The Impact of the New York City Marathon on Hotel Demand


Department of Economics, John Chambers College of Business and Economics, West Virginia University, Morgantown, WV 26506, USA
*
Author to whom correspondence should be addressed.
†
These authors contributed equally to this work.
Economies 2020, 8(4), 89; https://0-doi-org.brum.beds.ac.uk/10.3390/economies8040089
Submission received: 13 September 2020
/
Revised: 12 October 2020
/
Accepted: 13 October 2020
/
Published: 21 October 2020
(This article belongs to the Special Issue Advances in Sports Economics)
Abstract
:Daily hotel data are employed, along with information on prices, revenue, demand and hotel occupancy, to analyze part of the local economic impact of the annual New York City (NYC) Marathon. As the largest competitive race in the world, the marathon attracts domestic and international competitors and spectators. The cancellation of the 2012 marathon due to Hurricane Sandy was estimated to lead to an increase of 4000 hotel nights as well as a 10% increase in the average daily room rate. Taken together, this is associated with a USD 3 million increase in hotel revenue. The results suggest a significantly lower local economic impact of the race than previously thought.
1. Introduction
The economic impact of large events can often be overstated if resident and visitor activity cannot be identified (Crompton et al. 2001). Hodur et al. (2006) and Baade and Matheson (2001) state that the local economic impact of events depend strongly on the event’s ability to attract those from outside the area as local spending for regional events is likely to capture a substitution effect rather than fiscal gains to the area. This can be particularly acute in the case of large sporting events where many attendees live close enough to drive in for the event and then drive home. This behavior by locals, while understandable, is one of the reasons why a large number of studies have found modest to no economic impacts from major sporting events, such as the Super Bowl (Matheson and Baade 2006), the Pro Bowl (Baumann et al. 2009), college football games (Baade et al. 2011; Coates and Depken 2009, 2011), and professional basketball and hockey games (Chikish et al. 2019).
Outside of direct spending on and at the event, the largest part of visitor expenditure locally is on hotel nights. Heller et al. (2018) argue that visitor lodging expenses generally make up the single largest portion of tourist spending in a host city, and thus estimating the marginal change in variables which capture hotel demand can explain a large amount of the overall total impact of hosting an event. For that reason, a number of recent papers focus primarily on hotel demand as a way of estimating the economic impact of sporting events and other cultural events that attract out-of-town visitors (Chikish et al. 2019; Depken and Stephenson 2018; Earhart and Stephenson 2018; Heller et al. 2018; Meehan et al. 2020). Given that very few locals will pay for hotel nights, hotel demand is an important indicator of the extent to which the event is attracting out-of-town visitors and not crowding out other out-of-town visitors. Non-resident expenditures, as captured by hotel demand, is likely to represent local economic activity that would not have otherwise occurred.
In this paper, a decade of daily hotel data is used to estimate the impact of the New York City (NYC) Marathon on hotel demand. The NYC Marathon is the largest marathon in the world, with over 50,000 individuals participating. Given that the race is run on the same Sunday in November, the cancellation of the race in 2012 as a result of Hurricane Sandy is exploited to compare hotel demand in NYC when the race is held to when it is not. The results show statistically significant, but economically moderate effects of the race on the local economy. The results are robust to the inclusion of a significant number of tourism-related control variables. Despite the race typically occurring early in the morning, no result is found to occur occur the day before the marathon, which suggests a crowding-out effect. The findings contribute to the large literature on the economic impact of sporting events and the smaller literature on the economic impact of marathons (Baumann and Matheson 2017; Carvalho et al. 2018; Cobb and Olberding 2007; Shipway et al. 2012).
The organization of the remainder of the paper is as follows. Section 2 briefly reports background information regarding the unique history and qualification process of the NYC marathon as well as the specifics regarding its cancellation in 2012. Section 3 describes the data used for the empirical analysis, including the hotel data and data which were used to control for any factors that are related to tourism in NYC. Section 4 reports the empirical strategy and results. Section 5 concludes.
2. Setting
2.1. New York City Marathon
The NYC Marathon is an annual long-distance race taking place every November through five of the city’s most recognizable boroughs. Beginning with a group of running enthusiasts in the 1970s, the NYC marathon has grown to become the world’s largest and most renowned, regularly hosting over 50,000 finishers, nearly 100,000 applicants, over 2 million in-person spectators and national television broadcasting rights in the United States for each race over the last decade. As the sport of competitive distancing running has grown, so too has the NYC marathon. Currently the race is one of six marathons held throughout the year to be considered a World Marathon Major. Along with Tokyo, Boston, London, Berlin and Chicago, a World Marathon Major is where the world’s elite long-distance runners come together to compete.
The yearly race is organized by the New York Road Runners (NYRR) organization. Due to its popularity, entry into the race is not guaranteed. The NYRR allocate these limited spaces through five different methods: a random unweighted lottery, the program, completion of fifteen or more previous NYC marathons, charitable fund-raising, and meeting the race-completion time qualification standards. The time standards are set such that this method of qualification is almost exclusively reserved for those elite competitors. The program qualification method requires that NYRR members run in nine sponsored races and either volunteer at another event or donate $1000 to the NYRR. Forbes reports charitable donations from the NYC Marathon are large and significant: USD 36.1 million in 2017 and USD 270 million from 2006–2018 (Badenhausen 2017, 2018).
Badenhausen (2017) reports that there were 2.5 million spectators along the course for the 2017 race, that the city charges the NYRR USD 2.75 million for police services, and that the most recent estimates of the economic impact of the race was USD 415 million dollars per race with an estimated USD 22.2 million in sales and occupancy taxes to NYC in 2014. These widely reported results come from an unpublished study conducted by the global engineering firm AECOM on behalf of NYRR. The study arrives at their figure through the sum of the results calculated from surveys of over 1000 participants, sponsors and vendors, the NYRR expenditures, and the amount of charitable funding (New York Road Runners 2010).
2.2. Hurricane Sandy
The race itself has been held every year from 1970 except for 2012 and 2020. The 2020 race was canceled as a result of the COVID-19 pandemic. Typically held in the first Sunday of November, the 2012 marathon was canceled on 2 November, just two days before the race was scheduled to be held due to the aftermath of Hurricane Sandy.
The first rainfall from the hurricane hit the coast of New Jersey on 28 October 2012. Though the hurricane lost much of its force in the form of wind gusts and became extratropical the day after, considerable amounts of rain from the storm continued to fall into New York State until it finally dissipated on 2 November 2012.
Estimates suggest that NYC disproportionately bore the costs of the storm, with PlaNYC (2013) and Federal Emergency Management Agency (2013) indicating that NYC bore nearly 50% of all of the economic losses associated with the storm in large part due to the flooding of its underground subway system and road tunnels.1 Along with flooding, NYC experienced wide-spread electricity outages which persisted for multiple days as well as billions of dollars in property damage to both homes and vehicles. Nevertheless, it was not the physical conditions of the city at the time that canceled the race, but rather the economic factors. Two days before the race was held, then Mayor of NYC Michael Bloomberg canceled the race due to concerns that the race was diverting resources away from the Hurricane Sandy recovery effort.
3. Data
In addition to having high-quality data on hotel room supply, demand, and prices, controlling for other factors affecting hotel demand is important to properly estimating the impact of the NYC Marathon on the hotel industry. To estimate a model of hotel demand for New York City, it is important to account for as many major drivers of hotel demand as possible. While many drivers will be captured by day, week, month, and year fixed effects, controlling for other major events that attract out-of-town visitors is crucial.
3.1. Broadway, Sports and Weather
NYC, the most populous city in the United States, is one of the great entertainment hubs in the world. Known primarily for its year-long professional theatrical productions, known as “Broadway” shows, the city also boasts thirteen professional sports teams are near the city center. Data were gathered on both of these sources in order to control for the additional factors which might influence local hotel demand.
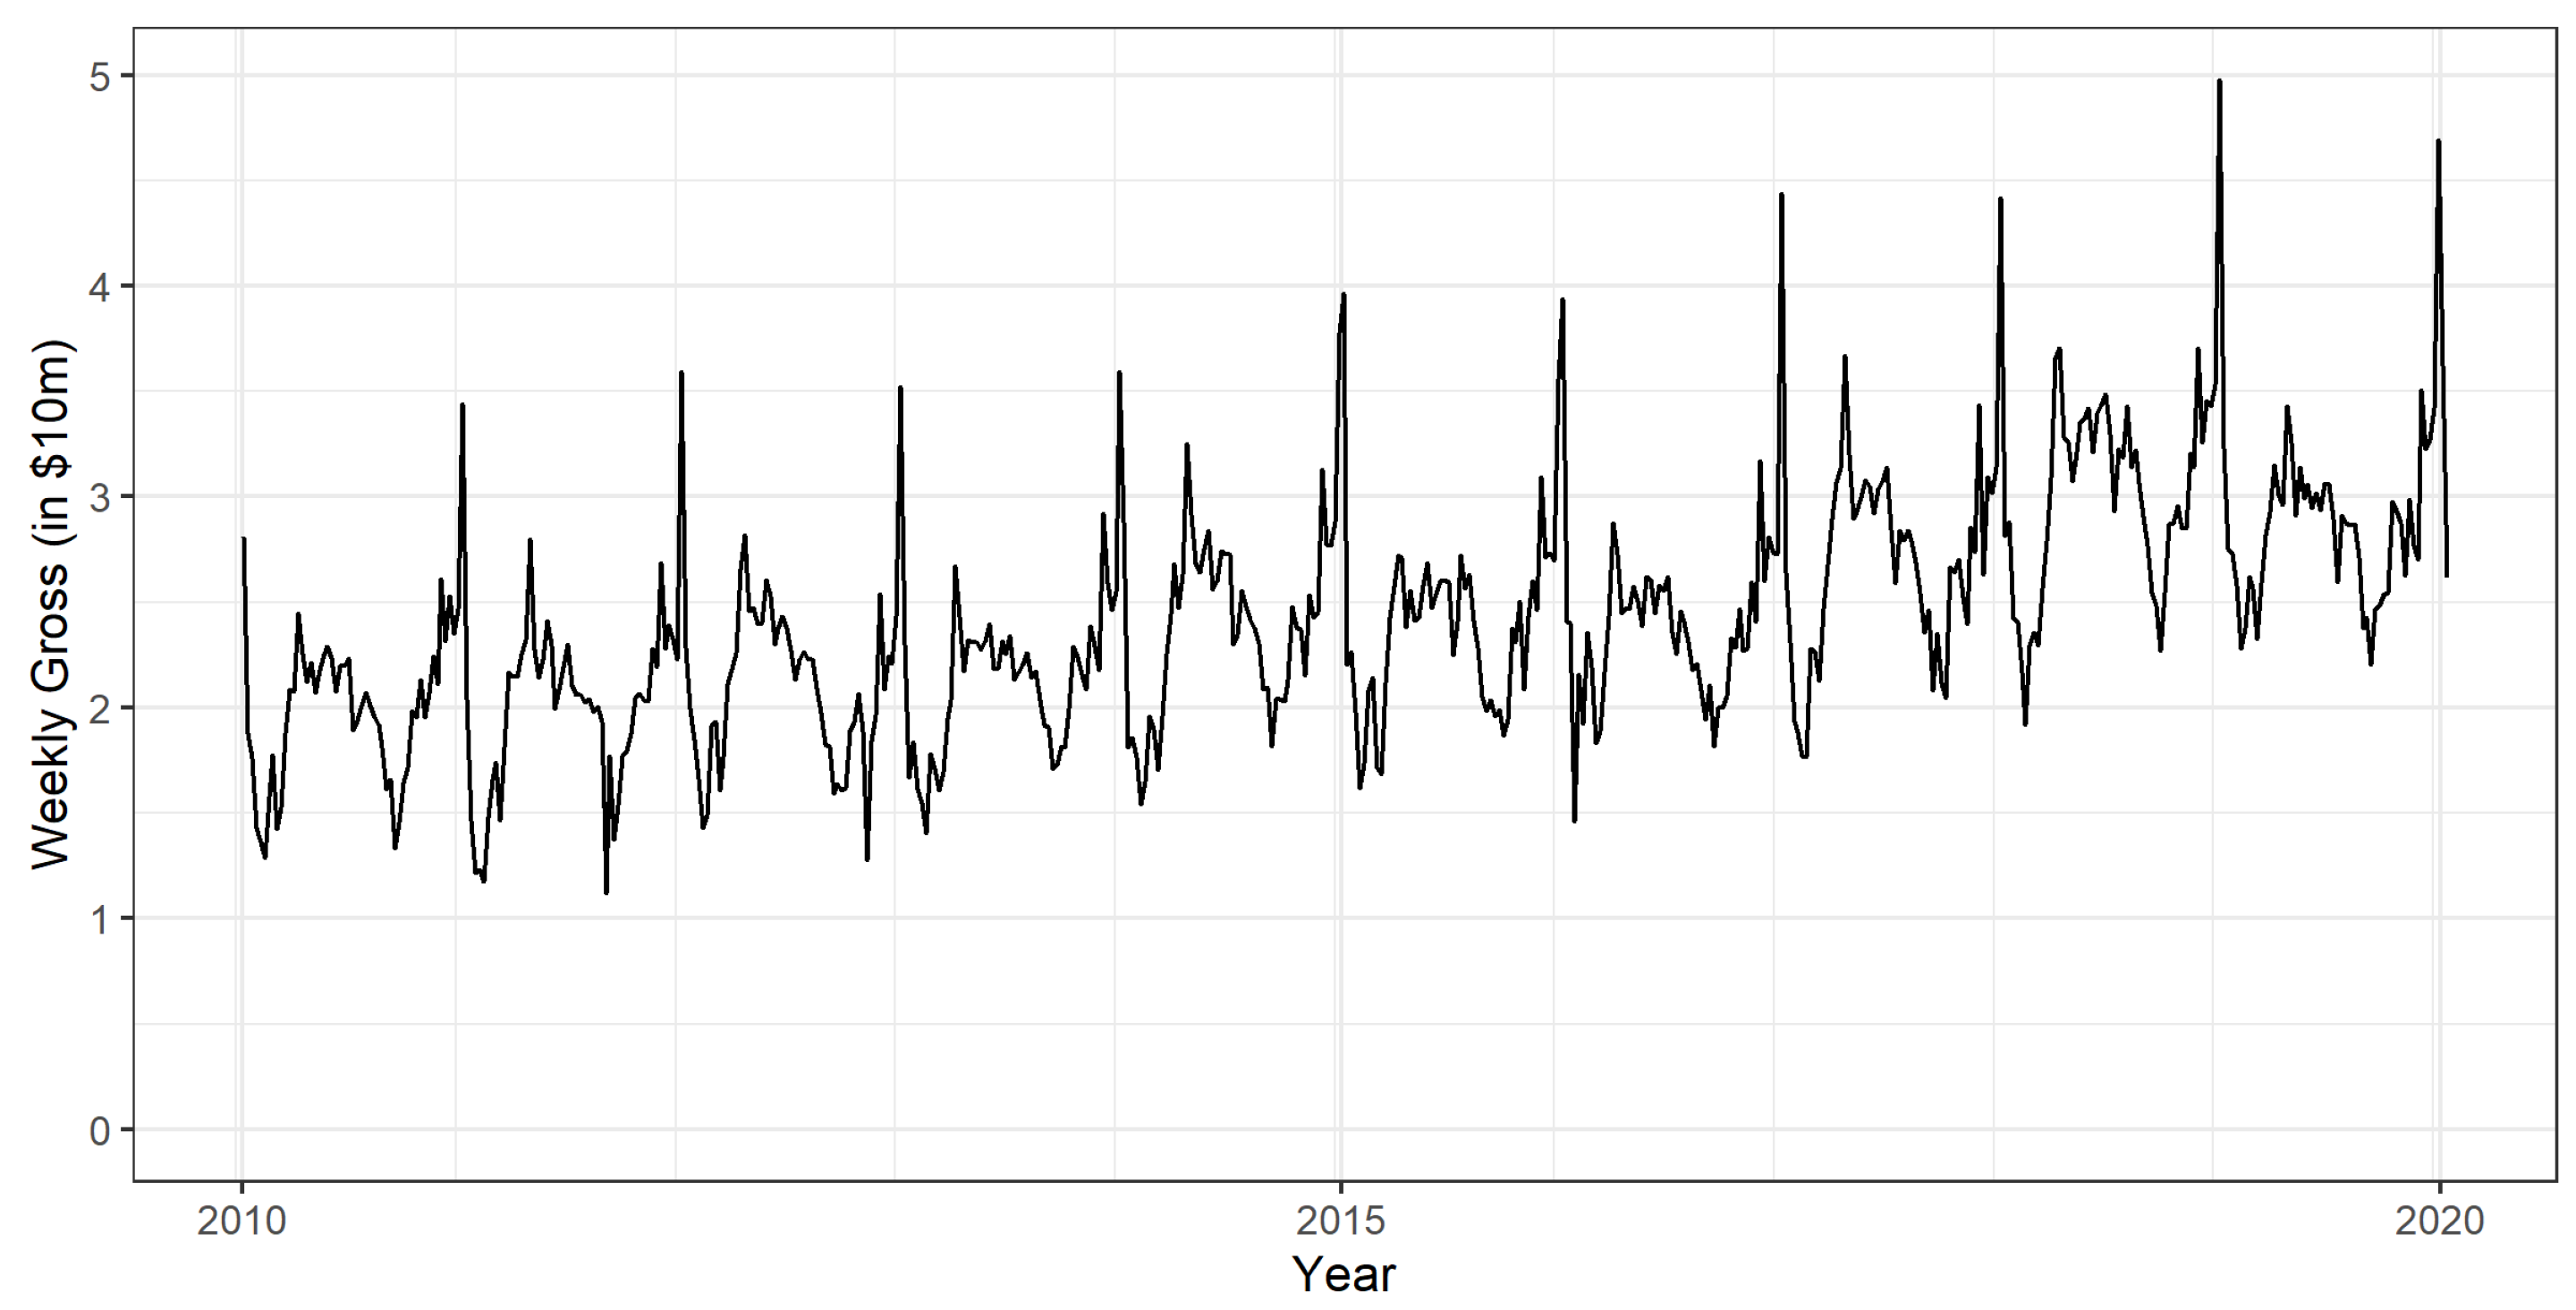
The first set of supplementary data came from the website Playbill.com, which reports the revenue gained for each play preformed on Broadway weekly from 1985 to present. These data were aggregated across plays in order to create a gross revenue for all Broadway plays within a given week. Given the long-period of time observed in our sample, revenue was adjusted for inflation using the consumer price index for all urban consumers from the Federal Reserve Bank of St. Louis. The adjustment placed each year’s revenue at USD 2010. These data can be seen in Figure 1. From here, it is easy to spot the cyclical shape of the data with the Broadway season reaching its peaks in late December and early January and its troughs in October and November.
Additionally, any sporting events which might induce non-residents to travel to the city were taken into account. Data regarding the date and location of all home games played by professional sports teams located in NYC came from the website Sports Reference. Indicator variables were created for every home game played from January 2010 through February 2020 for all fourteen of New York’s professional athletic teams and events. This includes 2 baseball teams, 3 basketball teams, 2 football teams, 3 hockey teams, 3 soccer teams and the US Open tennis tournament.
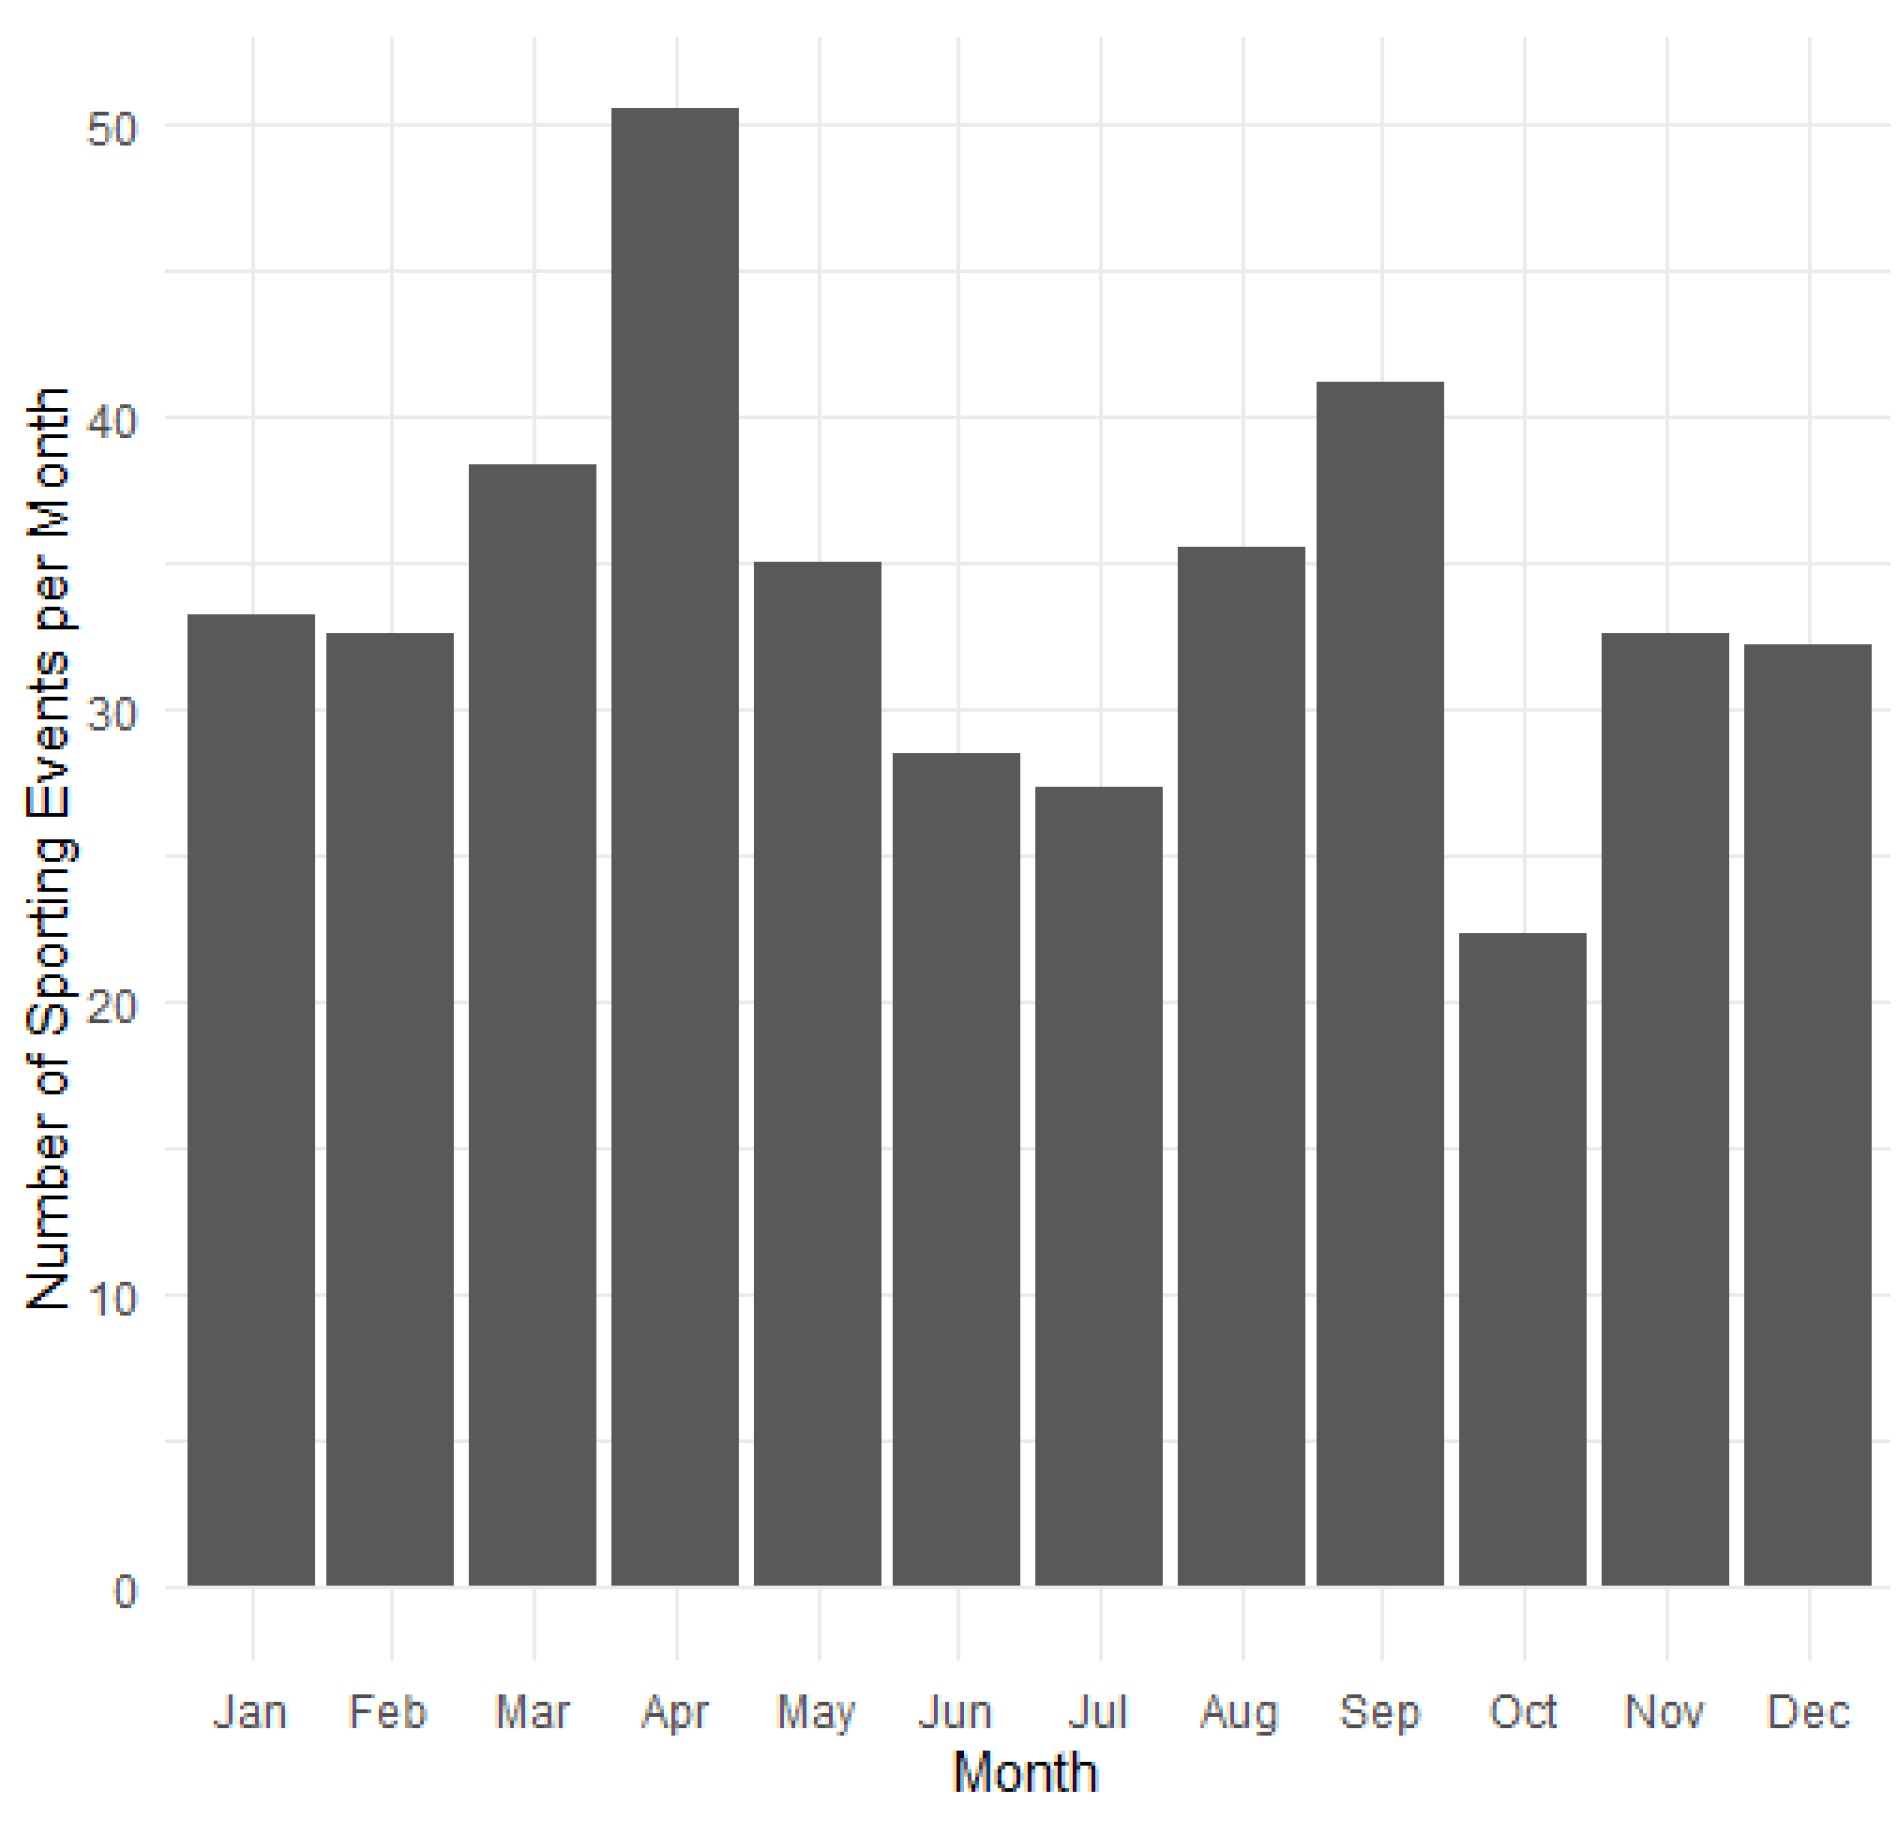
For visualization a variable measuring the average number of games per month was created by aggregating the indicator variables for each game in the sample by month of the year and then by dividing by the number of times each month is observed. This last step was done to account for the fact that the data sample observes January and February once more than the remaining months. The results can be seen in Figure 2, which show the cyclic nature of professional sporting events with the largest number of observed games occurring in April with more than 1.5 games per day compared to October, which sees an average of fewer than one game hosted per day.
Controls for daily changes in the weather were also included. The National Weather Service Forecast Office provides daily data which are collected by the National Oceanic and Atmospheric Administration. These data contain information across a wide-spectrum of weather-related outcomes. Of interest to this project are perception, average temperature, historical deviations from it and snowfall. The average temperature and its deviations are measured in degrees Fahrenheit while rain and snowfall are measured in inches. Approximately 7% of the observations for daily precipitation or snowfall were missing or incomplete. There is no relationship between these missing observations across time or with temperature or snowfall/rainfall, which suggests that they are randomly occurring. These observations were replaced with their modal value, zero, for the purposes of this analysis. Given their randomly occurring nature, the results are robust to replacing the missing values with a wide variety of alternative measures, including their mean and maximum values.
3.2. STR Hotel Data and Summary Statistics
Over 10 years of daily data from hotels within the Greater NYC area were employed as the dependant variable for this analysis. The data were provided by STR, a firm that specializes in worldwide metropolitan lodging data. The variables of interest, which were gathered from this data source, are hotel average daily room rates (ADR), revenue, demand and occupancy. ADR was calculated by dividing daily revenue by the number of rooms sold (Demand), and occupancy measures the proportion of available rooms which are occupied on any given day. The data came from 817 unique hotels, −65% of which are within NYC proper.
Summary statistics can be found in Table 1. There is an 84% occupancy rate for all of the available rooms in NYC from January 2010–February 2020 which translates to an average of 90,262 hotel nights per day. The average daily rate is $253 per night, which contributes to nearly USD 23 million in daily revenues. The sum of real revenue from all Broadway plays in our sample averages to USD 26.5 million per week. There is a federal holiday observed on 8.8% of the days in the sample. The average national unemployment rate is 6.2% and steadily declines over the course of the sample. The mean of the average daily temperature in NYC is 56 degrees Fahrenheit, where it infrequently rains or snows. However, during the infrequent times where it does snow, there is often a large amount of it, which dramatically influences the mean. There are 1.1 professional sporting events available to attend per day.
4. Methods and Results
The role that the exogenous shock to public finances resulting from Hurricane Sandy played in unexpectedly canceling the 2012 NYC Marathon is exploited in the study. Observing this period of time allows for an analysis of the economic conditions of NYC both with and without the marathon. Hotel demand is used as a proxy for this event’s economic impact as it is likely to represent spending from non-locals which would have otherwise not occurred.
The methods employed in our study are similar to those seen in Heller et al. (2018), Depken and Stephenson (2018), Earhart and Stephenson (2018), Bonneau and Hall (2020), Collins et al. (2020) and Sheehan and Stephenson (2020). Empirically, this means that the dependent variables of interest are average daily room rates (ADR), total revenue, demand, and occupancy for hotels in NYC. The independent variables of interest are binary variables which represent both the dates of the marathon itself, and also the days immediately before and after the event in order to capture any economic spillover (positive or negative) into other days of the resulting from the race. The model is estimated using ordinary least squares (OLS).
Estimating the impact of the marathon requires a comparison between the hotel demand in NYC during times where the race is held and demand during times where it is not. This is accomplished empirically through the use of regression analysis with time-fixed effects. Each model in Table 2 of the results includes controls for the variation specific to each day, week, month, and year.
The results from Table 2 show the estimated effects of the marathon on hotel demand in NYC, demonstrating that each of the dependent variables used as a proxy for hotel demand experience significant increases the day the marathon is held. However, the evidence of the marathon creating spillover effects is scant-to-none with only the estimate for hotel revenue the day before the race being estimated with any degree of precision.
The baseline results are improved upon in Table 3. While the dependent and independent variables of interest remain the same, significantly more control variables are added in order to account for other factors which could feasibly impact the dependent variable. Time-fixed effects are simply the day, week, month and year controls, seen in Table 2. The first of the added controls in Table 3 are entertainment-fixed effects. These can be broken into two major categories: sporting events and Broadway shows. The sporting category includes a binary variable indicating the date of any game occurring within NYC during the sample for every baseball, basketball, hockey, soccer team or tennis match played by professional sports teams’ events for which one might travel to New York to attend. The included team games and events are the Mets, Yankees, Red Bulls, NYC Football Club, Knicks, Nets, Devils, Rangers, Islanders and the US Open. The Broadway control variable includes the weekly gross inflation-adjusted revenue from all plays conducted on Broadway in order to account for the cyclic nature of entertainment tourism in the city.
Additionally, holiday-fixed effects are dealt with through the inclusion of one variable accounting for all Federal holidays and another which accounts for the Veteran’s day, which occasionally coincides with the day of the marathon. The national unemployment rate is included in order to account for changes in macroeconomic conditions, while weather-fixed effects account for variations in the average temperature, deviations from the the historical average temperature and the rain and snowfall observed in New York’s Central Park for each day in our sample.
The results from Table 3 confirm that the marathon has significant effects for each of the hotel demand variables, but also estimates these effects to be much larger than they were estimated in Table 2. These estimates can be viewed with greater confidence than those in Table 2 and they are calculated with much greater statistical precision. Dividing the estimated coefficients for the statistically significant independent variable by each dependent variable’s mean reveals that the marathon contributes to 10% increase in the average daily rooms rate (ADR), a 12.4% increase in hotel revenue, a 4.6% in overall demand and a 4.8% increase in occupancy for hotels in NYC from 2010–2019 during days where the marathon was held compared to those without the event.
At first glance—given that the NYC Marathon starts around 9:00 a.m.—it seems surprising that there is no statistical significance the night before the race. All of the positive effects of the marathon occur the evening of the race. It is important to remember that the race occurs on a Sunday and that the night before the race is a Saturday, a prime hotel night for weekend visitors to NYC. Statistical significance for the evening following the NYC Marathon but not the night before suggests that this major event crowds-out other NYC visitors. So even if NYC marathon runners from outside the area are staying in hotels the night before, the presence of the marathon the next day is discouraging for other out-of-town visitors unwilling to deal with the crowds and traffic disruptions associated with the marathon.
Robustness Check
The analysis is extended by estimating the effect of the three hurricanes which hit NYC over the course of the sample. This is done in order to address the possibility that the results are driven not by the fact that the economic effects of the marathon is large, but rather that the effect of what it is being compared to, a period of time when Hurricane Sandy hit, was so economically harmful.
In order to do so, an indicator variable was created for each of the three hurricanes, which is equal to one for each day from when the hurricane makes landfall to when it dissipates. Table 4 shows the results for this analysis, which confirm that the results from Table 2 and Table 3 were driven by the positive spillovers associated with the marathon rather than the negative spillovers of Hurricane Sandy.
The 2012 NYC Marathon was canceled by Mayor Michael Bloomberg on the Friday before the marathon. Perhaps hotel demand was not lowered from Sandy as many runners were already in NYC or en route? The results from Table 4 suggest that the late cancellation might have resulted in hotel demand not being affected.
5. Conclusions
This paper adds to the literature using hotel demand to measure the economic impact of local events. The analysis reveals modest overall impacts of the NYC marathon on local hotel demand. These range from an average yearly marginal effect of USD 3 million in revenue and 4.6% increase in nightly hotel stays. While not directly comparable, these findings are far less than the widely publicized yearly USD 415 million economic impacts boasted by proponents of the event.
One of the major shortcomings of studies such as these is explained via local substitution effects by Baade and Matheson (2001) and Cobb and Olberding (2007). In particular, Cobb and Olberding (2007) identify that economic impact studies of marathons often suffer from errors in the treatment of locally based impact due to the fact that local runners very often constitute a large percentage of overall participants. Given that 2020 will be the second time this decade that the NYC Marathon has been canceled, residents should rest well knowing that, while there will be a reduction in economic activity, it is not likely to be USD 400 million.
The NYC Marathon has been asked by public officials—in particular the police—to cover more of the costs associated with holding the marathon (Belson and Robbins 2011). According to Belson and Robbins (2011), the New York Road Runners pay over USD 800,000 to different city agencies to offset costs associated with hosting the marathon. The findings in this paper suggest that, in addition to the direct payments to city agencies, the NYC marathon brings in roughly USD 450,000 in additional tax revenue from hotel occupancy taxes.2 Unfortunately, only USD 315,000 or so of this goes to NYC, with the rest going to other entities, such as New York State.
There exist at least two avenues for future research. First, crowd out the night before the marathon could be explored through surveys and structured interviews. Individuals in the NYC hotel industry, such as hotel managers, could be interviewed. Traveler surveys could be used to find out if individuals avoiding the NYC Marathon weekend just substituted to another weekend. Second, the results in this paper only estimate the impact of the NYC Marathon on hotel demand and revenue. Surveys of visitors could be used to provide precise estimates of visitor spending in other categories, such as meals and entertainment, as a result of the marathon.
Author Contributions
Conceptualization, J.M. and J.H.; formal analysis, J.M.; data curation, J.M.; writing—original draft preparation, J.M.; writing—review and editing, J.H. All authors have read and agree to the published version of the manuscript.
Funding
This research received no external funding.
Conflicts of Interest
Joshua Martin has received funding from the Institute for Humane Studies. Joshua Hall has received funding during his career from the Charles Koch Foundation, the Thomas Smith Foundation, the Alliance for Markets Solutions, the Institute for Humane Studies, Liberty Fund, and honoraria from over 30 colleges and universities. These relationships had no role in the design of the study; in the collection, analyses, or interpretation of data; in the writing of the manuscript, or in the decision to publish the results.
Abbreviations
The following abbreviations are used in this manuscript:
| NYC | New York City |
| NYRR | New York Road Runners |
| OLS | Ordinary Least Squares |
References
- Baade, Robert A, Robert W Baumann, and Victor A Matheson. 2011. Big men on campus: Estimating the economic impact of college sports on local economies. Regional Studies 45: 371–80. [Google Scholar] [CrossRef] [Green Version]
- Baade, Robert A, and Victor A Matheson. 2001. Home run or wild pitch? Assessing the economic impact of Major League Baseball’s All-Star Game. Journal of Sports Economics 2: 307–27. [Google Scholar] [CrossRef]
- Badenhausen, Kurt. 2017. NYC Marathon 2017: By the numbers. Forbes, November 4. [Google Scholar]
- Badenhausen, Kurt. 2018. NYC Marathon 2018: By the numbers. Forbes, November 3. [Google Scholar]
- Baumann, Robert W, and Victor A Matheson. 2017. Many happy returns? The Pro-Bowl, mega-events, and tourism in Hawaii. Tourism Economics 23: 788–802. [Google Scholar] [CrossRef]
- Baumann, Robert W, Victor A Matheson, and Chihiro Muroi. 2009. Bowling in Hawaii: Examining the effectiveness of sports-based tourism strategies. Journal of Sports Economics 10: 107–23. [Google Scholar] [CrossRef]
- Belson, Ken, and Liz Robbins. 2011. Race directors raise concern over proposed police fee. New York Times, February 9. [Google Scholar]
- Bonneau, Dan, and Joshua Hall. 2020. The impact of WVU football and basketball on hotel demand. New York Economic Review 51: 5–15. [Google Scholar]
- Carvalho, Maria José, Marisa Sousa, Gustavo Paipe, Gustavo Bavaresco, and José Luis Felipe. 2018. Economic impact of the 11th Douro Valley Half Marathon. Physical Culture and Sport. Studies and Research 78: 41–49. [Google Scholar] [CrossRef] [Green Version]
- Chikish, Yulia, Brad R Humphreys, Crocker Liu, and Adam Nowak. 2019. Sports-led tourism, spatial displacement, and hotel demand. Economic Inquiry 57: 1859–78. [Google Scholar] [CrossRef]
- Coates, Dennis, and Craig A Depken. 2009. The impact of college football games on local sales tax revenue: Evidence from four cities in Texas. Eastern Economic Journal 35: 531–47. [Google Scholar] [CrossRef]
- Coates, Dennis, and Craig A Depken. 2011. Mega-events: Is Baylor football to Waco what the Super Bowl is to Houston? Journal of Sports Economics 12: 599–620. [Google Scholar] [CrossRef]
- Cobb, Steven, and Douglas J Olberding. 2007. The importance of import substitution in marathon economic impact analysis. International Journal of Sport Finance 2: 108–18. [Google Scholar]
- Collins, Clay, Craig Depken, and E Frank Stephenson. 2020. The Impact of Sporting and Cultural Events in a Heterogeneous Hotel Market: Evidence from Austin, TX. Berry College Working Paper. Mt Berry: Berry College. [Google Scholar]
- Crompton, John L, Seokho Lee, and Thomas J Shuster. 2001. A guide for undertaking economic impact studies: The Springfest example. Journal of Travel Research 40: 79–87. [Google Scholar] [CrossRef]
- Depken, Craig A, and E Frank Stephenson. 2018. Hotel demand before, during, and after sports events: Evidence from Charlotte, North Carolina. Economic Inquiry 56: 1764–76. [Google Scholar] [CrossRef]
- Earhart, Michael, and E Frank Stephenson. 2018. Same-sex marriage legalization and wedding tourism: Evidence from Charleston and Savannah. Journal of Economics and Finance 42: 566–74. [Google Scholar] [CrossRef]
- Federal Emergency Management Agency. 2013. Mitigation Assessment Team Report: Hurricane Sandy in New Jersey and New York; Report No. FEMA P-942; Washington: Federal Emergency Management Agency.
- Heller, Lauren R, Victor A Matheson, and E Frank Stephenson. 2018. Unconventional wisdom: Estimating the economic impact of the Democratic and Republican national political conventions. Papers in Regional Science 97: 1267–78. [Google Scholar] [CrossRef]
- Hodur, Nancy M, Dean A Bangsund, F Larry Leistritz, and John Kaatz. 2006. Estimating the contribution of a multi-purpose event facility to the area economy. Tourism Economics 12: 303–16. [Google Scholar] [CrossRef]
- Matheson, Victor A, and Robert A Baade. 2006. Padding required: Assessing the economic impact of the Super Bowl. European Sport Management Quarterly 6: 353–74. [Google Scholar] [CrossRef]
- Meehan, Brian, Corey J Rusko, and E Frank Stephenson. 2020. (Pot) heads in beds: The effect of marijuana legalization on hotel occupancy in Colorado and Washington. Journal of Regional Analysis & Policy 50: 46–53. [Google Scholar]
- New York Road Runners. 2010. 2010 ING New York City Marathon Generates $340M for NYC. New York: New York Road Runners. [Google Scholar]
- PlaNYC. 2013. A Stronger, More Resilient New York. New York: The City of New York. [Google Scholar]
- Sheehan, Kathleen, and E Frank Stephenson. 2020. Would Columbus miss the Crew? Major League Soccer and hotel occupancy. New York Economic Review 51: 16–22. [Google Scholar]
- Shipway, Richard, Naomi Kirkup, Melville Saayman, and Andrea Saayman. 2012. The economic impact of the Comrades marathon. International Journal of Event and Festival Management 3: 220–35. [Google Scholar]
| 1. | Federal Emergency Management Agency (2013) estimates that there were USD 50 billion in economic losses due to Hurricane Sandy across the United States, USD 19 billion of which were borne by NYC (PlaNYC 2013). |
| 2. | Calculated using the NYC hotel occupancy tax rate of 14.75 percent and estimate of USD 3 million in additional hotel revenue from the marathon. In addition, the number includes USD 3.50 per unit fee times 3904 in additional hotel rooms demanded from Table 3. |
Figure 1.
Weekly gross Broadway revenue (inflation-adjusted).

Figure 2.
Number of sporting events played per month in New York City (NYC) (January 2010–February 2020).
Figure 2.
Number of sporting events played per month in New York City (NYC) (January 2010–February 2020).


Table 1.
Summary Statistics.
| Statistic | N | Mean | St. Dev. | Min | Pctl(25) | Pctl(75) | Max |
|---|---|---|---|---|---|---|---|
| Occupancy | 3712 | 84.96 | 9.16 | 42.74 | 79.48 | 92.02 | 98.15 |
| ADR | 3712 | 252.93 | 53.59 | 151.32 | 211.37 | 287.31 | 465.89 |
| Demand | 3712 | 90,262 | 15,193 | 39,227 | 80,187 | 101,542 | 124,542 |
| Revenue | 3712 | 23,233,630 | 7,587,078 | 6,858,017 | 17,509,061 | 28,019,835 | 57,362,736 |
| Broadway | 3668 | 26.50 | 6.90 | 11.62 | 21.65 | 30.26 | 57.80 |
| Holidays | 3713 | 0.08 | 0.28 | 0 | 0 | 0 | 1 |
| Unemployment | 3712 | 6.17 | 2.06 | 3.50 | 4.30 | 8.20 | 9.90 |
| Average Temperature | 3712 | 56.00 | 17.47 | 7.00 | 41.50 | 71.62 | 94.00 |
| Temperature Deviation | 3712 | 1.34 | 7.47 | −28.00 | −3.40 | 5.90 | 32.50 |
| Rain | 3712 | 0.13 | 0.38 | 0.00 | 0.00 | 0.06 | 5.81 |
| Snow | 3712 | 0.49 | 2.24 | 0.00 | 0.00 | 0.00 | 23.00 |
| Sports | 3713 | 1.121 | 0.840 | 0 | 1 | 2 | 5 |
Table 2.
The effect of the NYC Marathon on the hotel demand without controls for other events.
| Dependent Variable: | ||||
|---|---|---|---|---|
| ADR (1) | Revenue (2) | Demand (3) | Occupancy (4) | |
| Marathon | 7.353 | 1,016,740 | 633.635 | 0.447 |
| (7.896) | (1,118,095) | (1743.712) | (1.654) | |
| Marathon | 14.443 * | 2,204,258 * | 861.771 | 0.628 |
| (8.228) | (1,164,975) | (1,816.824) | (1.724) | |
| Marathon | 18.117 ** | 1,745,518 * | 2,878.104 * | 2.931 * |
| (7.354) | (1041,332) | (1623.997) | (1.541) | |
| Marathon | 6.076 | 21,607 | −942.913 | −0.780 |
| (7.353) | (1,041,073) | (1623.594) | (1.540) | |
| Marathon | 7.018 | 222,882 | −1704.210 | −1.623 |
| (7.351) | (1,040,887) | (1,623.303) | (1.540) | |
| Constant | 209.543 *** | 13,588,369 *** | 65,348.050 *** | 77.454 *** |
| (13.839) | (1,959,557) | (3056.005) | (2.899) | |
| Day of the Week FE | ✓ | ✓ | ✓ | ✓ |
| Week FE | ✓ | ✓ | ✓ | ✓ |
| Month FE | ✓ | ✓ | ✓ | ✓ |
| Year FE | ✓ | ✓ | ✓ | ✓ |
| Observations | 3712 | 3712 | 3712 | 3712 |
| R | 0.887 | 0.887 | 0.931 | 0.830 |
| Adjusted R | 0.867 | 0.867 | 0.919 | 0.800 |
Note: Model estimated by OLS. Robust standard errors in parentheses. Statistical significance denoted by * p < 0.1; ** p < 0.05; *** p < 0.01.
Table 3.
The effect of the NYC Marathon on the hotel demand with all controls.
| Dependent Variable: | ||||
|---|---|---|---|---|
| ADR (1) | Revenue (2) | Demand (3) | Occupancy (4) | |
| Marathon | 4.632 | 688,715 | 571.060 | 0.413 |
| (7.856) | (1,113,436) | (1726.810) | (1.642) | |
| Marathon | 9.290 | 1,491,072 | 340.086 | 0.186 |
| (8.204) | (1,162,864) | (1803.467) | (1.715) | |
| Marathon | 27.881 *** | 3,055,650 *** | 3904.019 ** | 3.818 ** |
| (7.461) | (1,057,471) | (1640.014) | (1.559) | |
| Marathon | 12.545 * | 834,929 | −513.016 | −0.411 |
| (7.377) | (1,045,606) | (1621.612) | (1.542) | |
| Marathon | 11.828 | 849,336 | −1127.911 | −1.108 |
| (7.373) | (1,045,101) | (1620.830) | (1.541) | |
| Constant | 297.342 ** | 25,409,854 | 60,589.980 ** | 77.356 *** |
| (125.224) | (17,749,001) | (27,526.630) | (26.172) | |
| Time FEs | ✓ | ✓ | ✓ | ✓ |
| Entertainment | ✓ | ✓ | ✓ | ✓ |
| Holiday FEs | ✓ | ✓ | ✓ | ✓ |
| Unemployment Rate | ✓ | ✓ | ✓ | ✓ |
| Weather | ✓ | ✓ | ✓ | ✓ |
| Observations | 3668 | 3668 | 3668 | 3668 |
| R | 0.888 | 0.889 | 0.934 | 0.833 |
| Adjusted R | 0.867 | 0.869 | 0.922 | 0.803 |
Note: Model estimated by OLS. Robust standard errors in parentheses. Statistical significance denoted by * p < 0.1; ** p < 0.05; *** p < 0.01.
Table 4.
The effect of NYC area hurricanes on hotel demand.
| Dependent variable: | ||||
|---|---|---|---|---|
| ADR (1) | Revenue (2) | Demand (3) | Occupancy (4) | |
| Sandy | −12.237 | 531,597 | 4405.066 | 4.207 |
| (14.977) | (2,120,366) | (3278.663) | (3.114) | |
| Irene | −3.872 | −2,277,439 | −9087.725 *** | −10.010 *** |
| (11.831) | (1,674,941) | (2589.915) | (2.460) | |
| Earl | −9.566 | 753,639 | 6954.035 ** | 8.024 ** |
| (15.141) | (2,143,527) | (3314.475) | (3.148) | |
| Constant | 291.132 ** | 26,125,674 | 65,155.690 ** | 82.311 *** |
| (125.435) | (17,758,043) | (27,458.760) | (26.083) | |
| Time FEs | ✓ | ✓ | ✓ | ✓ |
| Entertainment | ✓ | ✓ | ✓ | ✓ |
| Holiday FEs | ✓ | ✓ | ✓ | ✓ |
| Unemployment Rate | ✓ | ✓ | ✓ | ✓ |
| Weather | ✓ | ✓ | ✓ | ✓ |
| Observations | 3668 | 3668 | 3668 | 3668 |
| R | 0.887 | 0.889 | 0.934 | 0.834 |
| Adjusted R | 0.867 | 0.869 | 0.922 | 0.804 |
Note: Model estimated by OLS. Robust standard errors in parentheses. Statistical significance denoted by * p < 0.1; ** p < 0.05; *** p < 0.01.
Publisher’s Note: MDPI stays neutral with regard to jurisdictional claims in published maps and institutional affiliations. |
© 2020 by the authors. Licensee MDPI, Basel, Switzerland. This article is an open access article distributed under the terms and conditions of the Creative Commons Attribution (CC BY) license (http://creativecommons.org/licenses/by/4.0/).
Share and Cite
MDPI and ACS Style
Martin, J.; Hall, J. The Impact of the New York City Marathon on Hotel Demand. Economies 2020, 8, 89. https://0-doi-org.brum.beds.ac.uk/10.3390/economies8040089
AMA Style
Martin J, Hall J. The Impact of the New York City Marathon on Hotel Demand. Economies. 2020; 8(4):89. https://0-doi-org.brum.beds.ac.uk/10.3390/economies8040089
Chicago/Turabian StyleMartin, Joshua, and Joshua Hall. 2020. "The Impact of the New York City Marathon on Hotel Demand" Economies 8, no. 4: 89. https://0-doi-org.brum.beds.ac.uk/10.3390/economies8040089
Note that from the first issue of 2016, this journal uses article numbers instead of page numbers. See further details here.