An Input–Output Analysis of Sectoral Specialization and Trade Integration of the Western Balkans Economies


Joint Research Centre, European Commission, 41002 Sevilla, Spain
*
Author to whom correspondence should be addressed.
†
The views expressed are purely those of the authors and may not in any circumstances be regarded as stating an official position of the European Commission.
Economies 2020, 8(4), 93; https://0-doi-org.brum.beds.ac.uk/10.3390/economies8040093
Submission received: 22 September 2020
/
Revised: 16 October 2020
/
Accepted: 27 October 2020
/
Published: 30 October 2020
(This article belongs to the Special Issue Regional Development and Policy in the EU Neighborhood Countries)
Abstract
:The contribution of this paper is twofold. First, it uses the available official Input–Output data for the Western Balkans economies to estimate the output and value added multipliers of the sectors identified as being either current or emerging strengths within the context of Smart Specialisation. These multipliers indicate the potential impact of changes in final demand for certain products and sectors. This permits the identification of the industries associated with high indirect and induced effects, and to form ideas about the sectoral interdependencies of the economies. For instance, it appears that many sectors related to construction are promising in terms of economic potential related to demand-side monetary injections in Albania. Second, a Multi-Regional dataset is used to investigate the international integration of the Western Balkans economies in terms of participation in the Global Value Chains. The latter has increased over time in the region, but it appears that some economies are benefitting relatively more than others from it.
JEL Classification:
C67; F151. Introduction
The Western Balkans economies (Albania, Bosnia and Herzegovina, Kosovo1, Montenegro, North Macedonia, and Serbia) were severely hit by the 2008 economic and financial crisis and struggled to get back to the pre-crisis economic growth rates they enjoyed after the armed conflicts of the nineties. According to the World Bank (2017a), the policy mix needed to improve the economic perspectives in the region should include, among other things, a fundamental role of private entrepreneurship and greater international integration with the global economy, and with the EU in particular.
As for the latter, four of the six economies have applied for future membership of the European Union (EU): North Macedonia in 2004, Montenegro in 2008, and Albania and Serbia in 2009. The other two are considered as potential candidates to become member states of the EU which is already providing policy and economic support to the whole region. The European Commission has recently reiterated its interest in the enlargement of the EU to include the Western Balkans (European Commission 2018, 2019) and it is working on an innovation agenda for the Western Balkans through the EU Instrument for Pre-accession Assistance (IPA) through which more than €4000 million of EU financial support is being channelled to the Western Balkans economies in the 2014–2022 programming period.
This support is tightly linked with the need for a bigger role of private enterprise mentioned above, since Smart Specialisation (the place-based territorial policy currently adopted by the EU) relies on the interaction between entrepreneurial actors and policy makers (Foray 2018a; Morgan 2017). Innovation is commonly thought to be among the main drivers of economic growth (Hasan and Tucci 2010), and the Smart Specialisation policy advocates concentrating investment in carefully chosen priority domains on which to focus research and development investments and innovation activities to maximise their impact (Barca 2009). The six Western Balkans economies all joined the Smart Specialisation Platform, the first step in preparing research and innovation strategies in collaboration with the European Commission.
Smart Specialisation is based on the idea that the economic and institutional characteristics of each region should determine the potential for future development and guide the process to identify where to build competitive advantages in high value-added activities. Foray (2018b) argues that this should transform the economic structure of the regions involved by collecting specific innovation capacities and activities. The identification of new opportunity domains should be done via an inclusive and evidence-based process involving all the main stakeholders pertaining to four different domains: the business actors, the government, the research community, and the civil society (Aranguren et al. 2019). Although appealing from a theoretical point of view, the multifaceted nature of the process may lead to implementation issues such as path dependency, lack of preconditions for innovation, governance difficulties, and lack of other structural and institutional capacities (Capello and Kroll 2016). The most recent evidence available on the effectiveness of Smart Specialisation in the EU regions, however, points towards tangible benefits of the policy even in the least developed regions of the EU (Trippl et al. 2019).
In this paper, we provide a macroeconomic snapshot of the Western Balkans economies with two different analyses which can be seen as somewhat complementary to each other. First, we provide an economic analysis based on an Input–Output (IO) framework, the so-called Leontief (1941, 1986) model, taking advantage of the work done by Matusiak and Kleibrink (2018) in the Smart Specialisation context for the Western Balkans. In particular, we present the results of an IO multiplier analysis of the sectors identified as being either current or emerging strengths in each economy for which official IO data exist (namely, Albania, North Macedonia, and Serbia). The IO multipliers are useful to understand the potential impact of changes in final demand for certain products and sectors, to identify the industries associated with high indirect and induced effects, and to form ideas about the sectoral interdependencies of the economy. This type of quantitative evidence should be considered as one of the many elements to be considered both when trying to gauge the potential benefits of Smart Specialisation and, from a policy maker point of view, in the implementation phase of the policy itself. Clearly, a full understanding of the implications of Smart Specialisation can only be achieved by using a variety of instruments such as, among others, relatedness and complexity analyses (Balland et al. 2019), other modelling frameworks (Varga et al. 2020), and case studies (Gianelle et al. 2019). However, we believe that an IO analysis such as ours is capable of providing useful sectoral information on the structure of the economies under scrutiny.
We provide an additional piece of empirical evidence by using the UNCTAD-Eora Multi-Regional IO (MRIO) dataset to investigate the participation of the Western Balkans economies in the Global Value Chains (GVCs). This yields insights on the international integration of the region with particularly interesting findings on the evolution over time of the international position of the various economies of the region. Due to data availability, this latter part of the analysis concentrates on Albania, Bosnia and Herzegovina, Montenegro, and North Macedonia (both separately and as an aggregate). Our analysis offers interesting insights regarding the full Western Balkans region, despite the only partial overlapping of data between the two parts of the analysis (of the six Western Balkans economies, only data for Albania and North Macedonia are available to perform the full analysis). We are unable to include Kosovo in our sample due to the lack of publicly available data but, since it only represents about 7% of the GDP of the whole region (according to Eurostat data), we still believe our conclusions to be relevant for the whole region.
The sectoral multiplier analysis suggests that in Albania all sectors related to construction are associated with relatively high economic potential following a demand-side stimulus. The results for North Macedonia suggest that specializing in manufacture of machinery and equipment may be particularly beneficial, while the multipliers associated with the food and beverage sector stand out when treating household income as endogenous in the IO modelling framework. On the other hand, it appears difficult to identify a clear picture when looking at the multipliers for the Serbian sectors: there does not seem to be a specific economic area characterized by high multipliers among those identified as strengths according to Smart Specialisation principles. As for international integration, the Western Balkans appear to be highly integrated in the GVCs, on average as much as the EU28. However, not all the economies of the regions are able to reap the same benefits from this integration. Our analysis suggests that Bosnia and Herzegovina is the economy currently capable of creating and exporting more value added (VA) than the one it imports, while Montenegro appears to be the economy benefitting the least from the participation in the GVCs.
The reminder of the paper is organised as follow. Section 2 illustrates the IO methodology used in this paper. Section 3 contains the results of the sectoral analysis based on IO multipliers, and Section 4 concentrates on the international integration of the Western Balkans economies. Section 5 concludes.
2. The Input–Output Methodology
The Leontief model is ideal to study the sectoral interdependence of an economy. IO data are normally organised in tables containing sectorally-disaggregated national economic accounts. The IO tables represent a snapshot of the flows of products and services produced and consumed in the economy in a single year, identifying and disaggregating the monetary flows between industries (inter-industry expenditure flows), the consumers, and the suppliers of production factors in the economy. Under a number of assumptions, these tables can be used as the basis for an economic model where exogenous final demand drives total output (Miller and Blair 2009).
A classic application of the model is the estimation of the IO multipliers which are a measure of the knock-on effects throughout the economy generated by an exogenous change in final demand. In other words, the IO multiplier gauges the expansionary effects caused by an increase in the final demand of one sector in the output of all sectors (including the sector initially perturbed). Section 2.1 contains more details on this part of the analysis.
Switching to an MRIO setting allows for different types of analysis accounting for the role of international integration and trade. The IO framework allows for the study of trade in VA which is nowadays thought to produce more meaningful results with respect to traditional analyses based on exports and imports flows (Johnson and Noguera 2012). This is due to the fact that world trade and production are now based on GVCs and economic activities are fragmented and dispersed across countries, so more than half of the world’s imports in manufacturing products are intermediate goods and more than 70% of the world’s service imports are intermediate services (OECD 2013). In Section 2.2 we explain how we study the international integration of the Western Balkans region in line with these recent developments in the international economics literature.
2.1. The Multiplier Analysis
Let sectoral output be defined as follows:
is output of sector ; stands for transactions from sector to sector ; stands for sales from sector to final demand users. Equation (1) means that output is given by the sum of intermediate sales and final demand and can be re-written as follows:
stands for intermediate sales (equivalently to ) expressed as output multiplying the technical coefficients . The latter express the quantity of input used to produce output and is defined as the ratio between intermediate transactions divided by output: . These coefficients are fixed, thus constant returns to scale are assumed to represent the available production technology in the economy.
In matrix notation, we can re-write Equation (2) as follows:
where is the vector of outputs, is the vector of final demands, is the matrix of technical (IO) coefficients, and is the identity matrix (with ones on the main diagonal and zeros elsewhere). For a given set of s, this is a set of linear equations in the unknowns and hence it may or may not be possible to find a unique solution. In fact, a unique solution depends on whether or not is singular, that is its inverse exists. Assuming that it does, by pre-multiplying both sides of Equation (3) by we obtain the following:
is either called the Leontief inverse or the total requirements matrix. The so-called open IO model used in our exercise assumes that is completely exogenous, which means that demand is not related to production. Equation (4) can be used to calculate the multipliers mentioned above: by modifying the exogenous demand vector one can calculate the output necessary to sustain such alternative demands. This analysis relies on three assumptions: (a) the supply-side of the economy is entirely passive; (b) there are no supply constraints, nor unused capacity; (c) the production technology for all sectors is represented by fixed coefficients, neglecting input substitutability. These are clear limitations of the IO approach, but they do not undermine the usefulness of the results obtained with the framework. However, these assumptions certainly affect the analysis and should be taken into account when interpreting the results and when drawing conclusions based on them.
IO multipliers indicate how an increase in final demand for the output of one sector entails expansionary effects on the output of intermediate sectors which, due to such demand change, increase their own demand for their intermediate inputs. The activity generated by the sum of these demands for intermediate inputs is known as the indirect effect. This is captured by the type I multipliers which are calculated as the sum of the direct and indirect effects divided by the initial increase in exogenous demand.
Type II multipliers also include induced effects and can be obtained by relaxing the assumption of fully exogenous final demand. We close the model with respect to households by making household consumption endogenous and related to production. Based on the assumption of a constant savings rate for different levels of income, type II multipliers capture the additional effects of household income generation through payments for labour and the associated consumer expenditures on goods and services produced by the various sectors. This additional expansionary effect is known as the induced effect.
In our analysis we also estimate the economic impact of changes in final demand in terms of additional VA (it can be considered equivalent to GDP for our purposes) generated rather than simply gross output (which includes intermediates). The VA multiplier is defined as the VA share in each unit of gross output produced in the economy as follows:
2.2. The International Integration Dimension
We use The UNCTAD-Eora Global Value Chain database2 to investigate the international integration of the region with an analysis of the participation of the Western Balkans economies in the GVCs.3 This MRIO dataset offers a global coverage for 189 countries and a time-series from 1990 to 2016 of the key GVC indicators: foreign value added (FVA), domestic value added (DVA), and indirect value added (DVX).
These indicators are the most commonly used in VA trade analysis and constitute the basis of gross export decomposition in VA terms (OECD-WTO 2013). In particular, the DVA embodied in a country’s gross exports includes the direct and indirect4 (DVX) value added, generated domestically and coming from the production of exported goods and services. The concept of FVA embodied in gross exports, similar to the vertical specialisation measure (VS) proposed by Hummels et al. (2001), refers to the VA content of intermediate imports used in a country to produce goods and services for export.
According to Koopman et al. (2010), if FVA and DVX are expressed as percent of exports, the formula for the GVC participation index is as follows:
The larger the ratio, the greater the intensity of participation of a country in GVCs. Moreover, FVA, by quantifying the imported intermediate inputs used to generate output for export, can be seen as a measure of the country’s backward participation. Applying the same logic, DVX can be defined as a measure of forward participation, given that it quantifies exports of intermediate goods used as inputs for the production of exports of other countries.
3. The Sectoral Dimension
This Section contains an IO sectoral analysis for the three Western Balkans economies for which official Supply and Use Tables (SUTs) are available from the national statistical offices: Albania, North Macedonia, and Serbia. Our multiplier analysis takes advantage of the identification of the current and emerging economic strengths done by Matusiak and Kleibrink (2018) in the context of Smart Specialisation, the EU place-based policy for innovation. The key idea behind this policy is for economies to concentrate on the sectors for which some comparative advantage exists. The identification of the sectors was done by looking at the critical mass and relative size of industries in terms of employment and VA (current strengths) and growth dynamics over time (emerging strengths) using data at the three-digit NACE 2 sector level for the 2008–2017 period (source: Orbis). The IO analysis considers the macro-sectors containing the industries identified as being either current or emerging strengths of the three Western Balkans economies under analysis. Our evidence should be considered as a starting point in a multi-step strategy aimed at a full comprehension of the complex relationships and structures, characterising the economies under scrutiny and of what could be the benefits related to the development of competitive advantages in certain sectors via Smart Specialisation. Table 1, Table 2 and Table 3 report the lists of the specialised sectors as identified by Matusiak and Kleibrink (2018) as well as the NACE 2 sectors for which we estimate the multipliers in our subsequent IO analysis.
Type-I and type-II output and VA multipliers for the specialised sectors of the economies of Albania, North Macedonia, and Serbia are reported in Table 4, Table 5 and Table 6, respectively. The tables also contain information on the transmission mechanism of the indirect effects in the rest of the economy. The data used for the analysis come from the official Supply and Use tables of the three economies for the year 2016 published by the national statistical offices. Note that in order to calculate the multipliers, we firstly transformed these tables into symmetric IO tables.
As an example of the multipliers’ interpretation, consider an increase of €1 in final demand of the agricultural products sector in Serbia (A01, Table 6). The type-I output multiplier for this sector indicates that a change in final demand of €1 induces an increase in total output of €1.21. This means that, in order to produce an additional unit of output in the target sector, the national economy’s output must increase by an additional €0.08 for the inputs to the sector itself, and by €0.12 in all stages of the supply chain for the inputs to the suppliers of the sector.
The value of the type-I output multiplier is the sum of the direct effect (1.00), the indirect effect on the sector where a change of final demand is assumed (0.08), and the industrial support effect (0.12). This highlights the importance of considering the inter-industry linkages in an economy in an economic impact analysis. The same logic applies for all the other sectors of the economy as well as for type-II multipliers. Considering the same example, when household consumption is assumed to react positively to the demand increase, the final effect of the initial €1 increase in demand would be much higher and equal to €1.53.
It is generally more interesting to analyse the economic impacts of changes in final demand in terms of increased VA rather than simply gross output. Looking at the type-II multipliers, the effect of €1 invested in the manufacture of the clothes sector in Serbia generates an increase in total VA of €0.92 (considering direct, indirect, and induced effects). It is a standard result for the VA multiplier to be lower than the output multiplier mainly because the intermediate goods and services enter the calculation of output, but not that of VA.
Looking at the type-I output multipliers, it appears that in Albania the sectors with the most potential related to a demand-side shock are all related to construction: specific construction works, mining and quarrying, and manufacture of concrete, cement, and plaster products. The values of the type-II multipliers suggest that, when taking into account the effects on household income, monetary intermediation and retailing may also be sectors in which it would be particularly effective to invest. This information should be used as an indication of the potential effects on the economy of sector- specific demand-side monetary injections (such as investments), with the actual foreseeable effects depending on the kind of strategies that the policy-makers decide to implement.
As for North Macedonia, the manufacture of machinery and equipment sector has the highest type-I multiplier, meaning that investments in this sector may be expected to have the greatest impact on the rest of the economy. This finding complements well the evidence of products’ upgrading reported by the World Bank (2017a): both North Macedonia and Serbia raised their share in high- and medium-skill products as well as technology-intensive ones, to 60–70% of manufactured exports. When household final demand is treated as endogenous so that induced effects are included in the analysis, the sector with the highest output multiplier is the food and beverage service activities sector. Finally, the results for Serbia do not identify any specific cluster of sectors as being characterised by particularly high multipliers, with a very diverse picture suggesting that investments may be fruitful in a wide range of sectors spanning from computer programming to manufacture of clothes.
These findings shed some further light on the initial identification of the current and emerging strengths done in the context of Smart Specialisation for the Western Balkans. The IO macroeconomic point of view suggests that in two countries out of three the stakeholders involved in shaping growth and innovation strategies may start from specific areas (namely, construction in Albania and manufacture of machinery in North Macedonia) to investigate which areas of the economy should be targeted by investments and monetary injections. Clearly, this evidence is not sufficient per se to guide policy intervention, but it gives an idea of the existing sectoral structure of the economy and of the production linkages. Also, it may serve as a benchmark for the comparison of subsequent ex-ante and ex-post impact assessment exercises related to the implemented policies. In this respect, the second part of the analysis deals with a different but related aspect which is international integration. Its objective is to provide additional insights and findings related to the characteristics of the Western Balkans economies, this time concentrating on their participation in the GVCs over time.
4. The International Integration of the Western Balkan Economies
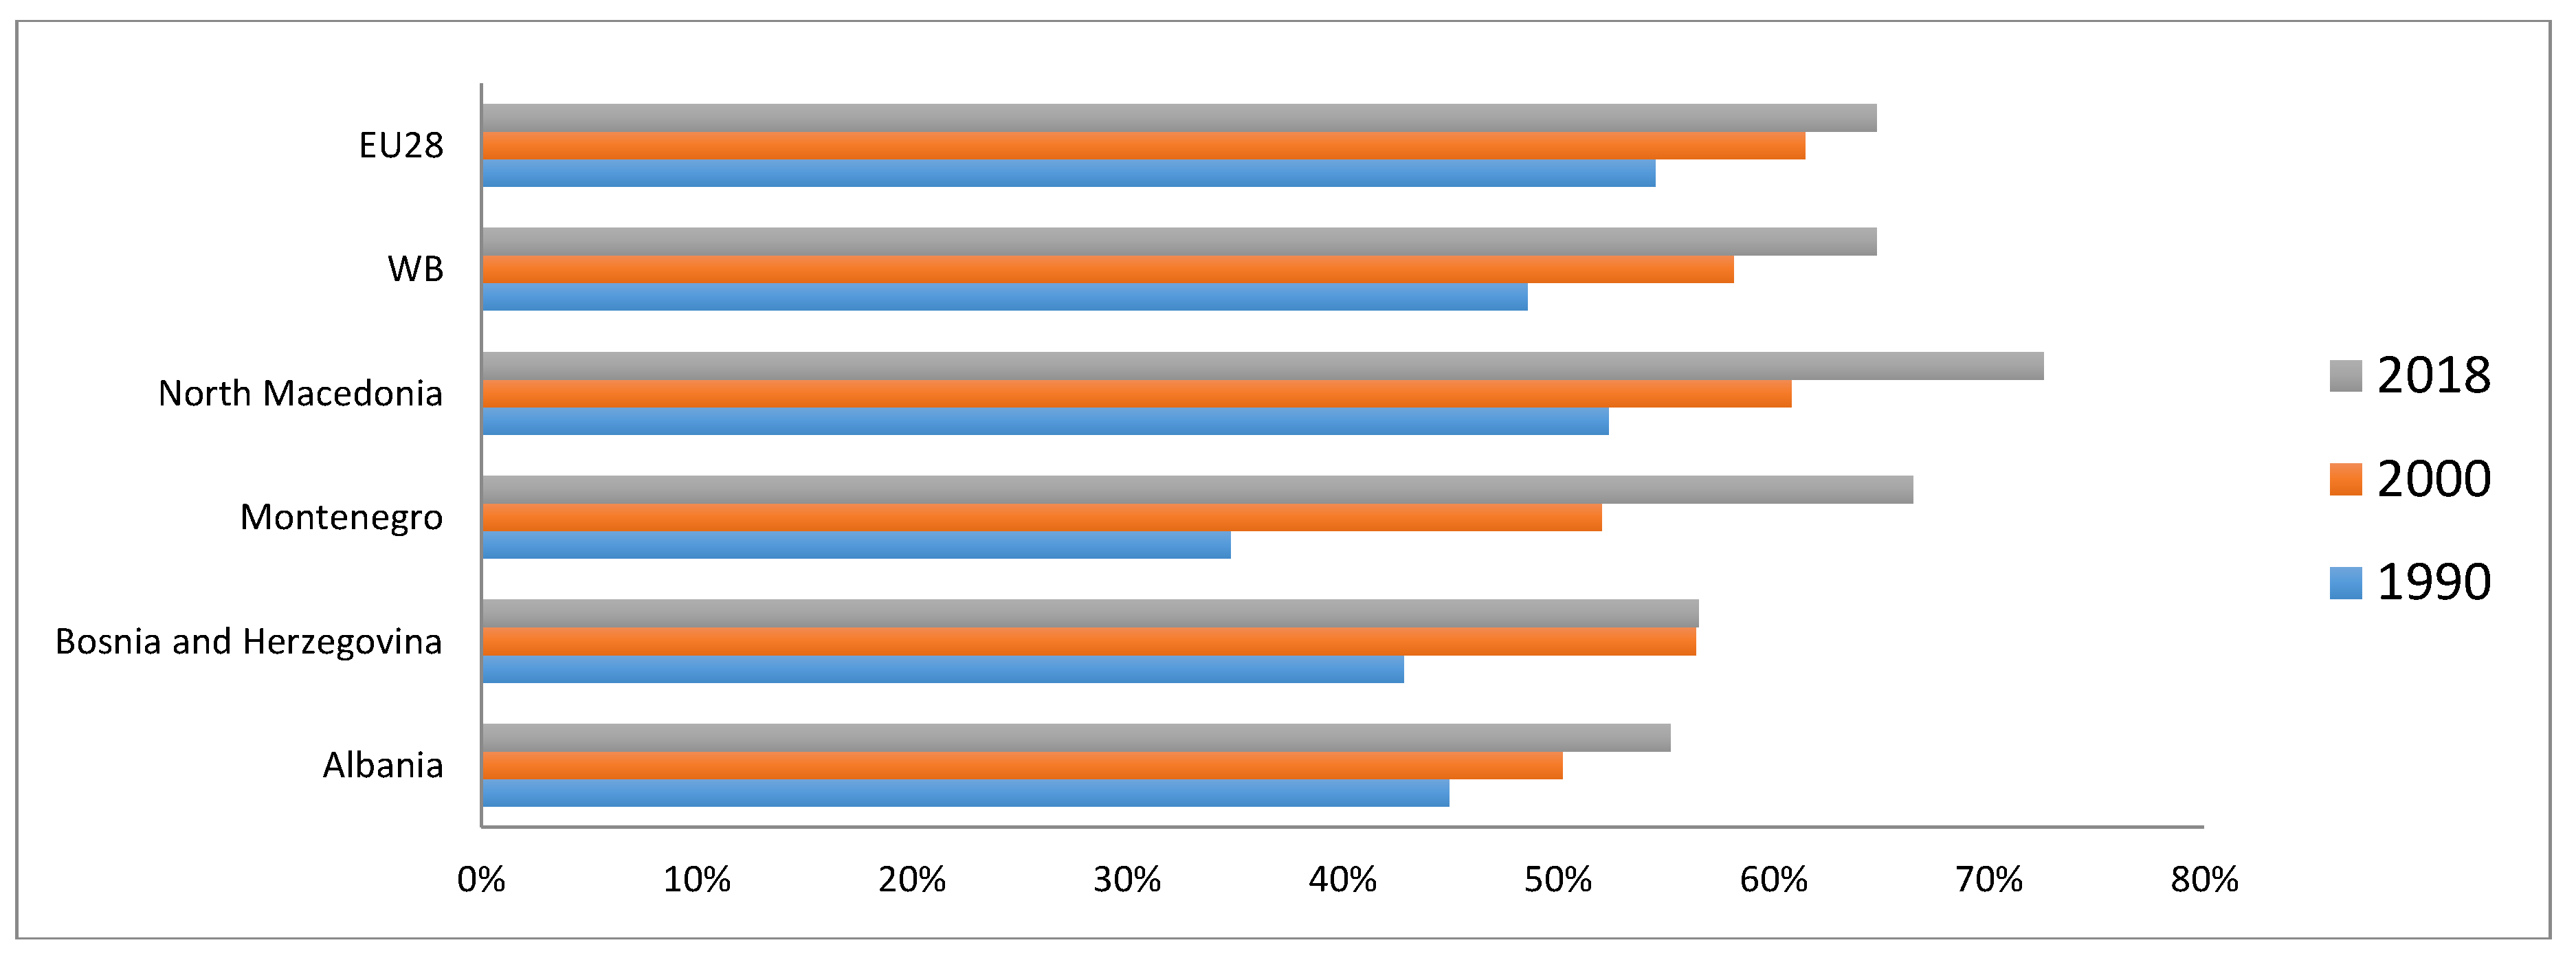
The analysis of the international economic integration of the Western Balkans economies relies on data for Albania, Bosnia and Herzegovina, Montenegro, and North Macedonia that is, the countries for which data are included in the UNCTAD-Eora dataset. We start by looking at the GVC participation rate, a synthetic indicator which can be used as a measure of the economy’s participation in cross-country production sharing activities (Koopman et al. 2010).5 In a nutshell, its value indicates the percentage of production engaged in global production networks. The GVC participation rates in three different years for the Western Balkans economies for which data are available are shown in Figure 1 below. For comparison reasons, data for the EU28 are also included in the figure, as well as the numbers related to the Western Balkans as a whole (computed by considering the four economies listed above as one single region). The lack of data for Serbia, the biggest economy of the region in terms of absolute GDP, is certainly a drawback of our analysis, but unfortunately the official data for Serbia used in Section 3 cannot be readily integrated in the MRIO UNCTAD-Eora dataset.
In each of the three periods for which we computed the indicators, North Macedonia presents the highest values among the Western Balkans economies, reaching 73% in 2018 and exceeding even the EU. Being ranked as the lowest in terms of GVC participation in 1990, Montenegro has the second highest GVC participation rate in 2018 in the region. At the same time, the GVC participation rate of Bosnia and Herzegovina has not changed notably between 2000 and 2018. The low GVC participation rates of Bosnia and Herzegovina and Albania imply that large shares of their exports are not used to produce further exports, but rather to satisfy domestic demand.
The rise of the GVC participation in the region reflects the change in the composition of the exports, moving from primary and resource-based products to medium-technology products like electrical equipment, machinery, and transport vehicles (OECD 2019). The production processes of the latter type of goods are typically more fragmented and this leads to more internationalisation. This seems consistent with the Smart Specialisation-based IO multiplier analysis which highlighted a high potential of construction-related sectors in Albania, sectors that tend to be less internationally integrated than the manufacture of medium-technology products. Conversely, the higher GVC participation of North Macedonia is reflected in its current and emerging sectoral strengths identified in the previous Section.
A high degree of integration and participation in international production frameworks is not enough to conclude that the country is gaining from its participation in GVCs (UNCTAD 2013). The existing literature on the distribution of the relative gains across countries (Schmitz 2006; Kaplinsky 2005; Milberg 2009) has pointed out that positive returns are unevenly distributed over the GVCs depending on whether country exports require the use of imported intermediate goods (upstream/backward linkages), or its exports are intermediate inputs used as a factor of production in other countries’ exports (downstream/forward linkages).
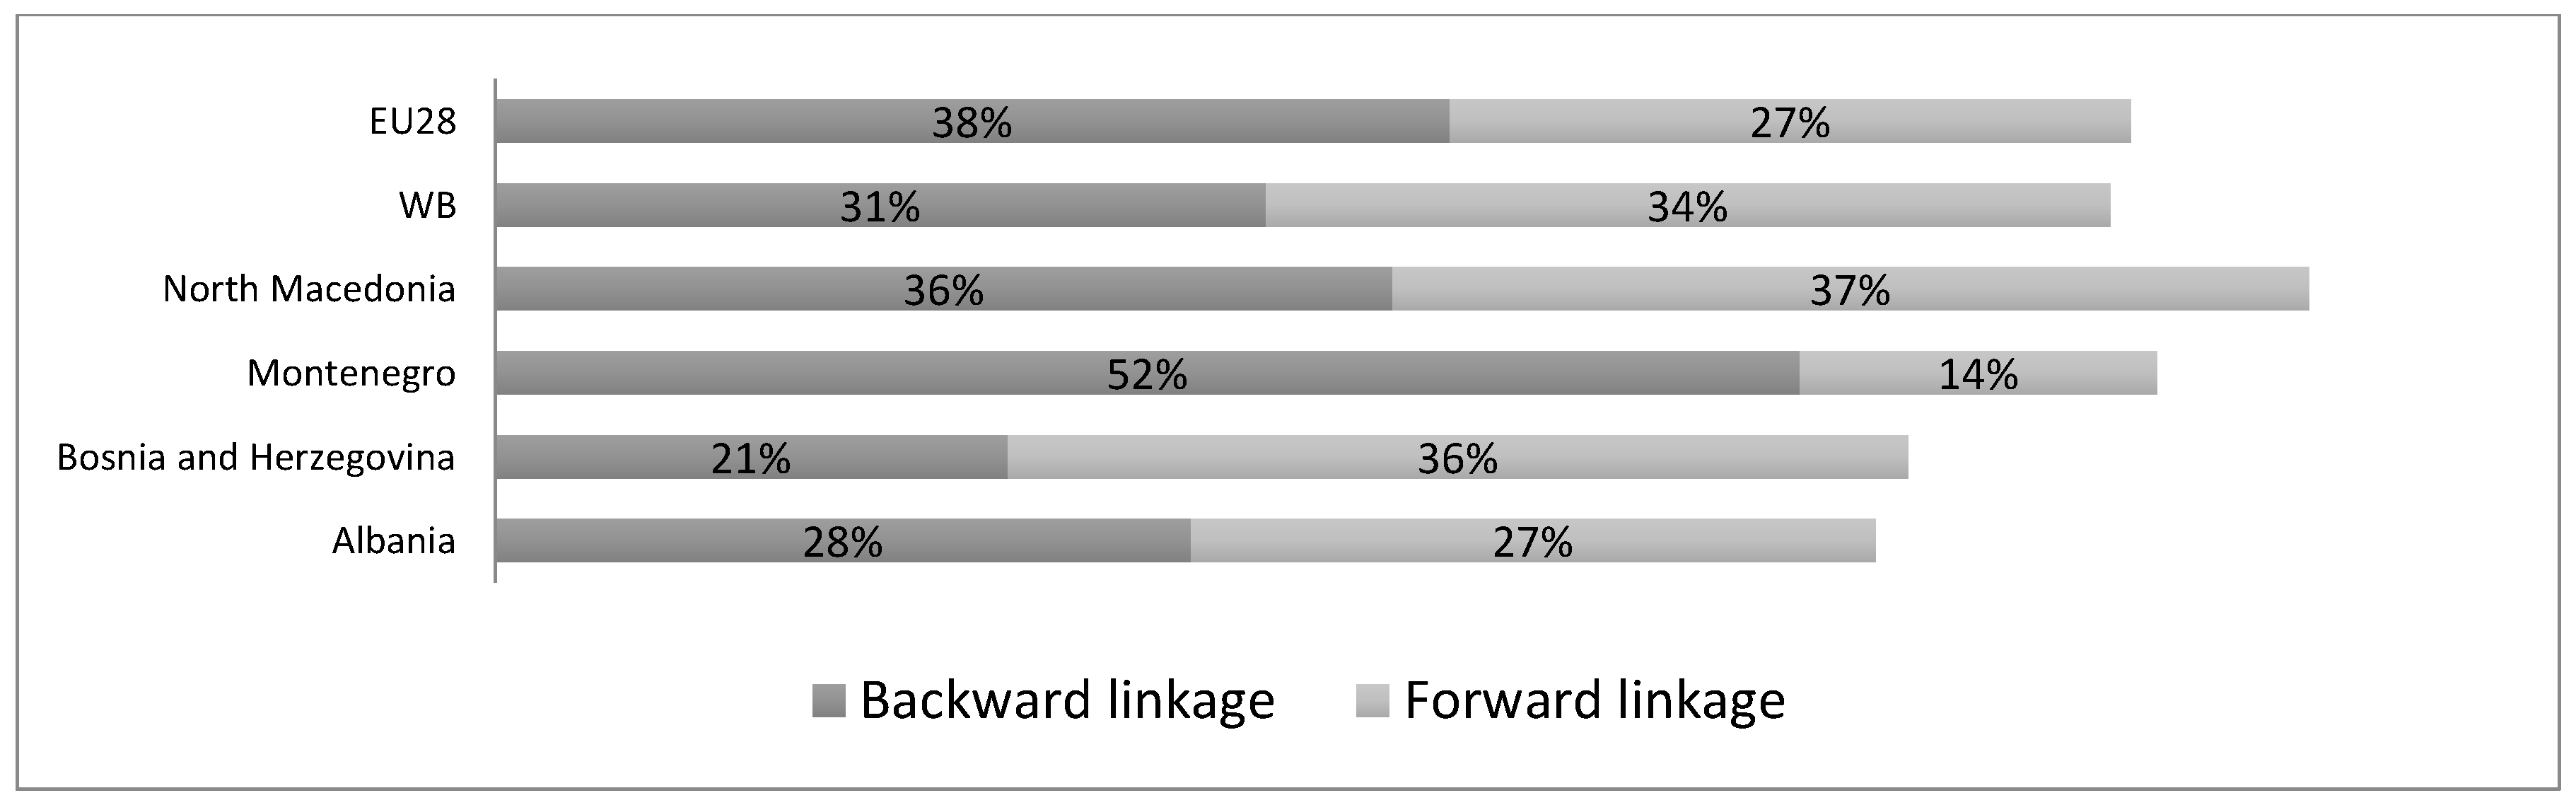
We explore this further dimension by disaggregating the 2018 GVC participation rate presented in Figure 1 into its two components: backward and forward linkages. In VA trade analysis, the former measures the share of FVA content of imported inputs used by a country to produce its exports. On the other hand, the downstream component quantifies the VA generated when domestically produced inputs are exported for the production of goods and services in other countries. Assessing the position of the economy in upstream or downstream helps to understand its potential sensitivity to trade policies. These indicators are provided in Figure 2.
Trade in Montenegro is characterised by the highest upstream component that reaches 52% of exports exceeding both the regional (31%) and the EU (38%) average values. The low downstream (14% of exports) and high upstream component of Montenegro’s export reflect its specialisation in the end stages of GVCs, revealing its extensive use of foreign inputs to produce its exports.
Conversely, the opposite holds for Bosnia and Herzegovina suggesting that the economy operates more at the beginning point of GVC, being more involved in exporting goods of the primary domestic sectors. Finally, North Macedonia and Albania are involved in GVCs 50% upstream and 50% downstream, functioning somewhere in the middle of the chains.
Forward linkages larger than backward linkages are thought to lead to higher gains for the economy (UNCTAD 2013). Indeed, the benefits coming from country participation in GVCs are related to the capacity of creating and exporting more DVA than the imported VA. Among the Western Balkans economies, the country that seems to benefit more from GVCs according to this criterion is Bosnia and Herzegovina, with Montenegro benefitting the least. This is particularly interesting when compared to the initial finding which highlighted the relatively low participation in the GVCs of Bosnia and Herzegovina (see Figure 1).
Moreover, the higher the GVC participation, the higher the share of intermediate inputs exported and imported. According to the World Bank (2017b), with the exception of Albania, more than half of the gross exports of the Western Balkans economies are intermediate products. Montenegro is characterised by the highest share of intermediates, with almost 50% of its exports consisting in primary inputs (mainly coming from the mining sector), which are related to an upstream GVC participation (explaining the 52% of backward linkages in Figure 2). Conversely, the intermediate exports of North Macedonia and Bosnia and Herzegovina mainly consist of clothing, footwear, automotive and machinery products, suggesting a downstream participation (explaining the predominance of forward linkages).
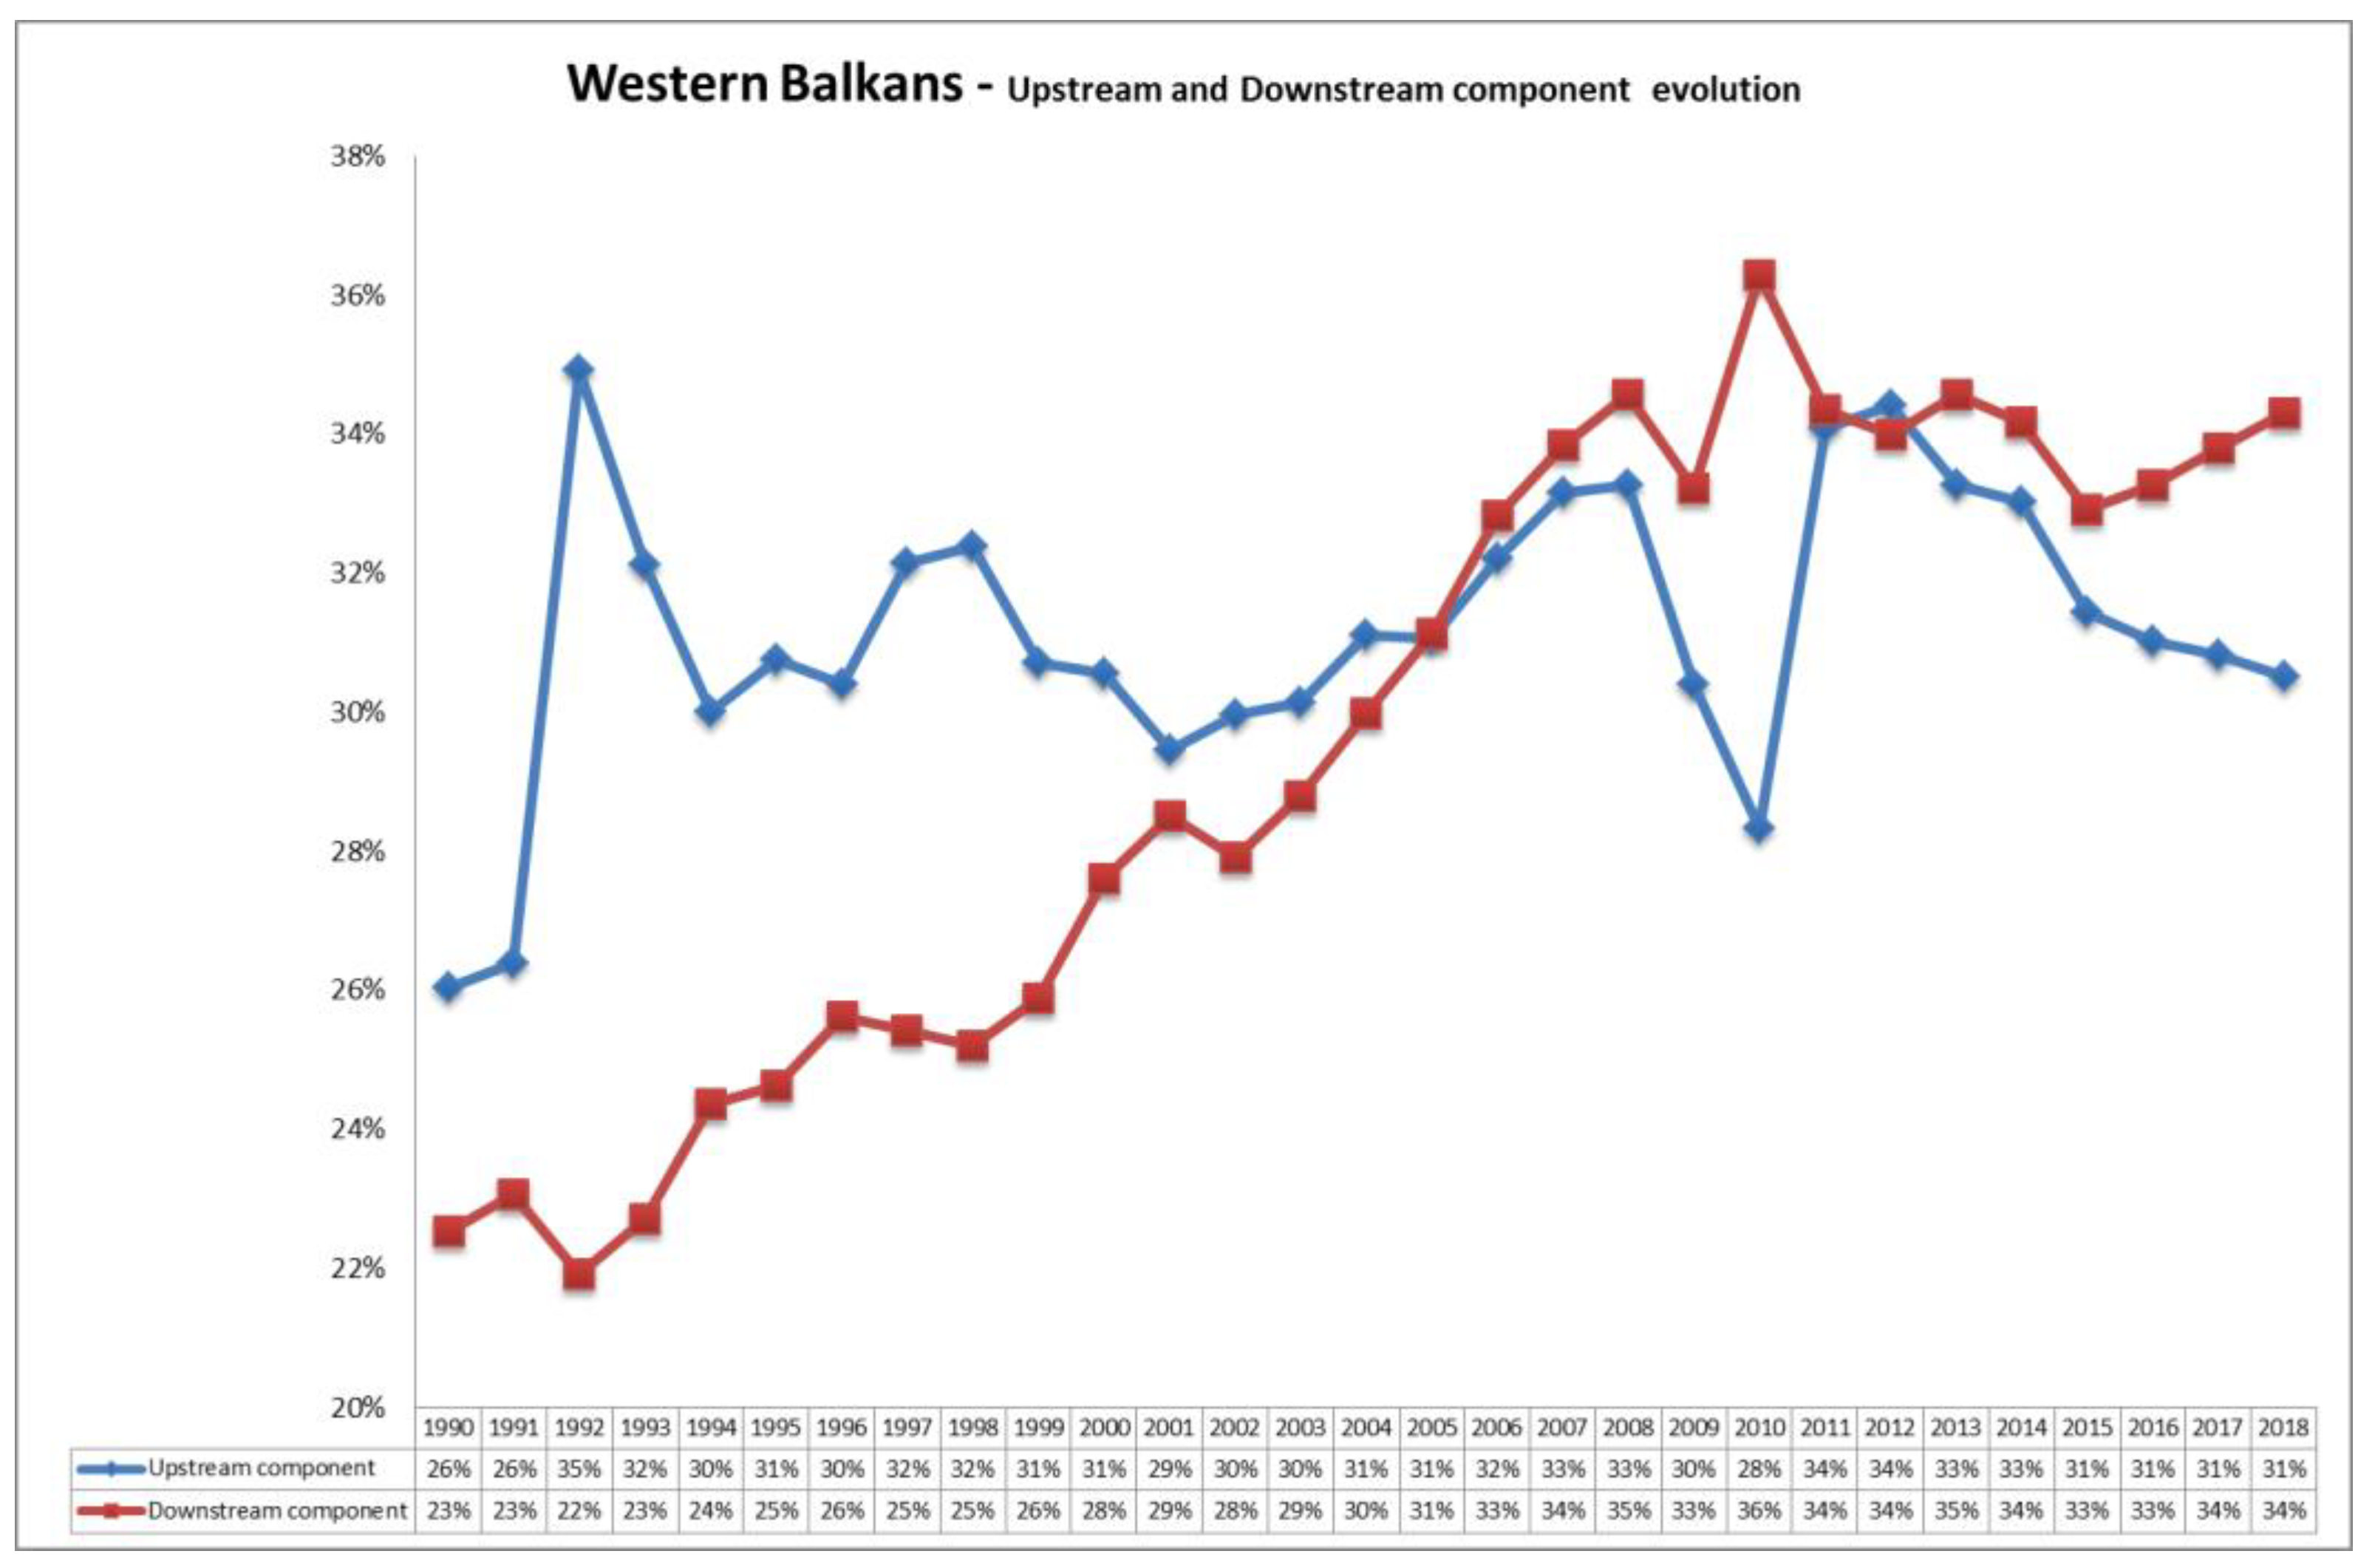
A final piece of evidence on the economic integration into GVCs of the Western Balkans is presented in Figure 3 on plotting the evolution of the upstream and downstream components of the GVC participation rate from 1990 to 2018. There is a clear upward trend in the downstream component moving from slightly above 22% to about 34% which is to be read as a positive sign in terms of VA generated thanks to economic integration. It can be noticed that the downstream component becomes higher than the upstream component in the early 2000s that is, shortly after the beginning of the trade liberalisation process in the region. The upstream component, on the other hand, presents an unsteady evolution. However, while it was above the other component in 1990, at the end of the period of observation it lies three percentage points below it (31% versus 34%) and there seems to be a trend heading towards an increase in that wedge, another good sign in terms of capacity to generate income and VA via trade integration. Finally, the disruptive effects of the recent economic crisis appear to affect the behaviour of both components especially between 2009 and 2011.
5. Conclusions
This paper contains an analysis of the industrial strengths and of the international trade performance of the Western Balkans economies carried out with an IO framework. The available official national statistics were used to estimate the output and VA multipliers associated with the industrial strengths identified in the context of the Smart Specialisation strategy, the European place- based policy, targeting economic growth and job creation through innovation and R&D. Then, the UNCTAD-Eora dataset was used to analyse the international integration of the Western Balkans and the participation in the GVCs. The two dimensions studied here appear to be particularly important from a policy point of view as both private entrepreneurship and greater international integration with the global economy and with the EU in particular have been identified as important steps for the economic development of the Western Balkans region.
Our estimated IO multipliers provide an early indication of specific macro-areas on which to focus for potential policy intervention and investments in Albania and North Macedonia (construction and manufacture of machinery, respectively). As for Serbia, it appears that a number of diverse sectors are promising in terms of potential knock-on effects of demand-side shocks, suggesting that investments targeting more than one area may all exert positive effects on economic growth and income as well as employment creation. This type of evidence can be considered as a first step towards a better understanding of the economies under scrutiny both from an academic and from a policy making point of view. The multipliers themselves are not only an indication of the potential effects on the economy of demand-side monetary injections (possibly related to the implementation of Smart Specialisation), but also a benchmark against which to compare future ex- ante and ex-post policy evaluations and impact assessments.
The second part of the analysis concentrates on the integration of the Western Balkans economies in the GVCs by studying a number of VA-related indicators. The results suggest that Bosnia and Herzegovina is extracting the most out of its GVC participation in the region, although all the economies considered are characterised by positive trends, with a growing importance of the downstream component of the GVC participation rate. This indicates an increasing capacity to create and export more domestic VA than what is imported for production purposes.
Our analysis also suggests that the importance of the more internationally integrated sectors is key to understanding how the economies of the region are participating in the GVCs and how much value they are extracting from such participation. Continuing to increase international economic integration appears to be a good economic strategy, but our results recommend caution in terms of the chosen sectoral specialisation as integration per se is not a guarantee of economic growth and prosperity. This analysis nevertheless remains as but a first step in order to define the economic position of the Western Balkans both now and over the last three decades. Should more data become available, it would be interesting to complete the picture both in domestic and international terms.
As for the former, the availability of national statistics is crucial in order to increase the sample: the publication of new official IO tables could permit a more detailed sectoral analysis in order to understand better the role played by Smart Specialisation and innovation in the region. With regard to the international integration analysis, the constant updating of the UNCTAD-Eora dataset is a promising feature indicating that better data coverage may be achieved in the future. This could warrant a check of the validity of the results reported here via an analysis on a wider sample, especially given the fact that the UNCTAD-Eora dataset currently lacks information for Serbia which is the biggest economy of the Western Balkans in terms of GDP.
The President of the European Commission (2020) has declared as recently as May 2020 that: “The Western Balkans belong in the EU. There is no question for us about this. And this is why I firmly believe that the EU has a special responsibility in assisting its partners in the region”. Findings such as those presented in this paper, and further evidence on these topics, are welcome both from an academic and from a policy point of view. Since support to economic growth and innovation via Smart Specialisation will continue, we can only expect an increasing amount of interest in the provision of data and the production of empirical evidence to guide the related economic and policy choices.
Author Contributions
Formal analysis, G.M. and S.S.; Investigation, G.M.; Methodology, G.M.; Project administration, S.S.; Writing—original draft, S.S.; Writing—review and editing, G.M. and S.S. All authors have read and agreed to the published version of the manuscript.
Funding
This research received no external funding.
Conflicts of Interest
The authors declare no conflict of interest.
References
- Aranguren, Mari José, Edurne Magro, Mikel Navarro, and James R. Wilson. 2019. Governance of the territorial entrepreneurial discovery process: Looking under the bonnet of RIS3. Regional Studies 53: 451–61. [Google Scholar] [CrossRef]
- Balland, Pierre Alexandre, Ron A. Boschma, Joan Crespo, and David L. Rigby. 2019. Smart specialization policy in the EU: Relatedness, knowledge complexity and regional diversification. Regional Studies 53: 1252–68. [Google Scholar] [CrossRef] [Green Version]
- Barca, Fabrizio. 2009. An Agenda for a Reformed Cohesion Policy. A Place-Based Approach to Meeting European Union Challenges and Expectations. Independent Report Prepared at the Request of Danuta Hübner, Commissioner for Regional Policy. Brussels. April. Available online: https://www.europarl.europa.eu/meetdocs/2009_2014/documents/regi/dv/barca_report_/barca_report_en.pdf (accessed on 30 October 2020).
- Capello, Roberta, and Henning Kroll. 2016. From theory to practice in smart specialization strategy: Emerging limits and possible future trajectories. European Planning Studies 24: 1393–406. [Google Scholar] [CrossRef]
- European Commission. 2018. A Credible Enlargement Perspective for and Enhanced EU Engagement with the Western Balkans. In Communication to the European Parliament, the Council, the European Economic and Social Committee and the Committee of the Regions. COM (2018) 65 Final. Strasbourg: European Commission. [Google Scholar]
- European Commission. 2019. 2019 Communication on EU Enlargement Policy. In Communication to the European Parliament, the Council, the European Economic and Social Committee and the Committee of the Regions. COM (2019) 260 Final. Brussels: European Commission. [Google Scholar]
- European Commission. 2020. Statement by President von der Leyen at the Joint Press Conference with President Michel and Andrej Plenkovic, Prime Minister of Croatia, Following the EU-Western Balkans Zagreb Summit. Statement/20/825. Available online: https://ec.europa.eu/commission/presscorner/detail/en/statement_20_825 (accessed on 12 October 2020).
- Foray, Dominique. 2018a. Smart specialization strategies as a case of mission-oriented policy—A case study on the emergence of new policy practices. Industrial and Corporate Change 27: 817–32. [Google Scholar] [CrossRef]
- Foray, Dominique. 2018b. Smart specialisation strategies and industrial modernisation in European regions—Theory and practice. Cambridge Journal of Economics 42: 1505–20. [Google Scholar]
- Gianelle, Carlo, Fabrizio Guzzo, and Krzysztof Mieszkowski. 2019. Smart specialisation: What gets lost in translation from concept to practice? Regional Studies. [Google Scholar] [CrossRef] [Green Version]
- Hasan, Iftekhar, and Christopher L. Tucci. 2010. The innovation-economic growth nexus: Global evidence. Research Policy 39: 1264–76. [Google Scholar] [CrossRef] [Green Version]
- Hummels, David, Jun Ishii, and Kei-Mu Yi. 2001. The nature and growth of vertical specialization in world trade. Journal of International Economics 54: 75–96. [Google Scholar] [CrossRef]
- Johnson, Robert C. 2018. Measuring global value chains. Annual Review of Economics 10: 207–36. [Google Scholar] [CrossRef] [Green Version]
- Johnson, Robert C., and Guillermo Noguera. 2012. Accounting for intermediates: Production sharing and trade in value added. Journal of International Economics 86: 224–36. [Google Scholar] [CrossRef] [Green Version]
- Kaplinsky, Raphael. 2005. Globalization, Poverty and Inequality: Between a Rockand a Hard Place. Cambridge: Policy Press. [Google Scholar]
- Koopman, Robert, William Powers, Zhi Wang, and Shang-Jin Wei. 2010. Give Credit Where Credit Is Due: Tracing Value Added in Global Production Chains. NBER Working Paper No. 16426. Cambridge: National Bureau of Economic Research. [Google Scholar]
- Koopman, Robert, Zhi Wang, and Shang-Jin Wei. 2014. Tracing Value-Added and Double Counting in Gross Exports. American Economic Review 104: 459–94. [Google Scholar] [CrossRef] [Green Version]
- Leontief, Wassily. 1941. The Structure of American Economy, 1919–1929. Cambridge: Harvard University Press. [Google Scholar]
- Leontief, Wassily. 1986. Input-Output Economics. Oxford: Oxford University Press. [Google Scholar]
- Matusiak, Monika, and Alexander Kleibrink, eds. 2018. Supporting an Innovation Agenda for the Western Balkans: Tools and Methodologies. Luxembourg: Publications Office of the European Union. [Google Scholar]
- Milberg, William. 2009. Shifting Sources and Uses of Profits: Sustaining US Financialization with Global Value Chains. Schwartz Centre for Economic Policy Analysis. SCEP Working Paper 2007-9. New York: The New School for Social Research. [Google Scholar]
- Miller, Ronald E., and Peter D. Blair. 2009. Input-Output Analysis: Foundations and Extensions. Cambridge: Cambridge University Press. [Google Scholar]
- Morgan, Kevin. 2017. Nurturing novelty: Regional innovation policy in the age of smart specialization. Environment and Planning C Politics and Space 35: 569–83. [Google Scholar] [CrossRef] [Green Version]
- OECD. 2013. Interconnected Economies: Benefiting from Global Value Chains. Paris: OECD Publishing. [Google Scholar]
- OECD. 2019. Unleashing the Transformation Potential for Growth in the Western Balkans. Paris: OECD Publishing. [Google Scholar]
- OECD-WTO. 2013. OECD-WTO Trade in Value Added (TiVA) Database, FAQs: Background Note. Available online: https://www.oecd.org/sti/ind/measuring-trade-in-value-added.htm (accessed on 12 October 2020).
- Schmitz, Hubert. 2006. Learning and earning in global garment and footwear chains. The European Journal of Development Research 18: 546–71. [Google Scholar] [CrossRef]
- Trippl, Michaela, Elena Zukauskaite, and Adrian Healy. 2019. Shaping smart specialization: the role of place-specific factors in advanced, intermediate and less-developed European regions. Regional Studies 54: 1328–40. [Google Scholar] [CrossRef] [Green Version]
- United Nations Conference on Trade and Development (UNCTAD). 2013. Global Value Chains and Development: Investment and Value Added Trade in the Global Economy, Advance Unedited Version; United Nations Publication UNCTAD/DIAE/2013/1; Available online: https://unctad.org/system/files/official-document/wir2013_en.pdf (accessed on 30 October 2020).
- United Nations Conference on Trade and Development (UNCTAD). 2015. UNCTAD-EORA Global Value Chain Database: Methodology and further research agenda. Transnational Corporations. [Google Scholar] [CrossRef]
- Varga, Attila, Szabó Norbert, and Sebestyén Tamás. 2020. Economic impact modelling of smart specialization policy: Which industries should prioritization target? Papers in Regional Science 99: 1367–88. [Google Scholar] [CrossRef]
- World Bank. 2017a. Western Balkans: Regional Economic Integration Issues Notes. World Bank Group Input in WB6 Regional Economic Area Action Plan. Washington: The World Bank Group. [Google Scholar]
- World Bank. 2017b. The Western Balkans: Revving up the Engines of Growth and Prosperity. Washington: The World Bank Group. [Google Scholar]
| 1 | This designation is without prejudice to positions on status, and is in line with UNSCR 1244/1999 and the ICJ Opinion on the Kosovo declaration of independence. |
| 2 | |
| 3 | GVC engagement can also be measured using micro-data. According to Johnson (2018), there is limited overlap between the macro- and micro-approaches, and the latter require data which are not readily available for the region under scrutiny here. Therefore, we use a macroeconomic approach although we believe that further micro-based evidence could complement well what we present in our paper. |
| 4 | According to the Koopman et al. (2014) decomposition, DVA includes two main components: the VA content of exports (VAX, as defined by Johnson and Noguera 2012), and the domestic content in intermediate exports that finally returns home (DVX, which is very similar to the VS1 indicator formalized by Hummels et al. 2001). |
| 5 | See Section 2.2. |
Figure 1.
Global Value Chain (GVC) participation rate, share of exports. Source: Our calculations based on UNCTAD-Eora GVC Database.
Figure 1.
Global Value Chain (GVC) participation rate, share of exports. Source: Our calculations based on UNCTAD-Eora GVC Database.

Figure 2.
Upstream (backward) and downstream (forward) components of 2018 GVC participation rate, share of exports. Source: Our calculations based on UNCTAD-Eora GVC Database.
Figure 2.
Upstream (backward) and downstream (forward) components of 2018 GVC participation rate, share of exports. Source: Our calculations based on UNCTAD-Eora GVC Database.

Figure 3.
Evolution of the upstream and downstream components of GVC participation rate. Source: Our calculations based on UNCTAD-Eora GVC Database.
Figure 3.
Evolution of the upstream and downstream components of GVC participation rate. Source: Our calculations based on UNCTAD-Eora GVC Database.


Table 1.
Identified economic specialisations in Albania.
| Current Strengths | NACE 2 | Emerging Strengths | NACE 2 |
|---|---|---|---|
| Marine fishing | A03 | Other mining and quarrying | B08 |
| Manufacture of concrete, cement, and plaster products | C23 | Manufacture of footwear | C15 |
| Other specific construction works | F43 | Other specific construction works | F43 |
| Wholesale of information-communication equipment | G46 | Retail in non-specialised stores | G47 |
| Non-specialised wholesale trade | G46 | ||
| Retail in non-specialised stores | G47 | ||
| Monetary intermediation | K64 | ||
| Management of real estate on a fee or contract basis | L68 |
Source: Matusiak and Kleibrink (2018).
Table 2.
Identified economic specialisations in North Macedonia.
| Current Strengths | NACE 2 | Emerging Strengths | NACE 2 |
|---|---|---|---|
| Manufacture of clothes except fur | C13–C15 | Plant propagation | A01 |
| Retail in other household articles in specialised stores | G47 | Services in agriculture and post-harvest crop activities | A01 |
| Retail in other goods in specialised stores | G47 | Manufacture of electric components and boards | C28 |
| Freight transport by road and removal services | H49 | Manufacture of other general-purpose machines | C28 |
| Restaurants and mobile food service activities | I56 | Manufacture of other parts/accessories for motor vehicles | C29 |
| Steam and air conditioning supply | D35 | ||
| Wireless telecommunication services | J61 | ||
| Renting and operating of own or leased real estate | L68 | ||
| Management of real estate on a fee or contract basis | L68 |
Source: Matusiak and Kleibrink (2018).
Table 3.
Identified economic specialisations in Serbia.
| Current Strengths | NACE 2 | Emerging Strengths | NACE 2 |
|---|---|---|---|
| Growing of one-year and two-year plants | A01 | Manufacture of clothes, except fur | C14 |
| Support activities for petroleum and natural gas extraction | B09 | Sawmilling and planing of wood | C16 |
| Manufacture of rubber products | C22 | Manufacture of cutlery, tools and general-purpose goods of metal | C25 |
| Wired telecommunication activities | J61 | Building of ships and floating structures | C30 |
| Management consultancy activities | M70 | Production, transmission, and distribution of electricity | D35 |
| Wolesale for a commission | G46 | ||
| Retail sale of information-communication equipment in specialised stores | G47 | ||
| Freight rail transport | H49 | ||
| Service activities incidental to transportation | H52 | ||
| Beverage preparing and serving activities | I56 | ||
| Computer programming, consultancy, and related activities | J62 |
Source: Matusiak and Kleibrink (2018).
Table 4.
IO multipliers—current and emerging strengths in Albania.
| NACE 2 Sector | Sector Indirect Effect | Industrial Support Effect | Type I Output Multiplier | Type II Output Multiplier | Type I VA Multiplier | Type II VA Multiplier |
|---|---|---|---|---|---|---|
| Current strengths | ||||||
| A03 | 0.240 | 0.125 | 1.37 | 1.73 | 0.89 | 1.00 |
| C23 | 0.108 | 0.607 | 1.72 | 3.07 | 0.39 | 0.81 |
| F43 | 0.347 | 0.854 | 2.20 | 5.39 | 0.75 | 1.75 |
| G46 | 0.051 | 0.518 | 1.57 | 4.64 | 0.89 | 1.85 |
| G47 | 0.002 | 0.412 | 1.41 | 4.25 | 0.79 | 1.67 |
| K64 | 0.068 | 0.453 | 1.52 | 4.60 | 0.79 | 1.75 |
| L68 | 0.002 | 0.252 | 1.25 | 3.33 | 0.96 | 1.61 |
| Emerging strengths | ||||||
| B08 | 0.181 | 0.516 | 1.70 | 3.34 | 0.76 | 1.27 |
| C15 | 0.085 | 0.454 | 1.54 | 2.81 | 0.55 | 0.95 |
| F43 | 0.347 | 0.854 | 2.20 | 5.39 | 0.75 | 1.75 |
| G47 | 0.002 | 0.412 | 1.41 | 4.25 | 0.79 | 1.67 |
Source: own calculations.
Table 5.
IO multipliers—current and emerging strengths in North Macedonia.
| NACE 2 Sector | Sector Indirect Effect | Industrial Support Effect | Type I Output Multiplier | Type II Output Multiplier | Type I VA Multiplier | Type II VA Multiplier |
|---|---|---|---|---|---|---|
| Current strengths | ||||||
| C13-C15 | 0.267 | 0.225 | 1.49 | 3.39 | 0.46 | 0.96 |
| G47 | 0.002 | 0.604 | 1.61 | 3.11 | 0.78 | 1.17 |
| H49 | 0.119 | 0.631 | 1.75 | 2.88 | 0.46 | 0.76 |
| I56 | 0.025 | 0.820 | 1.85 | 3.73 | 0.65 | 1.15 |
| Emerging strengths | ||||||
| A01 | 0.242 | 0.376 | 1.62 | 1.93 | 0.67 | 0.76 |
| C27 | 0.046 | 0.270 | 1.32 | 1.57 | 0.10 | 0.17 |
| C28 | 0.140 | 0.818 | 1.96 | 2.21 | 0.17 | 0.23 |
| C29 | 0.193 | 0.377 | 1.57 | 2.43 | 0.22 | 0.45 |
| D35 | 0.076 | 0.588 | 1.66 | 2.85 | 0.54 | 0.86 |
| J61 | 0.155 | 0.490 | 1.65 | 2.94 | 0.64 | 0.99 |
| L68 | 0.003 | 0.558 | 1.56 | 2.79 | 0.80 | 1.13 |
Source: own calculations.
Table 6.
IO multipliers—current and emerging strengths in Serbia.
| NACE 2 Sector | Sector Indirect Effect | Industrial Support Effect | Type I Output Multiplier | Type II Output Multiplier | Type I VA Multiplier | Type II VA Multiplier |
|---|---|---|---|---|---|---|
| Current strengths | ||||||
| A01 | 0.082 | 0.124 | 1.21 | 1.53 | 0.77 | 0.92 |
| B09 | 0.040 | 0.045 | 1.09 | 2.14 | 0.59 | 1.07 |
| C22 | 0.027 | 0.184 | 1.21 | 2.95 | 0.64 | 1.42 |
| J61 | 0.065 | 0.136 | 1.20 | 3.01 | 0.91 | 1.72 |
| M70 | 0.005 | 0.083 | 1.09 | 3.27 | 0.80 | 1.79 |
| Emerging strengths | ||||||
| C14 | 0.167 | 0.094 | 1.26 | 4.00 | 0.60 | 1.84 |
| C16 | 0.021 | 0.125 | 1.15 | 3.80 | 0.73 | 1.93 |
| C25 | 0.009 | 0.194 | 1.20 | 3.94 | 0.72 | 1.96 |
| C30 | 0.000 | 0.319 | 1.32 | 3.50 | 0.47 | 1.46 |
| D35 | 0.038 | 0.199 | 1.24 | 3.45 | 0.91 | 1.91 |
| G46 | 0.001 | 0.197 | 1.20 | 3.07 | 0.93 | 1.77 |
| G47 | 0.000 | 0.235 | 1.24 | 3.58 | 0.93 | 1.99 |
| H49 | 0.076 | 0.315 | 1.39 | 3.41 | 0.73 | 1.64 |
| H52 | 0.000 | 0.120 | 1.12 | 2.06 | 0.50 | 0.92 |
| I56 | 0.013 | 0.472 | 1.49 | 4.09 | 0.89 | 2.07 |
| J62 | 0.001 | 0.047 | 1.05 | 4.86 | 0.86 | 2.58 |
Source: own calculations.
Publisher’s Note: MDPI stays neutral with regard to jurisdictional claims in published maps and institutional affiliations. |
© 2020 by the authors. Licensee MDPI, Basel, Switzerland. This article is an open access article distributed under the terms and conditions of the Creative Commons Attribution (CC BY) license (http://creativecommons.org/licenses/by/4.0/).
Share and Cite
MDPI and ACS Style
Mandras, G.; Salotti, S. An Input–Output Analysis of Sectoral Specialization and Trade Integration of the Western Balkans Economies. Economies 2020, 8, 93. https://0-doi-org.brum.beds.ac.uk/10.3390/economies8040093
AMA Style
Mandras G, Salotti S. An Input–Output Analysis of Sectoral Specialization and Trade Integration of the Western Balkans Economies. Economies. 2020; 8(4):93. https://0-doi-org.brum.beds.ac.uk/10.3390/economies8040093
Chicago/Turabian StyleMandras, Giovanni, and Simone Salotti. 2020. "An Input–Output Analysis of Sectoral Specialization and Trade Integration of the Western Balkans Economies" Economies 8, no. 4: 93. https://0-doi-org.brum.beds.ac.uk/10.3390/economies8040093
Note that from the first issue of 2016, this journal uses article numbers instead of page numbers. See further details here.