Analysis of the Territorial Efficiency of European Funds as an Instrument to Reduce Labor Gender Differences


1
Department of General Economics, University of Cadiz, 11002 Cadiz, Spain
2
Applied Social Sciences Department, Community University of Chapeco Region, Servidao Anjo da Guarda, 295D, Chapecó 89809-900, Brazil
*
Author to whom correspondence should be addressed.
Economies 2021, 9(1), 9; https://0-doi-org.brum.beds.ac.uk/10.3390/economies9010009
Submission received: 7 December 2020
/
Revised: 12 January 2021
/
Accepted: 16 January 2021
/
Published: 27 January 2021
Abstract
:Gender equality has been one of the goals of the European Union since 1957. Article 157 of the Treaty on the Functioning of the European Union authorizes the European Parliament and the Council to adopt all those measures that guarantee the application of the principle of equality opportunities and equal treatment for men and women in employment and occupation matters. The main goal of this article was to determine whether the use of European Funds by Eurozone countries has made it possible to reduce labor differences in gender matters. To this end, the efficiency levels of the Funds are analyzed in two different periods, 2007 to 2013 and 2014 to 2020. Data Envelopment Analysis (DEA), a methodology frequently used by researchers in efficiency analyses, was applied. Among the main conclusions obtained are that the efficiency levels from the period 2014 to 2020 have been higher than that obtained in the previous period, but there are significant and persistent differences over time in the levels of gender efficiency between the different countries of the Eurozone.
JEL Classification:
C61; J08; R58; D24; F551. Introduction
Significant progress has been made in EU Member States in addressing gender inequalities at the legislative level, but the realization of women’s and men’s equal rights in everyday life still faces challenges. In particular, the worst situation with gender equality is recorded in the power structures involved in decision-making. At the same time, the same growth rate is observed in this area, which is mainly due to the increase in the representation of women on the boards of large companies. However, such growth applies to a few European countries, such as France, which is the only EU country where the number of women in the governing bodies of companies reaches 40%. In addition, cases of violence against women and so on demonstrate that structural gender inequality still exists.
To improve the situation, the European Commission considers urgent to integrate the principle of gender equality into strategies that have a direct and indirect impact on the lives of women and men. Women’s concerns, needs, and expectations, as well as men’s, must be taken into account in policy development and implementation. In this regard, the European Commission adopted in 1996 an approach to integrating gender priorities into policy (gender mainstreaming) (Commission of the European Communities 1996).
In addition, in order to implement the proclaimed policy of gender equality, the Council of Europe (CoE) as an international organization concerned with crime prevention, drug abuse, environmental protection, bioethics, migration, and the equal rights and opportunities of women and men and anti-discrimination, adopted in March 2018 the Gender Equality Strategy (Council of Europe 2018), designed for the period 2018–2023. It should be noted that the previous Strategy covered 2014–2017 (Council of Europe 2013) and was implemented by achieving five goals that considered issues of multiple discrimination and the special rights and needs of women and men throughout life, namely:
- Combating gender stereotypes and gender discrimination;
- Preventing and combating violence against women;
- Guaranteeing equal access of women to justice;
- Achieving equal participation of women and men in political/social decision-making; and
- Implementation of the strategy to achieve gender equality in policy and all measures.
The Gender Equality Strategy for 2018–2023 adds to these goals a new issue caused by the current geopolitical situation, namely the protection of the rights of migrants, refugees, women, and girls seeking asylum.
The CoE’s core documents on equal rights and opportunities include the Convention for the Protection of Human Rights and Fundamental Freedoms (adopted by the Council of Europe in 1950). Additionally, the Convention includes the Declaration of the Committee of Ministers of the Council of Europe “On Equality between Women and Men” (adopted in 1988). In particular, this Declaration states that “in modern society, there is ‘de jure and de facto’ inequality between women and men”. Therefore, CoE member states must work on their gender policies to change the situation.
Firstly, it is important to underline that the European Union’s gender strategy, as a whole, outlines the areas in which gender discrimination exists and proposes specific mechanisms for its elimination. However, one of the main problems of gender inequality is the spread of gender-based violence. The introduction to the Strategy states that “violence against women remains the clearest example of unequal power relations between women and men. It is interpreted as a violation of human rights and as a major obstacle to gender equality”. The Strategy defines the Council of Europe Convention on Preventing and Combating Violence against Women and Domestic Violence (Istanbul Convention; Council of Europe 2011) as the largest international treaty to combat such human rights violations.
Secondly, the Strategy addresses the role of men in achieving gender equality. It is noted that changing gender relations, empowering women, and eliminating negative traditional gender stereotypes are the way to achieve gender equality. As consequence, society and women may profit from well-being. Then, the Committee of Ministers of the Council of Europe, in its Recommendation to Member States on Gender Equality Standards and Principles, reminds of the importance of approving the methodology for implementing the Strategy. As result, State members will be achieving gender equality, including gender finance, gender analysis, and gender impact assessment.
To monitor the progress towards gender equality and create an information base for further policy development in this area, several indices have been developed, reflecting improvements towards achievements of the strategic goals set. Such instruments include the Gender Equality Index (GEI) and the Gender Gap Index. Currently, the GEI shows minimal progress in the EU in respecting equal rights of men and women to professional and social development. GEI outcomes allowed the identification that, as for October 2020, GEI is 67.9 compared to last year, when it was 67.4 from 100, which shows a slight positive movement (European Institute for Gender Equality 2019).
The GEI, developed by the European Institute for Gender Equality (EIGE), is based on indicators in six key areas: labor, money, knowledge, time, power, and health, as well as two additional ones—violence against women and related inequalities. This index reflects the various realities faced by different groups of women and men. It explores how factors, such as disability, age, level of education, country of birth, and family type, intersect with gender, creating different paths in people’s lives. Starting from 2019, for the first time the GEI covers the situation of lesbian, gay, bisexual, transgender, queer and intersex (LGBTQI+) and Roma and Muslim women in areas where statistics were available.
Thus, this indicator is closely linked to the EU’s goals and international commitments, such as the Beijing Platform for Action (European Institute for Gender Equality 2020) and the 2030 Agenda for Sustainable Development and its Sustainable Development Goals (SDGs) (General Assembly of United Nations 2015).
Another important tool for assessing the EU’s progress and policy towards achieving the goals of the Gender Equality Strategy is the Global Gender Gap Index, which has been published as part of research conducted for the World Economic Forum over the past 14 years. For 2020, the index includes data from 153 countries and is measured by four indicators: economic participation, empowerment in politics, education and access to health care and life expectancy. It should be noted that, in addition to this year’s report of The Global Gender Gap Index, research was added on the prospects of the gender gap in the professions of the future.
Thus, according to data for 2020, the country with the best level of gender equality remains as Iceland, which demonstrates its leadership for the 11th year in a row (the gender gap is closed by 88%). Among the other countries in the world in the top 10 by gender gap index included Norway (84.2%), Finland (83.2%), Sweden (82%), Nicaragua (80%), New Zealand (79.9%), Ireland (79.8), Rwanda (79.1%), and Germany (78.7%). For the first time, Spain (79.5%) broke into the top ten jumping from 29th to 8th place compared to last year (World Economic Forum 2019).
According to the McKinsey Global Institute, achieving gender equality by 2025 could increase world Gross Domestic Product (GDP) by $12 trillion (McKinsey Global Institute Report 2015), which is directly related to the growth of personal satisfaction with life based on the subjective perception of well-being; therefore, social, urban, and natural environment combine to influence the feeling of happiness. According to the UN World Happiness Report for 2020 (World Happiness Report 2020), people are happiest in the countries that rank first in terms of gender development, namely on the 1st place is Finland, 2nd place is for Denmark, 3rd place is occupied by Switzerland, 4th place is for Iceland, and the 5th place belongs to Norway.
Today, the European Union is one of the largest supporters and defenders of human rights worldwide. To ensure these rights, including gender equality and women’s rights, a significant number of directives and other regulations have been adopted. However, even the most perfect legislation loses its weight if it is not implemented in the reality. In view of this, although progress in achieving gender equality in the EU is slow, it is unquestionable and manifests itself both at the level of legislation aimed at combating gender discrimination and at the level of EU personnel policy, setting priorities for its development and funding programs.
Considering all EU incentives, the implementation of the principle of equal rights and opportunities for women and men is one of the important conditions for sustainable socio-economic development, positive changes in society and its well-being, realization of human rights and self-realization, guarantee of effective solutions and sustainable development goals achievement. Therefore, the main goal of this article is to determine the level of efficiency that the Eurozone countries are achieving in the use of the Funds to improve gender equality in labor matters.
The analysis presented in this paper should make it possible to determine the evolution of regional efficiency, identify those countries that are less and more efficient, and propose measures in the distribution of the Funds aimed at improving the levels of equality between men and women. This paper is structured as follows. Beyond this introduction, the European Funds are addressed in Section 2, followed by the methodology section. Results are presented in Section 4, followed by the discussion. The paper ends with the conclusion section and references used.
2. The European Funds as a Mechanism for Reducing Gender Differences
A fundamental source of financial resources destined to finance European projects that consider the dimension of gender equality in the EU comes from the European Funds. Main sources came from the European Regional Development Funds (ERDF), European Social Fund (ESF), Cohesion Fund (CF), European Agricultural Fund for Rural Development (EAFRD), European Fisheries Fund (EFF), and European Maritime and Fisheries Fund (FEMP). In past decades, two funding packages have been approved. The first had a temporal dimension that spanned the period 2007 to 2013 and the second from 2014 to 2020.
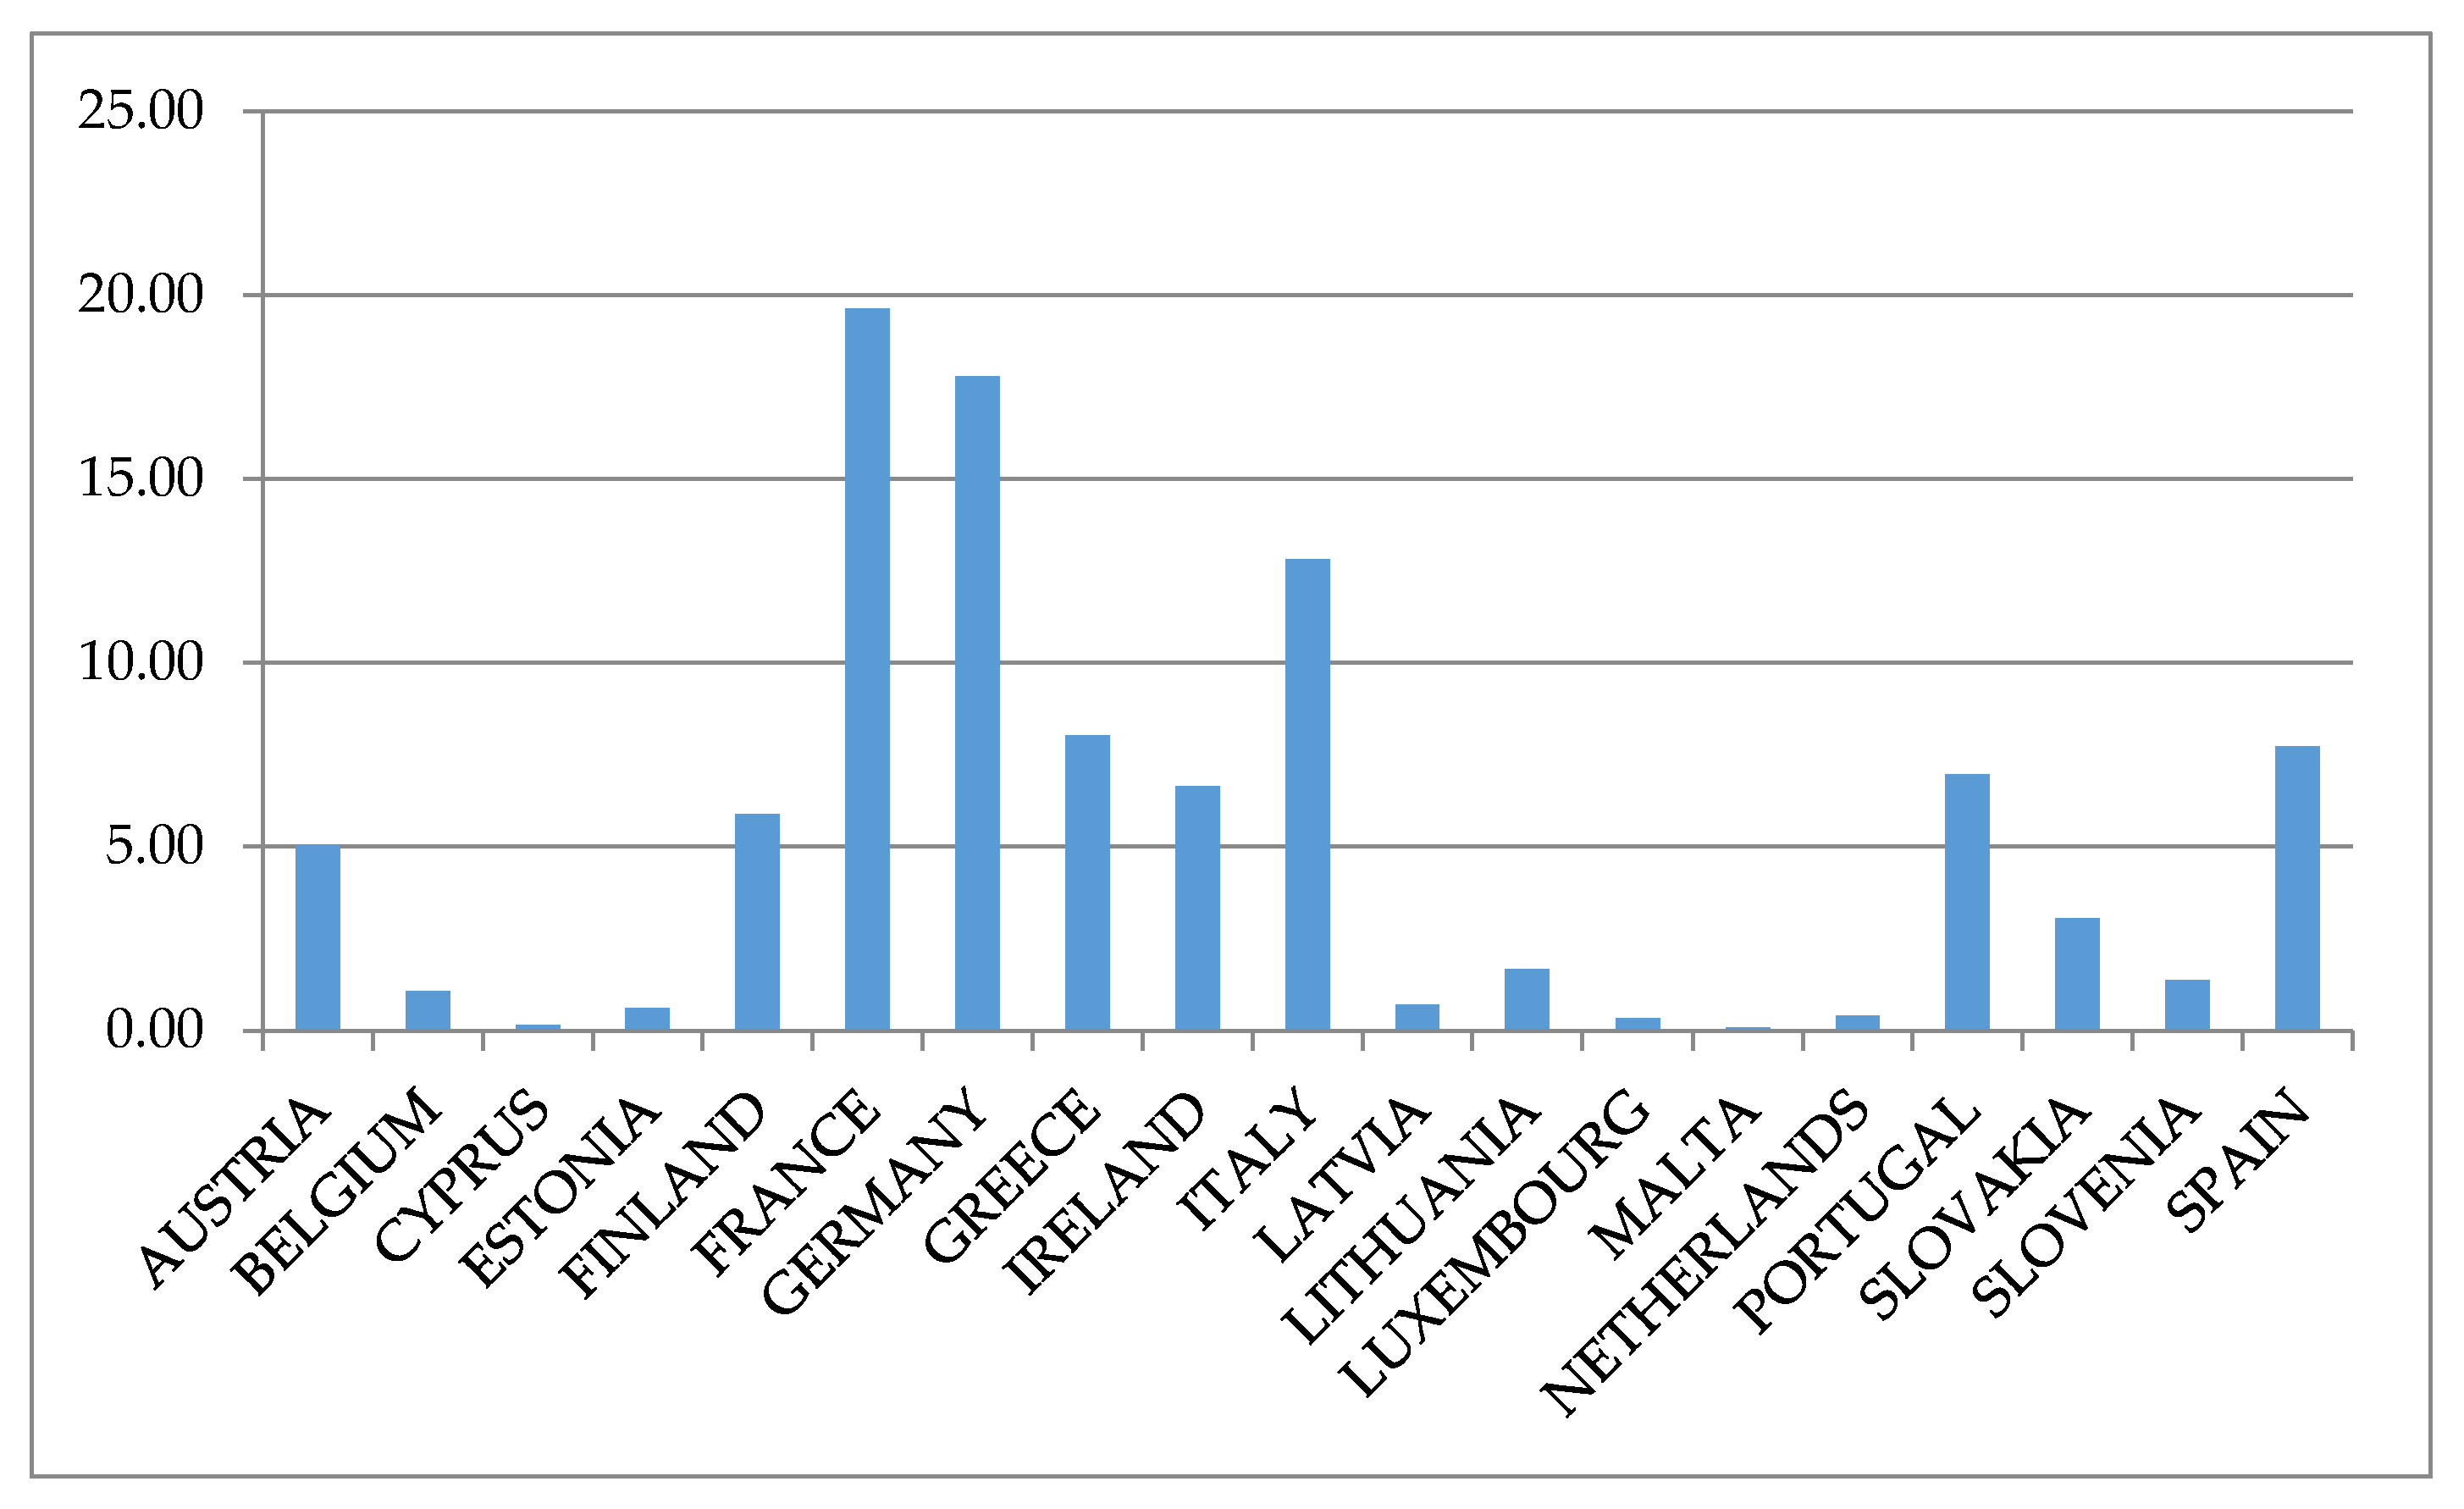
Figure 1 shows the percentage distribution of European funds during the period 2007 to 2013 among the countries of the Euro zone. The EAFRD, ERDF, and ESF Funds have been quantified, since they represent more than 90% of the total. It shows how France, Germany, Italy, and Spain receive more than 50% of them.
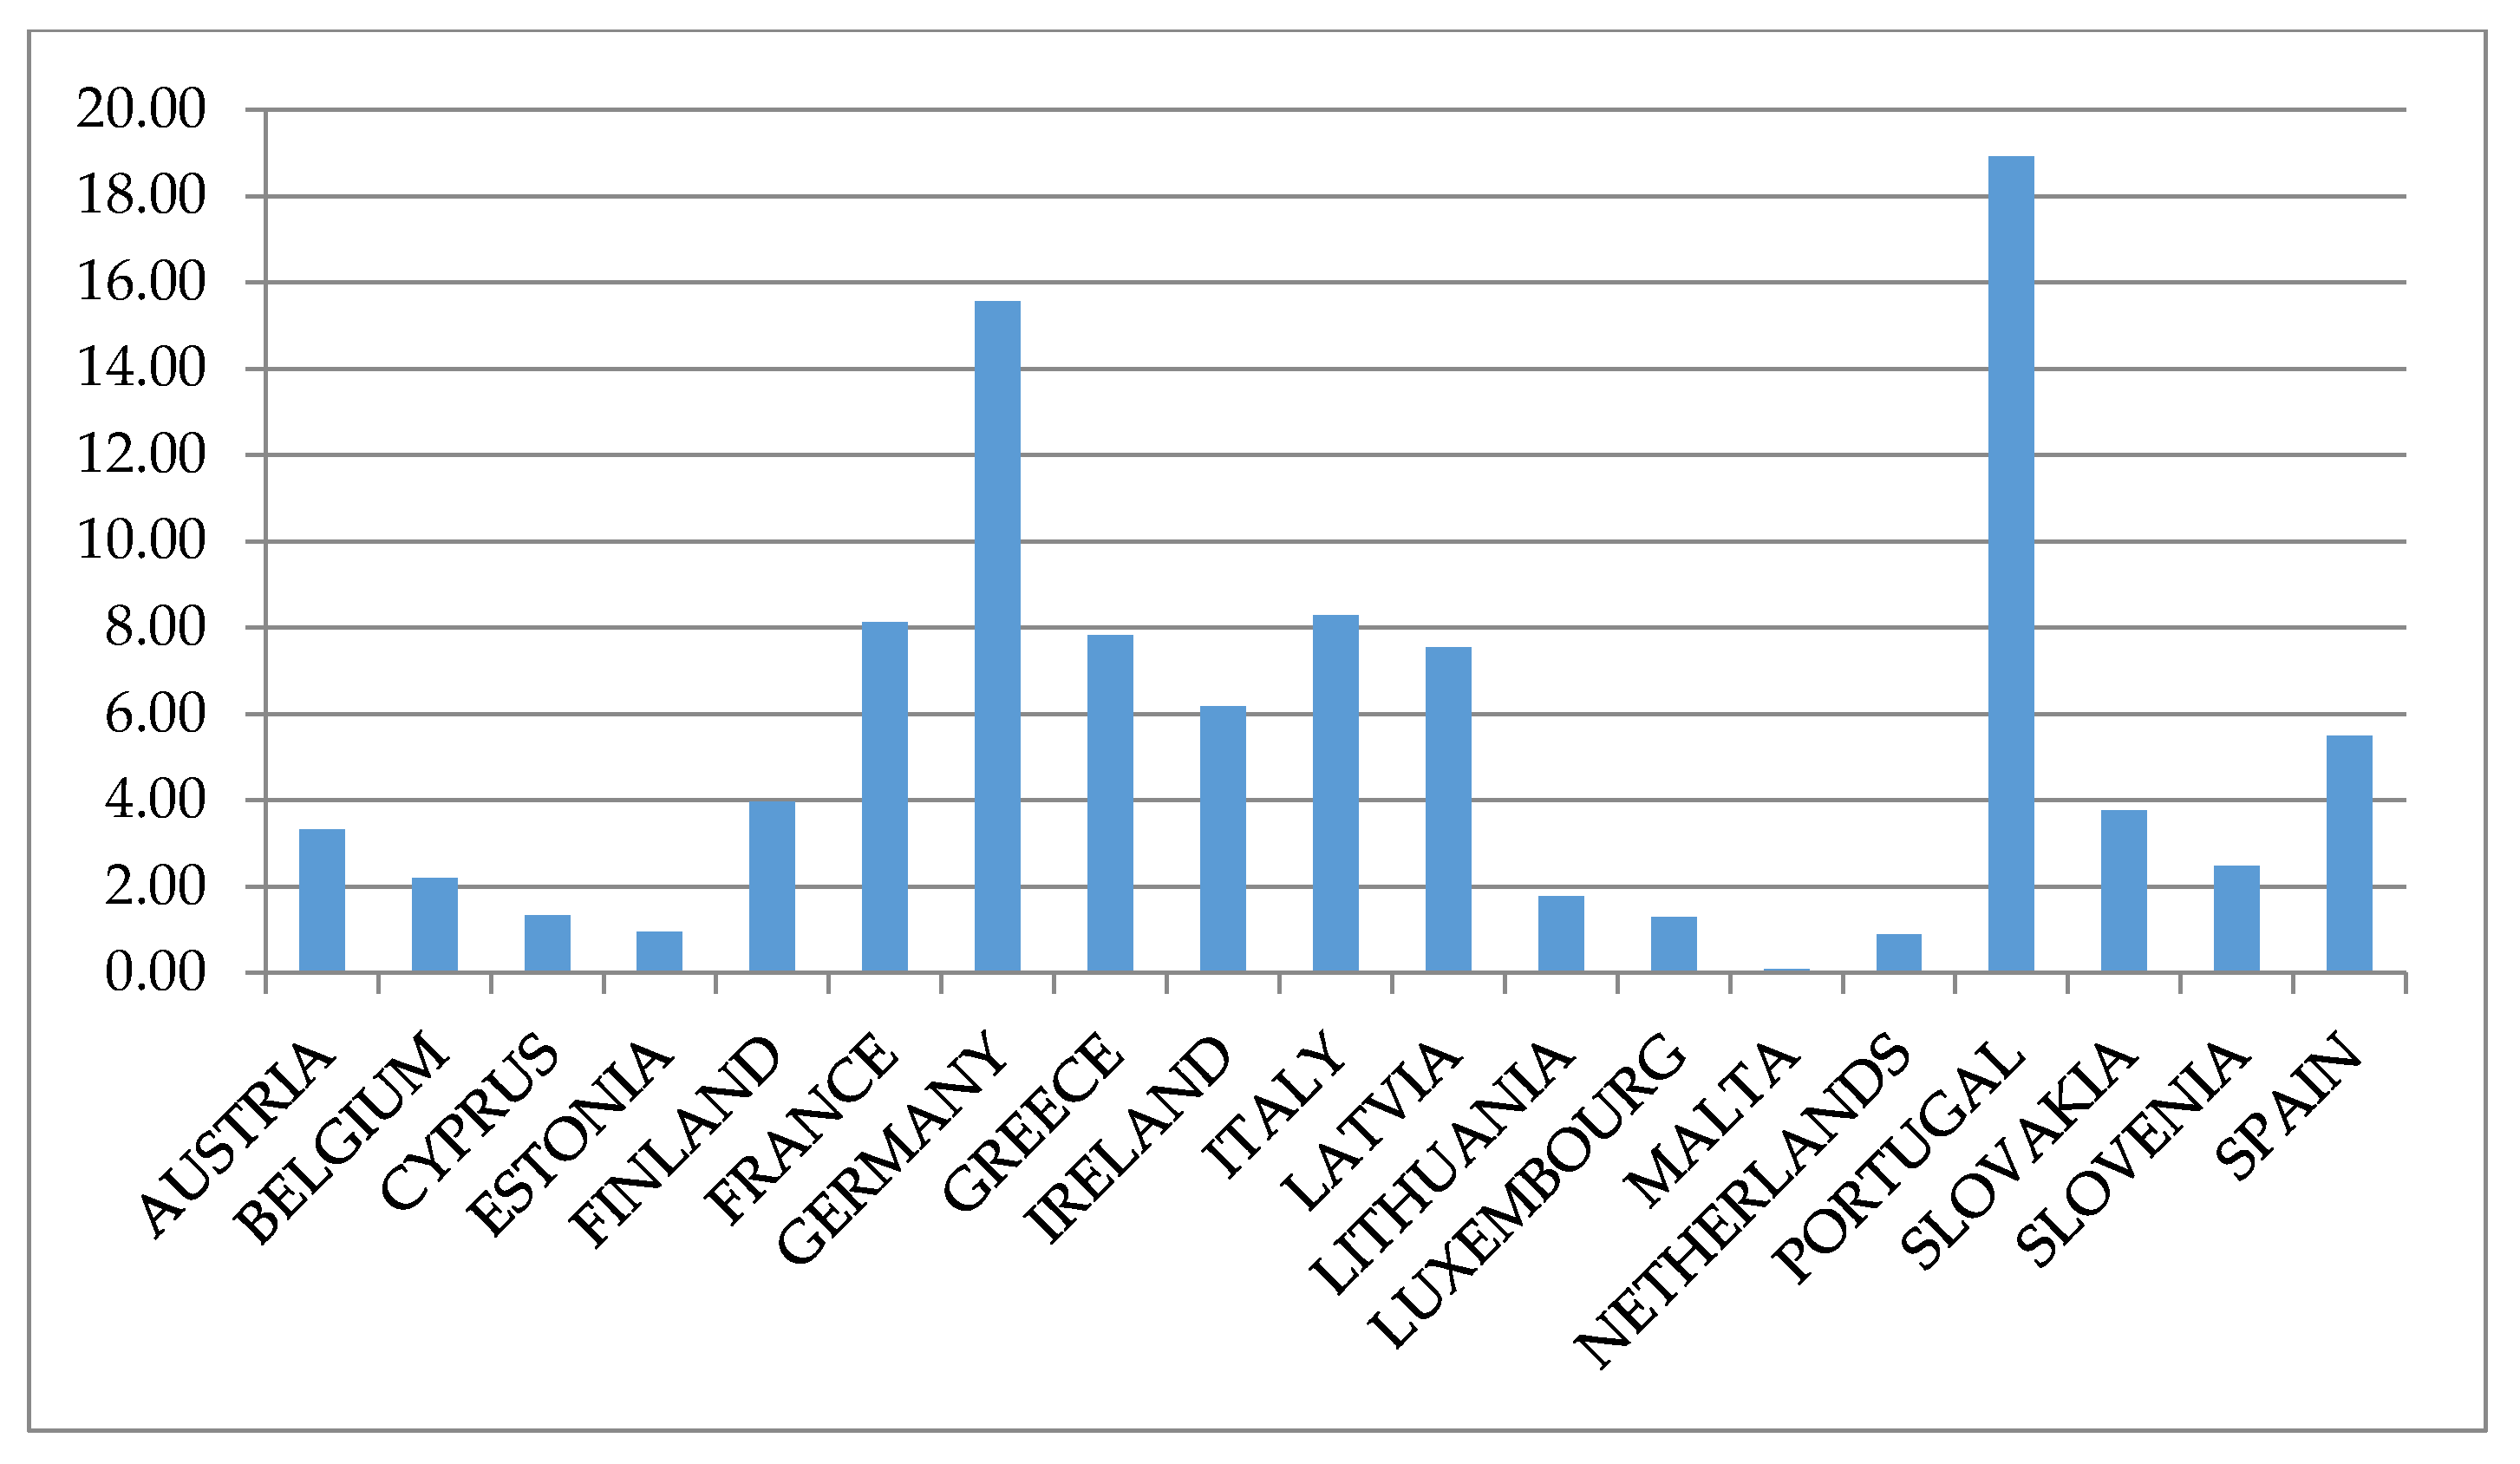
Figure 2 shows the percentage distribution made during the period 2014 to 2020. In this case, it is shown that Portugal has increased its participation in the distribution of the Funds by more than ten percentage points.
The system of distribution of the Funds is fundamentally based on the relative wealth of the regions. For this, three types have been classified. First of all, the less developed regions in which GDP per capita is less than 75% of the European average. In second place, the transition regions with GDP per capita ranked between 75% and 100% of the European average. Finally, there are the most developed regions, in which GDP per capita is greater than 100%. Fundamentally, this fund distribution system has been maintained for both the 2007 to 2013 and 2014 to 2020 periods.
Despite the large number of resources destined to finance projects that include among their goals the concern for equality between men and women, there are few researches that contemplate this issue. Generally, the published articles refer to the fight for gender equality from a social justice perspective (Nussbaum 1999; Thompson 2016; MacRae and Weiner 2017; Verloo 2018; Pascall and Lewis 2020), economic perspective (Chen 2004; Morrison et al. 2007; Löfström 2009; Kabeer and Natali 2013; Braunstein et al. 2020), or environmental perspective (Gaard 1997; Buckingham 2004; Gaard 2011, 2015; Kings 2017).
3. Methodology
Analysis of efficiency of public policies are quite frequent in the gender literature review (Adeabah et al. 2019; Bowlin and Renner 2008; Bowlin et al. 2003; Danso-Abbeam et al. 2020; Gkiza and Nastis 2017; Manello et al. 2019; Mohan and Ruggiero 2003; Reig-Martínez 2013; Uribe-Bohorquez et al. 2019). The gender equality participation in the labor market was also investigated (Castro Núñez et al. 2020; Lomazzi et al. 2019).
In this article, the following working hypotheses have been designed, derived from the main goal presented in introduction section. We present the hypotheses as follows.
Hypothesis 1 (H1).
During the period 2007 to 2020, the level of efficiency in the use of European Funds as an instrument to reduce gender inequalities in the labor market has improved.
Hypothesis 2 (H2).
The level of efficiency in the use of European Funds to reduce gender inequalities in the labor market during the period 2014 to 2020 it has been higher than in the period 2007 to 2013.
Hypothesis 3 (H3).
There are significant differences in the levels of efficiency related to the use of European Funds between the different countries of the Eurozone during the two analyzed periods.
Hypothesis 4 (H4).
These differences in efficiency levels are maintained in the two periods analyzed.
3.1. Concept of Efficiency
Efficiency is a concept that is traditionally defined as the ability of organizations to produce the maximum number of useful products with a certain amount of inputs, or the ability to produce using the minimum possible inputs, a certain amount of products (Fernández-Ríos and Sánchez 1997; Farrell 1957a; Palmer and Torgerson 1999; Wilson 1978; Murillo-Zamorano 2004).
In the business world, it is relatively easy to determine the relations between inputs and outputs. However, in the field of public policy, it is more complex. This complexity is because these types of organizations pursue several goals at the same time, which makes difficult to determine performance levels (Worthington and Dollery 2000; Cai and Wang 2012). Specifically, the regulations governing the European Funds set goals related mainly to growth and employment (Comisión Europea 2015) (Table 1).
Based on these, a series of thematic goals are defined, which can be classified into the following Table 2.
During the first period from 2007 to 2013, Council Regulation (EC) No 1083/2006 of 11 July 2006 was approved, which established the general provisions relating to the European Regional Development Fund, the European Social Fund and the Fund for Cohesion. In its article 16, it is established that the approval of the projects will be conditional on ensuring equality between men and women and non-discrimination. To this end, the Member States and the Commission shall take all appropriate measures to avoid any discrimination based on sex, race or ethnic origin, religion or belief, handicap, age, or sexual orientation.
Subsequently, Regulation No 1300/2013 of the European Parliament on 17 December 2013 on the Cohesion Fund, dedicates its second part to establishing a series of common principles applicable to all European Structural and Investment (ESI) Funds. Specifically, in Article 7, it promotes equality between men and women and non-discrimination between the Member States. To this end, it empowers the Commission to ensure that equality between men and women and the integration of the gender perspective are considered and promoted throughout the preparation and implementation of programs, including as regards monitoring, reporting and evaluation. All these actions are taken to avoid any discrimination based on sex, race or ethnic origin, religion or convictions, disability, etc.
Thus, it can be seen that there are a series of specific goals for each of the Funds but with a transversal character. It is stipulated that, in the approval and execution of all the programs, regardless of the type of Fund, equality between men and women must be respected. Therefore, and given the existence of multiple goals to be met by the projects that can be financed with European Funds, a second search was carried out on the main methodologies used in the efficiency analysis of public policies (Agovino and Rapposelli 2016; Choi and Park 2019; Maragos et al. 2020; Natesan and Marathe 2017; Sobreiro Filho et al. 2016). The result is that there is considerable heterogeneity on the part of researchers. However, the use of so-called border methodologies is increasingly common. The reason for this is the one noted above. Public policies define a great variety of final goals, and it is not easy to determine the conversion mechanisms that exist between resources or inputs and the results or outputs obtained.
In this type of analysis, a production, profit, or cost function is defined by using techniques that can be parametric or non-parametric. Likewise, a production frontier is defined in a way that determines the maximum product that can be achieved from a certain combination of inputs (Farrell 1957b). In this way, the situation of an organization can be compared with respect to that optimal level. Efficiency, in this model, is defined by the distance with respect to that level (Buchelli Lozano and Marín Restrepo 2012). Among the non-parametric methodology is the Data Envelopment Analysis (DEA) model, which is explored in the next section.
3.2. Data Envelopment Analysis Model
The DEA was developed by Charnes, Cooper, and Rodhes in 1978 (Charnes et al. 1978) as an instrument for calculating the technical efficiency index (Quesada et al. 2010). Subsequently, Banker et al. (1984) developed a model that is known by the initials of its authors (BCC) similar to the previous one, but that includes a more flexible border (Banker et al. 1984).
Being able to include multiple input and output variables, this model has turned it into an efficiency measurement tool usually used in the evaluation of public sector policies (Worthington and Dollery 2000). This evaluation is needed specially to public organizations that pursue multiple goals, making it difficult to determine their performance levels (Worthington and Dollery 2000; Cai and Wang 2012).
In this model, the efficiency of the decision unit (DMU) is obtained as:
When more inputs are used, the equation would be presented as follows:
The applied model aims to achieve the maximum number of outputs given a certain level of inputs, under a restriction of ignorance of the technological level assumed by each DMU. For this reason, the variable-scale returns model (VRS) proposed by Banker, Charles, and Cooper is used, oriented towards the output (BBC-output model). Thus, the problem to solve would be the maximization of the following expression:
Subject to:
where:
- is the radial enlargement that occurs in all its outputs, which can be identified with the efficiency of j if j is compared with a point belonging to the efficient frontier;
- is the rectangular reduction of input i;
- is the rectangular magnification of the output k; and
- represents the coefficients of the linear combination of inputs and outputs to which the DMU projection point is referring, on the efficient frontier. It can be interpreted as the proximity of the DMU projection point, with respect to the efficient frontier.
In this way, the efficiency frontier would be integrated by all those efficient decision units. Once the border has been determined by these entities, it compares each of the entities under study with the border, under the assumption that the detected deviations indicate inefficient behavior. Thus, the relative efficiency of a set of DMUs that produce a type of output from a common set of inputs can be measured.
3.3. Efficiency Analysis of the Funds Received by the Countries of the Eurozone in Improving Gender Equality
In this article, the DMUs are the member countries of the Eurozone. This choice has been motivated because the inclusion of these countries ensures that their economies move around certain economic levels. The inputs are the funds received by each country during the periods analyzed. The choice of outputs has been motivated by the two basic goals defined in the European regulatory regulations itself, and which, as described above, is linked to the basic goals of economic growth and employment.
The growth indicator that has been chosen was Annual Gross Domestic Product per capita of the member countries of the Eurozone. This is an index usually used in economic analysis to measure variations in the growth of the countries’ economies. It is an indicator of the economic situation of a nation. Moreover, this index reflects the total value of all goods and services produced minus the value of goods and services used for intermediate consumption in their production. Expressing GDP in purchasing power standards (PPS) eliminates differences in price levels between countries. The per capita calculations allow comparison of significantly different economies in absolute size.
In addition, an employment indicator that incorporates the gender dimension has been included in the analysis. For this, how the Gender Development Index (GDI) is built was analyzed. It includes eight dimensions, of which the first six (employment, money, knowledge, time, power, and health) are combined with two of a transversal nature (intersection of inequalities and violence). In relation to the labor dimension, it tries to determine the differences between men and women in terms of participation in the labor market and segregation and quality at work. Participation measures full-time employment and length of working life.
Regarding the dimension related to segregation and quality at work, the following variables were used: segregation by sectors, flexibility of working hours, occupational safety and risk prevention, and training at work. In this research, considering the basic goal of growth and employment, the labor variables related to the participation of women in the labor market have been included. This decision was made because women have a lower tendency to participate in it, as well as a greater tendency that women work in the shadow economy (Council of the European Union 2009). Therefore, the number of jobs for women and the number of active women has been chosen.
As a summary, Table 3 shows the input-output variables used in this research.
4. Results
Table 4 and Table 5 show the results obtained in the efficiency analysis for the periods 2007 to 2013 and 2014 to 2020.
During this period, the average efficiency was 92.77. The countries that are above the average have been Finland, Luxembourg, Netherlands, Cyprus, Estonia, Latvia, Germany, Lithuania, Austria, Portugal, Slovenia, and Ireland. On the contrary, France, Belgium, Spain, Slovakia, Greece, Malta, and Italy are below it. It should be noted that Finland, Luxembourg, and the Netherlands present, during all these years, maximum levels of efficiency in the use of European Funds to improve the degree of occupation and activity linked to variations in the growth of their economies.
Table 5 shows the results for the period 2014 to 2018. The study time horizon is up to 2018, the maximum date for which data are available.
The average for this entire period is 94.47. The countries that are above the average were Finland, Germany, Lithuania, Luxembourg, Malta, Netherlands, Estonia, Latvia, Austria, Cyprus, and Portugal. On the other hand, Ireland, Slovenia, Spain, France, Belgium, Slovakia, Greece, and Italy are below. Therefore, while it is true that average efficiency has increased, the data also indicate that the differences between countries have increased. Thus, in the first period, the number of countries that showed results below the average was 7, while, in this second period, it rises to 8. It is also noteworthy how the number of countries has increased in which all the years analyzed have a maximum efficiency value, such as Finland, Germany, Lithuania, Luxembourg, Malta, and the Netherlands.
Likewise, in Table 6 and Table 7, the basic statistics have been calculated. The first shows the indicators obtained in the countries of the Eurozone for the period of distribution of the Funds corresponding to the years 2007 to 2013, and the second corresponds to the years 2014 to 2020.
The highest average efficiency for the first period (2007–2013) came from Finland, Luxembourg, and the Netherlands with 100, followed by Cyprus, Estonia, and Lithuania. For the second period (2014–2018), the situation changed and more countries achieved an average efficiency of 100, i.e., Finland, Germany, Lithuania, Luxembourg, Malta, and the Netherlands.
5. Discussion
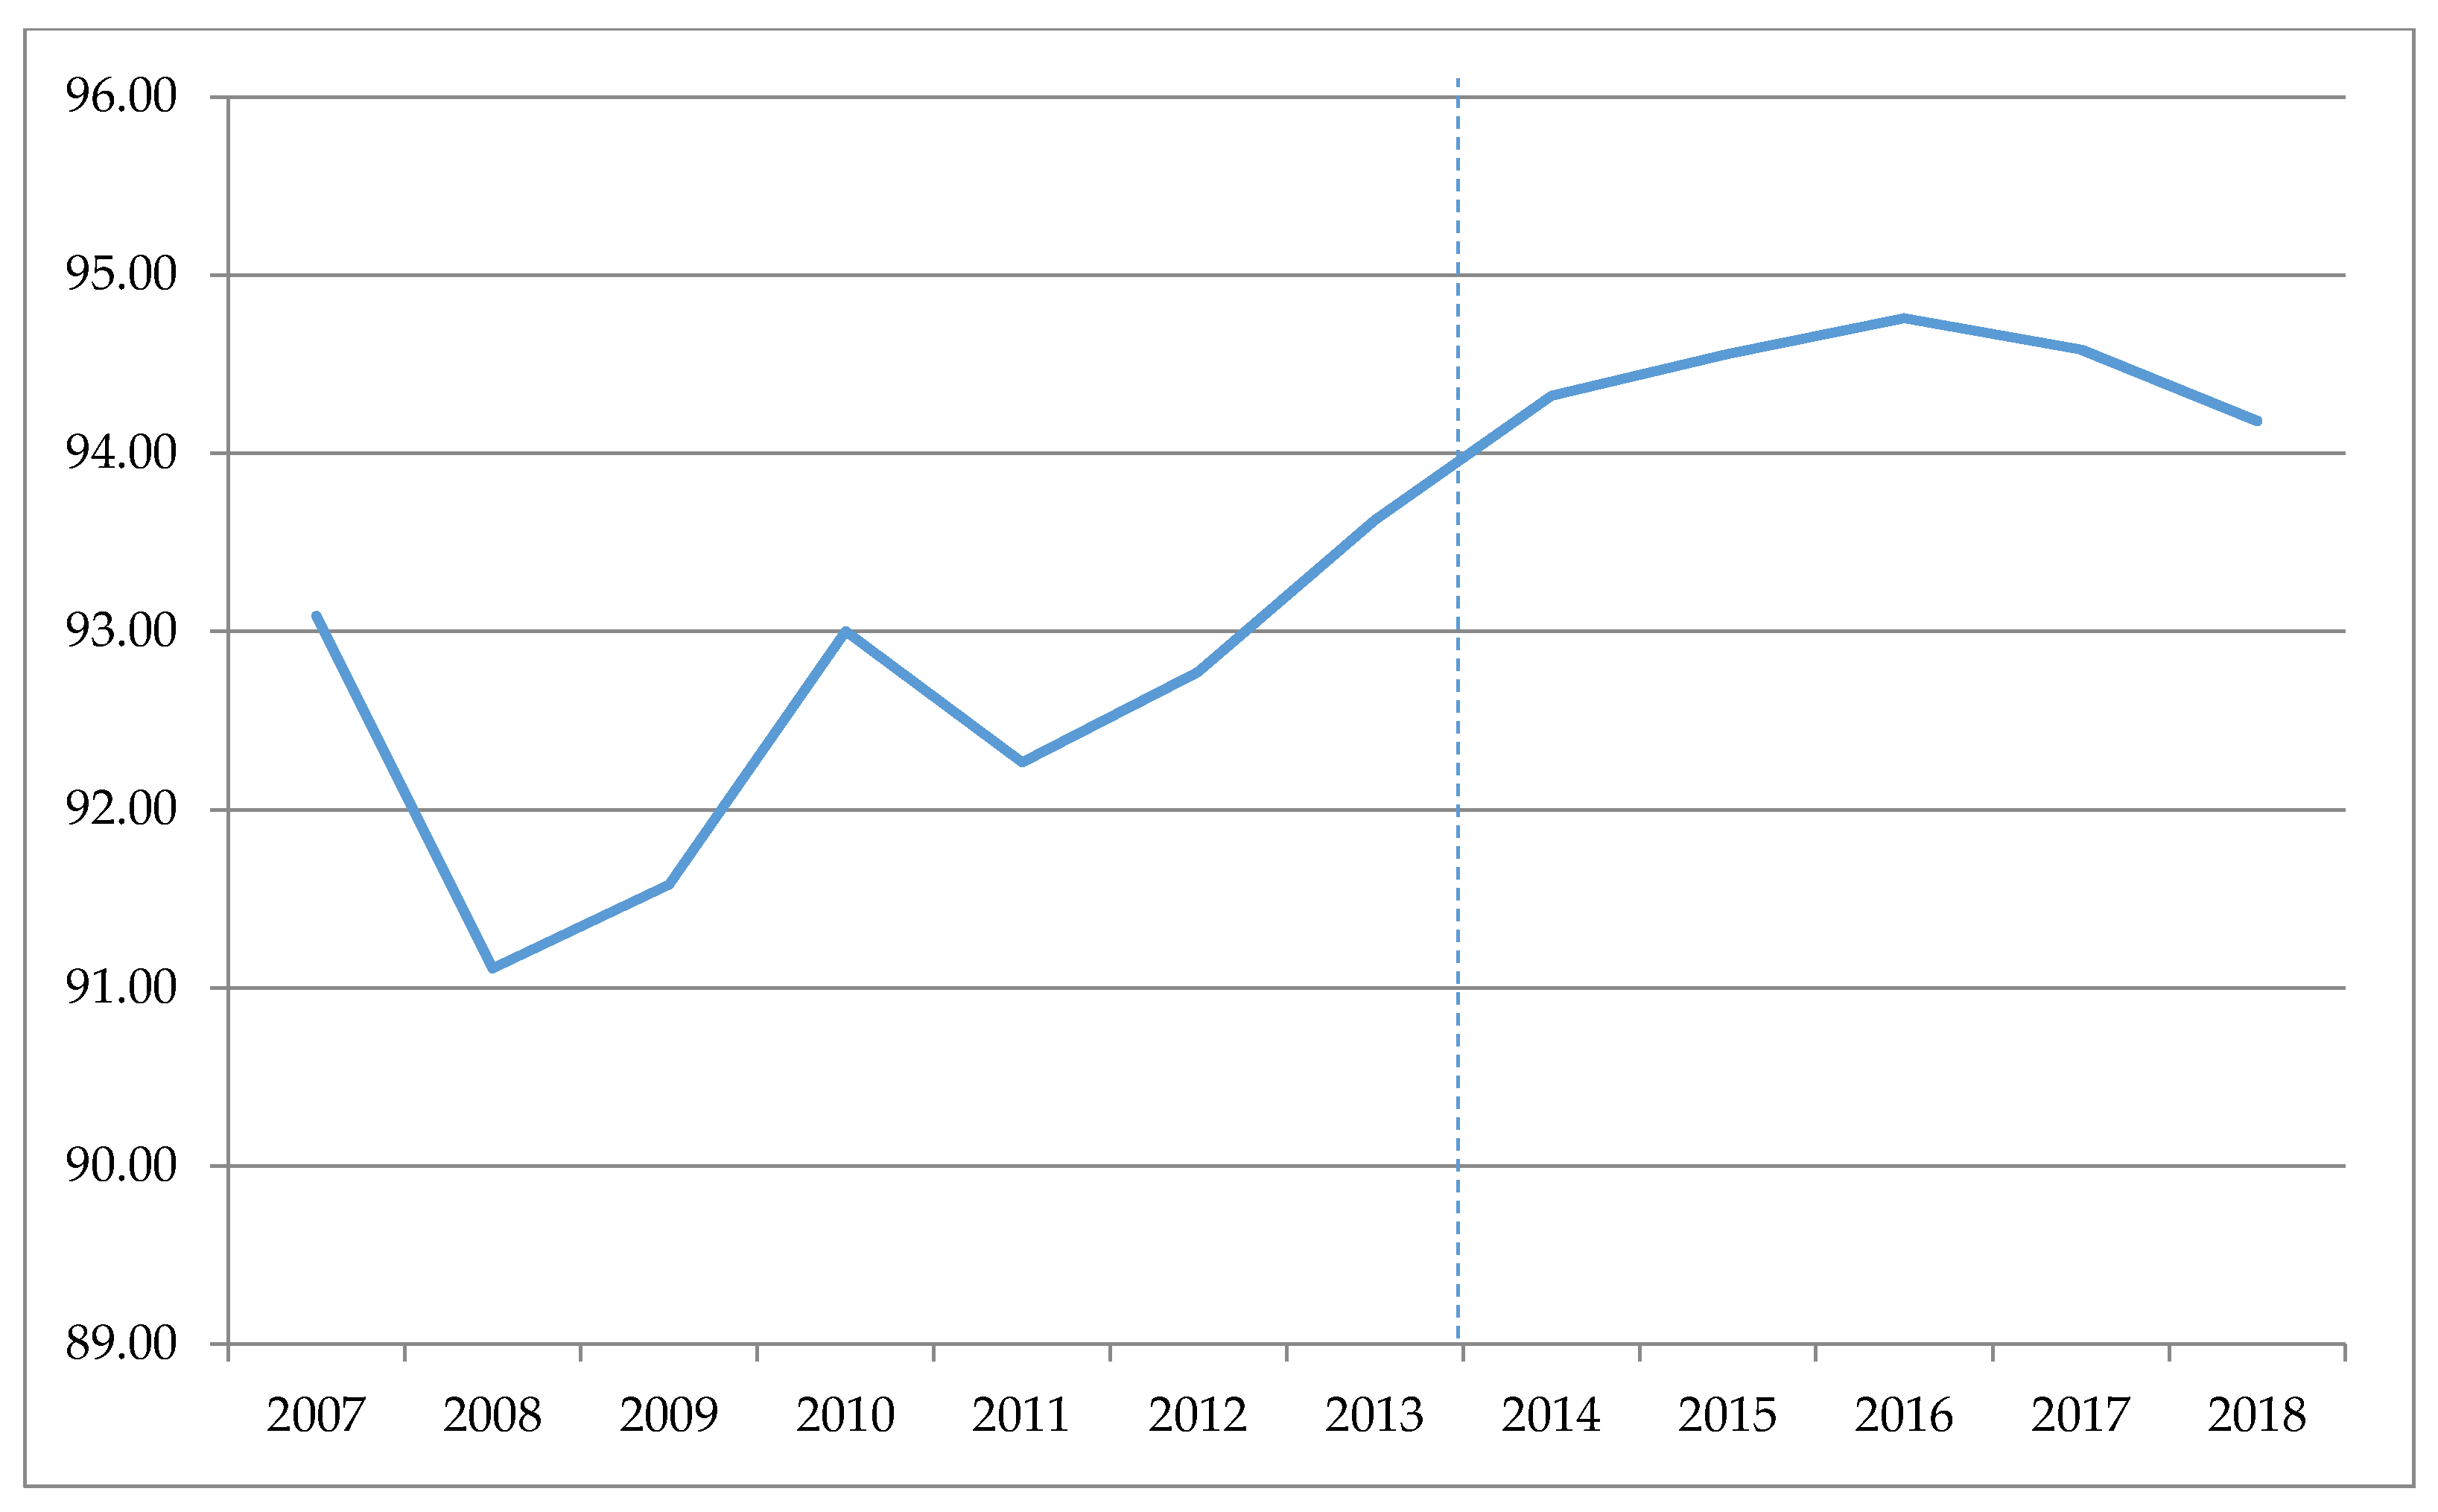
Figure 3 shows the evolution of average efficiency during the period 2007 to 2018. It can be seen how, during the time horizon of the study, it has presented a positive evolution.
These results show that, during the period 2007 to 2020, the level of efficiency in the use of European Funds as an instrument to reduce gender inequalities in the labor market has improved, so the first of the hypotheses raised has been confirmed. The average efficiency during the period 2007 to 2013 was 92.77, while, for the following period, it was 94.47. Therefore, the level of efficiency in the use of European Funds to reduce gender inequalities in the labor market during the period 2014 to 2020 has been higher than that of the period 2007 to 2013 by 1.7 points. Therefore, the second of the hypotheses has also been confirmed.
Aiming to determine whether the degree of efficiency in the use of European Funds to reduce labor differences has been homogeneous among the Eurozone countries, the Spearman order correlation coefficient has been calculated. This indicator takes values between −1 and 1. When its calculation yields a result of 1, it indicates that there has been no change in the relative positions of each country. On the contrary, values close to 0 indicate that there has been a drastic change in the ordering. Observing the results, in general, the values are very high. The mean of the first period is 0.76, while that of the second is 0.98. This indicates that the statistics are significant, and that there is a positive relation between the various rankings. Then, the first period of the analysis improved the average efficiency thanks to the Council Regulation (EC) No 1083/2006 of 11 July 2006. The second period improved thanks to the Regulation No 1300/2013 of the European Parliament on 17 December 2013.
Therefore, the use that is being made of the European Funds as a mechanism to reduce labor inequalities based on gender is not homogeneous among the countries of the Eurozone. Thus, two groups of countries can be identified. On the one hand, those that are highly efficient, such as Estonia, Finland, Germany, Lithuania, Luxembourg, Malta, and the Netherlands, meet the highest number of times with maximum levels of efficiency. On the other hand, countries, such as Austria, Belgium, France, Greece, Ireland, Italy, Latvia, Portugal, Slovakia, Slovenia, and Spain, do not reach that level of efficiency. What stands out from results is that they differ from the raking reported by World Economic Forum (2019), due to the use of a more precise index supported by European Funds information.
6. Conclusions
In this article, DEA methodology was applied to analyze the level of efficiency achieved by the Eurozone countries in improving the levels of equality between men and women, as a result of the use of European Funds in two consecutive periods. For this, a series of inputs and outputs variables were used that defined a maximum efficiency frontier. The greater or lesser distance of the countries in relation to that border made it possible to classify these countries.
One of the main limitations of the analysis is caused by the use of the defined variables. The choice of variables other than those stated would imply the determination of another efficiency frontier, and, therefore, the results obtained could vary. Then, much attention was paid to the chosen variables by most of the authors who have studied this topic.
The results showed a general positive evolution of the use of the Funds to improve the level of efficiency. Results reported that, during the period 2007 to 2013, this index was 92.77, and, in the following period, it was 94.47. This represents an increase of almost 2%. However, we believe that this data could be improved. In general terms, this analysis has been able to determine that there is a high degree of efficiency in the use of European resources to reduce labor differences in gender matters. However, it has also been found that this situation is not homogeneous, and two groups of countries can be distinguished. Some have maintained optimal levels of efficiency in all the years analyzed, while others have not reached level 100 in any of them.
If it is taken into account that the distribution of funds is produced fundamentally by the relative position that each member country occupies in relation to the average GDP per capita of the EU-27, without regarding other criteria, these differences are probably continuing to be maintained over time.
Based on our results, we consider that, to meet the specific goals of the European Funds related to reducing gender inequalities, it should be included other criteria related to the fulfillment of European regulations. This research is an attempt in providing a set of important elements for gender balance. For instance, a new package of funds has been approved for the period 2021–2027. They have set five goals that are not specifically related to gender equality, such as: the creation of a smarter Europe, a greener and carbon-free Europe, a more connected Europe, a more social Europe, and a Europe closer to its citizens. Even though the gender equality improved over the years, this theme still needs to be still addressed.
We hope our research encourages future research and interests focused on the specific study of the projects approved and managed in the countries that have presented the most efficiency in the analyzed periods. In this way, a manual could be built aiming to collect these experiences, in which countries with lower levels of efficiency can find good practices for their improvement. In this way, global efficiency could be improved, with which we would all win, both at the level of individuals and societies.
Author Contributions
Conceptualization, M.B. and L.B.; methodology, M.B.; investigation, M.B. and L.B.; resources, M.B.; writing—original draft preparation, M.B., L.B. and O.H.; writing—review and editing, M.B., L.B., O.H. and M.F.; supervision, M.F.; project administration, M.B.; funding acquisition, M.B. All authors have read and agreed to the published version of the manuscript.
Funding
This research received no external funding.
Institutional Review Board Statement
Not applicable.
Informed Consent Statement
Not applicable.
Data Availability Statement
Not applicable.
Conflicts of Interest
The authors declare no conflict of interest.
References
- Adeabah, David, Agyapomaa Gyeke-Dako, and Charles Andoh. 2019. Board gender diversity, corporate governance and bank efficiency in Ghana: A two stage data envelope analysis (DEA) approach. Corporate Governance 19: 299–320. [Google Scholar] [CrossRef]
- Agovino, Massimiliano, and Agnese Rapposelli. 2016. Disability and work: A two-stage empirical analysis of Italian evidence at provincial level in providing employment for disabled workers. Social Indicators Research 125: 635–48. [Google Scholar] [CrossRef]
- Banker, Rajiv D., Abraham Charnes, and William Wager Cooper. 1984. Some models for estimating technical and scale inefficiencies in data envelopment analysis. Management Science 30: 1078–92. [Google Scholar] [CrossRef] [Green Version]
- Bowlin, William F., and Celia J. Renner. 2008. Assessing gender and top-management-team pay in the S&P Mid-Cap and Small-Cap companies using data envelopment analysis. European Journal of Operational Research 185: 430–37. [Google Scholar]
- Bowlin, William F., Celia J. Renner, and J. M. Rives. 2003. A DEA study of gender equity in executive compensation. Journal of the Operational Research Society 54: 751–57. [Google Scholar] [CrossRef]
- Braunstein, Elissa, Rachid Bouhia, and Stephanie Seguino. 2020. Social reproduction, gender equality and economic growth. Cambridge Journal of Economics 44: 129–56. [Google Scholar] [CrossRef]
- Buchelli Lozano, Gerardo A., and Jhon Jairo Marín Restrepo. 2012. Estimación de la eficiencia del sectormetalmecánico en colombia: Análisis de la frontera estocástica. Cuadernos de Economía 31: 257–86. [Google Scholar]
- Buckingham, Susan. 2004. Ecofeminism in the twenty-first century. Geographical Journal 170: 146–54. [Google Scholar] [CrossRef] [Green Version]
- Cai, Zhonghua, and Ye Wang. 2012. Research frontiers in public sector performance measurement. Physics Procedia 25: 793–99. [Google Scholar]
- Castro Núñez, Rosa Belén, Pablo Bandeira, and Rosa Santero-Sánchez. 2020. The Social Economy, Gender Equality at Work and the 2030 Agenda: Theory and Evidence from Spain. Sustainability 12: 5192. [Google Scholar] [CrossRef]
- Charnes, Abraham, William W. Cooper, and Edwardo Rhodes. 1978. Measuring the efficiency of decision making units. European Journal of Operational Research 2: 429–44. [Google Scholar] [CrossRef]
- Chen, Derek H. C. 2004. Gender Equality and Economic Development: The Role for Information and Communication Technologies. Washington: The World Bank. [Google Scholar]
- Choi, Hyeri, and Min Jae Park. 2019. Evaluating the efficiency of governmental excellence for social progress: Focusing on low-and lower-middle-income countries. Social Indicators Research 141: 111–30. [Google Scholar] [CrossRef]
- Comisión Europea. 2015. Fondos Estructurales y de Inversión Europeos 2014–2020: Textos Y Comentarios Oficiales. Available online: https://www.informacioniti.es/wp-content/uploads/2017/01/04-guia-fondos-estructurales-comision-europea.pdf (accessed on 30 October 2020).
- Commission of the European Communities. 1996. Incorporating Equal Opportunities for Women and Men into All Community Policies and Activities. Communication from the Com-mission. Brussels, COM (96) 67 Final. February 21. Available online: https://eur-lex.europa.eu/LexUriServ/LexUriServ.do?uri=COM:1996:0067:FIN:EN:PDF (accessed on 22 October 2020).
- Council of Europe. 2011. Convention on Preventing and Combating Violence against Women and Domestic Violence. Council of Europe Treaty Series—No. 210. Istanbul. May 11. Available online: https://rm.coe.int/168008482e (accessed on 23 October 2020).
- Council of Europe. 2013. Gender Equality Strategy 2014–2017. Available online: https://edoc.coe.int/en/gender-equality/5992-council-of-europe-gender-equality-strategy-2014-2017.html (accessed on 22 October 2020).
- Council of Europe. 2018. Gender Equality Strategy 2018–2023. Copenhagen. March 7. Available online: https://www.coe.int/en/web/genderequality/gender-equality-strategy (accessed on 22 October 2020).
- Council of the European Union. 2009. Council Conclusions of 12 May 2009 on a Strategic Framework for European Cooperation in Education and Training (“ET 2020”) (OJ C 119, 28.5.2009, p. 2). Available online: http://europa.eu/legislation_summaries/education_training_youth/general_framework/ef0016_en.htm (accessed on 30 October 2020).
- Danso-Abbeam, Gideon, Lloyd J. S. Baiyegunhi, and Temitope O. Ojo. 2020. Gender differentials in technical efficiency of Ghanaian cocoa farms. Heliyon 6: e04012. [Google Scholar] [CrossRef] [PubMed]
- European Institute for Gender Equality. 2019. Gender Equality Index 2019: Still Far from the Finish Line. Available online: https://eige.europa.eu/news/gender-equality-index-2019-still-far-finish-line (accessed on 23 October 2020).
- European Institute for Gender Equality. 2020. Beijing +25: The Fifth Review of the Implementation of the Beijing Platform for Action in the EU Member States. Beijing Platform for Action. Available online: https://eige.europa.eu/beijing-platform-for-action (accessed on 23 October 2020).
- Farrell, Michael James. 1957a. La medición de la eficiencia productiva. Revista de la Royal Statistical Society: Series A (General) 120: 253–81. [Google Scholar] [CrossRef]
- Farrell, Michael James. 1957b. Measuring the Technical Efficiency. Journal of the Royal Statistical Society 120: 253–90. [Google Scholar] [CrossRef]
- Fernández-Ríos, Manuel, and José C. Sánchez. 1997. Eficacia Organizacional: Concepto, Desarrollo Y Evaluación. Madrid: Ediciones Díaz de Santos. [Google Scholar]
- Gaard, Greta. 1997. Toward a queer ecofeminism. Hypatia 12: 114–37. [Google Scholar] [CrossRef]
- Gaard, Greta. 2011. Ecofeminism revisited: Rejecting essentialism and re-placing species in a material feminist environmentalism. Feminist Formations 23: 26–53. [Google Scholar] [CrossRef]
- Gaard, Greta. 2015. Ecofeminism and climate change. Women’s Studies International Forum 49: 20–33. [Google Scholar] [CrossRef]
- General Assembly of United Nations. 2015. Transforming Our World: The 2030 Agenda for Sustainable Development. Resolution of the General Assembly, 4th Plenary Meeting. September 25. Available online: https://www.un.org/sustainabledevelopment/development-agenda/ (accessed on 23 October 2020).
- Gkiza, Ioanna G., and Stefanos A. Nastis. 2017. Health and Women’s Role in Agricultural Production Efficiency. Applied Economic Perspectives and Policy 39: 428–40. [Google Scholar] [CrossRef]
- Kabeer, Naila, and Luisa Natali. 2013. Gender equality and economic growth: Is there a win-win? IDS Working Papers 2013: 1–58. [Google Scholar] [CrossRef]
- Kings, Amy E. 2017. Intersectionality and the changing face of ecofeminism. Ethics and the Environment 22: 63–87. [Google Scholar] [CrossRef]
- Löfström, Åsa. 2009. Gender Equality, Economic Growth and Employment; Stockholm: Swedish Ministry of Integration and Gender Equality.
- Lomazzi, Vera, Sabine Israel, and Isabella Crespi. 2019. Gender equality in Europe and the effect of work-family balance policies on gender-role attitudes. Social Sciences 8: 5. [Google Scholar] [CrossRef] [Green Version]
- MacRae, Heather, and Elaine Weiner. 2017. Towards Gendering Institutionalism: Equality in Europe. London: Rowman and Littlefield International. [Google Scholar]
- Manello, Alessandro, Maurizio Cisi, Francesco Devicienti, and Davide Vannoni. 2019. Networking: A business for women. Small Business Economics 55: 1–20. [Google Scholar] [CrossRef]
- Maragos, Elias K., Petros E. Maravelakis, and Apostolos I. Linardis. 2020. A DEA Evaluation of the Successful Implementation of HEALTH2020 Policies. Socio-Economic Planning Sciences. [Google Scholar] [CrossRef]
- McKinsey Global Institute Report. 2015. How Advancing Women’s Equality Can Add $12 Trillion to Global Growth. Available online: https://www.mckinsey.com/featured-insights/employment-and-growth/how-advancing-womens-equality-can-add-12-trillion-to-global-growth# (accessed on 24 October 2020).
- Mohan, Nancy, and John Ruggiero. 2003. Compensation differences between male and female CEOs for publicly traded firms: A nonparametric analysis. Journal of the Operational Research Society 54: 1242–48. [Google Scholar] [CrossRef]
- Morrison, Andrew, Dhushyanth Raju, and Nistha Sinha. 2007. Gender Equality, Poverty and Economic Growth. Washington: The World Bank. [Google Scholar]
- Murillo-Zamorano, Luis R. 2004. Eficiencia económica y técnicas de frontera. Revista de Encuestas Económicas 18: 33–77. [Google Scholar]
- Natesan, Sarabjeet D., and Rahul Ratnakar Marathe. 2017. Evaluation of MGNREGA: Data envelopment analysis approach. International Journal of Social Economics 44: 181–94. [Google Scholar] [CrossRef]
- Nussbaum, Martha C. 1999. Sex and Social Justice. Oxford: Oxford University Press. [Google Scholar]
- Palmer, Stephen, and David J. Torgerson. 1999. Definitions of efficiency. BMJ 318: 1136. [Google Scholar] [CrossRef]
- Pascall, Gillian, and Jane Lewis. 2020. Emerging gender regimes and policies for gender equality in a wider Europe. Journal of Social Policy 33: 373–94. [Google Scholar] [CrossRef] [Green Version]
- Quesada, Víctor Manuel, Ingrid del C. Blanco, and Francisco Javier Maza. 2010. Análisis envolvente de datos aplicado a la cobertura educativa en el departamento de Bolívar—Colombia (2007–2008). Omnia 16: 77–100. [Google Scholar]
- Reig-Martínez, Ernest. 2013. Social and economic wellbeing in Europe and the Mediterranean Basin: Building an enlarged human development indicator. Social Indicators Research 111: 527–47. [Google Scholar] [CrossRef]
- Sobreiro Filho, José, Enzo Barberio Mariano, Vinicius Amorim Sobreiro, and Charbel José Chiappetta Jabbour. 2016. Beyond the Agrarian Reform Policies in Brazil: An Empirical Study of Brazilian States from 1995 through 2011. Social Indicators Research 129: 1093–114. [Google Scholar] [CrossRef] [Green Version]
- Thompson, Neil. 2016. Anti-Discriminatory Practice: Equality, Diversity and Social Justice. London: Palgrave Macmillan. [Google Scholar]
- Uribe-Bohorquez, María Victoria, Jennifer Martínez-Ferrero, and Isabel-María García-Sánchez. 2019. Women on boards and efficiency in a business-orientated environment. Corporate Social Responsibility and Environmental Management 26: 82–96. [Google Scholar] [CrossRef] [Green Version]
- Verloo, Mieke, ed. 2018. Varieties of Opposition to Gender Equality in Europe. Abingdon: Routledge, vol. 100. [Google Scholar]
- Wilson, Robert. 1978. Information, efficiency, and the core of an economy. Econometrica: Journal of the Econometric Society 46: 807–16. [Google Scholar] [CrossRef]
- World Economic Forum. 2019. Global Gender Gap Report 2020. Available online: http://www3.weforum.org/docs/WEF_GGGR_2020.pdf (accessed on 24 October 2020).
- World Happiness Report. 2020. Cities and Happiness: A Global Ranking and Analysis. Available online: https://worldhappiness.report/ed/2020/cities-and-happiness-a-global-ranking-and-analysis/ (accessed on 24 October 2020).
- Worthington, Andrew, and Brian Dollery. 2000. An empirical survey of frontier efficiency measurement techniques in local government. Local Government Studies 26: 23–52. [Google Scholar] [CrossRef] [Green Version]
Figure 1.
Percentage distribution of European Funds. Period 2007 to 2013.

Figure 2.
Percentage distribution of European Funds. Period 2014 to 2020.

Figure 3.
Evolution of average efficiency. Period 2007–2018.


Table 1.
Goals of the European Funds.
| Funds | General Goals for the Period 2007 to 2013 | General Goals for the Period 2014 to 2020 |
|---|---|---|
| European Structural and Investment Funds (the ESI Funds) | Convergence Regional competitiveness and employmentEuropean territorial cooperation | Investing in growth and jobs European territorial cooperation |
Source: European Commission.
Table 2.
Thematic goals of the European Funds.
| Funds | General Thematic Goals for the Period 2007 to 2013 | Thematic Goals for the Period 2014 to 2020 |
|---|---|---|
| European Structural and Investment Funds (the ESI Funds) |
|
|
Source: Own elaboration based on Article 3 of Regulation of the Council N 1083/2006 on 11 July 2006 and Article 9 of Regulation of the European Parliament N 1300/2013 on 17 December 2013.
Table 3.
Gender efficiency output function.
| Type | Variables | Description | |
|---|---|---|---|
| Output variables | Oij: GDP per capita | Annual per capita Gross Domestic Product of the member countries of the Eurozone where i is the country and j is the year. Source: https://ec.europa.eu/eurostat | |
| Eij: Number of employed women (women) | Number of women employed in the member countries of the Eurozone where i is the country and j is the year. Source: https://ec.europa.eu/eurostat | ||
| Aij: Number of active women (women) | Number of active women in the member countries of the Eurozone where i is the country and j is the year. Source: https://ec.europa.eu/eurostat | ||
| Input variables | I: Investment in European Funds | Iij: European Social Fund | Annual investment of the member countries of the Eurozone in ESF, where i is the country and j is the year. Source: https://cohesiondata.ec.europa.eu/ |
| Iij: European Agricultural Fund for Rural Development | Annual investment of the member countries of the Eurozone in EAFRD where i is the country and j is the year. Source: https://cohesiondata.ec.europa.eu/ | ||
| Iij: European Regional Development Fund | Annual investment of the member countries of the Eurozone in ERDF where i is the country and j is the year. Source: https://cohesiondata.ec.europa.eu/ | ||
Source: Own elaboration.
Table 4.
Relative efficiency of the countries of the Eurozone (2007–2013).
| Countries | 2007 | 2008 | 2009 | 2010 | 2011 | 2012 | 2013 |
|---|---|---|---|---|---|---|---|
| Austria | 92.8 | 94.28 | 96.13 | 100 | 96.68 | 96.5 | 97.7 |
| Belgium | 91.12 | 89.49 | 87.96 | 96.44 | 89.7 | 87.59 | 88.95 |
| Cyprus | 96.55 | 100 | 100 | 100 | 100 | 100 | 100 |
| Estonia | 100 | 100 | 98.97 | 92.17 | 100 | 99.62 | 100 |
| Finland | 100 | 100 | 100 | 100 | 100 | 100 | 100 |
| France | 90.71 | 91.23 | 92.27 | 94.55 | 92.44 | 92.75 | 93.77 |
| Germany | 94.19 | 94.74 | 96.15 | 99.08 | 99.17 | 98.76 | 100 |
| Greece | 76.5 | 76.45 | 78.58 | 87.93 | 80.57 | 81.22 | 81.58 |
| Ireland | 94.99 | 93.85 | 92.46 | 93.39 | 91.31 | 90.39 | 93.35 |
| Italy | 70.71 | 72.5 | 72.16 | 95.65 | 71.89 | 73.83 | 74.19 |
| Latvia | 100 | 100 | 99.74 | 90.21 | 98.57 | 99.74 | 99.19 |
| Lithuania | 95.5 | 94.11 | 96.77 | 91.33 | 99.74 | 99.61 | 99.48 |
| Luxembourg | 100 | 100 | 100 | 100 | 100 | 100 | 100 |
| Malta | 100 | 62.61 | 63.78 | 100 | 64.79 | 73.38 | 79.42 |
| Netherlands | 100 | 100 | 100 | 100 | 100 | 100 | 100 |
| Portugal | 96.02 | 94.85 | 95.1 | 93.1 | 96.87 | 96.63 | 96.76 |
| Slovakia | 87.94 | 86.87 | 85.81 | 89.61 | 86.31 | 86.53 | 87.55 |
| Slovenia | 94.86 | 93.84 | 95.24 | 97.39 | 92.05 | 92.36 | 92.37 |
| Spain | 86.74 | 86.23 | 88.9 | 83.88 | 92.96 | 93.78 | 94.55 |
| Spearman correlation coefficient | 0.75 | 0.95 | 0.42 | 0.32 | 0.97 | 0.95 |
Source: Own calculation.
Table 5.
Relative efficiency of the countries of the Eurozone (2014–2018).
| Countries | 2014 | 2015 | 2016 | 2017 | 2018 |
|---|---|---|---|---|---|
| Austria | 98.33 | 98.35 | 98.46 | 97.72 | 96.52 |
| Belgium | 88.95 | 88.49 | 89.01 | 88.69 | 88.95 |
| Cyprus | 100 | 98.88 | 97.09 | 95.3 | 94.18 |
| Estonia | 99.59 | 100 | 100 | 100 | 100 |
| Finland | 100 | 100 | 100 | 100 | 100 |
| France | 90.76 | 93.28 | 94.09 | 93.27 | 92.58 |
| Germany | 100 | 100 | 100 | 100 | 100 |
| Greece | 81.32 | 82.35 | 82.19 | 81.32 | 80.08 |
| Ireland | 91.12 | 93.23 | 94.7 | 94.98 | 95.45 |
| Italy | 74.76 | 73.88 | 75.73 | 76.05 | 75.14 |
| Latvia | 97.69 | 98.22 | 98.62 | 98.38 | 98.52 |
| Lithuania | 100 | 100 | 100 | 100 | 100 |
| Luxembourg | 100 | 100 | 100 | 100 | 100 |
| Malta | 100 | 100 | 100 | 100 | 100 |
| Netherlands | 100 | 100 | 100 | 100 | 100 |
| Portugal | 96.32 | 96.06 | 95.6 | 96.28 | 96.1 |
| Slovakia | 87 | 87.82 | 88.24 | 88.11 | 86.86 |
| Slovenia | 92.21 | 92.33 | 93.1 | 94.47 | 94.16 |
| Spain | 94.07 | 93.7 | 93.56 | 92.48 | 90.87 |
| Spearman correlation coefficient | 0.93 | 1 | 0.99 | 0.99 | 1 |
Source: Own calculation.
Table 6.
Average efficiency of the countries of the Eurozone (2007–2013).
| Countries | Average | Number of Times Maximum Efficiency | Efficiency Max. | Efficiency Min. | Variation |
|---|---|---|---|---|---|
| Austria | 96.30 | 1 | 100 | 92.8 | 7.2 |
| Belgium | 90.18 | 0 | 96.44 | 87.59 | 8.85 |
| Cyprus | 99.51 | 6 | 100 | 96.55 | 3.45 |
| Estonia | 98.68 | 4 | 100 | 92.17 | 7.83 |
| Finland | 100.00 | 7 | 100 | 100 | 0 |
| France | 92.53 | 0 | 94.55 | 90.71 | 3.84 |
| Germany | 97.44 | 1 | 100 | 94.19 | 5.81 |
| Greece | 80.40 | 0 | 87.93 | 76.45 | 11.48 |
| Ireland | 92.82 | 0 | 94.99 | 90.39 | 4.6 |
| Italy | 75.85 | 0 | 95.65 | 70.71 | 24.94 |
| Latvia | 98.21 | 2 | 100 | 90.21 | 9.79 |
| Lithuania | 96.65 | 0 | 99.74 | 91.33 | 8.41 |
| Luxembourg | 100.00 | 7 | 100 | 100 | 0 |
| Malta | 77.71 | 2 | 100 | 62.61 | 37.39 |
| Netherlands | 100.00 | 7 | 100 | 100 | 0 |
| Portugal | 95.62 | 0 | 96.87 | 93.1 | 3.77 |
| Slovakia | 87.23 | 0 | 89.61 | 85.81 | 3.8 |
| Slovenia | 94.02 | 0 | 97.39 | 92.05 | 5.34 |
| Spain | 89.58 | 0 | 94.55 | 83.88 | 10.67 |
Source: Own calculation.
Table 7.
Average efficiency of the Eurozone countries (2014–2018).
| Countries | Average | Number of Times Maximum Efficiency | Efficiency Max. | Efficiency Min. | Variation |
|---|---|---|---|---|---|
| Austria | 97.88 | 0 | 98.46 | 96.52 | 1.94 |
| Belgium | 88.82 | 0 | 89.01 | 88.49 | 0.52 |
| Cyprus | 97.09 | 1 | 100.00 | 94.18 | 5.82 |
| Estonia | 99.92 | 5 | 100.00 | 99.59 | 0.41 |
| Finland | 100.00 | 5 | 100.00 | 100.00 | 0.00 |
| France | 92.80 | 0 | 94.09 | 90.76 | 3.33 |
| Germany | 100.00 | 5 | 100.00 | 100.00 | 0.00 |
| Greece | 81.45 | 0 | 82.35 | 80.08 | 2.27 |
| Ireland | 93.90 | 0 | 95.45 | 91.12 | 4.33 |
| Italy | 75.11 | 0 | 76.05 | 73.88 | 2.17 |
| Latvia | 98.29 | 0 | 98.62 | 97.69 | 0.93 |
| Lithuania | 100.00 | 5 | 100.00 | 100.00 | 0.00 |
| Luxembourg | 100.00 | 5 | 100.00 | 100.00 | 0.00 |
| Malta | 100.00 | 5 | 100.00 | 100.00 | 0.00 |
| Netherlands | 100.00 | 5 | 100.00 | 100.00 | 0.00 |
| Portugal | 96.07 | 0 | 96.32 | 95.60 | 0.72 |
| Slovakia | 87.61 | 0 | 88.24 | 86.86 | 1.38 |
| Slovenia | 93.25 | 0 | 94.47 | 92.21 | 2.26 |
| Spain | 92.94 | 0 | 94.07 | 90.87 | 3.20 |
Source: Own calculation.
Publisher’s Note: MDPI stays neutral with regard to jurisdictional claims in published maps and institutional affiliations. |
© 2021 by the authors. Licensee MDPI, Basel, Switzerland. This article is an open access article distributed under the terms and conditions of the Creative Commons Attribution (CC BY) license (http://creativecommons.org/licenses/by/4.0/).
Share and Cite
MDPI and ACS Style
Blanco, M.; Bares, L.; Hrynevych, O.; Ferasso, M. Analysis of the Territorial Efficiency of European Funds as an Instrument to Reduce Labor Gender Differences. Economies 2021, 9, 9. https://0-doi-org.brum.beds.ac.uk/10.3390/economies9010009
AMA Style
Blanco M, Bares L, Hrynevych O, Ferasso M. Analysis of the Territorial Efficiency of European Funds as an Instrument to Reduce Labor Gender Differences. Economies. 2021; 9(1):9. https://0-doi-org.brum.beds.ac.uk/10.3390/economies9010009
Chicago/Turabian StyleBlanco, Miguel, Lydia Bares, Oksana Hrynevych, and Marcos Ferasso. 2021. "Analysis of the Territorial Efficiency of European Funds as an Instrument to Reduce Labor Gender Differences" Economies 9, no. 1: 9. https://0-doi-org.brum.beds.ac.uk/10.3390/economies9010009
Note that from the first issue of 2016, this journal uses article numbers instead of page numbers. See further details here.