Urban Heat Island Analysis Using the Landsat 8 Satellite Data: A Case Study in Skopje, Macedonia †


1
Earth and Space Sciences Institue, Anadolu University, 26470 Tepebaşı/Eskişehir, Turkey
2
Department of Environmental Engineering, Anadolu University, 26470 Tepebaşı/Eskişehir, Turkey
*
Author to whom correspondence should be addressed.
†
Presented at the 2nd International Electronic Conference on Remote Sensing, 22 March–5 April 2018; Available online: https://sciforum.net/conference/ecrs-2.
Proceedings 2018, 2(7), 358; https://0-doi-org.brum.beds.ac.uk/10.3390/ecrs-2-05171
Published: 22 March 2018
(This article belongs to the Proceedings of The 2nd International Electronic Conference on Remote Sensing)
Abstract
:An urban heat island (UHI) is an urban area that is significantly warmer than its surrounding rural areas due to antropogenic activities. The urban area of the city of Skopje has been rising rapidly in the past decade. In this study, the effect of UHI is analyzed using Landsat 8 data in the summer period of 2013–2017 as a case study in Skopje, Macedonia. An algorithm was applied to retrieve the land surface temperature (LST) distribution from the Landsat 8 data. In addition, the correlation between land surface temperature and the normalized difference vegetation index (NDVI) and the normalized difference build-up index (NDBI) were analyzed to explore the impacts of the green areas and the build-up land on the urban heat island. The results indicate that the effect of the urban heat island in Skopje is located in many sub-urban areas. The negative correlation between LST and NDVI indicates that the green area can weaken the effect on the urban heat island, while the positive correlation between LST and NDBI means that the built-up land can strengthen the effect of the urban heat island in the study area.
1. Introduction
Due to the fact that the global mean surface temperature has risen since the 20th century, global climate change has acquired more attention. Urbanization is one of the most significant contributors to global warming, as more than 50% of the human population lives in cities. The growth of population and urbanization has caused the phenomenon of Urban Heat Islands (UHI), which can be described as the alteration of temperatures in urban areas compared to their rural surroundings [1]. In order to observe UHI and their behavior, UHI studies are generally conducted in two ways: through the air temperature measuring, or through measuring the surface temperature [2]. With the ability of remote sensing sensors to measure the surface temperature, remote sensing has been successfully used in UHI studies all over the world. Different instruments have been used in UHI studies as The Moderate Resolution Imaging Spectroradiometer—MODIS [1,3,4], Landsat TM, ETM+ and OLI/TIRS [5,6], and ASTER [7], as well as their combined use. As MODIS is a low-resolution sensor; it has been used for big areas, while Landsat and ASTER with their medium resolution are more suitable for observing single cities or smaller areas. Research on LST and UHI showed that surface temperature response is a function of different land cover [8], which prompted research on the relationship between LST and land cover, and especially vegetation abundance [5,9,10,11].
Using remote sensing techniques, various vegetation indices can be obtained and used in the assessment of vegetation cover. The Normalized Difference Vegetation Index (NDVI) has been widely used for vegetation extraction. Higher NDVI values indicate a higher vegetation area in a pixel. For extraction of urban areas, the Normalized Difference Built-up Index has been widely used. Building a connection between the land cover and LST can be valuable for urban climate studies.
In this study, the effects of UHIs, as well as the relationship between LST, NDVI, and NDBI, have been studied for the city of Skopje. For this purpose, two Landsat 8 satellite images from 2013 and 2017 summer period have been downloaded from the USGS webpage.
2. Study Area and Methods
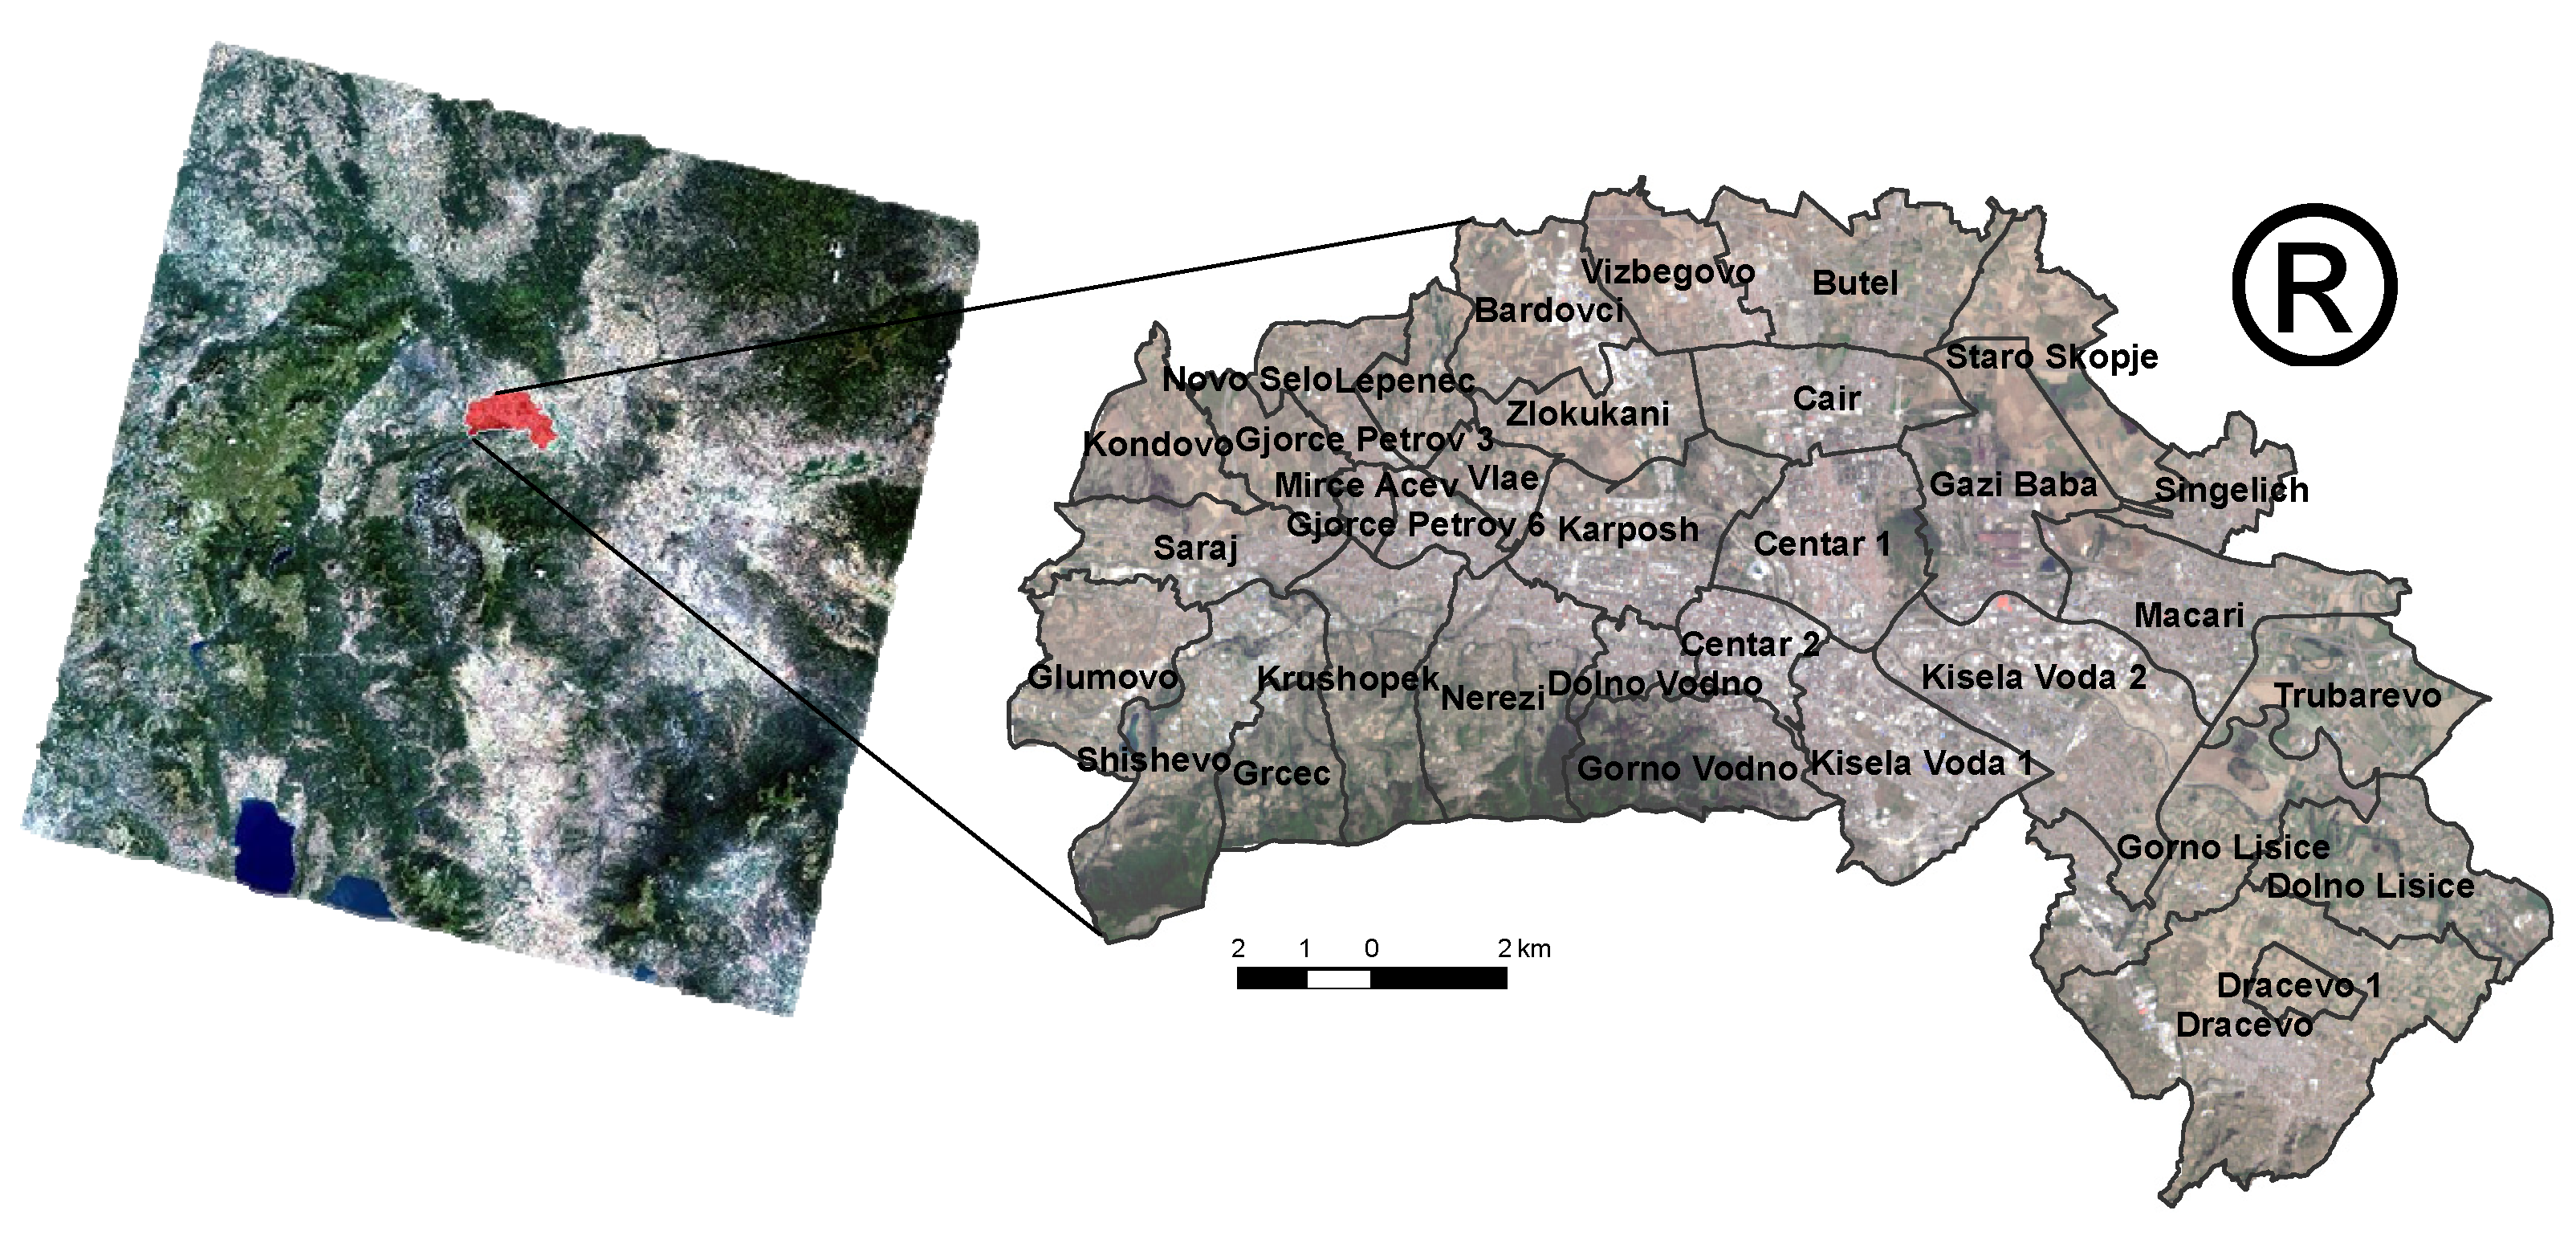
Skopje is the capital of the Republic of Macedonia, and is located in the center of the Balkan Peninsula. Republic of Macedonia is a landlocked country with a population of approximately 2 million citizents. The population of Skopje is estimated to be more than 700,000 [12]. In the last few decades, the urban area of Skopje has been significantly expanding. Skopje has been built in the Skopje Valley along the riverbed of Vardar. Skopje covers an area of 1818 km2, 23 km in longitude and 9 km in latitude, and is situated on a height of 245 m above the sea level. Skopje has an average temperature of 13.5 °C, and its average rainfall per year is 940 mm [13].
In this study, Landsat 8 satellite data have been used in order to investigate the UHI in 35 municipalities in the city of Skopje (Figure 1) and its behavior in the period of 2013 and 2017. For this purpose, two satellite images (Path 185 and Row 31) from July 2013 and July 2017 have been downloaded from the USGS webpage. Also, air temperature data from the meteorological station have been obtained for the same day and time with the overpass of the satellite over the city of Skopje (Table 1).
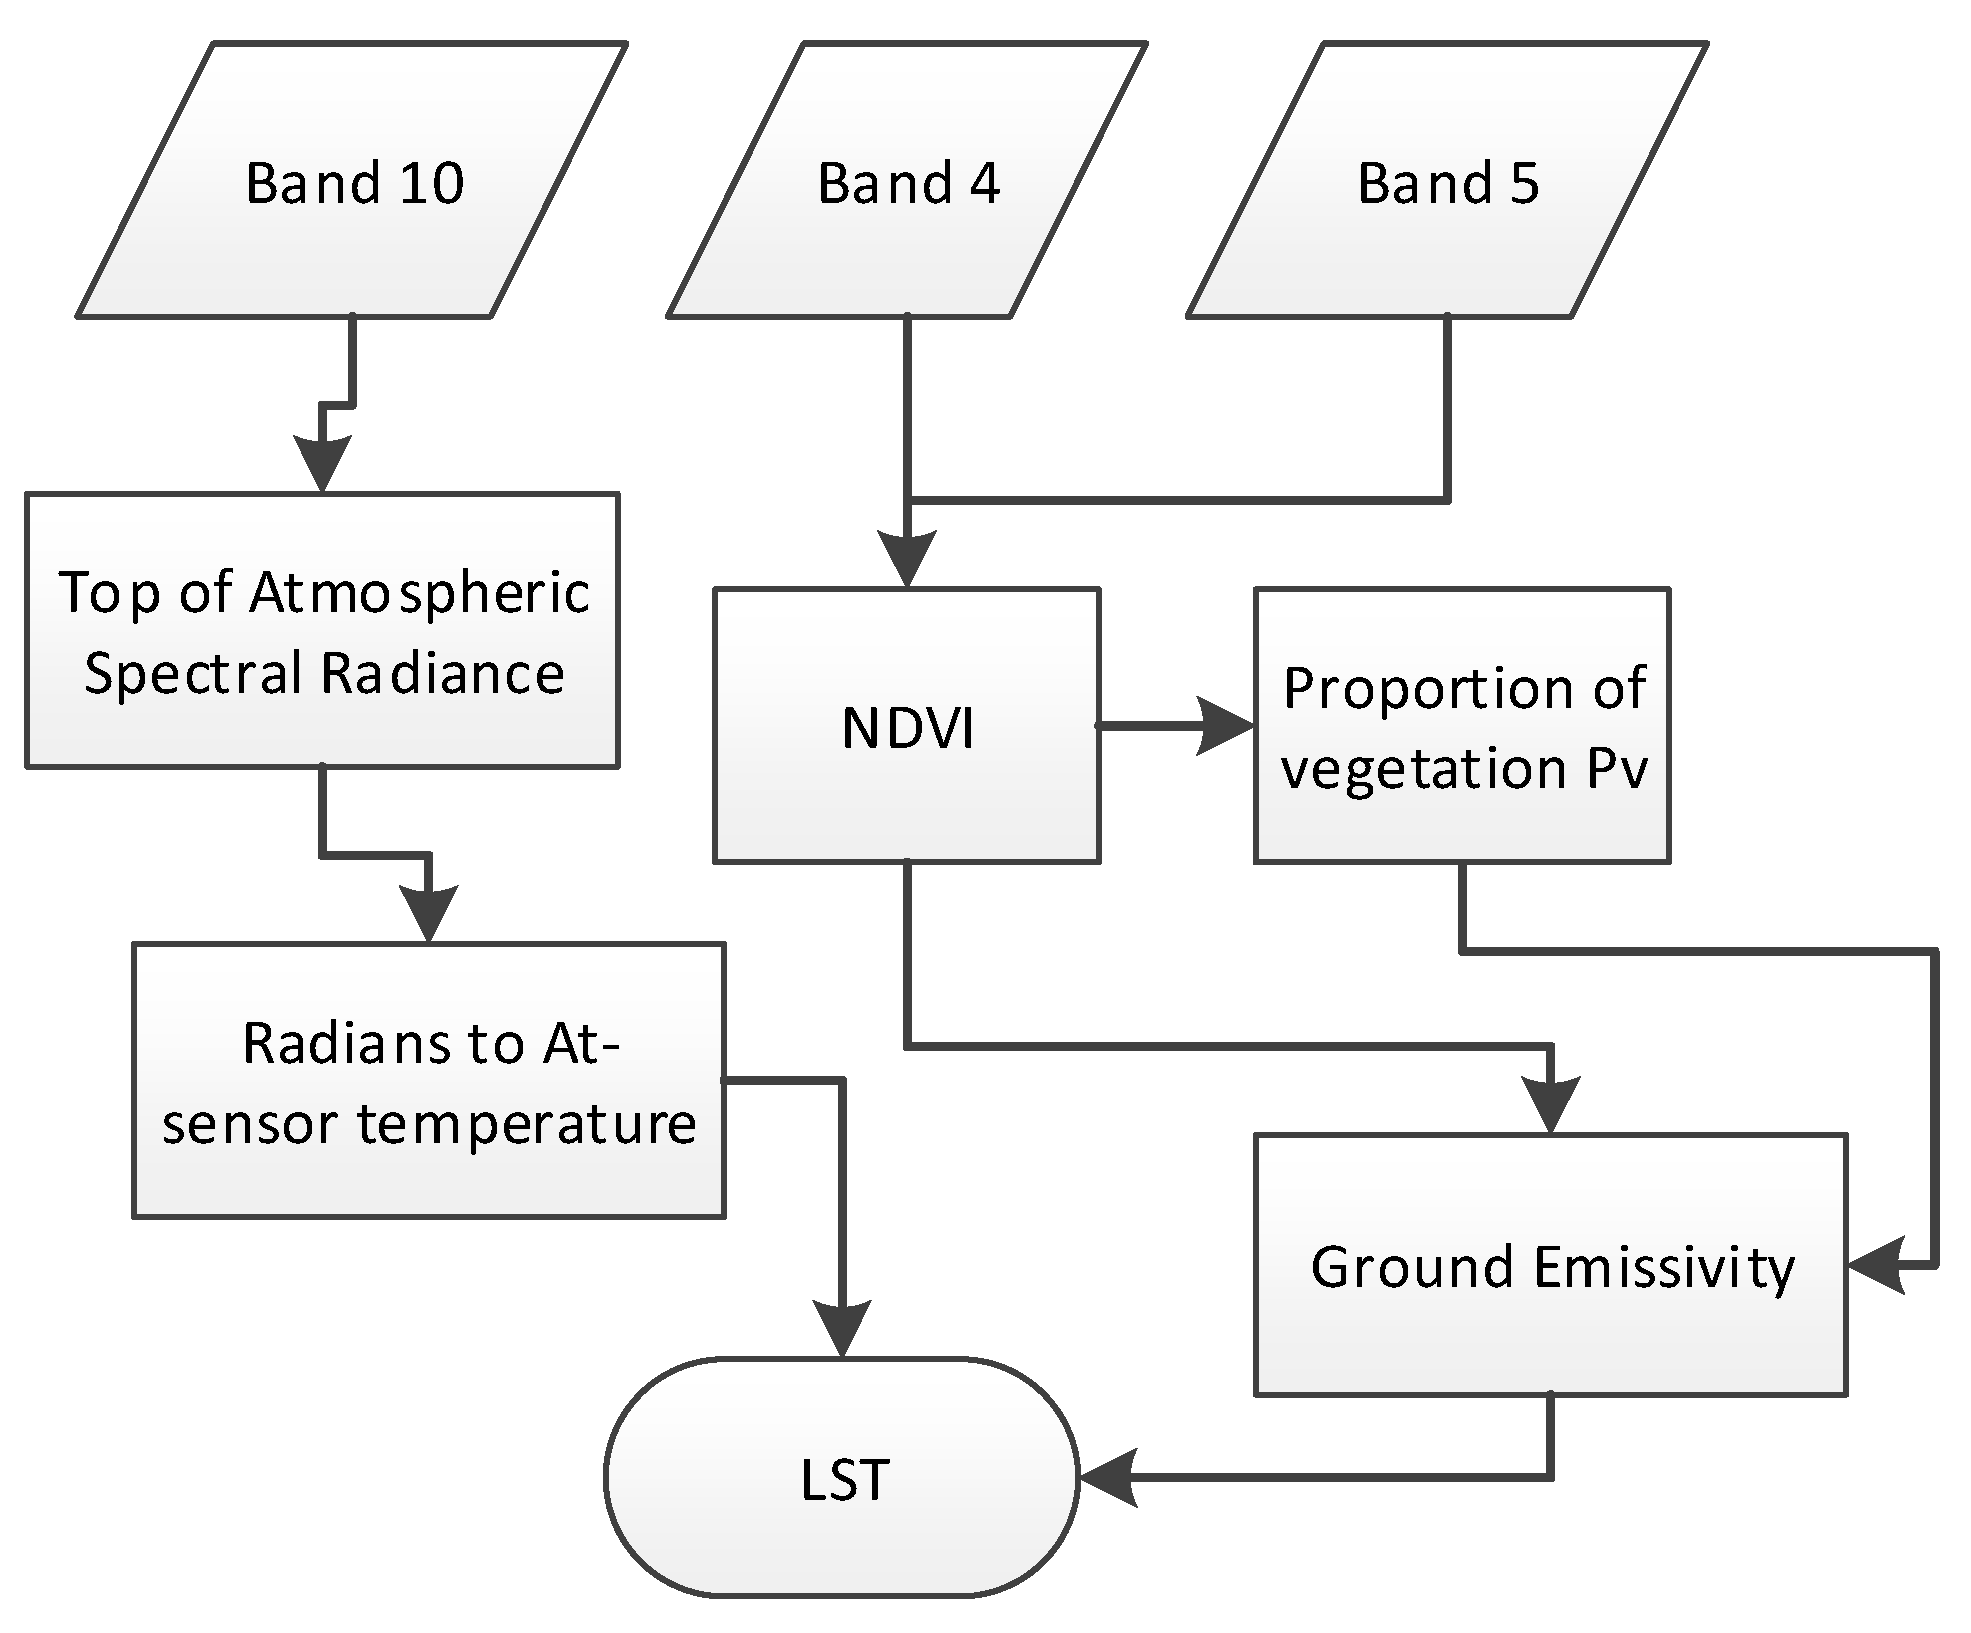
For extracting the UHIs, LST tool developed using ERDAS IMAGINE Model Maker was used [14]. The tool is used for retrieving LST of a given LANDSAT 8 image with the input of the fourth (red wavelength/micrometres, 0.64–0.67), fifth (near infrared (NIR) wavelength/micrometres, 085–0.88), and tenth (thermal infrared sensor (TIRS) wavelength/micrometres, 10.60–11.19) bands. A flowchart of the used algorithm is shown in Figure 2.
The UHI has been extracted using the following method [15]:
in which µ is the mean LST value of the study area, and σ is the standard deviation of the LST. NDVI and NDBI were calculated in order to determinate the correlation between the land cover and the LST results. NDVI is calculated using the 5th and 4th or Near Infra Red and Red Landsat 8 bands (Equation (2)).
The NDBI index [6] is calculated using the 6th and 5th or the Middle Infra Red and Near Infra-Red Landsat 8 bands, respectively.
3. Results
A correlation coefficient between LST and NDVI, and LST and NDBI, has been calculated in order to explore the impact of the green land and the build-up land on the UHI. The results from the performed statistical analysis are shown in Table 2.
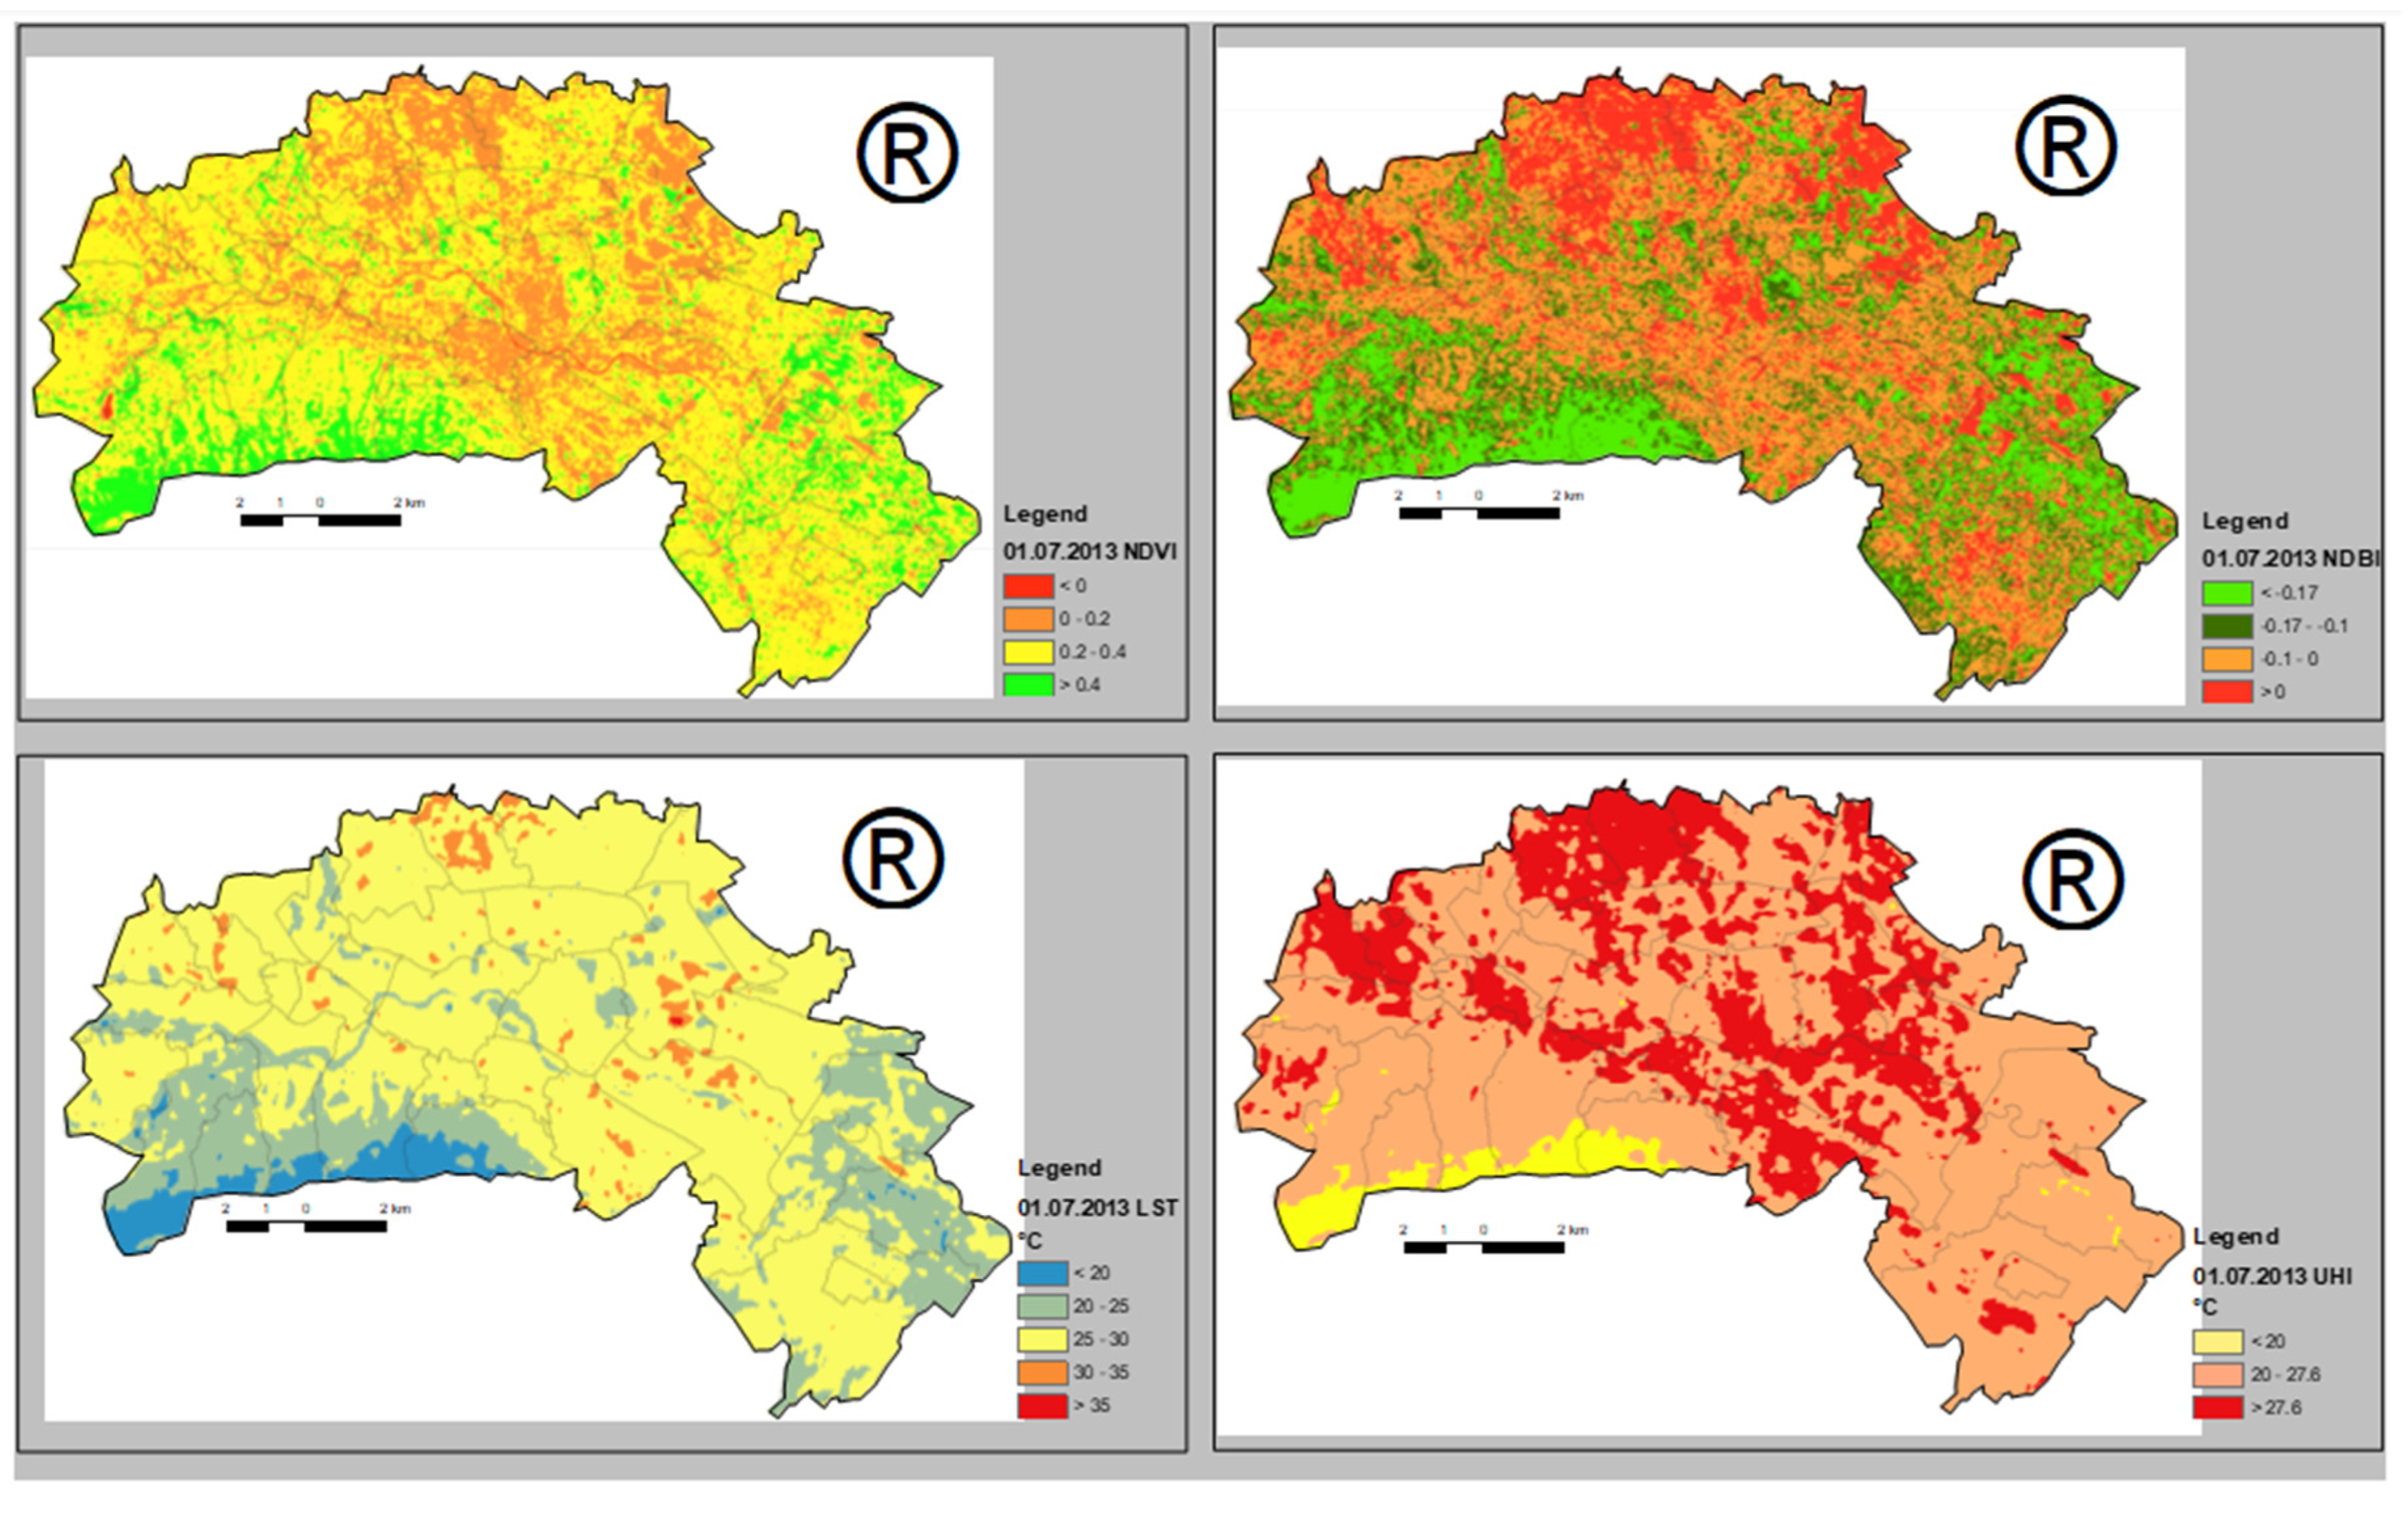
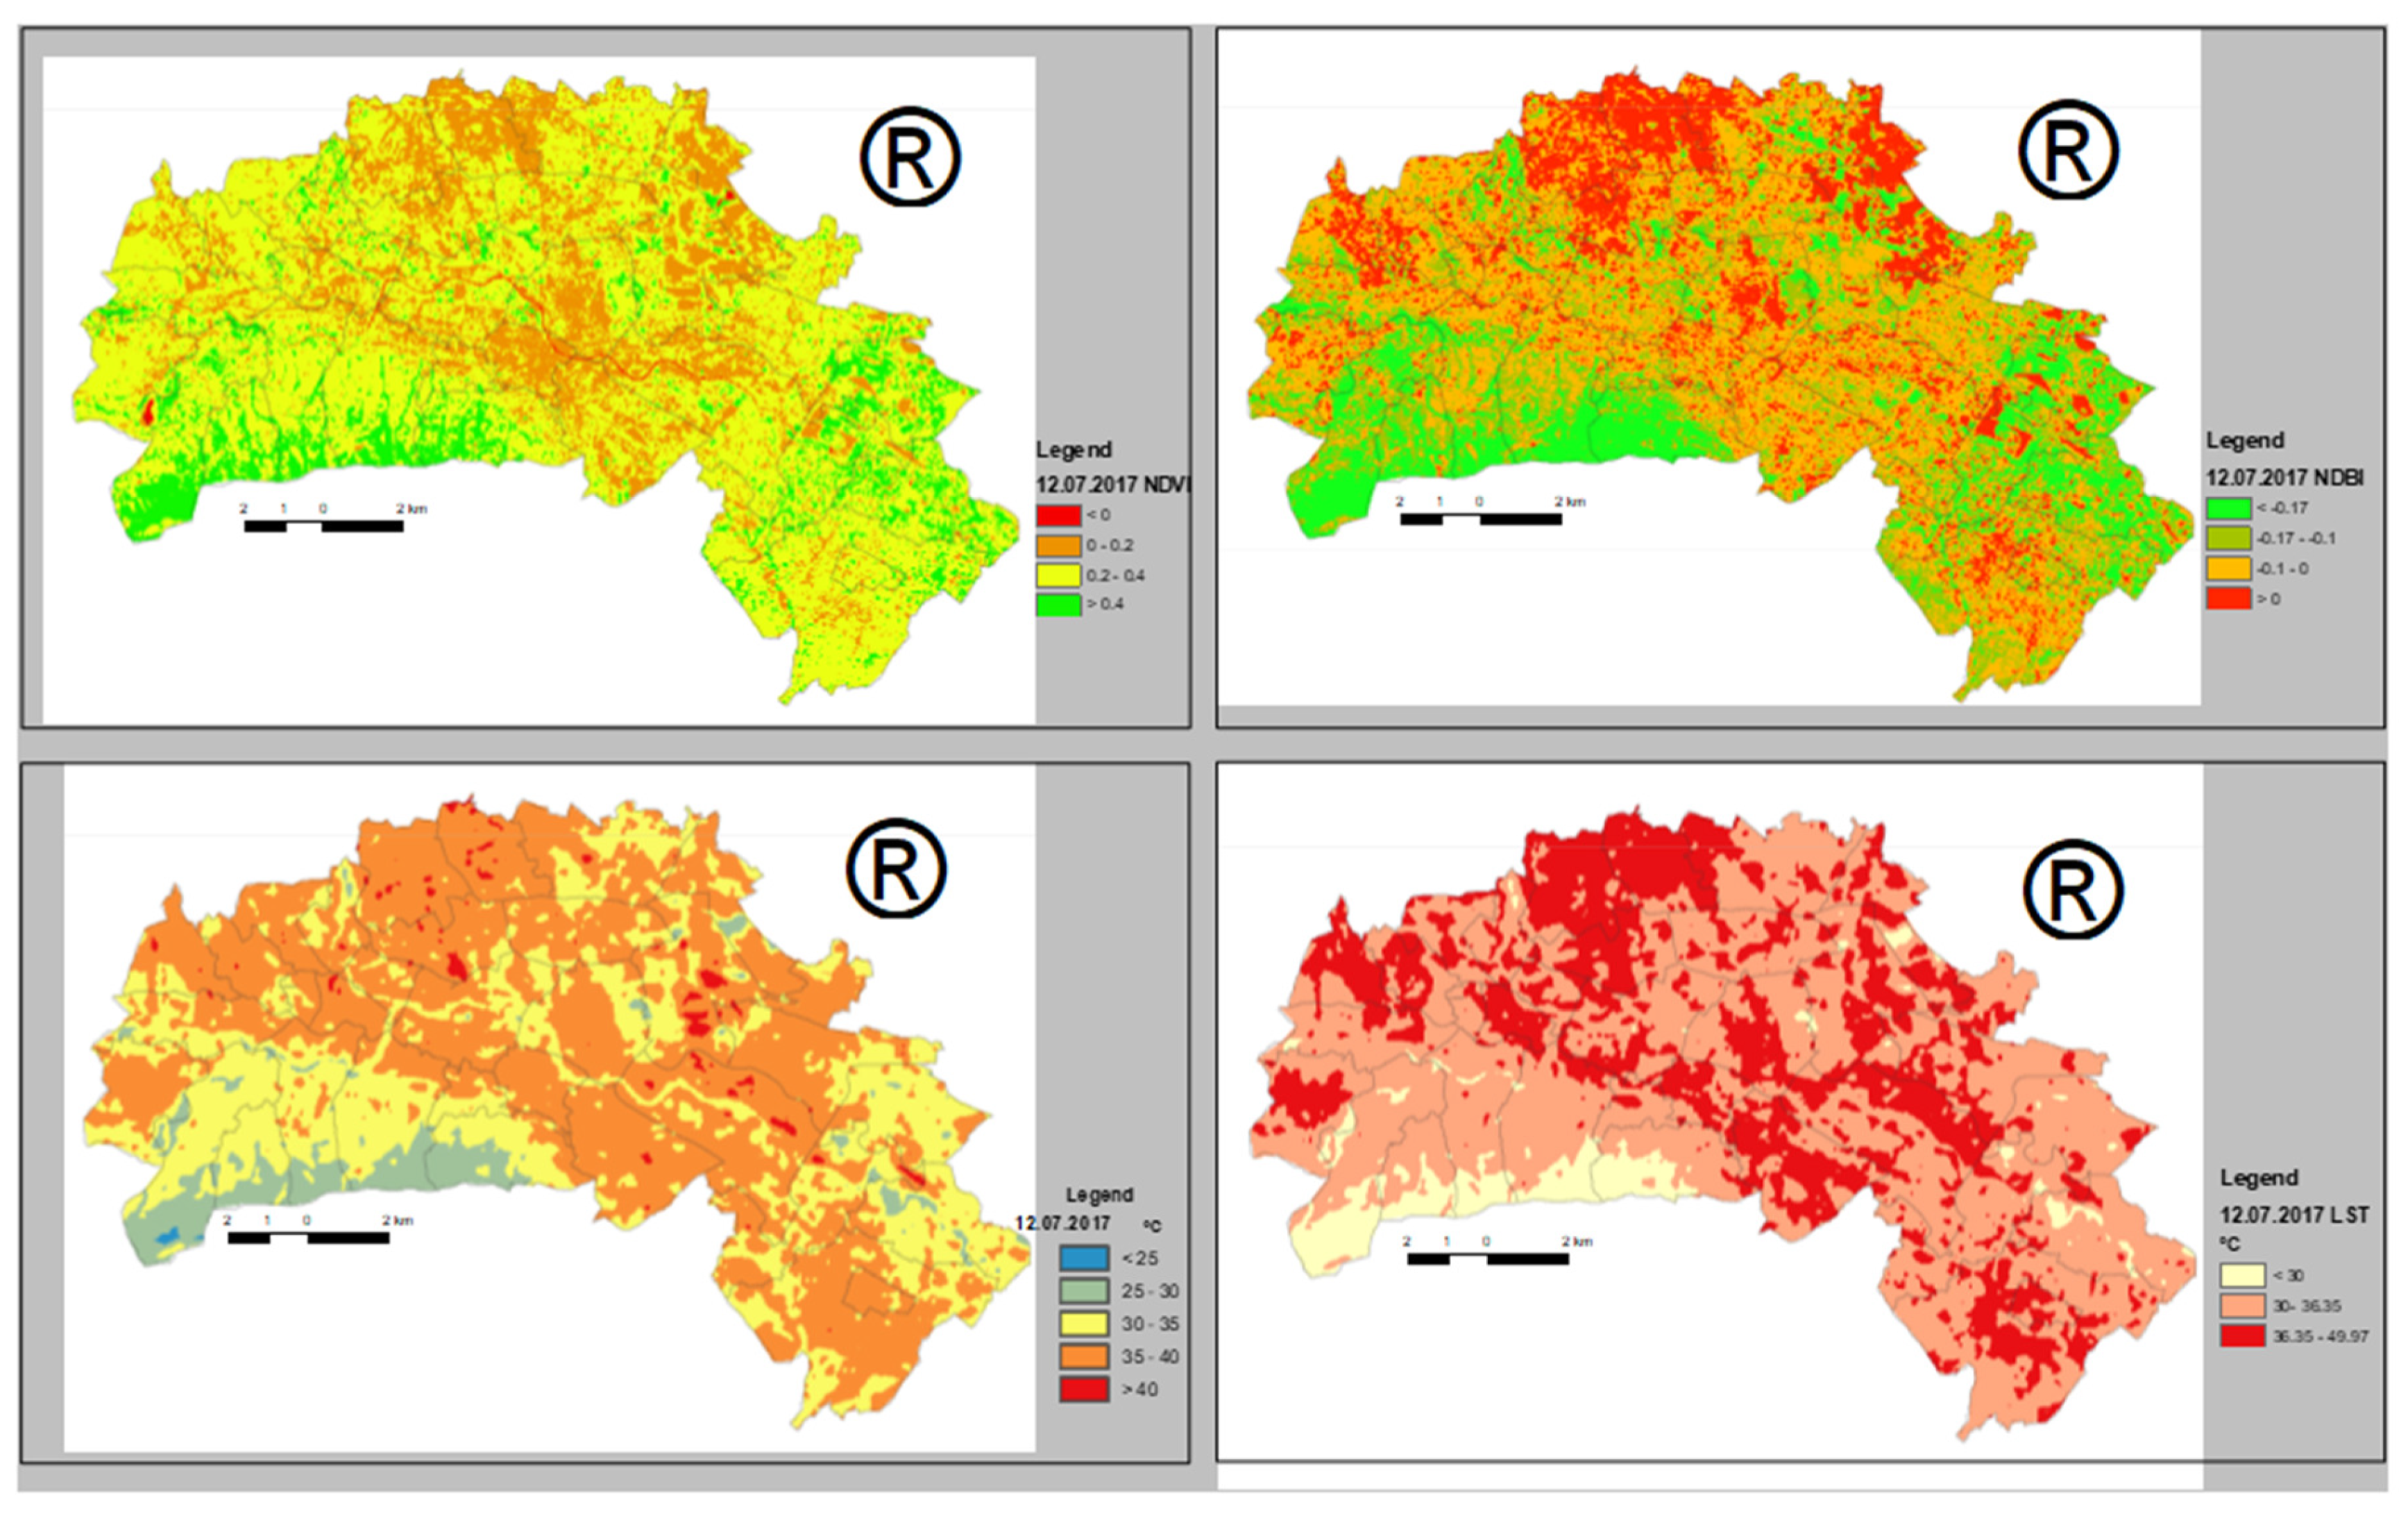
The results from the land cover analysis showed that the vegetation area has slightly decreased from 2013 to 2017 and expansion of some urban areas has been noticed. The surface temperature analysis showed that the minimum and maximum temperatures in the study area were 15 °C and 37 °C for 2013, and 24 °C and 49 °C for 2017, which matches the air temperature differences from the meteorological data. The results from the LST, NDVI, and NDVI analyses are shown in Figure 3 and Figure 4.
The comparison between the UHI from 2013 and 2017 indicates an increase of the UHI area for approximately 4 km2 (Table 3).
4. Discussion
In this paper, the relationship between land cover and UHI of the city of Skopje has been studied. Correlation of LST with both NDVI and NDBI indices was calculated, and the results showed that the effect of UHI in Skopje is located in many sub-urban areas. The negative correlation between LST and NDVI indicates that the green areas can weaken the effect on urban heat island, while the positive correlation between LST and NDBI means that the built-up land can strengthen the effect of urban heat island in the study area.
5. Conclusions
Global climate change is expected to raise the occurrence of urban heat island effects. Air temperatures in cities increase disproportionately to urban areas and have a locally acute, adverse human health, economic, social, and environmental impact. Land use/cover has a relationship with LST that can help in land use planning, has contributed to global climate change, and has changed UHI intensity, mainly through the process of the study area. Using the latent heat flux from the surface to atmosphere via evapotranspiration, the amount of green areas determines LST. Lower LSTs usually are found in areas with high NDVI. This negative correlation between NDVI and LST and the positive correlation between NDBI and LST is valuable for urban climate studies. As an outcome of this study, it can be concluded that in order to reduce UHI effects, local governments should increase the number of green areas in the intensive populated urban areas.
Conflicts of Interest
The authors declare no conflict of interest.
References
- Schwarz, N.; Lautenbach, S.; Seppelt, R. Exploring indicators for quantifying surface urban heat islands of European cities with MODIS land surface temperatures. Remote Sens. Environ. 2011, 115, 3175–3186. [Google Scholar] [CrossRef]
- Streutker, D.R. Satellite-measured growth of the urban heat island of Houston, Texas. Remote Sens. Environ. 2003, 85, 282–289. [Google Scholar] [CrossRef]
- Tomlinson, C.; Chapman, L.; Thornes, J.E.; Bakeret, C.J. Derivation of Birmingham’s summer surface urban heat island from MODIS satellite images. Int. J. Climatol. 2012, 32, 214–224. [Google Scholar] [CrossRef]
- Miao, S.; Chen, F.; LeMone, M.A.; Tewari, M.; Li, Q.; Wang, Y. An observational and modeling study of characteristics of urban heat island and boundary layer structures in Beijing. J. Appl. Meteorol. Climatol. 2009, 48, 484–501. [Google Scholar] [CrossRef]
- Chen, X.-L.; Zhao, H.-M.; Li, P.-X.; Yin, Z.-Y. Remote sensing image-based analysis of the relationship between urban heat island and land use/cover changes. Remote Sens. Environ. 2006, 104, 133–146. [Google Scholar] [CrossRef]
- Zha, Y.; Gao, J.; Ni, S. Use of normalized difference built-up index in automatically mapping urban areas from TM imagery. Int. J. Remote Sens. 2003, 24, 583–594. [Google Scholar] [CrossRef]
- Liu, L.; Zhang, Y. Urban heat island analysis using the Landsat TM data and ASTER data: A case study in Hong Kong. Remote Sens. 2011, 3, 1535–1552. [Google Scholar] [CrossRef]
- Owen, T.; Carlson, T.; Gillies, R. An assessment of satellite remotely-sensed land cover parameters in quantitatively describing the climatic effect of urbanization. Int. J. Remote Sens. 1998, 19, 1663–1681. [Google Scholar] [CrossRef]
- Gallo, K.P.; Owen, T.W. Satellite-based adjustments for the urban heat island temperature bias. J. Appl. Meteorol. 1999, 38, 806–813. [Google Scholar] [CrossRef]
- Weng, Q. A remote sensing? GIS evaluation of urban expansion and its impact on surface temperature in the Zhujiang Delta, China. Int. J. Remote Sens. 2001, 22, 1999–2014. [Google Scholar]
- Weng, Q.; Lu, D.; Schubring, J. Estimation of land surface temperature-vegetation abundance relationship for urban heat island studies. Remote Sens. Environ. 2004, 89, 467–483. [Google Scholar] [CrossRef]
- Available online: http://www.exploringmacedonia.com/skopje.nspx (accessed on 2 December 2017).
- Available online: http://skopje.gov.mk (accessed on 2 December 2017).
- Avdan, U.; Jovanovska, G. Algorithm for automated mapping of land surface temperature using LANDSAT 8 satellite data. J. Sens. 2016. [Google Scholar] [CrossRef]
- Ma, Y.; Kuang, Y.; Huang, N. Coupling urbanization analyses for studying urban thermal environment and its interplay with biophysical parameters based on TM/ETM+ imagery. Int. J. Appl. Earth Obs. Geoinf. 2010, 12, 110–118. [Google Scholar] [CrossRef]
Figure 1.
Study Area; the city of Skopje.

Figure 2.
Flowchart of the Land Surface Temperature algorithm.

Figure 3.
Results for 1 July 2013.

Figure 4.
Results for 12 July 2017.


Table 1.
Air temperature data.
| Date | Time | Air Temperature | Humidity |
|---|---|---|---|
| 1 July 2013 | 10:20 | 22 °C | 35% |
| 12 July 2017 | 10:20 | 30 °C | 43% |
Table 2.
Results of the correlation coefficient between LST, NDVI, and NDWI.
| Year | LST-NDVI | LST-NDBI |
|---|---|---|
| 2013 | −0.63 | 0.67 |
| 2017 | −0.59 | 0.64 |
Table 3.
2013–2017 UHI comparison.
| Year | Study Area (km2) | UHI Area (km2) |
|---|---|---|
| 2013 | 130 | 51 |
| 2017 | 130 | 55 |
Publisher’s Note: MDPI stays neutral with regard to jurisdictional claims in published maps and institutional affiliations. |
© 2018 by the authors. Licensee MDPI, Basel, Switzerland. This article is an open access article distributed under the terms and conditions of the Creative Commons Attribution (CC BY) license (https://creativecommons.org/licenses/by/4.0/).
Share and Cite
MDPI and ACS Style
Kaplan, G.; Avdan, U.; Avdan, Z.Y. Urban Heat Island Analysis Using the Landsat 8 Satellite Data: A Case Study in Skopje, Macedonia. Proceedings 2018, 2, 358. https://0-doi-org.brum.beds.ac.uk/10.3390/ecrs-2-05171
AMA Style
Kaplan G, Avdan U, Avdan ZY. Urban Heat Island Analysis Using the Landsat 8 Satellite Data: A Case Study in Skopje, Macedonia. Proceedings. 2018; 2(7):358. https://0-doi-org.brum.beds.ac.uk/10.3390/ecrs-2-05171
Chicago/Turabian StyleKaplan, Gordana, Ugur Avdan, and Zehra Yigit Avdan. 2018. "Urban Heat Island Analysis Using the Landsat 8 Satellite Data: A Case Study in Skopje, Macedonia" Proceedings 2, no. 7: 358. https://0-doi-org.brum.beds.ac.uk/10.3390/ecrs-2-05171