Post-Earthquake Landslide Distribution Assessment Using Sentinel-1 and -2 Data: The Example of the 2016 Mw 7.8 Earthquake in New Zealand †


Abstract
:1. Introduction
2. Experiments
2.1. Satellite Data
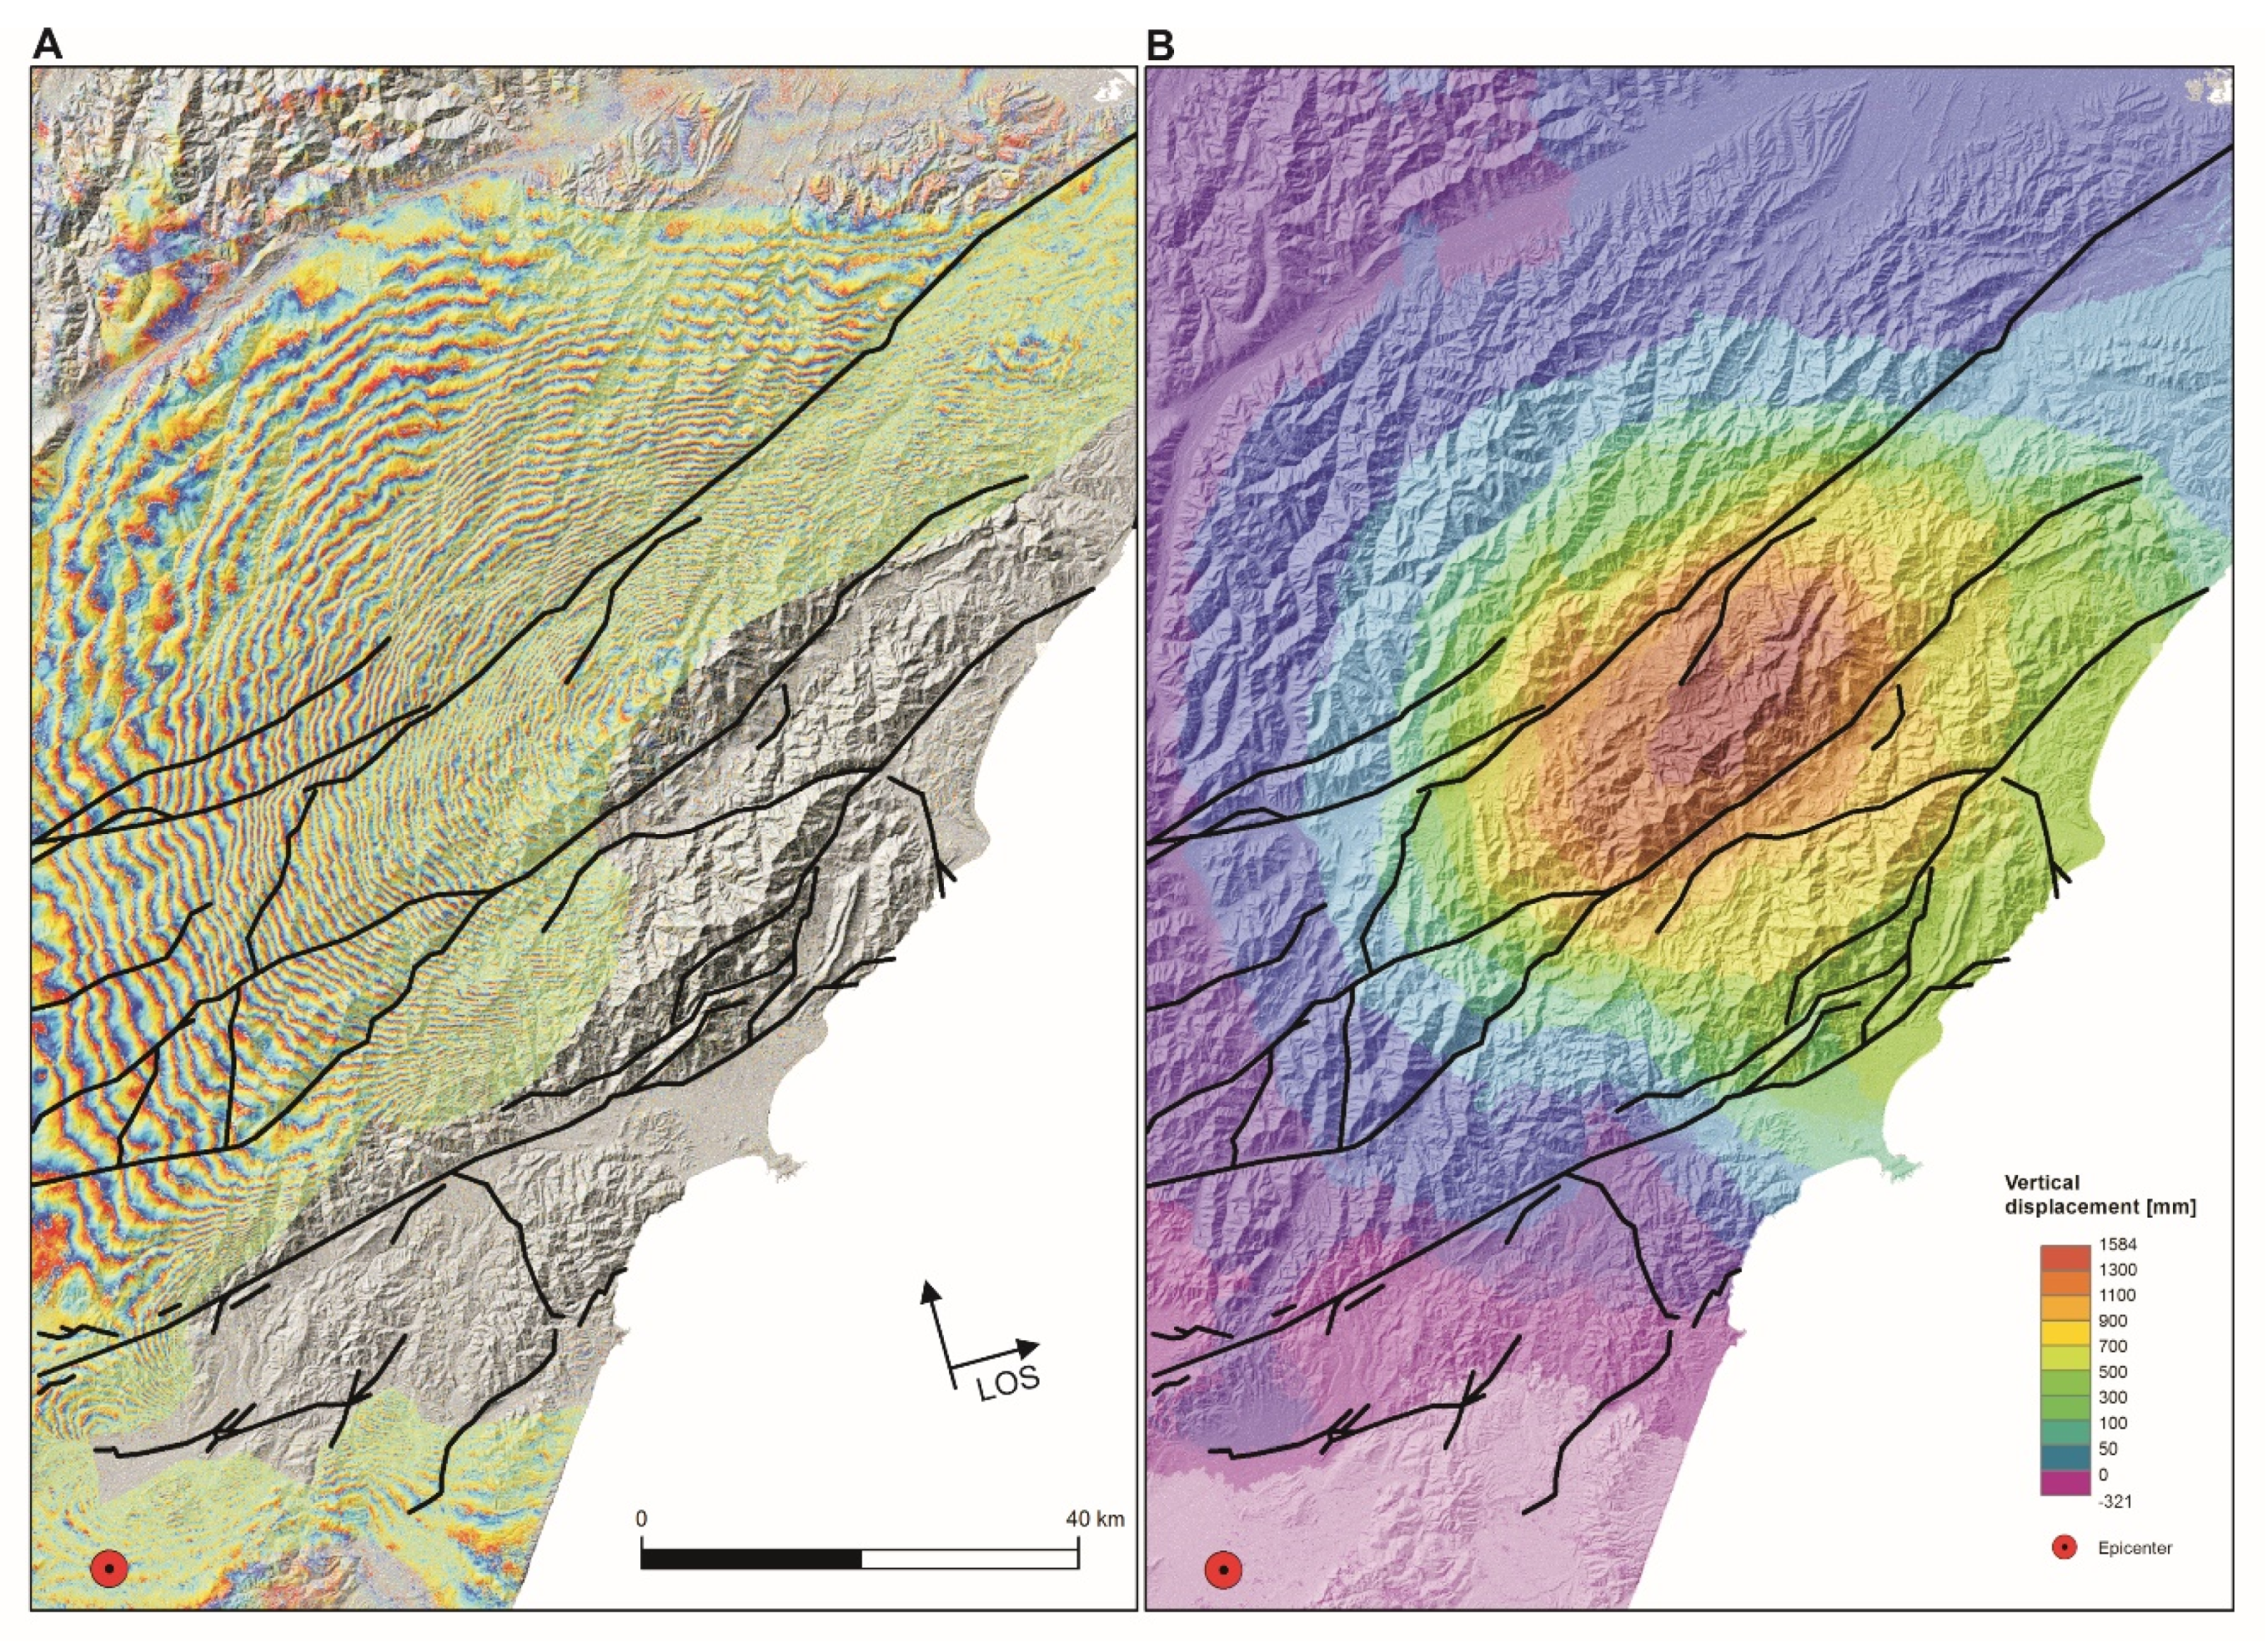
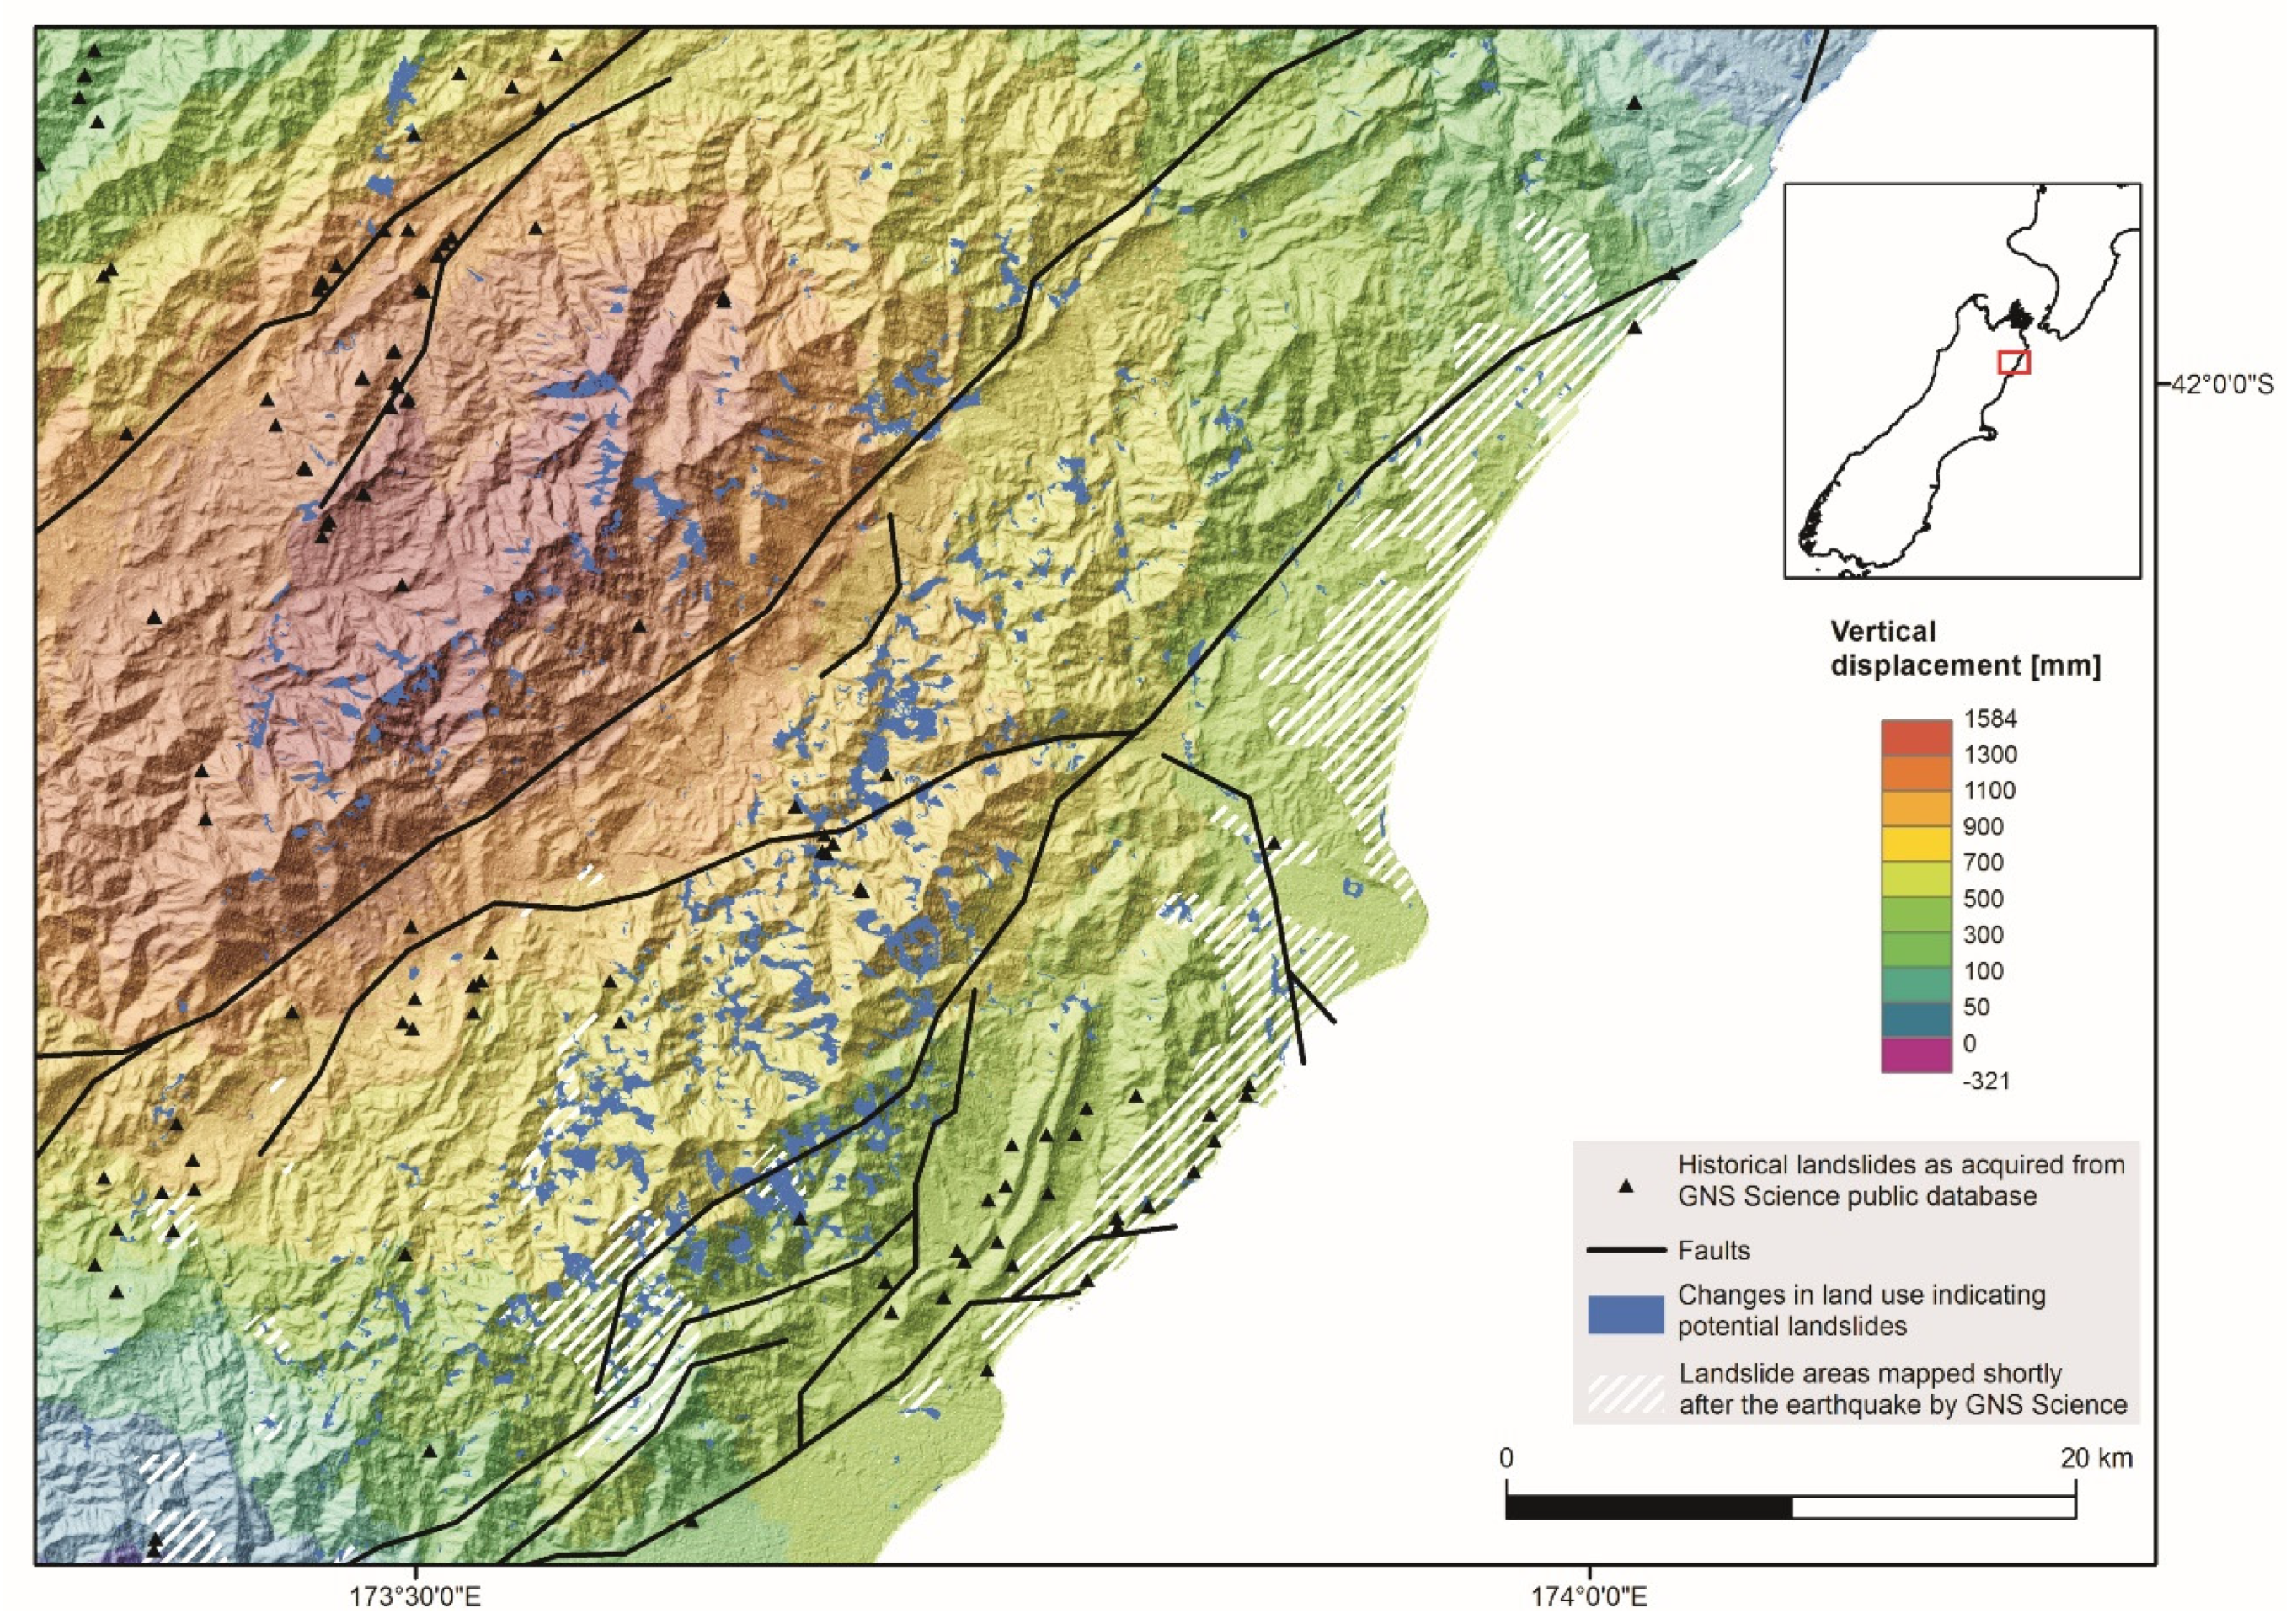
2.2. Methods
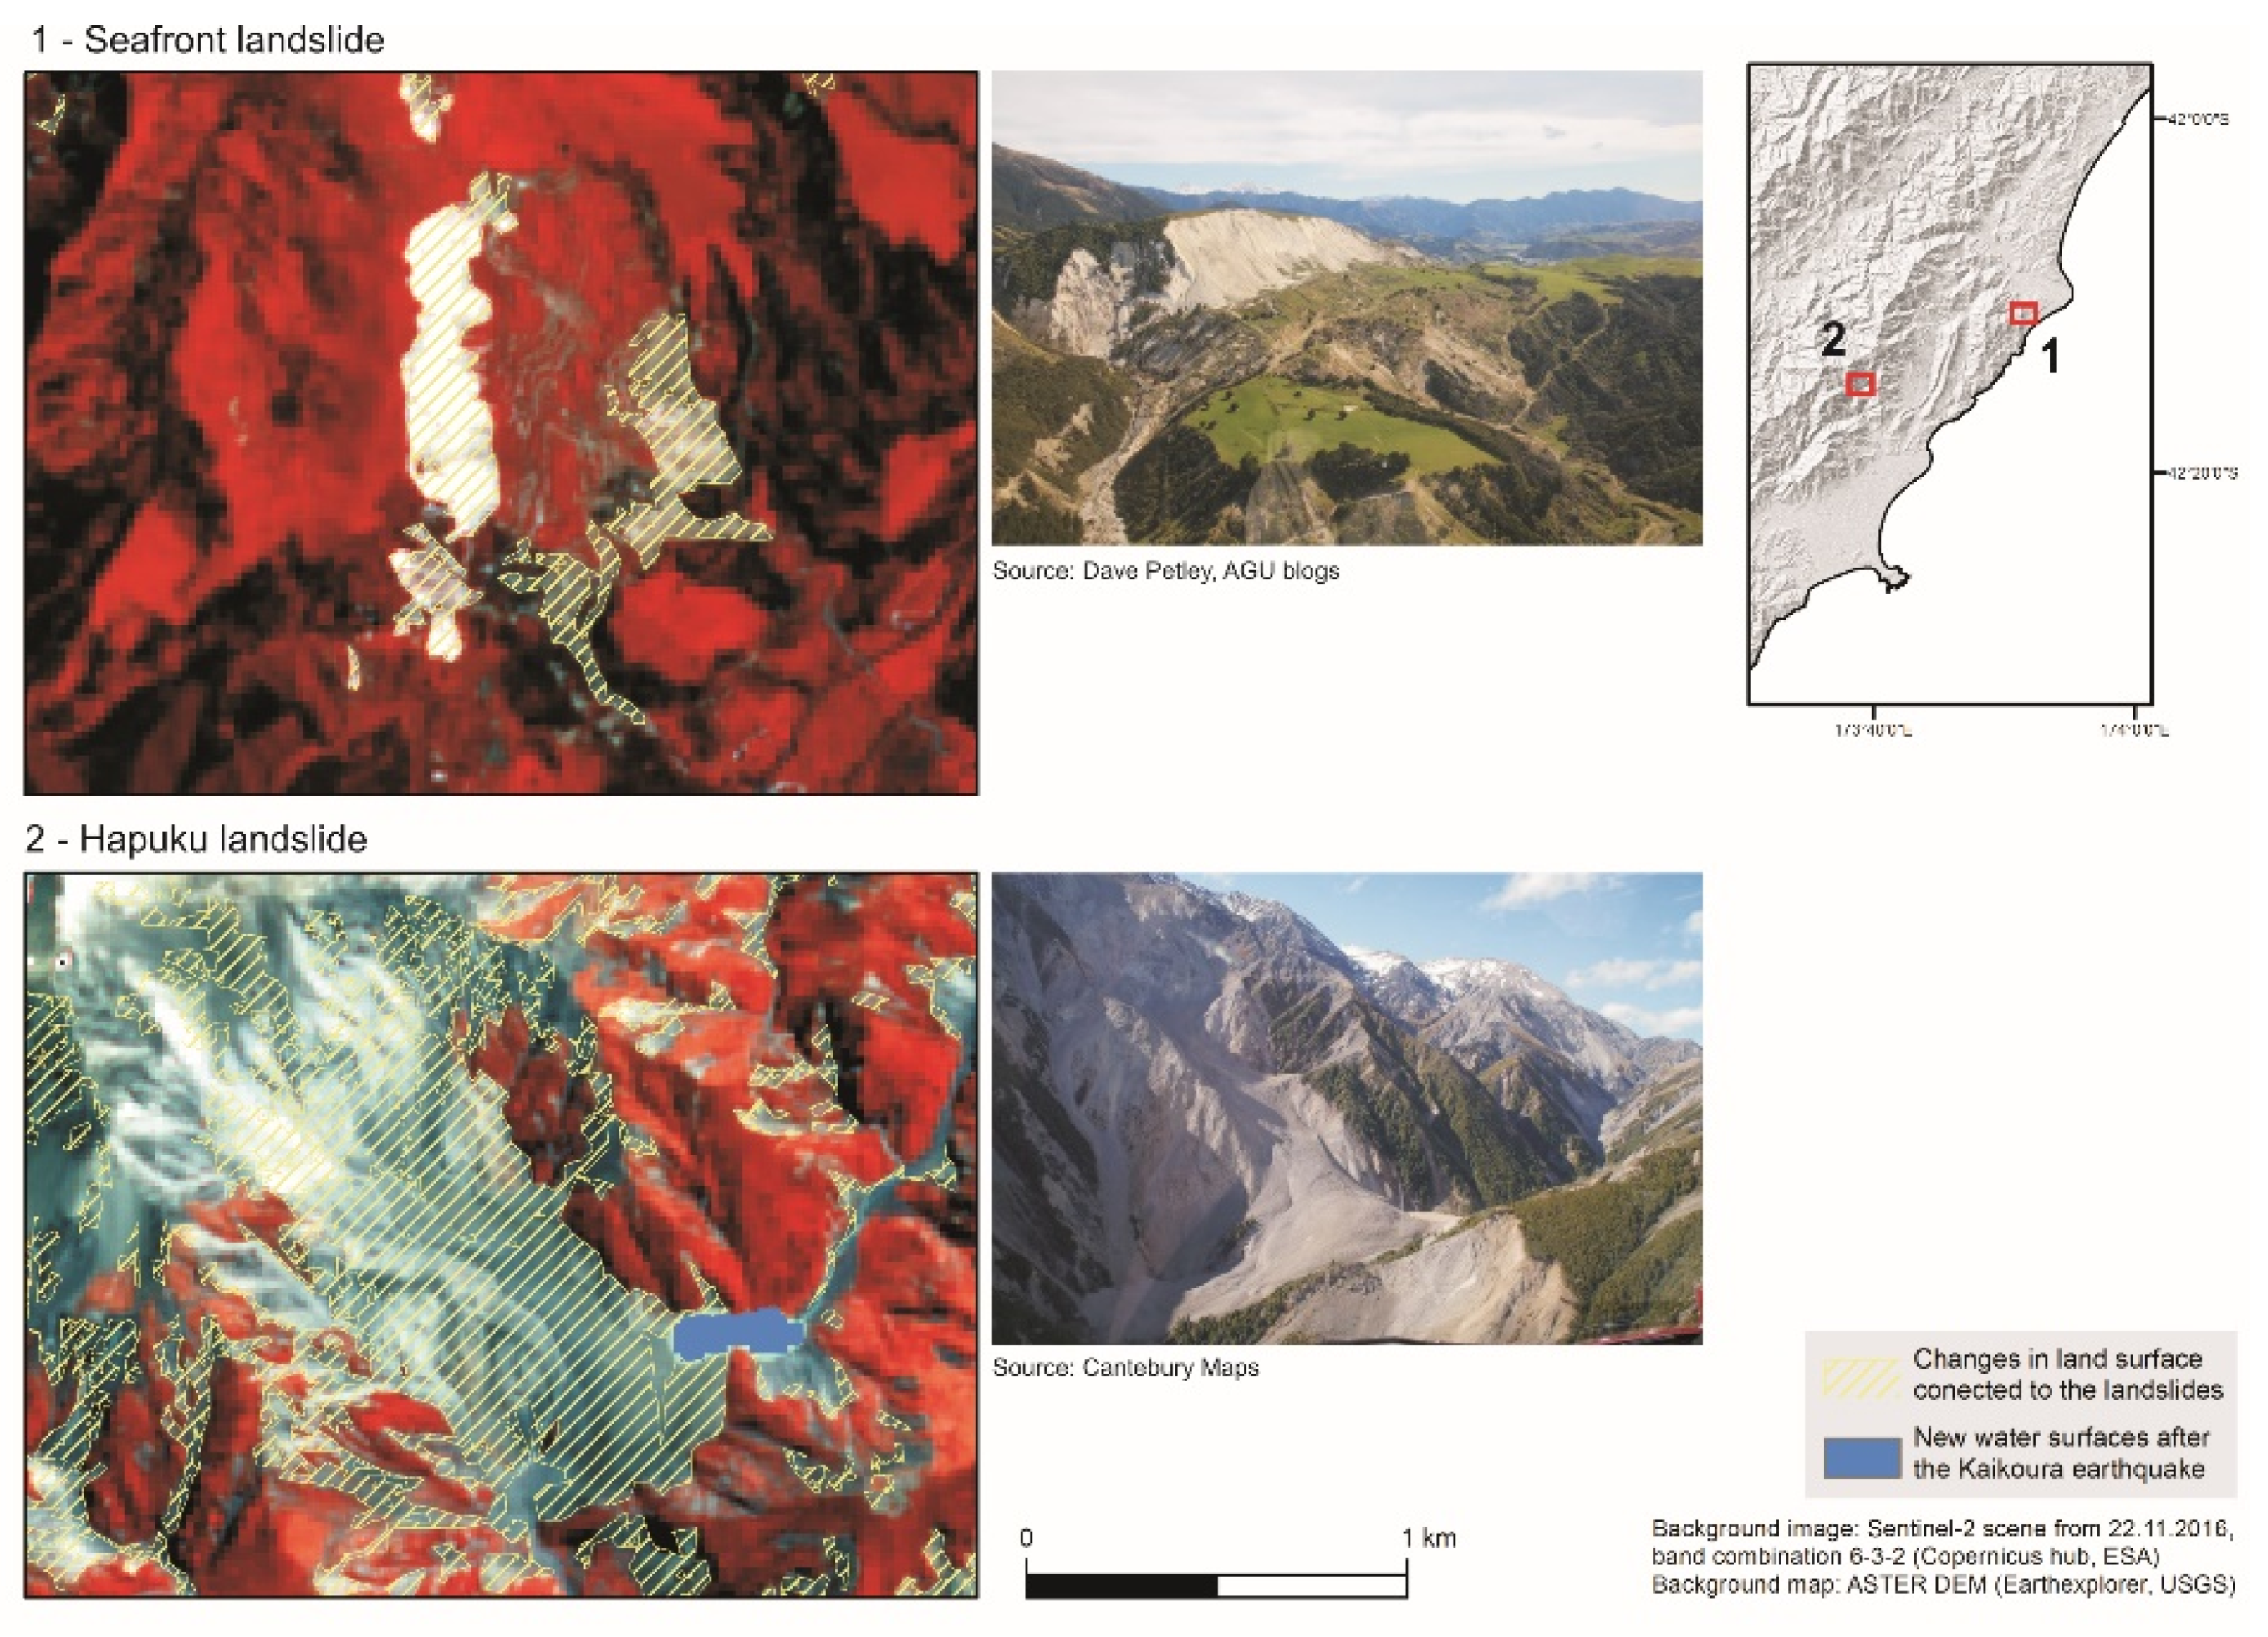
3. Results and Discussion
4. Conclusions
Author Contributions
Acknowledgments
Conflicts of Interest
Abbreviations
| ARVI | Atmospherically resistant vegetation index |
| DInSAR | Differential synthetic aperture radar interferometry |
| ESA | European space agency |
| LOS | Line of sight |
| NDVI | Normalized difference vegetation index |
| SAR | Synthetic aperture radar |
References
- Czuchlewski, K.R.; Weissel, K.; Kim, Y. Polarimetric synthetic aperture radar study of the Tsaoling landslide generated by the 1999 Chi-Chi earthquake, Taiwan. J. Geophys. Res. 2003, 108, 1–11. [Google Scholar] [CrossRef]
- Hanssen, R.F. Radar Interferometry: Data Interpretation and Error Analysis, 1st ed.; Springer: Dordrecht, The Netherlands, 2001. [Google Scholar]
- Osmanoglu, B.; Sunar, F.; Wdowinski, S.; Cabral-Cano, E. Time series analysis of InSAR data: Methods and trends. ISPRS J. Photogramm. Remote Sens. 2016, 115, 90–102. [Google Scholar] [CrossRef]
- Lazecký, M.; Comut, F.C.; Hlaváčová, I.; Gürboga, S. Practical Application of Satellite-Based SAR Interferometry for the Detection of Landslide Activity. Procedia Earth Planet. Sci. 2015, 15, 613–618. [Google Scholar] [CrossRef]
- Belgiu, M.; Csillik, O. Sentinel-2 cropland mapping using pixel-based and object-based timeweighted dynamic time warping analysis. Remote Sens. Environ. 2018, 204, 509–523. [Google Scholar] [CrossRef]
- Valero, S.; Mroin, D.; Inglada, J.; Sepulcre, G.; Arias, M.; Hagolle, O.; Dedieu, G.; Bontemps, S.; Defourny, P. Processing Sentinel-2 image time series for developing a real-time cropland mask. In Proceedings of the 2015 IEEE International Geoscience and Remote Sensing Symposium (IGARSS), Milan, Italy, 26–31 July 2015. [Google Scholar]
- Veloso, A.; Mermoz, S.; Bouvet, A.; Le Toan, T.; Planells, M.; Dejoux, J.-F.; Ceschia, E. Understanding the temporal behavior of crops using Sentinel-1 and Sentinel-2-like data for agricultural applications. Remote Sens. Environ. 2017, 199, 415–426. [Google Scholar] [CrossRef]
- Amorós-López, J.; Gómez-Chova, L.; Alonso, L.; Guanter, L.; Zurita-Milla, R.; Moreno, J.; Camps-Valls, G. Multitemporal fusion of Landsat/TM and ENVISAT/MERIS for crop monitoring. Int. J. Appl. Earth Obs. Geoinf. 2013, 23, 132–141. [Google Scholar] [CrossRef]
- Hyde, P.; Dubayah, R.; Walker, W.; Blair, J.B.; Hofton, M.; Hunsaker, C. Mapping forest structure for wildlife habitat analysis using multi.sensor (LiDAR, SAR/InSAR, ETM+, Quickbird) synergy. Remote Sens. Environ. 2006, 102, 63–73. [Google Scholar] [CrossRef]
- Mwanki, M.W.; Kuria, D.N.; Boitt, M.K.; Ngigi, T.G. Image enhancements of Landsat 8 (OLI) and SAR data for preliminary landslide identification and mapping applied to the central region of Kenya. Geomorphology 2017, 282, 162–175. [Google Scholar] [CrossRef]
- Wotherspoon, L.M.; Palermo, A.; Holden, C. The 2016 Mw7.8 Kaikōura Earthquake: An Introduction. Bull. N. Z. Soc. Earthq. Eng. 2017, 50, i–iv. [Google Scholar]
- Duputel, Z.; Rivera, L. Long-period analysis of the 2016 Kaikōura earthquake. Phys. Earth Planet. Interiors 2017, 265, 62–66. [Google Scholar] [CrossRef]
- Castaldo, R.; De Novellis, V.; Solaro, G.; Pepe, S.; Tizzani, P.; De Luca, C.; Bonano, M.; Manunta, M.; Casu, F.; Zinno, I.; et al. Finite element modelling of the 2015 Gorkha earthquake through the joint exploitation of DInSAR measurements and geologic-structural information. Tectonophysics 2017, 714–715, 125–132. [Google Scholar] [CrossRef]
- Matějíček, L.; Kopačková, V. Changes in Croplands as a Result of Large Scale Mining and the Associated Impact on Food Security Studied Using Time-Series Landsat Images. Remote Sens. 2010, 2, 1463–1480. [Google Scholar] [CrossRef]
- Kaufman, Y.J.; Tanre, D. Atmospherically resistant vegetation index (ARVI) for EOS-MODIS. IEEE Trans. Geosci. Remote Sens. 1992, 30, 261–270. [Google Scholar] [CrossRef]
- Langridge, R.M.; Ries, W.F.; Litchfield, N.J.; Villamore, P.; Van Dissen, R.J.; Barell, D.J.A.; Rattenbury, M.S.; Heron, D.W.; Haubrock, S.; Townsend, D.B.; et al. The New Zealand Active Faults Database. N. Z. J. Geol. Geophys. 2016, 59, 86–96. [Google Scholar] [CrossRef]
- Preliminary Landslide Inventory for the 2016 Kaikoura, New Zealand Earthquake Derived from Satellite Imagery and Aerial/Field Reconnaissance. Available online: http://www.geerassociation.org/component/geer_reports/?view=geerreports&id=80&layout=default (accessed on 5 November 2017).


| Date | Perpendicular Baseline | Temporal Baseline | Track | Pass | |
|---|---|---|---|---|---|
| Sentinel-1A south | 3 November 2016–15 November 2016 | −9.84 m | 12 days | 52 | ascending |
| Sentinel-1A north | 3 November 2016–15 November 2016 | −8.65 m | 12 days | 52 | ascending |
| Date | Track | Pass | |
|---|---|---|---|
| Sentinel-2A | 3 October 2016 | 129 | descending |
| Sentinel-2A | 22 November 2016 | 129 | descending |
Publisher’s Note: MDPI stays neutral with regard to jurisdictional claims in published maps and institutional affiliations. |
© 2018 by the authors. Licensee MDPI, Basel, Switzerland. This article is an open access article distributed under the terms and conditions of the Creative Commons Attribution (CC BY) license (https://creativecommons.org/licenses/by/4.0/).
Share and Cite
Jelének, J.; Kopačková, V.; Fárová, K. Post-Earthquake Landslide Distribution Assessment Using Sentinel-1 and -2 Data: The Example of the 2016 Mw 7.8 Earthquake in New Zealand. Proceedings 2018, 2, 361. https://0-doi-org.brum.beds.ac.uk/10.3390/ecrs-2-05174
Jelének J, Kopačková V, Fárová K. Post-Earthquake Landslide Distribution Assessment Using Sentinel-1 and -2 Data: The Example of the 2016 Mw 7.8 Earthquake in New Zealand. Proceedings. 2018; 2(7):361. https://0-doi-org.brum.beds.ac.uk/10.3390/ecrs-2-05174
Chicago/Turabian StyleJelének, Jan, Veronika Kopačková, and Kateřina Fárová. 2018. "Post-Earthquake Landslide Distribution Assessment Using Sentinel-1 and -2 Data: The Example of the 2016 Mw 7.8 Earthquake in New Zealand" Proceedings 2, no. 7: 361. https://0-doi-org.brum.beds.ac.uk/10.3390/ecrs-2-05174