1. Introduction
Nowadays, Heritage preservation activities provide for the interdisciplinary collaboration of several experts from scientific and humanistic field. The basic principles for a correct conservation treatment are to identify the problems, define the appropriate conservation actions and to select materials and procedures, taken into account some factors as the intrinsic stone properties, the degradation mechanisms and the environmental factors. Nanotechnologies provide new materials for the consolidation and protection of the Cultural Heritage: the implementation of innovative nanoproducts with a biocidal function, such as the titanium dioxide (TiO2), in association with consolidant products and/or protective treatments, it is already a common practice for the treatment of the stone surfaces.
This nanomaterial provides important advantages in the conservation of cultural heritage and can be applied to traditional methods in order to strengthen the delicate and complex challenge of preservation. When particles have dimensions of about 1–100 nm, the materials properties change significantly. Nanomaterials have larger surface areas than similar masses of larger scale materials, which increase their chemical reactivity and present the possibility to penetrate deep into the damage stone materials stone materials [
1].
In particular, atmospheric pollution is increasing the external degradation of monuments due the deposition of organic matter and other contaminants on the stone substrates. Nanometric TiO
2 has become a promising photocatalytic material owing to its ability to catalyze the complete degradation of many organic contaminants and environmental toxins [
2]. Innovative applications have reached by using TiO
2 nanoparticles in stone materials such as environmental pollution remediation and anti-microbial effects, with regard to Cultural Heritage. In addition, TiO
2 photoactive materials can also have water repellent properties which favor the self-cleaning action and prevent the generation of damage caused by water.
As a part of an integrated multi-analytical approach focused on the photocatalytic properties of titanium dioxide (TiO2) such as a new environmentally friendly alternative for disinfection of stone materials, the paper presents a procedure to check the amount of TiO2 in the nanoparticle coatings by field hyperspectral surveys.
2. Method
2.1. Sample Preparation
In order to verify hydrophobic and biocidal features of TiO
2-containing coatings, marble samples (a slab of 40 × 20 cm and two samples of 5 × 5 cm) were treated with NANOESTEL
® [
3] and AEROXIDE
® TiO
2 P25 pure titanium dioxide [
4].
NANOESTEL is a colloid system wherein the particles of SiO2 are dispersed in a water based solution. The dispersed nanoparticles have a diameter not higher than 20 nm. Following the evaporation of water, particles link to each other and generate a silica gel able to build bridges between detached particles of stone (consolidation effect).
AEROXIDE TiO2 P25 consists of aggregated primary particles (with a particles mean diameter of approximately 21 nm and aggregates of several hundred nm in size), with a high photoactivity hydrophilic character.
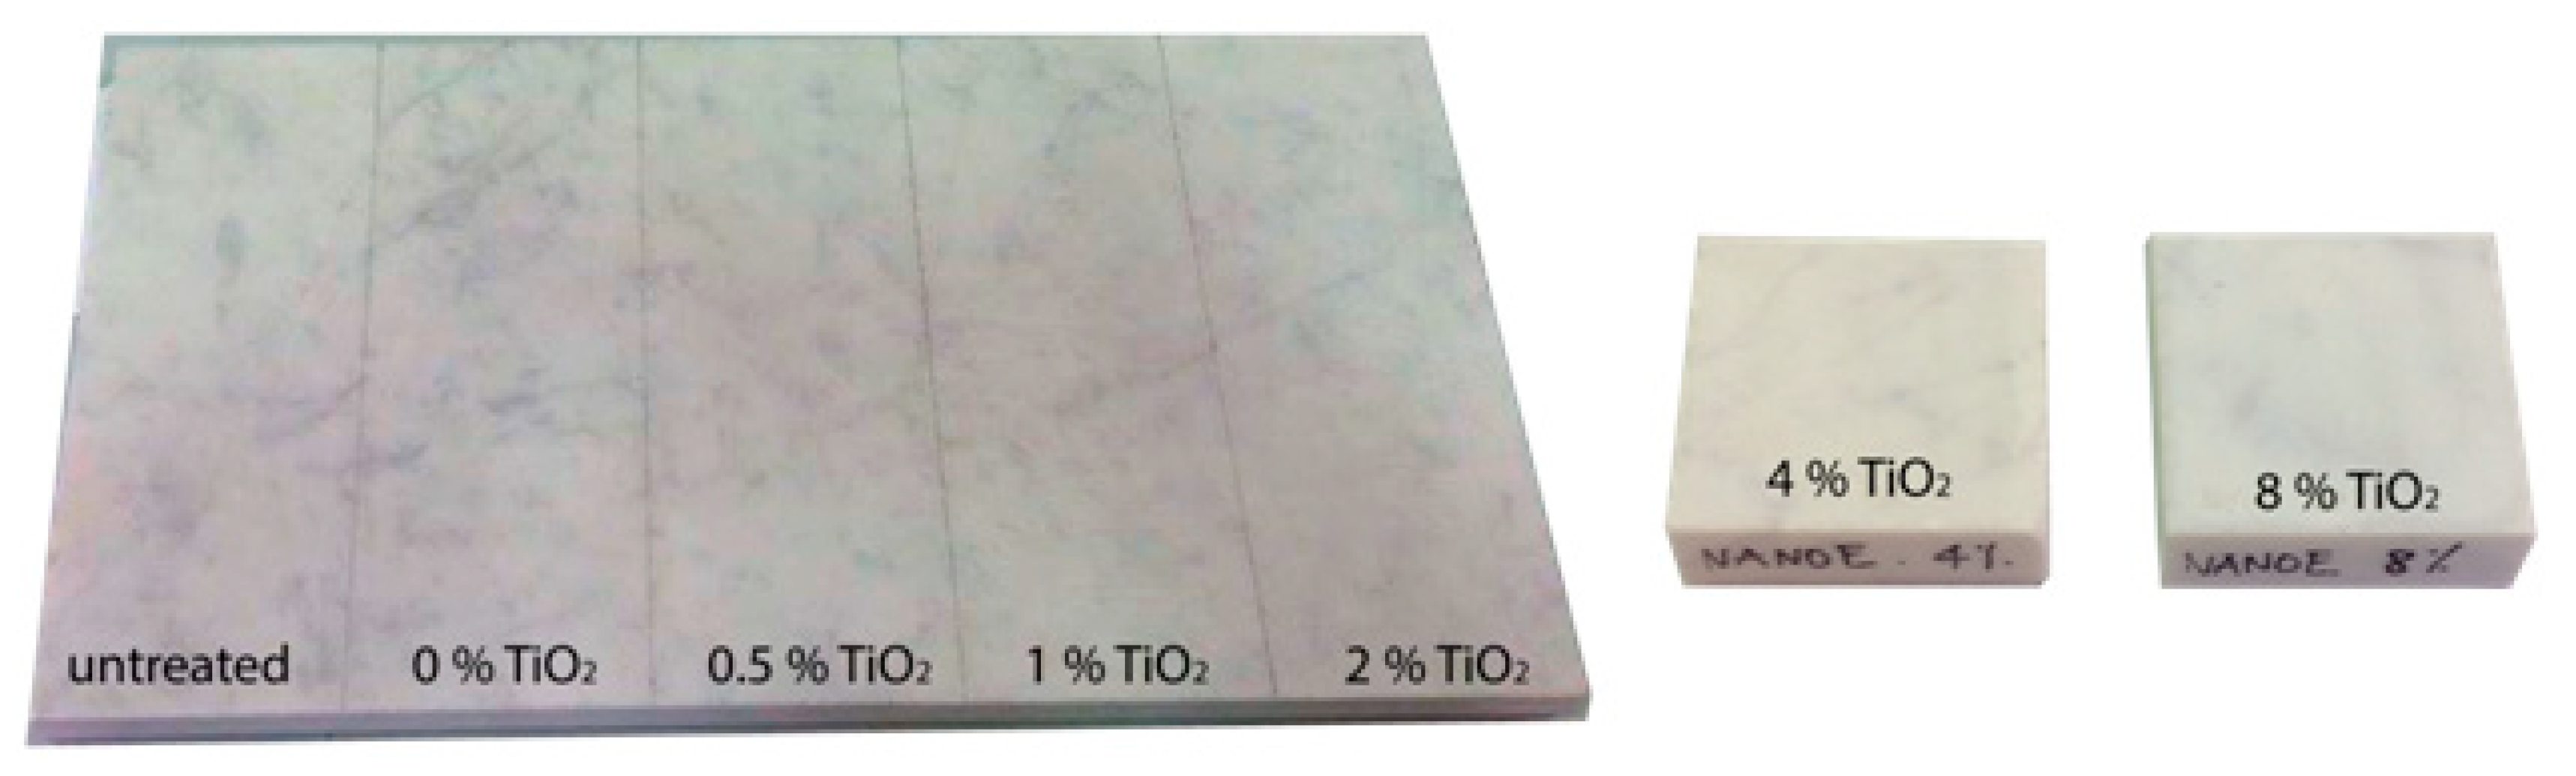
NANOESTEL was diluted to 3% with deionized water and, successively, blended with different amounts of TiO
2 (from 0 w% to 8 w%). TiO
2-containing coatings were applied on marble samples (
Figure 1).
Colorimetric measurement, methylene blue degradation test, accelerated aging tests through UV radiation and contact angle were carried out in order to evaluate the interaction between products and stone materials. With respect to untreated samples, these tests were undertaken to define some specific properties of the coating, such as chromatic variations, self-cleaning property, stability of the hydrophobic property of the film, effect on liquid water and variability of the contact angle.
2.2. Spectral Signatures
For the definition of the Spectral Signature, surface spectral measurements have been performed over 7 marble samples: 1 for untreated material, 1 coated with NANOESTEL and 5 with NANOESTEL blended with increasing TiO2 weight percentage (0.5 w%, 1 w%, 2 w%, 4 w% and 8 w%).
Measurements of solar reflected radiance were carried out with an analytical spectral device (ASD Inc., Longmont, Colorado, U.S.) FieldSpec pro portable spectroradiometer [
5]. Three separate spectrometers cover the 350–2500 nm spectral range with 3 detectors: 1 in the VNIR (350–1000 nm) and 2 in the SWIR region (1001–1800 nm and 1801–2500 nm). These sensors are characterized by: spectral resolution of 3 nm @ 700 nm and 10 nm @ 1400/2100 nm; spectral sampling of 1.4 nm and 1.1 nm in the ranges 350–1000 nm and 1001–2500 nm, respectively; wavelength accuracy 0.5 nm. All other technical specifications can be found in [
5].
Measurements were carried out directly with the bare fiber-optic cable, which has a field of view of 25° with. All samples have been acquired by following the same methodology. The fiber fore optic has been pointed toward the target with a same angular inclination of the solar incidence but in opposite direction. Moreover, the distance between fiber fore optic and target has been kept constant as much as possible. For each measurement 25 spectral signatures were collected. Furthermore, for each sample the 10 measurements were performed, in order to take into account variability of the local conditions due to the coating application and the base stone.
Measures of reflectance were collected on 31 March 2016. During the survey the weather was excellent and totally cloud free allowing the data collection over all different samples. For taking into account, also, the effect due to the environmental conditions, the measurements were repeated with the same procedures on 15 June 2016.
3. Results and Discussion
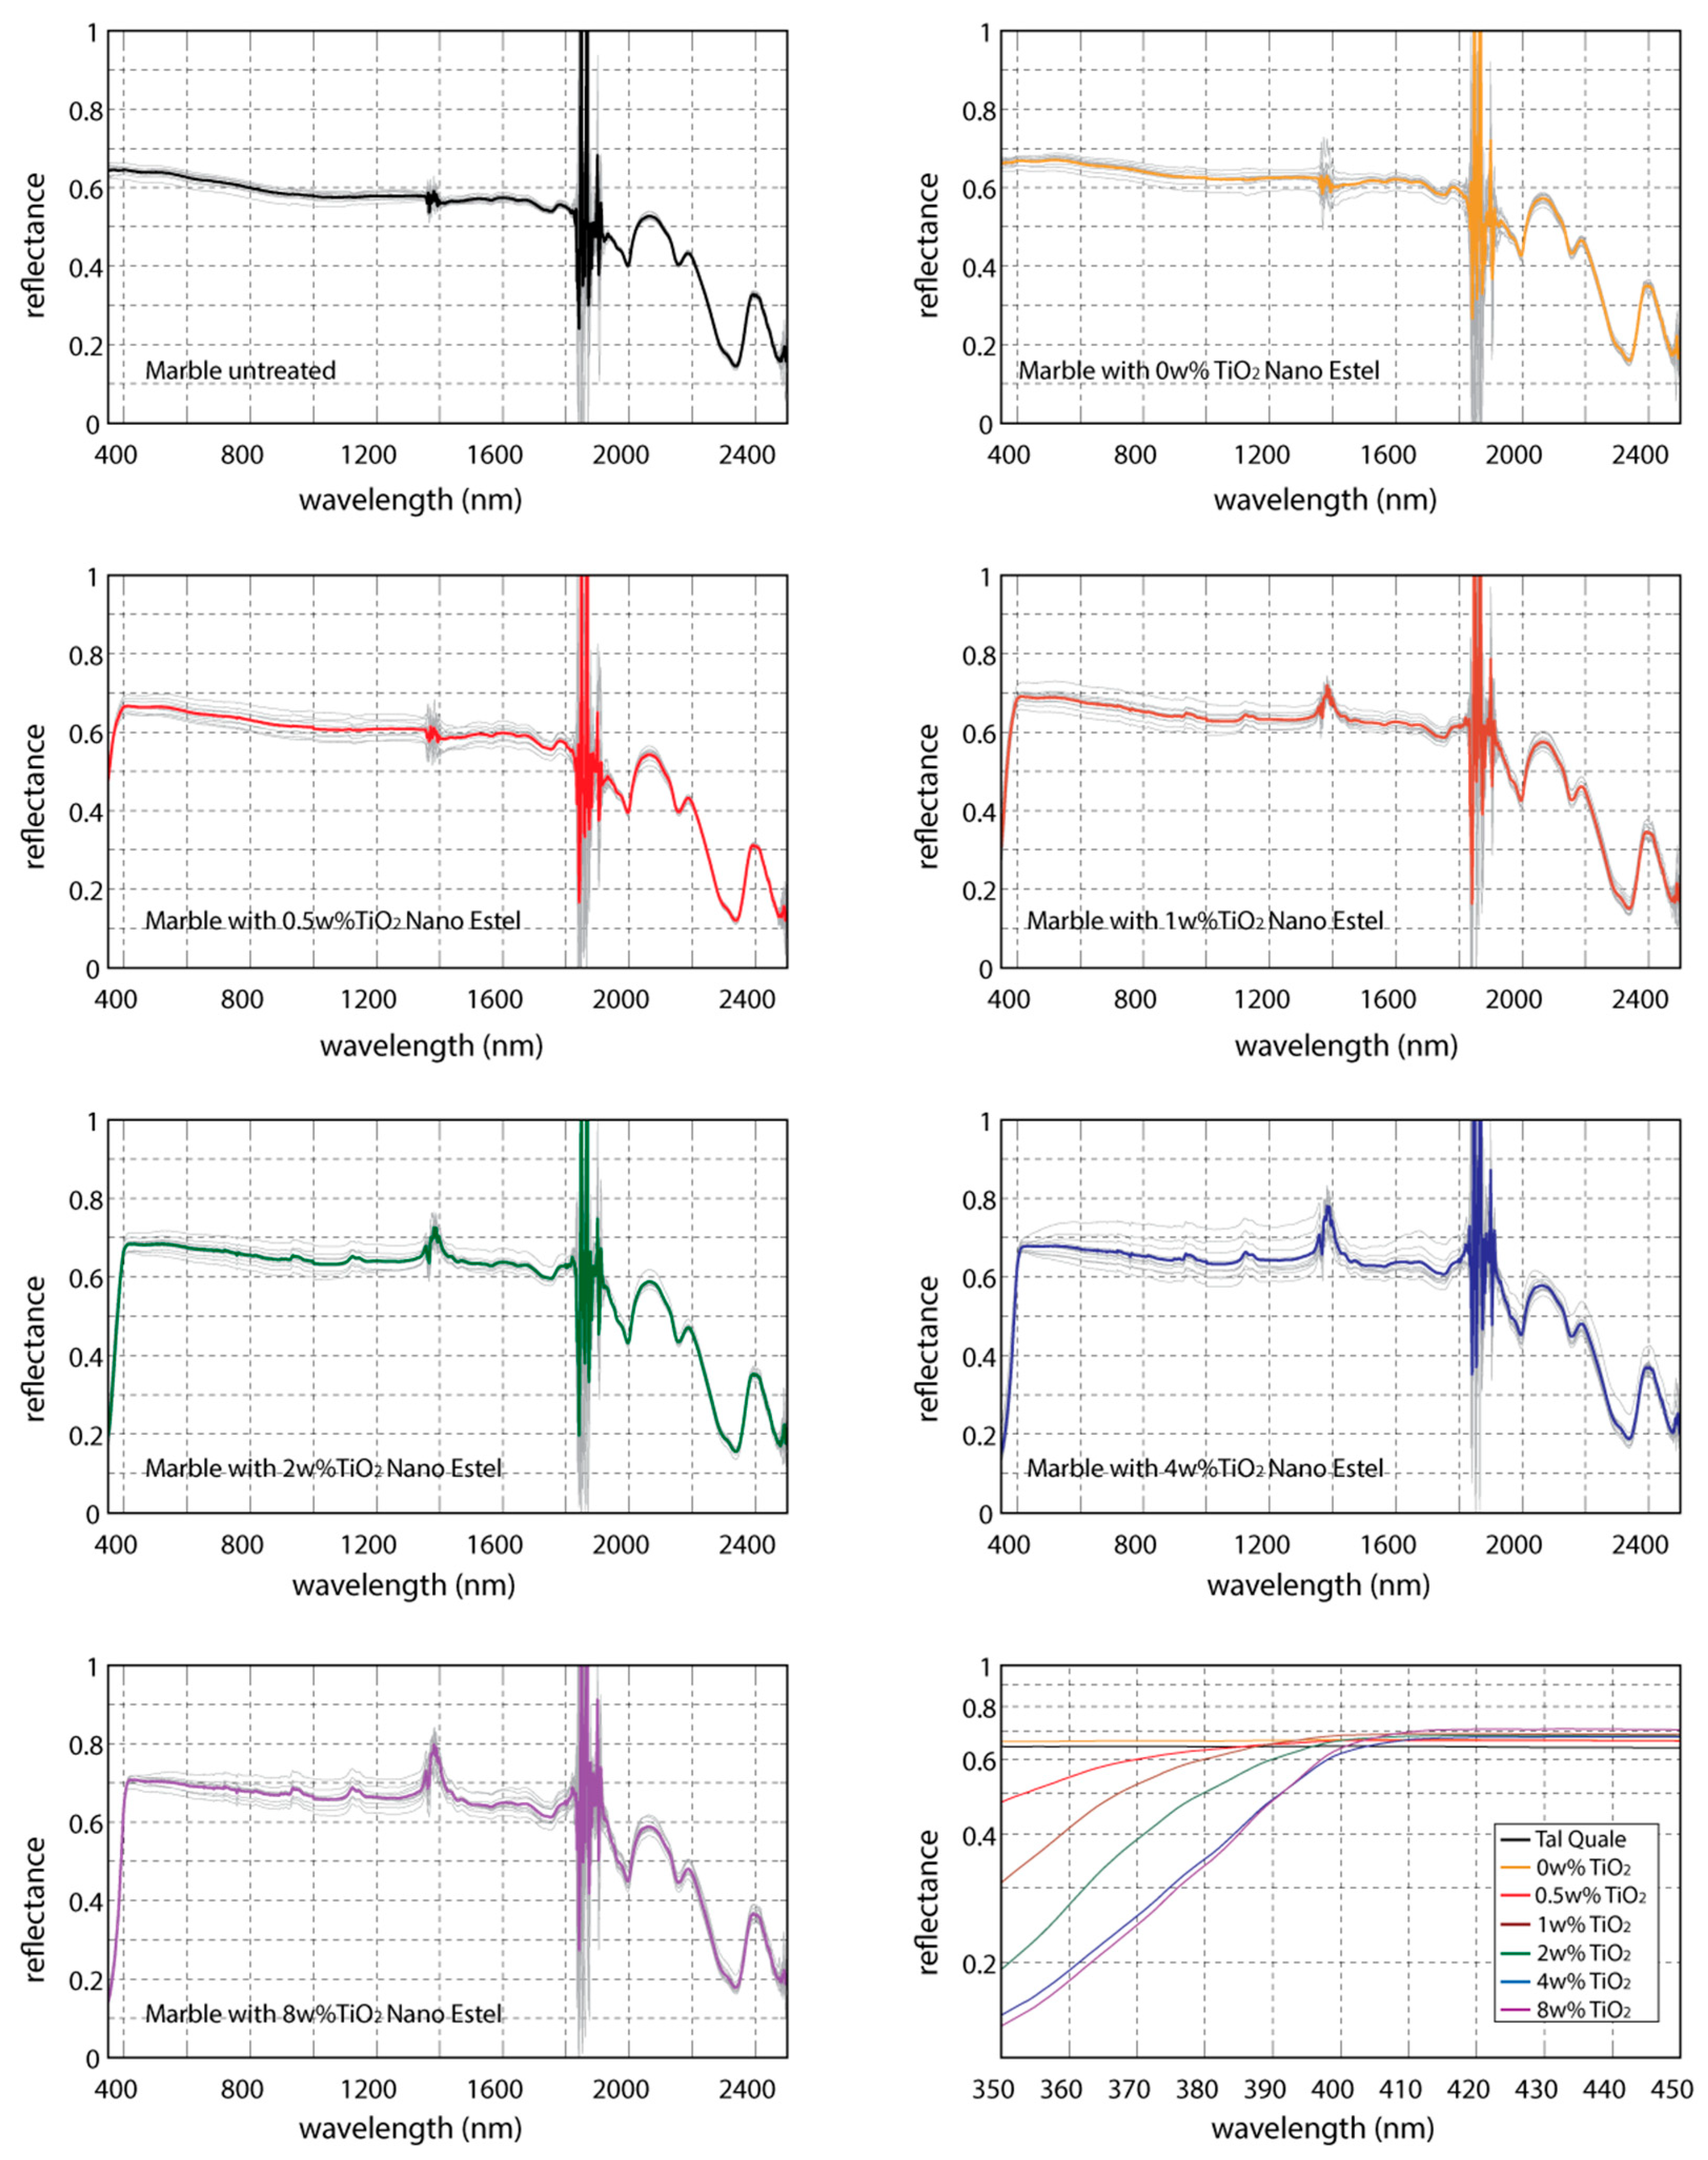
The
Figure 2 shows the spectral signatures obtained by marble samples superficially covered by NANOESTEL coating, varying the TiO
2 weight percentage. These measures are those collected on 15 June 2016. Note that the appreciable difference among the reflectance values are shown in the ultraviolet range (350–400 nm) of the electromagnetic spectrum, especially. This behavior is strongly linked to the presence of titanium dioxide: in fact, its spectral signature available in the ASTER spectral library [
6] allows to find very high slope already in the wavelength range from 400 nm to 410 nm, with a strong decrease of reflectance moving towards the ultraviolet range.
The comparison among the spectral signatures increasing the TiO
2 weight percentage (graph at the bottom right of
Figure 2) shows relevant differences for 0.5 w% respect to the coating without titanium and a similar shape for amount greater than 4 w%.
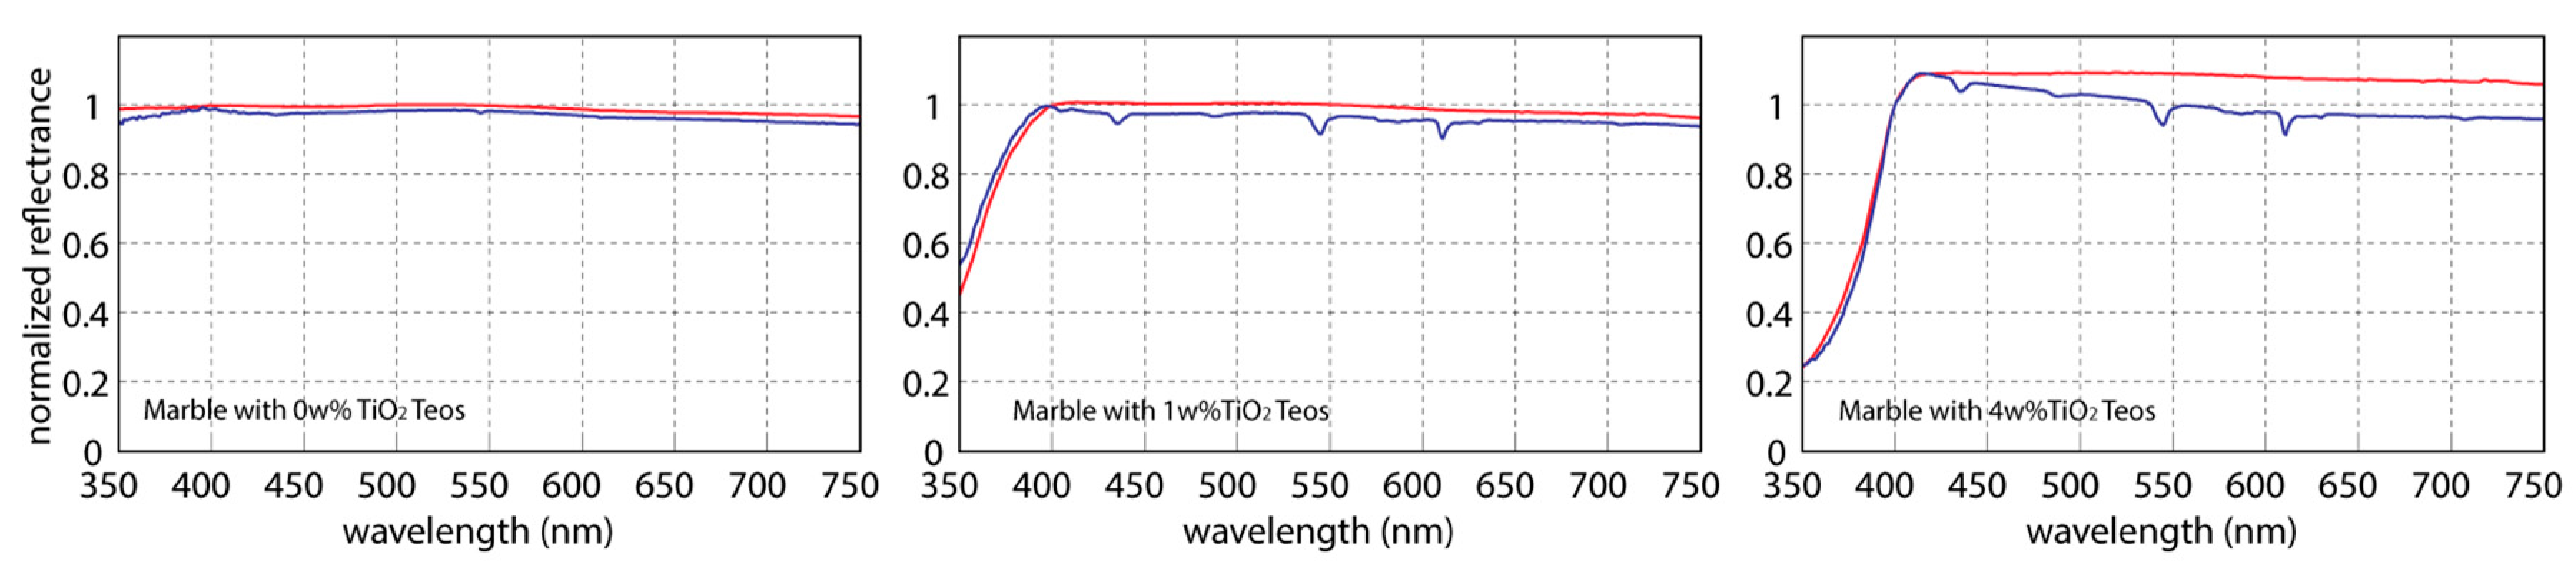
The comparison between the measures collected on the two different days show similar shapes of the normalized spectral signature: all reflectance values were divided by that at 400 nm wavelength for reducing the solar source effect. In particular, the
Figure 3 shows a substantive similarity of the average spectral shapes up to wavelength of 410 nm, even increasing the weight percentage of TiO
2.
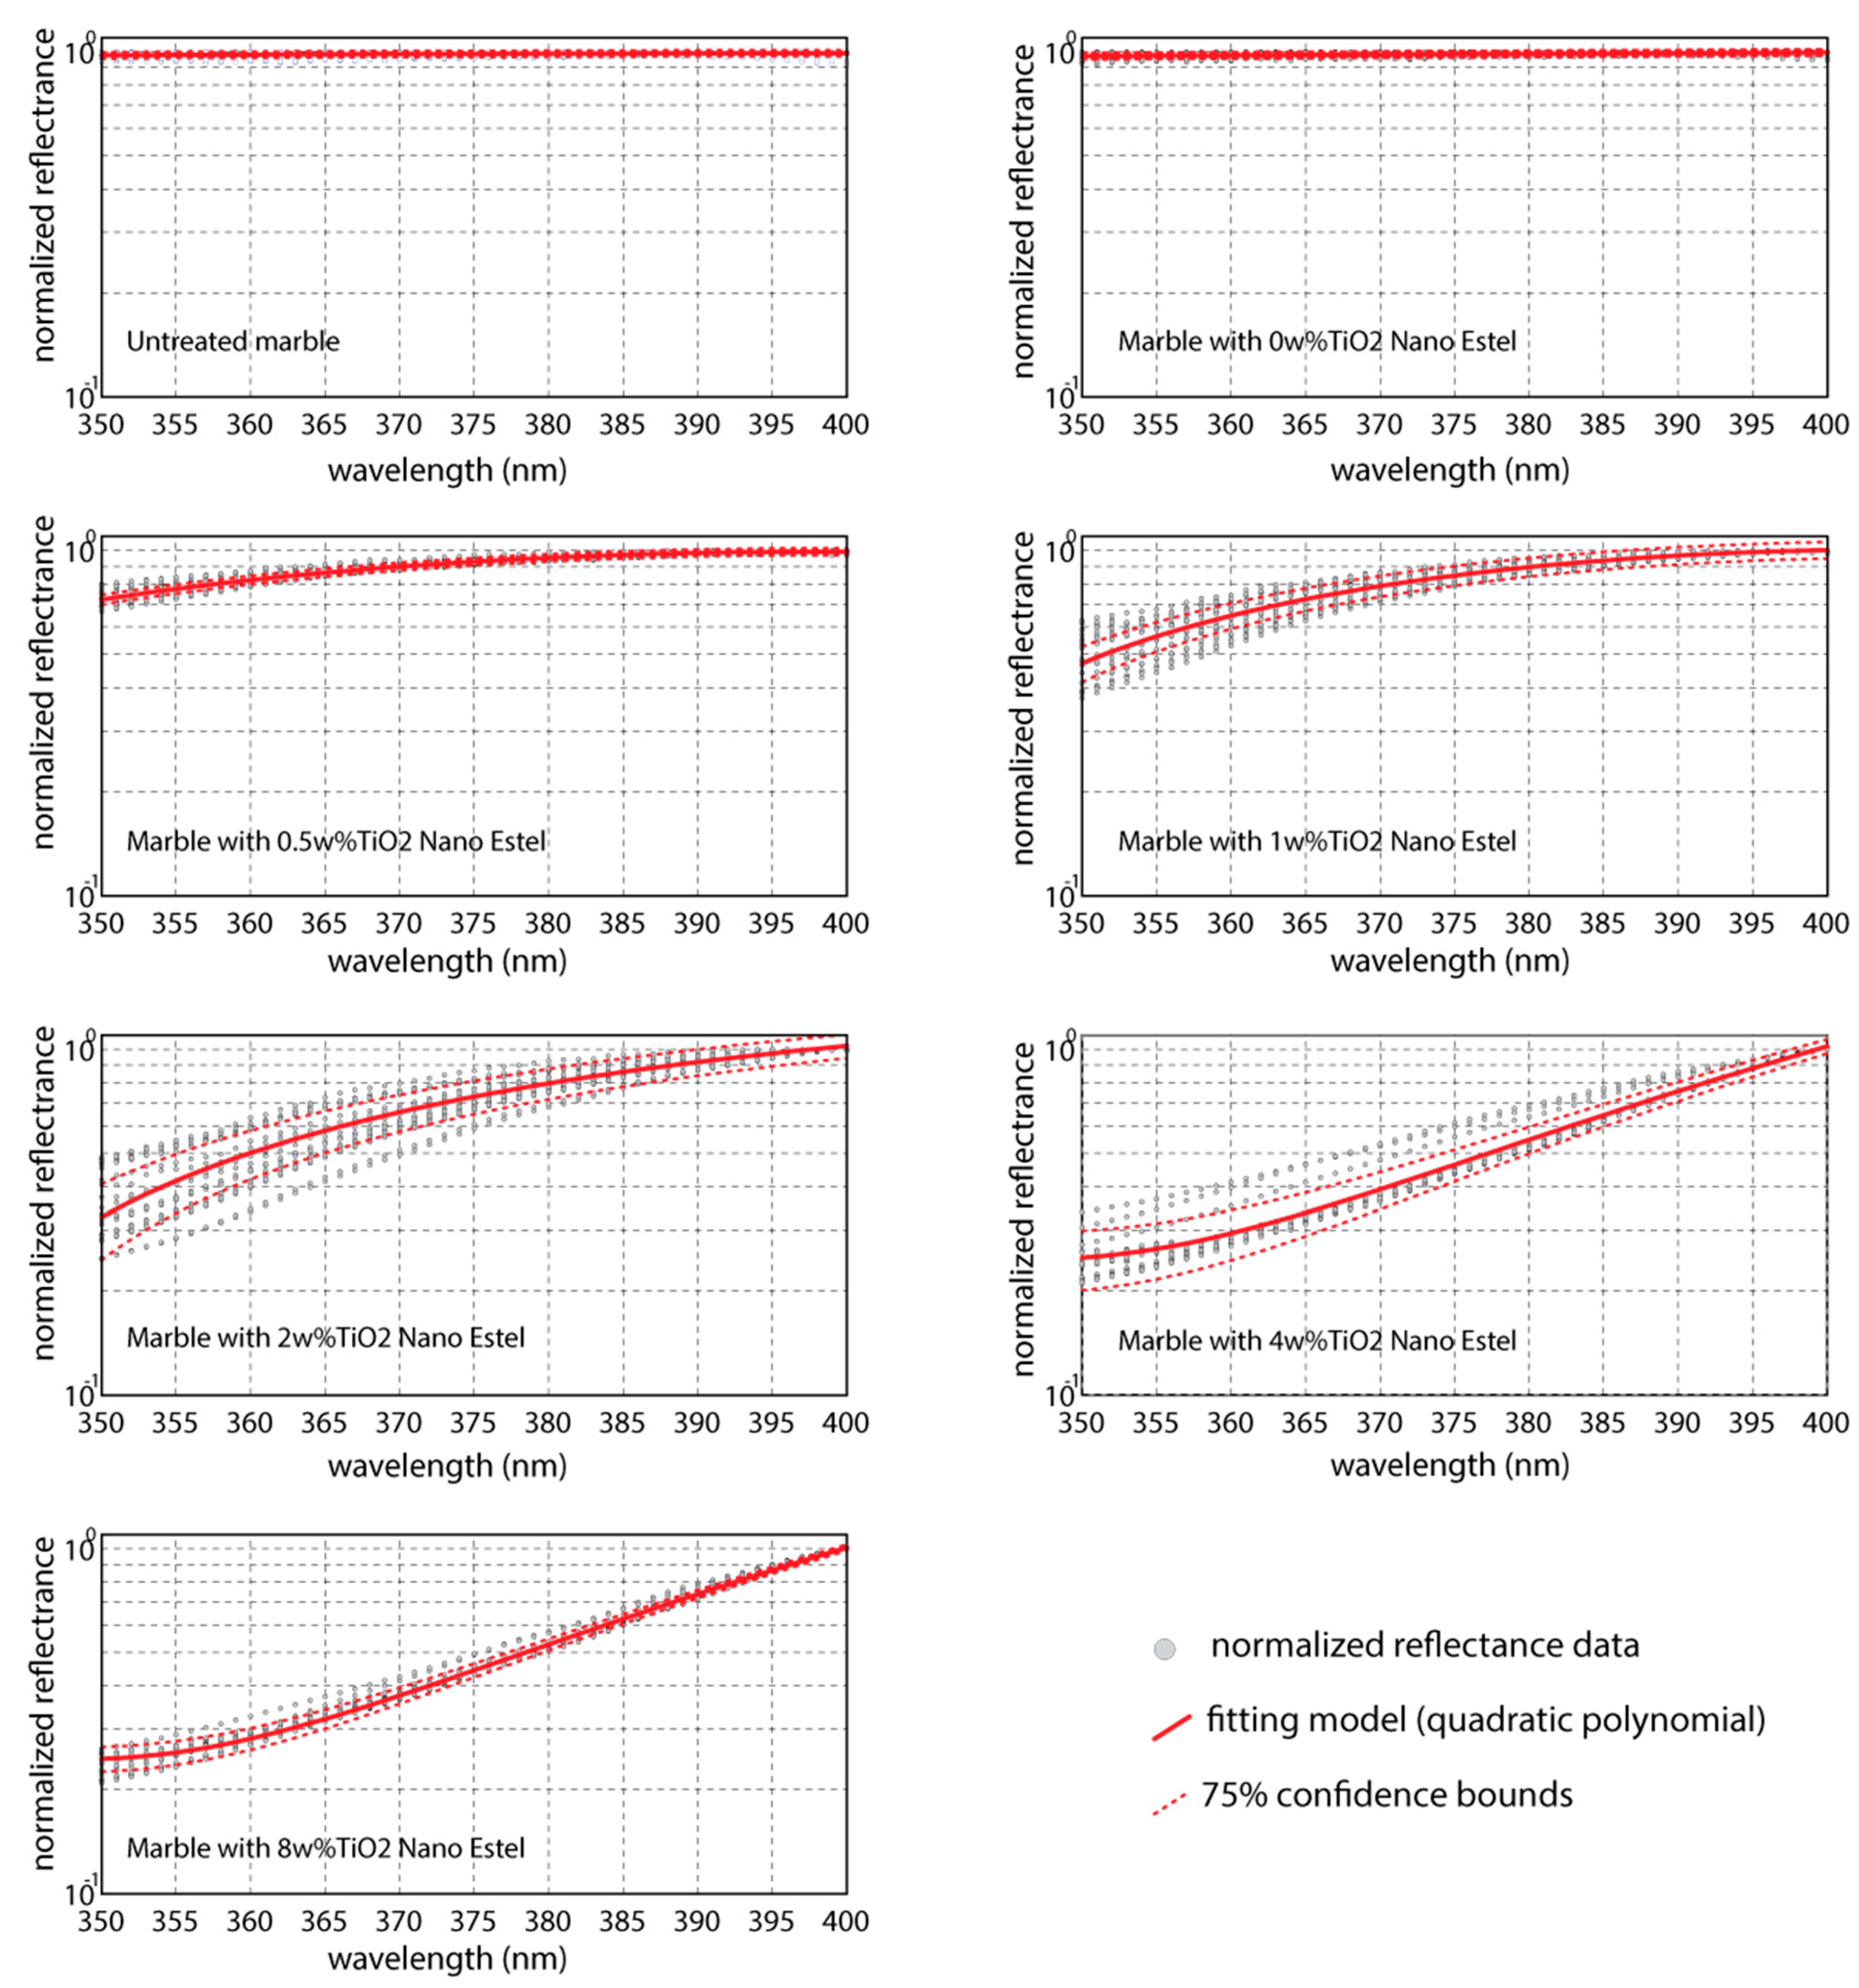
To obtain a representative model, for each TiO
2 weight percentage all data collected and normalized are interpolated through a quadratic polynomial with equation:
In Equation (1): R is reflectance normalized respect to that at wavelength of 400 nm, w is the wavelength, P1, P2 and P3 are the coefficients.
Based on normalized reflectance data, in
Figure 4 the fitting curves are reported for each TiO
2w% analyzed. In the same figure, also, the 75th percentile confidence bounds are indicate in order to assess the statistical reliability of the models. The coefficients obtained by regression of data and RMSE (Root Mean Square Error) for assessing goodness of fits are reported in
Table 1.
The observation of graphs and the analysis of errors seem to indicate a great reliability for TiO2 weight percentages lower than 1% and higher than 4%; although, for intermediate values of TiO2 w% a higher dispersion of the data is encountered, also in these cases good results are shown (R-squared > 0.897). Moreover, curves for TiO2 4 w% and 8 w% are not statistically different.
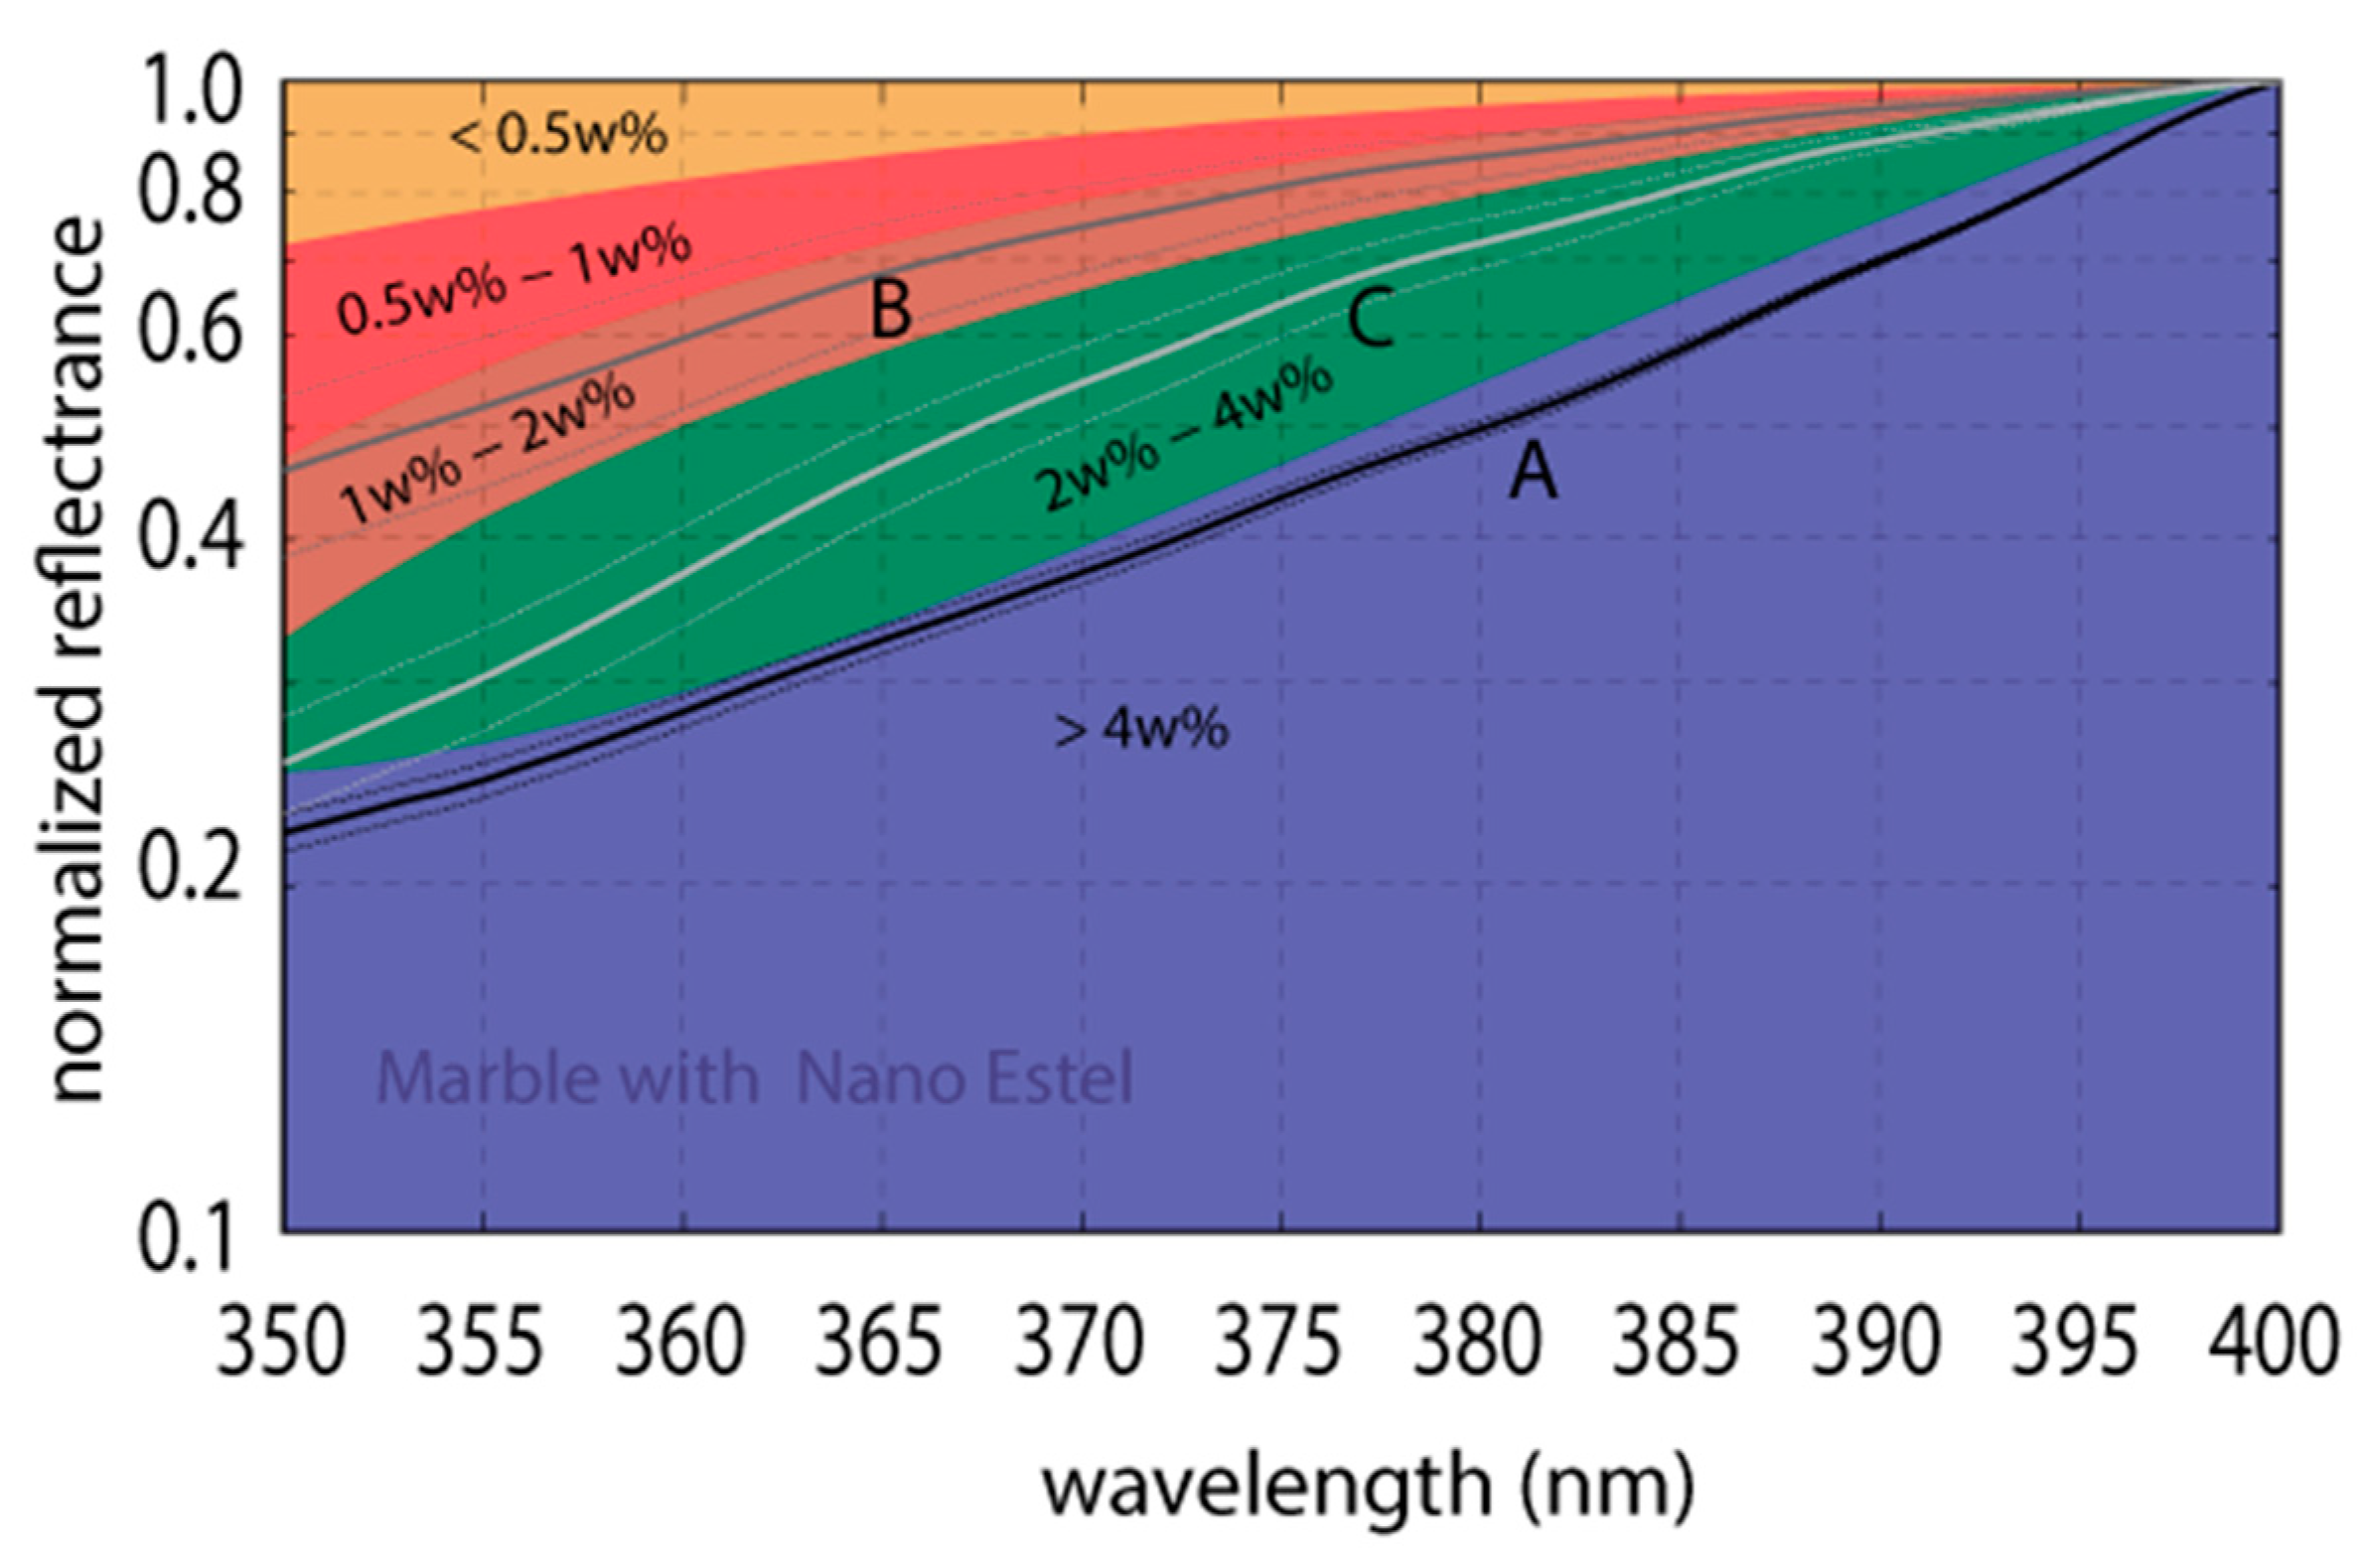
Based on the results, the control chart in
Figure 5 was obtained from the fitting curves, in order to assess the TiO
2 w% from field spectroradiometric survey in the range 350–400 nm.
The procedure was applied on three samples (named A, B and C in
Figure 5) with unknown percentage of titanium dioxide. The first comparisons between the values provided by preparation laboratory and those resulting from the proposed model seem to show promising results (cf. values reported in
Table 2).
4. Conclusions
In this work, coatings with NANOESTEL, blended to different weight percentages of the TiO2, were applied on marble samples and tested through field spectroradiometric survey. The results were useful to develop a procedure both to check the application phase of the product on the Cultural Heritage and to control the coating state on the based stone, over time.
In the data processing, simple quadratic polynomials were used to interpolate hyperspectral data, and to build a control chart able to provide a fast response about the TiO2 weight percentage by field surveys, directly. The study was focused on the data analysis in the 350–400 nm wavelength range, where the influence of titanium dioxide appears more evident, further analyses are under development to verify possible effects on other spectrum ranges.
Forthcoming developments in this study concern the compared analyses of field hyperspectral data obtained by marble and travertine stones coated with different nanoparticles products (NANOESTEL, TEOS, etc.). Furthermore, applications of the proposed procedure to artifacts and facades, directly exposed to weather, biological and chemical changes, will be evaluated.

 ,
, 


