
Evaluation of Phytochemical & Antimitotic Potential of Annona Reticulata Extracts by Onion Root Model †

 ,
,
Abstract
:1. Introduction
2. Material and Methods
2.1. Collecting the Material (Leaves)
2.2. Sample Preparation
2.3. Identification of Acetogenin by Using Kedde Reagent
2.4. Phytochemical Investigation of the A. reticulata Leaves Extracts and Fractions
Qualitative Phytochemical Tests
2.5. Characterization of the Leaf Extract
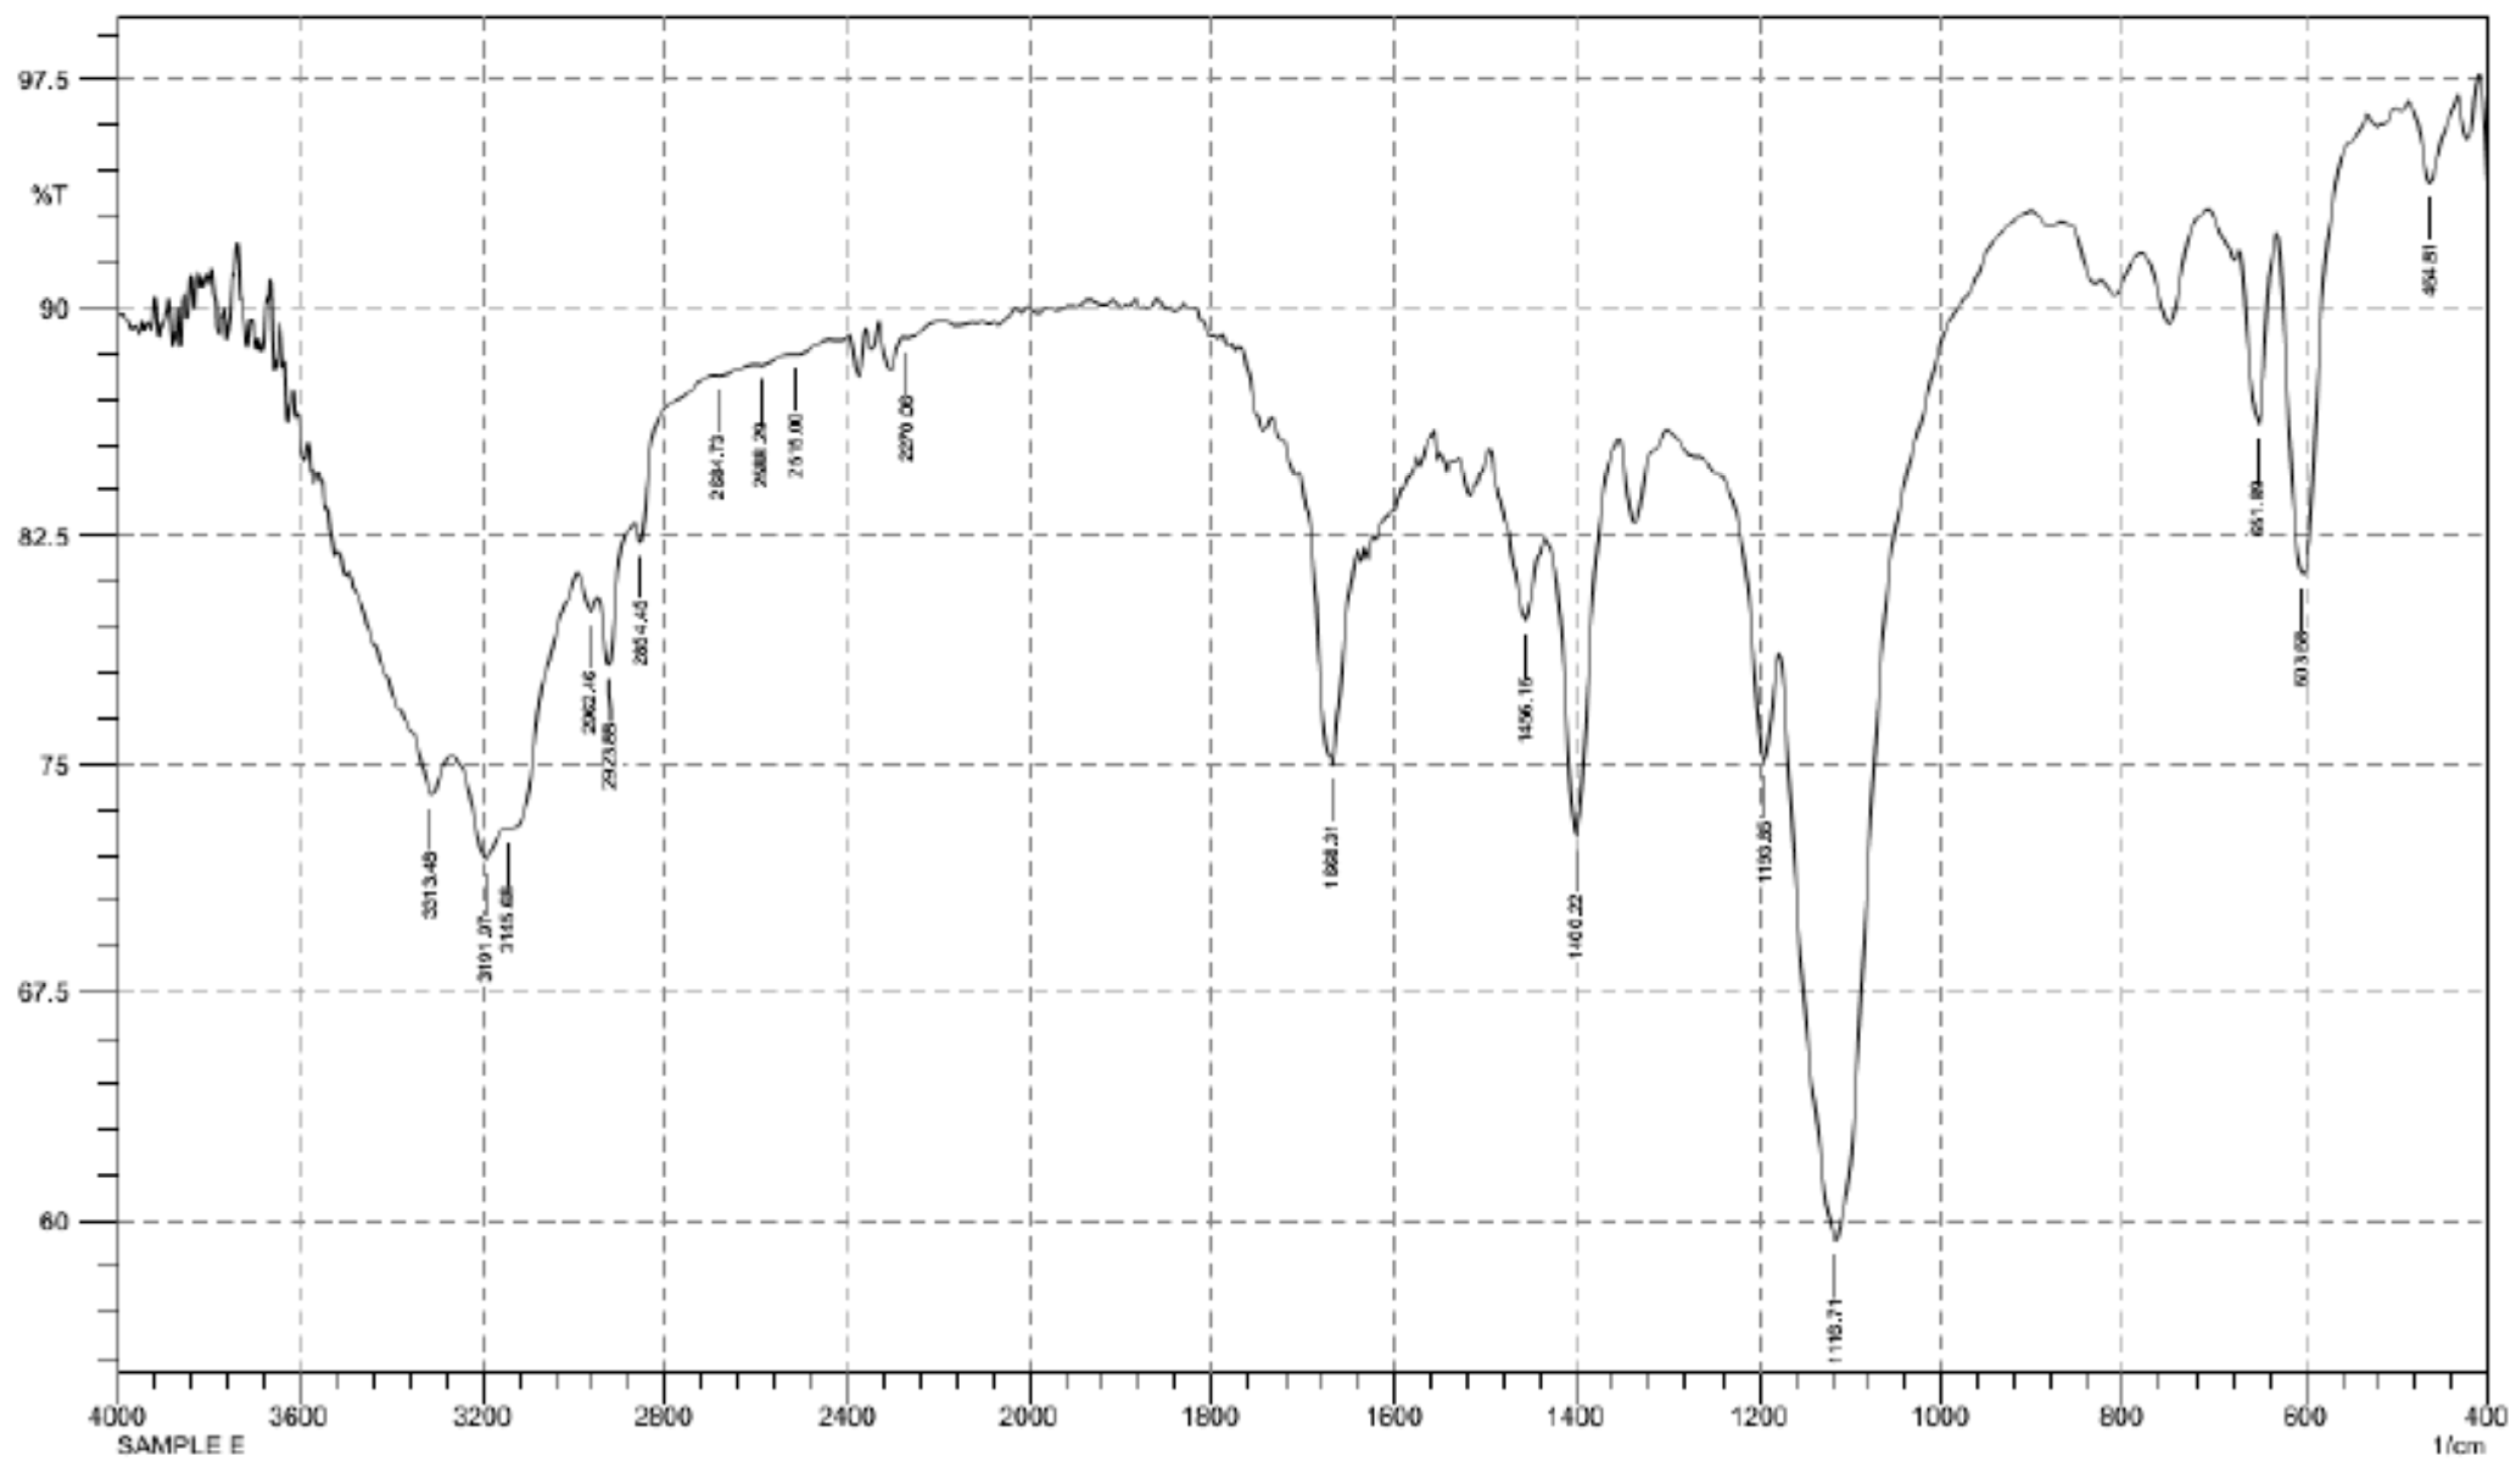
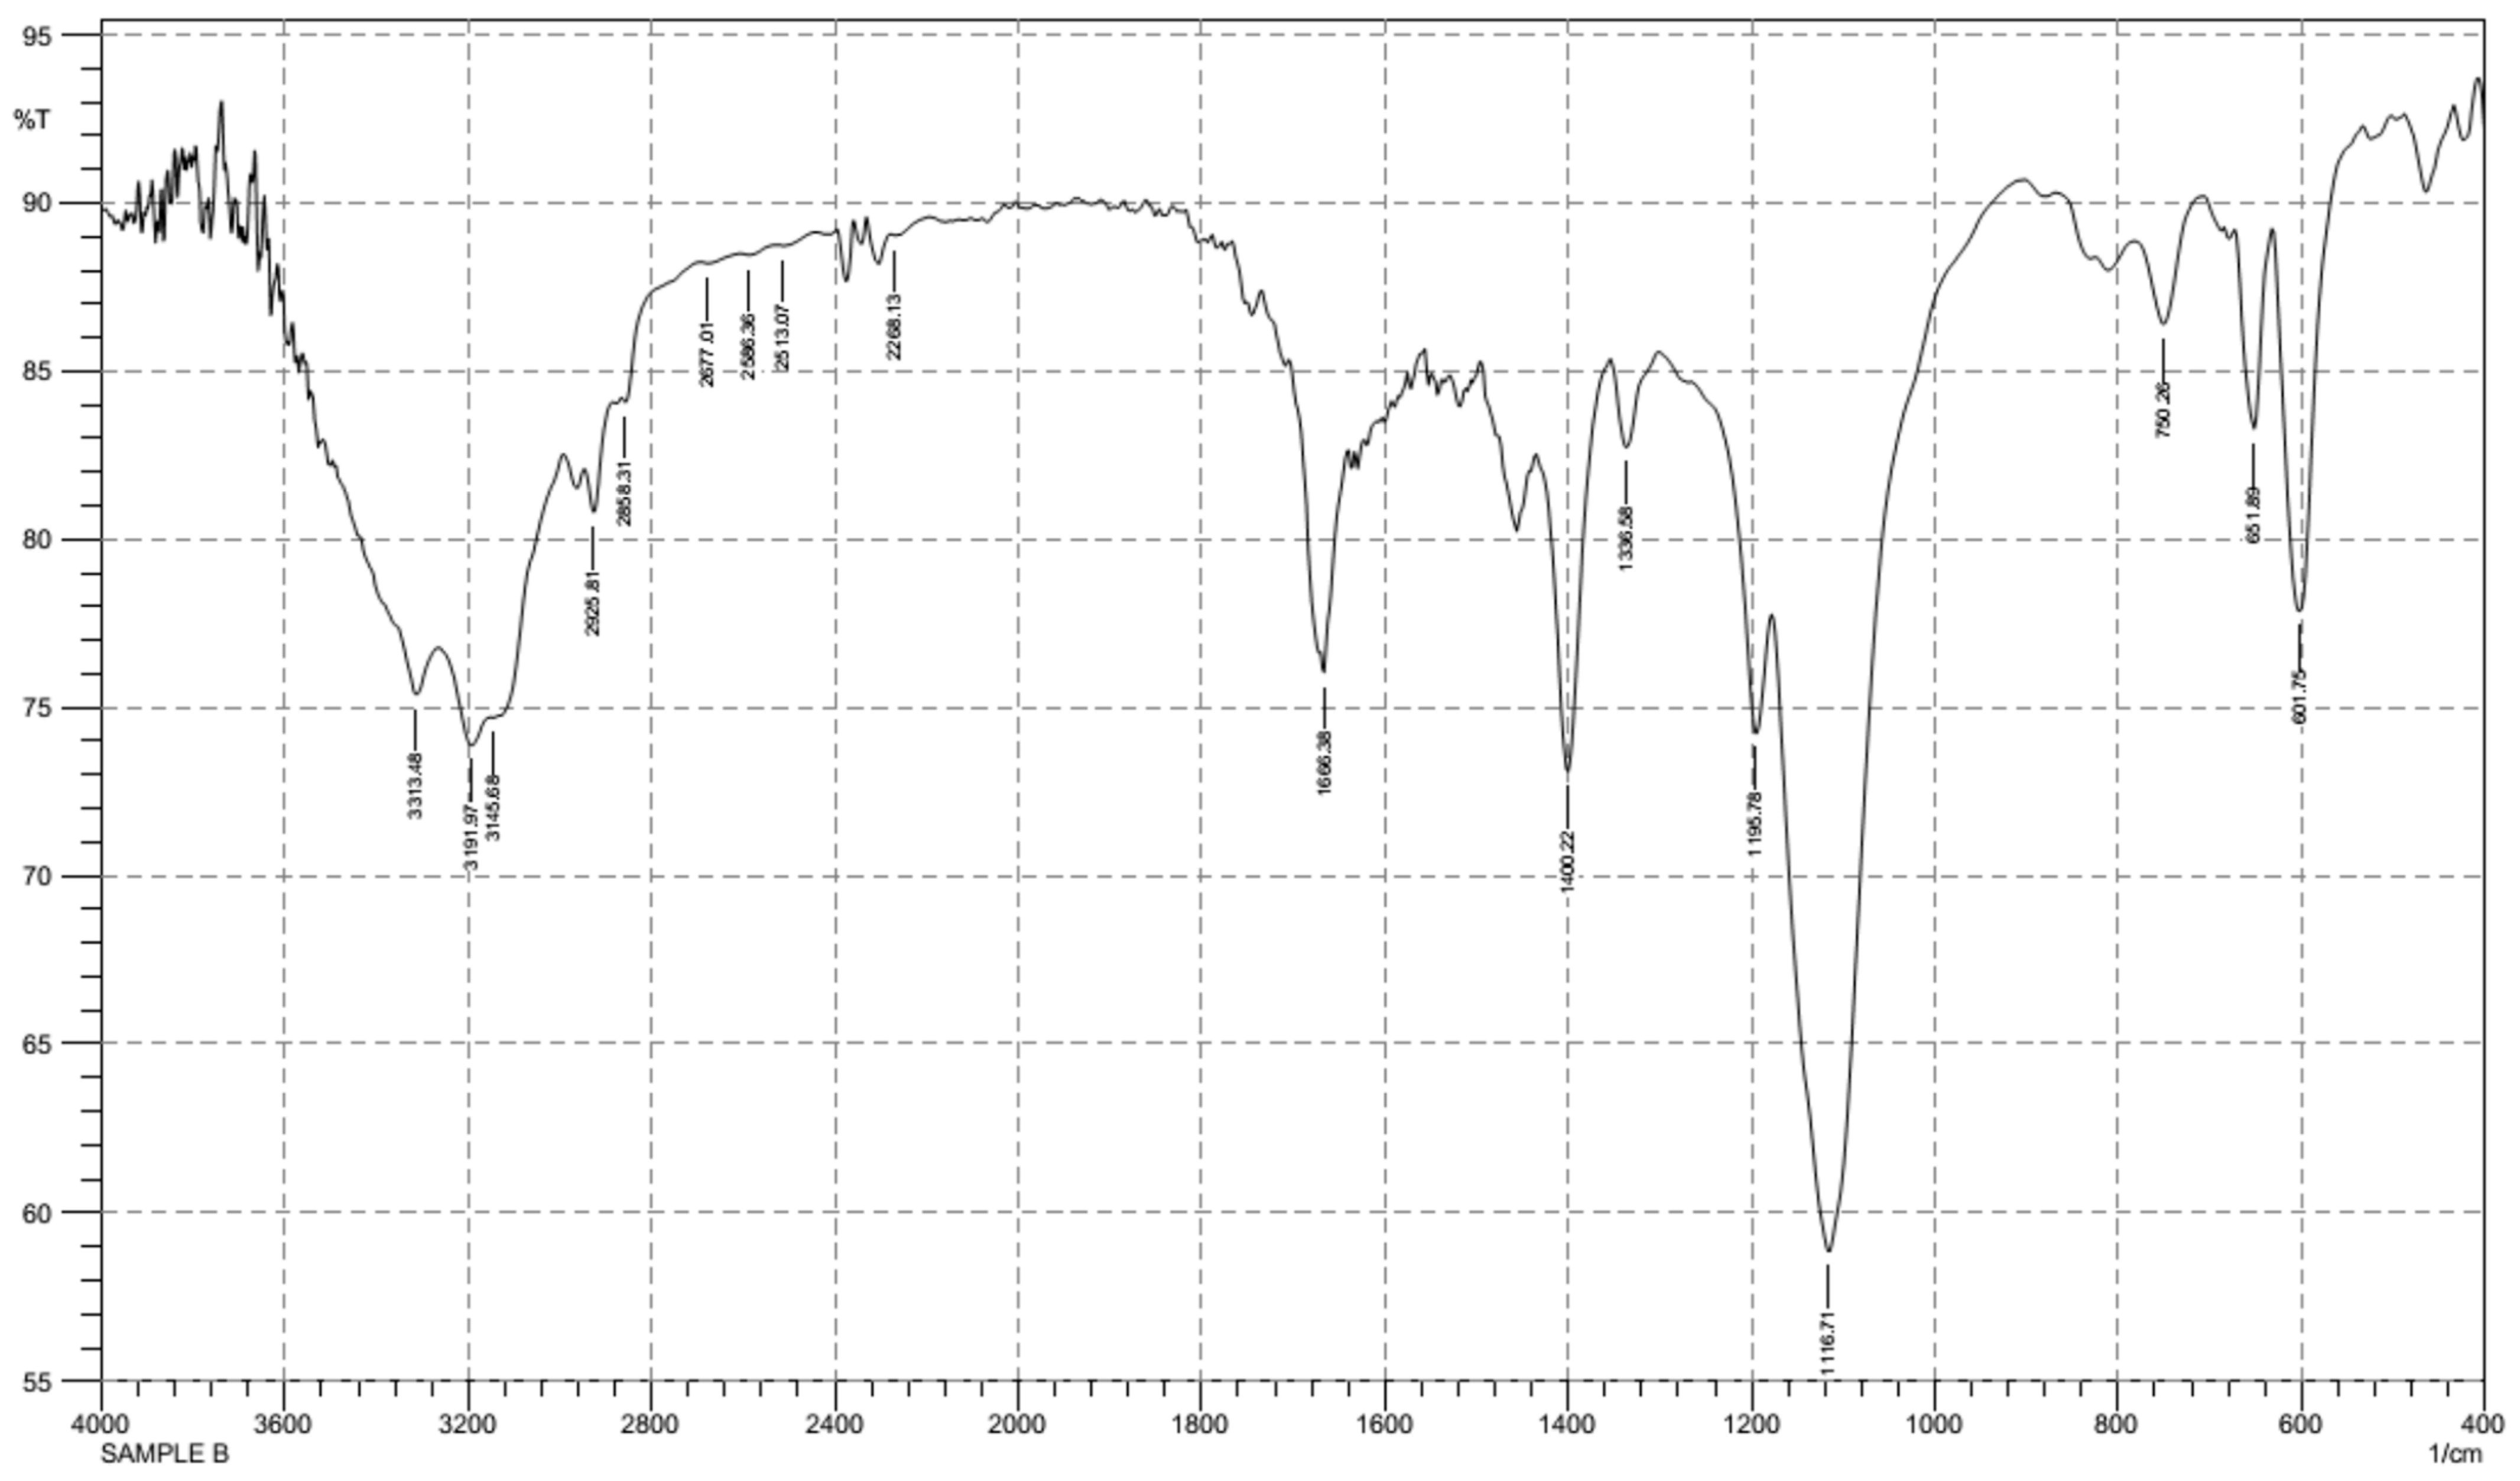
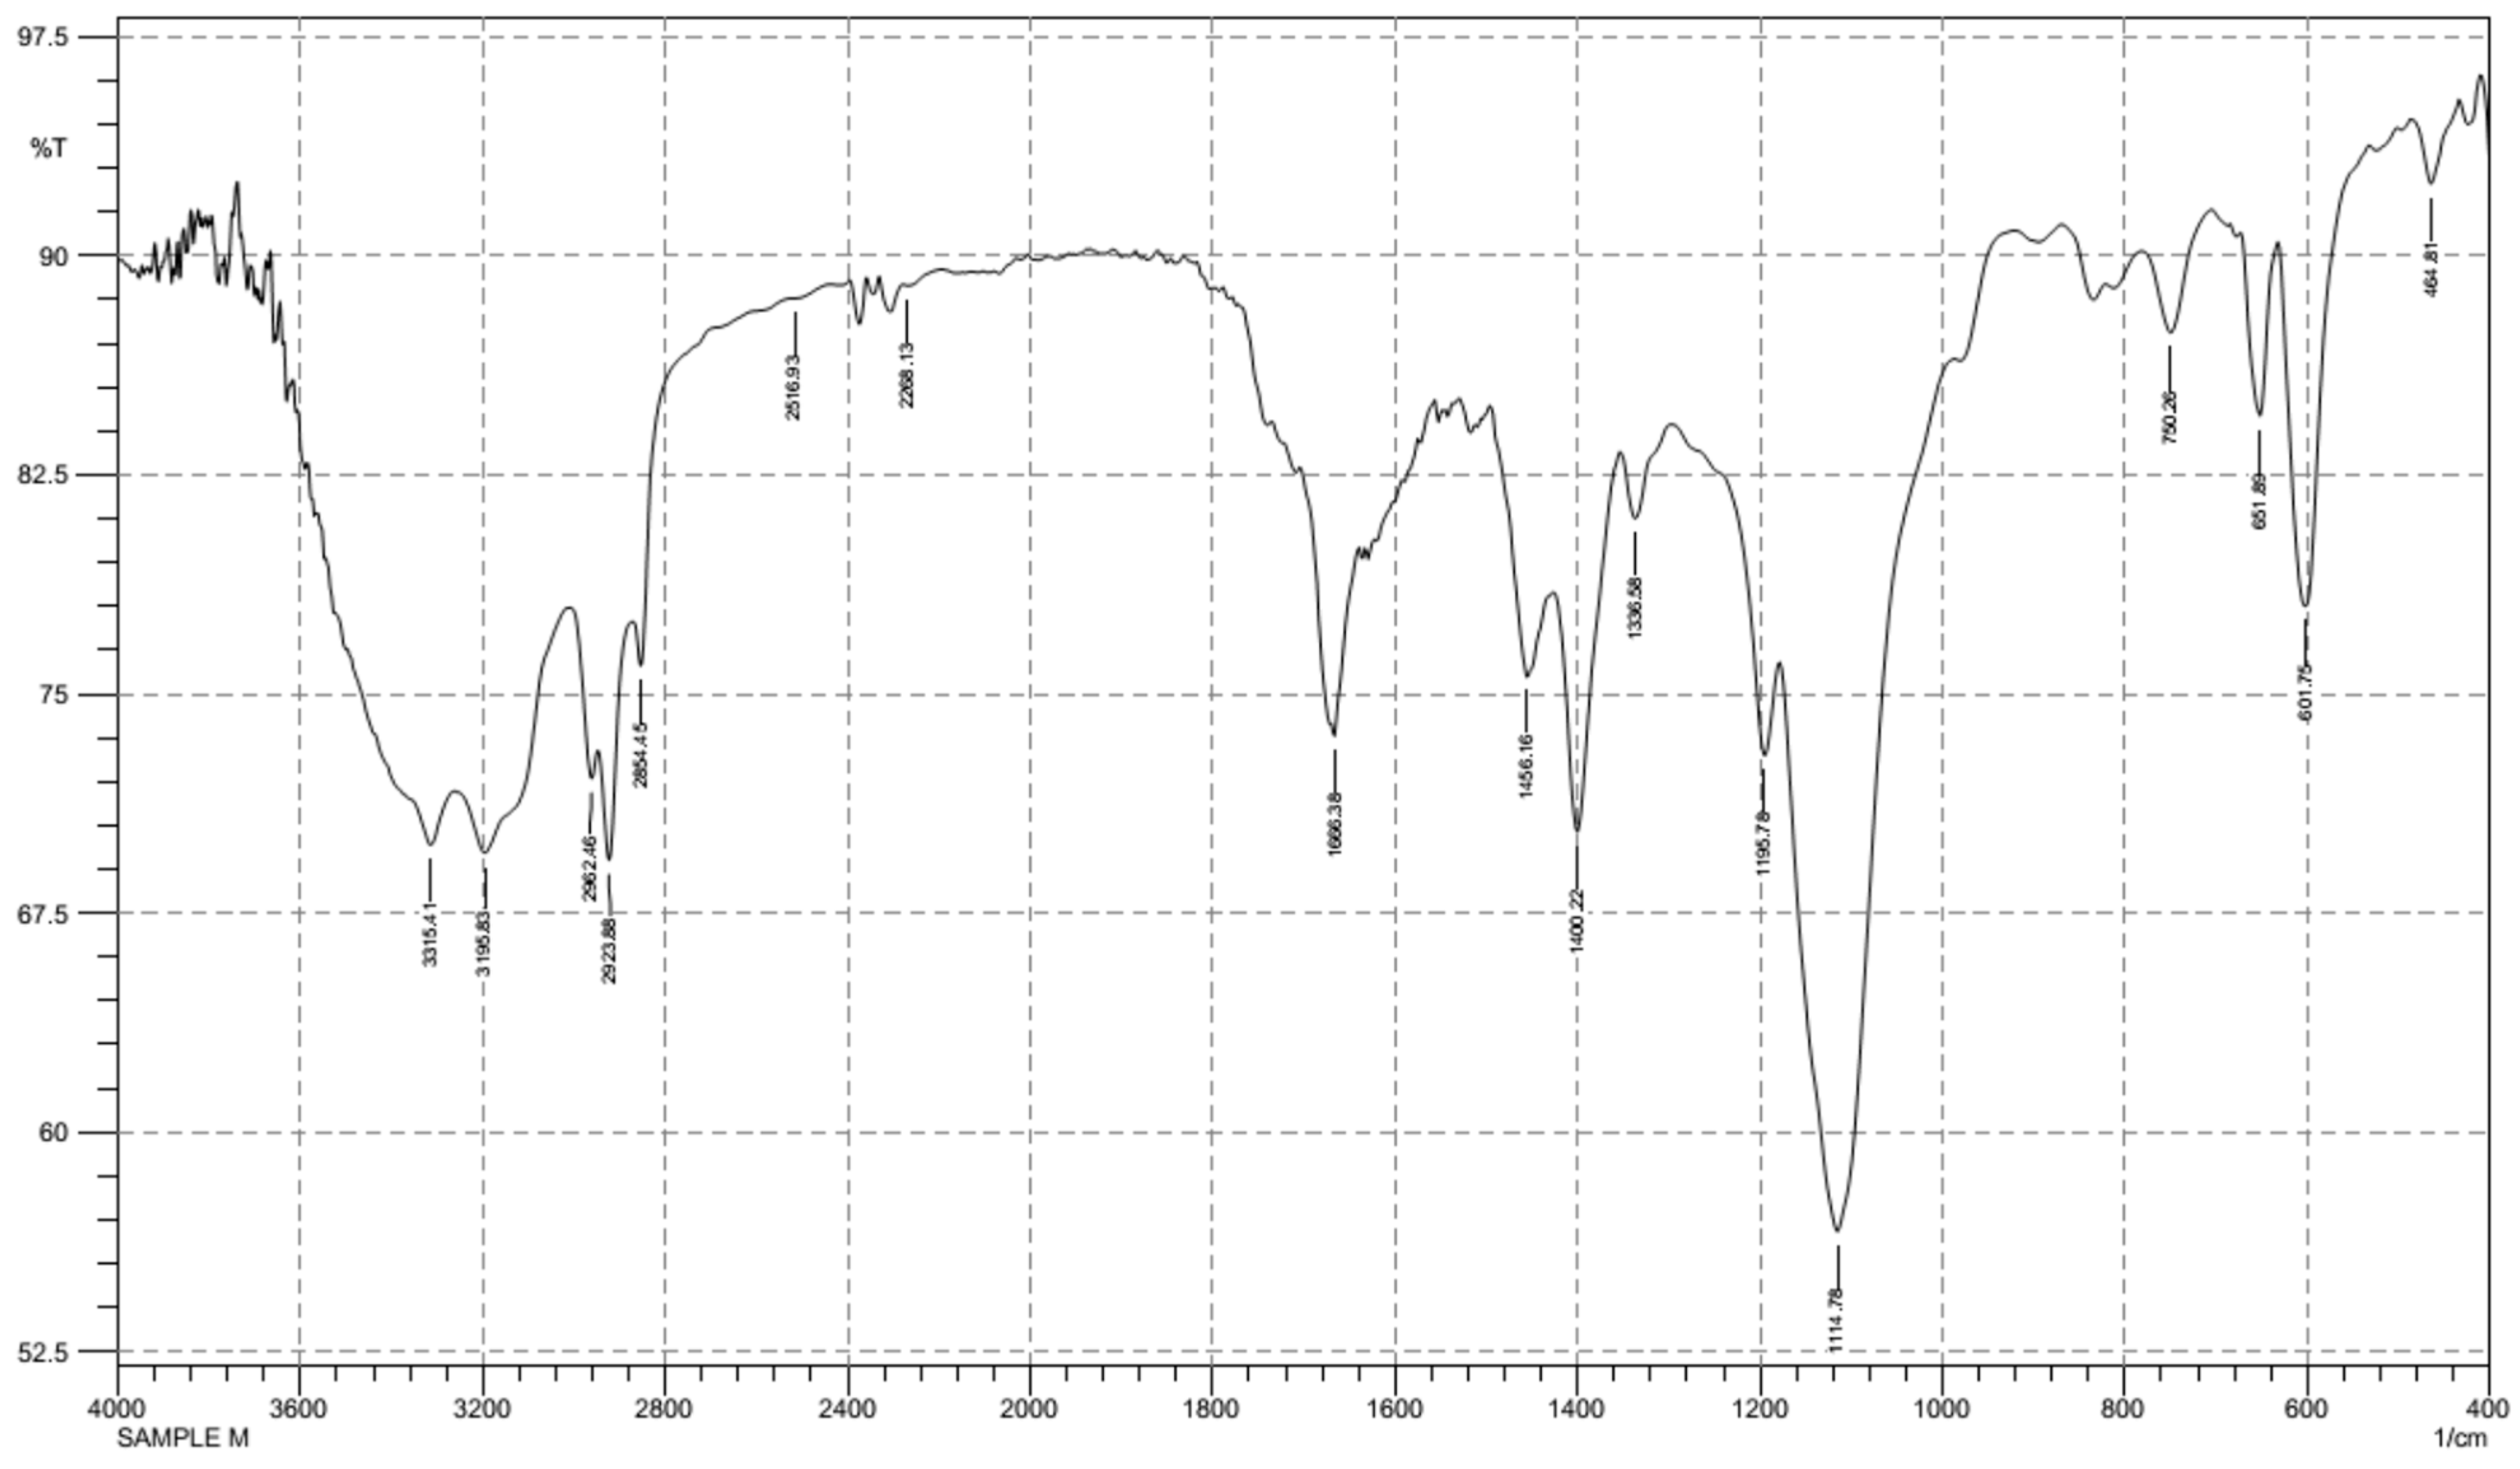
FT-IR Spectroscopy
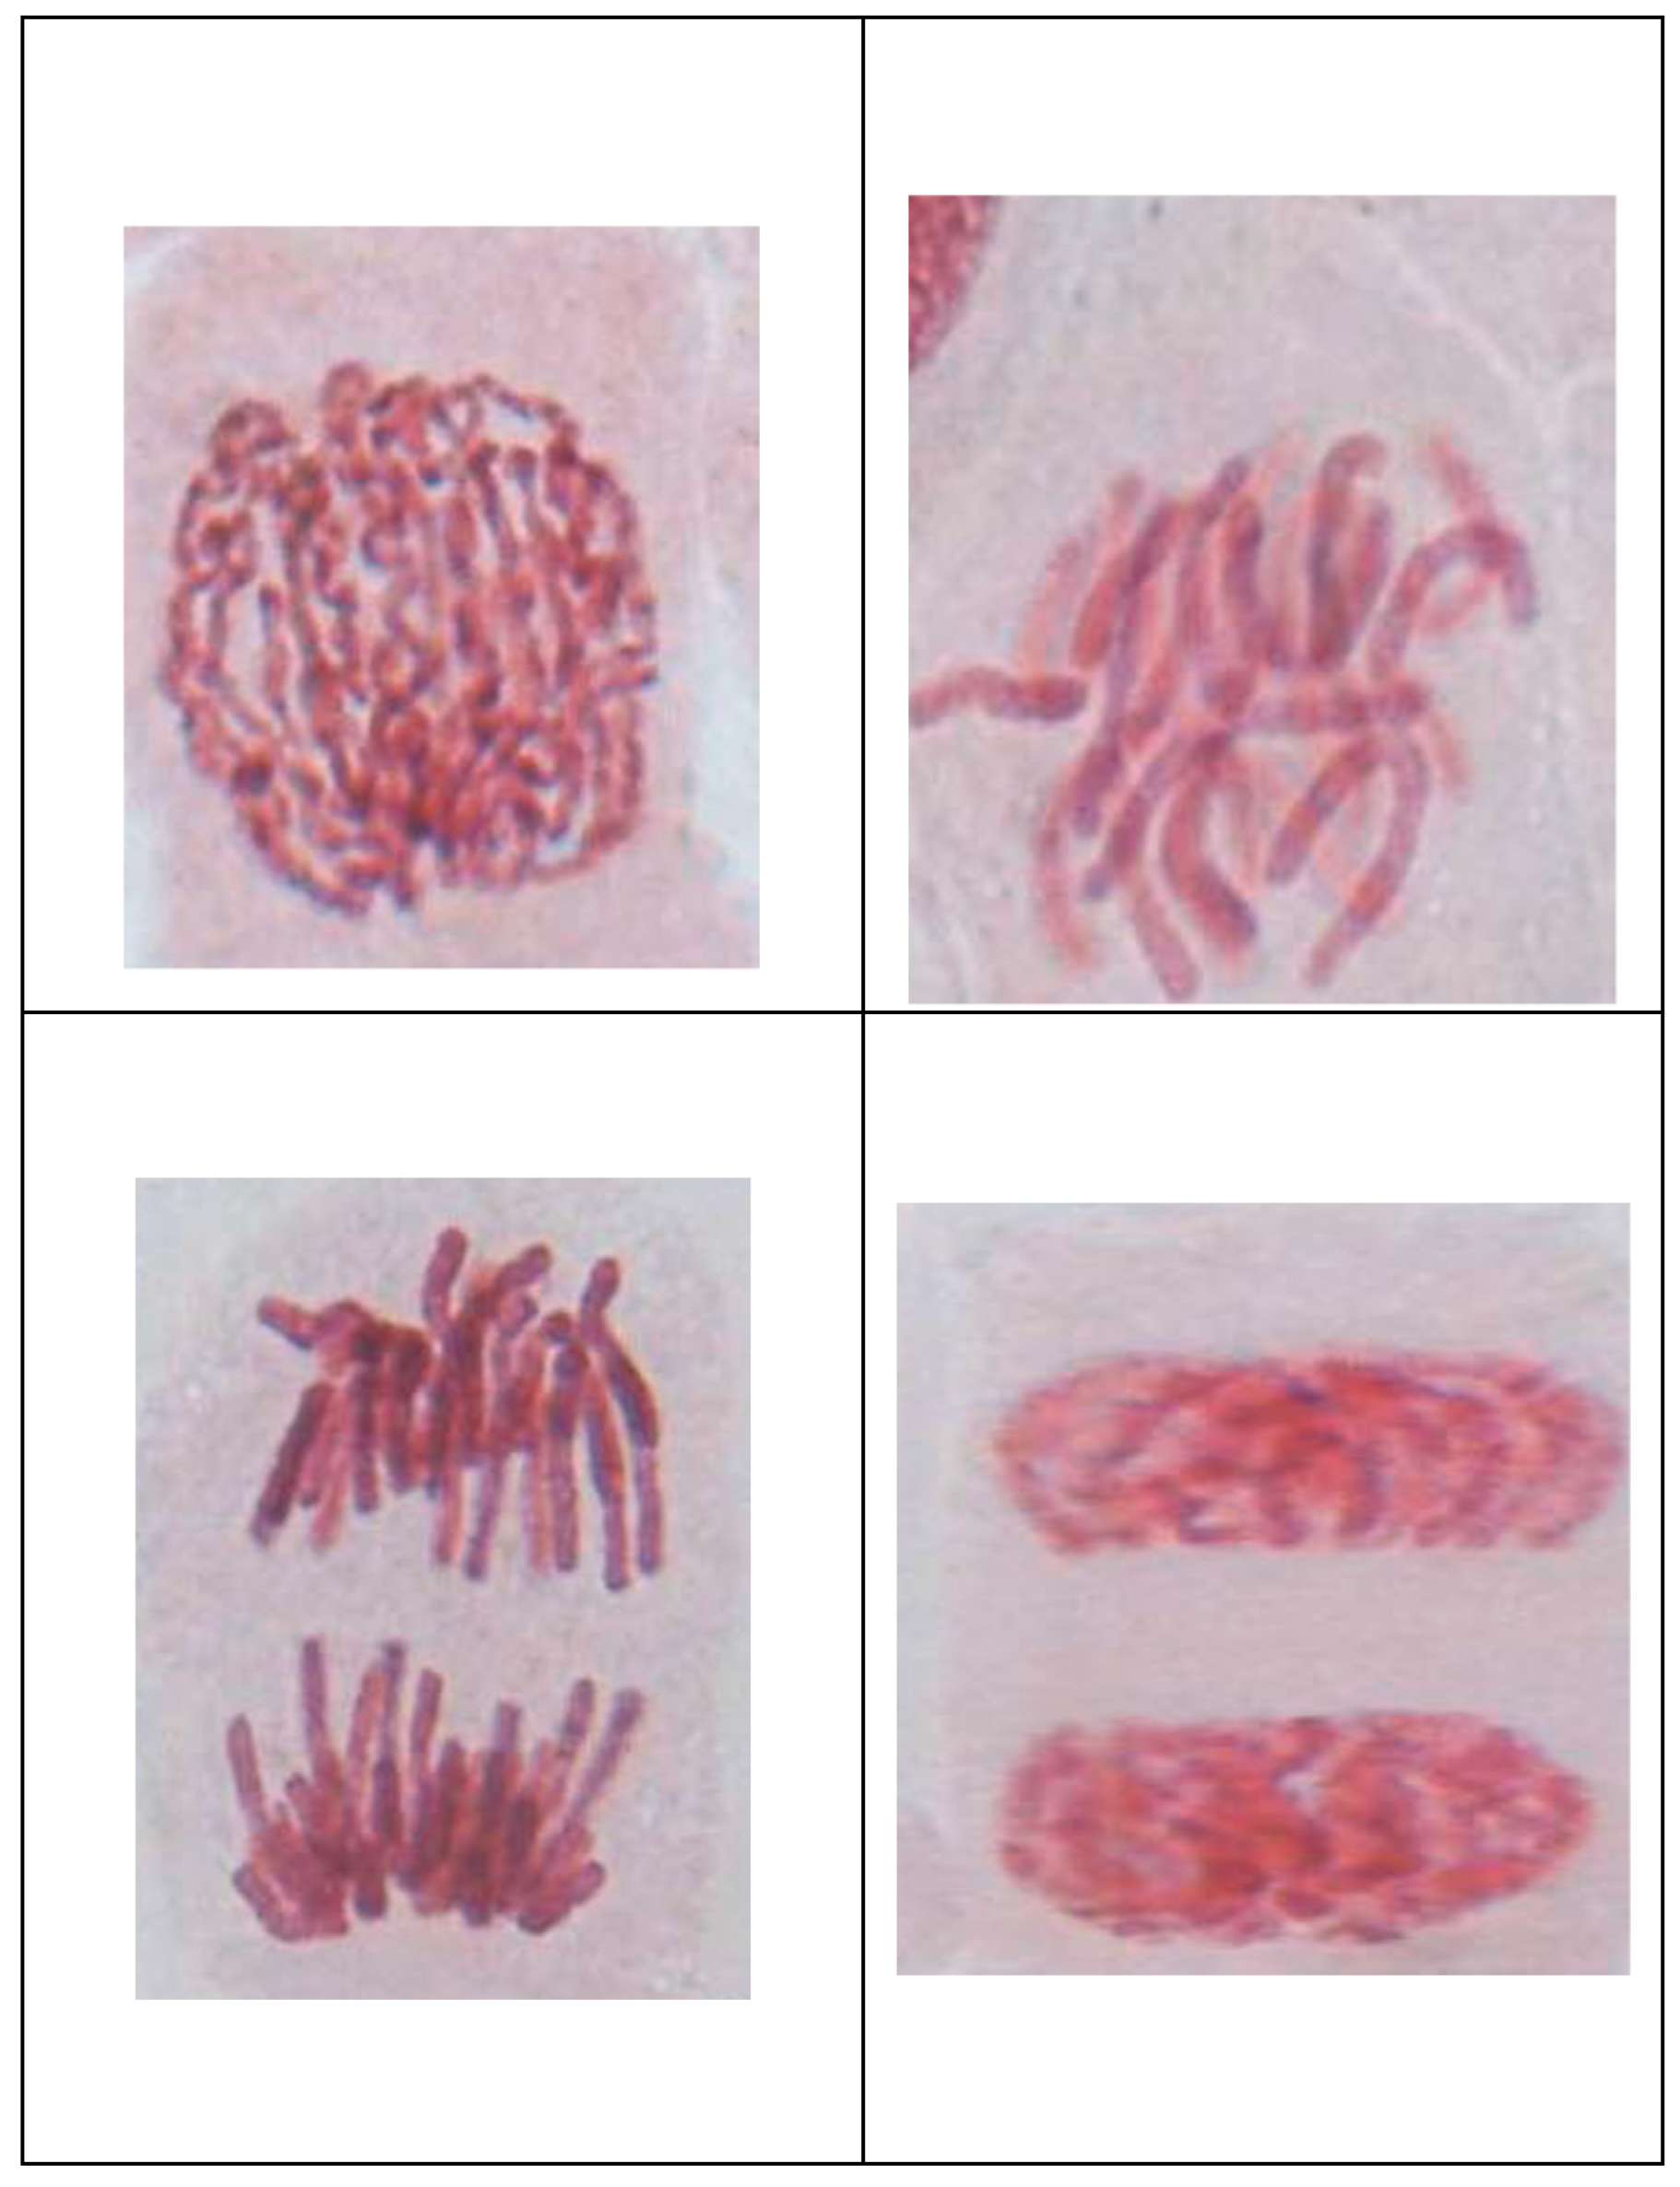
2.6. Allium Cepa Root Cap Cells Preparation
2.7. Analysis of Cytotoxicity and Genotoxicity
- (i)
- (ii)
3. Results
3.1. Isolation of Acetogenin by Column Chromatography
3.2. FT-IR Spectroscopy
4. Discussion
5. Conclusions
Supplementary Materials
Institutional Review Board Statement
Informed Consent Statement
Data Availability Statement
Conflicts of Interest
References
- Prasad, G.J.; Amruta, S.W.; Ashish, D.K.; Priti, S.T.; Mohan, G.K. Assessment of Annona reticulata Linn. leaves fractions for in vitro antioxidative effect and antimicrobial potential against standard human pathogenic strains. Alex. J. Med. 2015, 52, 19–25. [Google Scholar]
- Soumya, P.R.; Durga, M.K.; Santosh, B.M.; Sharada, P.S. Anti-hyperglycemic effect Annona reticulata L. leaves on experimental diabetic rat model. Asian J. Pharm. Clin. Res. 2013, 6, 56–60. [Google Scholar]
- Ndiaye, M.; Sy, G.; Dièye, A.; Touré, M.; Faye, B. Evaluation de l’activité anti-inflammatoire de feuillesd’annona reticulata (annonaceae) sur l’œdèmeaigu de la patte de rat induitpar la carragénine. Pharm. Méd. Trad. Afr. 2006, 15, 179–186. [Google Scholar]
- Sheetal, S.C.; Sanjay, R.C.; Machindra, J.C. Analgesic, anti-inflammatory and anti-arthritic activity of Cassia uniflora Mill. Asian Pac. J. Trop. Biomed. 2012, 2, S181–S186. [Google Scholar]
- Nirmal, S.A.; Gaikwad, S.B.; Dhasade, V.V.; Dhikale, R.S.; Kotkar, P.V.; Dighe, S.S. Anthelmintic activity of Annona reticulata leaves. Res. J. Pharm. Biol. Chem. Sci. 2010, 1, 115–118. [Google Scholar]
- Chavan, M.J.; Kolhe, D.R.; Wakte, P.S.; Shinde, D.B. Analgesic and anti-inflammatory activity of Kaur-16-en-19-oic acid from Annona reticulata L. bark. Phytother. Res. 2012, 26, 273–276. [Google Scholar] [CrossRef]
- Ngbolua, K.N.; Mudogo, V.; Mpiana, P.T.; Malekani, M.J.; Rafatro, H.; Ratsimamanga, U.; Takoy, L.; Rakotoarimana, H.; Tshibangu, D.S.T. Evaluation de l’activité anti-drépanocytaire et antipaludique de quelquestaxonsvégétaux de la Républiquedémocratique du Congo et de Madagascar. Ethnopharmacologia 2013, 50, 19–24. [Google Scholar]
- Suresh, H.M.; Shivakumar, B.; Shivakumar, S.I. Phytochemical Potential of Annona reticulata Roots for Antiproliferative Activity on Human Cancer Cell Lines. Adv. Life Sci. 2012, 2, 1–4. [Google Scholar] [CrossRef]
- Levan, A. Chemically induced chromosome reactions in allium cepa and viciafaba. Cold Spring Harb. Symp. Quant. Biol. 1951, 16, 233–243. [Google Scholar] [CrossRef]
- Fiskesjö, G. The Allium test as a standard in environmental monitoring. Hereditas 1985, 102, 99–112. [Google Scholar] [CrossRef]
- Stich, H.F.P.; Lam, L.W.; Korapatnik, J.; San, R.H.C. The search for relevant short term bioassay for chemical carcinogens. Can. J. Genet. Cytol. 1975, 17, 471–492. [Google Scholar] [CrossRef] [PubMed]
- Fonrose, X.; Ausseil, F.; Soleilhac, E.; Masson, V.; David, P. Parthenolide Inhibits Tubulin Carboxypeptidase Activity. Cancer Res. 2007, 67, 3371–3378. [Google Scholar] [CrossRef] [PubMed]
- Iwasaki, S. Antimitotic agents: Chemistry and recognition of tubulin molecule. Med. Res. Rev. 1993, 13, 183–198. [Google Scholar] [CrossRef] [PubMed]
- Mangale, S.M.; Chonde, S.G.; Raut, P.D. Use of Moringa oleifera (Drumstick) seed as Natural Absorbent and an Antimicrobial agent for Ground water Treatment. Res. J. Recent Sci. 2012, 1, 31–40. [Google Scholar]
- Mondal, D.; Mondal, T. A Review on efficacy of Azadirachtaindica A. Juss based biopesticides: An Indian perspective. Res. J. Recent Sci. 2012, 1, 94–99. [Google Scholar]
- Luna, J.D.S.; De Carvalho, J.M.; De Lima, M.R.F.; Bieber, L.W.; Bento, E.D.S.; Franck, X.; Sant’Ana, A.E.G. Acetogenins in Annona muricata L. (annonaceae) leaves are potent molluscicides. Nat. Prod. Res. 2006, 20, 253–257. [Google Scholar] [CrossRef]
- Vinothini, R.; Growther, L. Isolation and Identification of Acetogenin from Annona Muricata Leaves. Int. J. Appl. Biol. Pharm. Technol. 2016, 7, 169–172. [Google Scholar] [CrossRef]
- Akinboro, A.; Kamaruzaman, B.M.; Mohd, Z.A.; Othman, A.S.; Akeem, A.; Bin Mohamed, K.; Asmawi, M.Z.; Sofiman, O.A. Mutagenic and antimutagenic potentials of fruit juices of five medicinal plants in Allium cepa L.: Possible influence of DPPH free radical scavengers. Afr. J. Biotechnol. 2011, 10, 10520–10529. [Google Scholar] [CrossRef]
- Balog, C. The mitotic index in diploid and triploid Allium roots. Cytologia 1982, 47, 689–697. [Google Scholar] [CrossRef]
- Al-Ahmadi, S. Effects of organic insecticides, Kingbo and Azdar 10 EC, on mitotic chromosomes in root tip cells of Allium cepa. Int. J. Genet. Mol. Biol. 2013, 5, 64–70. [Google Scholar] [CrossRef]
- Akinsemolu, A.; Nwangburuka, C.; Ogunwenmo, K.O. Evaluation of Tobacco Industrial Wastewater for Genotoxic Characteristics on Allium cepa L. Root Cell Mitosis. J. Adv. Biol. Biotechnol. 2015, 2, 165–173. [Google Scholar] [CrossRef]


| Sample | Eluent | Color | Kedde Test |
|---|---|---|---|
| F0 | Aqueous fraction | Dark reddish pink | Positive |
| F1 | Ethanol | Faint reddish pink | Positive |
| F2 | Acetone | Faint reddish pink | Positive |
| F3 | Ethyl acetate | Faint reddish pink | Positive |
| F4 | Hexane | Green | Negative |
| Sr. No. | Tests | Different Solvent Extracts of Leaves (SL) | ||||
|---|---|---|---|---|---|---|
| ARL-Aq | ARL-EOH | ARL-Ac | ARL-EtAc | ARL-Hx | ||
| 1. | Carbohydrates | - | - | - | - | - |
| 2. | Starch | - | - | - | +++ | ++ |
| 3. | Reducing sugar | - | +++ | +++ | +++ | - |
| 4. | Amino acids | - | - | - | - | - |
| 5. | Proteins | - | - | - | - | - |
| 6. | Acid | - | - | - | - | - |
| 7. | Quinones | - | + | - | - | - |
| 8. | Coumarins | - | +++ | ++ | ++ | - |
| 9. | Gums and mucilages | - | - | - | - | - |
| 10 | Steroids | - | ++ | ++ | +++ | + |
| 11 | Tannins | - | +++ | +++ | +++ | + |
| 12. | Phlobatannins | - | - | - | - | - |
| 13. | Phenols | - | +++ | +++ | +++ | - |
| 14. | Cardiac glycosides | - | - | - | - | + |
| 15. | Alkaloids | ++ | - | - | ++ | + |
| 16. | Anthraquinones | - | - | - | - | - |
| 17. | Betacyanins | ++ | + | + | +++ | +++ |
| 18. | Emodols | ++ | +++ | +++ | +++ | - |
| 19. | Saponins | + | + | - | - | - |
| 20. | Volatile oils | - | ++ | + | +++ | - |
| 21. | Flavanoids | ++ | +++ | +++ | + | - |
| 22. | Terpenoids | - | - | - | - | + |
| 23. | Resins | - | - | - | - | - |
| 24. | Fixed oils and fats | - | - | - | - | - |
| Extract | Concentration in mg/mL | Total No. of Cells | Cells in Interphase | Cell in Division | Mitotic Index % |
|---|---|---|---|---|---|
| Control | 0.1 | 400 | 241 | 159 | 39.75 |
| 1 | 400 | 115 | 285 | 71.25 | |
| 10 | 400 | 268 | 132 | 33 | |
| 100 | 400 | 124 | 276 | 69 | |
| Standard colchicine | 0.1 | 400 | 44 | 356 | 89 |
| 1 | 400 | 75 | 325 | 81.25 | |
| 10 | 400 | 96 | 304 | 76 | |
| 100 | 400 | 80 | 320 | 80 | |
| ARL-Aq | 0.1 | 400 | 187 | 213 | 53.25 |
| 1 | 400 | 97 | 303 | 75.75 | |
| 10 | 400 | 263 | 137 | 34.25 | |
| 100 | 400 | 131 | 269 | 67.25 | |
| ARL-EOH | 0.1 | 400 | 207 | 193 | 48.25 |
| 1 | 400 | 146 | 254 | 63.5 | |
| 10 | 400 | 293 | 107 | 26.75 | |
| 100 | 400 | 261 | 139 | 34.75 | |
| ARL-Ac | 0.1 | 400 | 75 | 325 | 81.25 |
| 1 | 400 | 115 | 285 | 71.25 | |
| 10 | 400 | 105 | 295 | 73.75 | |
| 100 | 400 | 97 | 303 | 75.75 | |
| ARL-EtAc | 0.1 | 400 | 167 | 233 | 58.25 |
| 1 | 400 | 117 | 283 | 70.75 | |
| 10 | 400 | 227 | 173 | 43.25 | |
| 100 | 400 | 131 | 254 | 67.25 | |
| ARL-Hx | 0.1 | 400 | 159 | 241 | 60.25 |
| 1 | 400 | 87 | 313 | 78.25 | |
| 10 | 400 | 141 | 259 | 64.75 | |
| 100 | 400 | 119 | 281 | 70.25 |
| Extract | Concentration in mg/mL | Prophase (Mean SE±) | Metaphase (Mean SE±) | Anaphase (Mean SE±) | Telophase (Mean SE±) |
|---|---|---|---|---|---|
| Control | 0.1 | 63.33 ± 5.17 | 32 ± 3.51 | 23 ± 1.73 | 41 ± 2.00 |
| Standard colchicine | 0.1 | 147 ± 8.00 | 110 ± 4.16 | 48 ± 2.08 | 51 ± 2.00 |
| ARL-Aq | 0.1 | 96 ± 1.53 | 53 ± 3.21 | 36 ± 2.52 | 28 ± 2.65 |
| ARL-EOH | 0.1 | 73 ± 3.92 | 52 ± 2.65 | 41 ± 3.06 | 27 ± 1.53 |
| ARL-Ac | 0.1 | 147 ± 8.89 | 93 ± 3.51 | 24 ± 2.31 | 61 ± 3.46 |
| ARL-EtAc | 0.1 | 94 ± 2.31 | 73 ± 2.52 | 36 ± 2.65 | 30 ± 1.00 |
| ARL-Hx | 0.1 | 107 ± 7.21 | 58 ± 2.52 | 32 ± 2.31 | 44 ± 2.52 |
| ANOVA | - | 7494.67 | 5488.67 | 670.92 | 1564 |
| p value | - | p < 0.05 | p < 0.05 | p < 0.05 | p < 0.05 |
| Extract | Concentration in mg/mL | Prophase (Mean SE±) | Metaphase (Mean SE±) | Anaphase (Mean SE±) | Telophase (Mean SE±) |
|---|---|---|---|---|---|
| Control | 1 | 132 ± 3.06 | 58 ± 2.89 | 53 ± 3.00 | 42 ± 2.08 |
| Standard colchicine | 1 | 127 ± 6.03 | 83 ± 2.65 | 53 ± 2.89 | 62 ± 2.52 |
| ARL-Aq | 1 | 141 ± 2.65 | 61 ± 1.73 | 54 ± 3.06 | 47 ± 2.65 |
| ARL-EOH | 1 | 111 ± 10.06 | 68 ± 4.51 | 38 ± 2.52 | 37 ± 6.08 |
| ARL-Ac | 1 | 118 ± 1.73 | 76 ± 3.21 | 53 ± 4.93 | 38 ± 1.53 |
| ARL-EtAc | 1 | 116 ± 2.52 | 67 ± 2.31 | 48 ± 2.00 | 52 ± 3.51 |
| ARL-Hx | 1 | 138 ± 2.89 | 73 ± 3.61 | 43 ± 1.53 | 59 ± 2.00 |
| ANOVA | - | 1828.92 | 1046.92 | 800 | 1466.92 |
| p value | - | p < 0.05 | p < 0.05 | p < 0.05 | p < 0.05 |
| Extract | Concentration in mg/mL | Prophase (Mean SE±) | Metaphase (Mean SE±) | Anaphase (Mean SE±) | Telophase (Mean SE±) |
|---|---|---|---|---|---|
| Control | 10 | 55.33 ± 0.88 | 29 ± 1.53 | 21 ± 2.08 | 27 ± 2.65 |
| Standard colchicine | 10 | 110 ± 8.08 | 83 ± 2.65 | 50 ± 2.08 | 61 ± 3.61 |
| ARL-Aq | 10 | 58 ± 1.73 | 29 ± 2.31 | 26 ± 2.65 | 24 ± 1.15 |
| ARL-EOH | 10 | 51 ± 5.99 | 18 ± 4.51 | 17 ± 2.65 | 21 ± 2.52 |
| ARL-Ac | 10 | 127 ± 3.00 | 71 ± 4.36 | 52 ± 3.21 | 45 ± 1.15 |
| ARL-EtAc | 10 | 73 ± 2.52 | 42 ± 3.61 | 22 ± 1.53 | 36 ± 2.65 |
| ARL-Hx | 10 | 111 ± 3.51 | 73 ± 5.20 | 31 ± 1.73 | 44 ± 3.06 |
| ANOVA | - | 10,424.67 | 7472.25 | 1879.67 | 2515 |
| p value | - | p < 0.05 | p < 0.05 | p < 0.05 | p < 0.05 |
| Extract | Concentration in mg/mL | Prophase (Mean SE±) | Metaphase (Mean SE±) | Anaphase (Mean SE±) | Telophase (Mean SE±) |
|---|---|---|---|---|---|
| Control | 100 | 128 ± 9.02 | 57 ± 0.58 | 56 ± 2.08 | 35 ± 1.00 |
| Standard colchicine | 100 | 131 ± 5.03 | 84 ± 3.61 | 42 ± 2.08 | 63 ± 4.51 |
| ARL-Aq | 100 | 119 ± 4.91 | 67 ± 2.65 | 45 ± 3.00 | 38 ± 2.00 |
| ARL-EOH | 100 | 63 ± 5.66 | 29 ± 1.53 | 21 ± 4.16 | 26 ± 1.73 |
| ARL-Ac | 100 | 131 ± 3.51 | 75 ± 3.00 | 57 ± 4.00 | 40 ± 2.00 |
| ARL-EtAc | 100 | 111 ± 2.00 | 68 ± 2.89 | 38 ± 2.08 | 37 ± 4.58 |
| ARL-Hx | 100 | 107 ± 6.66 | 73 ± 5.20 | 58 ± 3.46 | 43 ± 3.21 |
| ANOVA | - | 6843.67 | 3896 | 1976.00 | 1372.25 |
| p value | - | p < 0.05 | p < 0.05 | p < 0.05 | p < 0.05 |
| Extract | Concentration in mg/mL | Total No. of Cells | Cells in Interphase | Cell in Division | Mitotic Index % |
|---|---|---|---|---|---|
| Control | 0.1 | 400 | 241 | 159 | 39.75 |
| 1 | 400 | 115 | 285 | 71.25 | |
| 10 | 400 | 268 | 132 | 33 | |
| 100 | 400 | 124 | 276 | 69 | |
| Standard colchicine | 0.1 | 400 | 44 | 356 | 89 |
| 1 | 400 | 75 | 325 | 81.25 | |
| 10 | 400 | 96 | 304 | 76 | |
| 100 | 400 | 80 | 320 | 80 | |
| ARL-Aq | 0.1 | 400 | 187 | 213 | 53.25 |
| 1 | 400 | 97 | 303 | 75.75 | |
| 10 | 400 | 263 | 137 | 34.25 | |
| 100 | 400 | 131 | 269 | 67.25 | |
| ARL-EOH | 0.1 | 400 | 207 | 193 | 48.25 |
| 1 | 400 | 146 | 254 | 63.5 | |
| 10 | 400 | 293 | 107 | 26.75 | |
| 100 | 400 | 261 | 139 | 34.75 | |
| ARL-Ac | 0.1 | 400 | 75 | 325 | 81.25 |
| 1 | 400 | 115 | 285 | 71.25 | |
| 10 | 400 | 105 | 295 | 73.75 | |
| 100 | 400 | 97 | 303 | 75.75 | |
| ARL-EtAc | 0.1 | 400 | 167 | 233 | 58.25 |
| 1 | 400 | 117 | 283 | 70.75 | |
| 10 | 400 | 227 | 173 | 43.25 | |
| 100 | 400 | 131 | 254 | 67.25 | |
| ARL-Hx | 0.1 | 400 | 159 | 241 | 60.25 |
| 1 | 400 | 87 | 313 | 78.25 | |
| 10 | 400 | 141 | 259 | 64.75 | |
| 100 | 400 | 119 | 281 | 70.25 |
Publisher’s Note: MDPI stays neutral with regard to jurisdictional claims in published maps and institutional affiliations. |
© 2020 by the authors. Licensee MDPI, Basel, Switzerland. This article is an open access article distributed under the terms and conditions of the Creative Commons Attribution (CC BY) license (https://creativecommons.org/licenses/by/4.0/).
Share and Cite
Sandeep, W.; Omkar, D.; Harshada, M.; Aaditi, P.; Prajwal, G.; Deepak, G.; Nilesh, G.; Ajay, K.; Mohan, K. Evaluation of Phytochemical & Antimitotic Potential of Annona Reticulata Extracts by Onion Root Model. Chem. Proc. 2021, 3, 137. https://0-doi-org.brum.beds.ac.uk/10.3390/ecsoc-24-08296
Sandeep W, Omkar D, Harshada M, Aaditi P, Prajwal G, Deepak G, Nilesh G, Ajay K, Mohan K. Evaluation of Phytochemical & Antimitotic Potential of Annona Reticulata Extracts by Onion Root Model. Chemistry Proceedings. 2021; 3(1):137. https://0-doi-org.brum.beds.ac.uk/10.3390/ecsoc-24-08296
Chicago/Turabian StyleSandeep, Waghulde, Dukare Omkar, More Harshada, Pacharkar Aaditi, Gharat Prajwal, Gupta Deepak, Gorde Nilesh, Kharche Ajay, and Kale Mohan. 2021. "Evaluation of Phytochemical & Antimitotic Potential of Annona Reticulata Extracts by Onion Root Model" Chemistry Proceedings 3, no. 1: 137. https://0-doi-org.brum.beds.ac.uk/10.3390/ecsoc-24-08296