Indicators of Regional Innovation Clusters’ Effectiveness in the Higher Education System


1
Department of Financial and Economic Security, Chernihiv Polytechnic National University, 14035 Chernihiv, Ukraine
2
Department of Electrical Engineering and Information Measuring Technologies, Chernihiv Polytechnic National University, 14035 Chernihiv, Ukraine
3
Department of Foreign Languages for Specific Purposes, Chernihiv Polytechnic National University, 14035 Chernihiv, Ukraine
*
Author to whom correspondence should be addressed.
Educ. Sci. 2020, 10(9), 245; https://0-doi-org.brum.beds.ac.uk/10.3390/educsci10090245
Submission received: 10 August 2020
/
Revised: 9 September 2020
/
Accepted: 10 September 2020
/
Published: 12 September 2020
(This article belongs to the Special Issue Engineering Education in Knowledge Based Society)
Abstract
:Under globalization conditions, the main priority of the state education policy in many countries of the world is to ensure higher education quality. This is possible through close and efficient cooperation between the state, higher education institutions, future specialists, employers and innovative structures (clusters). This study focuses on the development of indicators that can comprehensively assess the effectiveness of regional innovation clusters in the higher education system. The main attention is given to the analysis of innovations, business, education development and competitiveness, as indicators of the effectiveness of regional innovation clusters in the higher education system. The following methods have been used within the research: content analysis, statistical, correlation and regression analysis, econometric modeling and the graphical method. As a result of the research, indicators of the effectiveness of regional innovation clusters have been identified and the impact of these indicators on the higher education system has been evaluated. The authors have shown that there is a close relationship between the level of development of regional innovation clusters, indicators of business and innovations development, and the level of competitiveness. The direct impact of those on the higher education system has been established and confirmed by the provided calculations.
1. Introduction
One of the sustainable development goals adopted at the 2015 UN Summit is to provide an inclusive, equitable, quality education and to promote the lifelong learning. One of the steps towards achieving this goal is the collaboration of regional innovation clusters (RICs) with the higher education system (HES). The analysis of world experience shows that by means of higher education internationalization, the involvement of RICs in the scientific and educational space contributes to enhancement of graduates’ employability, improving their mobility in the world labor market, and increasing the quality of higher education.
For many countries, higher education quality is one of the most important strategic factors of economic development. Particularly important is the solution to the problem of improving the higher education quality that arises in the context of the information society’s development, where the intellectual component of the population is the key. The HES can be considered reproducible for any country, since investing in it within the current period brings future effects [1,2,3,4,5,6,7,8,9]. Therefore, improving higher education quality is an urgent issue for every country.
It should be noted that higher education institutions’ (HEIs’) interaction with RICs plays an important role in their activities. Current trends indicate the need for close interaction between innovation structures, HEIs and the scientific community. International experience in managing innovative, scientific and technical development of regions shows that at this level, the processes of synthesis of scientific, industrial, economic and social policy in the form of innovation clusters is taking place [10,11,12,13,14]. The purpose of their operation is to create and maintain a favorable environment for the active use of innovations.
Some research [15] devoted to the discussion and assessment of higher education quality propose a set of innovative generic key performance indicators which provide valuable insights into improving teaching, learning and assessment and will eventually lead to sustainable curricula. At the same time, correlation with the RICs’ development level was not considered. Other research [16] emphasized that sustainable development becomes incorporated into the HEIs’ systems and sustainable assessment tools have been used to determine the impact of HEIs on sustainable development.
The authors of [17] substantiate the concept and methodology of performance management in the post-Soviet transformation of higher education. The mechanism of using re-engineering and motivational management in the process of realization of the goals of European integration in university education in Ukraine is offered.
Still other research [18] is devoted to the study of the contribution of higher education and technological innovations, which are two important factors influencing economic growth. The authors of [19] consider the analysis of different cases from Europe and Latin America to synthesize the model of management of technology and innovation. Conceptually, the model focuses on competencies, tools, skills and behavior. From this knowledge base, we obtain a new model of learning for higher education, using an organizational framework.
Taking into account the significant contribution of the above given research, it should be noted that today the issue of the impact of RICs on the higher education system remains insufficiently studied. In particular, the lack of clear criteria, namely, formalized indicators that would allow a comprehensive assessment of the RICs’ effectiveness in HES, does not provide evidence of the positive impact of such clusters. In this regard, the issue of developing indicators that would assess the effectiveness of RICs in higher education is relevant.
Therefore, the aim of the article is to determine indicators for evaluating and monitoring the effectiveness of regional innovation clusters and to assess their impact on the higher education system.
The article has the following structure. Section 2 continues the Introduction with the basic definitions and review of concepts related to regional innovation clusters, higher education and competitiveness. Section 3 describes the methodology for assessment of the impact of regional innovation clusters on the higher education system and presents statistics data for calculations. Section 4 is devoted to calculations and evaluation of research results; there is a description and comparison of key indicators, and graphs for visual interpretation of calculation results. Section 5 is devoted to the justification of the relationships between the given indicators, conclusions and proposals for further research.
2. Basic Definitions and Considerations
It is necessary to provide some clarifications regarding the main definitions related to the research before proceeding to the analysis and evaluation of appropriate indicators.
J. Simmie, J. Sennett and Wood P. point out [20] that an innovation cluster is a large number of related industrial and/or service companies that have a high level of collaboration, usually across the supply chain, and operate under the same market conditions.
S. Engel argues that innovation clusters are global “hotspots” of the economy, where new technologies advance at a staggering speed, and where capital, experience and talent help to develop new industries and new ways of doing business [21].
According to [22], an innovation cluster is an association bringing together universities, science and technology for education and research in the field of innovation.
Ya.B. Yanchenko [23] states that an innovation cluster is a structure with a significant (in comparison with industrial and national indicators) share of innovative products, as well as innovative infrastructure, which includes interaction of stakeholders of the regional innovation system (educational and scientific institutions, R&D centers, technology transfer centers, business incubators, technoparks, non-governmental organizations, financial institutes, cluster development centers, etc.).
In the opinion of some authors [24], RICs are associations and cooperation of scientific, technological, production, financial, investment and other institutions (organizations, enterprises) with the aim of agreeing on common interests securing an innovative interaction, implementation of the latest technologies and innovative products at the regional level.
Higher education is the unity of systematized knowledge, skills, ways of thinking, professional, world view and civic qualities, moral and ethical values, and other competences acquired in the HEI (or scientific institution) in the relevant field of knowledge according to a specific qualification in the higher education levels, that has a higher complexity than a general secondary education level. The system of higher education comprises: (1) HEIs of any ownership; (2) levels and degrees (qualifications) of higher education; (3) fields of knowledge and specialties; (4) educational and scientific programs; (5) license conditions for conducting educational activities and license conditions for higher education; (6) governing bodies in higher education; (7) participants of the educational process [25].
As K. Jonkers, R. Tijssen, A. Karvounaraki and X. Goenaga state, higher education competitiveness appears in the formation of a competitive economy and increases the number of students who successfully graduate from colleges and universities, and has a decisive value for the long-term economic growth of the country [26].
J. Knight has formed a definition of internationalization as a purposeful process of giving higher education an international, intercultural or global dimension in order to increase the quality of education and science for all students and employees of HEIs, as well as making a significant contribution to the life of society [27]. The definition of the term underlines that internationalization is not a goal itself, but rather a mechanism of increasing the quality of higher education.
The majority of national strategies of internationalization, including the European ones, are aimed at increasing the mobility, involvement and training of talented students and staff, increasing the reputation and recognition of universities, points out A.V. Verbytska [28]. According to M. Porter, K. Debackere, P. Andries, S. Breschi, F. Malerba, M. Muro, B. Katz, S. Tallman, M. Jenkins, N. Henry, S. Pinch, A. Turró, D. Urbano, M. Peris-Ortiz, S. Engel and I. del-Palacio [29,30,31,32,33,34,35,36,37], the improvement of effectiveness of scientific and research work with talented youth is less possible without a joint interaction of HEIs with innovative structures (clusters).
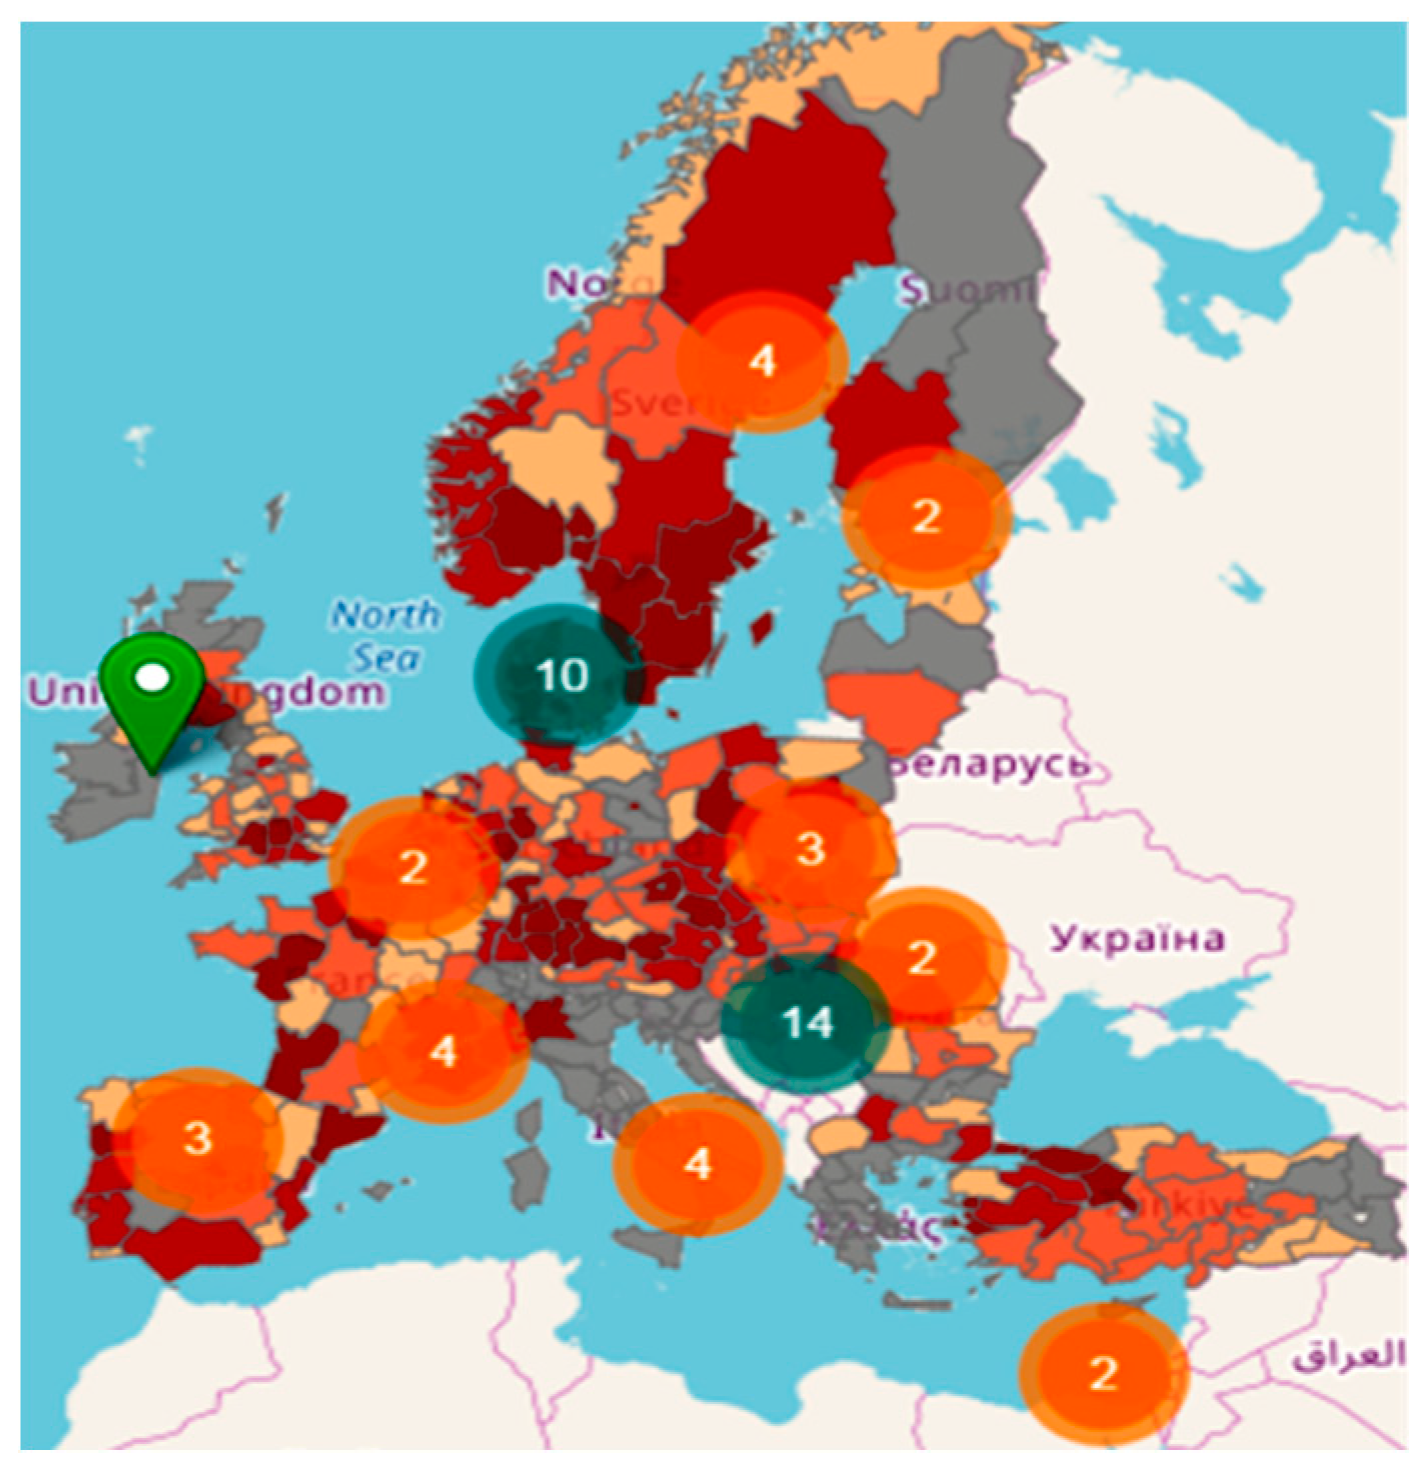
According to European Commission data [38], there are nearly 3000 specialized clusters in Europe, which equals 54 million workplaces. Salaries at enterprises that belong to clusters are on average 3% higher than at other enterprises. That is important due to the current COVID-19 pandemic, as those enterprises appear to be more resilient to crises. The updated strategy of EU industrial policy defines clusters as a powerful tool of economic development for the support and implementation of innovations. According to the European Cluster Observatory and European Cluster Collaboration Platform data [39,40] more than 50 innovation clusters are at work in the territory of the European Union as of the beginning of 2020 (Figure 1).
3. Assessment of the Regional Innovation Clusters’ Impact on the Higher Education System
In order to detect the indicators of effectiveness and evaluate the impact of RICs on the HES, statistical methods have been used: correlation and regression analysis, econometric modeling, as well as estimation of dependence and ties between the level of cluster development, level of education development, innovations, business and the index of global competitiveness for 141 countries.
There are some explanations for better understanding the calculation principles of this index. The Global Competitiveness Index (GCI) is a global research tool that determines the country’s ranking in the world by means of economic competitiveness. The World Economic Forum (WEF) defines national competitiveness as a means of the country and its institutions to secure a stable pace of economic growth that is sustainable in the mid-term perspective [41].
The GCI is a list of 103 indicators that describe in detail the competitiveness of countries of the world at different levels of economic development. The set of these indicators at 2/3 consists of the results of a survey of company executives (to cover a wide range of factors affecting the business climate in the surveyed countries) and at 1/3 of open sources (statistics and research results regularly provided by international organizations). The representatives of the WEF note that national economic competitiveness is defined by numerous and varied features. They are combined in 12 pillars that determine national competitiveness: institutions, infrastructure, ICT implementation, macroeconomic stability, health, skills, product market, labor market, financial system, market size, business dynamics and innovative capacity.
The choice of the abovementioned variables is explained by theoretical and empirical studies, and no single factor can provide competitiveness to economics. Countries that have high indicators of national competitiveness, as a rule, ensure a higher level of well-being for their citizens. Along with the institutional factors, education and increase in the qualifications of the workforce, constant access to new knowledge and technology can be decisive. For example, the effect of increasing expenditure on education may be diminished by the ineffectiveness of the labor market, other disadvantages of the institutional structures and, as a consequence, the absence of opportunities for proper employment of graduates.
Having analyzed the experience of many countries, the authors have come to the conclusion that the most important indicators that can determine the effectiveness of regional innovation clusters in higher education are: indicators of innovation development, business and competitiveness.
In order to conduct the correlation and regression analysis, econometric modeling and calculations, an authors’ sample from 103 indicators has been formed and summarized in Table 1, which was compiled by the authors based on data from WEF: The Global Competitiveness Report 2019 [41]. A scale from 0 to 100 has been used for each indicator to show how close the economy is to an ideal state or “border” of competitiveness in the industry.
In [42,43,44,45,46] the authors point out that the main task of correlation and regression methods of analysis is to process statistics to identify the mathematical relation between the studied features and to establish, by means of correlation coefficients, a correlation estimate of the density of interconnection that has a definite numerical expression. Correlation and regression analysis solves two main tasks: determining by means of regression equations the analytical form of the relation between the resultant and factor indices, and establishing the level of relationship between them.
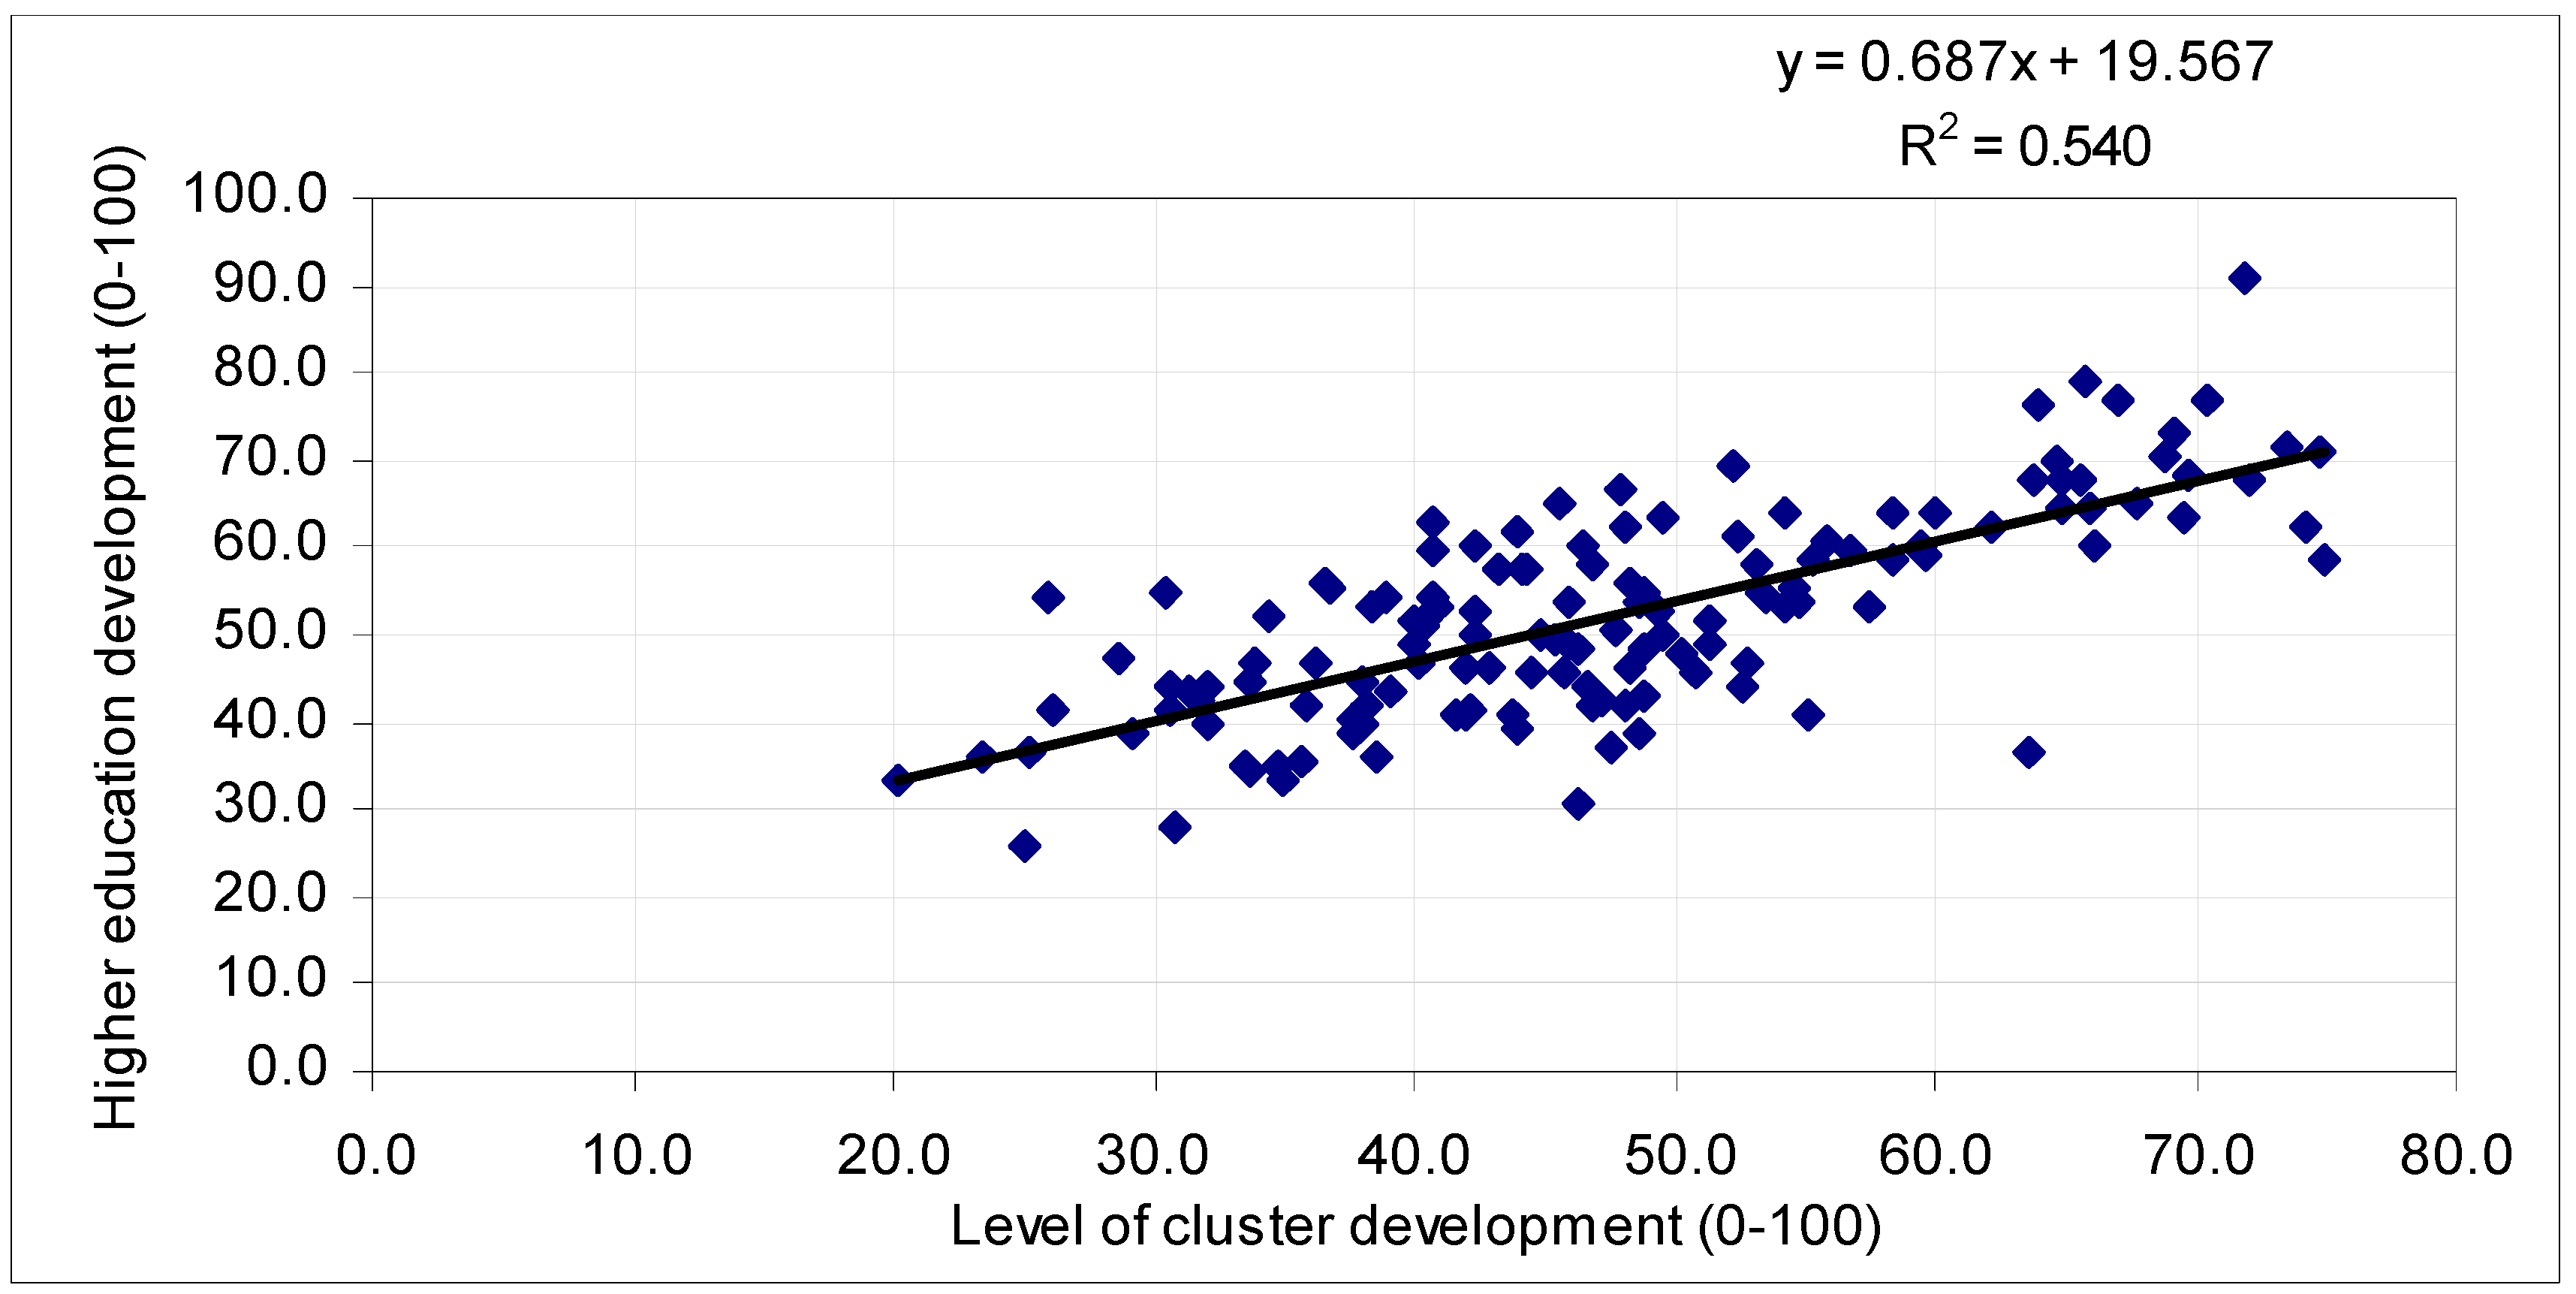
In order to establish a correlation between the state of cluster development and the level of higher education development, we use a linear one-factor model which, as the calculation shows, most accurately reflects the relationship between the studied parameters. Then the regression equation has the following form:
where is an estimated value of higher education development indicator; b is a model coefficient equal to the variation of , when changing by one; is the level of cluster development; a is a model coefficient equal to the value of when equal to zero.
The coefficients b and a could be defined according to (2) and (3) accordingly:
where is the average value of cluster development level; is the level of higher education development; is the average level of higher education development; n = 141.
The obtained values b = 0.687, a = 19.567 give the regression equation as follow:
In order to determine the degree of variation dependence of the variable on the variation of the variable , the coefficient of determination has been calculated according to (5):
where R2 is the coefficient of determination; is the estimated value of the level of higher education development; is the average level of higher education development.
4. Evaluation Results Analysis and Discussion
According to the results of the calculations, the value of the coefficient of determination has been obtained (R2 = 0.540). Since R2 > 0.5, we may conclude that the regression equation is consistent with the original data. Therefore, the coefficient of determination has shown that the variation of the variable by 54% is caused by the variation of the variable . The point diagram with a trend line (Figure 2) illustrates the relationship between the parameters under study.
The presented data analysis shows that, generally, with the increasing indicators of the cluster development , the value of the higher education development demonstrates similar dynamics. To establish the tightness of relationship between the cluster development and the higher education development, a linear correlation coefficient was calculated by (6):
As the result of the calculations, the value of the linear correlation coefficient has been obtained = 0.735. According to the R. Chaddok scale [47], which estimates the tightness of relationship between y and x, the linear correlation coefficient in the range 0.7–0.9 is high enough. Thus, the linear correlation coefficient has indicated that a close relationship between the studied parameters exists.
In order to verify the validity of the model, we applied the F–test (Fisher criterion). The actual value of the Fisher criterion was calculated by (7):
where is the actual value of the Fisher criterion; n is the sample size; k is the number of coefficients in the model; is the estimated value of the higher education development level; is the average higher education development level; is the actual significance of the higher education development level. According to the calculation results, the actual value of the Fisher criterion has been obtained as = 163.41.
The critical value of the Fisher criterion is defined by (8):
where a is the level of significance; m1 is the number of degrees of freedom for greater dispersion; m2 is the number of degrees of freedom for the smaller dispersion; n is the sample size (n = 141 in our case); k is the number of coefficients in the model (there are two coefficients in our case). The calculated critical value of the Fisher criterion is 3.91. Since > , we can conclude the reliability of the selected linear one-factor model.
The sample size is 141 countries, i.e., n > 100, so it is advisable to check the validity of the linear correlation coefficient using the Student’s statistical criterion. The actual value of the Student’s criterion can be calculated by (9):
where is the actual value of the Student’s criterion; is the linear correlation coefficient; n is the sample size. According to the calculation results, the actual value of the Student’s criterion has been obtained as = 12.88.
The critical value of the Student’s criterion is determined by (10):
where is the critical value of the Student’s criterion; a is the level of significance; n is the sample size. The determined critical value of the Student’s criterion is = 2.27. Since > , we can conclude that the correlation coefficient is statistically significant.
Similarly, we performed the calculation for other indicators of Table 1. The point diagrams with trend lines were built (Figure 3, Figure 4, Figure 5 and Figure 6) to illustrate the relationship between the parameters under study.
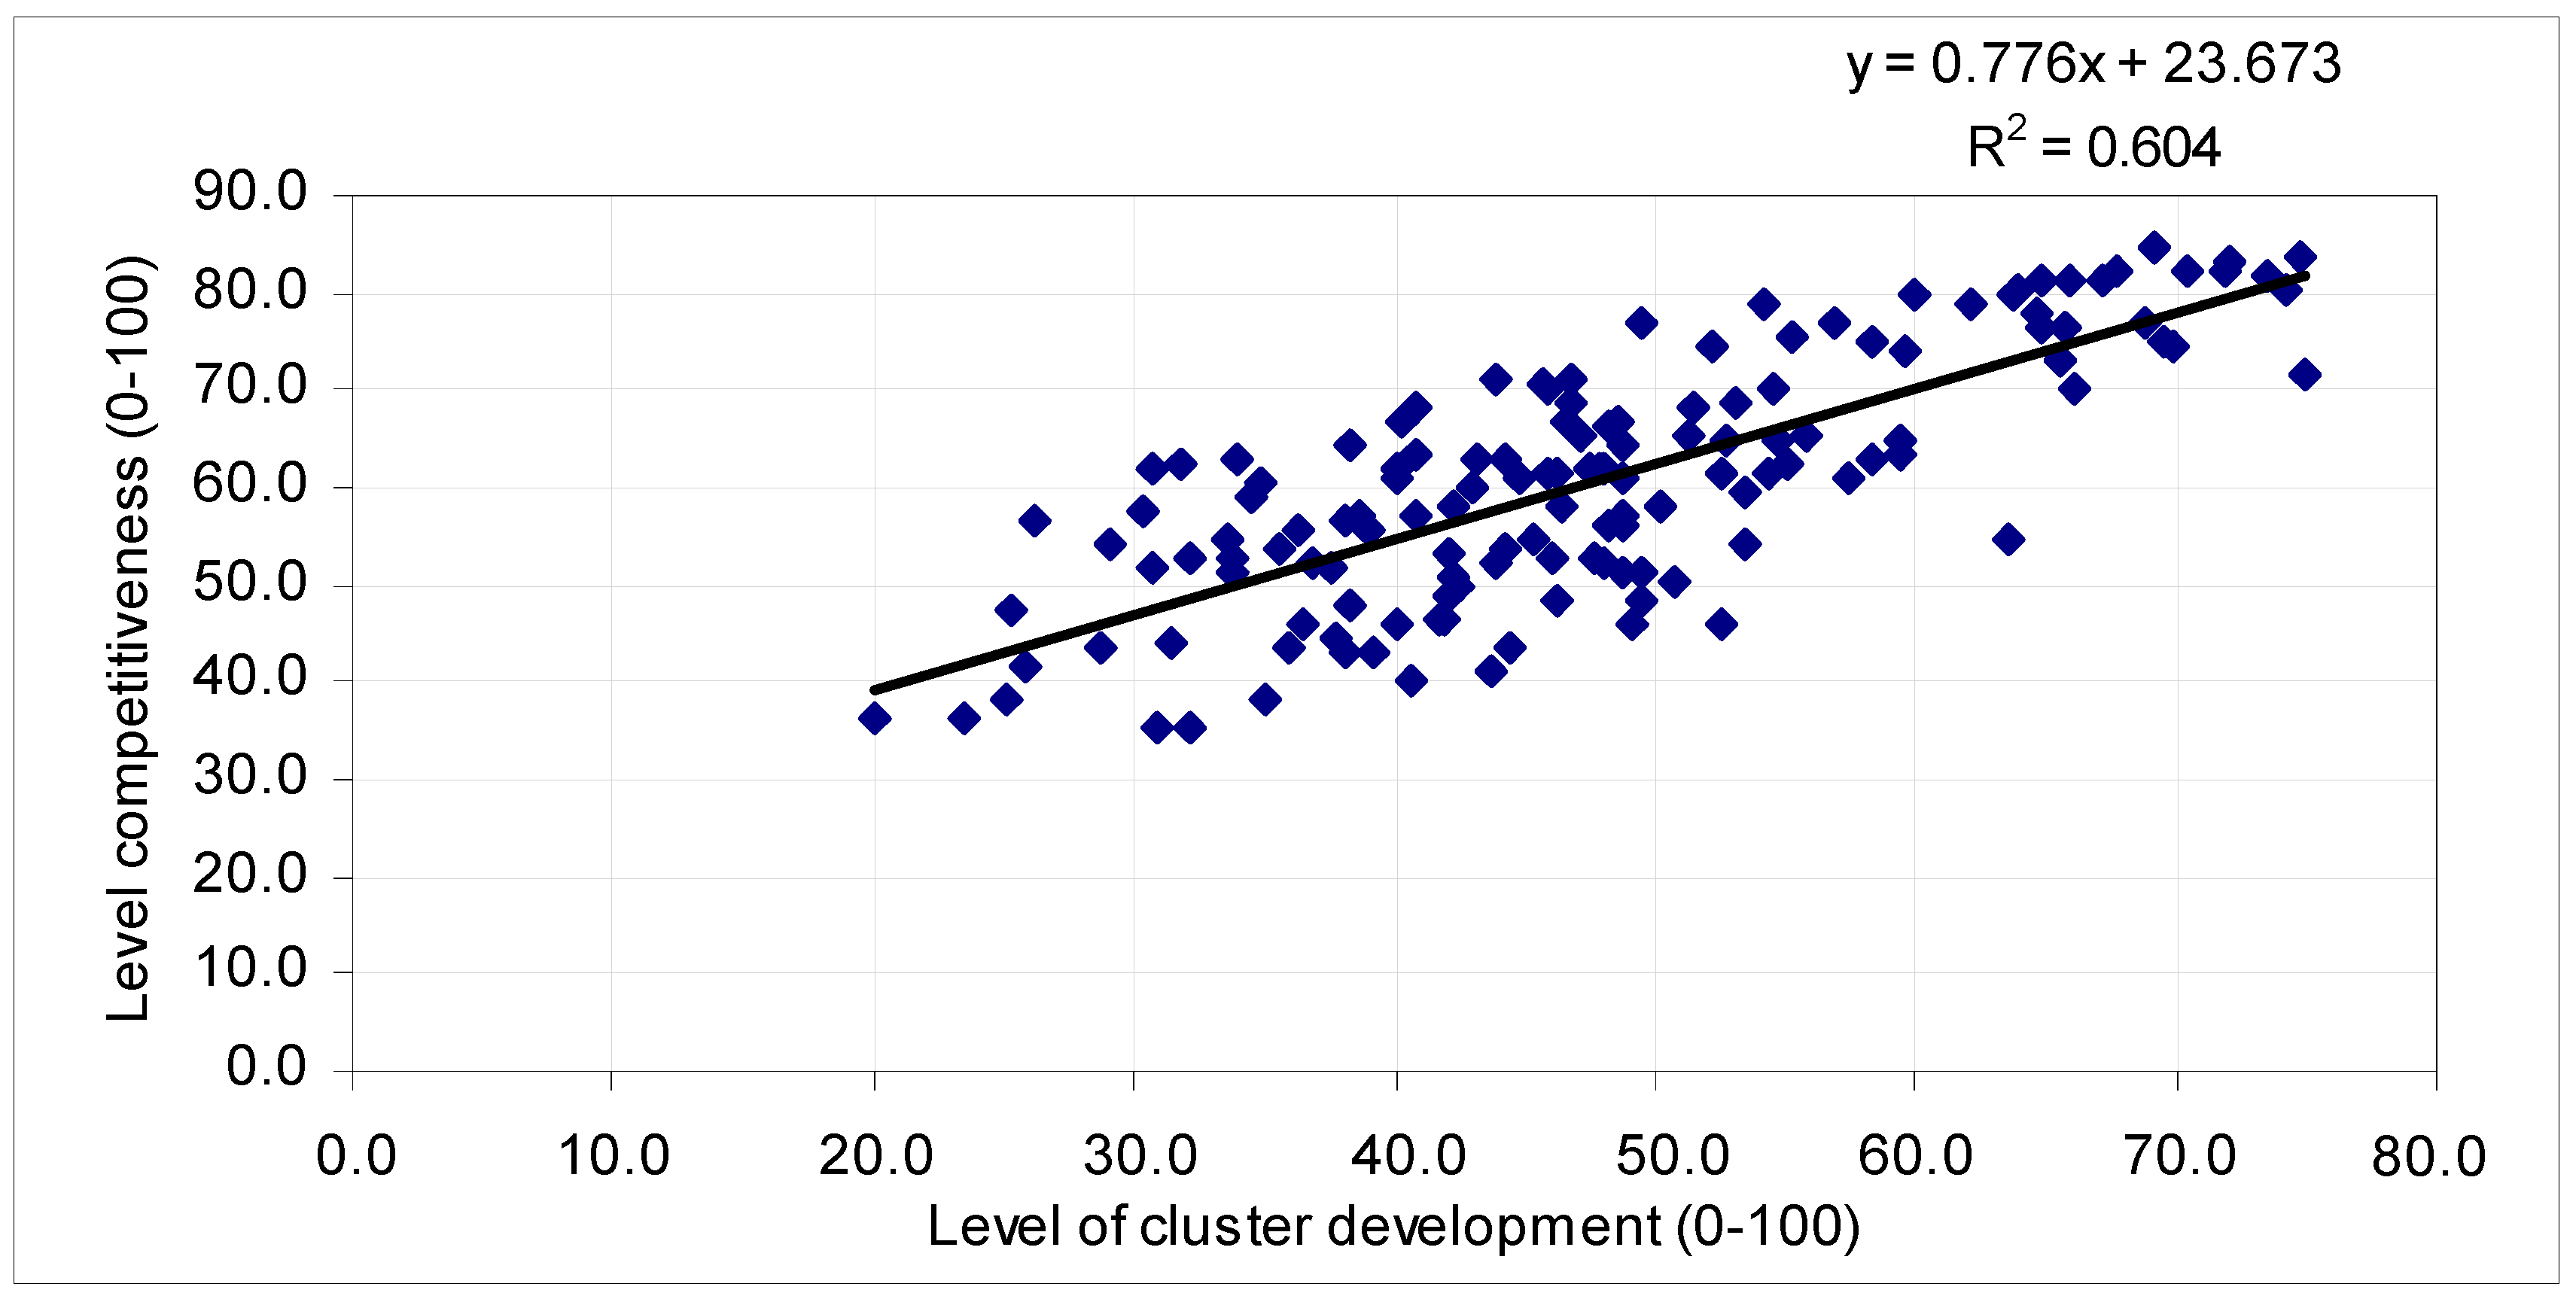
For the competitiveness dependence, the coefficients are: b = 0.776; a = 23.673 and the regression equation has the following form:
where is the level of competitiveness; is the level of cluster development.
According to the calculation results, the coefficient of determination has been obtained (R2 = 0.604). Since R2 > 0.5, we may conclude that the regression equation is consistent with the original data. Therefore, the coefficient of determination has shown that the variation of the level of competitiveness by 60.4 % is caused by the variation of the level of cluster development (Figure 3).
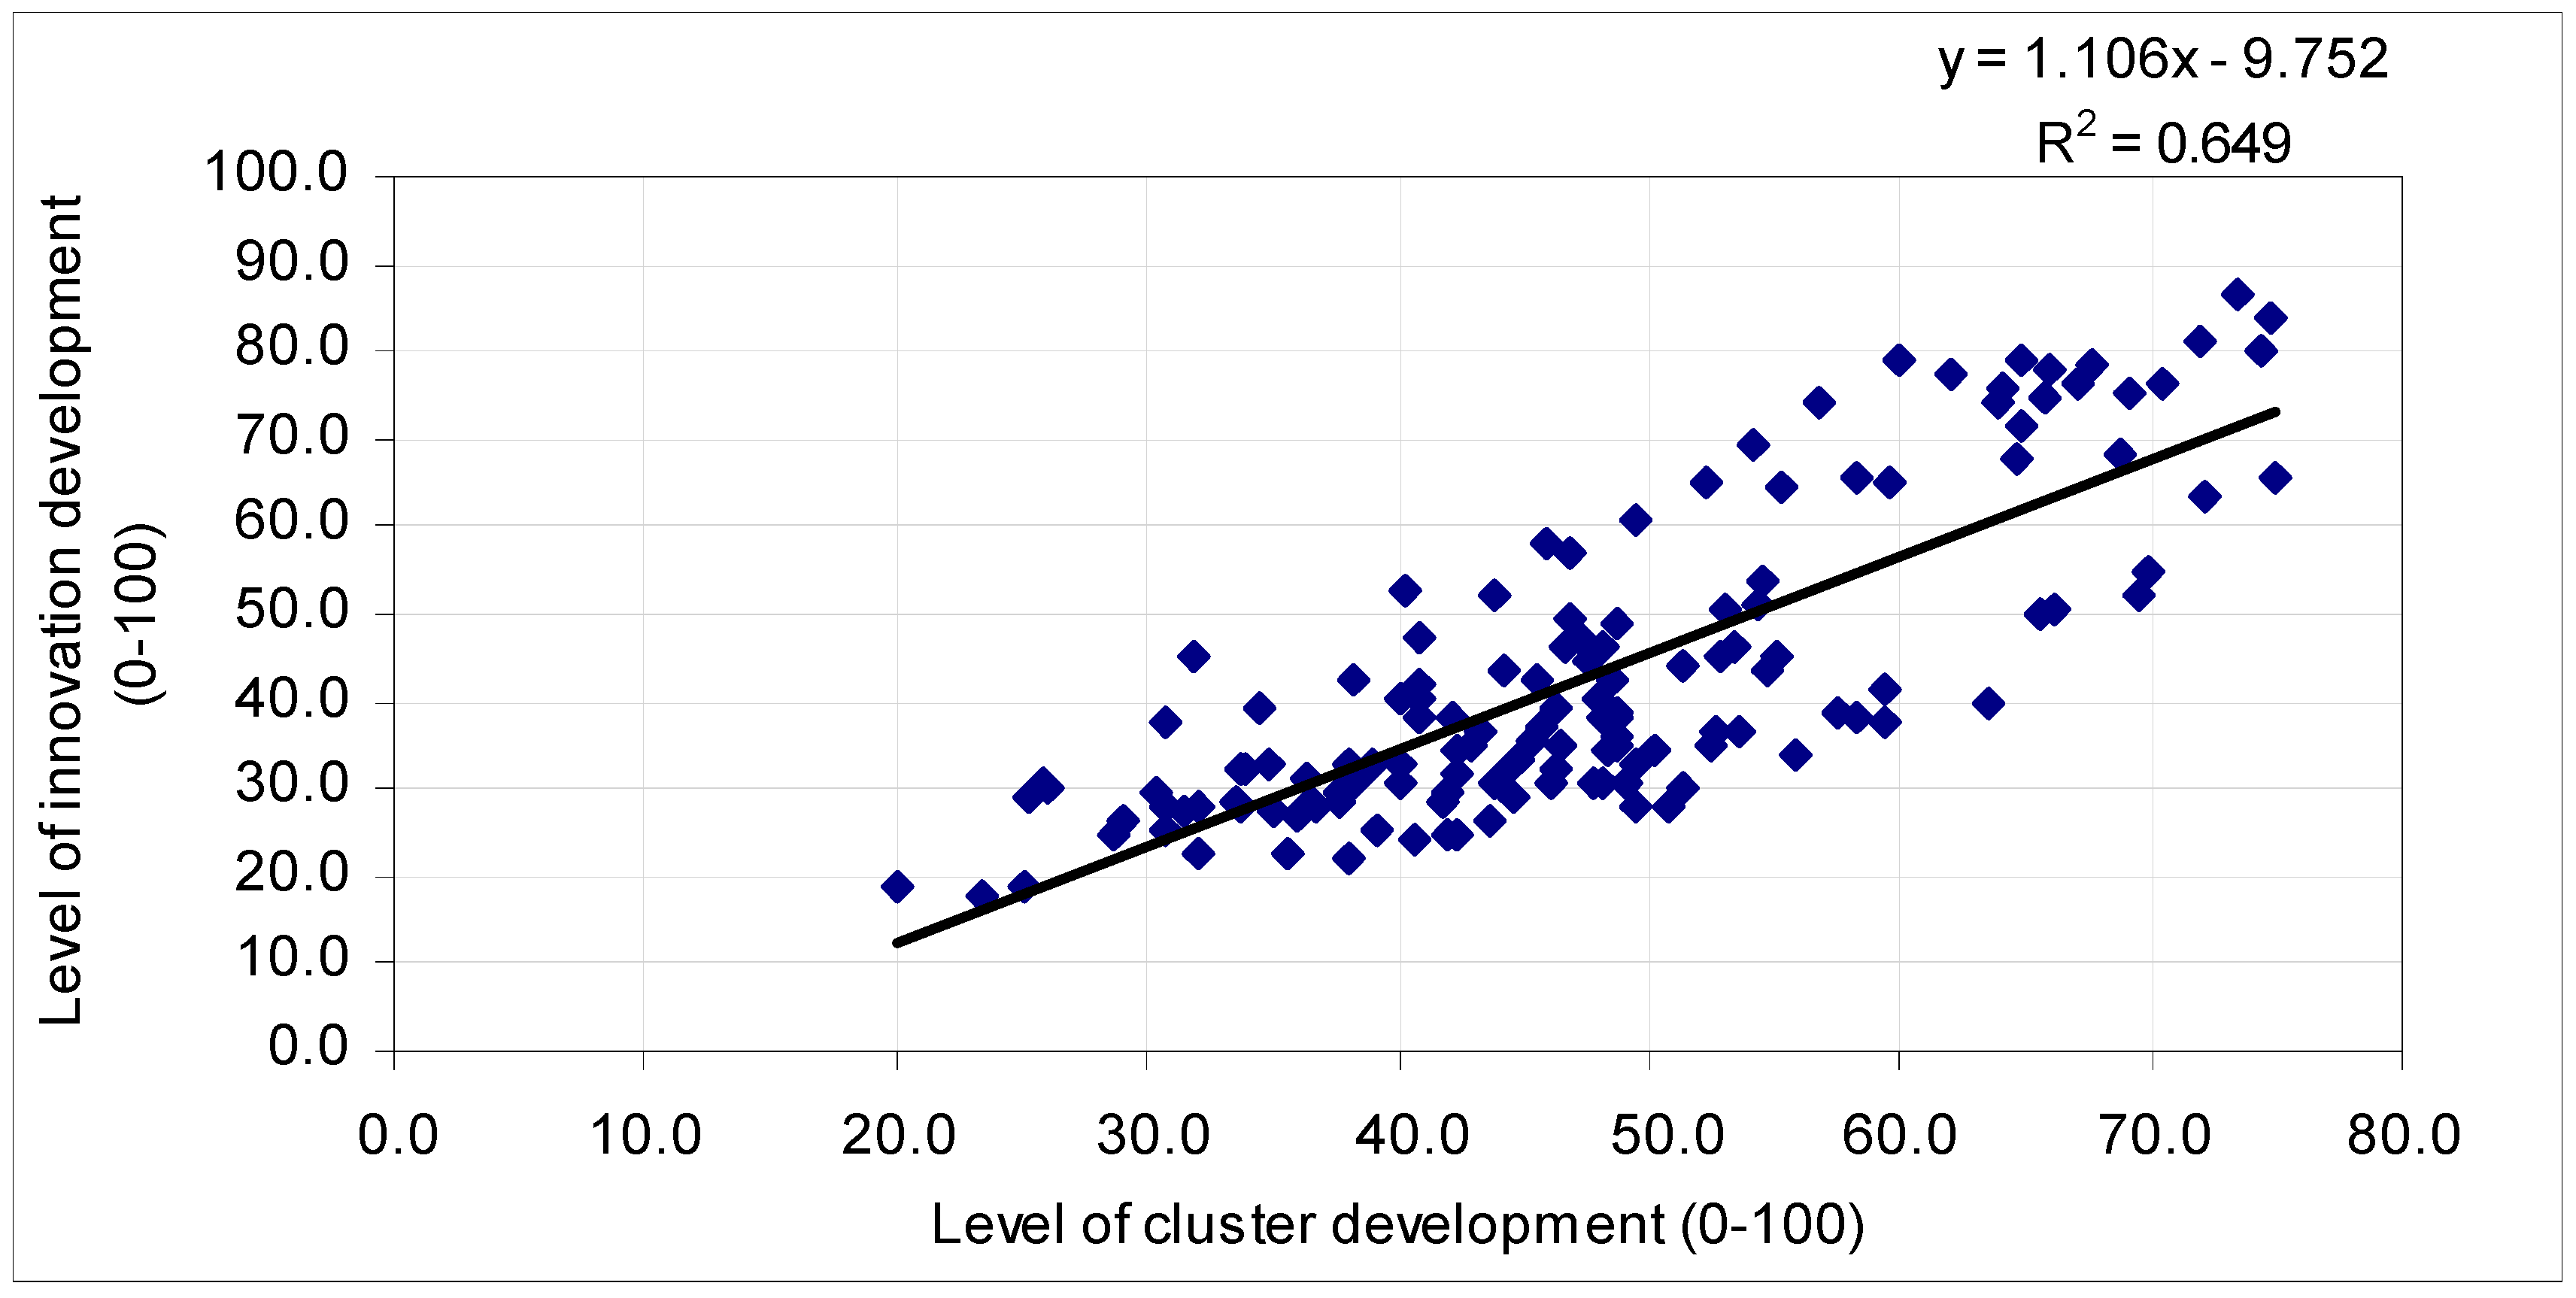
For the innovation development, the coefficients are: b = 1.106; a = 9.752 and the regression equation has the following form:
where is the level of innovation development; is the level of cluster development.
According to the calculation results, the coefficient of determination has been obtained (R2 = 0.649). Since R2 > 0.5, we may conclude that the regression equation is consistent with the original data. Therefore, the coefficient of determination showed that the variation of the level of innovation development by 64.9 % is caused by the variation of the level of cluster development (Figure 4).
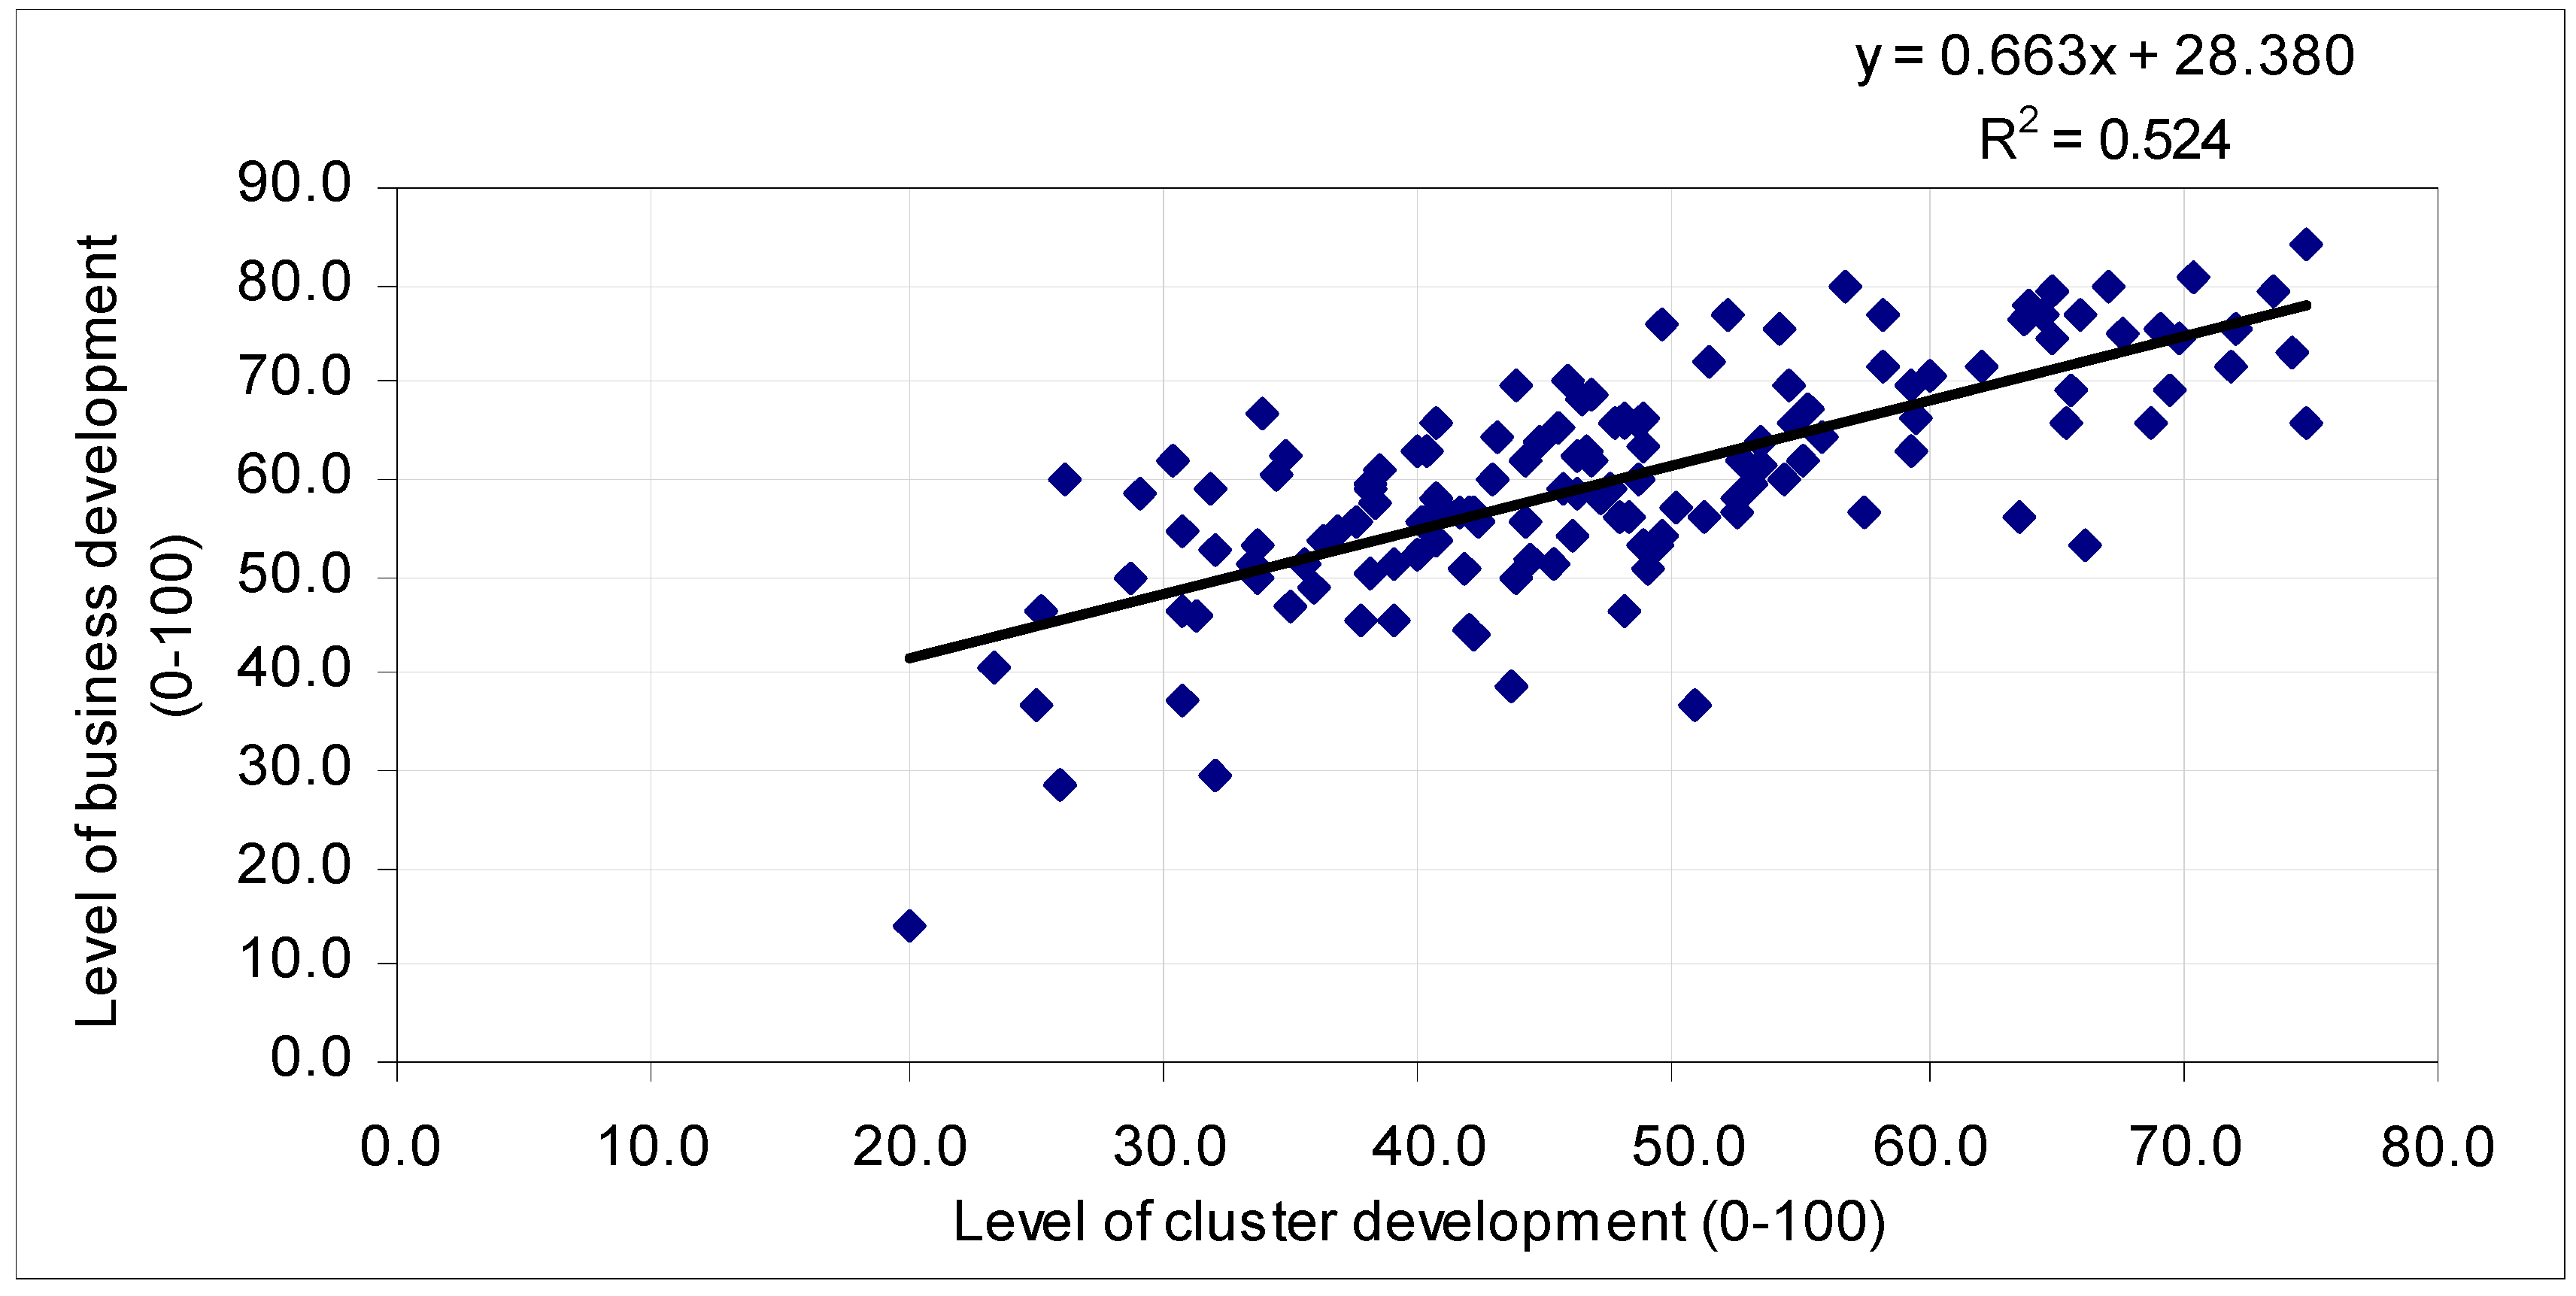
For the business development, the obtained coefficients are: b = 0.663; a = 28.380 and the regression equation has the following form:
where is the level of business development; is the level of cluster development.
According to the calculation results, the coefficient of determination has been obtained (R2 = 0.524). Since R2 > 0.5, we may conclude that the regression equation is consistent with the original data. Therefore, the coefficient of determination showed that the variation of the level of business development by 52.4 % is caused by the variation of the level of cluster development (Figure 5).
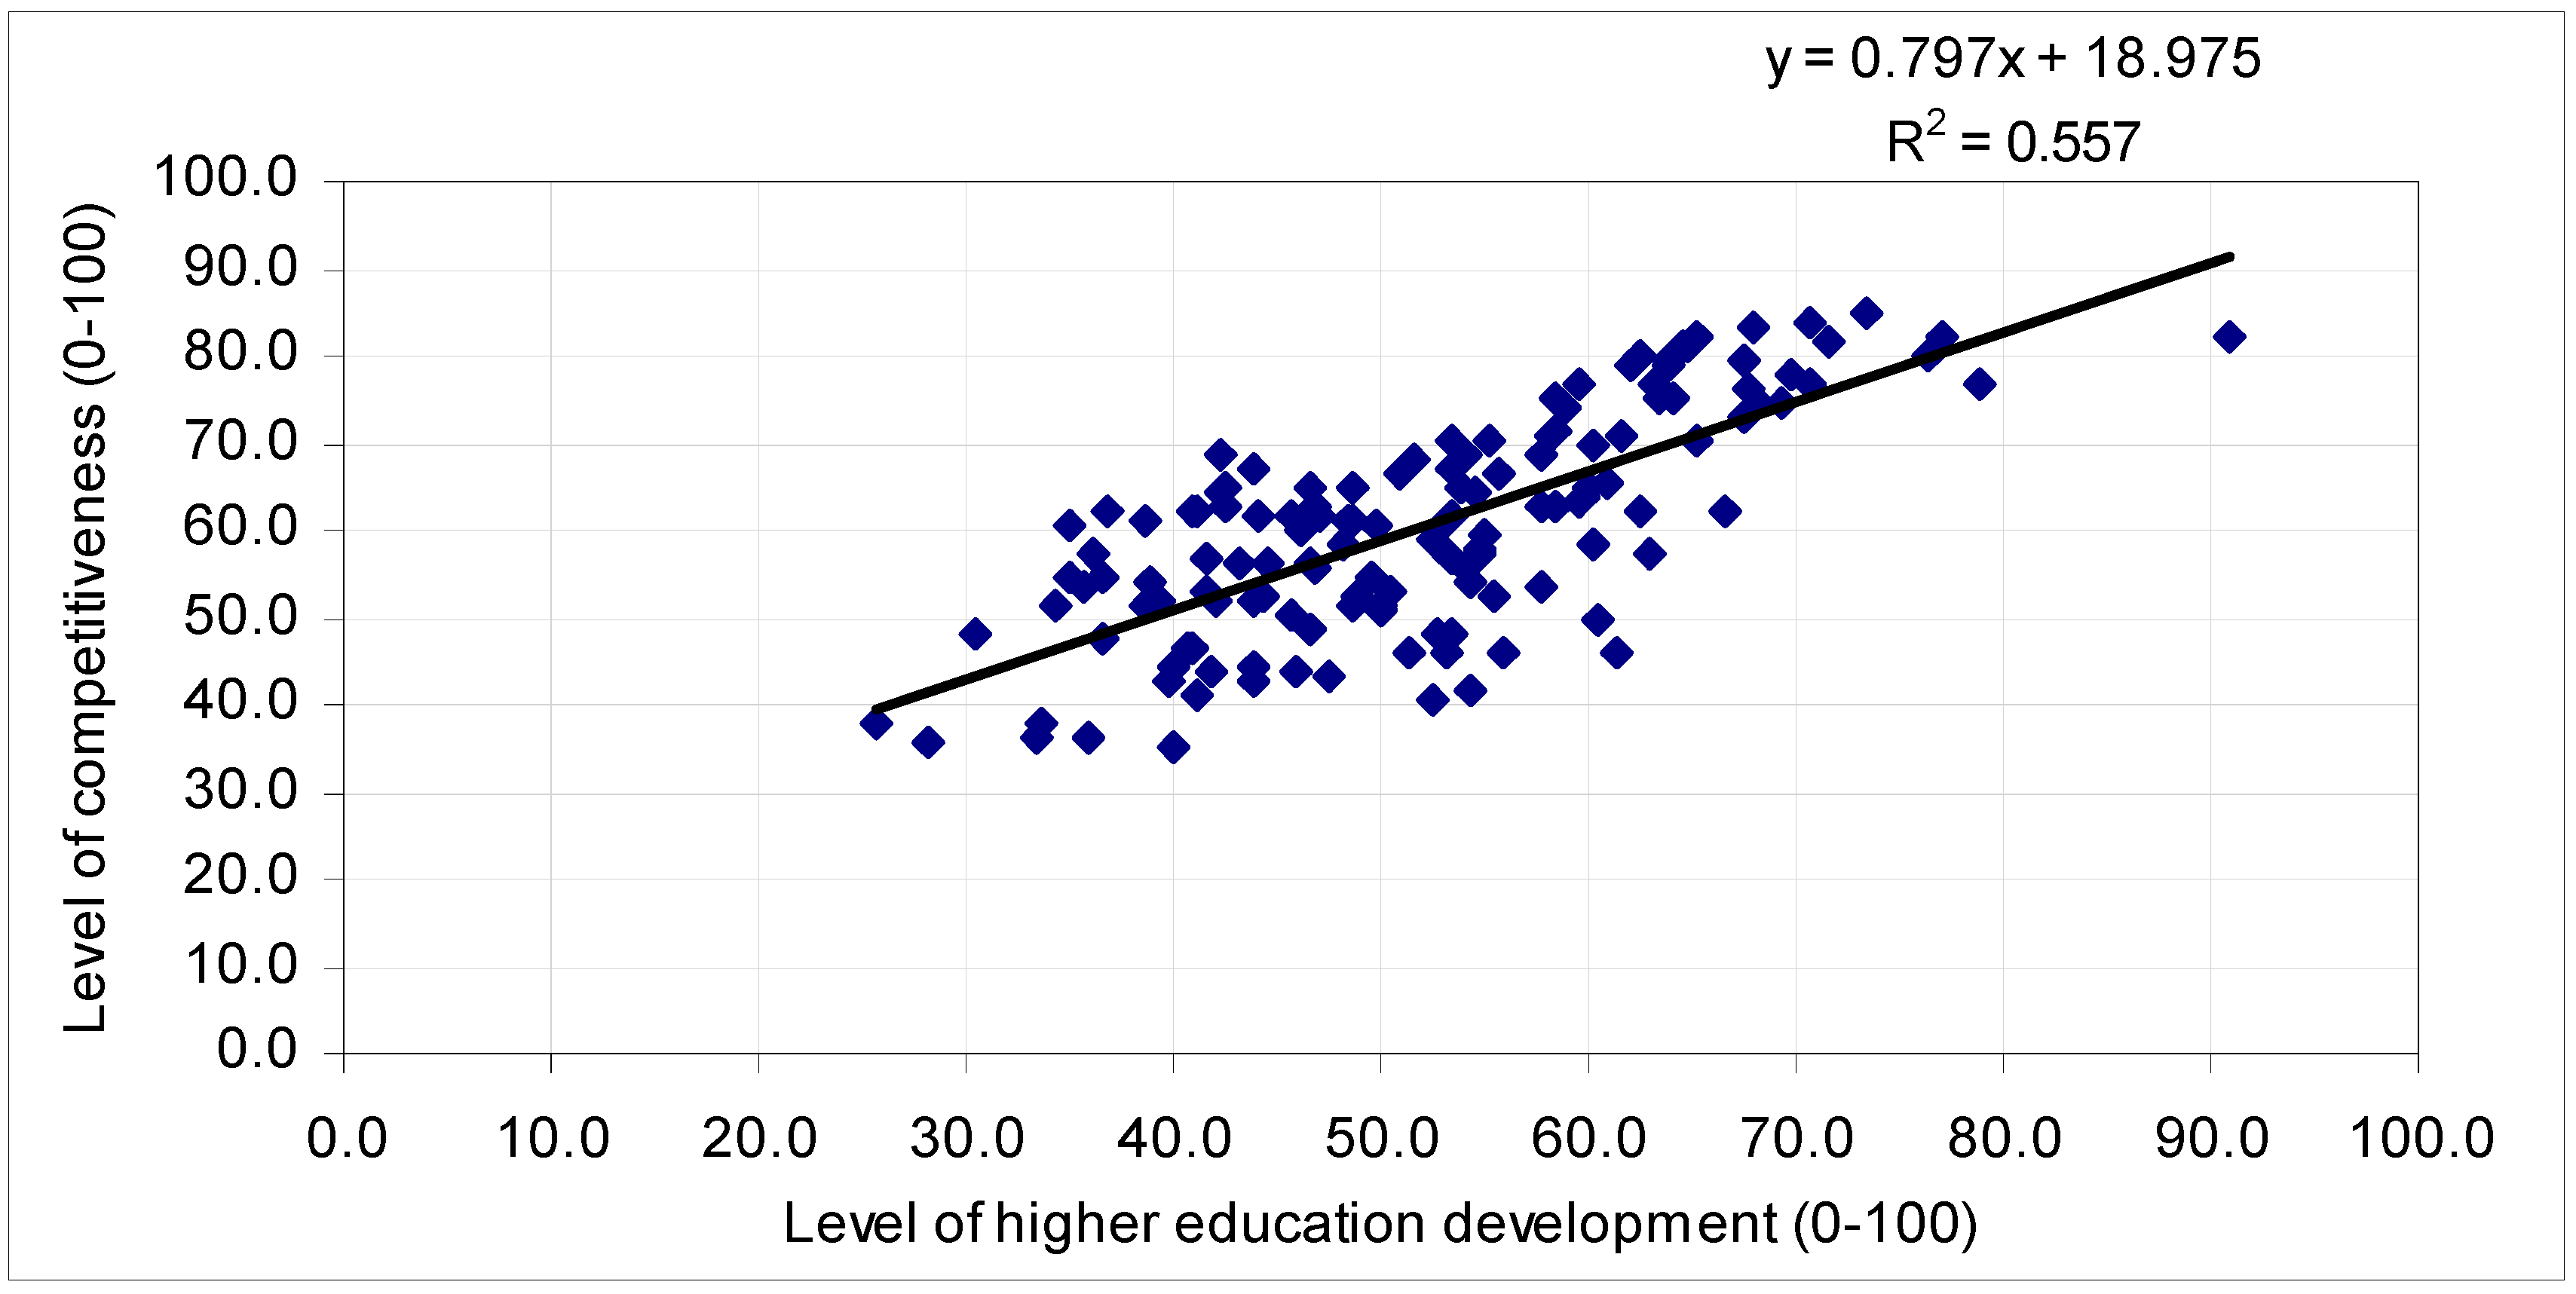
For the relationship between the higher education development and the competitiveness, the obtained coefficients are: b = 0.797; a = 18.975 and the regression equation has the following form:
where is the level of competitiveness; is the level of higher education development.
According to the calculation results, the coefficient of determination has been obtained (R2 = 0.557). Since R2 > 0.5, we may conclude that the regression equation is consistent with the original data. Therefore, the coefficient of determination has shown that the variation of the level of competitiveness by 55.7 % is caused by the variation of the level of higher education development variable (Figure 6).
Based on these results, one can see that there is a close linear dependence between the cluster development of the countries and the higher education development, which allows considering innovative clusters as one of the key factors for increasing higher education competitiveness.
Additionally, the existence of cause and consequence relationships between the level of development of business, innovation and competitiveness allows us to state that the level of development of the abovementioned indicators depends on the competitiveness and quality of higher education. Some explanations should be given regarding the major variables.
The level of cluster development is influenced by the following factors: the presence of a powerful core, which can be an enterprise or a university that serves as the base around which all cluster members unite; participation of research institutions and organizations, which provide the conduct of research and its approbation; support of local self-government bodies, as they create conditions for support of cluster initiatives and promote their development in the future.
The level of higher education development is influenced by the following factors: the level of training of school graduates, because they should receive basic knowledge there; material and technical support, as it has a significant impact on the quality of training of future professionals; the level of scientific and pedagogical staff is another important component, as well as the quality of professional training of graduates and cooperation with innovative structures and research activities of HESs; all these elements are extremely important for the level of higher education development.
The level of innovation development includes the following components: the level of cooperation between universities and business and research institutions, which are the main participants in innovation production; the level of financial support for innovation, an extremely important component; the quantity and quality of innovation research and development, which shows how active innovation is in the state; cooperation with international organizations and commercialization of research, necessary for the exchange of experience and knowledge; government support for innovation, at the legislative level, in public policy and regional development policy.
The main components that are included in the indicator of the level of competitiveness are as follows: the level of socioeconomic development, a multicomponent part, which includes the level of education, health and income of the population; indicators of development of institutions and government, their openness and transparency; the level of development of the infrastructure (production and social), a component that combines a wide range of indicators of socioeconomic activity of the country; macroeconomic stability, because with stable economic growth there is an improvement in all spheres of life; the level of development of science and technology, which shows the number of innovative developments, research and know-how; the level of human development, as an indicator of the society’s development, which directly affects the competitiveness of the country.
5. Conclusions
The conducted research substantiates the positive impact of the involvement of innovative clusters in the HES, which can provide: (1) closer cooperation between HEIs, enterprises and research institutions; (2) attraction of targeted investments in the development of new production technologies and innovative infrastructure for all participants in the educational process; (3) intensification of R&D works, research and construction works, cooperation and targeted training of specialists in HEIs, and long-term partnership studies within the innovative projects; (4) development and introduction of new innovative products, and application of effective mechanisms for attracting investment in education development; (5) creation and development of modern innovative infrastructure in the field of higher education; (6) enhancement of the mobility of students and graduates in the global labor market; (7) satisfaction of the interests of all stakeholders in the educational process.
The scientific novelty of the study is in the development and substantiation of the theoretical and practical principles for determining indicators for evaluating and monitoring the effectiveness of regional innovation clusters in higher education. For the first time, indicators for evaluating and monitoring the effectiveness of regional innovation clusters in the higher education system have been suggested and the impact of regional innovation clusters in the higher education system has been assessed, resulting in a close relationship between the level of development of regional innovation clusters, higher education, innovation, business and competitiveness.
In conclusion, we should note that, in the context of globalization, the important factors of quality and competitiveness of modern higher education include the development of digital literacy and interpersonal skills, whereas the ability to think critically and creatively depends not only on technical achievements, inventions and knowledge creation, but also on organizational changes, which facilitate the commercialization of R&D results and marketing innovations.
Author Contributions
Conceptualization, I.L. and S.S.; methodology, I.L.; software, S.S.; validation, I.L., S.S. and H.D.; formal analysis, I.L., S.S. and H.D.; investigation, S.S.; resources, I.L.; data curation, I.L., S.S. and H.D.; writing—original draft preparation, I.L.; writing—review and editing, S.S. and H.D; visualization, I.L.; supervision, I.L. All authors have read and agreed to the published version of the manuscript.
Funding
This research funding is held in the framework of the research project “Integrated Model of Competitive Higher Education of Ukraine under the Quadruple Helix Concept” (state registration number 0117U007258) at Chernihiv Polytechnic National University.
Conflicts of Interest
The authors declare no conflict of interest.
References
- Hartikainen, S.; Rintala, H.; Pylväs, L.; Nokelainen, P. The Concept of Active Learning and the Measurement of Learning Outcomes: A Review of Research in Engineering Higher Education. Educ. Sci. 2019, 9, 276. [Google Scholar] [CrossRef] [Green Version]
- Pisoni, G. Strategies for Pan-European Implementation of Blended Learning for Innovation and Entrepreneurship (I&E) Education. Educ. Sci. 2019, 9, 124. [Google Scholar] [CrossRef] [Green Version]
- Tadesse, T.; Gillies, R.J.; Campbell, C. Testing Models and Measurement Invariance of the Learning Gains Scale. Educ. Sci. 2018, 8, 192. [Google Scholar] [CrossRef] [Green Version]
- Sá, M.J.; Serpa, S. Transversal Competences: Their Importance and Learning Processes by Higher Education Students. Educ. Sci. 2018, 8, 126. [Google Scholar] [CrossRef] [Green Version]
- Murray, N. Understanding Student Participation in the Internationalised University: Some Issues, Challenges, and Strategies. Educ. Sci. 2018, 8, 96. [Google Scholar] [CrossRef] [Green Version]
- Traxler, J. Distance Learning—Predictions and Possibilities. Educ. Sci. 2018, 8, 35. [Google Scholar] [CrossRef] [Green Version]
- Ossiannilsson, E.; Altinay, F.; Altinay, Z. MOOCs as Change Agents to Boost Innovation in Higher Education Learning Arenas. Educ. Sci. 2016, 6, 25. [Google Scholar] [CrossRef]
- Vignoles, A.; Murray, N. Widening Participation in Higher Education. Educ. Sci. 2016, 6, 13. [Google Scholar] [CrossRef] [Green Version]
- Kholyavko, N.; Mostova, M.; Shestakovska, T. Ukraine’s higher education system development tendencies. Econ. An. XXI 2014, 3, 23–26. [Google Scholar]
- Lysenko, I. The analysis of the global experience of interaction of regional innovation clusters and higher education. Prob. Pr. Econ. Man. 2019, 3, 229–239. [Google Scholar]
- Lysenko, I. Mechanism of interaction of regional innovation clusters and higher education. Prob. Pr. Econ. Man. 2019, 1, 143–154. [Google Scholar]
- Onipko, T. Innovation and Cluster Development as a Factor of Increasing the Competitiveness of Economic Systems. Ph.D. Thesis, Poltava University of Economics and Trade, Poltava, Ukraine, 2019. [Google Scholar]
- Shkarlet, S.; Kholiavko, N.; Dubyna, M. Territorial reform in the system of strategic management of energy-economic and information spheres of the state. Econ. An. XXI 2015, 5–6, 103–107. [Google Scholar]
- Shkarlet, S.; Lytvynov, V.; Dorosh, M.; Trunova, E.; Voitsekhovska, M. The Model of Information Security Culture Level Estimation of Organization. In International Scientific-Practical Conference MODS 2019: Mathematical Modeling and Simulation of Systems Intelligent Systems and Computing, 1019; Springer: Cham, Germany, 2019; pp. 249–258. [Google Scholar]
- Varouchas, E.; Sicilia, M.-Á.; Sánchez-Alonso, S. Academics’ Perceptions on Quality in Higher Education Shaping Key Performance Indicators. Sustainability 2018, 10, 4752. [Google Scholar] [CrossRef] [Green Version]
- Findler, F.; Schönherr, N.; Lozano, R.; Stacherl, B. Assessing the Impacts of Higher Education Institutions on Sustainable Development—An Analysis of Tools and Indicators. Sustainability 2019, 11, 59. [Google Scholar] [CrossRef] [Green Version]
- Velychko, O.; Velychko, L.; Kharytonov, M. Managing Efficiency in Higher Education: A Case of Ukrainian Universities. Soc. Sci. 2018, 7, 138. [Google Scholar] [CrossRef] [Green Version]
- Zhou, G.; Luo, S. Higher Education Input, Technological Innovation, and Economic Growth in China. Sustainability 2018, 10, 2615. [Google Scholar] [CrossRef] [Green Version]
- Arciénaga Morales, A.A.; Nielsen, J.; Bacarini, H.A.; Martinelli, S.I.; Kofuji, S.T.; García Díaz, J.F. Technology and Innovation Management in Higher Education—Cases from Latin America and Europe. Adm. Sci. 2018, 8, 11. [Google Scholar] [CrossRef] [Green Version]
- Simmie, J.; Sennett, J.; Wood, P. Innovation and clustering in the London metropolitan region. In Urban Competitiveness: Policies for Dynamic Cities; Bristol University Press: Bristol, UK, 2002; pp. 161–190. [Google Scholar]
- Engel, J.S. Global Clusters of Innovation: Lessons from Silicon Valley. Calif. Manag. Rev. 2015, 57, 36–65. [Google Scholar] [CrossRef] [Green Version]
- Consortium Linking Universities of Science and Technology for Education and Research. Available online: https://cluster.org (accessed on 8 August 2020).
- Yanchenko, Z. Innovation clusters. Adaptation of the best world experience to national realities. Bus. Inf. 2017, 5, 62–66. [Google Scholar]
- Mazaraki, A. Regional Economics: Glossary of Terms: Manual; KNCEU: Kiev, Ukraine, 2012; p. 120. [Google Scholar]
- Law of Ukraine on Higher Education of 28 September 2017 № 1556-18. Available online: https://zakon.rada.gov.ua/laws/show/1556-18 (accessed on 8 August 2020).
- Jonkers, K.; Tijssen, R.; Karvounaraki, A.; Goenaga, X. A Regional Innovation Impact Assessment Framework for Universities; Publications Office of the European Union: Luxembourg, 2017; Available online: https://www.researchgate.net/publication/323357303_A_Regional_Innovation_Impact_Assessment_Framework_for_universities (accessed on 8 August 2020).
- Knight, J. Updating the Definition of Internationalization. Updated definition of internationalization. Int. Hig. Ed. 2015, 33, 2–3. Available online: https://ejournals.bc.edu/index.php/ihe/article/view/7391/6588 (accessed on 8 August 2020).
- Verbytska, A. Internationalization as the main direction of higher education development. You. Sci. 2017, 11, 160–164. [Google Scholar]
- Diebold, W.; Porter, M.E. The Competitive Advantage of Nations. Foreign Aff. 1990, 69, 180. [Google Scholar] [CrossRef]
- Porter, M. Clusters and the new economics of competition. Harv. Bus. Rev. 1998, 76, 77–90. [Google Scholar] [PubMed]
- Delgado, M.; Porter, M.; Stern, S. Clusters and Entrepreneurship. J. Econ. Geogr. 2010, 10, 495–518. [Google Scholar] [CrossRef]
- Breschi, S.; Malerba, F. The Geography of Innovation and Economic Clustering: Some Introductory Notes. Ind. Corp. Chang. 2001, 10, 817–833. [Google Scholar] [CrossRef]
- Muro, M.; Katz, B. The new cluster moment: How regional innovation clusters can Foster the next economy. Metrop. Policy Progr. Brook. 2010, 1–59. [Google Scholar]
- Tallman, S.; Jenkins, M.; Henry, N.; Pinch, S. Knowledge, Clusters, and Competitive Advantage. Acad. Manag. Rev. 2004, 29, 258–271. [Google Scholar] [CrossRef]
- Turró, A.; Urbano, D.; Peris-Ortiz, M. Culture and innovation: The moderating effect of cultural values on corporate entrepreneurship. In Technological Forecasting & Social Change; Elsevier: Amsterdam, The Netherlands, 2014; Volume 88, pp. 360–369. [Google Scholar]
- Engel, J.S.; Del-Palacio, I. Global networks of clusters of innovation: Accelerating the innovation process. Bus. Horiz. 2009, 52, 493–503. [Google Scholar] [CrossRef]
- Van Looy, B.; DeBackere, K.; Andries, P. Policies to stimulate regional innovation capabilities via university-industry collaboration: An analysis and an assessment. R&D Manag. 2003, 33, 209–229. [Google Scholar] [CrossRef]
- European Commission. Available online: https://ec.europa.eu/growth/industry/policy/cluster_en (accessed on 8 August 2020).
- European Cluster Collaboration Platform. Available online: https://www.clustercollaboration.eu/cluster-mapping (accessed on 8 August 2020).
- European Cluster Observatory. Available online: http://www.clusterobservatory.eu (accessed on 8 August 2020).
- The Global Competitiveness Report 2019. World Economic Forum. Available online: https://www.weforum.org/reports/global-competitiveness-report-2019 (accessed on 8 August 2020).
- Rodgers, J.; Nicewander, W. Thirteen ways to look at the correlation coefficient. Am. Stat. 1988, 42, 59–66. [Google Scholar] [CrossRef]
- Dowdy, S.; Weardon, S.; Chilko, D. Statistics for Research, 3rd ed.; John Wiley & Sons, Inc.: Hoboken, NJ, USA, 2004; pp. 211–256. [Google Scholar]
- Aldrich, J. Correlations Genuine and Spurious in Pearson and Yule. Stat. Sci. 1995, 10, 364–376. [Google Scholar] [CrossRef]
- Damghani, B.M.; Welch, D.; O’Malley, C.; Knights, S. The Misleading Value of Measured Correlation. Wilmott 2012, 2012, 64–73. [Google Scholar] [CrossRef]
- Anscombe, F. Graphs in Statistical Analysis. Am. Stat. 1973, 27, 17–21. Available online: http://0-www-jstor-org.brum.beds.ac.uk/stable/2682899 (accessed on 8 August 2020).
- Chaddock, R. Principles and Methods of Statistics, 1st ed.; Houghton Mifflin Company: Boston, MA, USA, 1925; p. 471. [Google Scholar]
Figure 1.
Cartographic image of existing innovation clusters in the territory of the European Union [39].
Figure 1.
Cartographic image of existing innovation clusters in the territory of the European Union [39].

Figure 2.
The relationship between the cluster development and the higher education development.

Figure 3.
The relationship between the cluster development and the competitiveness.

Figure 4.
The relationship between the cluster development and the innovation development.

Figure 5.
The relationship between the cluster development and the business development.

Figure 6.
The relationship between the higher education development and the competitiveness.


Table 1.
Statistics on Global Competitiveness Index, cluster development levels, higher education, innovation and business for 141 countries of the world (the authors’ sample based on [41]).
Table 1.
Statistics on Global Competitiveness Index, cluster development levels, higher education, innovation and business for 141 countries of the world (the authors’ sample based on [41]).
| # | Country | Mark (0–100) | ||||
|---|---|---|---|---|---|---|
| 1 | Singapore | 84.8 | 69.2 | 73.3 | 75.2 | 75.6 |
| 2 | United States of America | 83.7 | 74.8 | 70.7 | 84.1 | 84.2 |
| 3 | Hong Kong | 83.1 | 72.1 | 67.9 | 63.4 | 75.4 |
| 4 | Netherlands | 82.4 | 70.4 | 77.1 | 76.3 | 80.6 |
| 5 | Japan | 82.3 | 67.7 | 65.3 | 78.3 | 75.0 |
| 6 | Switzerland | 82.3 | 71.9 | 90.8 | 81.2 | 71.5 |
| 7 | Germany | 81.8 | 73.5 | 71.7 | 86.8 | 79.5 |
| 8 | Denmark | 81.2 | 67.1 | 76.8 | 76.2 | 80.0 |
| 9 | Sweden | 81.2 | 64.8 | 64.6 | 79.1 | 79.4 |
| 10 | United Kingdom | 81.2 | 65.9 | 64.7 | 78.2 | 77.0 |
| 11 | Finland | 80.2 | 64.0 | 76.4 | 75.8 | 78.1 |
| 12 | Taiwan, China | 80.2 | 74.3 | 62.4 | 80.2 | 73.1 |
| 13 | Canada | 79.6 | 63.8 | 67.6 | 74.0 | 76.5 |
| 14 | Republic of Korea | 79.6 | 60.0 | 63.9 | 79.1 | 70.5 |
| 15 | France | 78.8 | 62.1 | 62.1 | 77.2 | 71.4 |
| 16 | Australia | 78.7 | 54.2 | 63.8 | 69.5 | 75.3 |
| 17 | Norway | 78.1 | 64.6 | 69.8 | 68.0 | 76.9 |
| 18 | Luxembourg | 77.0 | 68.8 | 70.6 | 68.4 | 65.8 |
| 19 | Israel | 76.7 | 56.8 | 59.6 | 74.2 | 79.6 |
| 20 | New Zealand | 76.7 | 49.5 | 63.2 | 60.6 | 75.8 |
| 21 | Austria | 76.6 | 65.7 | 78.9 | 74.5 | 69.3 |
| 22 | Belgium | 76.4 | 64.9 | 67.8 | 71.4 | 74.4 |
| 23 | Spain | 75.3 | 55.3 | 58.5 | 64.3 | 67.3 |
| 24 | Ireland | 75.1 | 58.3 | 64.1 | 65.5 | 76.9 |
| 25 | United Arab Emirates | 75.0 | 69.5 | 63.3 | 52.3 | 69.3 |
| 26 | Iceland | 74.7 | 52.2 | 69.3 | 65.1 | 77.1 |
| 27 | Malaysia | 74.6 | 69.8 | 68.1 | 55.0 | 74.6 |
| 28 | China | 73.9 | 59.6 | 58.9 | 64.8 | 66.4 |
| 29 | Qatar | 72.9 | 65.5 | 67.5 | 50.0 | 66.0 |
| 30 | Italy | 71.5 | 74.9 | 58.4 | 65.5 | 65.7 |
| 31 | Czech Republic | 70.9 | 46.8 | 58.1 | 56.9 | 68.7 |
| 32 | Estonia | 70.9 | 43.9 | 61.7 | 52.1 | 69.9 |
| 33 | Chile | 70.5 | 45.6 | 65.3 | 42.5 | 65.3 |
| 34 | Portugal | 70.4 | 54.6 | 55.3 | 53.7 | 69.7 |
| 35 | Slovenia | 70.2 | 45.9 | 53.5 | 58.2 | 70.1 |
| 36 | Saudi Arabia | 70.0 | 66.1 | 60.2 | 50.6 | 53.1 |
| 37 | Poland | 68.9 | 46.8 | 42.2 | 49.7 | 62.0 |
| 38 | Malta | 68.5 | 53.1 | 57.8 | 50.5 | 59.4 |
| 39 | Lithuania | 68.4 | 40.8 | 54.2 | 47.1 | 65.6 |
| 40 | Thailand | 68.1 | 51.4 | 51.6 | 43.9 | 72.0 |
| 41 | Latvia | 67.0 | 48.6 | 53.5 | 42.4 | 65.9 |
| 42 | Slovak Republic | 66.8 | 46.6 | 43.9 | 46.3 | 62.8 |
| 43 | Russian Federation | 66.7 | 40.3 | 50.9 | 52.9 | 63.1 |
| 44 | Cyprus | 66.4 | 48.2 | 55.7 | 46.3 | 66.2 |
| 45 | Bahrain | 65.4 | 55.8 | 61.0 | 33.7 | 64.3 |
| 46 | Hungary | 65.1 | 47.2 | 42.6 | 47.4 | 58.1 |
| 47 | Kuwait | 65.1 | 51.3 | 48.7 | 30.3 | 56.1 |
| 48 | Bulgaria | 64.9 | 52.8 | 46.7 | 45.0 | 61.9 |
| 49 | Mexico | 64.9 | 54.7 | 53.9 | 43.6 | 65.8 |
| 50 | Indonesia | 64.6 | 59.4 | 60.1 | 37.7 | 69.6 |
| 51 | Romania | 64.4 | 38.2 | 42.2 | 42.3 | 59.7 |
| 52 | Mauritius | 64.3 | 48.8 | 54.6 | 38.1 | 66.1 |
| 53 | Oman | 63.6 | 59.4 | 59.7 | 41.2 | 62.8 |
| 54 | Uruguay | 63.5 | 40.8 | 59.6 | 38.3 | 58.1 |
| 55 | Kazakhstan | 62.9 | 33.9 | 46.8 | 32.0 | 66.6 |
| 56 | Brunei Darussalam | 62.8 | 44.2 | 57.7 | 43.8 | 61.8 |
| 57 | Azerbaijan | 62.7 | 58.3 | 58.4 | 38.3 | 71.5 |
| 58 | Colombia | 62.7 | 43.2 | 57.7 | 36.4 | 64.2 |
| 59 | Greece | 62.6 | 31.8 | 42.4 | 45.1 | 58.8 |
| 60 | South Africa | 62.4 | 55.1 | 41.0 | 45.2 | 61.9 |
| 61 | Turkey | 62.1 | 47.5 | 36.9 | 44.5 | 58.8 |
| 62 | Costa Rica | 62.0 | 47.9 | 66.7 | 40.3 | 56.3 |
| 63 | Croatia | 61.9 | 30.7 | 41.2 | 37.8 | 54.6 |
| 64 | Philippines | 61.9 | 48.1 | 62.4 | 38.0 | 65.7 |
| 65 | Peru | 61.7 | 40.1 | 47.0 | 32.7 | 55.8 |
| 66 | Panama | 61.6 | 45.8 | 45.6 | 37.3 | 58.8 |
| 67 | Vietnam | 61.5 | 52.6 | 44.0 | 36.8 | 56.5 |
| 68 | India | 61.4 | 54.3 | 53.3 | 50.9 | 60.0 |
| 69 | Armenia | 61.3 | 46.3 | 48.3 | 39.4 | 62.5 |
| 70 | Brazil | 60.9 | 48.7 | 38.6 | 48.9 | 60.2 |
| 71 | Jordan | 60.9 | 57.5 | 53.1 | 38.8 | 56.6 |
| 72 | Serbia | 60.9 | 40.0 | 48.7 | 40.2 | 63.1 |
| 73 | Montenegro | 60.8 | 44.8 | 49.8 | 33.3 | 64.0 |
| 74 | Georgia | 60.6 | 34.8 | 34.9 | 32.7 | 62.2 |
| 75 | Morocco | 60.0 | 42.9 | 46.2 | 35.1 | 59.8 |
| 76 | Seychelles | 59.6 | 53.4 | 55.1 | 46.1 | 61.5 |
| 77 | Barbados | 58.9 | 34.5 | 52.4 | 39.1 | 60.4 |
| 78 | Dominican Republic | 58.3 | 50.2 | 48.1 | 34.6 | 57.1 |
| 79 | Jamaica | 58.3 | 46.5 | 60.2 | 34.9 | 68.3 |
| 80 | Trinidad and Tobago | 58.3 | 42.3 | 52.8 | 34.4 | 56.7 |
| 81 | Albania | 57.6 | 30.4 | 54.7 | 29.8 | 61.8 |
| 82 | Northern Macedonia | 57.3 | 38.6 | 36.1 | 31.8 | 61.2 |
| 83 | Argentina | 57.2 | 40.8 | 62.9 | 41.7 | 58.3 |
| 84 | Sri Lanka | 57.1 | 48.7 | 54.8 | 34.9 | 60.0 |
| 85 | Ukraine | 57.0 | 40.9 | 53.4 | 40.1 | 57.2 |
| 89 | Moldova | 56.7 | 26.1 | 41.6 | 29.9 | 60.1 |
| 87 | Tunisia | 56.4 | 38.1 | 44.6 | 32.6 | 59.0 |
| 88 | Algeria | 56.3 | 48.3 | 46.5 | 34.4 | 56.2 |
| 89 | Lebanon | 56.3 | 48.8 | 43.1 | 38.5 | 53.0 |
| 90 | Ecuador | 55.7 | 39.0 | 54.2 | 33.0 | 45.7 |
| 91 | Botswana | 55.5 | 36.3 | 46.8 | 31.4 | 53.8 |
| 92 | Bosnia and Herzegovina | 54.7 | 33.6 | 35.0 | 28.4 | 51.1 |
| 93 | Egypt | 54.5 | 63.6 | 36.7 | 39.6 | 56.1 |
| 94 | Namibia | 54.5 | 45.4 | 49.5 | 35.6 | 51.2 |
| 95 | Kenya | 54.1 | 53.5 | 54.4 | 36.3 | 63.9 |
| 96 | Kyrgyz Republic | 54.0 | 29.1 | 38.8 | 26.2 | 58.6 |
| 97 | Paraguay | 53.6 | 35.6 | 35.6 | 22.4 | 51.2 |
| 98 | Guatemala | 53.5 | 44.3 | 57.7 | 31.5 | 55.8 |
| 99 | Iran | 53.0 | 42.1 | 41.5 | 38.0 | 44.3 |
| 100 | Rwanda | 52.8 | 47.7 | 50.4 | 30.9 | 65.6 |
| 101 | El Salvador | 52.6 | 32.1 | 44.2 | 27.9 | 52.7 |
| 102 | Honduras | 52.6 | 46.0 | 48.9 | 30.6 | 54.0 |
| 103 | Mongolia | 52.6 | 33.7 | 44.4 | 32.3 | 53.3 |
| 104 | Tajikistan | 52.4 | 36.8 | 55.4 | 28.0 | 54.8 |
| 105 | Bangladesh | 52.1 | 43.9 | 39.4 | 30.7 | 49.9 |
| 106 | Cambodia | 52.1 | 48.1 | 42.1 | 30.9 | 46.6 |
| 107 | Bolivia | 51.8 | 30.7 | 43.9 | 27.7 | 46.6 |
| 108 | Nepal | 51.6 | 37.6 | 38.7 | 29.4 | 55.8 |
| 109 | Nicaragua | 51.5 | 33.7 | 34.3 | 27.8 | 49.8 |
| 110 | Pakistan | 51.4 | 48.8 | 48.6 | 35.8 | 63.3 |
| 111 | Ghana | 51.2 | 49.5 | 50.1 | 32.9 | 54.1 |
| 112 | Cape Verde | 50.8 | 42.3 | 50.1 | 24.8 | 44.0 |
| 113 | Laos | 50.1 | 50.8 | 45.7 | 28.0 | 36.8 |
| 114 | Senegal | 49.7 | 42.4 | 60.4 | 31.9 | 55.6 |
| 115 | Uganda | 48.9 | 42.0 | 46.5 | 29.5 | 56.4 |
| 116 | Nigeria | 48.3 | 46.3 | 30.5 | 32.2 | 58.5 |
| 117 | Tanzania | 48.2 | 49.4 | 52.8 | 27.7 | 53.3 |
| 118 | Ivory Coast | 48.1 | 38.3 | 53.4 | 30.7 | 57.6 |
| 119 | Gabon | 47.5 | 25.3 | 36.5 | 29.0 | 46.4 |
| 120 | Zambia | 46.5 | 41.7 | 41.0 | 28.6 | 56.4 |
| 121 | Eswatini | 46.4 | 41.9 | 40.6 | 24.5 | 50.7 |
| 122 | Guinea | 46.1 | 52.5 | 61.3 | 34.9 | 58.2 |
| 123 | Cameroon | 46.0 | 40.0 | 51.4 | 30.8 | 52.4 |
| 124 | Gambia | 45.9 | 49.1 | 53.1 | 30.5 | 51.0 |
| 125 | Benin | 45.8 | 36.5 | 55.8 | 28.4 | 53.7 |
| 126 | Ethiopia | 44.4 | 37.7 | 40.1 | 28.3 | 45.3 |
| 127 | Zimbabwe | 44.2 | 31.4 | 43.8 | 27.2 | 45.8 |
| 128 | Malawi | 43.7 | 35.9 | 41.9 | 26.9 | 48.8 |
| 129 | Mali | 43.6 | 44.5 | 45.8 | 29.0 | 51.8 |
| 130 | Burkina Faso | 43.4 | 28.7 | 47.5 | 24.8 | 49.9 |
| 131 | Lesotho | 42.9 | 38.1 | 39.7 | 21.8 | 50.1 |
| 132 | Madagascar | 42.9 | 39.1 | 43.8 | 25.3 | 51.3 |
| 133 | Venezuela | 41.8 | 25.9 | 54.4 | 30.9 | 28.6 |
| 134 | Mauritania | 40.9 | 43.7 | 41.1 | 26.3 | 38.9 |
| 135 | Burundi | 40.3 | 40.7 | 52.5 | 24.4 | 53.7 |
| 136 | Angola | 38.1 | 25.1 | 25.6 | 18.8 | 36.7 |
| 137 | Mozambique | 38.1 | 35.0 | 33.6 | 27.4 | 46.8 |
| 138 | Haiti | 36.3 | 20.1 | 33.4 | 18.9 | 14.1 |
| 139 | Congo | 36.1 | 23.5 | 36.0 | 18.0 | 40.5 |
| 140 | Yemen | 35.5 | 30.8 | 28.1 | 25.3 | 37.4 |
| 141 | Chad | 35.1 | 32.1 | 39.9 | 22.7 | 29.7 |
© 2020 by the authors. Licensee MDPI, Basel, Switzerland. This article is an open access article distributed under the terms and conditions of the Creative Commons Attribution (CC BY) license (http://creativecommons.org/licenses/by/4.0/).
Share and Cite
MDPI and ACS Style
Lysenko, I.; Stepenko, S.; Dyvnych, H. Indicators of Regional Innovation Clusters’ Effectiveness in the Higher Education System. Educ. Sci. 2020, 10, 245. https://0-doi-org.brum.beds.ac.uk/10.3390/educsci10090245
AMA Style
Lysenko I, Stepenko S, Dyvnych H. Indicators of Regional Innovation Clusters’ Effectiveness in the Higher Education System. Education Sciences. 2020; 10(9):245. https://0-doi-org.brum.beds.ac.uk/10.3390/educsci10090245
Chicago/Turabian StyleLysenko, Iryna, Serhii Stepenko, and Hanna Dyvnych. 2020. "Indicators of Regional Innovation Clusters’ Effectiveness in the Higher Education System" Education Sciences 10, no. 9: 245. https://0-doi-org.brum.beds.ac.uk/10.3390/educsci10090245
Note that from the first issue of 2016, this journal uses article numbers instead of page numbers. See further details here.