A Learning Analytics Theoretical Framework for STEM Education Virtual Reality Applications


1
Department of Future Technologies, Center for Learning Analytics, University of Turku, 20014 Turku, Finland
2
Department of Communication and Digital Media, University of Western Macedonia, 52100 Kastoria, Greece
*
Author to whom correspondence should be addressed.
Educ. Sci. 2020, 10(11), 317; https://0-doi-org.brum.beds.ac.uk/10.3390/educsci10110317
Submission received: 6 October 2020
/
Revised: 31 October 2020
/
Accepted: 31 October 2020
/
Published: 3 November 2020
(This article belongs to the Special Issue New Research and Trends in Higher Education)
Abstract
:While virtual reality has attracted educators’ interest by providing new opportunities to the learning process and assessment in different science, technology, engineering and mathematics (STEM) subjects, the results from previous studies indicate that there is still much work to be done when large data collection and analysis is considered. At the same time, learning analytics emerged with the promise to revolutionise the traditional practices by introducing new ways to systematically assess and improve the effectiveness of instruction. However, the collection of ‘big’ educational data is mostly associated with web-based platforms (i.e., learning management systems) as they offer direct access to students’ data with minimal effort. Thence, in the context of this work, we present a four-dimensional theoretical framework for virtual reality-supported instruction and propose a set of structural elements that can be utilised in conjunction with a learning analytics prototype system. The outcomes of this work are expected to support practitioners on how to maximise the potential of their interventions and provide further inspiration for the development of new ones.
1. Introduction
As new statistical data show, STEM (science, technology, engineering, and mathematics) education is expanding rapidly in most developed countries and thus, the necessity to provide learners with well-designed instructional contexts becomes even more imperative. This statement is aligned to the outcomes of previous studies [1,2], which stressed the importance of assisting learners to understand the acquired knowledge in-depth, albeit the difficulties that instructional designers face when preparing specific laboratory exercises (including experiments and practice-based tasks) pertinent to the STEM fields cannot be easily disregarded. For instance, field-based experiments require complex transportation to different locations whereas some of the laboratory-based tasks may be too dangerous (e.g., an electric shock caused due to the incorrect wiring of electrical wires in an electrical engineering course) or too expensive to be performed in the real world (e.g., use of hard-to-acquire specialised equipment). Additionally, the limited training, or the lack of awareness that students may have on matters related to lab safety and security further increase the risks for injuries or even fatalities [2,3]. To prevent such issues from occurring, the presence of the instructor is essential however, even then, the limited attention that individuals receive—e.g., due to the time-management constraints—has been reported as a factor causing negative emotions and behaviour (e.g., frustration, dissatisfaction) [3,4]. Such shortcomings are linked to serious complications towards the theoretical knowledge development or the conceptual experience advancement when abstract topics are under consideration, and that may hinder students’ confidence to apply such practices in the future [5].
A proposed solution to eliminate the impact of such drawbacks considers the adoption and the integration of interactive technologies which can make the educational processes more efficient and effective [2,6]. This is also aligned to the route that wants employees to be undertaking frequent training tasks in simulated environments [7,8]. As a result, the need to analyse the potential and the shortcomings of the computer-supported instructional strategy is of critical importance [9].
However, understanding how to maximise the effectiveness of the instructional design strategy, based on the theory that each STEM subject imposes, is a complicated and demanding process. The solution to this matter is identified in the potential that the technological tools (per se) offer several opportunities for the collection of large datasets which can provide information related to the educational context, the utilised instructional strategy and the behavior of the learners. Therefore, by collecting and interpreting such information, content and instructional designers as well as researchers and educators can increase the effectiveness of the learning strategy, facilitate the learning process, and prevent the development of misconceptions [10,11].
Virtual reality (VR) has been steadily gaining momentum in STEM education as researchers, educators, and industry practitioners tend to design and develop more and more applications that promote experiential and active learning; as opposed to the traditional teacher-centered (passive) approach [1,4]. In addition, under the aid of third-party equipment—such as cave automatic virtual environments (CAVEs) or head-mounted displays (HMDs)—users are free from external distractions and can thus, achieve greater levels of immersion. Relevant studies [5,6,9,10,11,12] have concluded that the high representational fidelity of the graphics affects the realism of the activities and thus, leads users to develop the so-called sense of presence. Sense of presence or, otherwise, immersion has been correlated with positive learning outcomes and results (e.g., attainment of different learning objectives, cultivation of cognitive thinking skills).
However, despite the increasing movement towards evidence-informed VR-supported instruction, very few systematic efforts can be identified to date where applied learning analytics (LA) practices are discussed. In addition, no concrete solution exists to analyse and present the potential benefits of using VR in different STEM subjects. This inadequacy of the literature motivated this initial attempt to describe and propose a theoretical design framework that could assist educators, scholars, researchers, and policymakers to gather large data sets in order to analyse the potential of VR applications in combination with LA models.
Therein, in the context of this work, we filtered and analysed the elements that influence VR-support instruction the most and further combined them with LA practices. We believe that researchers and developers who are interested in these disciplines and envision a similar instruction-and-assessment system will find this work as the “go-to” source on the basis of which actual research and development efforts can be initiated.
The remainder of this manuscript is organised as follows: in Section 2 we synthesise the conclusions of different works related to the integration of VR and LA in STEM education and align them to the instructional design perspective. Section 3 entails the rationale and the purpose of the proposed theoretical design framework wherein, the design decisions are justified and the proposed developmental tools are analysed. Section 4 encompasses the main contribution and implications (conceptual, theoretical, and practical) made by this work. Section 5 discusses the potential of this work by blending conceptual and developmental elements of the proposed framework. Finally, Section 6 concludes with the most important limitations and provides directions for future research and development.
2. Background
2.1. Virtual Reality in STEM Education
Heim [12] argued over the potential of virtual reality (VR) by attributing its added value to three fundamental elements: interactivity, immersion, and information intensity. Despite the time that has passed since this claim was made, the experimental studies that have been performed ever since not only confirmed its validity but, also, revealed the additional benefits that such “tools” can bring to the educational scenery [3,13]. Therein, in the context of this work, we adopt the definition that Gigante [14] coined, which defines VR as the computer-supported setting that enhances the real-world experience through the provision of multi-aesthetic stimuli (e.g., visual, audio, motion). Additionally, we expand the notion of this definition by providing a brief overview of the VR-supported (educational) settings that are available to date (e.g., room-scale VR such as CAVE, standalone-VR such as Oculus Rift, HTC Vive, and mobile-VR such as Samsung Gear VR, Google Cardboard).
The aforementioned setups promote different levels of embodiment (immersion) and offer variable opportunities for knowledge acquisition and construction (information intensity) whereas, the inclusion of haptic sensors, brings additional opportunities for interactivity and engagement. In a sense, this is what differentiates VR from other educational technology tools—i.e., the opportunity offered to learners to undertake both passive learning (e.g., observation of natural phenomena) and active learning activities (e.g., laboratory-related experiments) without spatiotemporal or time constraints. However, none of the above would have been possible without the rapid technological advancement of computing devices and the vast evolution of VR [15].
The integration of VR in different educational contexts is already playing a significant role as it has facilitated the application of contemporary instructional methods which enable learners to immerse themselves in the subject under investigation and thus, develop the cognitive strategies (e.g., problem-solving, critical thinking, creativity) that are essential in the 21st century [3,10]. Aligned to the notion of this claim, a common observation across the STEM education disciplines can be made regarding the nature of the programs and the respective interventions which follow (primarily) the principles of the experiential learning model. It, therefore, comes with no surprise why such tremendous efforts have been made to integrate immersive technologies to every education level which involves matters related to the STEM disciplines. This is also in line with the conclusions that [11] have drawn which attribute the successful integration of such technologies to the high degree of embodiment that users develop when interacting with the (digital) objects that have been customised following their personal needs and demands [9,11].
2.2. Instructional Design in Virtual Reality
Instructional design methods comprised strategies (e.g., instructor-guided, self-directed) and techniques (e.g., simulations, gamification) aimed at helping educators to contextualise the learning process and learners to link the concepts under investigation with their prior knowledge and experiences [16,17]. In other words, instructional design helps learners to understand what kind of information is provided within a specific context, how this information can be translated into knowledge acquisition, and how the constructed knowledge can be applied more effectively into practice [18,19]. The aforementioned processes are directly linked to the learning performance, which concerns the range of fluctuations in learners’ knowledge development or behavior during the different stages of the intervention, and the learning outcomes (e.g., satisfaction, achievements, acquired knowledge/skills, competencies) that learners are expected to achieve at the end of the intervention [20].
The findings from the VR-supported educational activities are well-documented by a substantial body of literature as are the benefits that this technology brings to the learning process. Below, we provide a summary of the most important elements that influence the respective educational practices:
- Student-centered learning: Aligned to the principles of (social) constructivism and constructionism, the visually rich environment and the experimental nature of VR enable students to develop strong mental representations of the information sources through hands-on and collaborative activities [21,22].
2.3. Learning Analytics
Educational practitioners and scholars have attempted to define LA from different perspectives. For instance, a portion of researchers [27,28,29] account them as an alternative method to gather student-generated data to provide personalised learning experiences. Others [30,31] set the focus on the patterns that can be developed from the students’ learning behaviour to inform future instructional design decisions. Long and Siemens [32] have proposed a definition which considers and rounds up the aforementioned perspectives by suggesting that LA is a method to collect longitudinal educational data and a process that utilises the collected data to optimise learning and the environment in which it occurs. A significant number of researchers from different disciplines and fields (e.g., applied statistics, artificial intelligence, data Science) are working in collaboration to identify the diverse learning needs that students have and improve the present educational practices [32]. To achieve this goal, large sets of heterogeneous data—from different educational levels and sources—are collected, explored, and analysed using machine learning (ML) models. The outcomes of this process provide diverse, but equally useful, feedback to the educational stakeholders concerning learners’ performance, the shortcomings of the utilised instructional approach, and the inadequacies of the course under investigation [33,34].
The added value of LA can be examined from different points of view. Below, we present the key-areas that LA influence, after considering the interests and the needs that the various stakeholders (e.g., learners, educators, instructional designers, policymakers) have:
- Learners: Alter the learning habits by identifying patterns and paths that can support the attainment of the learning objectives and ensure the achievement of the predefined goals.
- Educators: Improve the quality of teaching based on real-time and summative data that mirror learners’ performance, involvement, and engagement throughout the time.
- Instructional designers: Increase the quality of instruction based on the analysis of the elements that have been utilised the most, the feedback from the students on the provided interventions, and the comments of the teachers.
- Policymakers: Develop clear and accurate awareness of current and future tendencies to inform the subsequent decisions and policymaking.
3. The Theoretical Framework Design
3.1. Rationale and Purpose
Accounting to the above, the desirable outcome of this work is to provide a theoretical framework that offers educators and instructional designers suggestions related to the data that can be collected from different VR-supported educational interventions and recommendations on the connections that may exist amongst them. To facilitate this goal, the main objectives of this work are split into three consecutive stages.
In the context of this manuscript, we elaborate on and discuss the perquisites that characterise the requirements of the first stage as presented below:
- Development of a theoretical design framework which takes under consideration the research gaps that have been identified from the examination of the relevant literature.
- Analysis of an instructional approach that can determine students, educators, and practitioners from different STEM fields while uncovering the most relevant variables related to this classification.
- Identification of the most efficient ML models for the analysis of the error-related behaviors and the determination of the patterns that will improve the provided instruction.
In the second stage, we plan on using the proposed framework to design a functional prototype of a VR learning tool which can be applied in various iterations within the STEM education fields for evaluation purposes. Finally, in the third stage, it is expected that a complete training and assessment session is provided by utilising solely the recommendations of the LA measurements.
To achieve the objectives of the first stage, we propose the use of different approaches based on which the student models are shaped from the information that can be retrieved from the VR application and the companion learning management system (LMS). The proposed methodology that leads to the practical development of the proposed framework also comprises three parts, which are:
- Use of statistical analysis models to classify students after collecting data from several VR-supported training sessions. The initial dataset includes information related to the course design, the learners’ profile, and the interactions that the students had during the VR training task. For the construction of the final model it is expected that several statistical models are considered so as to increase the prediction accuracy and the reliability of the results.
- Use of different feature importance analysis (FIA) methods to identify the most effective classifiers per task, the relevant variables, and their impact on determining students’ success or failure for the task under consideration.
- Use of an exploratory data analysis (EDA) tool to identify the relationships between the recorded errors. To this end, the clustered information is exported visually to develop different hypotheses related to the underlying reasons that drive these relations. For the visual representation, the LA guidelines that Baker and Yacef [35] have proposed can be applied.
3.2. Theoretical Framework Analysis
According to Hevner et al. [36] the design science research methodology is one of the most appropriate methods for the development of an information technology or information system artifact which, in this case, is the proposed theoretical framework. The main principle of this approach suggests the deconstruction of important problems on the grounds of which sound (technical) solutions can be developed. Therein, during the literature review that was conducted in the context of this work, we identified a set of issues that have not been yet addressed. These shortcomings, provide the foundation based on which we design the main requirements of this framework as presented below:
- LA models are applied primarily to data that originate from LMS without considering alternative or supplementary tools.
- The main sources for data collection consider the information that derives either from the technological or the pedagogical perspective of the tool/intervention but disregard partially or even completely the psychological one.
- Relevant studies examine the correlations that may exist between a finite set of dependent variables (e.g., demographics, credits, grades) against non-classified parameters that are relevant to specific contexts and fields. This endangers the essence and the further evolution of LA as it prevents the collection and the sharing of large and homogenous data sets.
- By cross-examining the latest (systematic) literature reviews, it became apparent that there is still a lack of a universally accepted comprehensive framework and/or system capable of providing the involved stakeholders with suggestions on the typology of the data that should be collected or recommendations on how to interpret such data to evaluate specific elements and improve their practices.
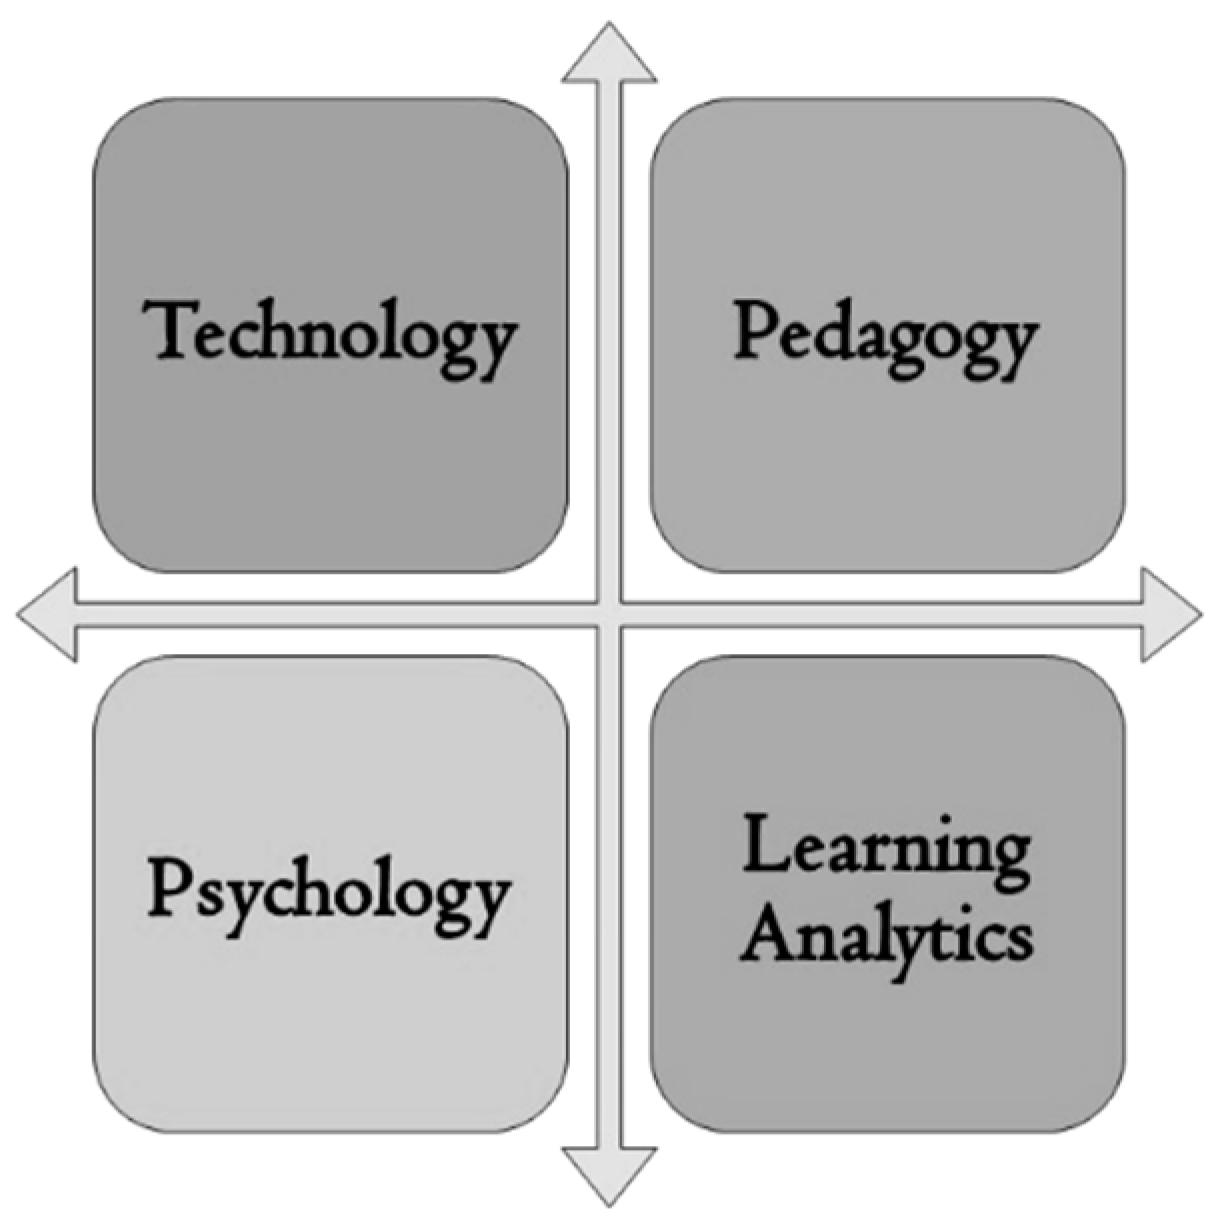
According to the above, the proposed framework (Figure 1) blends the aforementioned points by integrating the use of LA models for processing and cross-examination of the information related to:
- (a)
- the technical affordances of the utilised tools;
- (b)
- the instructional design choices that practitioners and educators make,
- (c)
- the psychological elements that influence learning.
3.3. Design Decisions
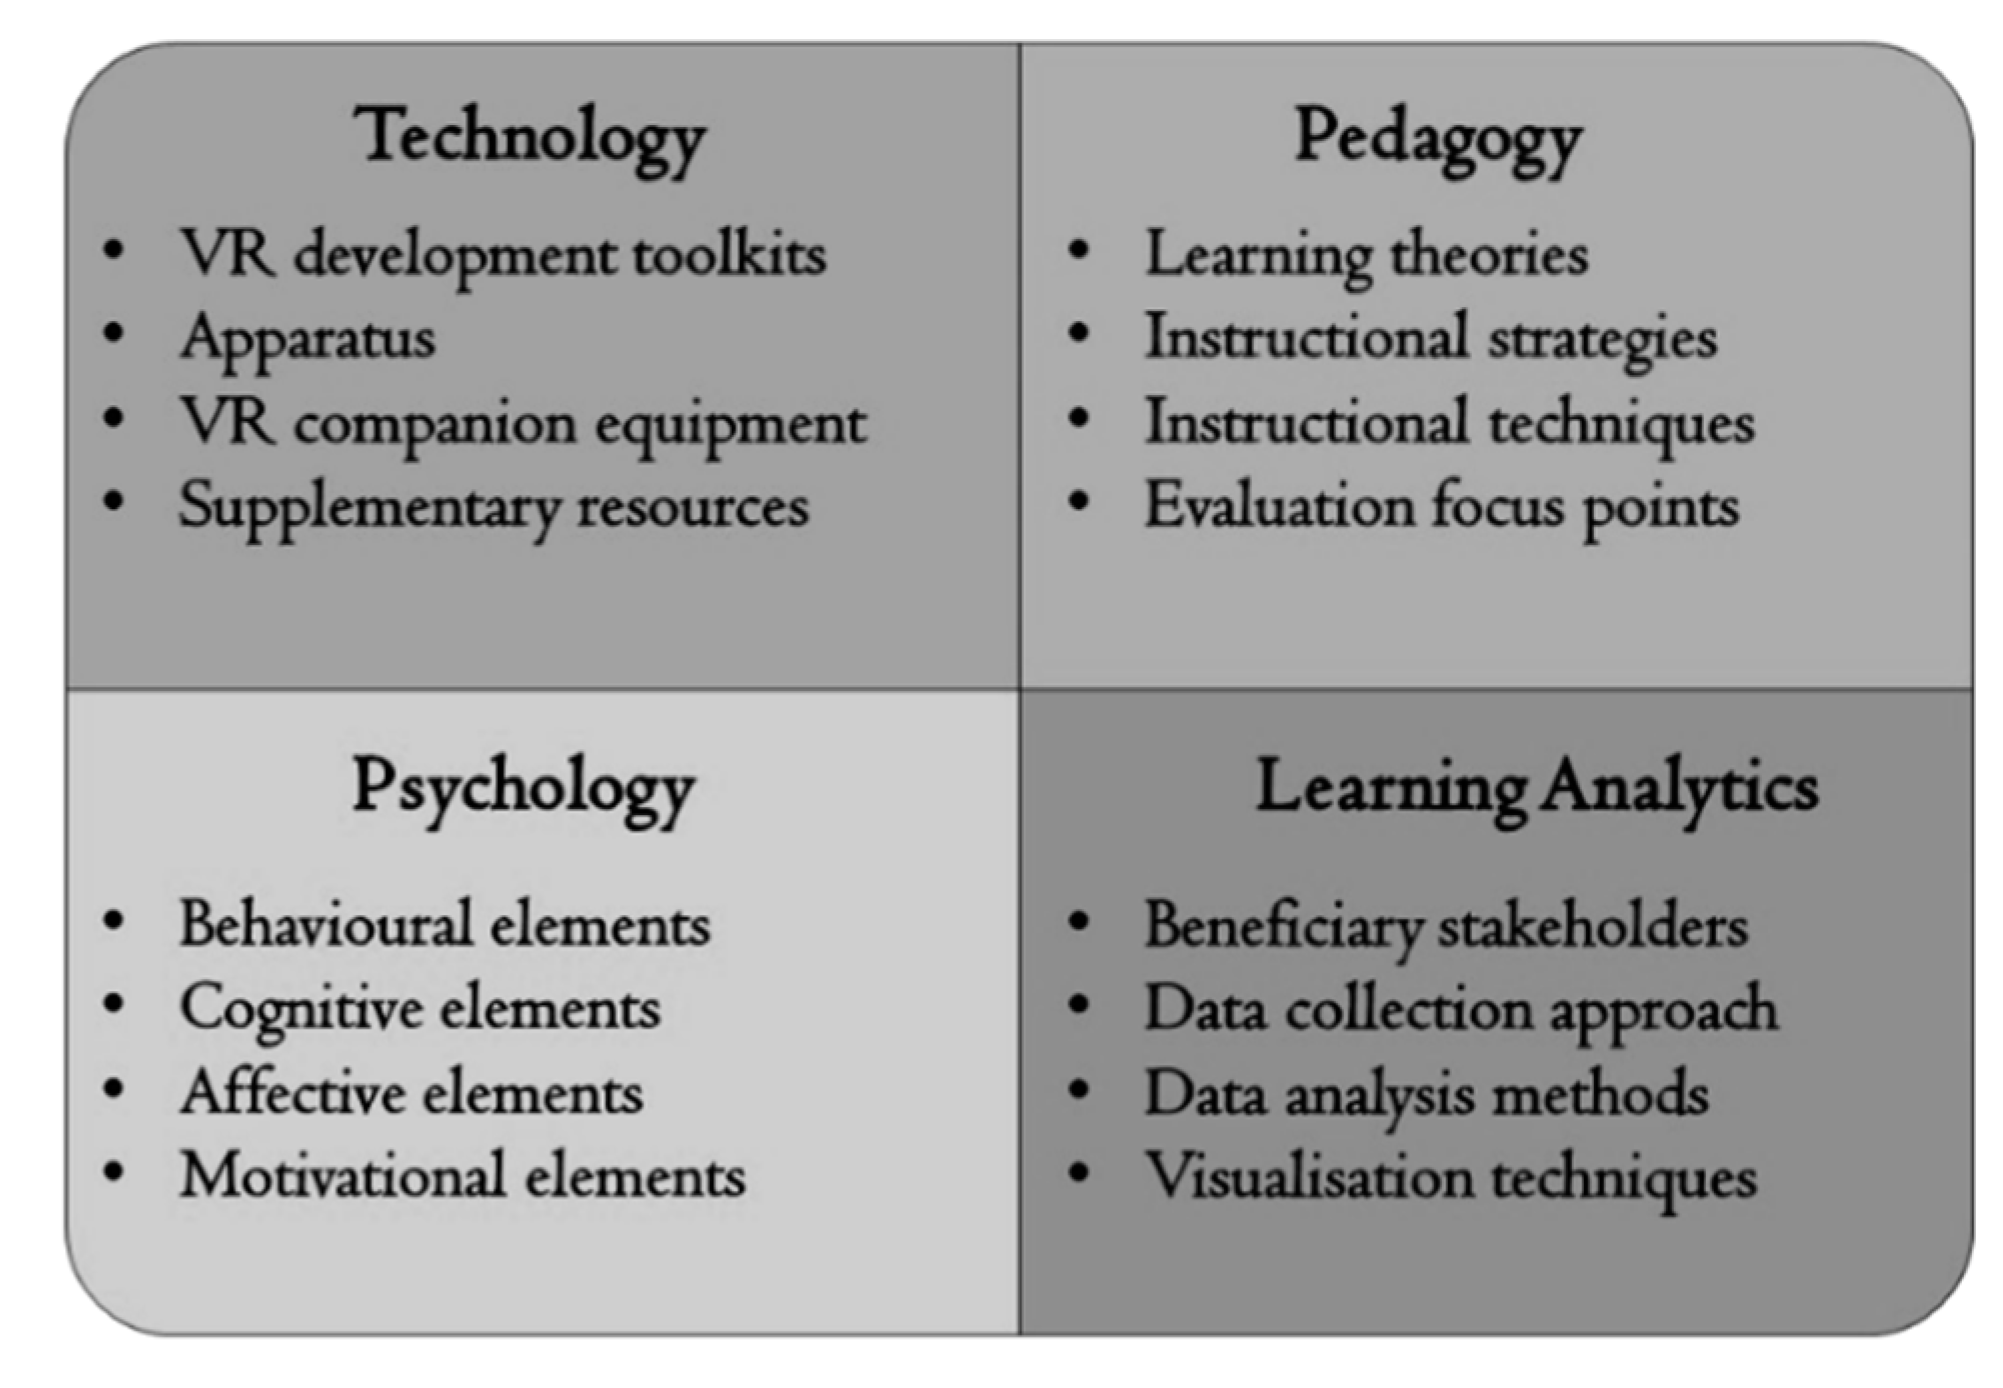
The information that can be collected from each category are illustrated in Figure 2 (abstract level) and elaborated upon further in the following sections.
In the first category (technology), we consider matters related to the design and the development of VR-supported interventions, such as:
- the software toolkits utilised for the development of the VR application (e.g., Unity, Maya, Net, Photoshop)
- the specifications of the hardware equipment utilised for the conduct of the interventions (e.g., smartphone, tablet, laptop, desktop PC, head-mounted display)
- the type of the VR approach (e.g., HMD-based, CAVE, 360° video) and the companion equipment (e.g., VR-enabled laboratory handbooks or discipline-related specialised equipment)
- the supplementary resources that may be required for the conduct of the intervention (e.g., multimedia resources, web-based educational platforms, 3D models)
In the second category (pedagogy), we contemplate the potential connection across the instructional decisions that practitioners make when designing educational activities [16], such as:
- the learning theories based on which the design of the intervention relies on (e.g., constructionism, cognitivism, (social) constructivism, embodied cognition),
- the instructional strategies (learning models) that gravitate the didactic essence of the respective theories (e.g., activity-based, experiential, collaborative, situated, problem-based, game-based, agent-based learning) and instructional techniques utilised for the conduct of the intervention (e.g., lecture, demonstration, seminar, tutorial, case study), and
- the evaluation focus points related to the effectiveness and efficiency of the application, the intervention, and the instructional approach (e.g., learners’ performance, learning outcomes, learning gains).
In the third category (psychology), we consider the psychological elements that are connected to the pedagogical dimension and influence the learning process [37,38], such as:
- the behavioral elements (e.g., the impact/effect of reinforcement, user experience, visual attractiveness/intuitiveness),
- the cognitive elements (e.g., attention and memory span, problem-solving skills),
- the affective elements (e.g., interest, attachment, satisfaction, degree of arousal, social communication, nature of the activities),
- the motivational elements (e.g., self-belief, self-regulation, self-efficacy, self-goals, self-concept, self-esteem, situational interest)
In the fourth category (learning analytics), we consider the steps that are related to the data gathering and analysis process, such as:
- the information that can be collected from the different stakeholders (e.g., administrators, educators, students, assessment tools),
- the data collection approach which includes information related to the research method (e.g., experimental, quasi-experimental, non-experimental) and the research methods utilised (e.g., qualitative, quantitative, mixed),
- the data analysis approach which includes the use and combination of different methods (e.g., item response theory, cognitive diagnosis, evolutionary algorithms) and educational data mining models (e.g., decision tree, naïve Bayes, k-nearest neighbor), and
- the data visualisation models for the dissemination of the processed data (e.g., graphs/charts, scatterplots, sociograms, tag clouds, signal lights).
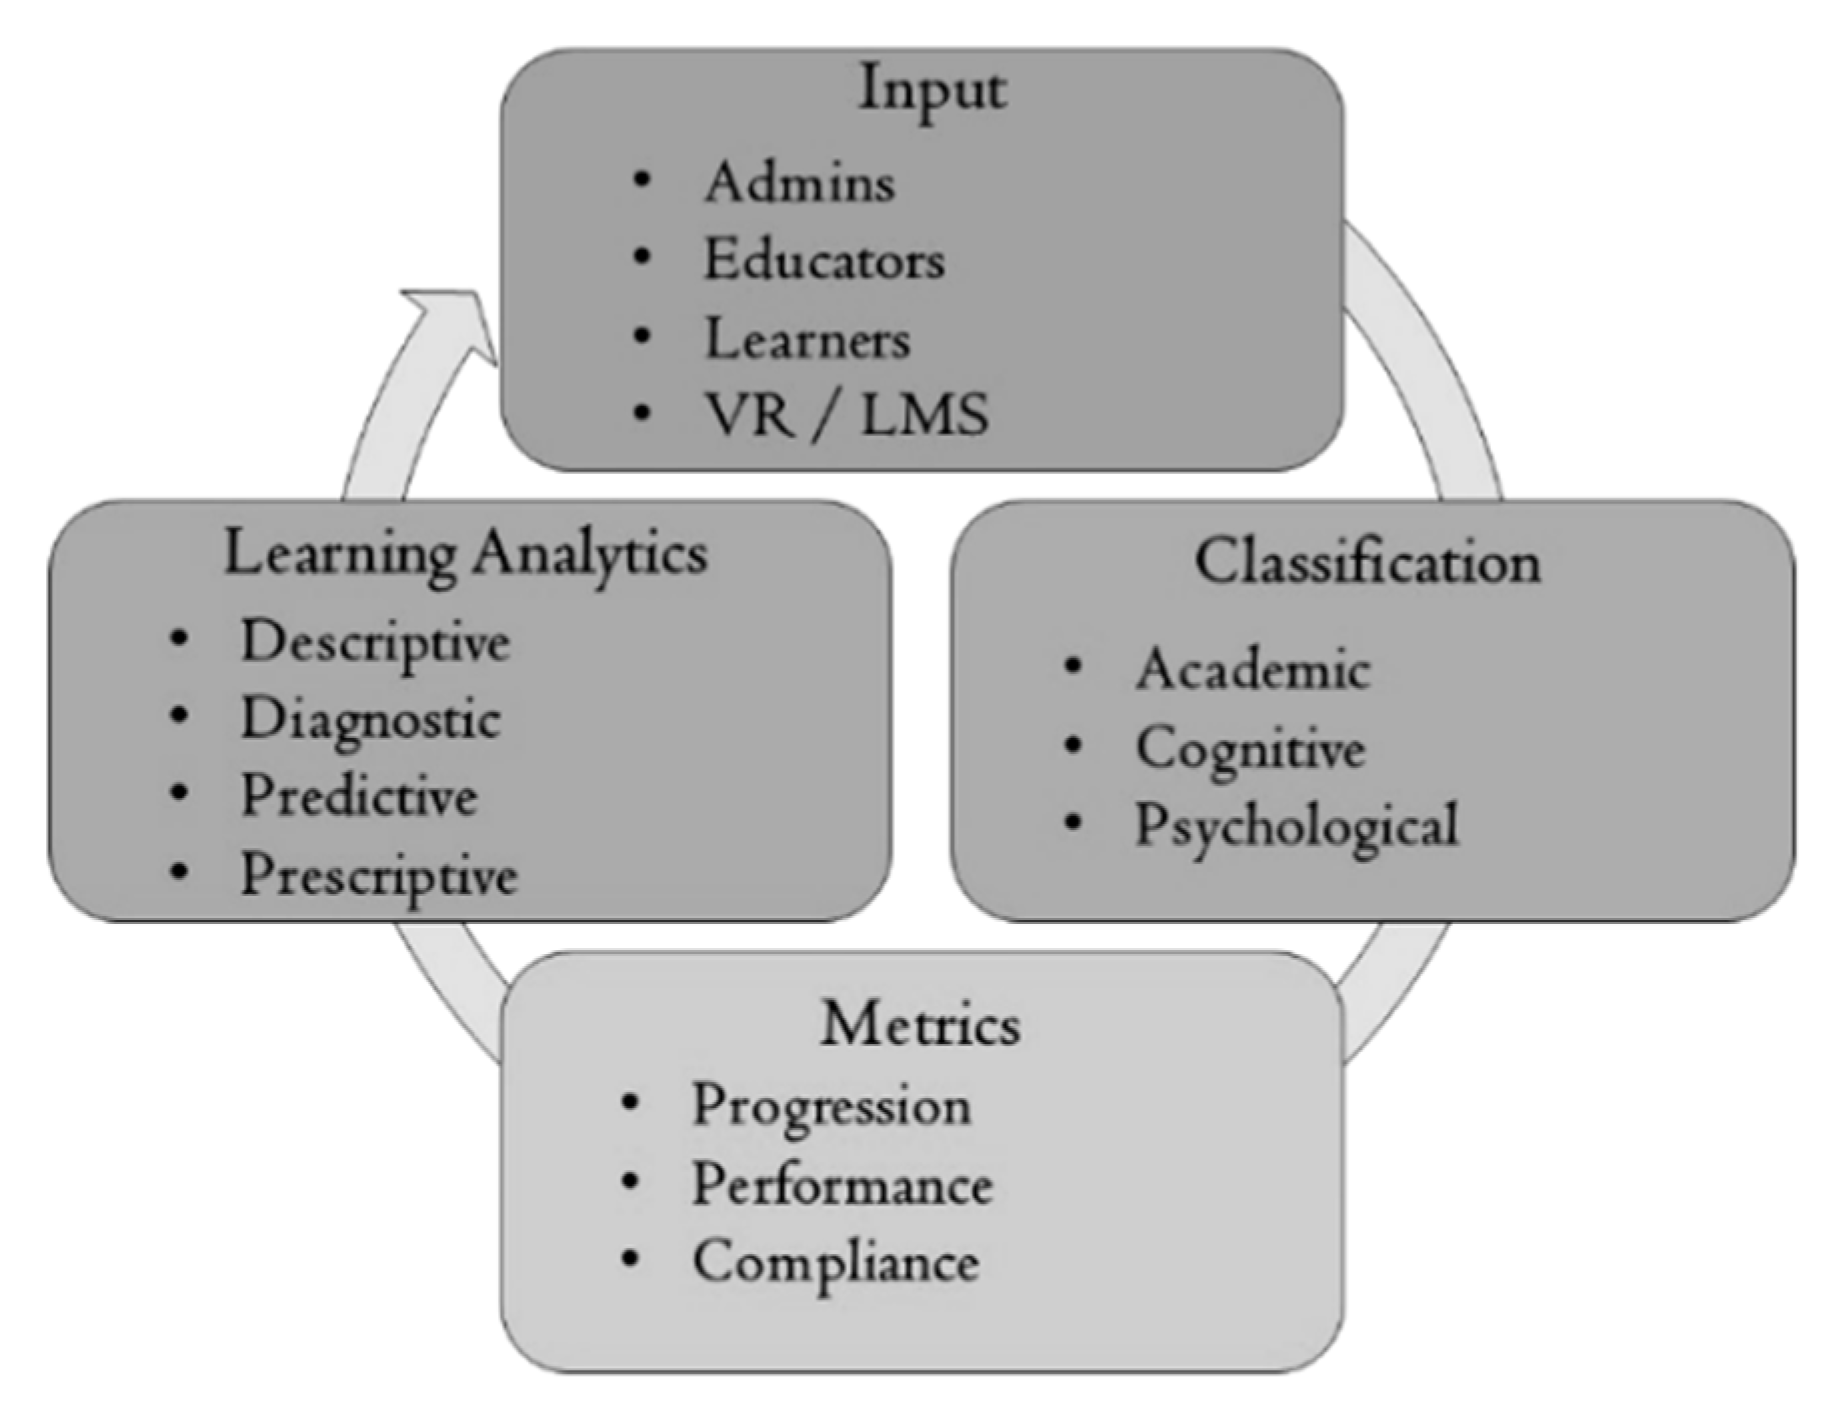
3.4. Overview of the Learning Analytics System
Educational data (Figure 3—Input) falls into three broad and usually overlapping categories: learning progression (Figure 3—Academic), learner intellectual competences (Figure 3—Cognitive), and learner behaviour (Figure 3—Psychology) whereas, external linked data—such as demographics or societal norms—can augment each of these. Aligned to the intended goal, in this section, we provide an overview of the functional requirements and specifications of the proposed system.
However, prior to unfolding the specifics of the proposed system, it should be noted that the use of ML techniques benefits all the following stages as it is a prerequisite to filter the input data, analyse the classification metrics, and interpret the results (learning analytics) in order to provide answers to the questions or concerns that educators and instructional designers usually have, such as:
- How to assess the skill cultivation between novice/expert students in VR STEM training scenarios?
- How to select the most appropriate instructional design elements to increase the effectiveness of the VR intervention, according to the difficulty of the topic and the learners’ abilities?
- How to perform error diagnosis for VR-supported instructional settings in conjunction with LA?
- How to provide timely support to low-performing or additional opportunities for development to high-performing students?
In Table 1, we list some examples of data types (Figure 3—“Input”), that have been reported to be associated with LA practices and further adjust them to the concept of the proposed framework in accordance with their nature, collection method, and source of origin.
Nevertheless, the actual integration of LA begins after identifying the patterns that support the development of deep understanding related to students’ academic skills, cognitive competences, and psychological behaviour (Figure 3—“Classification”). For this reason, it is important to classify the gathered information in accordance with the area(s) (Figure 3—“Metrics”) that are under investigation and/or in need of improvement (Table 2).
For instance, to measure matters related to the academic dimension, the primary data collection can include information related to students’ management skills (e.g., use of resources), their prior knowledge with the scientific subject (STEM) and experience with the digital learning tools (e.g., VR, LMS) as well as their attitude towards the learning process (e.g., attendance, participation, interaction with the peers) and their learning competence (i.e., time to develop and integrate the acquired knowledge and skills). The primary data sources can include information originating from the students’ interaction with the VR application and the LMS as well as self-reported cues related to their short- and long-term plans or goals (e.g., academic, personal, professional, monetary).
As regards the measurement of matters related to the cognitive dimension, self-reported data related to the ways that students regulate their efforts (e.g., strategies, tactics, habits) can be collected using validated instruments and further correlated with their learning outcomes (including the identification of misconceptions and knowledge gaps) using artificial intelligence techniques.
Finally, for the measurement of matters related to the psychological dimension, the focus is set on learners’ behavioral patterns which are recorded from the onboard sensors of the devices that will be utilised for the conduct of the interventions (e.g., smartphones, tablets) and other wearables (e.g., HMDs). Such data include information related to learners’ interactions (e.g., app use log, visual attention span, emotion recognition, textual communication records) and mobility patterns (e.g., frequency and duration of time spent at various locations).
The gathered data can be analysed under the aid of diverse statistical analysis methods and/or Machine Learning (ML) techniques (Figure 3—intermediate process between “Metrics” and “Learning Analytics”). However, before adopting such practices, it is essential to understand the features and benefits that each approach presents as well as the situations in which they can be applied (Table 3).
For the interpretation of the analysed data (Figure 3—“Learning Analytics”), we recommend the use of the model that Howson et al. [48] propose (Table 4).
The output of these analyses (Figure 3—prerequisite for the “Learning Analytics” stage) is communicated to the interested stakeholders, who may not always be familiar with the dataset, via different mediums (LA dashboards) and techniques (visualisations). The use of graphic elements makes it easy to share insights and translate complex ideas into simple and easy-to-grasp concepts. However, while we recognise that LA tools provide rich and detailed information about the educational practices, they may also lead to information overload which may restrict educators’ abilities to provide effective and adequate support to learners. Hence, it is essential to ensure that the receiver understands the purpose of the visualisations and its interpretation (Table 5).
4. Contribution and Implications
4.1. Conceptual Implications
The current study also contributes to the existing body of literature by providing a range of parameters that stream from the proposed theoretical framework and could improve teaching and learning practices. These are:
- Orchestration of instruction by teachers and reflection on the utilised strategies from the originals available to them.
- Evaluation methods to assess not only the students’ performance but, also, that of teachers about the mode of operation and practices followed in both formal and informal contexts.
- Provision of personalised suggestions and appropriate structures to support the implementation of similar scenarios in the future.
- Development of deep understanding of the core elements that influence the educational process and adaptation of the educational resources based on needs and interests of the students.
- Assessment of the course curriculum with particular focus on the parameters that affect the success and the effectiveness of the interventions in STEM training tasks.
- Support from the administration for reshaping of the educational units and allocation of financial resources for the development of VR applications in formal teaching conditions.
4.2. Theoretical Implications
Several theoretical implications with regard to the development of a universal LA system tailored to the VR configuration setups are also provided. The following points are expected to guide the future developmental decisions but also provide instructions to those researchers, educators, and instructional designers who are willing to contribute towards this effort:
- The decisions related to the data collection should be driven by the principles of the applied instructional design method. Hence, the involved stakeholders are encouraged to provide detailed information about the utilised instructional approaches, the educational subjects that were under investigation, and the analysis methods that have been followed for the examination of the correlations. In doing so, the repetition of the intervention to similar contexts facilitate and supports future research efforts to validate (collectively) the gathered information to develop well-grounded theoretical perspectives.
- The potential of interactions should be examined holistically and not just unilaterally (i.e., both between the users and the VR system and among the users themselves). Under this consideration, we recommend cross-examination and correlation clustering of different pedagogical and psychological elements using ML models to aid the development of prototype profiles and allow the systematic mapping of the factors that influence students’ outcomes and performance.
- The classification of the gathered information should be done in accordance to the areas of interest of the different beneficiaries (e.g., administrators, instructional designers, teachers, students) and the outcomes should be disseminated following the data analytics maturity scale that Howson et al. [46] proposed (e.g., descriptive, diagnostic, predictive, and prescriptive analytics). In doing so the involved stakeholders are able to determine the suitability and the effectiveness of the intervention and thus, perform any adjustments that may be required before designing or implementing new interventions.
4.3. Practical Implications
The inadequacy of the literature to provide recommendations with regard to the data types that can be collected from immersive technologies as well as the absence of a distributed system—capable of collecting, analyzing, and determining the appropriateness and the effectiveness of the VR-supported interventions in STEM education—motivated this initiative based on which we provide a set of practical implications which could help developers to better understand the functional requirements of such VR-supported LA systems:
- VR technology produces huge amounts of data but not all of them are meaningful to the context of educational studies. For exemplification purposes we summarise the data sources that are pertinent to the aim of the proposed LA system followed by some indicative examples:
- visual (e.g., eye motion tracking)
- auditory (e.g., pitch/intensity of the environmental noise levels)
- haptic (e.g., movement, rotation, force)
- network (e.g., packet loss, time delay)
- The essence of the educational VR applications relies on the provision of immediate feedback which offers answer-revision opportunities and leads to errorless learning. In the same vein, comprehensive implementation of a visual LA dashboard is expected to influence the learning dynamics (e.g., motivation, competitiveness, goal orientation) and impact positively learners’ outcomes, achievements, and performance.
5. Discussion and Conclusions
In the context of the 21st century skills that individuals need to develop, more digitally oriented training programs and tools are needed to support and/or enhance trainees’ digital competences and learning performance. At the same time, as STEM programs continue to gain ground globally, the need to improve and advance the existing instructional and assessment methods increases. To this end, student engagement across STEM fields is dependent on the appropriateness of the learning activities which, in turn, shape the capacity of the future professionals. Therefore, in order to guarantee the proficiency of the newly trained graduates, it is essential to integrate highly sophisticated and advanced instructional methods and evaluation techniques.
The potential of VR in STEM education has already attracted practitioners’ interest by demonstrating its power to support the conduct of safe, interactive, and engaging learning experiences. At the same time, the LA domain is gaining more and more ground as it has immense potential to improve teaching and learning practices [24,28,29]. Typical examples include early warning and recommendation systems which provide personalised guidance, feedback and support to learners while enabling educators and instructors to better understand the needs and potential of their learners [49]. Other studies [50], focus on the analytics methods used to predict learning outcomes (e.g., completion, progression) and student retention [51]. Finally, a substantial body of the available literature is streamlined towards the educational data mining techniques and methods that are being used to achieve the aforementioned goals [52,53]. However, the attempts to integrate LA in the context of immersive technologies are limited and scarce.
Studies which blend pedagogy and cognitive psychology with LA could not be identified. Therein, in the present work, an effort to tackle this literature limitation was made on the basis of which we outlined the foundations of a four-dimensional theoretical framework which accounts the multifaceted layers that the learning process displays (technology, pedagogy, psychology) and combines them with LA practices. In addition, we discussed the parameters and constructs that should be taken into account with particular emphasis on the impact that the different instructional strategies and methods have on the knowledge development process and the opportunities they bring to create personalised learning patterns [16].
By integrating LA, educators and instructors can also facilitate the assessment process. This is of particular importance now that teaching takes place in distant settings (e.g., remote/virtualised laboratories) and thus, timely feedback and feedforward is needed. For instance, a VR application dedicated to construction engineering includes both hands-on practices, using controllers and haptics, and observation-oriented actions using HMDs and standardised PC peripherals (e.g., geometrical calculations, 3D model editing, estimation of actual construction costs) in order to achieve the respective learning objectives. Any data collected during this process can be extracted via an embedded LA pipeline to a dedicated LA system for classification and interpretation using ML algorithms. For instance, supervised learning algorithms can be utilised to predict future events based on students’ past behaviour and actions in the VR environment. On the other hand, unsupervised learning algorithms do not require historical information for the classification of the input data. In this case, the clusters are developed in accordance with the hidden patterns and connections that emerge during the training of the dataset under investigation (e.g., grouping of different VR exercises).
By highlighting these conceptual design elements, we envision that researchers, educators, and educational technology entrepreneurs will further consider these relations—when evaluating the potential of the utilised instructional VR approach so as to take full advantage of the data that can be collected from such tools and platforms and thus, support the students to reach their maximum potential. This statement also governs our future work recommendations thus, we advise VR developers and practitioners to make their primary data publicly available so as to support and promote such efforts for the mutual benefit of the respective communities. However, as LA entail multiple privacy management and ethical considerations we would like to highlight and remind that any data collection, interpretation, and dissemination practices should always follow the General Data Protection Regulation (GDPR) guidelines and the wider code of ethical research [54].
6. Limitations of the Study
As in any study, this one has its own limitations worth noting. First, due to the often-sparse definitions used to describe VR, we sought articles only from specific databases (Scopus, Web of Science, IEEE Xplore) with preference of selection over peer-reviewed international journals. Second, many of the originally identified articles were one-off studies with either too small samples or very context-dependent conclusions. As a result, when considering the features that could be integrated in the preliminary version of the proposed system, we opted for studies which were grounded to well-established theories and models and had reasonably large samples so as to compose a more realistic picture with regard to the needs that STEM education students have.
Author Contributions
Conceptualization, A.C. and N.P.; methodology, A.C. and N.P.; software, A.C.; validation, N.P.; formal analysis, A.C.; investigation, A.C. and N.P.; resources, N.P.; data curation, M.-J.L.; writing—original draft preparation, A.C. and N.P.; writing—review and editing, A.C. and N.P.; visualization, A.C.; supervision, M.-J.L.; project administration, M.-J.L.; funding acquisition, M.-J.L. All authors have read and agreed to the published version of the manuscripts.
Funding
The first and the third author would like to thank the Research Council of the Academy of Finland for financially supporting this research and APC under the grant number 312527.
Conflicts of Interest
The authors declare that there is no conflict of interest.
References
- STEM Education Data. Available online: https://nsf.gov/nsb/sei/edTool/explore.html (accessed on 6 October 2020).
- Pellas, N.; Kazanidis, I.; Konstantinou, N.; Georgiou, G. Exploring the educational potential of three-dimensional multi-user virtual worlds for STEM education: A mixed-method systematic literature review. Educ. Inf. Technol. 2016, 22, 2235–2279. [Google Scholar] [CrossRef]
- Pellas, N.; Kazanidis, I.; Palaigeorgiou, G. A systematic literature review of mixed reality environments in K-12 education. Educ. Inf. Technol. 2019, 25, 2481–2520. [Google Scholar] [CrossRef]
- Potkonjak, V.; Gardner, M.; Callaghan, V.; Mattila, P.; Guetl, C.; Petrović, V.M.; Jovanović, K. Virtual laboratories for education in science, technology, and engineering: A review. Comput. Educ. 2016, 95, 309–327. [Google Scholar] [CrossRef] [Green Version]
- Makransky, G.; Borre-Gude, S.; Mayer, R.E. Motivational and cognitive benefits of training in immersive virtual reality based on multiple assessments. J. Comput. Assist. Learn. 2019, 35, 691–707. [Google Scholar] [CrossRef]
- Christopoulos, A.; Conrad, M.; Shukla, M. Increasing student engagement through virtual interactions: How? Virtual Real. 2018, 22, 353–369. [Google Scholar] [CrossRef] [Green Version]
- García, A.A.; Bobadilla, I.G.; Arroyo-Figueroa, G.; Pérez, M.; Román, J.M. Virtual reality training system for maintenance and operation of high-voltage overhead power lines. Virtual Real. 2016, 20, 27–40. [Google Scholar] [CrossRef]
- Villagrá-Arnedo, C.J.; Gallego-Durán, F.J.; Llorens-Largo, F.; Compañ-Rosique, P.; Satorre-Cuerda, R.; Molina-Carmona, R. Improving the expressiveness of black-box models for predicting student performance. Comput. Hum. Behav. 2017, 72, 621–631. [Google Scholar] [CrossRef] [Green Version]
- Christopoulos, A.; Conrad, M.; Shukla, M. Between virtual and real: Exploring hybrid interaction and communication in virtual worlds. Int. J. Soc. Media Interact. Learn. Environ. 2016, 4, 23. [Google Scholar] [CrossRef]
- Christopoulos, A.; Kajasilta, H.; Salakoski, T.; Laakso, M.-J. Limits and Virtues of Educational Technology in Elementary School Mathematics. J. Educ. Technol. Syst. 2020, 49, 59–81. [Google Scholar] [CrossRef]
- Pellas, N.; Fotaris, P.; Kazanidis, I.; Wells, D. Augmenting the learning experience in primary and secondary school education: A systematic review of recent trends in augmented reality game-based learning. Virtual Real. 2018, 23, 329–346. [Google Scholar] [CrossRef]
- Heim, M. Virtual Realism; Oxford University Press: Oxford, UK, 1998. [Google Scholar]
- Wolfartsberger, J. Analyzing the potential of Virtual Reality for engineering design review. Autom. Constr. 2019, 104, 27–37. [Google Scholar] [CrossRef]
- Gigante, M. Virtual reality: Definitions, history and applications. In Virtual Reality Systems; Earnshaw, R.A., Gigante, M.A., Jones, H., Eds.; Academic Press: San Diego, CA, USA, 1993. [Google Scholar] [CrossRef]
- Virtual Reality (VR)—Statistics & Facts. Available online: https://0-www-statista-com.brum.beds.ac.uk/topics/2532/virtual-reality-vr (accessed on 6 October 2020).
- Akdeniz, C. Instructional process and concepts. In Theory and Practice: Improving the Teaching Process; Springer: Singapore, 2016. [Google Scholar] [CrossRef]
- Yeh, S.-C.; Hwang, W.-Y.; Wang, J.-L.; Zhan, S.-Y. Study of co-located and distant collaboration with symbolic support via a haptics-enhanced virtual reality task. Interact. Learn. Environ. 2013, 21, 184–198. [Google Scholar] [CrossRef]
- Christopoulos, A.; Conrad, M.; Shukla, M. Objects, Worlds, and Students: Virtual Interaction in Education. Educ. Res. Int. 2014, 2014, 1–20. [Google Scholar] [CrossRef] [Green Version]
- Christopoulos, A.; Conrad, M.; Shukla, M. Interaction with Educational Games in Hybrid Virtual Worlds. J. Educ. Technol. Syst. 2018, 46, 385–413. [Google Scholar] [CrossRef]
- Moore, K. Classroom Teaching Skills; McGraw-Hill: Boston, MA, USA, 2007. [Google Scholar]
- Concannon, B.J.; Esmail, S.; Roberts, M.R. Head-Mounted Display Virtual Reality in Post-secondary Education and Skill Training. Front. Educ. 2019, 4. [Google Scholar] [CrossRef] [Green Version]
- Segura, R.J.; Pino, F.J.; Ogáyar, C.J.; Rueda, A.J. VR-OCKS: A virtual reality game for learning the basic concepts of programming. Comput. Appl. Eng. Educ. 2019, 28, 31–41. [Google Scholar] [CrossRef]
- Johari, A.; Chen, C.J.; Toh, S.C. A feasible constructivist instructional development model for virtual reality (VR)-based learning environments: Its efficacy in the novice car driver instruction of Malaysia. Educ. Technol. Res. Dev. 2005, 53, 111–123. [Google Scholar] [CrossRef]
- Pellas, N.; Kazanidis, I. Online and hybrid university-level courses with the utilization of Second Life: Investigating the factors that predict student choice in Second Life supported online and hybrid university-level courses. Comput. Hum. Behav. 2014, 40, 31–43. [Google Scholar] [CrossRef]
- Chen, Y.-L.; Hsu, C.-C. Self-regulated mobile game-based English learning in a virtual reality environment. Comput. Educ. 2020, 154, 103910. [Google Scholar] [CrossRef]
- Pellas, N. The influence of computer self-efficacy, metacognitive self-regulation and self-esteem on student engagement in online learning programs: Evidence from the virtual world of Second Life. Comput. Hum. Behav. 2014, 35, 157–170. [Google Scholar] [CrossRef]
- Junco, R.; Clem, C. Predicting course outcomes with digital textbook usage data. Internet High. Educ. 2015, 27, 54–63. [Google Scholar] [CrossRef]
- Siemens, G. Learning analytics: The emergence of a discipline. Am. Behav. Sci. 2013, 57, 1380–1400. [Google Scholar] [CrossRef] [Green Version]
- Xing, W.; Guo, R.; Petakovic, E.; Goggins, S. Participation-based student final performance prediction model through interpretable Genetic Programming: Integrating learning analytics, educational data mining and theory. Comput. Hum. Behav. 2015, 47, 168–181. [Google Scholar] [CrossRef]
- Drachsler, H.; Kalz, M. The MOOC and learning analytics innovation cycle (MOLAC): A reflective summary of ongoing research and its challenges. J. Comput. Assist. Learn. 2016, 32, 281–290. [Google Scholar] [CrossRef] [Green Version]
- Slade, S.; Prinsloo, P. Learning analytics: Ethical issues and dilemmas. Am. Behav. Sci. 2013, 57, 1510–1529. [Google Scholar] [CrossRef] [Green Version]
- Long, P.; Siemens, G. Penetrating the Fog: Analytics in Learning and Education. Educ. Rev. 2011, 46, 31–40. [Google Scholar]
- Peña-Ayala, A. Learning analytics: A glance of evolution, status, and trends according to a proposed taxonomy. Wiley Interdiscip. Rev. Data Min. Knowl. Discov. 2018, 8, e1243. [Google Scholar] [CrossRef]
- Sciarrone, F. Machine Learning and Learning Analytics: Integrating Data with Learning. In Proceedings of the 17th International Conference on Information Technology Based Higher Education and Training, Olhao, Portugal, 26–28 April 2018; pp. 1–5. [Google Scholar] [CrossRef]
- Baker, R.S.; Yacef, K. The State of Educational Data Mining in 2009: A Review and Future Visions. J. Educ. Data Min. 2009, 1, 3–17. [Google Scholar] [CrossRef]
- Hevner, A.R.; March, S.T.; Park, J.; Ram, S. Design Science in Information Systems Research. MIS Q. 2004, 28, 75. [Google Scholar] [CrossRef] [Green Version]
- Gawlik-Kobylinska, M. The Four-Dimensional Instructional Design Approach in the Perspective of Human-Computer Interactions. In Proceedings of the 1st Frontiers in Artificial Intelligence and Applications, Las Palmas de Gran Canaria, Spain, 8–12 January 2018; pp. 146–156. [Google Scholar] [CrossRef]
- Parong, J.; Mayer, R.E. Learning science in immersive virtual reality. J. Educ. Psychol. 2018, 110, 785–797. [Google Scholar] [CrossRef]
- Chung, J.Y.; Lee, S. Dropout early warning systems for high school students using machine learning. Child. Youth Serv. Rev. 2019, 96, 346–353. [Google Scholar] [CrossRef]
- Gray, C.C.; Perkins, D. Utilizing early engagement and machine learning to predict student outcomes. Comput. Educ. 2019, 131, 22–32. [Google Scholar] [CrossRef]
- Pérez, R.C.; Muñoz-Merino, P.J.; Alexandron, G.; Pritchard, D.E. Using Machine Learning to Detect ‘Multiple-Account’ Cheating and Analyze the Influence of Student and Problem Features. IEEE Trans. Learn. Technol. 2017, 12, 112–122. [Google Scholar] [CrossRef]
- Asif, R.; Merceron, A.; Ali, S.A.; Haider, N.G. Analyzing undergraduate students’ performance using educational data mining. Comput. Educ. 2017, 113, 177–194. [Google Scholar] [CrossRef]
- Pliakos, K.; Joo, S.-H.; Park, J.Y.; Cornillie, F.; Vens, C.; Noortgate, W.V.D. Integrating machine learning into item response theory for addressing the cold start problem in adaptive learning systems. Comput. Educ. 2019, 137, 91–103. [Google Scholar] [CrossRef]
- Alexandron, G.; Yoo, L.Y.; Ruipérez-Valiente, J.A.; Lee, S.; Pritchard, D.E. Are MOOC Learning Analytics Results Trustworthy? With Fake Learners, They Might Not Be! Int. J. Artif. Intell. Educ. 2019, 29, 484–506. [Google Scholar] [CrossRef] [Green Version]
- Zhang, H.; Huang, T.; Lv, Z.; Liu, S.; Yang, H. MOOCRC: A Highly Accurate Resource Recommendation Model for Use in MOOC Environments. Mob. Netw. Appl. 2018, 24, 34–46. [Google Scholar] [CrossRef]
- Yang, F.; Li, F.W. Study on student performance estimation, student progress analysis, and student potential prediction based on data mining. Comput. Educ. 2018, 123, 97–108. [Google Scholar] [CrossRef] [Green Version]
- Yin, M.S.; Haddawy, P.; Suebnukarn, S.; Rhienmora, P. Automated outcome scoring in a virtual reality simulator for endodontic surgery. Comput. Methods Programs Biomed. 2018, 153, 53–59. [Google Scholar] [CrossRef]
- Howson, C.; Sallam, R.L.; Richardson, J.L.; Kronz, A. Magic Quadrant for Analytics and Business Intelligence Platforms. Available online: http://www.sift-ag.com/wp-content/uploads/Qlik-Gartner-2019.pdf (accessed on 6 October 2020).
- Viberg, O.; Hatakka, M.; Bälter, O.; Mavroudi, A. The current landscape of learning analytics in higher education. Comput. Hum. Behav. 2018, 89, 98–110. [Google Scholar] [CrossRef]
- Ferguson, R.; Clow, D. Where is the evidence? A call to action for learning analytics. In Proceedings of the 7th International Learning Analytics Knowledge Conference, New York, NY, USA, 13–17 March 2017; pp. 56–65. [Google Scholar] [CrossRef]
- Leitner, P.; Khalil, M.; Ebner, M. Learning analytics in higher education—A literature review. In Learning Analytics: Fundaments, Applications, and Trends (Studies in Systems, Decision and Control); Peña-Ayala, A., Ed.; Springer International Publishing AG: New York, NY, USA, 2017; Volume 94, pp. 1–23. [Google Scholar] [CrossRef]
- Aldowah, H.; Al-Samarraie, H.; Fauzy, W.M. Educational data mining and learning analytics for 21st century higher education: A review and synthesis. Telemat. Inform. 2019, 37, 13–49. [Google Scholar] [CrossRef]
- Dutt, A.; Ismail, M.A.; Herawan, T. A Systematic Review on Educational Data Mining. IEEE Access 2017, 5, 15991–16005. [Google Scholar] [CrossRef]
- Sclater, N.; Bailey, P. Code of Practice for Learning Analytics. JISC. Available online: https://www.jisc.ac.uk/guides/code-of-practice-for-learning-analytics (accessed on 6 October 2020).
Figure 1.
The four-dimensional framework for virtual reality (VR)-based learning analytics (LA).

Figure 2.
Classification parameters for each dimension.

Figure 3.
Overview of the LA system data processing approach.


Table 1.
Indicative examples of data collection types, methods, and sources.
| Parameters | Method | Stakeholder |
|---|---|---|
| Gender, Age | Survey, Registry | Admins |
| Grades, Credits, Achievements, Enrolments, Dropouts, Attendance | Registry | Admins, Educators |
| Produced artifacts (Documents, Code, 3D models) | LMS, VR | Students |
| Log-in time/frequency, Time-on-task, Resources use, e-Assessment/Feedback | LMS, VR | Students, Designers |
| Activity setting (Blended, Distance, F2F, Individual/Collaborative) | LMS, VR | Educators, Designers |
| Usability (VR), User experience (VR) | Survey | Students |
| Attitude, Motivation | Survey | Students |
| Gaze, Gesture, Speech | Sensors | Students |
Table 2.
Data classification.
| Categories | Metrics |
|---|---|
| Academic Progression | Domain knowledge proficiency, Skills mastery, Knowledge retention, Learning strategies, Learning preferences, Learning styles, Performance, Achievements, Misconceptions, Cognition, Aptitude |
| Cognitive Performance | Efficiency, Evaluation, Achievement, Competence, Resource consuming, Elapsed time, Correctness, Deficiencies |
| Behaviour | Gambling, Guessing, Inquiring, Requesting Help, Willingness to collaborate, Time series of access and response, Persistence, Emotions |
Table 3.
Data interpretation.
| Aim | Machine Learning models | References |
|---|---|---|
| Feedback to educators’ and instructional designers’ scenarios. | Decision Trees, Random Forest | [39,40] |
| Investigation of learners’ behavior during and after the VR-supported intervention. | Naïve Bayes | [41] |
| Course adaptation and learning recommendations based on learners’ behavior. | Decision Trees, Random Forest | [42,43] |
| Assessment of the VR-supported learning material and content. | Decision Trees, Random Forest, Naïve Bayes | [44,45] |
| Prediction of student’s learning performance. | Decision Trees, Logistic Regression, Support Vector Machines | [46,47] |
Table 4.
The analytics stages as described by Howson et al. [48].
Table 4.
The analytics stages as described by Howson et al. [48].
| Analytics | Description | Outcome |
|---|---|---|
| Descriptive | What happened? | Insights into historical patterns of behavior/performance. |
| Diagnostic | Why did it happen? | Evaluation of the examined data. |
| Predictive | What could happen in the future? | Identify trends / predict future behavior. |
| Prescriptive | How should we respond in the future? | Generate recommendations and make decisions based on algorithmic models |
Table 5.
Data visualisation.
| Evaluation | Visualisation Method |
|---|---|
| Collaboration | Mathematical graph, Statistical, Timeline, Interaction Matrix, Heatmap |
| Instructional Design | Mathematical graph, Statistical, Timeline, Word cloud, Interaction matrix, Circular graph, Bubble plot, Concept map, Glyph, Geomap |
| Learning Progress | Statistical, Circular graph, Heatmap, Radar |
| Retention | Statistical, Timeline, Word cloud, Glyph |
| Motivation | Statistical |
Publisher’s Note: MDPI stays neutral with regard to jurisdictional claims in published maps and institutional affiliations. |
© 2020 by the authors. Licensee MDPI, Basel, Switzerland. This article is an open access article distributed under the terms and conditions of the Creative Commons Attribution (CC BY) license (http://creativecommons.org/licenses/by/4.0/).
Share and Cite
MDPI and ACS Style
Christopoulos, A.; Pellas, N.; Laakso, M.-J. A Learning Analytics Theoretical Framework for STEM Education Virtual Reality Applications. Educ. Sci. 2020, 10, 317. https://0-doi-org.brum.beds.ac.uk/10.3390/educsci10110317
AMA Style
Christopoulos A, Pellas N, Laakso M-J. A Learning Analytics Theoretical Framework for STEM Education Virtual Reality Applications. Education Sciences. 2020; 10(11):317. https://0-doi-org.brum.beds.ac.uk/10.3390/educsci10110317
Chicago/Turabian StyleChristopoulos, Athanasios, Nikolaos Pellas, and Mikko-Jussi Laakso. 2020. "A Learning Analytics Theoretical Framework for STEM Education Virtual Reality Applications" Education Sciences 10, no. 11: 317. https://0-doi-org.brum.beds.ac.uk/10.3390/educsci10110317
Note that from the first issue of 2016, this journal uses article numbers instead of page numbers. See further details here.