
Does Postsecondary Education Attainment Matter in Community Service Engagement? Evidence from Across 18 OECD Countries


1
Institute of Higher Education, University of Georgia, Athens, GA 30602, USA
2
Department of Mathematics, Sciences, and Technology, University of West Georgia, Carrollton, GA 30118, USA
*
Author to whom correspondence should be addressed.
Educ. Sci. 2021, 11(3), 96; https://0-doi-org.brum.beds.ac.uk/10.3390/educsci11030096
Submission received: 15 January 2021
/
Revised: 22 February 2021
/
Accepted: 23 February 2021
/
Published: 2 March 2021
(This article belongs to the Special Issue New Research and Trends in Higher Education)
Abstract
:This study is concerned with the central issues of community service engagement (CSE) in 21st century democratic societies around the world. To examine the factors influencing postsecondary education attainment’s relationship to CSE, this study utilized data from the Organization for Economic Co-operation and Development (OECD) countries using ordinary least square (OLS) and two-level hierarchical linear modeling (HLM) methods, including various factors for each country’s individual and country levels. The results show that attainment in postsecondary education at the individual level and investment and enrollments in tertiary education both have an influence on increasing CSE in 18 OECD countries. The present study is expected to contribute to an understanding of the relationship between postsecondary education and CSE across the world.
1. Introduction
Encouraging responsible, active, participatory citizenship is a goal in the field of education and has globally been an important agenda item among researchers, educators, and policy makers [1]. Increasing civic engagement is a growing concern, as it has been proven to be an essential aspect of high-quality governance and a well-functioning democracy, producing better quality schools, faster economic development, and more effective governments [2]. In Organization for Economic Co-operation and Development (OECD) countries, especially, matters of economic disparity and environmental sustainability have increased calls for a more civil society [3]. In terms of the relationship between a nation and its civic affairs, according to a Washington DC Gallup Poll [4], adults in developed countries are more likely to be civically engaged than those in the developing world. Furthermore, the related literature has revealed that civic engagement can be cultivated by a nation through its economic status, culture, or social norms [5,6]. Despite variances in civic engagement behaviors around the world, cultivating community service engagement and thereby increasing civic engagement is an important task for all global citizens [1].
In the United States, individuals express their beliefs in the importance of individual effort and concern for others through volunteerism and the ethic of service [7]. Americans believe that one of the ways of passing this value on to younger generations is to participate in community service [7]. According to U.S. Bureau of Labor Statistics [8], 24.9% of the total U.S. population volunteered at least once and spent average 52 hours on volunteer activities during the period from September 2014 to September 2015. The three main organizations people volunteered for were religious (33.1%), educational or youth service (25.2%), and social or community service-related organizations (14.6%) [8]. Thus, K-12 schools strive to play a crucial role in addressing community needs and often utilize service-learning as a pedagogical method [9]. At the collegiate level, membership in Campus Compact, the U.S. coalition of colleges and universities committed to the public service purposes of higher education, grew from its founding three colleges in 1985 to over 1100 campuses in 2008 [10]. The increased pressure for educational accountability and commitment to public good has led universities to provide more opportunities for students to engage in community service and to learn through service-learning [11]. In addition to Campus Compact, a variety of professional and higher education organizations, such as the American Association of Colleges and Universities and the Engagement Scholarship Consortium, have been actively involved in community engagement in the United States.
Similarly, the United Kingdom places significance on building active citizens and believes that citizenship education is essential to achieving this goal [12]. Therefore, the national curriculum has included citizenship programs formally since 2002 with a goal to prepare students to become active, responsible members of society [13]. In the same manner, the majority of higher education institutions in the United Kingdom have been interested in promoting active citizenship, with an emphasis on volunteerism, so many institutions have provided various community service-learning programs for their students [14]. In addition, national organizations such as Volunteering Matters offer volunteer opportunities for the young generation.
In South Korea, the foundation of citizenship education has changed in accordance with Korean modern history from anticommunism in the 1950s (post-Korean war) to patriotism from the 1960s to the 1980s, to globalism and neoliberalism since the 1990s [15]. Recently, it has focused on preparing competitive workers rather than democratic citizens [15]. In K-12 education, community service activities are included in the formal school curriculum, so students tend to complete them mandatorily [16]. Korean higher education institutions do not seem to emphasize community service, so college students often participate in volunteer programs individually through non-profit organizations such as the Korean University Council for Social Service or religious organizations [17].
Last, surprisingly, citizens in South America show a relatively high level of civic engagement despite their countries’ unfavorable political conditions and economic performances [18]. Citizens tend to actively participate in community activities to solve political and economic issues by raising their voices together [18,19]. The results of a survey of young teenagers from Chile and Columbia also revealed their civic engagement to be higher than the international mean, in spite of lower civic knowledge and attitudes [20]. In particular, various social and political issues in Chile have made universities’ social responsibilities significant [21]. In 2001, many universities participated in the University Builds Country project to fulfill their responsibilities through service-learning [21].
As these countries have tried to expand their efforts for improving civic engagement, scholars and researchers also have revealed the relationship between education and civic engagement. In terms of the relationship between higher education and civic engagement (including community service engagement), past studies have focused on the connection between them and pointed out the importance of education in improving attitudes toward citizenship, civic education, political behavior, and social engagement [22,23,24]. Braskamp [25] also suggested that higher education should reinvestigate its role in preparing citizens for participation in a democratic society and the larger community. Since the 1970s, the field of postsecondary education has considered community service to be one of the most indispensable components of civic engagement and recognized its importance in student community service activities [26].
Although the importance of civic knowledge and engagement in the context of academia and society is convincing, thus far few empirical studies and trials have attempted to navigate the factors or determinants that influence community service engagement (CSE). There was particularly a dearth of recent empirical evidence from cross-national samples on the relationship between postsecondary education and CSE. This study, therefore, investigates how individual and national factors influence CSE. It focuses on the educational context, especially the influence of postsecondary educational (throughout this paper, the terms higher education, postsecondary education, and tertiary education are regarded as concepts that can be interchangeable; however, we keep the original term from the given secondary datasets from each source) attainment at the individual and country levels within the OECD countries, using cross-national representative data and ordinary least square (OLS) regression and hierarchical linear modeling (HLM) methods. The specific research questions are as follows:
- Does the level of CSE vary by educational level in OECD countries?
- To what extent does individual educational attainment, especially postsecondary education attainment, affect CSE in each OECD country while controlling individual-level covariates?
- To what extent does postsecondary education attainment at the country level directly affect CSE while controlling for both individual-level and country-level covariates?
Literature Review
There is no single definition of civic engagement. It is sometimes defined narrowly, to focus on one specific perspective and activity, or broadly, to cover “all activity related to personal and societal enhancement which results in improved human connection and human condition” [27] (p. 22). However, generally it refers to “the ways in which citizens participate in the life of a community in order to improve conditions for others or to help shape the community’s future” [5] (p. 236). Civic engagement has four key aspects: community service, collective action, political involvement, and social change [5,27]. The first aspect, community service, focuses on individual or group participation and engagement in voluntary service activities in the local community [28]. Taking collaborative and collective action with other community members to advance their common interest is a significant feature of civic engagement as well [29]. Civic engagement also includes active participation and involvement in the political process or democracy [22]. Lastly, civic engagement should strive towards positive social change, which benefits the entire community [30]. Therefore, various activities are often considered forms of civic engagement (e.g., community problem solving, volunteering, fund-raising, voting, protesting, submitting petitions, and canvassing) [22].
To promote students’ meaningful, experiential, and active learning and to prepare them to become the leaders of our future society, higher education institutions have been offering service-learning opportunities for students participating in service activities as components of course work or extracurricular activities [11]. Service-learning should closely relate to students’ academic curriculum; experiences that a student obtains from service-learning need to meet the learning objectives of a certain course the student takes [11]. Therefore, unlike volunteerism, which more focuses on the receipient than the provider of volunteering, service-learning focuses on the development of students’ learning through community service activities [11].
Emphasis on these activities in higher education institutions has naturally led to individuals in their 20s reporting higher participation in such activities than did previous generations [31]. Moreover, because a majority of colleges have begun to include community service experiences among their admission criteria, middle and high school students are participating in such activities at rates higher than those found among any other age groups, with numbers increasing steadily since the 1990s [5,32]. College students’ participation in community service activities is especially important because people with prior volunteer experiences tend to remain involved in other forms of volunteer work continuously as they get older [26]. It seems that higher education institutions are the dominant gateway to promoting civic engagement among the youth in the long term.
Several studies have reported various benefits arising from students’ service-learning experiences [11]. Through these experiences, students can improve their academic learning and develop practical skills [33]. They also provide opportunities for both personal growth (e.g., development of interpersonal, communication, problem-solving, and leadership skills) [34,35] and increased connections with their local community [36]. They are especially useful and critical in learning about diversity, because students’ prejudices can be challenged by direct encounters with people with different identities (e.g., generations, socioeconomic status, ethnicity, and race) [37,38]. In addition, students can develop the capacity to be responsible members of society [35,39]. These activities also benefit students’ future career by providing time to identify their values and consider career paths beneficial to their community [11].
Prior studies also identified an individual’s motivations toward community service engagement, including altruism, patriotism, values, career, and enhancement [40,41,42]. Generation Z, who were born in the mid-1990s to 2002, especially seem to engage in community service activities to receive learning opportunities and to be beneficial for their career preparation [40]. Moreover, some scholars reported a close relationship between an individual’s motivation to work in public sectors, such as government and non-governmental organizations (i.e., public service motivation) and engagement of community service activities, including volunteering [43,44]. In particular, people with a high level of commitment to the public interest tend to volunteer more often than others, and those people usually volunteer for political, religious, and charitable organizations [44].
In previous studies, background characteristics, such as gender, age, and religion, have been associated with engagement in community service [12,20,45]. These associated variables can be divided into three groups. First, as a proxy of economic capital, family background factors such as income have been reported as important attributes [12,45]. Second, as a proxy of social capital, parental education, occupation, and volunteer experience [45,46], along with the degree of social trust [47] and the service orientation of an individual’s acquaintances [46,48], has correlated to CSE. Third, as a proxy of cultural capital, activities such as reading a book, going to a museum, or watching television news [20] and community organization experiences [31,32] have been associated with CSE. Other factors associated with the national level, such as characteristics of the individual’s community [45] and governmental factors, such as media and ICT influence [49] or internationalization [50] also have an influence on CSE. Some studies also addressed education as one of the factors related to CSE; for example, the level of education, the desire for higher education attainment, and the availability of literacy resources at home are positively related to one’s attitude towards civic engagement and CSE [20,51,52]. However, these studies were published almost 20 years ago, and there is still a dearth of recent literature examining the relationship between education, specifically focusing on postsecondary education, and CSE across OECD countries.
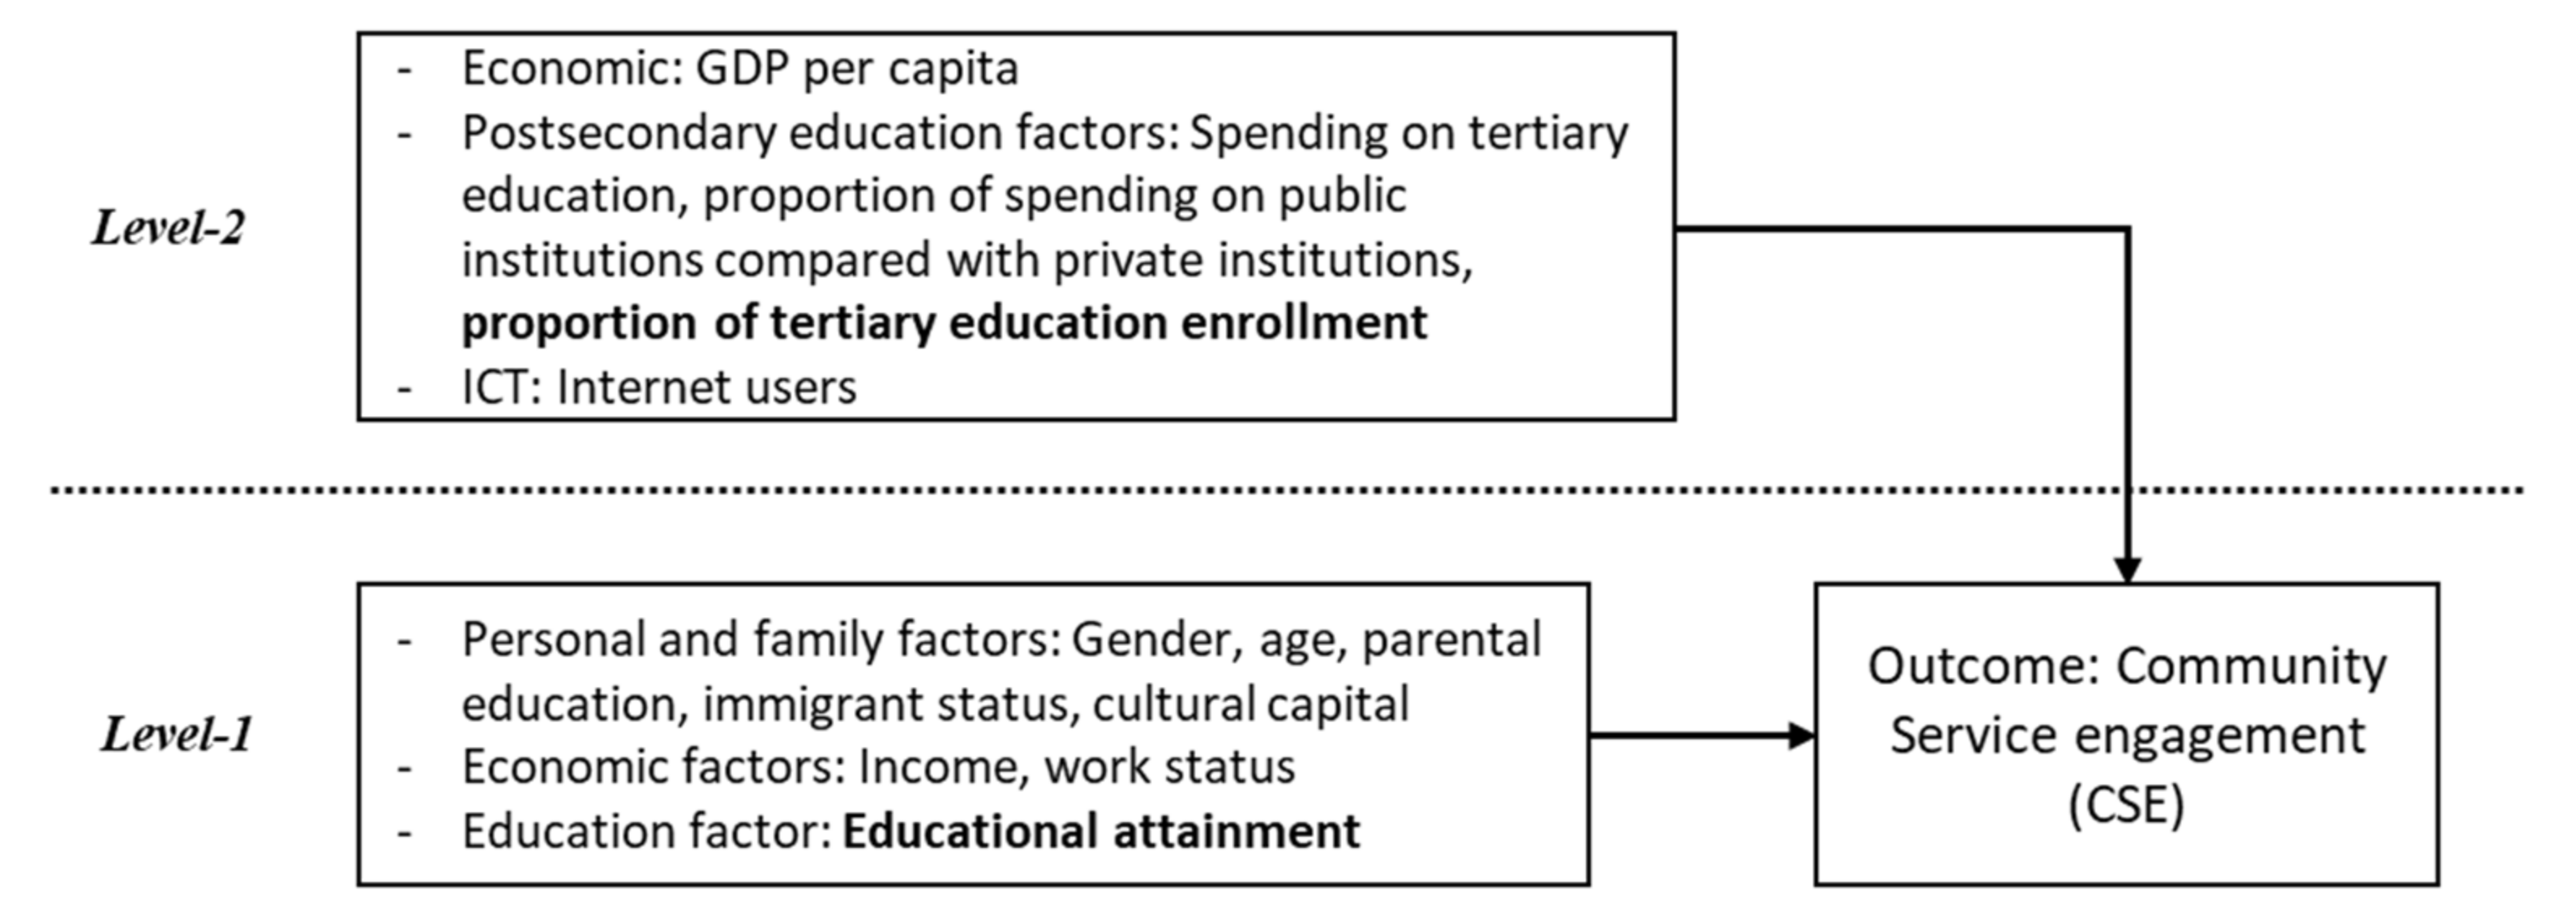
Comprehensively, even though postsecondary education has been gradually more interested in civic engagement and has put efforts into developing the curriculum and activities for community service, most previous studies focused on the individual factors influencing CSE and did not sufficiently consider educational factors using recently published large-scale data. Further, few trials have been conducted with a global perspective, and several studies were limited to a sample of one or a small number of countries. Thus, the conceptual model for our study, with literature support, is described in Figure 1.
2. Materials and Methods
2.1. Data and Sample
The data for this study came from the Survey of Adult Skills, a product of the OECD Programme for the International Assessment of Adult Competencies (PIAAC), which assesses and compares the basic skills and competencies of adults in the 21st-century around the world. The survey was a large-scale study developed by the OECD, which surveyed 24 participating countries in 2012, nine additional countries in 2014, and another five in 2017. For this study, out of the 24 countries that were surveyed in 2012, 18 made their data available for public use. The surveys were conducted in multiple languages, all transcribed and subsequently translated so that the data could be available to the OECD in English. The raw data are organized by nation; thus, they had to be collapsed into one dataset. After the systematic missing values for a variable utilized for this study were deleted, the final dataset included a total of 110,288 individuals in 18 OECD countries. For the analysis, among 110,288 individuals, if there were missing data in a specific variable included in the analytic models, that observation was excluded from the analysis; thus, the number of individuals in OLS and the HLM model was 64,910.
2.2. Variables
The dependent variable of this study is CSE, measured by individuals’ self-reported levels of participation in voluntary work. This includes unpaid work for a charity, political party, trade union, or other non-profit organization in the last 12 months. A Likert-scale was used for measuring the variable from (1) “never” to (5) “every day.” It was redeemed as a continuing variable as often as possible so it could be used without any harm to the analysis [53].
Independent variables at the individual level (level-1) included personal factors, family background factors, economic factors, and educational factors. Personal factors included gender and age (16–55+). Family background included parental education (a proxy for social capital), the number of books at home (a proxy for cultural capital), and immigrant status. Economic factors included income level (a proxy for economic capital) and individuals’ occupational status (e.g., student, employee, or retired). The educational factors that were used in the study included degree attainment (i.e., less than a high school diploma, high school diploma/some college but no degree, and college degree or higher).
In order to examine the effects of postsecondary educational attainment at the national level (level-2), other variables related to sectors of the economy, society, and technology were used as control variables, which were compiled from previous related studies [49,54,55]. The proportion of gross enrollment ratios in tertiary education for both sexes were used to assess postsecondary education attainment. In order to minimize the differences between the postsecondary education systems of each country, spending on tertiary education (1/1000 dollar) and the proportion of spending on tertiary education in the public sector were included as well. Gross domestic product (GDP) per capita (1/10,000 dollar) and the proportion of internet users were considered as control variables as well. All variables were drawn from indicators from World Bank and OECD data, aligning the same matched years (2012 and 2013) with the individual data from the PIAAC.
In the sample, in brief, 49% were female, 40% obtained greater than secondary education completion (postsecondary), 92% were employed or self-employed, and 89% were non-1st or 2nd generation immigrants. More specific descriptive statistics of the variables included in the analysis are presented in Table 1. It was confirmed that none of the missing data were biased towards a particular country or other variables.
2.3. Analytic Methods
For the analysis of these data, the following three research hypotheses (alternative hypotheses) based on the aforementioned three research questions were established:
Hypothesis 1:
The level of CSE varies by educational level in OECD countries.
Hypothesis 2:
Individual postsecondary educational attainment is positively associated with CSE.
Hypothesis 3:
Postsecondary educational attainment at the country-level is positively associated with CSE.
Specifically, for the first hypothesis test, we applied an ANOVA test with a Bonferroni post hoc test for multiple comparisons. Next, the second hypothesis was tested using OLS regression. Lastly, hierarchical linear modeling (HLM) was utilized for the testing of the third hypothesis.
The rationale behind the use of the HLM method, in particular, is the fact that data can be commonly grouped by hierarchical level [56]. For example, in this study, the behaviors of people are influenced simultaneously by their personal backgrounds but also by their country of residence. This means that variances in outcome variables are shared by the hierarchically structured data, on both the individual and national level. HLM allows for the estimation of OLS regression, taking into account the nested structure of the data, a unit of measurement. Thus, HLM can use data clusters to avoid grouping errors [57], which is helpful for drawing out accurate estimate slopes for each level.
In terms of HLM modeling, first, specifically, we fitted an unconditional model (basic model) to examine whether the average CSE differs between countries. After that, we added individual-level variables, including individual educational attainment and other covariates (Model 1). Finally, country-level variables, including the portion of postsecondary enrollment and other covariates at the country level, were included (Model 2). In Model 2, all the regression slopes of individual predictors were fixed at the country-level (level-2), since the outcomes among the given OECD countries showed only relatively small variations. This was also done to methodologically secure statistical stability [57]. The final model (Model 2) can be briefly represented as follows:
- (1)
- Level-1: ,
- (2)
- Level -2:
3. Results
Prior to conducting OLS regression and hierarchical linear modeling techniques, we examined the mean CSEs using a one-way ANOVA test with the Bonferroni post hoc test for multiple comparisons, which addressed the first research question. Means and standard deviations, as well as the results of the ANOVA comparison of means analysis, are set forth in Table 2. On average, CSE was 1.58 during the 12 months prior to completion of the survey. This value is between the level of “never (1)” and “less than once a month (2)”. However, worldwide, CSE varies from 1.31 (Poland) to 2.04 (USA), which yields a standard deviation of 0.99 among the individuals sampled within the 18 OECD countries. An alternative hypothesis (H1) predicts that for the individual participants in the CSE sample, CSE would be greater for individuals with higher rather than secondary education levels. As shown in Table 2, we rejected the null hypothesis, and the mean of CSE was not statistically equal for an individual with lower than high school completion, high school completion, and higher than high school completion. The detailed results of the Bonferroni post hoc test is also presented in Table 2. For those individuals with more than high school education (or postsecondary education level), the CSE in all 18 countries was higher than those with only high school completion or individuals with less than a high school completion.
With regard to research question 2, whether educational degree level has a statistical influence on CSE when considering other factors associated with it, the results of the OLS regression are shown in Table 3a,b. According to the results, which included all individuals in 18 countries in the sample, individuals with post-high school degrees were more likely to participate in CSE than individuals with high school completion only (β = 0.121, p < 0.001), when considering other factors as constant. In terms of the results of a statistical model applied in each of 18 countries individually, the coefficients in 12 countries out of the 18 were statistically significant. However, all individuals with a postsecondary education level participated more in CSE than did individuals who had equal to secondary education completion in all 18 countries, holding other personal background characteristics, such as gender, age, immigrant and working status, and social, economic, and cultural capital constant.
In terms of the results from the HLM method for the last research question (see Table 4), the basic model was first run before the analysis. The indicator of the intra-class correlation coefficient (ICC) in CSE, calculated by dividing the between-country variance for the outcome variable by the total variance, turned out to be 0.055. This indicates that about 5.5% of the variability was caused by countries’ individual factors or characteristics (in other words, accounted for by the between-country effect).
Next, according to the results of Model 1, including level-1 predictors and covariates, individual postsecondary educational attainment was significantly positively associated with CSE compared to the secondary educational attainment (β = 0.117, p < 0.001). At the same time, less than high school completion attainment negatively influenced CSE, compared to secondary educational attainment (β = −130, p < 0.001).
Additionally, the result of Model 2 shows that, globally, individuals with more than a high school education were more likely to participate in CSE compared to those who had only completed high school (β = 0.118, p < 0.001), when other factors at the individual and country levels remain constant in the model. On the other hand, individuals who completed lower than secondary education were associated with lower participation in CSE than those who completed secondary education. Meanwhile, the proportion of the postsecondary education enrollment at the country level (level-2) was positively associated with increased participation in CSE (β = 0.006, p < 0.05) across the OECD countries as well, when holding spending on tertiary education, the proportion of public-sector to private-sector spending on tertiary education, GDP per capita, and the proportion of internet users constant in the model.
4. Discussion and Conclusions
Recent decades have witnessed a rising emphasis on civic engagement and citizenship, and it is recognized as the leading civic education movement. The issues of civic engagement in postsecondary education are continuously discussed among policymakers, scholars, and practitioners in tertiary education settings [23,58,59]. Almost all higher education institutions state that their mission is educating students to become good, responsible citizens in our society [22,26,60,61,62]. That is, their ultimate goal is to prepare students for an active civic life. Thus, this study mainly examined the CSE globally, as a part of civic engagement activities, to explore how postsecondary education attainment affects participation in CSE. From the findings of the current study, educational degree attainment significantly influences the individual to engage in community service in most OECD countries, considering other factors associated with CSE. The study also revealed that postsecondary educational attainment plays an especially important role in increasing CSE among individuals. In addition, attaining postsecondary education is associated with an increase in CSE as a part of civic engagement and citizenship, which goes beyond the individual level and impacts the whole country.
It is important to acknowledge the limitations of our work. The outcome variable was measured using a Likert scale, but the intervals on the scale would not carry the assumption that the differences between points on the scale are all the same. Likert and Likert-type responses are popular psychometric items, and debates on whether the analysis using the Likert scale should be estimated using parametric statistics or non-parametric statistics are ongoing. However, according to Carifio and Perla [63,64], Likert responses are approximate ratio data. Additionally, individual items on Likert scales are not independent and autonomous but instead are connected to each other to yield a single unified result, which provide more reliable and fundamental construct than any individual item. Moreover, we performed the ordered logistic regression, non-parametric function as well; however, the results show considerably similar findings, which included statistically significant factors on CSE, compared to the findings of this study. Therefore, for an intuitive interpretation, we assumed CSE Likert-scale is a continuous variable. In addition to that, there are other possible factors associated with CSE, and those factors, such as information on community environment, and where they live and belong, would be included in our analytical model. However, due to the characteristics of the secondary data, we could not use these variables in our analysis and made our best attempt to analyze the given data. We hope that other researchers will further expand the analysis using more inclusive variables, and test our model using different sources, and ultimately improve upon our study.
Despite the limitations, this empirical study’s global perspective could have important implications for policy and research. First, this study comprehensively analyzed how a variety of influential factors, including personal and family characteristics (e.g., economic, social, and cultural capital), educational factors, and national factors influence CSE. Furthermore, it reveals whether each of these variables has a positive or negative influence on CSE. Accordingly, the results of this study can contribute to an appreciation of the real challenges surrounding CSE and civic engagement issues, as well as the role of higher education. Other factors (e.g., parental education and working status) that influence CSE vary from country to country. Thus, policymakers and educators in each country must compare and evaluate the results and utilize them to improve their country’s CSE. In addition, the methodology of this study was especially comprehensive and robust since it used the representative OECD national large-data samples and utilized a variety of exploratory variables and advanced analytic method, including diverse contexts at the individual and country levels. Additionally, it employed HLM, which had been rarely used to analyze this topic. Therefore, this study will assist researchers and national leaders in ensuring that CSE can be affected not only by individual-level components but also by those on a country level.
The empirical evidence of the positive association between postsecondary educational attainment and CSE, closing the previous research gap, and simultaneously adding to the previous studies (e.g., [51]). However, there is a dearth of past empirical literature related to those issues in each country, and thus limited data are available on this subject. Further studies are needed to investigate relevant factors, such as the relationship between the postsecondary education system and government (governance) in each country at the national level. This in turn influences improvements in community service and, more broadly, civic engagement. Moreover, based on the findings of this study, average national higher education attainment in a country is revealed as a significant factor influencing the average CSE of the country, which also verified as the purpose of higher education such factors as public service to society and commitment to civic affairs. Educational attainment has been one of the consistent predictors from previous studies. However, our study newly confirmed the importance of higher education attainment specifically as a motivator toward CSE at the national level. Future studies could also attempt to consider historical and political context in the country to examine how the relationship between postsecondary education and CSE would be changed depending on those national contexts. Furthermore, studies could potentially trace how civic engagement and CSE are influenced by the deliberate development level of postsecondary education. Those trials could contribute to an appreciation of the real challenges surrounding CSE and civic engagement and the role of general education and tertiary education systems around the world.
In order to be effective in the college and university setting, service-learning opportunities for students should not only advance their academic learning, but also promote their civic engagement and responsibility. Scholars have suggested several important components of this process: mutuality, personalization, inquiry, reflection, community, citizenship, and democracy [65,66]. The activities should be mutually beneficial for both actors and recipients, and students need to personalize the service by cultivating meaningful interactions with others. Pedagogically, students must have enough time to reflect on and interrogate their experiences, think through any issues, and find ways to solve them. The activities should be also directly or indirectly valuable to their community. Through these experiences, students will be able to develop their lifelong citizenship in a democratic society.
Higher education institutions should also play an important role in reducing disparity in civic engagement accessibility among students with different socioeconomic backgrounds by providing more opportunities and resources for students who do have less accessibility [22]. For example, student affairs departments and professionals at colleges and universities provide a variety of co-curricular or extra-curricular engagement bonding opportunities (e.g., experiential learning) both on and off campus together with community engagement activities. This approach ultimately should be “a transformation toward justice and the greater public good” [67] (p. 86). In addition, in the midst of the COVID-19 pandemic, due to the development of technologies, online community service engagement has been introduced [11]; thus, higher education practitioners try to spread knowledge about out this new medium to students or adults who have lower accessibility and knowledge of community and civic engagement activities.
Consequently, this study hopes to offer new insights and ideas as to how CSE can be examined in postsecondary education settings across the globe and lead to a fuller understanding of the factors that contribute to CSE from diverse contexts, including both individual and country levels in 18 OECD countries. Moreover, policy makers and practitioners can obtain additional insights into what factors function as a commonality of improving CSE and what factors do not. Simultaneously, investment in postsecondary education can play a pivotal role at both the individual and country level in bolstering CSE. This study, therefore, will contribute to improving civic engagement in educational contexts, especially in that of higher education, thereby promoting the value of democracy and social mobility to produce a better world.
Author Contributions
Conceptualization, H.J.G. and J.E.H.; Methodology, H.J.G.; Writing—original draft, H.J.G. and J.E.H.; Writing—review & editing, H.J.G. and J.E.H.. All authors have read and agreed to the published version of the manuscript.
Funding
There was no funding for this study.
Institutional Review Board Statement
Not applicable. In the paper preparation, authorization for the public-use of data utilization for this study was exempted by the PIAAC coordinator in OECD.
Informed Consent Statement
Not applicable.
Data Availability Statement
Data may openly be available in a public repository: https://www.oecd.org/skills/piaac/data/ (accessed on 15 February 2021).
Acknowledgments
The earlier version of this paper was presented at the annual meeting of the American Educational Research Association (AERA) at New York City in 2018 (“Civic engagement and political efficacy across OECD countries: Focusing on the impact of postsecondary education” by Hee Jung Gong). We thank scholars who provided valuable feedback and comments and also anonymous reviewers to improve this study.
Conflicts of Interest
The authors declare no conflict of interest.
References
- UNESCO. Available online: https://unesdoc.unesco.org/ark:/48223/pf0000227729 (accessed on 11 February 2021).
- Berg-Schlosser, D. The quality of democracies in Europe as measured by current indicators of democratization and good governance. J. Communist Stud. Transit. Politics 2004, 20, 28–55. [Google Scholar] [CrossRef]
- Hunter, C.P. Shifting themes in OECD country reviews of higher Education. High. Educ. 2013, 66, 707–723. [Google Scholar] [CrossRef]
- Washington D.C. Gallup. Available online: http://www.gallup.com/poll/145589/civic-engagement-highest-developed-countries.aspx (accessed on 18 December 2019).
- Adler, R.P.; Goggin, J. What do we mean by “civic engagement”? J. Transform. Educ. 2005, 3, 236–253. [Google Scholar] [CrossRef] [Green Version]
- Amnå, E.; Munck, I.; Zetterberg, P. Meaningful participation? Political efficacy of adolescents in 24 countries. In Emerging Repertoires of Political Action: Toward a Systemic Study of Post-Conventional Forms of Participation at ECPR Joint Sessions of Workshops; ECPR: Uppsala, Sweden, 2004. [Google Scholar]
- Spring, K.; Grimm, R., Jr.; Dietz, N. Community Service and Service-Learning in America’s Schools; Corporation for National and Community Service: Washington, DC, USA, 2008. [Google Scholar]
- U.S. Bureau of Labor Statistics. Available online: https://www.bls.gov/news.release/volun.nr0.htm (accessed on 11 February 2021).
- Kim, J.; Morgül, K. Long-term consequences of youth volunteering: Voluntary versus involuntary service. Soc. Sci. Res. 2017, 67, 160–175. [Google Scholar] [CrossRef]
- Butin, D. Service-Learning in Theory and Practice: The Future of Community Engagement in Higher Education; Springer: New York, USA, 2010. [Google Scholar]
- Salam, M.; Iskandar, D.N.A.; Ibrahim, D.H.A.; Farooq, M.S. Service learning in higher education: A systematic literature review. Asia Pac. Educ. Rev. 2019, 20, 573–593. [Google Scholar] [CrossRef]
- Morris, D.; Wylie, R.; Wilson, S. The Ties that Bind: Citizenship and Civic Engagement in the 21st Century; House of Lords: London, UK, 2018. [Google Scholar]
- QCA. Citizenship Programmes of Study (Key Stages 3 and 4); Qualifications and Curriculum Authority: London, UK, 2013. [Google Scholar]
- McIlrath, L.; MacLabhrainn, I. Higher Education and Civic Engagement: International Perspectives; Ashgate Publishing, Ltd: Aldershot, UK, 2007. [Google Scholar]
- Kang, D. A historical study on Korean citizenship education. Theory Res. Citizsh. Educ. 2001, 33, 1–22. [Google Scholar]
- Hong, W.P. How to enhance the educative function of school-based community service: Integrating service and learning. J. Curric. Stud. 2013, 31, 227–251. [Google Scholar] [CrossRef]
- Cho, H.Y. College students’ international volunteer experience through education for international understanding perspectives: Significance and limitation. J. Educ. Int. Underst. 2015, 10, 1–44. [Google Scholar]
- Gundelach, B. Economic development and civic engagement in Latin America: Comparative study. Nonprofit Volunt. Sect. Q. 2016, 45, 238–260. [Google Scholar] [CrossRef]
- Cruz, J.M. Social Capital in the Americas: Community Problem-Solving Participation; (Insights-series); Latin American Public Opinion Project: Nashville, TN, USA, 2008. [Google Scholar]
- Torney-Purta, J. Civic knowledge, beliefs about democratic institutions, and civic engagement among 14-year-olds. Prospects 2001, 31, 279–292. [Google Scholar] [CrossRef]
- Hasbún, B.; Miño, C.; Cárdenas, C.; Cisternas, O.; Fara, C.; Garcia, F. Service-Learning as a Means to Promote Development of Social Responsibility Competency in a Department of Economics and Business. Int. J. Res. Serv. Learn. Community Engagem. 2016, 4, 167–179. [Google Scholar]
- Benenson, J.; Bergom, I. Voter Participation, Socioeconomic Status, and Institutional Contexts in Higher Education. Rev. High. Educ. 2019, 42, 1665–1688. [Google Scholar] [CrossRef]
- Egerton, M. Higher education and civic engagement. Br. J. Sociol. 2002, 53, 603–620. [Google Scholar] [CrossRef]
- Hillygus, S.D. The missing link: Exploring the relationship between higher education and political engagement. Political Behav. 2005, 27, 25–47. [Google Scholar] [CrossRef]
- Braskamp, L.A. Higher education for civic learning and democratic engagement: Reinvesting in longstanding commitments. Divers. Democr. 2011, 14, 3. [Google Scholar]
- Einfeld, A.; Collins, D. The relationships between service-learning, social justice, multicultural competence, and civic engagement. J. Coll. Stud. Dev. 2008, 49, 95–109. [Google Scholar] [CrossRef]
- Diller, E.C. Citizens in Service: The Challenge of Delivering Civic Engagement Training to National Service Programs; Corporation for National and Community Service: Washington, DC, USA, 2001. [Google Scholar]
- Li, M.; Frieze, I.H. Developing civic engagement in university education: Predicting current and future engagement in community services. Soc. Psychol. Educ. 2016, 19, 775–792. [Google Scholar] [CrossRef]
- Carbone, J.T.; McMillin, S.E. Neighborhood collective efficacy and collective action: The role of civic engagement. J. Community Psychol. 2019, 47, 311–326. [Google Scholar] [CrossRef] [PubMed]
- Bilali, R.; Vollhardt, J.R.; Rarick, J.R.D. Modeling collective action through media to promote social change and positive intergroup relations in violent conflicts. J. Exp. Soc. Psychol. 2017, 68, 200–211. [Google Scholar] [CrossRef]
- Astin, A.W.; Keup, J.R.; Lindholm, J.A. A Decade of Changes in Undergraduate Education: A National Study of System “Transformation”. Rev. High. Educ. 2002, 25, 141–162. [Google Scholar] [CrossRef]
- Flanagan, C.; Levine, P. Civic engagement and the transition to adulthood. Future Child. 2010, 20, 159–179. [Google Scholar] [CrossRef]
- Meyer, C.L.; Harned, M.; Schaad, A.; Sunder, K.; Palmer, J.; Tinch, C. Inmate education as a service learning opportunity for students: Preparation, benefits, and lessons Learned. Teach. Psychol. 2016, 43, 120–125. [Google Scholar] [CrossRef] [Green Version]
- Geller, J.D.; Zuckerman, N.; Seidel, A. Service-learning as a catalyst for community development how do community partners benefit from service-learning? Educ. Urban Soc. 2016, 48, 151–175. [Google Scholar] [CrossRef]
- Rutti, R.M.; LaBonte, J.; Helms, M.M.; Hervani, A.A.; Sarkarat, S. The service learning projects: Stakeholder benefits and potential class topics. Educ. Train. 2016, 58, 422–438. [Google Scholar] [CrossRef] [Green Version]
- Garcia, N.A.; Longo, N.V. Going global: Re-framing service-learning in an interconnected world. J. High. Educ. Outreach Engagem. 2013, 17, 111–135. [Google Scholar]
- Johnson, A.M.; Howell, D.M. International service learning and interprofessional education in Ecuador: Findings from a phenomenology study with students from four professions. J. Interprofessional Care 2017, 31, 245–254. [Google Scholar] [CrossRef]
- Laks, J.; Wilson, L.A.; Khandelwal, C.; Footman, E.; Jamison, M.; Roberts, E. Service-learning in communities of elders (SLICE): Development and evaluation of an introductory geriatrics course for medical students. Teach. Learn. Med. 2016, 28, 210–218. [Google Scholar] [CrossRef]
- Winston, F. Reflections upon community engagement: Service learning and its effect on political participation after college. J. High. Educ. Outreach Engagem. 2015, 19, 79–104. [Google Scholar]
- Cho, M.; Bonn, M.A.; Han, S.J. Generation Z’s sustainable volunteering: Motivations, attitudes and job performance. Sustainability 2018, 10, 1400. [Google Scholar] [CrossRef] [Green Version]
- Dwyer, P.C.; Bono, J.E.; Snyder, M.; Nov, O.; Berson, Y. Sources of volunteer motivation: Transformational leadership and personal motives influence volunteer outcomes. Nonprofit Manag. Leadersh. 2013, 24, 181–205. [Google Scholar] [CrossRef]
- Lee, C.K.; Reisinger, Y.; Kim, M.J.; Yoon, S.M. The influence of volunteer motivation on satisfaction, attitudes, and support for a mega-event. Int. J. Hosp. Manag. 2014, 40, 37–48. [Google Scholar] [CrossRef]
- Clerkin, R.M.; Fotheringham, E. Exploring the relationship between public service motivation and formal and informal volunteering. J. Public Nonprofit Aff. 2017, 3, 23–39. [Google Scholar] [CrossRef] [Green Version]
- Leisink, P.L.; Knies, E.; van Loon, N. Does public service motivation matter? A study of participation in various volunteering domains. Int. Public Manag. J. 2018, 1–21. [Google Scholar] [CrossRef] [Green Version]
- Seider, S. Catalyzing a commitment to community service in emerging adults. J. Adolesc. Res. 2007, 22, 612–639. [Google Scholar] [CrossRef]
- McLellan, J.A.; Youniss, J. Two systems of youth service: Determinants of voluntary and required youth community service. J. Youth Adolesc. 2003, 32, 47–58. [Google Scholar] [CrossRef]
- Kim, J.-Y. “Bowling Together” isn’t a cure-all: The relationship between social capital and political trust in South Korea. Int. Political Sci. Rev. 2005, 26, 193–213. [Google Scholar] [CrossRef]
- Chesbrough, R.D. College students and service: A mixed methods exploration of motivations, choices, and learning outcomes. J. Coll. Stud. Dev. 2011, 52, 687–705. [Google Scholar] [CrossRef] [Green Version]
- Sulaiman, A.H.; Othman, J.; Samah, B.A.; Yero, A.; D’Silva, J.L.; Ortega, A. Determinants of community participation in community policing program in Malaysia. J. Appl. Sci. 2014, 14, 2439–2449. [Google Scholar] [CrossRef]
- Horn, A.S.; Hendel, D.D.; Fry, G.W. The empirical basis for adopting a civic rationale for internationalization. High. Educ. 2012, 64, 161–175. [Google Scholar] [CrossRef]
- Parboteeah, K.P.; Cullen, J.B.; Lim, L. Formal volunteering: A cross-national test. J. World Bus. 2004, 39, 431–441. [Google Scholar] [CrossRef]
- Wilson, J. Volunteering. Annu. Rev. Sociol. 2000, 26, 215–240. [Google Scholar] [CrossRef]
- Norman, G. Likert scales, levels of measurement and the “laws” of statistics. Adv. Health Sci. Educ. 2010, 15, 625–632. [Google Scholar] [CrossRef]
- Brown, P.; Lauder, H. Education, economy and social change. Int. Stud. Sociol. Educ. 1991, 1, 3–23. [Google Scholar] [CrossRef]
- Dumciuviene, D. The Impact of Education Policy to Country Economic Development. Procedia Soc. Behav. Sci. 2015, 191, 2427–2436. [Google Scholar] [CrossRef] [Green Version]
- Osborne, J.W. Advantages of hierarchical linear modeling. Pract. Assess. Res. Eval. 2000, 7, 1–4. [Google Scholar]
- Raudenbush, S.W.; Bryk, A.S. Hierarchical Linear Models; Stage: Newbury Park, CA, USA, 2002. [Google Scholar]
- Gastil, J.; Levine, P. The Deliberative Democracy Handbook: Strategies for Effective Civic Engagement in the Twenty-First Century; Jossey-Bass: San Francisco, CA, USA, 2005; p. 308. [Google Scholar]
- Jacoby, B. Civic engagement in today’s higher education: An overview. In Civ. Engagem. High. Educ. Concepts Pract; Jacoby, B., Ed.; Jossey-Bass: San Francisco, CA, USA, 2009; pp. 5–30. [Google Scholar]
- Colby, A.; Beaumont, E.; Ehrlich, T.; Stephens, J. Educating Citizens: Preparing America’s Undergraduates for Lives of Moral and Civic Responsibility; Jossey-Bass: San Francisco, CA, USA, 2003. [Google Scholar]
- Kezar, A. Assessing community service learning: Are we identifying the right outcomes? About Campus. 2002, 7, 14–20. [Google Scholar] [CrossRef]
- Sax, L.J. Citizenship development and the American college student. New Dir. Inst. Res. 2004, 122, 65–80. [Google Scholar] [CrossRef] [Green Version]
- Carifio, J.; Perla, R. Ten common misunderstandings, misconceptions, persistent myths and urban legends about Likert scales and Likert response formats and their antidotes. J. Soc. Sci. 2007, 3, 106–116. [Google Scholar] [CrossRef] [Green Version]
- Carifio, J.; Perla, R. Resolving the 50-year debate around using and Misusing Likert Scales. Med Educ. 2008, 42, 1150–1152. [Google Scholar] [CrossRef]
- Cummings, C.K. John Dewey and the rebuilding of urban community: Engaging undergraduates as neighborhood organizers. Mich. J. Community Serv. Learn. 2000, 7, 97–109. [Google Scholar]
- Rhoads, R.A. Democratic citizenship and service learning: Advancing the caring self. New Dir. Teach. Learn. 2000, 82, 37–44. [Google Scholar] [CrossRef]
- Ozias, M.; Pasque, P. Critical geography as theory and praxis: The community–university imperative for social change. J. High. Educ. 2019, 90, 85–110. [Google Scholar] [CrossRef]
Figure 1.
Conceptual model of predictors influencing community service engagement


Table 1.
Descriptive statistics (n = 64,910).
| Variable | Mean | Std. Dev. | Min | Max |
|---|---|---|---|---|
| Communivty Service Engagement (CSE) | 1.63 | 1.00 | 1.00 | 5.00 |
| Gender (female) | 0.49 | 0.50 | 0.00 | 1.00 |
| Age: 16–24 (Age1) * | 0.13 | 0.33 | 0.00 | 1.00 |
| Age: 25–34 (Age2) | 0.23 | 0.42 | 0.00 | 1.00 |
| Age: 35–44 (Age3) | 0.24 | 0.43 | 0.00 | 1.00 |
| Age: 45–54 (Age4) | 0.23 | 0.42 | 0.00 | 1.00 |
| Age: 55+ (Age5) | 0.17 | 0.37 | 0.00 | 1.00 |
| Lower than secondary education completion (ED1) | 0.14 | 0.35 | 0.00 | 1.00 |
| Secondary education completion (ED2) * | 0.46 | 0.50 | 0.00 | 1.00 |
| Greater than secondary education completion (postsecondary) (ED3) | 0.40 | 0.49 | 0.00 | 1.00 |
| Income: no income (Income1) * | 0.15 | 0.36 | 0.00 | 1.00 |
| Income: lowest quantile (Income2) | 0.15 | 0.36 | 0.00 | 1.00 |
| Income: next lowest quantile (Income3) | 0.25 | 0.43 | 0.00 | 1.00 |
| Income: mid-level quantile (Income4) | 0.21 | 0.41 | 0.00 | 1.00 |
| Income: next to highest quantile (Income5) | 0.13 | 0.33 | 0.00 | 1.00 |
| Income: highest quantile (Income6) | 0.11 | 0.31 | 0.00 | 1.00 |
| Immigrant status: 1st generation immigrants (Imgrt1) * | 0.08 | 0.28 | 0.00 | 1.00 |
| Immigrant status: 2nd generation immigrants (Imgrt2) | 0.03 | 0.16 | 0.00 | 1.00 |
| Immigrant status: non 1st or 2nd generation immigrants (Imgrt3) | 0.89 | 0.32 | 0.00 | 1.00 |
| Cultural capital: 10 books or less (Culture1) * | 0.12 | 0.33 | 0.00 | 1.00 |
| Culture capital: 11 to 25 books (Culture2) | 0.15 | 0.35 | 0.00 | 1.00 |
| Culture capital: 26 to 100 books (Culture3) | 0.33 | 0.47 | 0.00 | 1.00 |
| Culture capital: 101 to 500 books (Culture4) | 0.18 | 0.38 | 0.00 | 1.00 |
| Culturel capital: more than 500 books (Culture5) | 0.22 | 0.42 | 0.00 | 1.00 |
| Parental educaiton: Neither parent has attained upper secondary (ParEd1) * | 0.35 | 0.48 | 0.00 | 1.00 |
| Parental educaiton: At least one parent has attained secondary and postsecondary, non-tertiary (ParEd2) | 0.41 | 0.49 | 0.00 | 1.00 |
| Parental educaiton: At least one parent has attained tertiary (ParEd3) | 0.25 | 0.43 | 0.00 | 1.00 |
| Work status: Employed or Self-employed (Status1) | 0.92 | 0.27 | 0.00 | 1.00 |
| Work status: Retired (Status2) | 0.00 | 0.07 | 0.00 | 1.00 |
| Work status: Unemployed and looking for work (Status3) * | 0.01 | 0.10 | 0.00 | 1.00 |
| Work status: Student (including work programs (Status4) | 0.04 | 0.20 | 0.00 | 1.00 |
| Work status: Doing unpaid household work (Status5) | 0.01 | 0.11 | 0.00 | 1.00 |
| Work status: Others (Status6) | 0.01 | 0.12 | 0.00 | 1.00 |
| Proportion of Internet users (per 100 people) (C_Internet) | 0.80 | 0.12 | 0.58 | 0.95 |
| Average GDP per capita (10k) (C_GDP/capita) | 0.41 | 0.22 | 0.14 | 1.03 |
| Financial amount for tertiary education/student ($10,000)(C_TertiarySpend) | 1.56 | 0.58 | 0.78 | 2.79 |
| Proportion of spending on tertiary public education (C_SepndingTertiaryPublic) | 0.73 | 0.21 | 0.32 | 0.96 |
| Proportion of gross tertiary enrollment (C_TertiaryEnroll) | 0.73 | 0.12 | 054 | 0.95 |
Note: Descriptive statistics indicate the analytic sample number is limited to 64,910, and the observation has no missing data across all the variables. In the table, * indicates the reference categories.
Table 2.
ANOVA results for differences in community service engagement (CSE) by educational level.
| Country | CSE Mean | CSE Std. Dev. | Lower than High School Completion | High School Completion (Secondary Education) | Greater than High School Completion (Postsecondary Education) | n | Difference in Educational Level |
|---|---|---|---|---|---|---|---|
| All (18 countries) | 1.58 | 0.99 | 1.43 (0.88) | 1.53 (0.97) | 1.75 (1.07) | 110,288 | F = 828.77 *** |
| Chile | 1.55 | 1.01 | 1.47 (0.95) | 1.53 (0.99) | 1.70 (1.10) | 5188 | 20.81 *** |
| Czech | 1.35 | 0.83 | 1.35 (0.77) | 1.32 (0.81) | 1.46 (0.93) | 6077 | 13.94 *** |
| Denmark | 1.84 | 1.13 | 1.64 (1.04) | 1.85 (1.15) | 1.95 (1.15) | 7284 | 41.55 *** |
| Estonia | 1.43 | 0.82 | 1.30 (0.71) | 1.39 (0.81) | 1.53 (0.87) | 7577 | 42.56 *** |
| Finland | 1.77 | 1.03 | 1.59 (0.95) | 1.77 (1.05) | 1.89 (1.02) | 5450 | 23.69 *** |
| France | 1.53 | 1.03 | 1.26 (0.80) | 1.47 (0.98) | 1.70 (1.12) | 6905 | 59.48 *** |
| Israel | 1.73 | 1.09 | 1.55 (1.01) | 1.71 (1.06) | 1.89 (1.14) | 5963 | 44.32 *** |
| Ireland | 1.65 | 1.11 | 1.65 (1.13) | 1.56 (1.06) | 1.75 (1.14) | 5308 | 15.23 *** |
| Italy | 1.48 | 1.00 | 1.35 (0.89) | 1.51 (1.03) | 1.66 (1.12) | 4584 | 26.98 *** |
| Japan | 1.50 | 0.81 | 1.38 (0.73) | 1.49 (0.80) | 1.55 (0.84) | 5172 | 12.16 *** |
| South Korea | 1.44 | 0.83 | 1.44 (0.78) | 1.40 (0.83) | 1.48 (0.86) | 6651 | 6.21 ** |
| Norway | 2.03 | 1.10 | 1.84 (1.03) | 2.05 (1.11) | 2.14 (1.12) | 4941 | 29.67 *** |
| Poland | 1.31 | 0.74 | 1.27 (0.62) | 1.26 (0.69) | 1.45 (0.88) | 9360 | 53.32 *** |
| Slovakia | 1.36 | 0.75 | 1.27 (0.66) | 1.34 (0.73) | 1.57 (0.89) | 5695 | 49.20 *** |
| Spain | 1.35 | 0.87 | 1.22 (0.72) | 1.42 (0.94) | 1.52 (1.01) | 5970 | 70.71 *** |
| Sweden | 1.70 | 1.06 | 1.48 (0.92) | 1.71 (1.08) | 1.80 (1.08) | 4462 | 24.23 *** |
| United Kingdom | 1.63 | 1.07 | 1.34 (0.86) | 1.60 (1.05) | 1.87 (1.17) | 8806 | 181.47 *** |
| United of States | 2.04 | 1.15 | 1.74 (1.09) | 1.92 (1.12) | 2.30 (1.15) | 4895 | 87.30 *** |
*** p < 0.001 ** p < 0.01. For these statistics, the sample is inclusive of observations suitable for analysis when the outcome variable has no missing values. The F-Statistic is calculated from variation between sample means divided by variation within the samples.
Table 3.
Ordinary least square (OLS) estimates for educational attainment predicting community service engagement.
(a)
| Variables | All | Chile | Czech | Denmark | Estonia | Finland | France | Ireland | Israel |
|---|---|---|---|---|---|---|---|---|---|
| Coef. | Coef. | Coef. | Coef. | Coef. | Coef. | Coef. | Coef. | Coef. | |
| (s.e.) | (s.e.) | (s.e.) | (s.e.) | (s.e.) | (s.e.) | (s.e.) | (s.e.) | (s.e.) | |
| Ed1 | −0.137 *** | −0.086 | −0.159 * | −0.150 ** | −0.123 ** | −0.179 ** | −0.179 ** | −0.238 *** | 0.160 * |
| −0.027 | −0.065 | −0.074 | −0.051 | −0.038 | −0.06 | −0.066 | −0.07 | −0.077 | |
| Ed3 | 0.121 *** | 0.150 + | 0.147 * | 0.056 | 0.145 *** | 0.048 | 0.147 *** | 0.156 ** | 0.183 *** |
| −0.023 | −0.085 | −0.074 | −0.044 | −0.03 | −0.045 | −0.04 | −0.054 | −0.052 | |
| Covariates (control variables) | |||||||||
| Age2 | −0.158 *** | 0.021 | 0.081 | 0.003 | 0.021 | 0.016 | 0.141 * | 0.052 | −0.052 |
| −0.041 | −0.092 | −0.076 | −0.085 | −0.046 | −0.073 | −0.055 | −0.083 | −0.065 | |
| Age3 | 0.021 | 0.129 | 0.094 | 0.322 *** | 0.045 | 0.214 ** | 0.368 *** | 0.290 *** | 0.006 |
| −0.041 | −0.098 | −0.078 | −0.086 | −0.046 | −0.076 | −0.058 | −0.085 | −0.072 | |
| Age4 | 0.085 * | 0.114 | 0.053 | 0.293 *** | 0.083 + | 0.262 *** | 0.430 *** | 0.616 *** | 0.185 * |
| −0.042 | −0.104 | −0.095 | −0.086 | −0.05 | −0.078 | −0.06 | −0.095 | −0.082 | |
| Age5 | 0.193 *** | 0.105 | 0.051 | 0.204 * | 0.023 | 0.206* | 0.366 *** | 0.516 *** | 0.055 |
| −0.045 | −0.115 | −0.089 | −0.085 | −0.052 | −0.081 | −0.067 | −0.101 | −0.085 | |
| Female | 0.053 ** | 0.055 | −0.086 | −0.161 *** | −0.100 *** | −0.080 * | −0.147 *** | −0.123 ** | −0.034 |
| −0.02 | −0.066 | −0.058 | −0.037 | −0.029 | −0.037 | −0.034 | −0.046 | −0.044 | |
| Income2 | −0.033 | −0.387 *** | 0.138 | −0.266 *** | −0.096 + | −0.188 *** | −0.043 | −0.077 | 0.028 |
| −0.034 | −0.117 | −0.094 | −0.078 | −0.052 | −0.056 | −0.105 | −0.103 | −0.091 | |
| Income3 | 0.013 | −0.380 *** | 0.11 | −0.230 ** | −0.099 * | −0.132 * | −0.077 | −0.290 *** | −0.179 * |
| −0.03 | −0.114 | −0.07 | −0.078 | −0.048 | −0.055 | −0.1 | −0.079 | −0.079 | |
| Income4 | 0.096 ** | −0.398 *** | 0.06 | −0.206 * | −0.105 * | −0.061 | −0.045 | −0.261 ** | −0.185 * |
| −0.032 | −0.114 | −0.078 | −0.082 | −0.049 | −0.058 | −0.104 | −0.081 | −0.08 | |
| Income5 | 0.152 *** | −0.305* | 0.137 | −0.194 * | −0.172 ** | 0.013 | −0.047 | −0.180 * | −0.242 ** |
| −0.036 | −0.15 | −0.095 | −0.089 | −0.052 | −0.068 | −0.112 | −0.092 | −0.09 | |
| Income6 | 0.069 + | −0.519 *** | 0.025 | −0.219 * | −0.135 * | −0.019 | −0.168 | −0.284 ** | −0.279 ** |
| −0.037 | −0.135 | −0.099 | −0.094 | −0.057 | −0.072 | −0.12 | −0.096 | −0.094 | |
| Imgrt2 | 0.087 | 0.127 | 0.036 | 0.16 | −0.004 | −0.107 | 0.189 * | 0.145 | 0.329 *** |
| −0.079 | −0.562 | −0.377 | −0.168 | −0.06 | −0.348 | −0.084 | −0.185 | −0.062 | |
| Imgtr3 | −0.047 | 0.086 | −0.294 | 0.208 *** | 0.029 | 0.243 * | 0.199 *** | 0.397 *** | 0.312 *** |
| −0.038 | −0.119 | −0.235 | −0.043 | −0.046 | −0.1 | −0.049 | −0.049 | −0.051 | |
| Culture2 | −0.007 | 0.116 | 0.046 | 0.031 | −0.010 | 0.134 + | 0.052 | 0.106 | 0.047 |
| −0.031 | −0.076 | −0.147 | −0.079 | −0.084 | −0.08 | −0.053 | −0.072 | −0.074 | |
| Culture3 | 0.105 *** | 0.141 | −0.051 | 0.075 | 0.011 | 0.079 | 0.127 ** | 0.173 * | 0.120 + |
| −0.029 | −0.093 | −0.118 | −0.071 | −0.078 | −0.072 | −0.048 | −0.067 | −0.067 | |
| Culture4 | 0.179 *** | 0.216 | 0.171 | 0.045 | 0.079 | 0.252 ** | 0.181** | 0.190* | 0.144 + |
| −0.036 | −0.152 | −0.136 | −0.075 | −0.081 | −0.08 | −0.061 | −0.08 | −0.079 | |
| Culture5 | 0.251 *** | 0.564 ** | 0.138 | 0.149 + | 0.123 | 0.291 *** | 0.311 *** | 0.184 * | 0.463 *** |
| −0.038 | −0.21 | −0.129 | −0.076 | −0.081 | −0.08 | −0.066 | −0.082 | −0.078 | |
| ParEd2 | 0.139 *** | 0.071 | −0.051 | −0.041 | 0.058+ | 0.048 | 0.062 | 0.005 | 0.031 |
| −0.022 | −0.07 | −0.101 | −0.044 | −0.033 | −0.043 | −0.04 | −0.052 | −0.056 | |
| ParEd3 | 0.256 *** | 0.018 | −0.070 | −0.031 | 0.130 ** | 0.024 | 0.074 | 0.116+ | 0.118 + |
| −0.029 | −0.103 | −0.126 | −0.053 | −0.04 | −0.058 | −0.058 | −0.066 | −0.06 | |
| Status1 | −0.153 + | −0.126 | 0.057 | 0.035 | 0.041 | 0.321 + | 0.078 | 0.526 ** | 0.251 |
| −0.088 | −0.158 | −0.128 | −0.196 | −0.124 | −0.177 | −0.253 | −0.201 | −0.191 | |
| Status2 | 0.167 | 0.364 | 0.132 | −0.037 | −0.284 + | 0.953 ** | 0.083 | 1.032 ** | 1.748 + |
| −0.186 | −0.506 | −0.171 | −0.273 | −0.149 | −0.32 | −0.365 | −0.375 | −0.967 | |
| Status4 | 0.285 ** | 0.061 | 0.157 | 0.062 | 0.325 * | 0.454 * | 0.244 | 0.574 * | 0.528 * |
| −0.107 | −0.196 | −0.167 | −0.209 | −0.157 | −0.194 | −0.276 | −0.232 | −0.22 | |
| Status5 | 0.398 * | −0.330 + | −0.074 | −0.422 | −0.009 | 0.347 + | −0.19 | 0.227 | 0.573 |
| −0.165 | −0.185 | −0.163 | −0.271 | −0.151 | −0.21 | −0.266 | −0.375 | −0.472 | |
| Status6 | −0.026 | −0.174 | −0.136 | −0.173 | −0.093 | 0.385 | 0.282 | 0.312 | 0.311 |
| −0.118 | −0.235 | −0.175 | −0.233 | −0.142 | −0.242 | −0.344 | −0.287 | −0.243 | |
| Constant | 1.539 *** | 1.722 *** | 1.440 *** | 1.678 *** | 1.317 *** | 0.974 *** | 0.915 *** | 0.709 ** | 0.929 *** |
| −0.105 | −0.244 | −0.305 | −0.214 | −0.159 | −0.218 | −0.273 | −0.219 | −0.209 | |
| n | 64,910 | 3025 | 3017 | 5137 | 4367 | 3668 | 3835 | 3256 | 2877 |
| R2 | 0.06 | 0.06 | 0.03 | 0.03 | 0.03 | 0.04 | 0.05 | 0.08 | 0.07 |
Reference group: Age1 (16–24), Ed2 (secondary education completion), Imgrt1 (1st generation immigrants), Income1 (no income), Culture1 (cultural capital_lowest quantile), ParEd1 (neither parent has attained upper secondary), Status3 (not working and looking for work). + p < 0.10, * p < 0.05, ** p < 0.01, *** p < 0.001.
(b)
| Variables | Italy | Japan | S. Korea | Norway | Poland | Slovakia | Spain | Sweden | UK | USA |
|---|---|---|---|---|---|---|---|---|---|---|
| Coef. | Coef. | Coef. | Coef. | Coef. | Coef. | Coef. | Coef. | Coef. | Coef. | |
| (s.e.) | (s.e.) | (s.e.) | (s.e.) | (s.e.) | (s.e.) | (s.e.) | (s.e.) | (s.e.) | (s.e.) | |
| Ed1 | −0.022 | −0.115 * | −0.140 *** | −0.198 *** | −0.065 | −0.087 + | −0.217 *** | −0.109 | −0.271 *** | −0.160 * |
| −0.054 | −0.047 | −0.039 | −0.05 | −0.051 | −0.049 | −0.053 | −0.071 | −0.052 | −0.075 | |
| Ed3 | 0.128 + | 0.036 | 0.090 ** | 0.023 | 0.187 *** | 0.211 *** | 0.025 | 0.027 | 0.144 ** | 0.287 *** |
| −0.071 | −0.031 | −0.032 | −0.045 | −0.044 | −0.044 | −0.056 | −0.045 | −0.046 | −0.052 | |
| Covariates (control variables) | ||||||||||
| Age2 | −0.045 | 0.072 | −0.083 | 0.094 | −0.047 | −0.054 | −0.033 | 0.008 | 0.086 | −0.232 ** |
| −0.092 | −0.051 | −0.054 | −0.067 | −0.037 | −0.053 | −0.075 | −0.084 | −0.066 | −0.079 | |
| Age3 | 0.065 | 0.151 ** | −0.002 | 0.506 *** | 0.089 * | −0.015 | 0.122 | 0.314 *** | 0.269 *** | 0.015 |
| −0.093 | −0.051 | −0.055 | −0.07 | −0.043 | −0.054 | −0.079 | −0.088 | −0.07 | −0.083 | |
| Age4 | 0.167 + | 0.226 *** | 0.138* | 0.506 *** | 0.098 * | 0.049 | 0.089 | 0.335 *** | 0.354 *** | −0.028 |
| −0.095 | −0.056 | −0.056 | −0.072 | −0.05 | −0.056 | −0.078 | −0.089 | −0.071 | −0.084 | |
| Age5 | 0.089 | 0.363 *** | 0.269 *** | 0.234 ** | 0.125 + | 0.049 | 0.250 * | 0.209 * | 0.298 *** | 0.098 |
| −0.098 | −0.059 | −0.064 | −0.075 | −0.065 | −0.061 | −0.101 | −0.09 | −0.075 | −0.09 | |
| Female | 0.012 | −0.134 *** | 0.085 ** | −0.140 *** | 0.073 * | 0.007 | −0.066 | −0.132 ** | 0.013 | 0.073 + |
| −0.047 | −0.032 | −0.027 | −0.038 | −0.037 | −0.028 | −0.041 | −0.042 | −0.043 | −0.043 | |
| Income2 | −0.214 * | −0.092 * | −0.077 + | −0.059 | −0.017 | −0.076 | −0.040 | −0.483 *** | −0.398 *** | −0.322 ** |
| −0.085 | −0.046 | −0.044 | −0.073 | −0.062 | −0.058 | −0.058 | −0.111 | −0.089 | −0.102 | |
| Income3 | −0.074 | −0.045 | −0.034 | −0.111 | −0.020 | −0.121 * | 0.012 | −0.251 ** | −0.514 *** | −0.334 *** |
| −0.086 | −0.048 | −0.04 | −0.071 | −0.062 | −0.061 | −0.062 | −0.077 | −0.089 | −0.098 | |
| Income4 | −0.048 | −0.024 | 0.021 | −0.121 | 0.016 | −0.058 | −0.024 | −0.217 ** | −0.515 *** | −0.282 ** |
| −0.091 | −0.047 | −0.043 | −0.08 | −0.074 | −0.08 | −0.067 | −0.081 | −0.091 | −0.101 | |
| Income5 | 0.097 | −0.068 | 0.037 | 0 | −0.047 | −0.020 | −0.002 | −0.266 ** | −0.450 *** | −0.236 * |
| −0.103 | −0.053 | −0.052 | −0.087 | −0.089 | −0.188 | −0.078 | −0.087 | −0.102 | −0.105 | |
| Income6 | −0.178+ | −0.096+ | 0.063 | −0.090 | 0.024 | 0.011 | −0.082 | −0.265 ** | −0.430 *** | −0.310 ** |
| −0.107 | −0.051 | −0.057 | −0.092 | −0.091 | −0.111 | −0.086 | −0.094 | −0.105 | −0.11 | |
| Imgrt2 | 0.134 | 0 | −0.544 *** | 0.367 | −0.297 | 0.134 | −0.068 | −0.030 | 0.017 | 0.079 |
| −0.331 | (.) | −0.112 | −0.244 | −0.256 | −0.221 | −0.129 | −0.112 | −0.107 | −0.127 | |
| Imgtr3 | 0.026 | −0.538 | 0.075 | 0.320 *** | −0.388 ** | 0.037 | 0.114 * | 0.189 *** | 0.087 | 0.112 + |
| −0.073 | −0.492 | −0.103 | −0.055 | −0.118 | −0.145 | −0.049 | −0.056 | −0.058 | −0.068 | |
| Culture2 | 0.118 * | 0.045 | 0.097 * | 0.029 | 0.034 | 0.055 | 0.053 | 0.028 | −0.095 | −0.051 |
| −0.06 | −0.041 | −0.038 | −0.104 | −0.052 | −0.056 | −0.055 | −0.116 | −0.075 | −0.071 | |
| Culture3 | 0.250 *** | 0.192 *** | 0.150 *** | 0.137 | 0.132 * | 0.103 * | 0.087 | 0.032 | −0.014 | 0.167 * |
| −0.065 | −0.039 | −0.036 | −0.094 | −0.052 | −0.052 | −0.057 | −0.098 | −0.07 | −0.07 | |
| Culture4 | 0.356 *** | 0.216 *** | 0.247 *** | 0.196 * | 0.280 *** | 0.127 * | 0.184 * | 0.1 | 0.064 | 0.259 ** |
| −0.084 | −0.053 | −0.051 | −0.097 | −0.068 | −0.059 | −0.08 | −0.104 | −0.08 | −0.083 | |
| Culture5 | 0.511 *** | 0.208 *** | 0.288 *** | 0.282 ** | 0.321 *** | 0.207 ** | 0.229 ** | 0.264 * | 0.125 | 0.425 *** |
| −0.101 | −0.055 | −0.056 | −0.097 | −0.082 | −0.066 | −0.084 | −0.104 | −0.083 | −0.086 | |
| ParEd2 | 0.011 | −0.004 | −0.001 | −0.047 | −0.049 | −0.039 | −0.018 | 0.006 | 0.067 | 0.003 |
| −0.063 | −0.041 | −0.032 | −0.047 | −0.059 | −0.036 | −0.055 | −0.054 | −0.052 | −0.069 | |
| ParEd3 | −0.104 | −0.031 | 0.058 | −0.043 | −0.012 | −0.048 | 0.06 | 0.019 | 0.216 *** | 0.027 |
| −0.121 | −0.046 | −0.046 | −0.056 | −0.094 | −0.061 | −0.068 | −0.055 | −0.064 | −0.077 | |
| Status1 | −0.392 | 0.368 ** | 0.172+ | −0.124 | −0.010 | −0.114 | 0.081 | −0.108 | −0.580 | −0.050 |
| −0.316 | −0.12 | −0.089 | −0.345 | −0.083 | −0.145 | −0.075 | −0.27 | −0.422 | −0.158 | |
| Status2 | −0.294 | 0.814 | 0.591 | 0.249 | −0.067 | 0.083 | −0.437 ** | 0.073 | −0.677 | 0.23 |
| −0.467 | −0.501 | −0.559 | −0.543 | −0.145 | −0.27 | −0.134 | −0.401 | −0.623 | −0.332 | |
| Status4 | −0.449 | 0.552 *** | 0.251 * | 0.045 | 0.323 ** | 0.185 | 0.211 | −0.136 | −0.283 | 0.257 |
| −0.375 | −0.15 | −0.127 | −0.351 | −0.119 | −0.207 | −0.188 | −0.287 | −0.447 | −0.181 | |
| Status5 | −0.907 ** | 0.613 ** | 0.285 | 0.114 | −0.065 | 0.195 | −0.172 * | −0.415 | −0.932 * | 0.716 * |
| −0.339 | −0.228 | −0.197 | −0.425 | −0.212 | −0.232 | −0.088 | −0.293 | −0.47 | −0.281 | |
| Status6 | −0.461 | 0.142 | 0.152 | −0.395 | 0.242 | −0.286 | 0.224 | 0.278 | −0.487 | −0.082 |
| −0.343 | −0.154 | −0.128 | −0.376 | −0.217 | −0.223 | −0.212 | −0.381 | −0.455 | −0.191 | |
| Constant | 1.597 *** | 1.457 ** | 0.903 *** | 1.604 *** | 1.474 *** | 1.360 *** | 1.137 *** | 1.626 *** | 2.165 *** | 2.004 *** |
| −0.339 | −0.508 | −0.149 | −0.365 | −0.157 | −0.207 | −0.122 | −0.285 | −0.437 | −0.197 | |
| n | 2396 | 3560 | 4219 | 3854 | 4339 | 2911 | 2799 | 3191 | 5225 | 3234 |
| R2 | 0.05 | 0.04 | 0.04 | 0.06 | 0.06 | 0.04 | 0.04 | 0.04 | 0.08 | 0.09 |
Reference group: Age1 (16–24), Ed2 (secondary education completion), Imgrt1 (1st generation immigrants), Income1 (no income), Culture1 (cultural capital_lowest quantile), ParEd1 (neither parent has attained upper secondary), Status3 (not working and looking for work). + p < 0.10, * p < 0.05, ** p < 0.01, *** p < 0.001.
Table 4.
Two-level hierarchical linear modeling (HLM) result of postsecondary educational attainment predicting CSE (n = 64,910 at Level 1; n = 18 at Level 2).
Table 4.
Two-level hierarchical linear modeling (HLM) result of postsecondary educational attainment predicting CSE (n = 64,910 at Level 1; n = 18 at Level 2).
| Fixed Effects | Basic Model Coef. (s.e.) | Model 1 Coef. (s.e.) | Model 2 Coef. (s.e.) |
|---|---|---|---|
| Constant | 1.619 ** | 1.258 *** | 0.969 ** |
| (0.055) | (0.069) | (0.257) | |
| Level-1 Variables | |||
| Female | −0.066 *** | −0.066 *** | |
| (0.008) | (0.008) | ||
| Age2 | −0.016 | −0.016 | |
| (0.015) | (0.015) | ||
| Age3 | 0.149 *** | 0.149 *** | |
| (0.015) | (0.015) | ||
| Age4 | 0.211 *** | 0.211 *** | |
| (0.015) | (0.015) | ||
| Age5 | 0.182 *** | 0.181 *** | |
| (0.016) | (0.016) | ||
| Ed1 | −0.130 *** | −0.130 *** | |
| (0.012) | (0.012) | ||
| Ed3 | 0.117 *** | 0.118 *** | |
| (0.009) | (0.009) | ||
| Income2 | −0.122 *** | −0.122 *** | |
| (0.014) | (0.014) | ||
| Income3 | −0.142 *** | −0.142 *** | |
| (0.013) | (0.013) | ||
| Income4 | −0.114 *** | −0.114 *** | |
| (0.014) | (0.014) | ||
| Income5 | −0.088 *** | −0.088 *** | |
| (0.016) | (0.016) | ||
| Income6 | −0.107 *** | −0.107 *** | |
| (0.017) | (0.017) | ||
| Imgrt2 | 0.150 *** | 0.149 *** | |
| (0.027) | (0.027) | ||
| Imgtr3 | 0.190 *** | 0.191 *** | |
| (0.014) | (0.014) | ||
| Culture2 | 0.056 *** | 0.056 *** | |
| (0.015) | (0.015) | ||
| Culture3 | 0.136 *** | 0.135 *** | |
| (0.014) | (0.014) | ||
| Culture4 | 0.195 *** | 0.194 *** | |
| (0.015) | (0.015) | ||
| Culture5 | 0.282 *** | 0.281 *** | |
| (0.016) | (0.016) | ||
| ParEd2 | 0.007 | 0.007 | |
| (0.010) | (0.010) | ||
| ParEd3 | 0.033 ** | 0.033 ** | |
| (0.012) | (0.012) | ||
| Status1 | 0.016 | 0.016 | |
| (0.038) | (0.038) | ||
| Status2 | 0.168 * | 0.168 * | |
| (0.067) | (0.067) | ||
| Status4 | 0.205 *** | 0.206 *** | |
| (0.043) | (0.043) | ||
| Status5 | 0.056 | 0.056 | |
| (0.052) | (0.052) | ||
| Status6 | 0.001 | 0.001 | |
| (0.050) | (0.050) | ||
| Level−2 Variables | |||
| C_GDP/capita (10k) | 0.780 *** | ||
| (0.185) | |||
| C_Internet | −7.612 ** | ||
| (0.281) | |||
| C_TertiarySpend | 0.164 ** | ||
| (0.063) | |||
| C_SepndingTertiaryPublic | −0.008 | ||
| (0.137) | |||
| C_TertiaryEnroll | 0.455 * | ||
| (0.209) | |||
| Random effects | |||
| Between countries (τ00) | 0.055 | 0.050 | 0.010 |
| (0.018) | (0.017) | (0.004) | |
| Within countries (σ2) | 0.952 | 0.921 | 0.922 |
| (0.005) | (0.005) | (0.005) | |
| Chi-square | 3388.92 *** | 2973.63 *** | 367.38 *** |
Reference group: Age1 (16–24), Ed2 (secondary education completion), Imgrt1 (1st generation immigrants), Income1 (no income), Culture1 (cultural capital_lowest quantile), ParEd1 (neither parent has attained upper secondary), Status3 (not working and looking for work. * p < 0.05, ** p < 0.01, *** p < 0.001
Publisher’s Note: MDPI stays neutral with regard to jurisdictional claims in published maps and institutional affiliations. |
© 2021 by the authors. Licensee MDPI, Basel, Switzerland. This article is an open access article distributed under the terms and conditions of the Creative Commons Attribution (CC BY) license (http://creativecommons.org/licenses/by/4.0/).
Share and Cite
MDPI and ACS Style
Gong, H.J.; Hong, J.E. Does Postsecondary Education Attainment Matter in Community Service Engagement? Evidence from Across 18 OECD Countries. Educ. Sci. 2021, 11, 96. https://0-doi-org.brum.beds.ac.uk/10.3390/educsci11030096
AMA Style
Gong HJ, Hong JE. Does Postsecondary Education Attainment Matter in Community Service Engagement? Evidence from Across 18 OECD Countries. Education Sciences. 2021; 11(3):96. https://0-doi-org.brum.beds.ac.uk/10.3390/educsci11030096
Chicago/Turabian StyleGong, Hee Jung, and Jung Eun Hong. 2021. "Does Postsecondary Education Attainment Matter in Community Service Engagement? Evidence from Across 18 OECD Countries" Education Sciences 11, no. 3: 96. https://0-doi-org.brum.beds.ac.uk/10.3390/educsci11030096
Note that from the first issue of 2016, this journal uses article numbers instead of page numbers. See further details here.