
The Comparison of Students’ Self-Assessment, Gender, and Programming-Oriented Spreadsheet Skills


Faculty of Informatics, University of Debrecen, 4028 Debrecen, Hungary
*
Author to whom correspondence should be addressed.
Educ. Sci. 2021, 11(10), 590; https://0-doi-org.brum.beds.ac.uk/10.3390/educsci11100590
Submission received: 8 August 2021
/
Revised: 12 September 2021
/
Accepted: 20 September 2021
/
Published: 28 September 2021
(This article belongs to the Special Issue New Online Technical Applications for Non-Face-to-Face Learning)
Abstract
:Previous research proved that teaching spreadsheeting from a programming perspective is much more effective than the widely accepted tool-centered surface approach methods. Spreadsheeting as an introductory programming approach allows students to build up schemata leading to contextualized, concept-based problem-solving. Furthermore, it provides tools for real-world problem-solving in other disciplines, and supports knowledge-transfer to database management and “serious” programming. The present study provides the details of a nationwide testing of Grades 7–10 students on how they evaluate their spreadsheet knowledge, which classroom activities form their self-assessment values, and the results of three spreadsheet tasks evaluated by the SOLO categories of understanding. The comparison reveals that most students’ spreadsheet knowledge is pre-structural. On the other hand, they assess themselves much higher, which is primarily based on the number of activities carried out in classes. Traces of conscious problem-solving and knowledge-transfer within the scope of spreadsheeting are hardly detectable, while knowledge brought from mathematics is recognizable. In general, we found proof that the pieces of knowledge remain unconnected, not allowing students to reach the relational level of understanding and build up long-lasting knowledge.
1. Introduction
1.1. Should We Teach Students to Program?
Hungary is one of the countries in the world where informatics as a school subject was introduced as early as the mid-‘90s [1,2,3] in the first National Base Curriculum [4]. Various names and numbers of classes (from 2009) have been assigned to the subject in the meantime (Table 1) [4,5,6,7], with only minor changes in the content, detailed in the frame curricula. A thorough analysis of the 2013 issues [8,9] revealed, on the one hand, that the same material should be taught regardless of the name of the school subject, while on the other hand, that the same amount of material should be taught regardless of the number of classes [10,11,12,13,14] assigned to the subject. The research also revealed that the content of the frame curricula [8,9] is (1) oversized, even in the case of the largest number of classes, (2) loaded with a high number of ambiguous terms, (3) tool-centered, and (4) strictly divided into distinct subthemes. Furthermore, the research found that problem-solving is restricted to programming.
One consequence of the low number of lessons along with the overestimated, overplanned content is that informatics education has become a rather tool-oriented, boring, good-for-nothing subject which [15,16,17,18] does not support the development of computational thinking as a fundamental skill [19]. The widely accepted and popular low mathability [20,21] teaching approaches commit all of the errors which were outlined as early as 1993 in Soloway’s paper [22]. The author and his fellow researchers claimed that schools are inefficient in terms of teaching programming and developing students’ algorithmic skills, which is one of the ultimate goals of teaching informatics. As a result of this, they determined that:
- Schools have made programming isolated and disconnected.
- Schools should adopt a “whole programming” approach.
Furthermore, they presented their ideas on how programming can be integrated into education. It was stated that programming is ubiquitous, and thus should be:
- expanded to end-user computing;
- socially sanctioned for intellectual advances for everyone; and
- embedded in a rich cognitive context.
They went further by claiming that creating a computational medium requires:
- making programming easier to learn and do; and
- expressiveness and usefulness.
Back then, in 1993, these statements were based on the researchers’ experiment; however, these findings have been proven multiple times since then [23,24,25,26,27,28,29,30]. The focus should be on the development of computational thinking [19,31,32,33,34,35,36,37], including the development of algorithmic and computational problem-solving skills [38,39,40,41,42], extended to end-user computing. Teaching and testing spreadsheeting from a programming point of view is in complete accordance with Soloway’s ideas.
Furthermore, the vision of teaching programming—nonetheless informatics—to everyone, and giving meaning to this subject is in complete accordance with the concept of Technological Pedagogical Content Knowledge (TPCK) [43,44], and also with the Meaning System Model (MSM) [26], which have been proven to be effective over time. The TPCK claims that all three aspects of the model should be present in the teaching-learning process, regardless of the subject. The MSM goes one step further and declares that beyond the built-up knowledge pieces, the belief in the incremental nature of sciences (e.g., dynamic contextual knowledge) also plays a crucial role in the process. These findings are in complete accordance with the research results of Hattie [40,45], who makes a distinction between experienced and expert teachers. The experts of Hattie are teachers with high teaching self-efficacy and a strong belief in the incremental nature of sciences. Being aware of the recently published results, to carry out the vision of Soloway, teaching approaches must be revolutionized.
1.2. Problems We Are Faced with
In spite of the relatively early introduction of the school subject, Hungary is faced with the low efficiency of teaching-learning informatics. The country—both in education policy and in teachers of informatics—does not realize that teaching informatics is a lot more than using digital tools meaninglessly. The first warning came in 2009 in the form of the PISA 2009: Students On Line (Figure 1) [46]. The competence test revealed that in Hungary, there is an extremely negative correlations between the use of computers in school and computer problem-solving achievements.
Another warning sign is the trend observable in the number of participating schools and students in the Nemes Tihamér programming [47] and application [48] contests [1]. This programming contest started as early as 1985, and the numbers of schools and students participating in 2018 were about the same as in 1990. In the application contest, which started in 2004, apart from the first two years, the lowest number of schools and students participated in 2018. In a similar way, low-level academic knowledge was found by testing first-year students of informatics at starting their tertiary studies [40,49].
These independent measurements of students’ academic abilities reveal that the solution does not lie exclusively on the introduction and the development of tools, including both hardware and software, but rather on the applied teaching approaches and methods [26,40,50,51]. This finding is in complete accordance with Soloway’s suggestion from 1993 [22]. It has also been proven that Prensky’s idea of the digital natives [52] is only a myth [53,54], and its fast wide-spreading results in more harm than good. We had also found proof that the intensive use of mobile devices has a rather negative effect on the development of students’ algorithmic skills [51].
One further reason for the low efficiency of teaching informatics in Hungary is the popularity of folk-pedagogy [50]. In the mid-1980s, universities—totally unprepared, especially in terms of didactics—started a teacher of informatics education program. In these circumstances, low effective teaching methods were presented, practiced, and stated as examples—whether consciously or not. Preservice and post-graduate teachers left universities with a diploma and with the burden of being taught how to behave and act like a folk-teacher. Furthermore, after leaving the shelter of their universities, these teachers were left alone. The most ambitious of them started developing their own approaches and methods, while the others were satisfied with not knowing and not wanting to know that students do nothing but play during classes [55].
The comparison of folk-medicine and folk-pedagogy in the influential paper of Lister reveals the negative and questionable effects of this approach [50], which include that folk-pedagogy:
- is a category of informal knowledge distinct from “scientific medicine [pedagogy]”;
- is usually unwritten and transmitted orally;
- is not necessarily integrated into a coherent system, and may be contradictory;
- is sometimes associated with quackery;
- [but]… it may also preserve important knowledge and cultural tradition from the past.
The most distinguishing phrases of folk-teachers, according to Lister, are:
- “I’ve been teaching for N years, and…”
- “When I was a student…”
In general, teachers apply methods that they find satisfying for all of the participants of the teaching-learning process—students, teachers, schools, parents, education policy, ECDL, etc.—without relying on any proof of effectiveness of these methods.
2. Mini Competence Tests
Being aware of the problems of informatics education in Hungary and the test results of first-year students of informatics [42,56,57,58,59], mini competence tests were designed to measure primary and high school students’ academic abilities in informatics. The specialty of our mini competence tests is that they present tasks and questions with short descriptions accompanied with figures. The idea behind these short and visualized tasks is to lessen the cognitive load of reading, because high-demanding texts would distort the outcome of the tests. The latest PISA tests (2015, 2018) [60,61] reveal that in all three subjects—reading, mathematics, and sciences—the results of Hungarian students are below the OECD average, and the share of low achievers in all three subjects are significantly higher than the average. Furthermore, the PISA 2009: Students On Line assessment presents similar results, with an additional negative correlation between the results and the use of a computer in school. Considering these published results, we wanted to lessen (1) the cognitive load of reading, and (2) the negative effect of the tool-centered teaching approaches in the informatics subject [62]. To achieve our goals, the complexity of the tasks are cut back, the texts of the tasks are shortened—compared to the PISA tasks—and all of the tasks are supported with informative pictures.
The purpose of the test is to investigate the effectiveness of informatics education, to identify the specific pieces of knowledge, and to measure the activation of knowledge transfer elements.
In general, our mini competence tests [12] are usually divided into three main parts:
- general questions;
- spreadsheet functions; and
- mini problems to solve.
2.1. General Section
The first section of the competence test poses questions on general information, including questions on how students evaluate their knowledge in the following topics:
- file management;
- text management;
- spreadsheet management;
- database management;
- algorithms and programming; and
- resource (citation) management.
To fill in the form, a 0–5 Likert scale is offered. In connection with their self-assessment, students are also asked whether they study/studied these subjects in school or not. In the present paper, the focus is on the students’ spreadsheet knowledge. Consequently, their spreadsheet self-assessment values will be taken into consideration.
Self-assessment and achievement in the tasks can be significantly influenced by the activities carried out in an informatics class. Consequently, the students are asked to select items from a predefined list of activities that characterize their informatics lessons. The following list presents those activities, which have a direct connection to teaching-learning spreadsheeting:
- solving ECDL tests (ECDL);
- solving maturation exam tests (maturation);
- formulating algorithms (algorithm1);
- writing and drawing algorithms (algorithm2);
- creating multilevel functions (multilevel functions);
- working alone, based on a list of tasks (alone);
- programming;
- typing spreadsheet tables (typing);
- checking the correctness of outputs (output); and
- playing.
The general section also poses questions on the students’ computer and mobile phone use, both in schools and in general. The time spent on using these devices were asked by selecting from a list with seven options. Four questions were set up considering the time spent on computers (desktop computer and laptop) and mobile devices (tablet, phone, and e-book reader) in classes other than informatics during a week (<1, 1, 2, 3, 4, 5, >5 h) and for daily personal use (<2, 2, 4, 6, 8, 10, >10 h).
Furthermore, questions were presented regarding the number of informatics lessons per week in Grades 1–12, the programming language(s) learned in school, the course and exercise books they use, and the frequency of using them.
2.2. Spreadsheet Functions
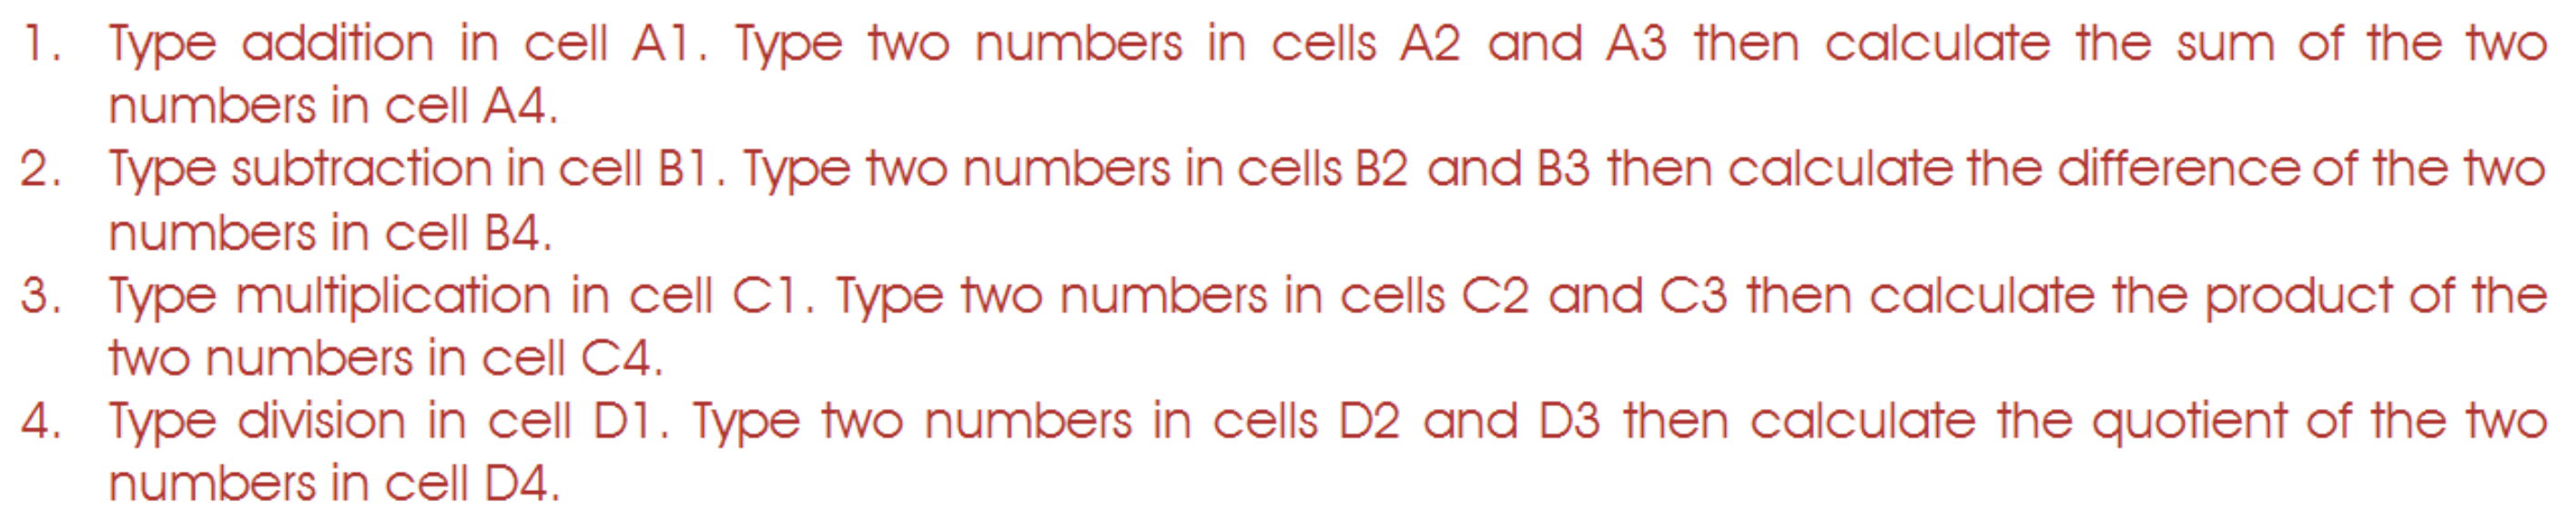
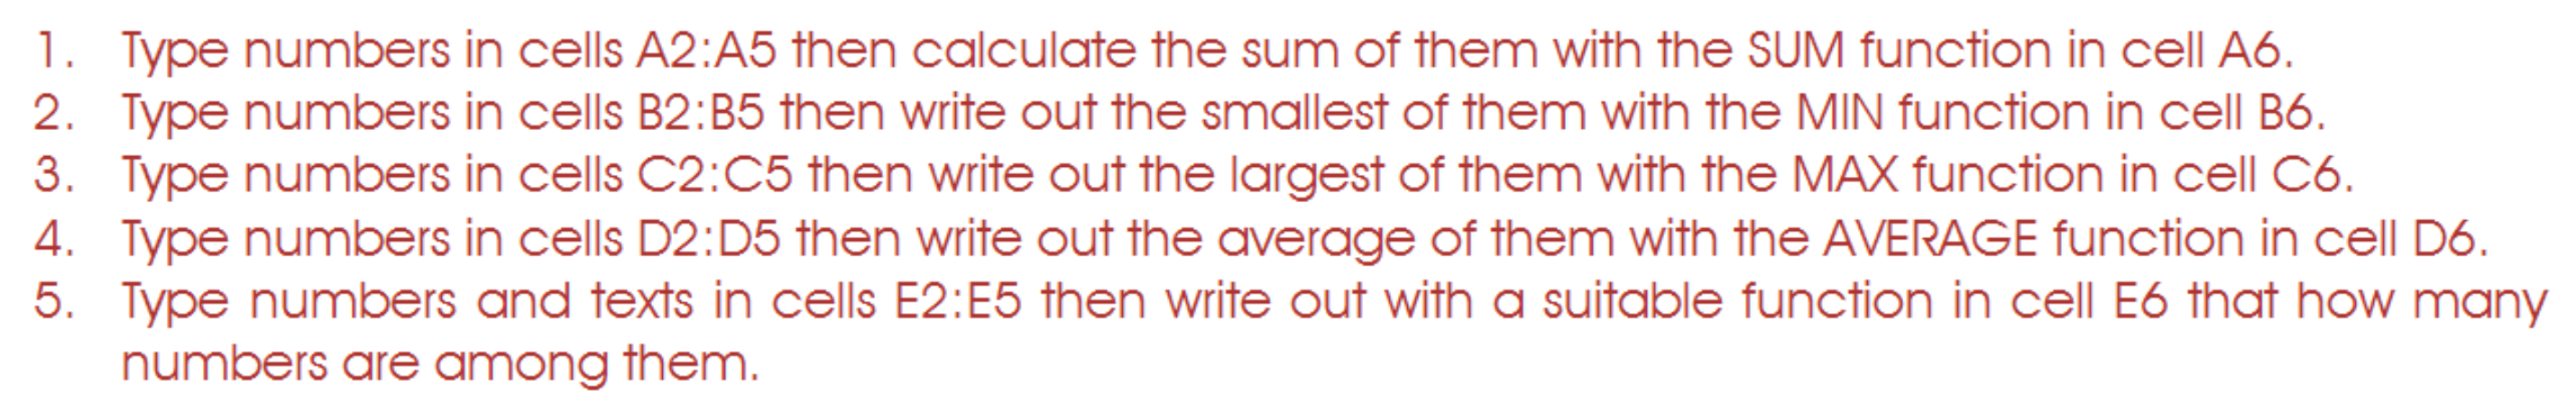
In the second part of the test, students were asked to list fifteen spreadsheet functions which they consider to be the most important ones. The names of functions must be provided without ranking them. One aim of this task is to see whether students can remember all of the functions presented in class, in course and exercise books, and/or in spreadsheet applications [62]. In the official coursebook of the time of the test [63], there are 41 spreadsheet functions listed, with hardly any problems to solve with them (Figure 2 and Figure 3). Primarily, similar to these examples, decontextualized, meaningless tasks are presented in the coursebook [63], leaving the principles of TPCK [43,44] completely unattended. Furthermore, one must call attention to the fact that students should be familiar with these operators and functions from their previous spreadsheet studies in primary school [8,9,62].
The other aims of the task listing the fifteen most important functions are to see whether schools:
- make students learn functions; and
- teach these functions at all or just let students navigate on the user interface.
From the results of this task, we can conclude how conscious the tested students are, and how fast thinking [64] can be applied in routine problem-solving activities.
2.3. Spreadsheet Problems and Their SOLO Categories
In part three, students solved real spreadsheet problems on paper without using a computer. Each section of the test contained multiple-choice and/or short-answer tasks. Most of these tasks could be completed by either activating knowledge transfer elements from other sciences, or basic knowledge in spreadsheeting. As it is mentioned above, according to the principles of the mini competence test, the instructions were short, accompanied with figures to make them concise and easy to understand.
The items of the problems were calculated recognizable pieces of the answers, which are detailed in the Chapters “Spreadsheet problems and their SOLO categories” and “Spreadsheet problems presented in the test”. Furthermore, the items were converted into the SOLO (Structure of the Observed Learning Outcome) categories of understanding, which are widely accepted in teaching programming [49,50,65,66]. The usability of the SOLO categories on functional programming language problems has already been proven in previous studies [49,56,57,58,59]. Consequently, it was reasonable to apply the same method in these tasks. The modified SOLO categories of understanding have the following four levels [42], where the highest SOLO category—extended abstract—is not considered, due to the structure of the presented tasks.
- The task is ignored or the answer has no relation either to the task or the correct answer (pre-structural, P).
- One of the items is recognizable (uni-structural, U).
- Several items are correct, but the connection(s) between these items are not formulated (multi-structural, M).
- Both the items and the connection between them are clearly formulated (relational, R).
3. Spreadsheet Problems Presented in the Test
3.1. Formula Completion
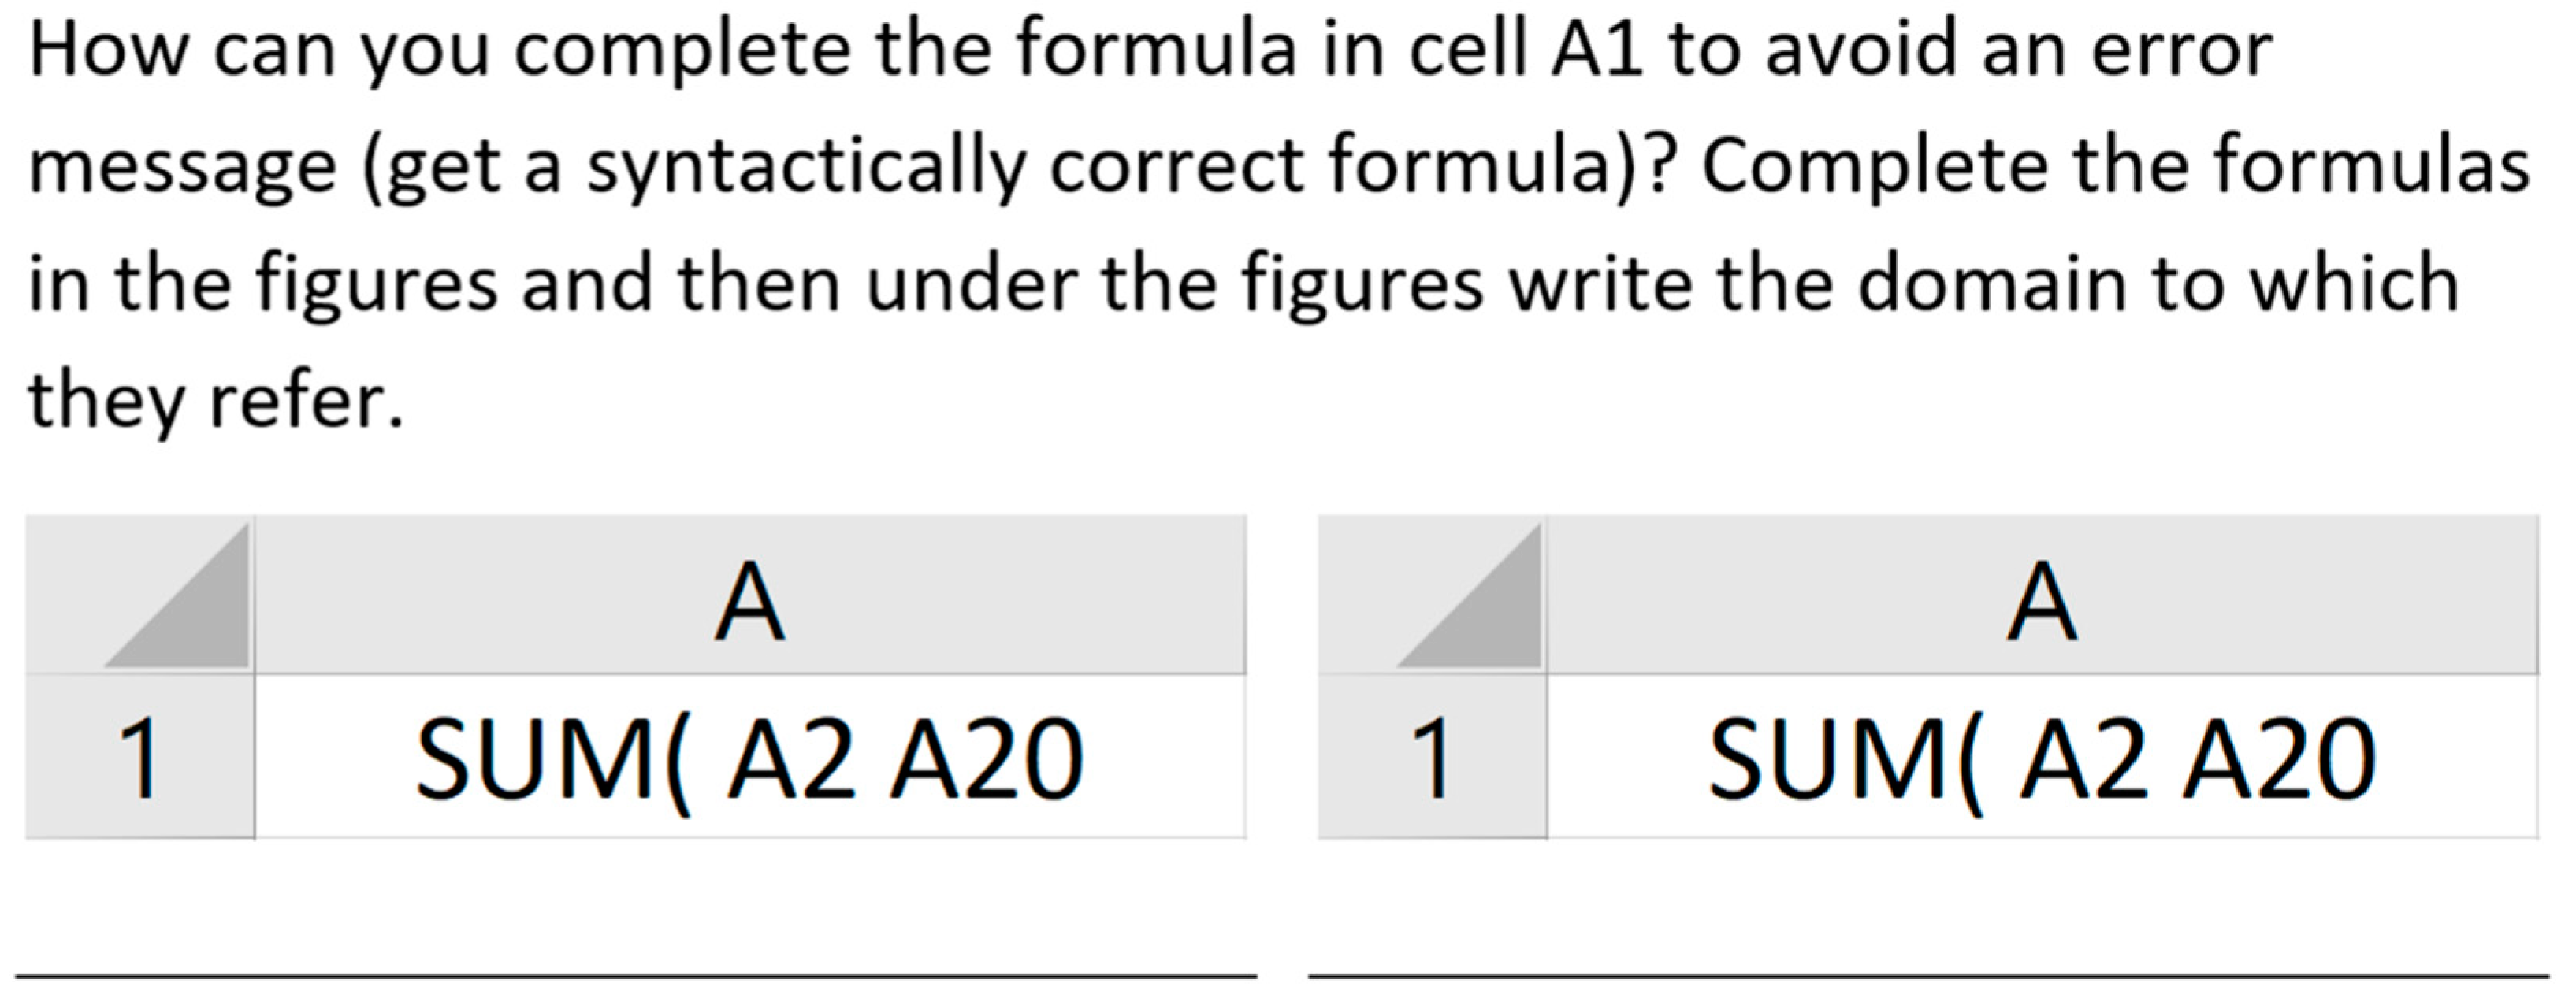
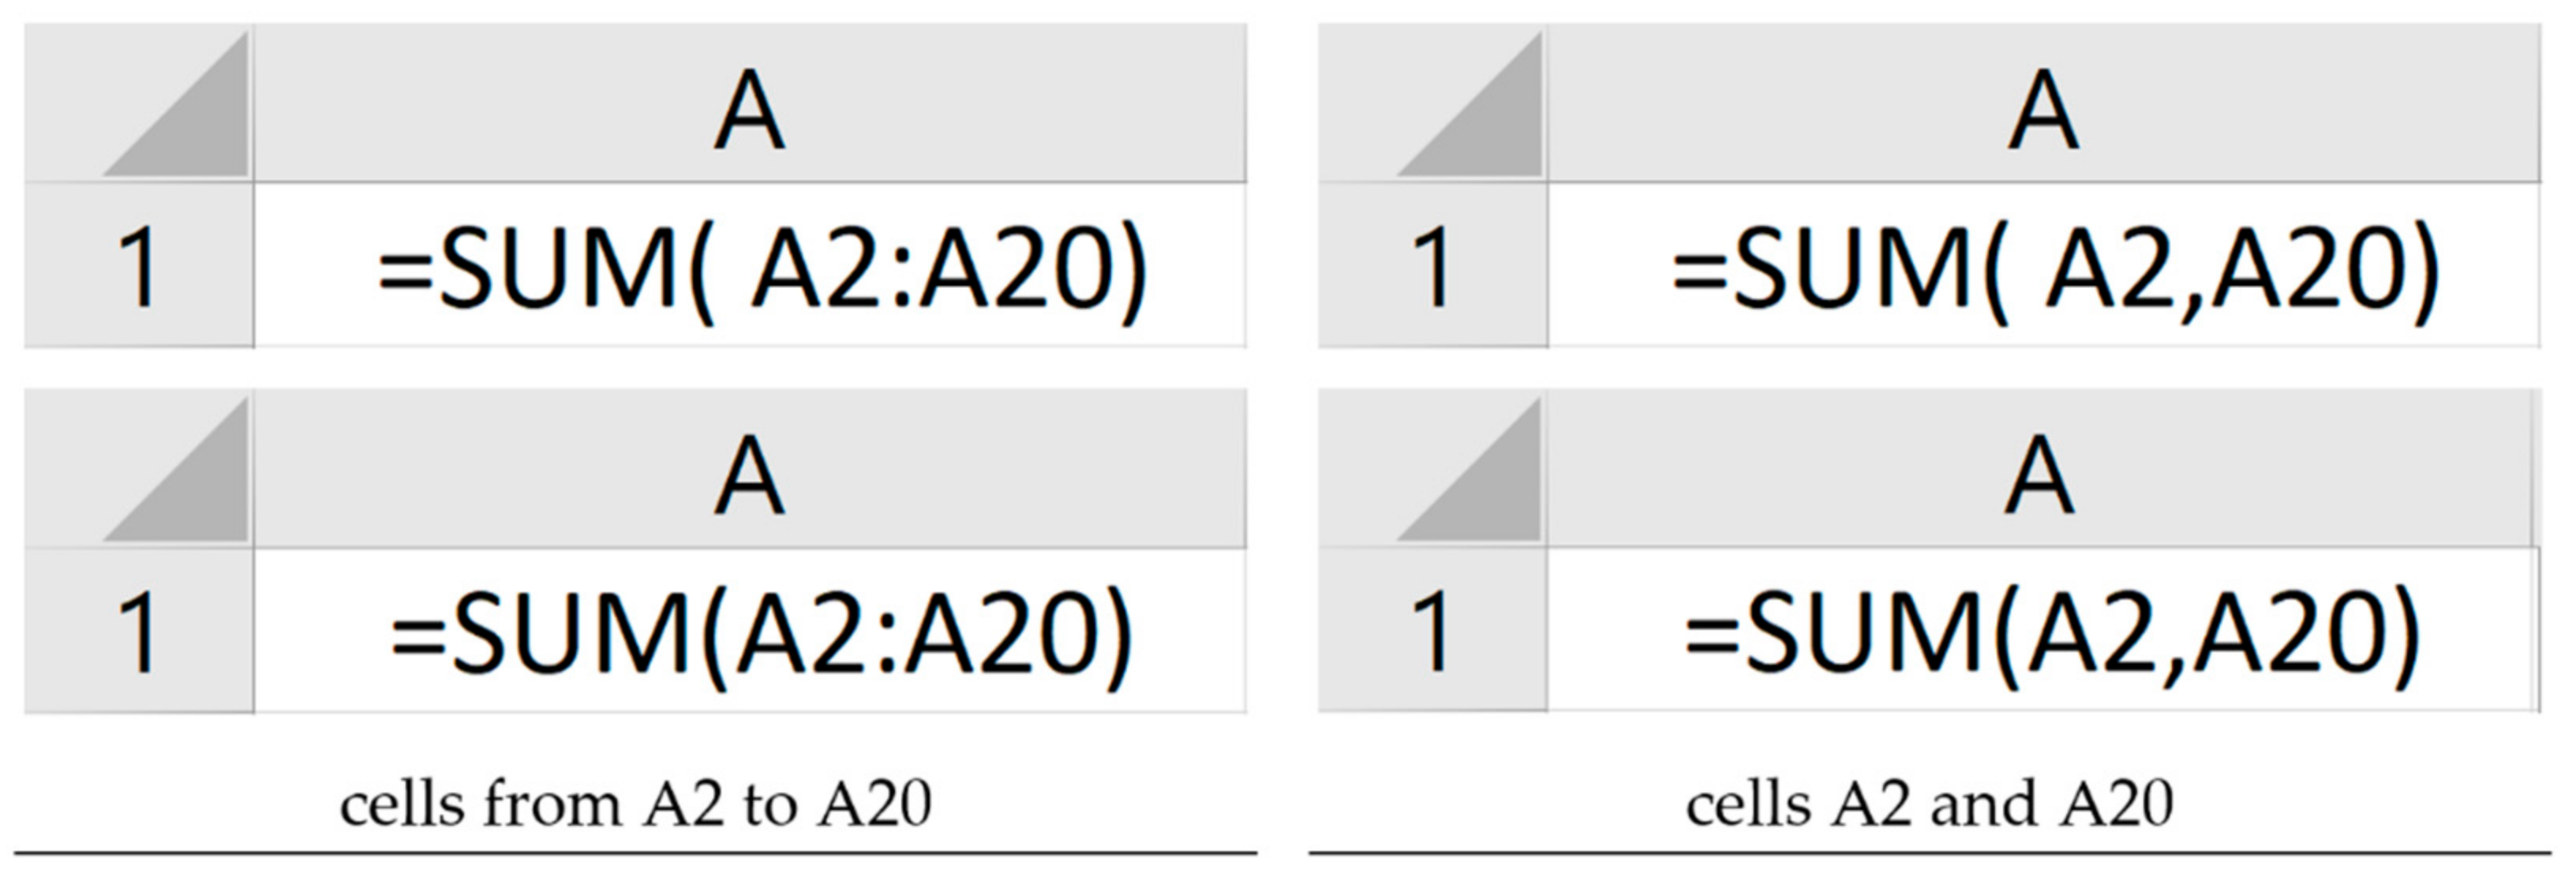
In this task, students were asked to complete a given string into two syntactically correct spreadsheet formulae (Figure 4). Two samples were presented to provide places for two solutions—providing the range, i.e., A2:A20 (from A2 to A20) or two separate arguments, i.e., A2, A20 (A2 and A20). Furthermore, the last part of the task was to explain (name), via natural language, the domain to which the completed formulae refer. The English version of the task is shown in Figure 4, and the solutions are shown in Figure 5. In both solutions, the opening equal sign, the closing parenthesis, the reference operator, and the explanation of the domain are considered as separate items, adding up to a total of eight items.
Table 2 presents the SOLO categories of understanding assigned to the items of the formula completion task.
3.2. Order of Execution
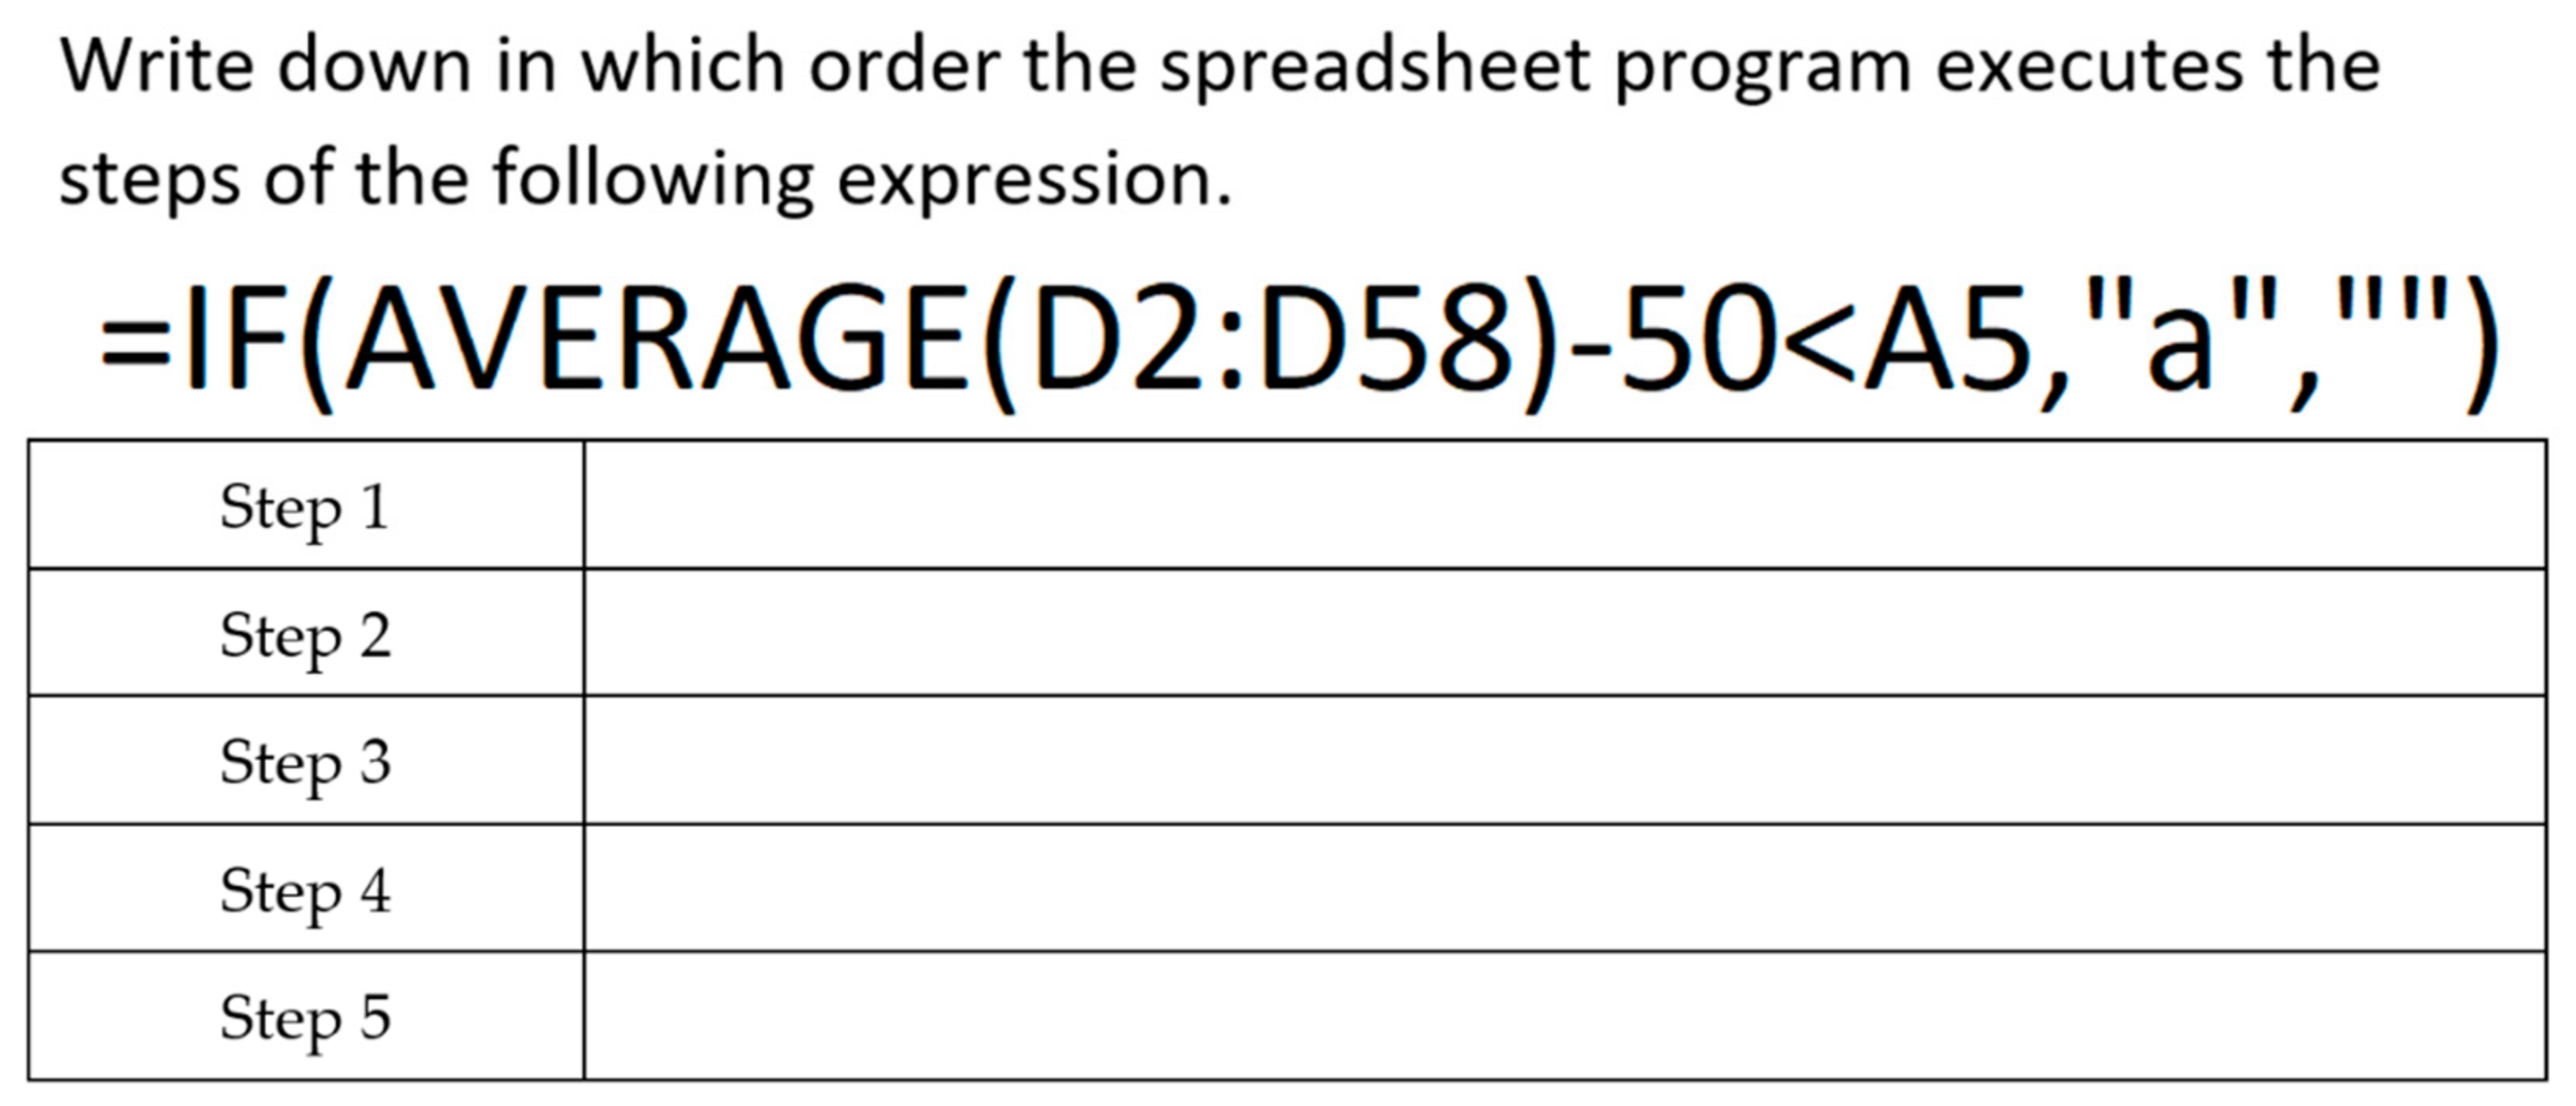
To test how knowledge transfer elements brought from mathematics can be activated in informatics, students were asked to provide the order of the execution of the given formula. In addition to the formula, a table of five rows was added, which the students had to fill in with the steps (Figure 6). The purpose of the extra row was to see whether students recognize that there are only four steps, or if they feel obligated to fill in all of the rows.
The solution to the execution order problem (Figure 6) is shown in Table 3. Using the SOLO categories, the scores are distributed as follows:
- Calculating the average is the first step, one item.
- Calculating the average, one item.
- Calculating the average is followed by the subtraction, one item.
- The subtraction is followed by the yes/no question, one item.
- The question is followed by calling the IF() function, one item.
- Calling the IF() function is the last step, one item.
Thus, a total of six items were scored.
Table 4 presents the SOLO categories of understanding assigned to the items of the execution order task.
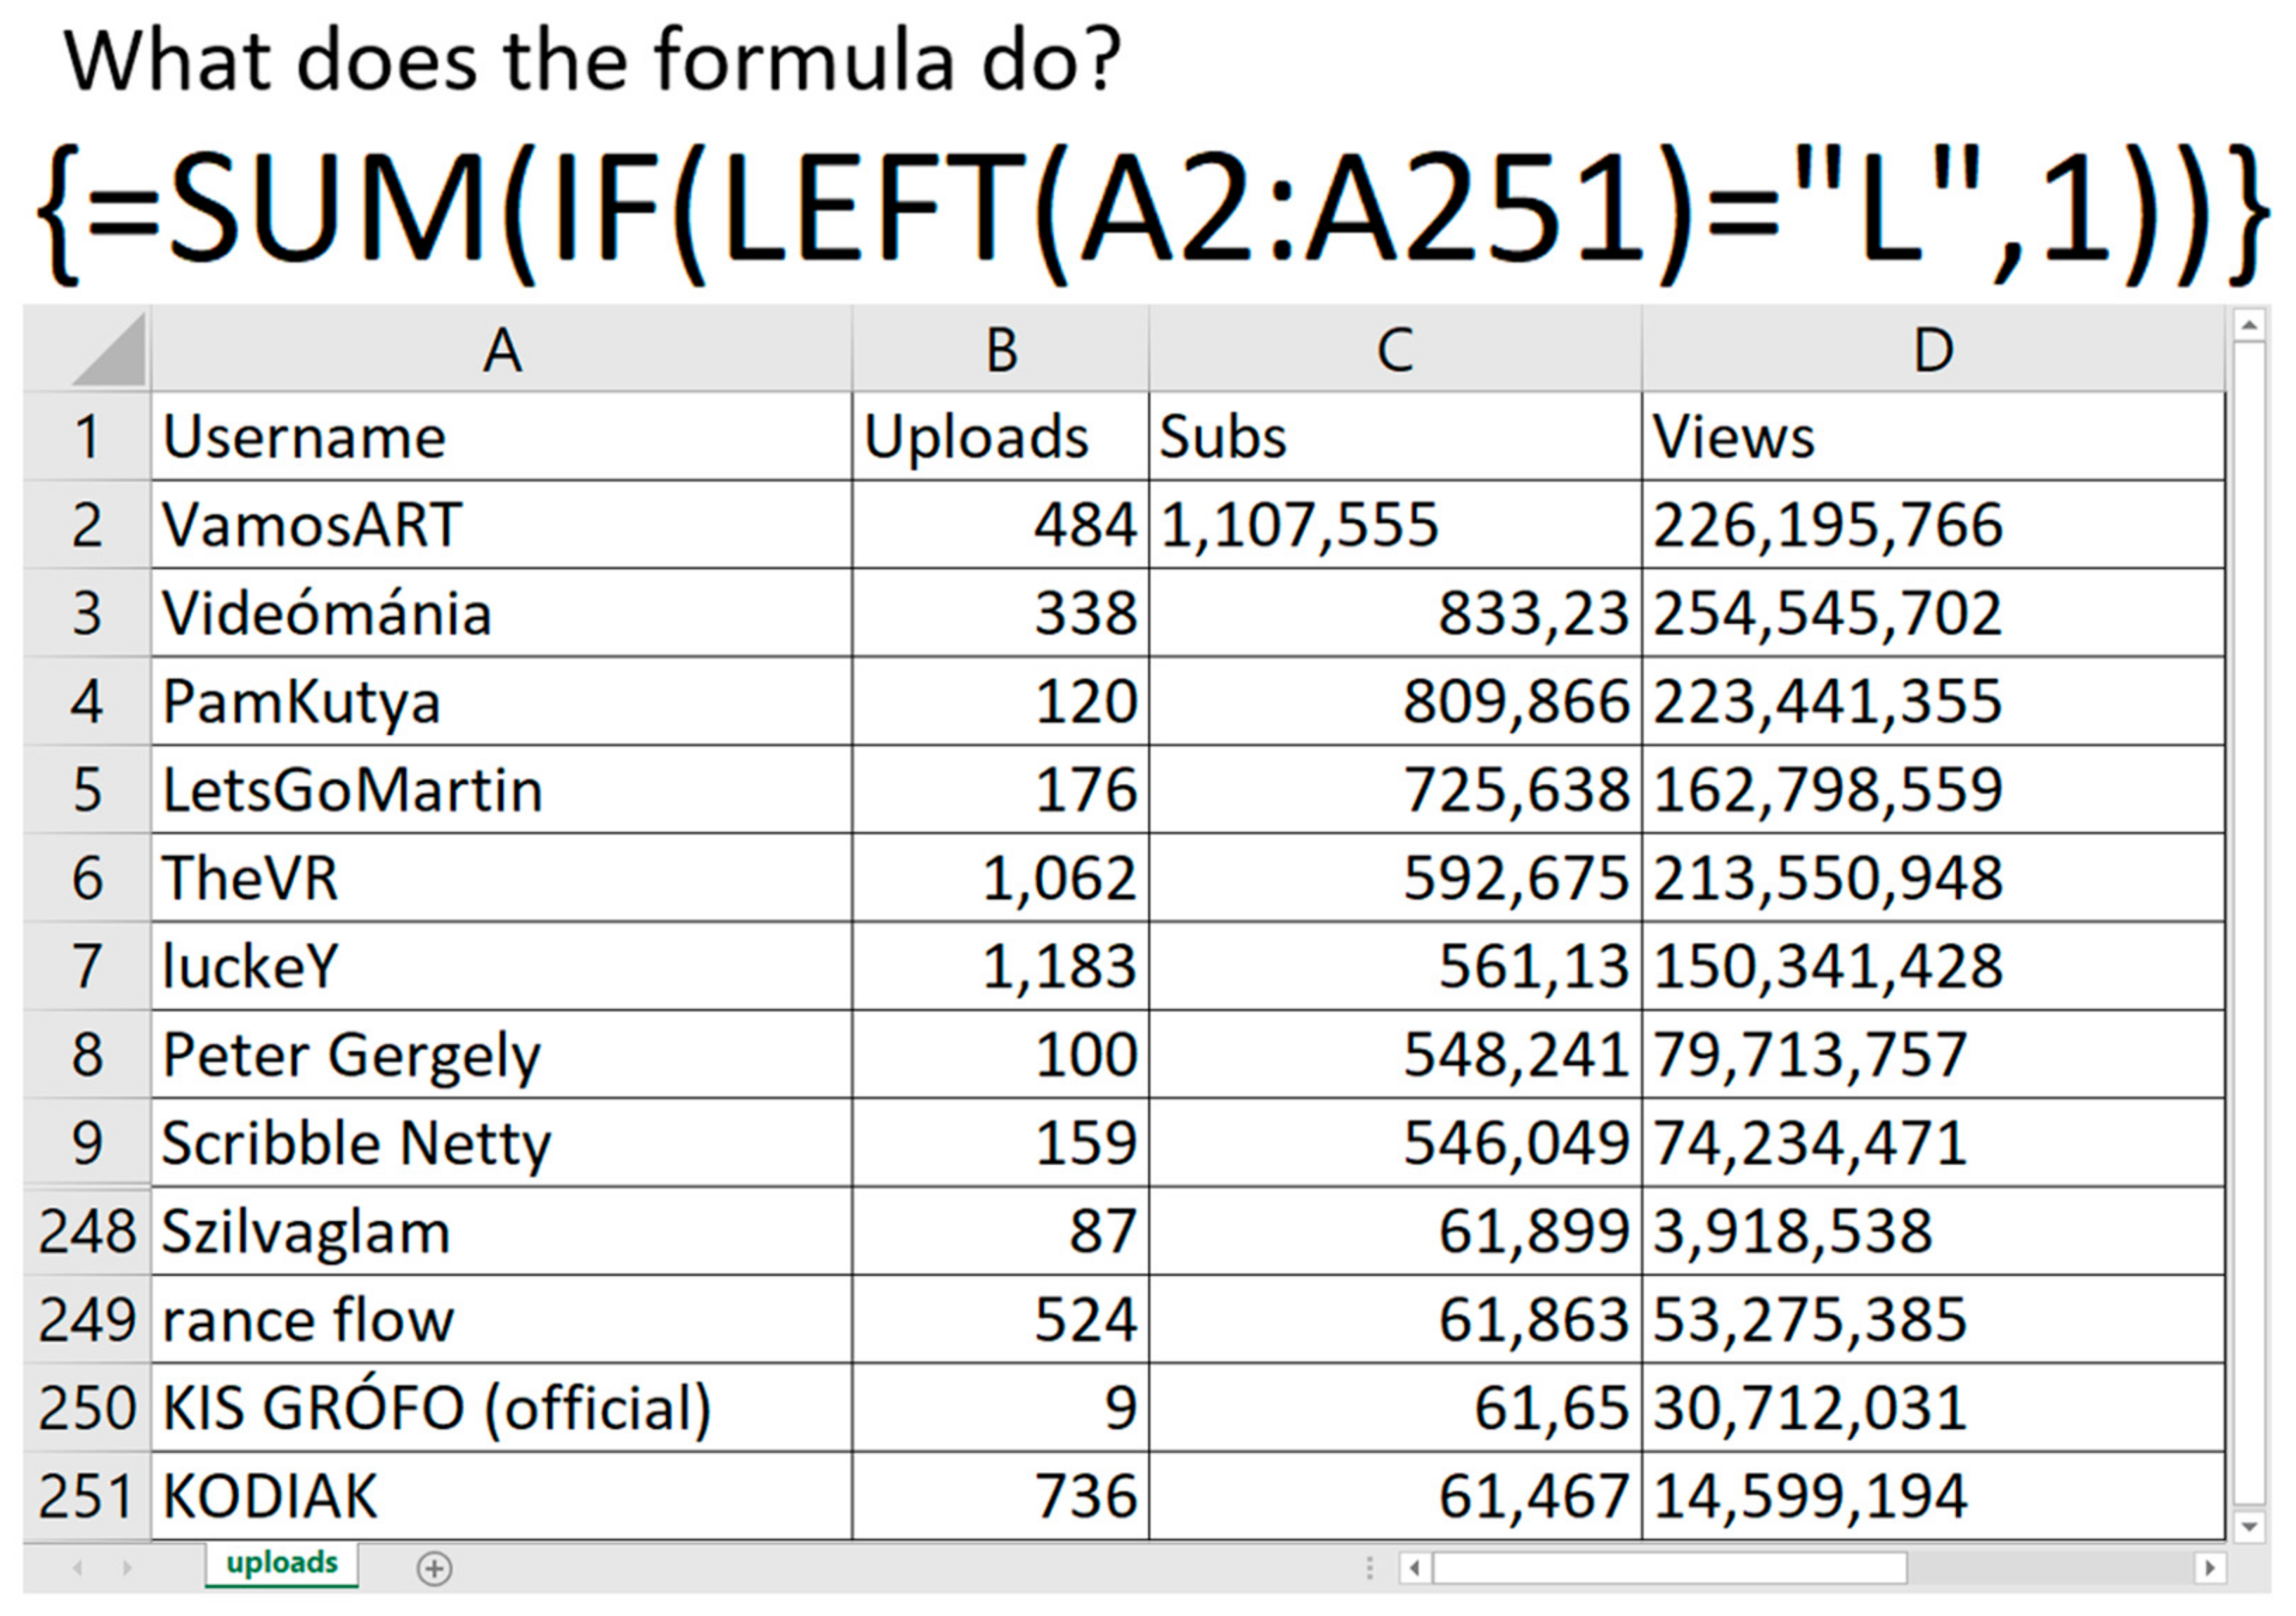
3.3. Array Formula Task
In the third task of the test, a sample table and a multi-level formula were presented (Figure 7). The table is created from the Social Blade webtable [67] with the WDC (webtable to datatable conversion) method [68,69]. The specialty of the table is that, despite the fact that the language of the webtable is set to Hungarian, based on the selected country, the separator characters are not changed according to the syntactical rules of the language. As a result, the English thousand separator characters are transformed into a decimal comma (cells B6, B7, C3:C9, C248:C251) or a comma character (cells C2, D2:D9, D248:D251), depending on the number of commas. The consequences of this data conversion are analyzed in the paper of Nagy [70].
The aim of this task is to see how students explain what the given formula does, or what output it produces. In this task, the students’ previous knowledge in mathematics (concept of functions), spreadsheeting (especially recognizing functions, their arguments, and their output), and the ability to connect this task to the previous ones are tested.
The solution to the problem is “The number of usernames starting with the character L.” natural language sentence, or any other expression with the same meaning. In the answer, both the lowercase and the capital letter L are accepted.
The spreadsheet SOLO categories were assigned to the task, similar to the previous tasks (Table 5).
4. The Sample
The test was carried out at the end of the pre-COVID academic year of 2017/2018, where the use of the digital tools was not affected by online teaching and testing. A total of 8880 pupils from 93 schools across Hungary participated in the measurement. Among them, 8517 are from Grades 7–10, forming the sample of this study. According to the self-assessment values, 6886 students claimed that they studied (Group Studied) spreadsheet management in school, 919 claimed that they did not (Group DidNotStudy), and 712 left the question unanswered (Group NoAnswer). Table 6 presents the number of students in Grades 7–10 participating in the test.
5. Hypotheses
The hypotheses of the present paper are set up according to the structure of the test, the current national base curriculum and frame curricula, and the coursebooks based on these official documents. The aims of our research are to reveal connections and/or missing links between the aims and the requirements of the official documents and the performance of students. Furthermore, previously published research results are taken into consideration, which shed light on the misconceptions and the negative effects of stereotypes considering teaching-learning informatics in general, especially in spreadsheeting.
Previously conducted research has proven that teaching spreadsheeting from a programming point of view and using functional languages as introductory programming languages is significantly more effective than either the interface-centered or the imperative or object-oriented “classical” methods [27,28,71,72,73,74,75,76,77]. Being aware of these results and that school grade levels are often not good indicators of where students are in their cognitive development, the students’ self-assessment values are compared to their results in the test.
Hypothesis 1 (H1).
There is no significant difference between the self-assessment values and the students’ results in the test.
Hypothesis 2 (H2).
There is a strong correlation between classroom activities and the students’ self-assessment.
Hypothesis 3 (H3).
There is a relationship between the learned functions, the students’ self-assessment values, and the results in the test.
Hypothesis 4 (H4).
Students can apply knowledge from mathematics in solving programming-oriented spreadsheet problems.
Hypothesis 5 (H5).
There is no difference between the boys’ and the girls’ self-assessment and results in the tasks.
6. Results
6.1. Students’ Results in the Spreadsheet Tasks
From Grades 7–10, 8517 students completed the test (Table 6). Table 7 presents the average results in the three spreadsheet tasks. The averages of the scores are 1.32 (17%), 0.86 (14%), and 0.18 (5%) in the formula completion, the execution order, and array formula tasks, respectively. The frequency of students who scored zero items is 5226 (61%), 6464 (76%), and 7918 (93%) in the three tasks. The frequency of students who scored the maximum items is 118 (1%), 629 (7%), and 118 (1%). Both the modus and the median are zero in all three tasks. According to the PISA evaluation system, 78% of students are able to perform tasks at Level 2, and 99.3% of students are able to perform tasks at Level 1b [61]. In the spreadsheet tasks of the test, the students’ performance is much lower, which is a shocking result and cannot be ignored. It is devastating that an extremely high percentage of students scored zero, even in the simplest task.
The mean ranks of the three tasks calculated by the Friedman Test are 2.02, 2.08, and 1.90 in the formula completion, execution order, and array formula tasks, respectively. Furthermore, it is found that there is a significant difference between the averages of the results of the three tasks (p < 0.001).
In the comparison of the three tasks (Spearman correlation), it is found that there is a strong correlation between the formula completion and the execution order tasks (R = 0.453). A weak correlation is found between the array formula and the other two tasks (R = 0.206 and R = 0.263 in the formula completion and execution order, respectively).
The Chi-square crosstables reveal the details of the correlations between the pairs of the tasks. If the students’ knowledge is pre-structural in the formula completion task, then there is a 91% probability that the execution order is also pre-structural. As the level of understanding increases in the formula completion task, the level of understanding is either pre-structural or relational in the execution order task. We can conclude, on the one hand, that syntactical awareness does not help the recognition of the execution order. On the other hand, better performance in the formula completion task allows knowledge-transfer activation, through which the execution order of expressions is deduced from mathematics. These mathematical knowledge pieces seem to be much more firmly solidified than the students’ spreadsheet knowledge.
The knowledge that parentheses always work in pairs—which also comes from mathematics—should be applied in the formula completion task. The comparison of the opening and closing parentheses in the two formulae reveals that there are 3106, 1985, and 1949 students who completed the first formula, the second formula, and both formulae with the closing parenthesis, respectively. A strong correlation can be found between closing parentheses in the first and the second formulas (R = 0.707). On the contrary, in the other pairs of the items—except for the first closing parenthesis and the first reference operator (R = 0.82)—medium or weak correlations are detectable (Table 8). One can conclude that the two strongest pieces of knowledge are transferred from a schema and mathematics. However, one must note here that the schema—SUM(A2:A21) or SUM(A2,A21)— is not accompanied with the semantics of the expressions (R = 0.323 or R = 0.324), and neither with the reference operator of the other solution (R = 0.462, not in the table).
In the comparison of the two tasks vs. the array formula task, it is found that the increase in the SOLO categories in the first two tasks—even reaching relational level—students only reach the multi-structural level in the array formula task. These results show that both the syntactical and the mathematical knowledge pieces remain unconnected, which leads to students not being able to cross the border of the multi-structural and the relational categories [78].
These findings partially prove Hypothesis H4. Knowledge-transfer activation from mathematics allows students to apply basic mathematical knowledge (parentheses), or to solve implicit math problems (execution order). However, when the mathematical background is only explicitly present, students are not able to apply it.
6.2. Gender Issue
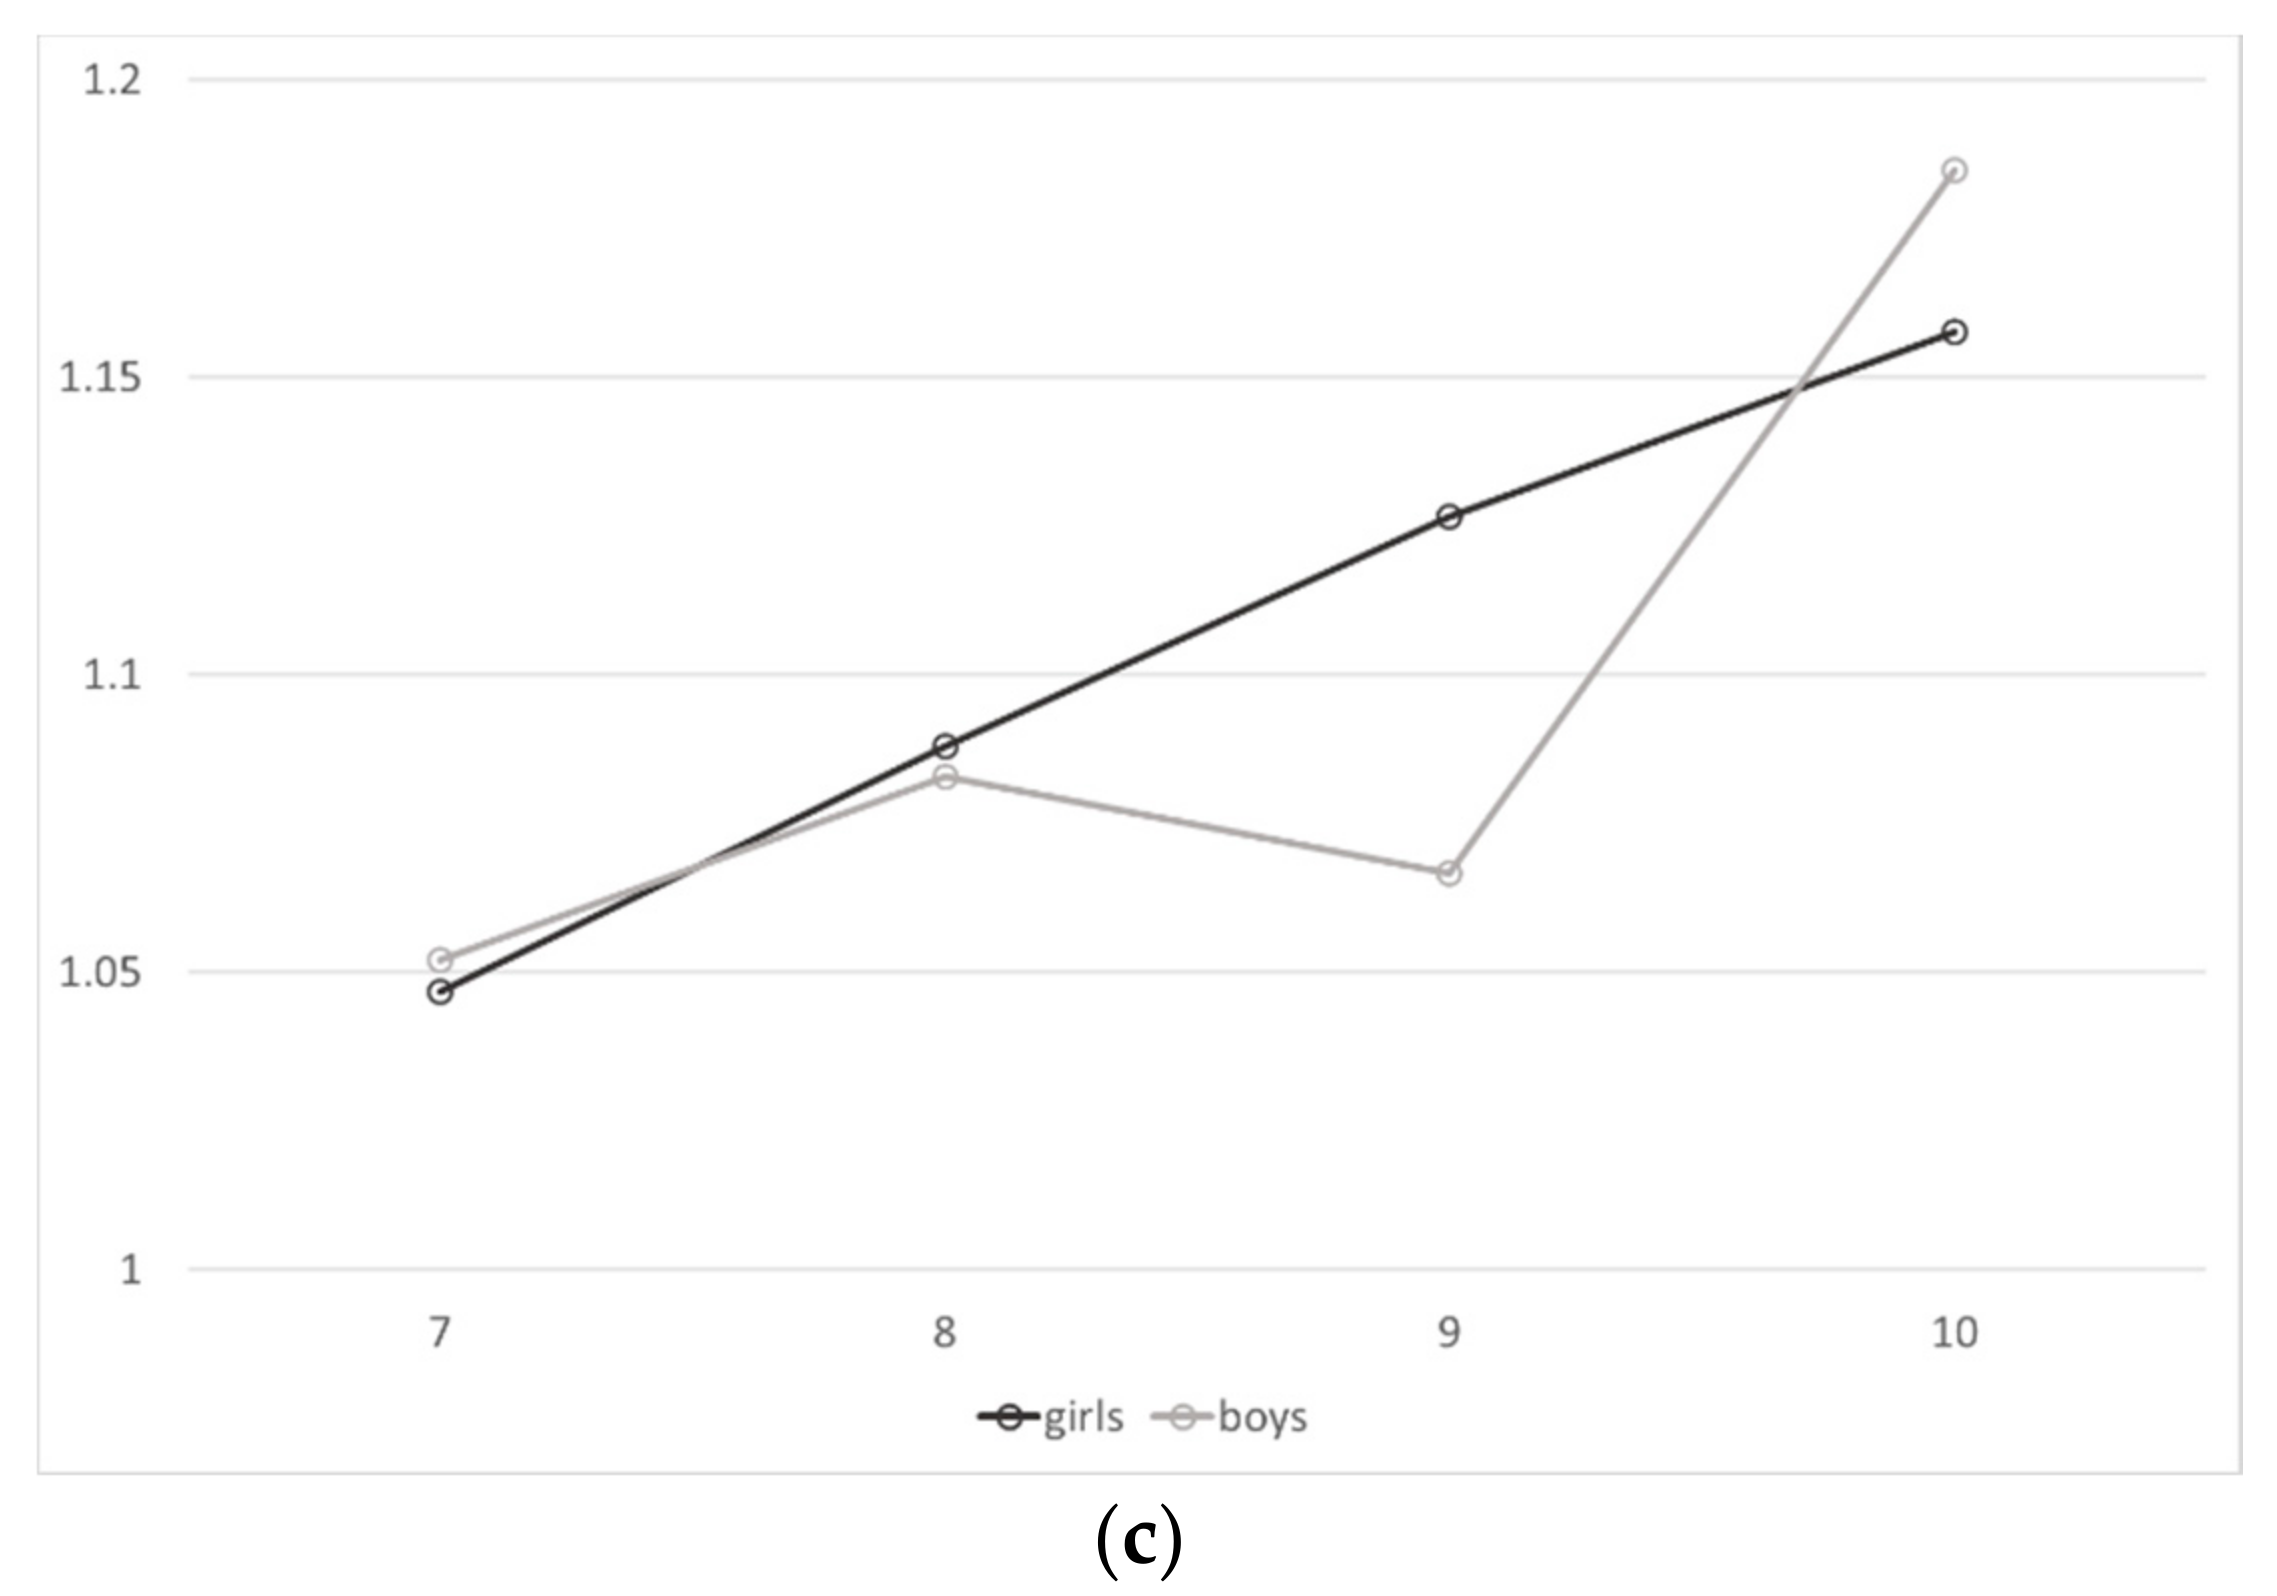
In the comparison of the gender of students, a significant difference is revealed between boys and girls in the formula completion and the execution order tasks (p < 0.001 and p = 0.006)—where girls’ results are higher—while there is no difference between the two groups in the array formula task (p = 0.655) (Figure 8). This result is in complete accordance with previously published papers considering boys’ and girls’ programming skills [79,80,81], where the “informatics and computer sciences fit boys better than girls” statement is proven to be a misconception.
The means of the SOLO values in Grades 7−10 are presented in Figure 8. The effect of the given grade is different in the three tasks. In the graphs, the lines for the girls and the boys are not parallel. The statistical analysis reveals the following differences between the genders (Table 9):
- In Grade Seven, there is no significant difference in any of the tasks (p = 0.632, p = 0.069, and p = 0.704, respectively).
- In Grade Eight, there is no difference in the formula completion and the array formula task (p = 0.948 and p = 0.355). However, in the execution order task, the difference is significant (p = 0.01).
- In Grade Nine, there is a significant difference in all three tasks (p < 0.001, p < 0,001, and p = 0.014, respectively).
- In Grade Ten, there is a significant difference in the formula completion task (p = 0.005), while there is no difference in the other two tasks (p = 0.406 and p = 0.224).
Beyond considering the differences between the results of boys and girls, we cannot leave unnoticed that there is significant difference between the self-assessment of the two gender groups (p = 0.022). Boys evaluated their knowledge higher than girls did, which is in complete accordance with previously published results [27,28,73].
Hypothesis H5 must be rejected, because we have found differences between the two gender groups in both the self-assessment and the results. Considering the self-assessment, boys rated their knowledge higher than girls, while on the contrary, the results of the girls are higher than the boys.
6.3. Studied vs. Results
In the next analysis, the results of Groups Studied, DidNotStudy, and NoAnswer are compared and analyzed. As mentioned in the Chapter “The Sample”, the groups are formed on the self-assessment section of the test. Even though the averages are extremely low (Table 9), the question was whether there is any difference between Groups Studied and DidNotStudy (Table 10 and Table 11). In the array formula task, the number of students whose results are greater than zero is so low that we could not separate them into two groups. Consequently, the task is left out from this analysis.
The analysis reveals that 43.9% vs. 10.2% (formula completion) and 27.6% vs. 5.2% (execution order) of the students in Group Studied and DidNotStudy scored at least one item, respectively. The averages of the students of the different groups are presented in Table 10 and Table 11.
In spite of the low averages, a significant difference is revealed between Groups Studied and DidNotStudy. Considering all of the different groups—Total (Grades 7–10 altogether), Grade Seven, Grade Eight, Grade Nine, and Grade Ten—the results of Group Studied are higher on both tasks than in DidNotStudy. Group NoAnswer scored between the two groups.
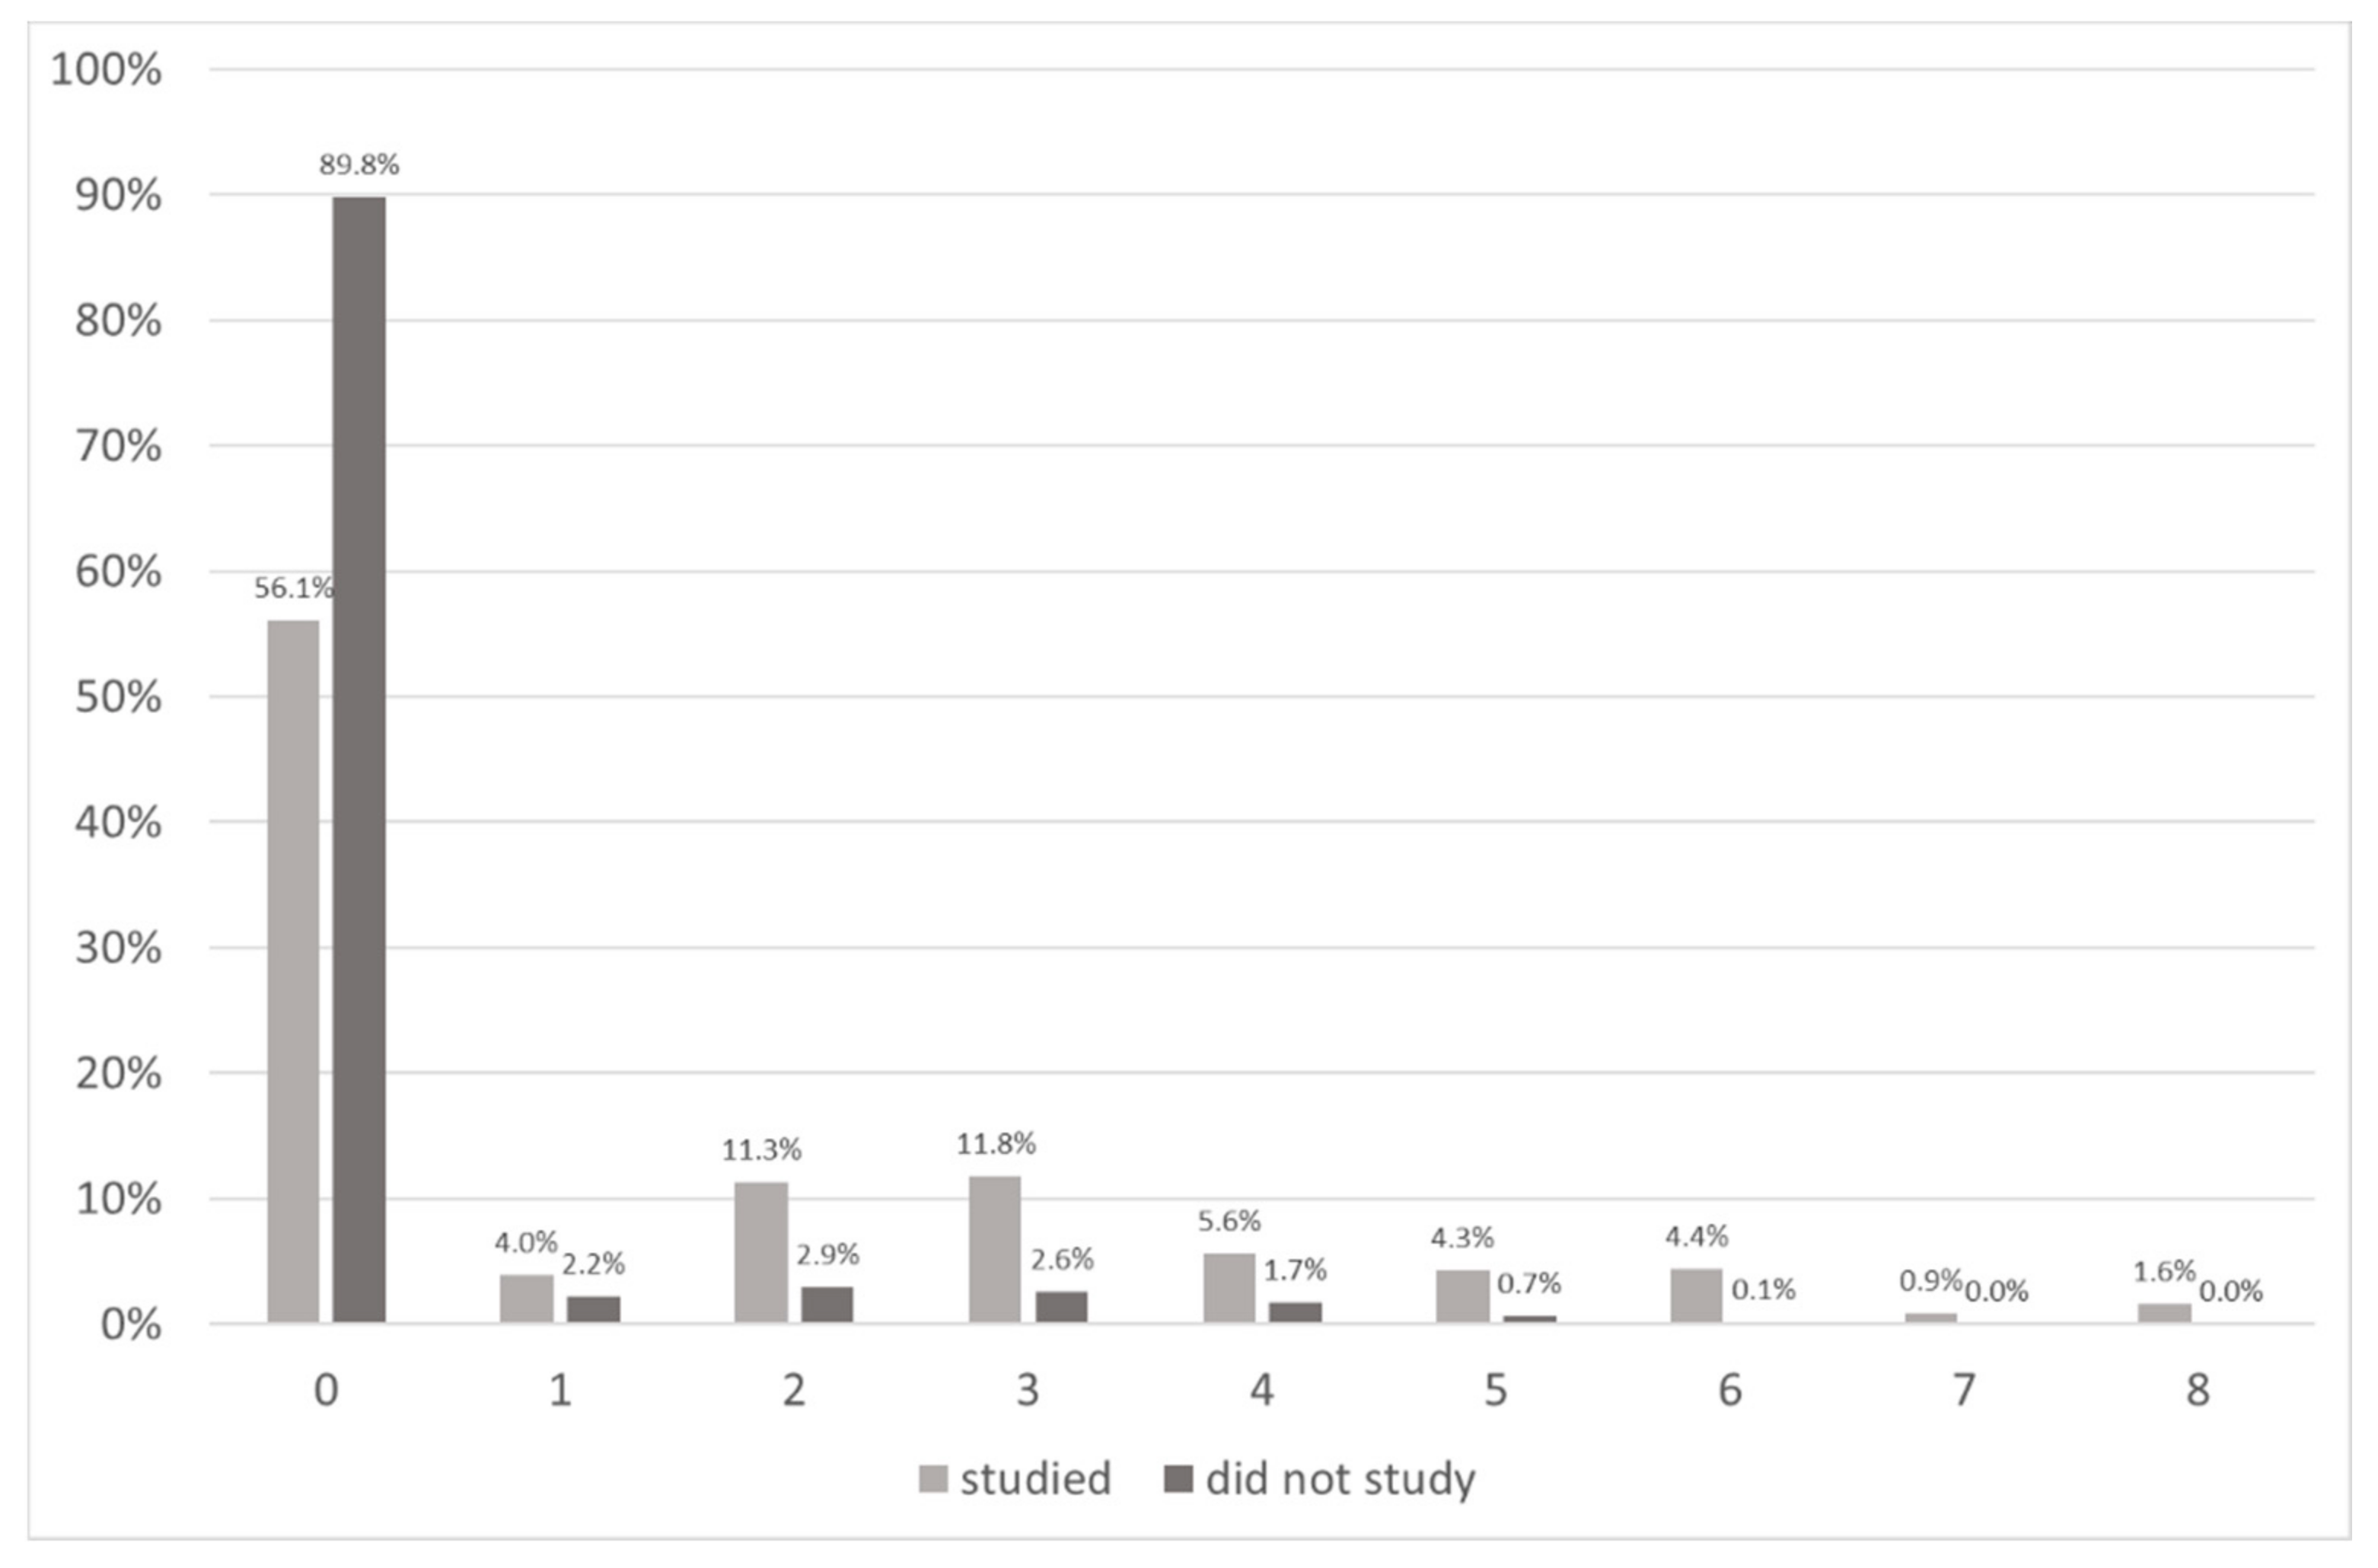
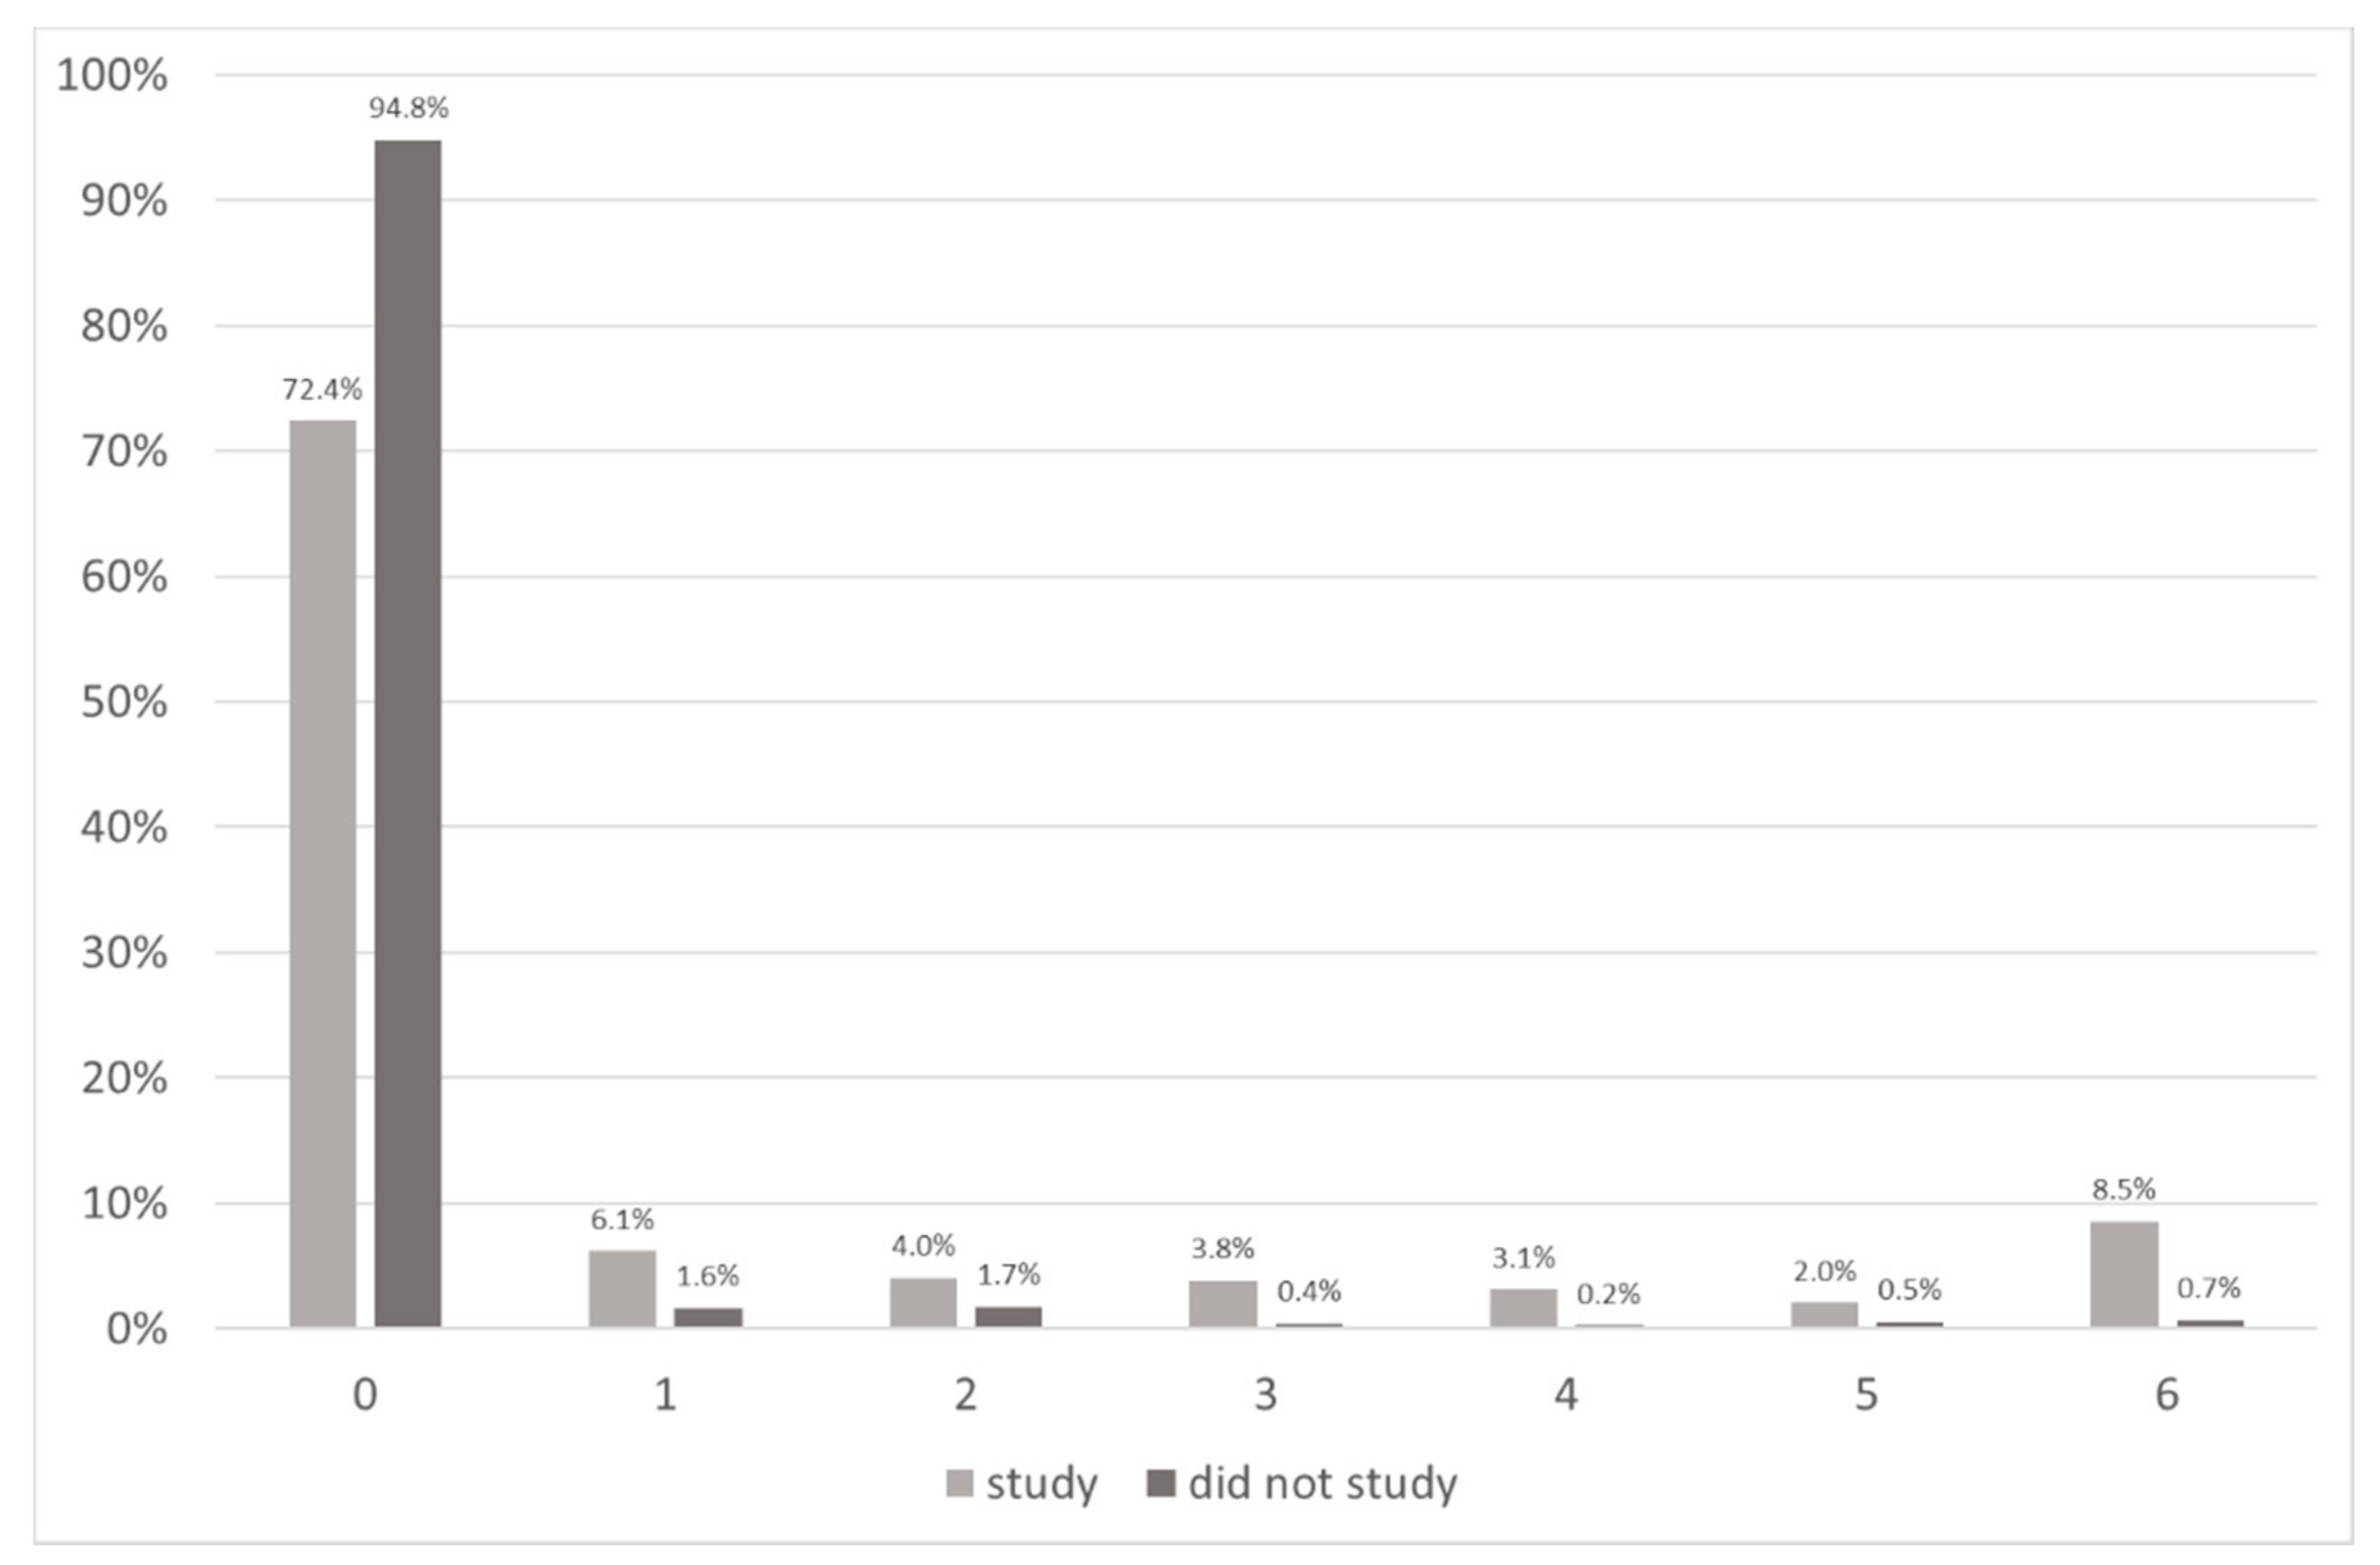
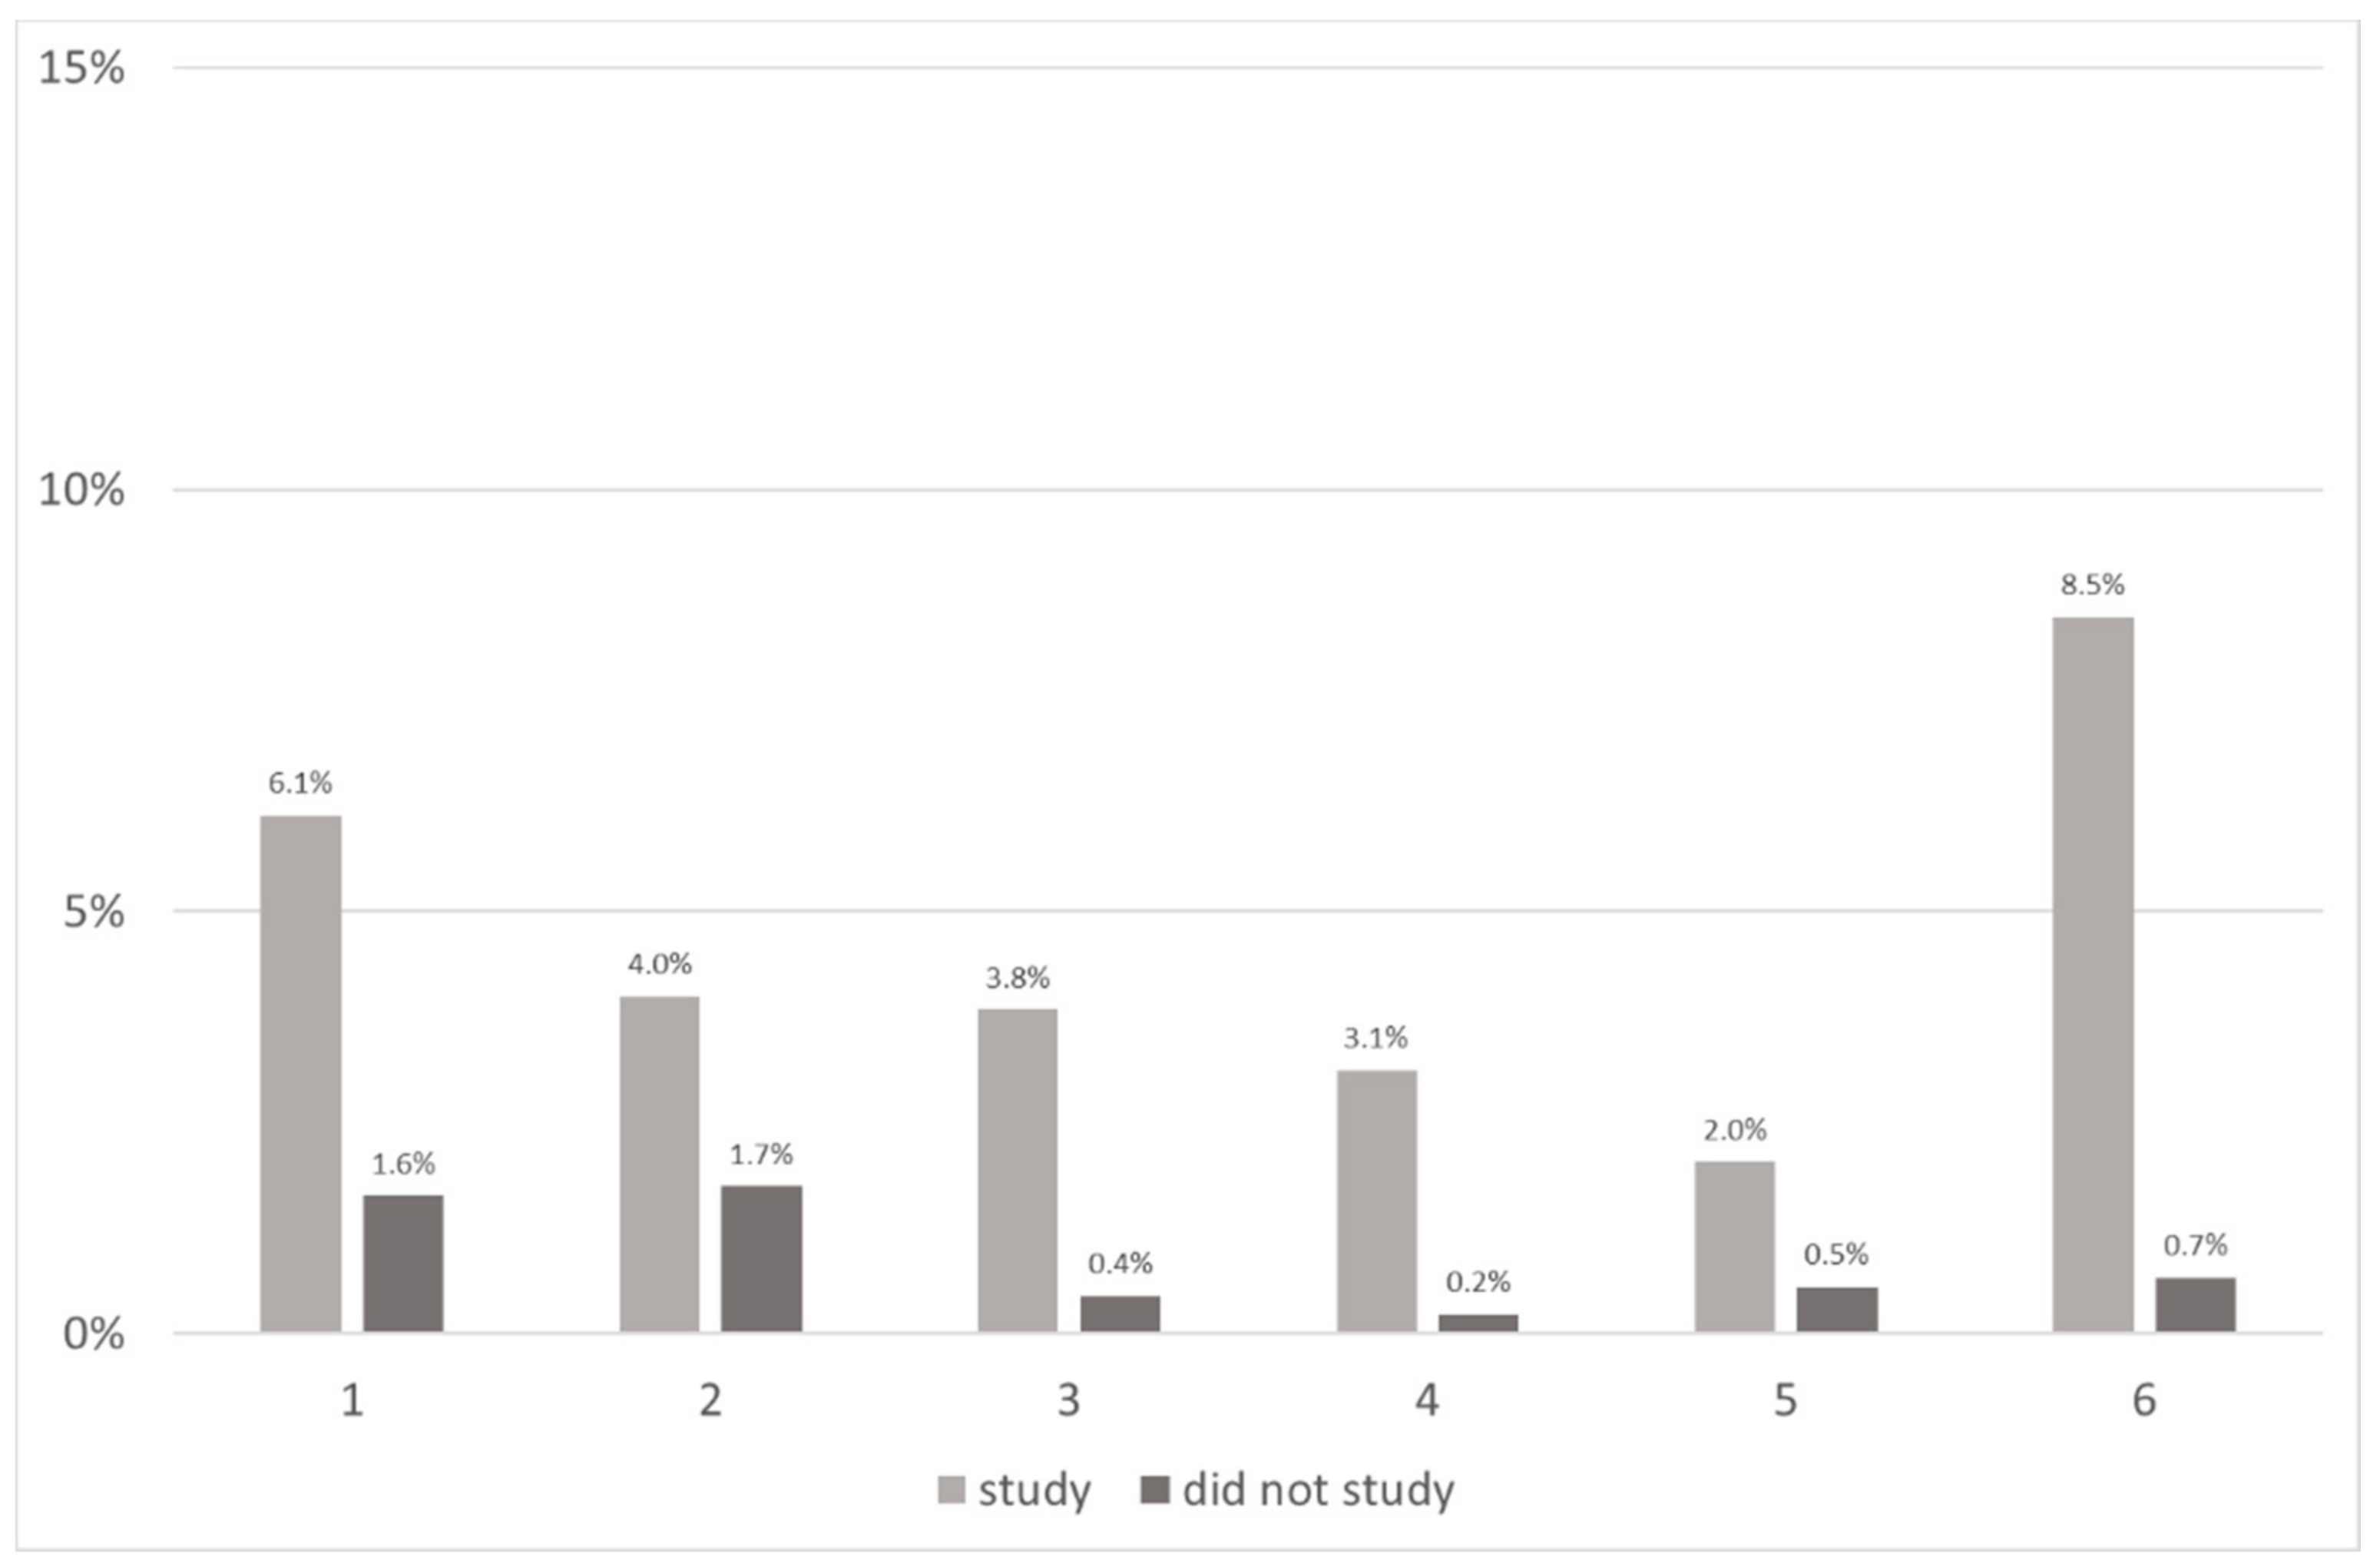
The percentage of students in Groups Studied and DidNotStudy scoring items 0–8 and 0−6 in the formula completion and the execution order tasks are presented in Figure 9 and Figure 10.
In the formula completion task, leaving out those students who scored zero, the two most frequent items are three and two (872 and 855 students, respectively, from 3291 students). This means that most students’ knowledge is pre-structural. The two most frequent items do not depend on whether the students studied spreadsheeting in school or not (813 and 780, 24 and 27, from 3023, and 94 students in Groups Studied and DidNotStudy, respectively) (Figure 11).
In the execution order task, the two most frequent scores are six and one (629 and 450 students, respectively, from 2050 students). This means that most of the students—considering only those who scored at least one item—either recognized only one step or all of them in the correct order (Figure 10). In this task, the two most frequent items depend on whether the students studied spreadsheeting in school or not. In Group Studied, the two most frequent items are six and one (584 and 422 from 1901 students), while in Group DidNotStudy, the two most frequent items are two and one (16 and 15 from 48 students) (Figure 12).
6.4. Self-Assessment
The self-assessment values on spreadsheet management and the responses to the studied/did not study in school questions were taken into consideration at this stage of the analysis. Similar to the evaluation of the students’ results, the 0–5 self-assessment values were converted into SOLO categories (Table 12). These categories are in complete accordance with the levels of science proficiency in PISA 2018, where Level 2 stands for the minimum [61]. We must note here that 516 students did not answer this question.
These categories of understanding are in accordance with the European Qualifications Framework (EQF) [82] and, based on this document, the proficiency levels of DigComp 2.1 [83]. Due to the administration process of the test, the first level of EQF and DigComp cannot be tested, where work or study is carried out under direct supervision in a structured context. In a similar way, Levels 7 and 8 cannot be identified due to the limits of the testing procedure.
According to the frame curricula [8,9], teaching-learning spreadsheet management is obligatory from Grades Seven to Ten (sample size: 8517). The question arises, then, regarding why 10.79% (919 students) of the tested students claimed that they did not study spreadsheeting in school—either because they did not study it or because they did not realize that they studied it (Table 6)—and further, 8.36% (712) did not answer the question.
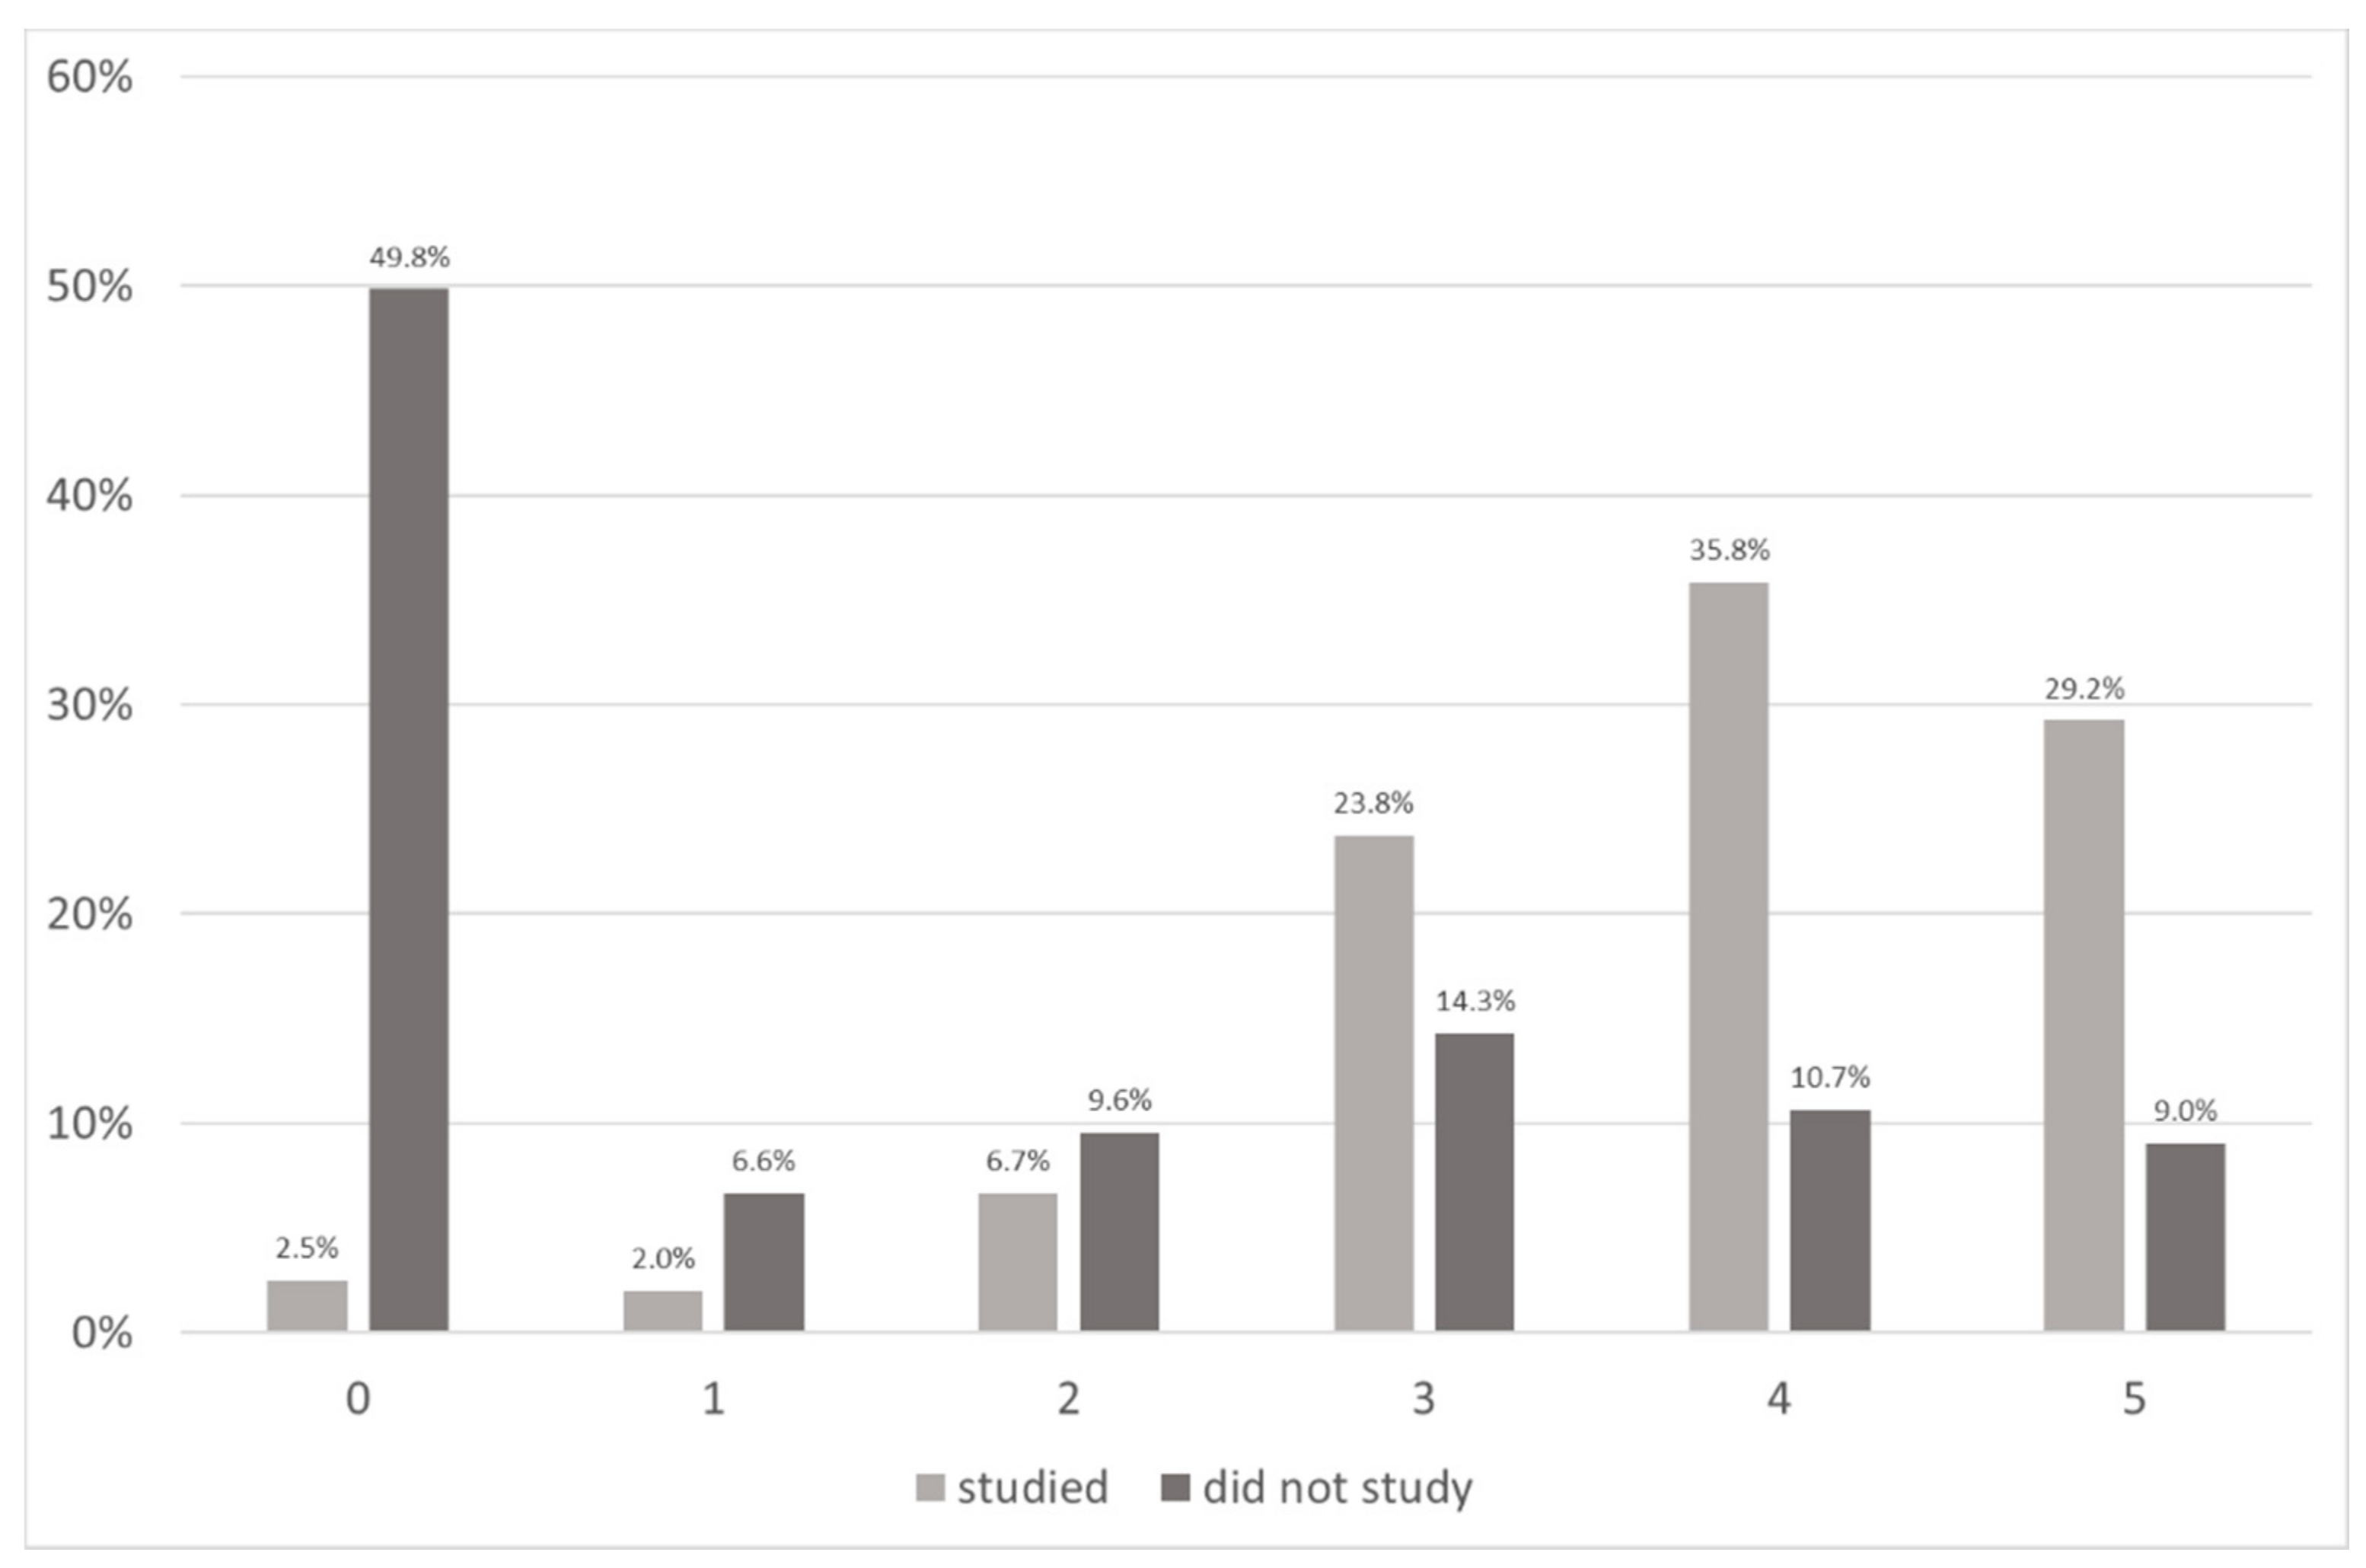
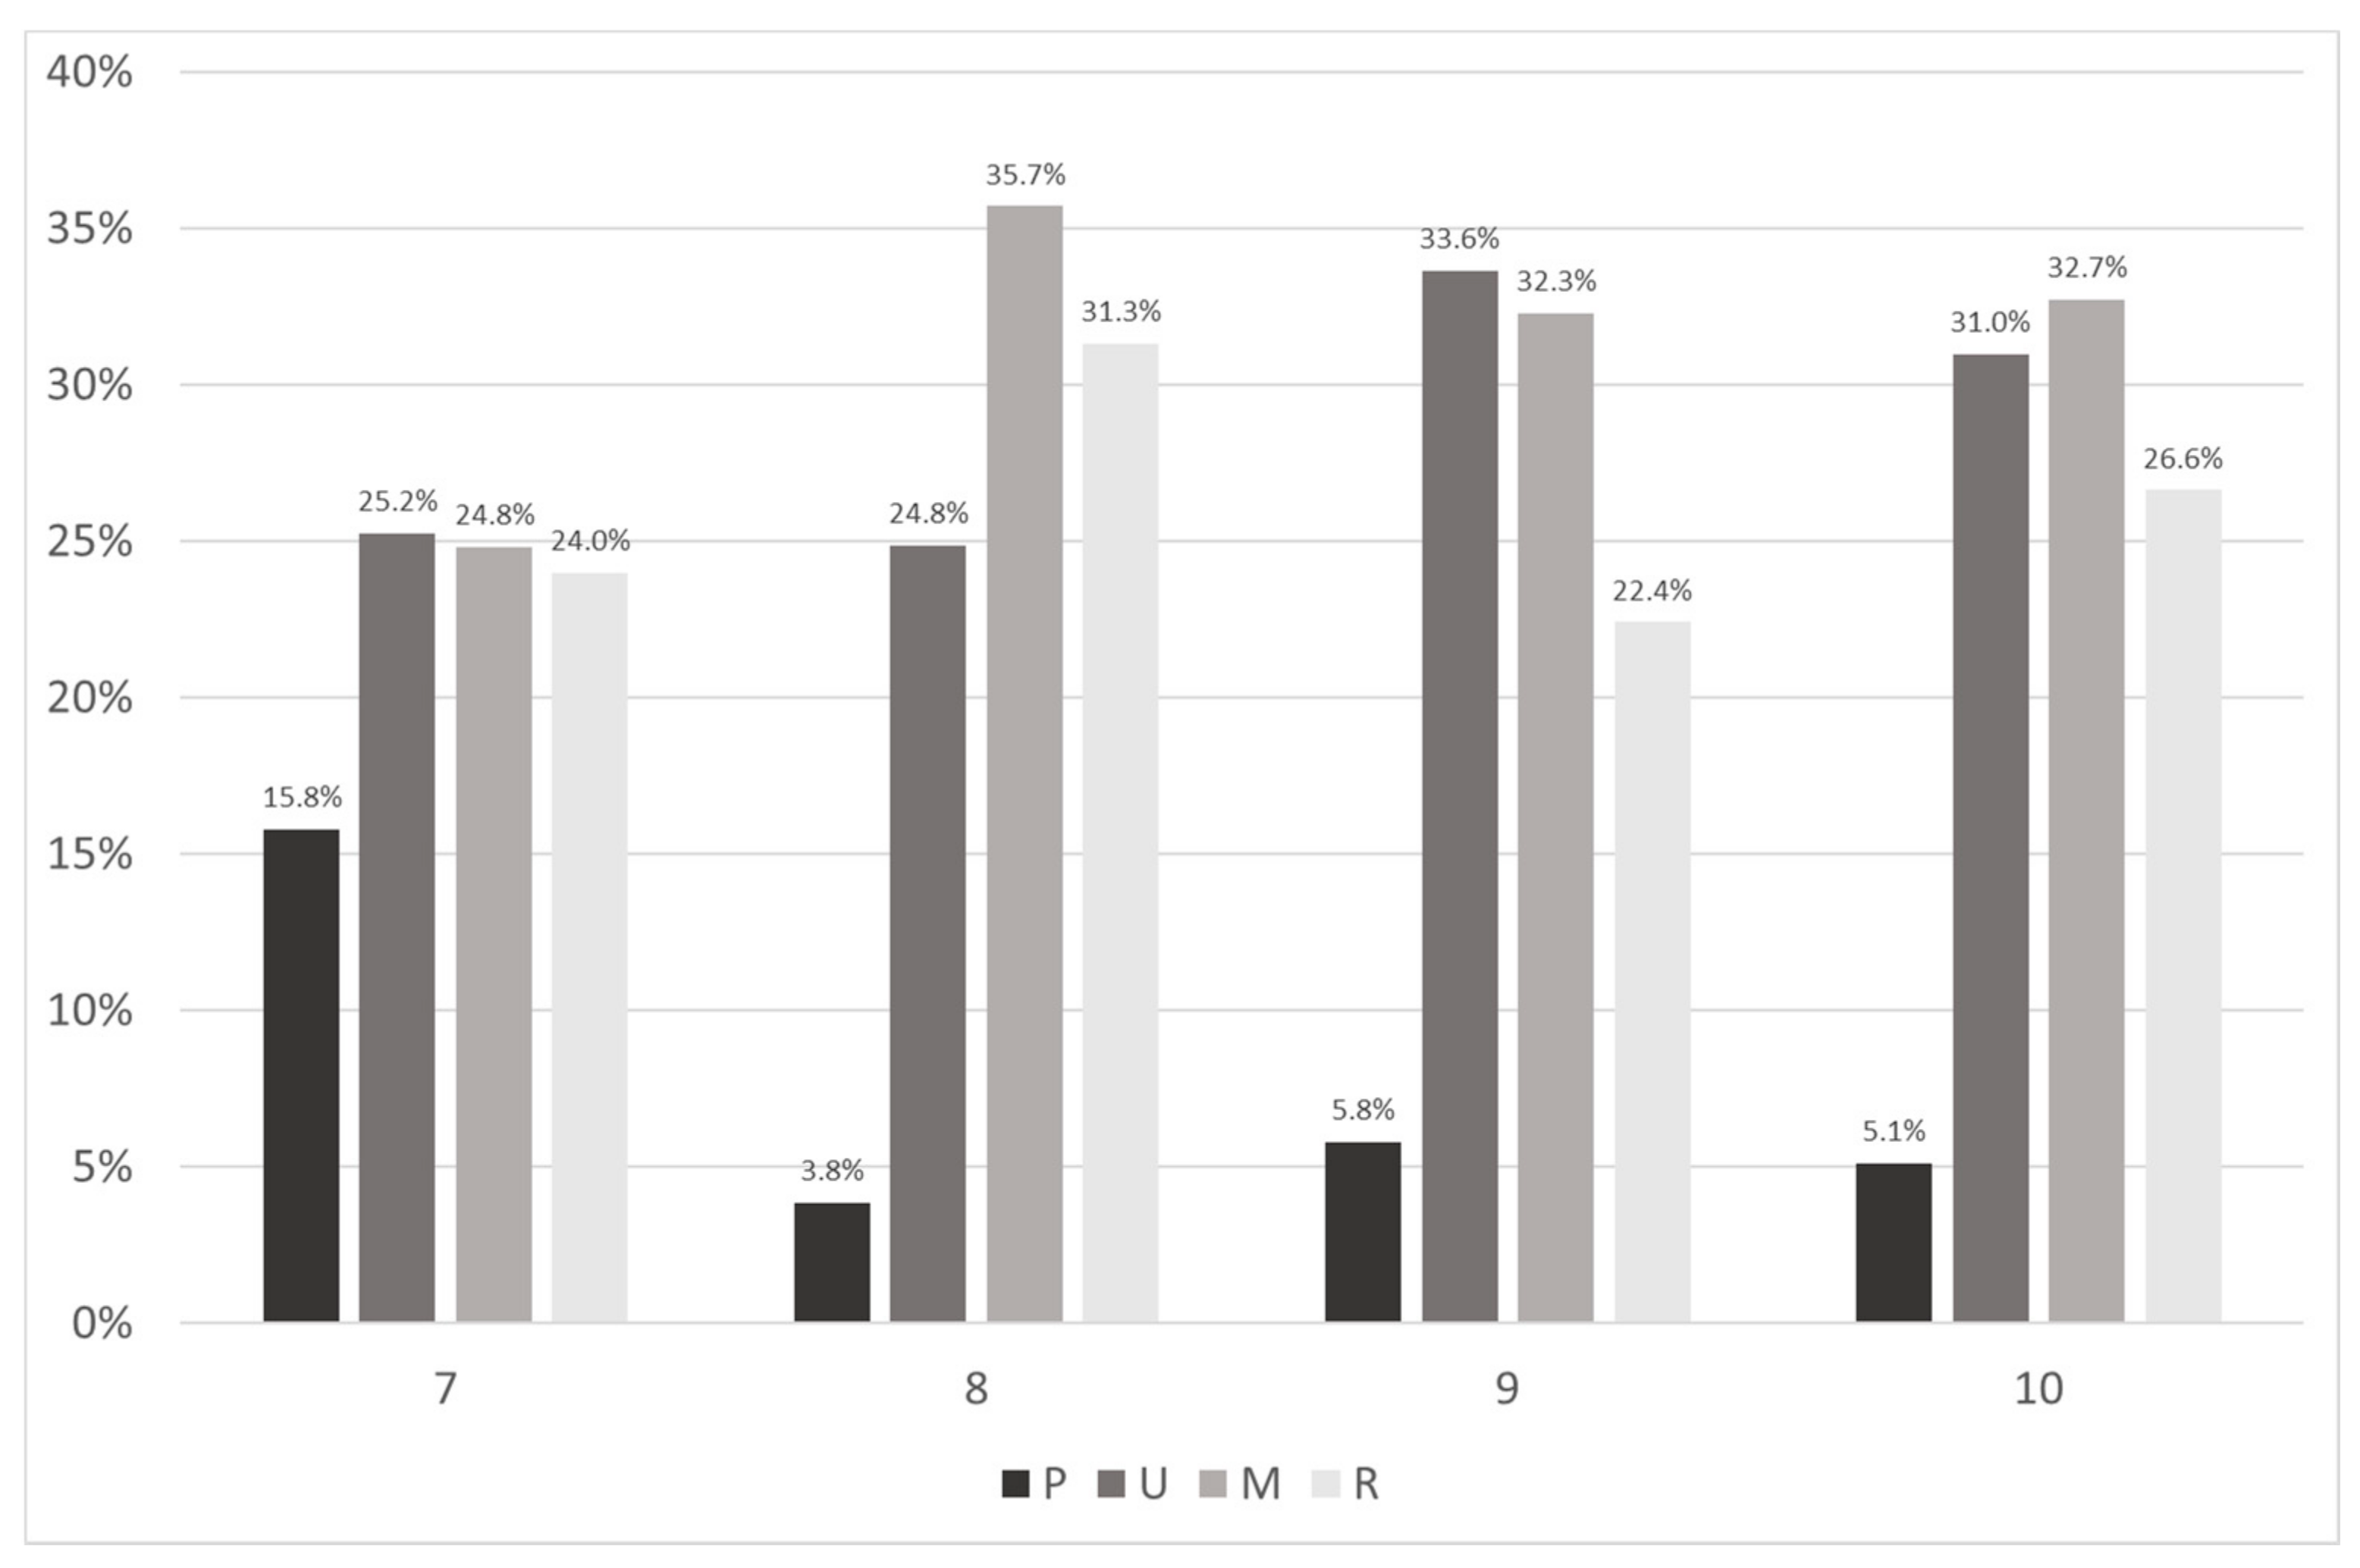
The comparison of Groups Studied and DidNotStudy revealed that students who studied spreadsheet management in school evaluated their knowledge higher than those who did not. Moreover, 65.1%, 19.7%, and 29.8% evaluated their knowledge at a four or five, in Groups Studied, DidNotStudy, and NoAnswer, respectively (Figure 13). According to the SOLO categories, their knowledge is multi-structural or relational. In Group Studied, 5% (310 from 6888 students) claimed that in spite of studying spreadsheeting in school, their knowledge is non-existent, and is only the lowest, pre-structural level of understanding. In the other two groups, 56% (519 from 919 students) and 40% (287 from 712 students) claimed that their knowledge is pre-structural (Groups DidNotStudy and NoAnswer, respectively).
Altogether, 4.5% of the students of Group Studied have pre-structural knowledge (zero or one), or 2.5% and 2%, respectively. In contrast, 49.8% of Group DidNotStudy rated their knowledge as zero, 6.6% evaluated their knowledge with one. This means that 56.4% of the students of Group DidNotStudy have a pre-structural level of understanding (Figure 13). Considering all students, 9.73% of them rated their spreadsheet knowledge pre-structural, 27.16% uni-structural, 24.62% multi-structural, 20.75% relational or extended abstract, and 17.74% did not answer (Figure 14 and Figure 15).
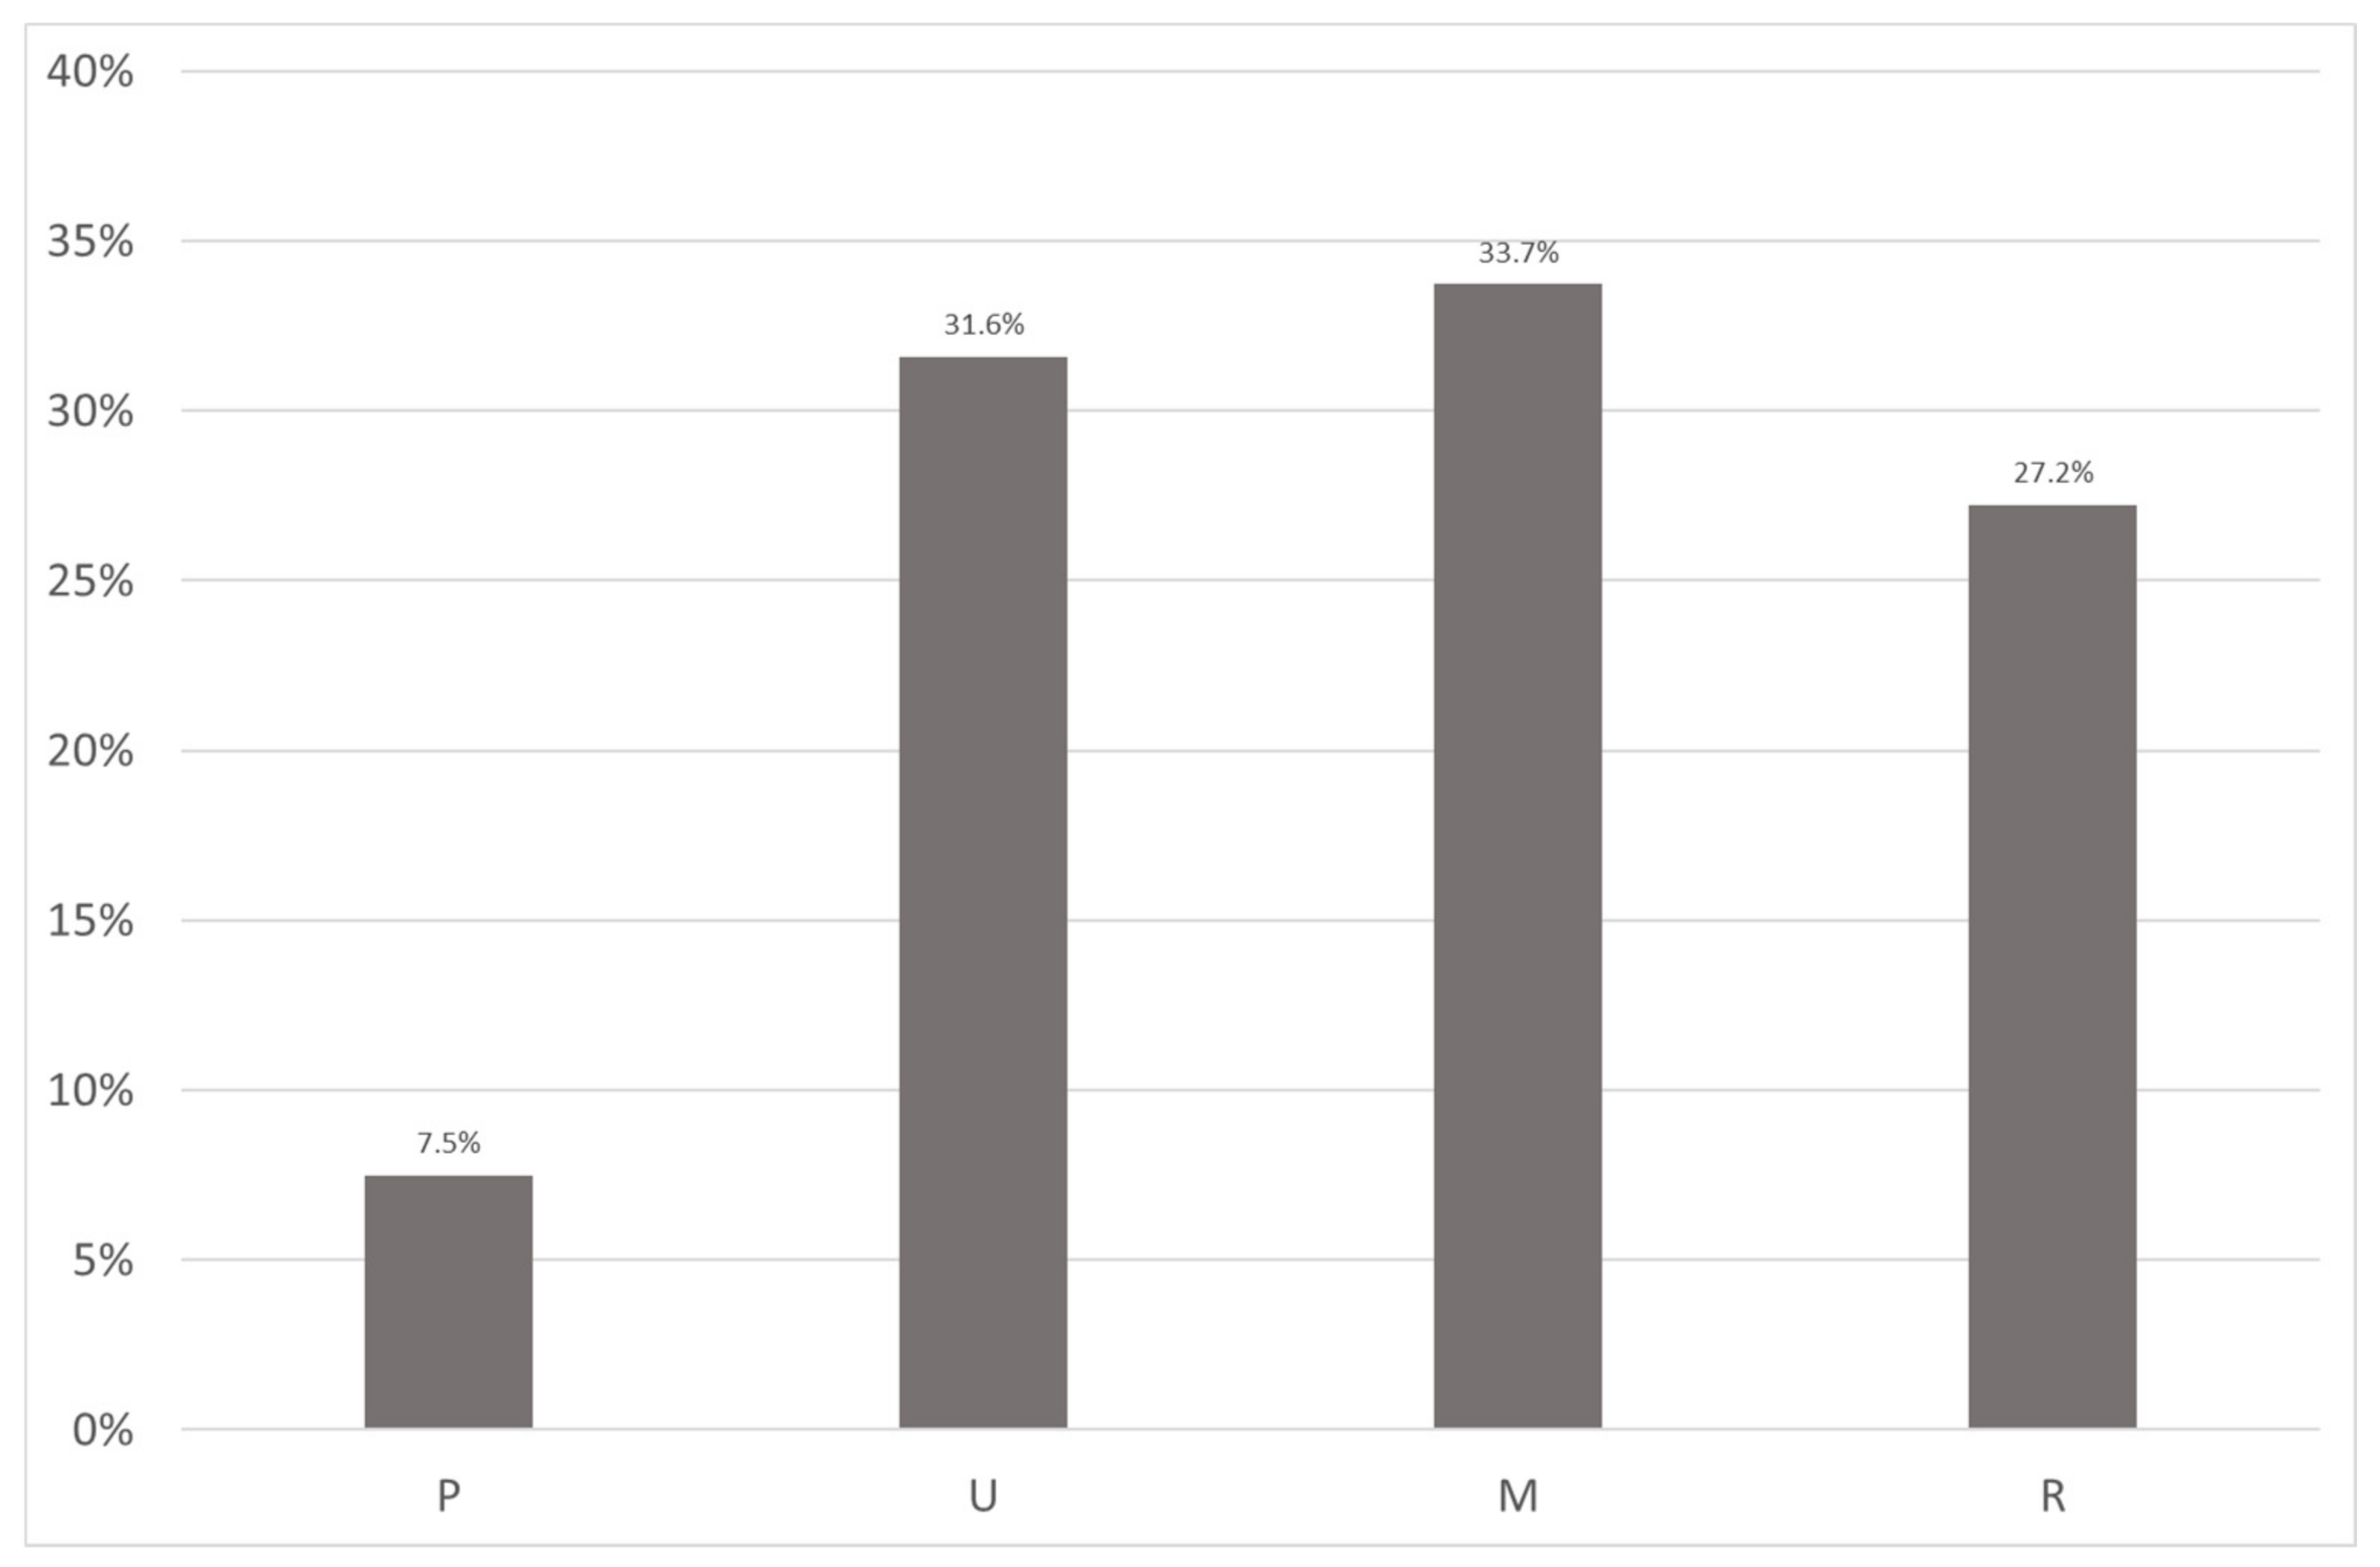
Evaluation of the self-assessment values revealed that there is a significant difference between the grades (p = 0.024). In Grade Seven, the SOLO categories are almost equally distributed, while in Grade Eight, the multi-structural and the relational levels dominate, and in Grades Nine and Ten, the uni- and multi-structural levels dominate. Grade Eight students are the most confident, which is in complete accordance with their behavior as senior students (Figure 14) [42,49]. Figure 15 presents the cumulative SOLO categories assigned to the self-assessment values. Based on the categories, a firm spreadsheet knowledge can be expected.
6.5. Spreadsheet Functions
As mentioned in the Chapter “Spreadsheet functions”, in the second section of the test, students were asked to list the most important spreadsheet functions, and fifteen cells were offered to fill in. This is much less than the number of functions listed in the official coursebook for Grades 9–10 [63].
Students wrote various strings which they considered as function names. Along with the correct functions, primarily misspelled functions, operators, and fictive names were presented. Table 13 provides the number of students from Grades 7–10 listing 0–15 correct functions. Here, we must mention the responsibility of the translators. In Hungarian, in several cases, the translators did not follow the original naming conventions. Furthermore, the names can be changed occasionally from version to version. Among these nonconventional naming practices, one of the most distracting features is a period character inserted into the middle of the function name. One can never anticipate whether the dot is part of a name or not, and it seems to appear arbitrarily. Consequently, the translation does not fulfill its original role of helping with the memorization of these function names.
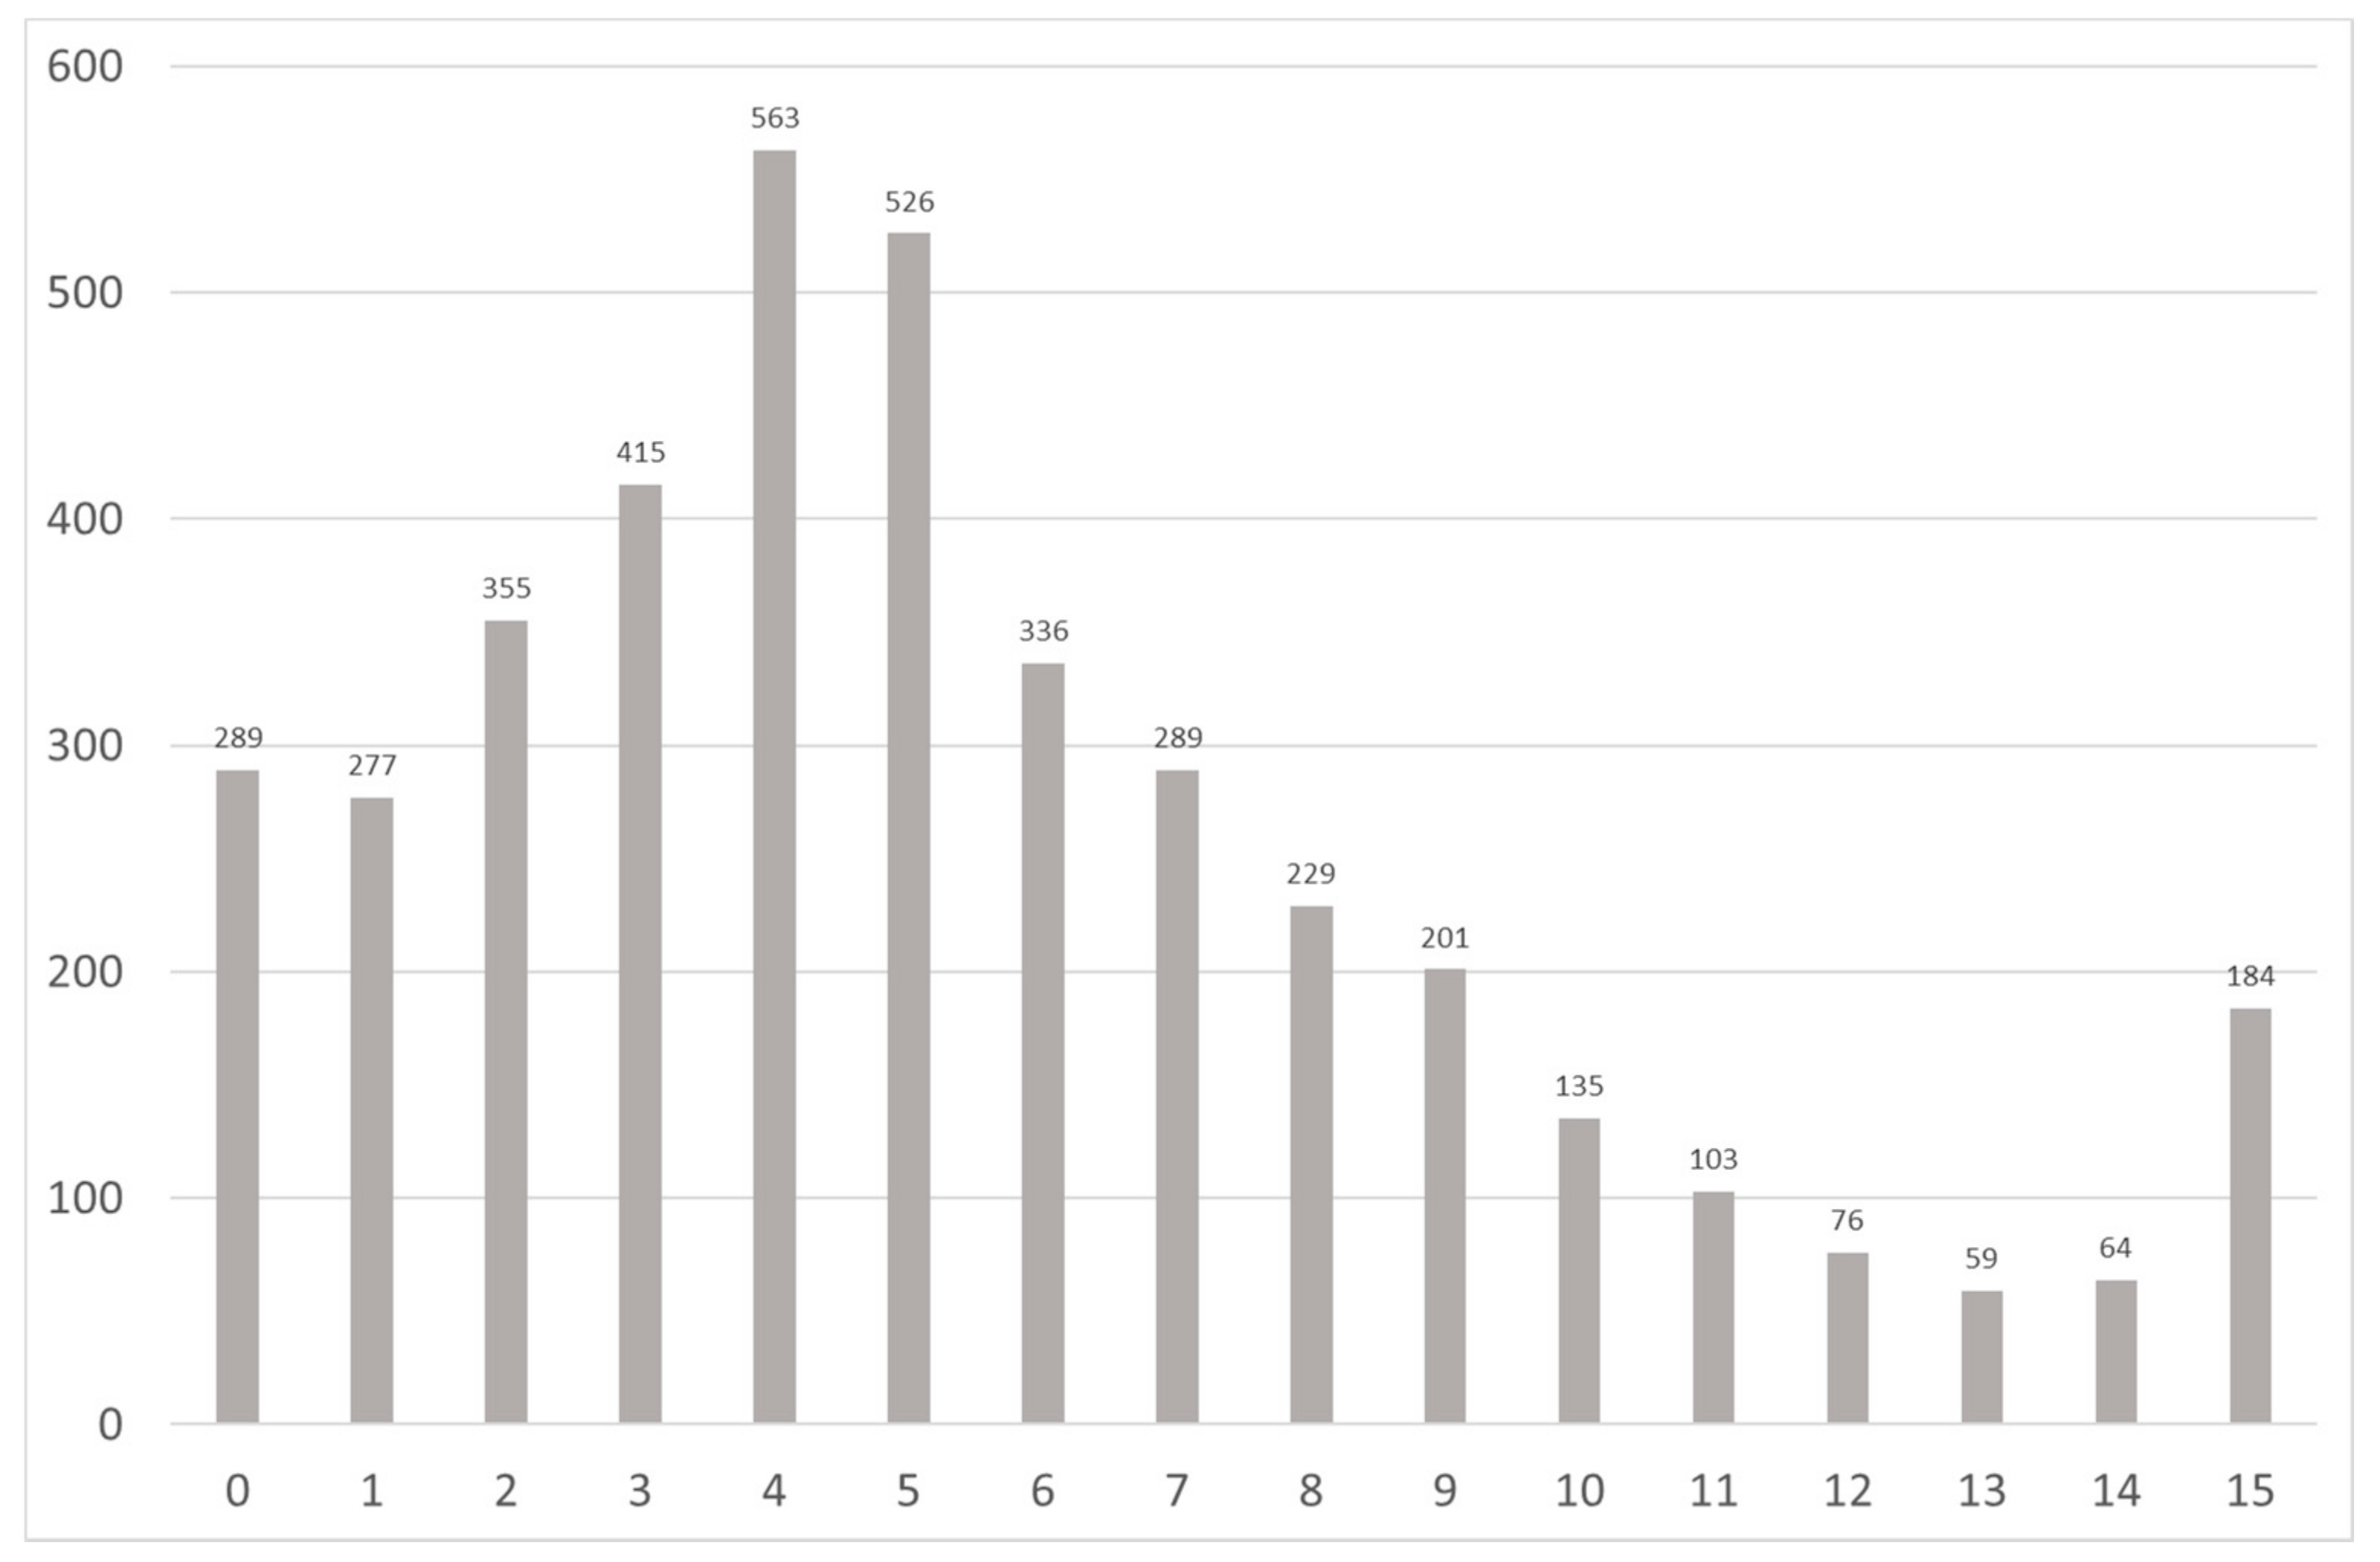
We cannot leave unnoticed that on average, students listed 3.2 strings, among which 2.8 were found correct. The modus and the median of the number of correct functions are zero, due to the high number of students (4477) who could not name a single correct function. One of the reasons for the high number of zero functions is that students did not recall any function name. In other cases, they only wrote incorrect names. It is found that among those students who wrote at least one string, 45% of them named only correct (existing) functions. Among the incorrect strings, the most common errors were, as mentioned above, mathematical operators—addition, subtraction, division, and multiplication operators, incorrectly named or drawn—and misspelled functions (Figure 16).
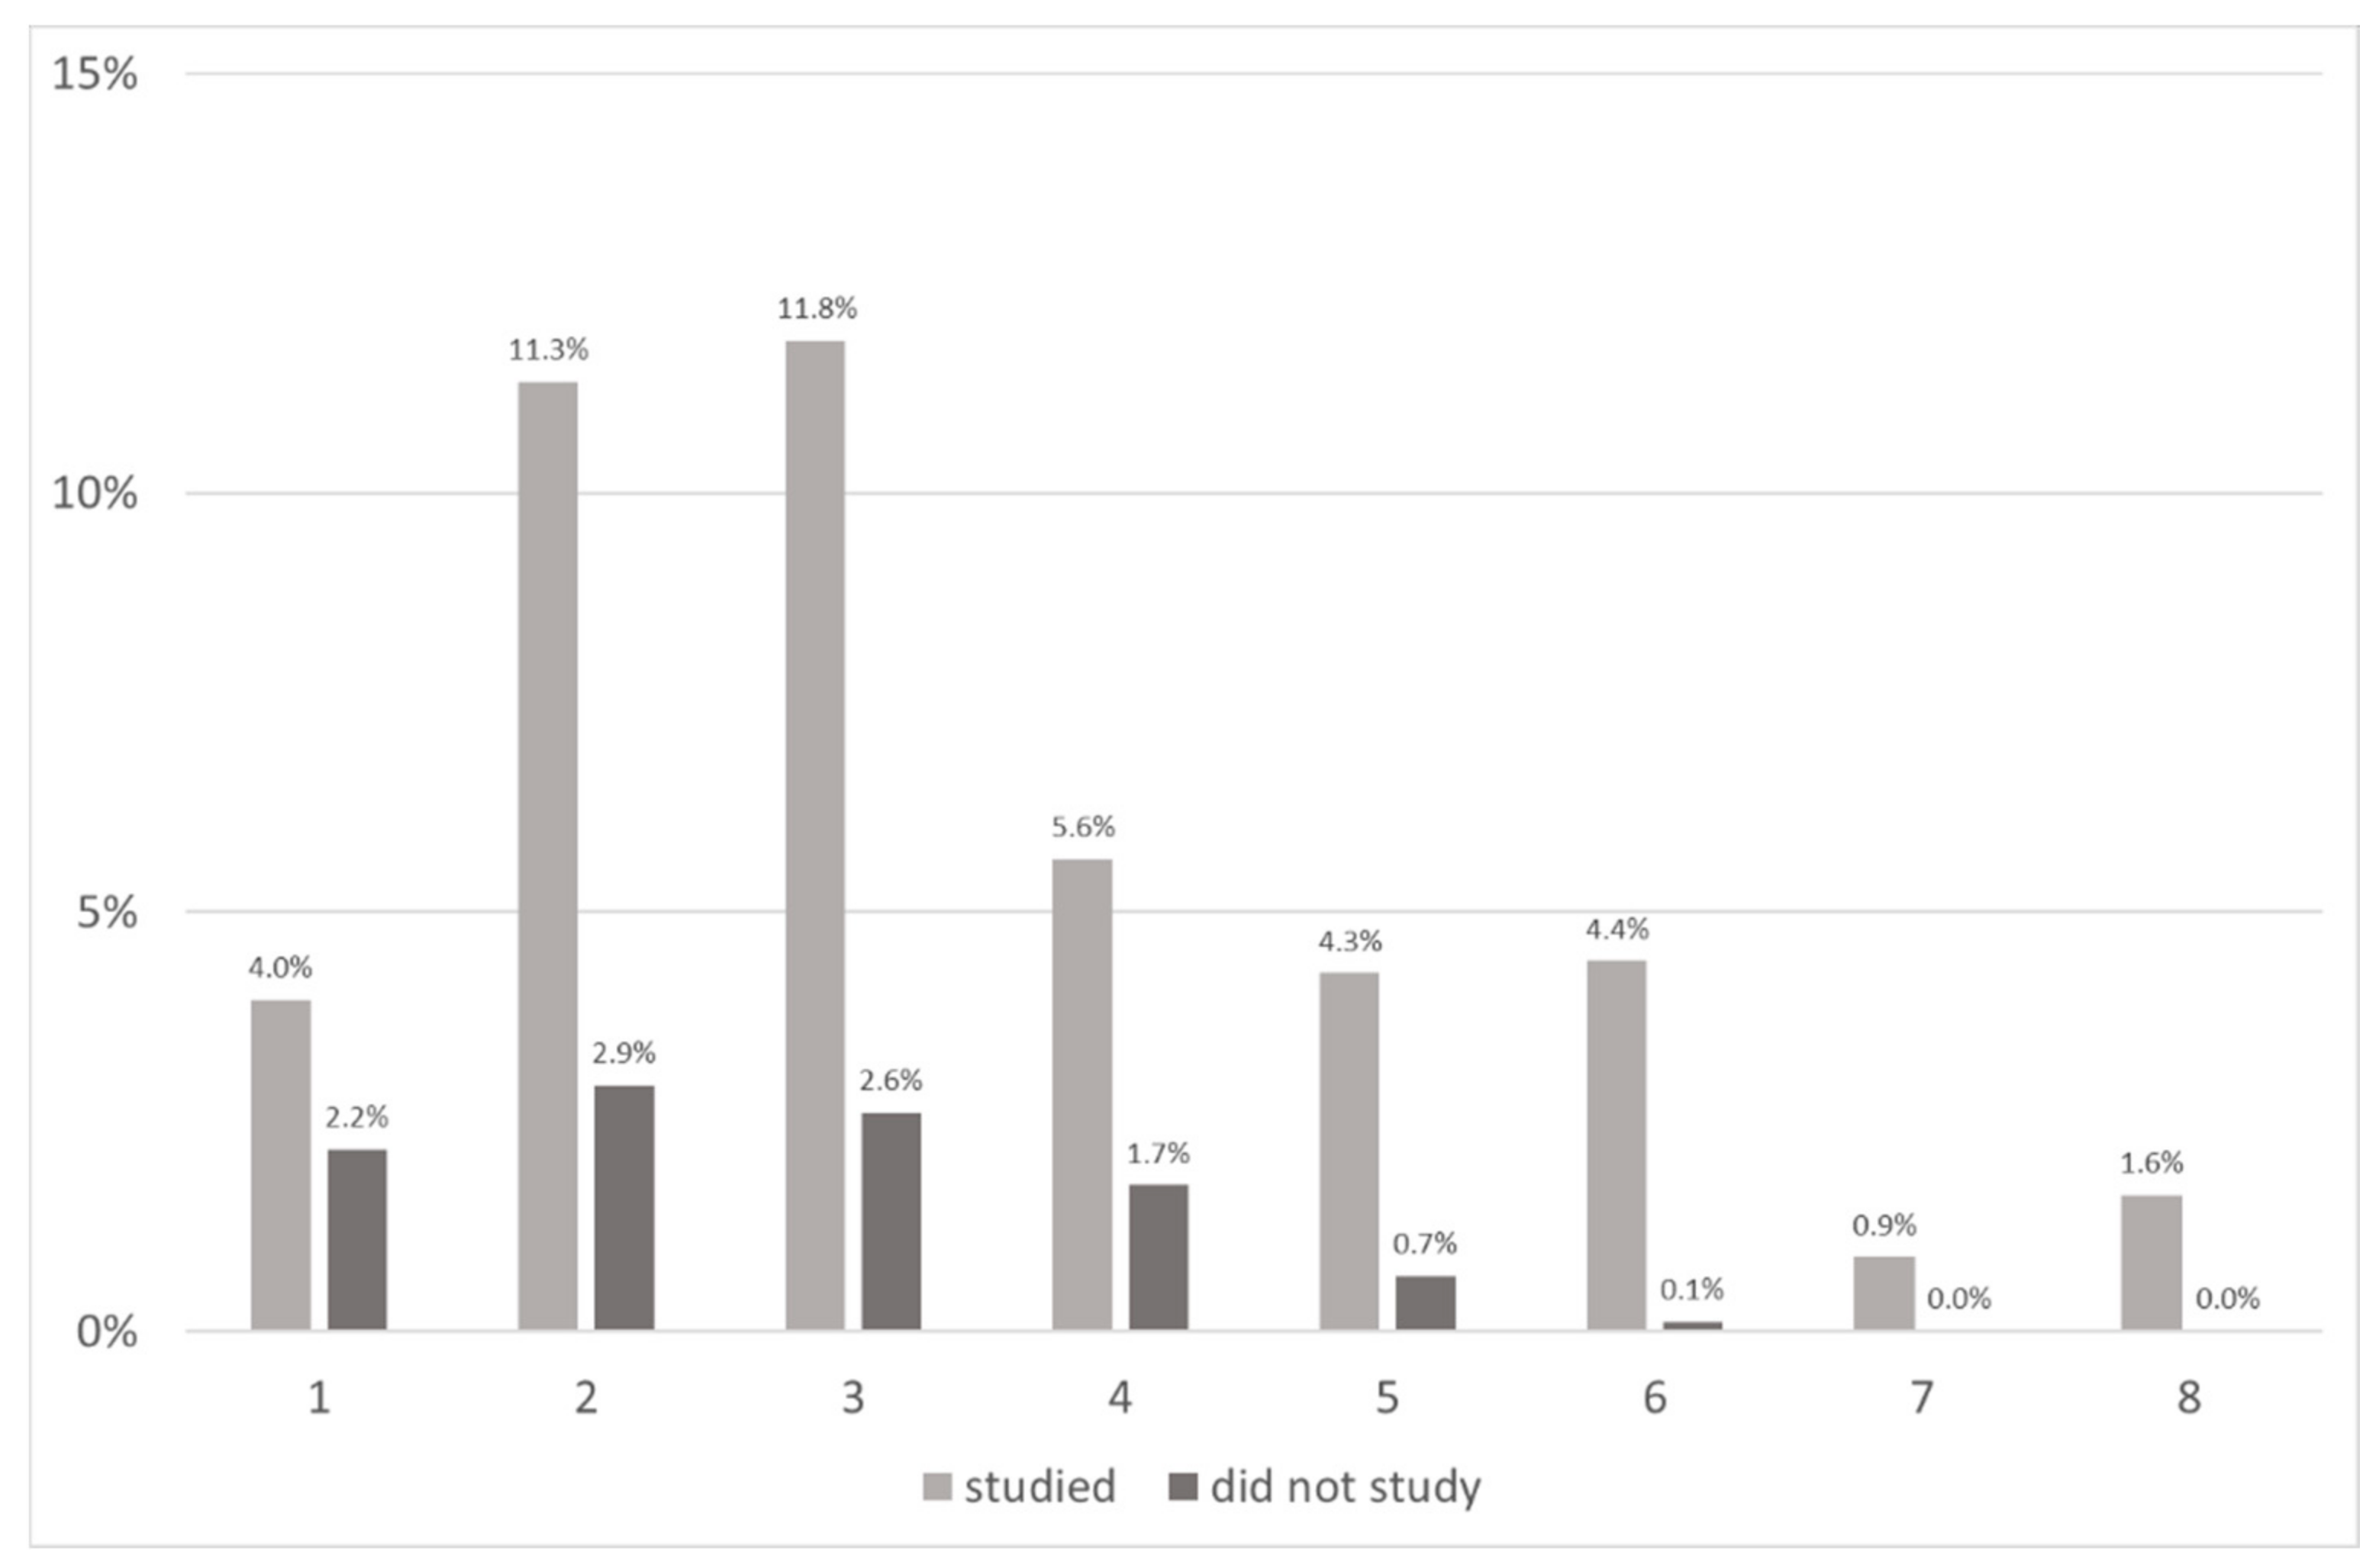
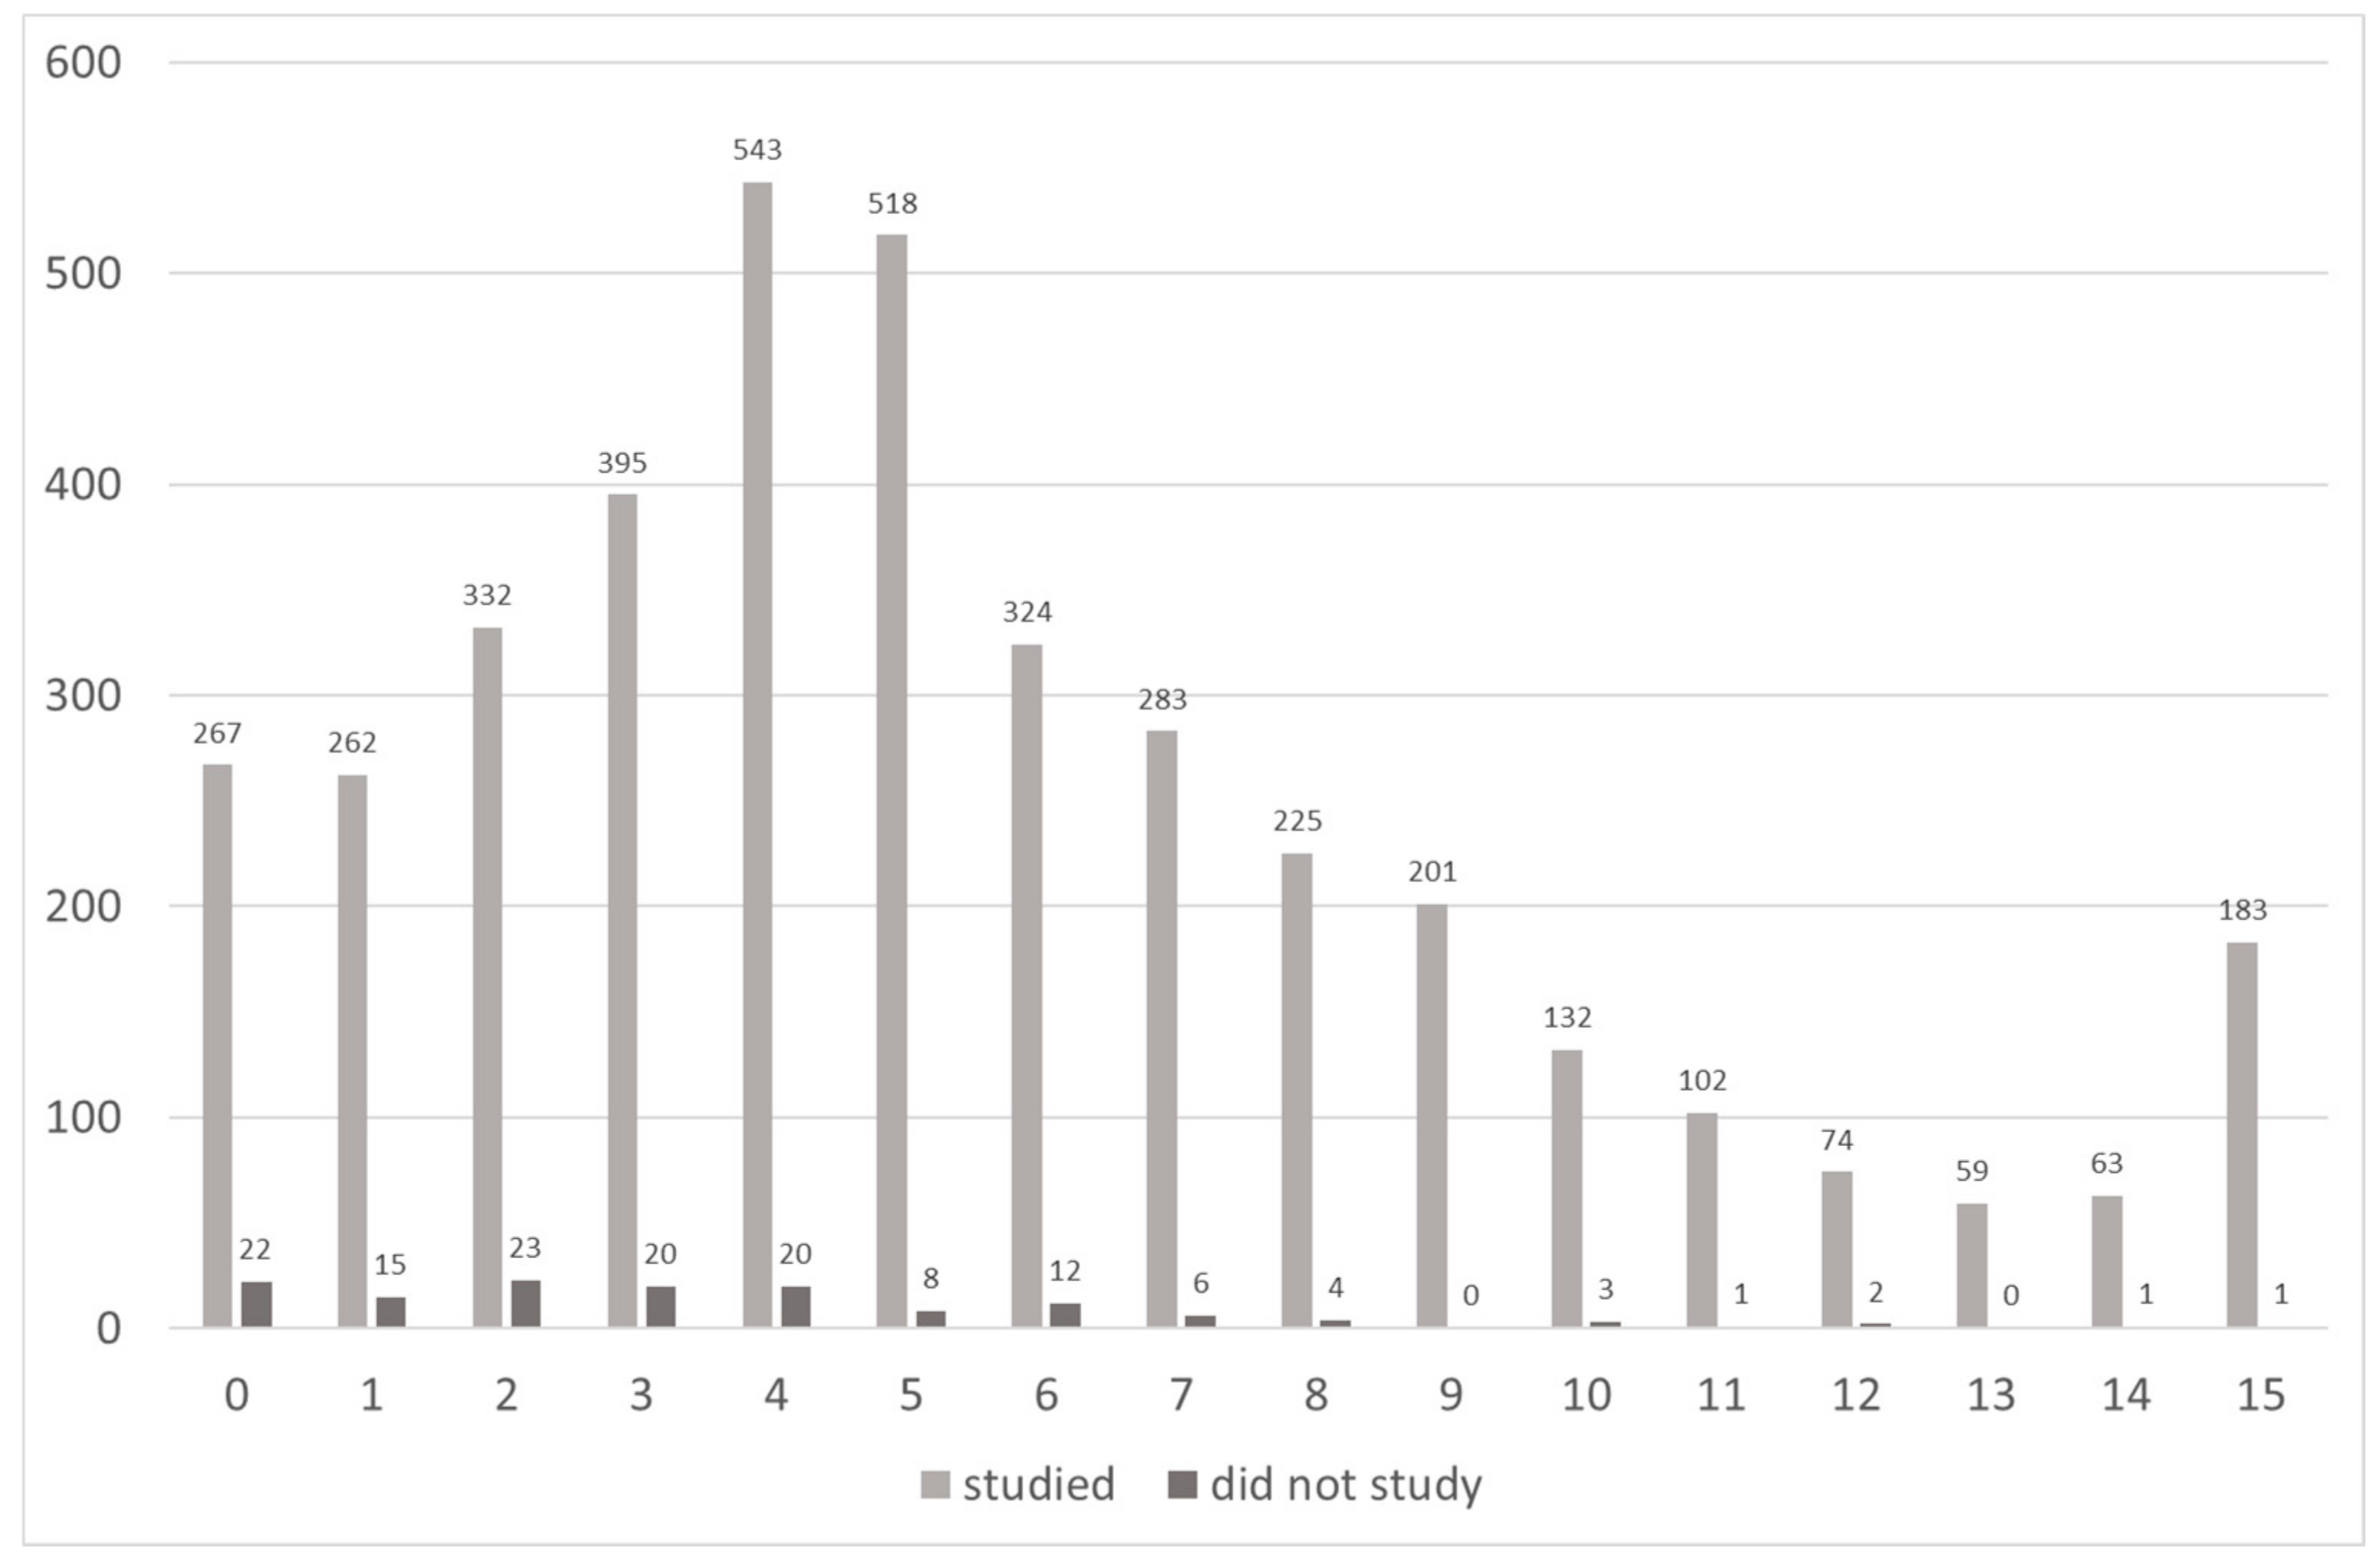
In Figure 17, the students of Groups Studied and DidNotStudy are separated. The graph shows the percentage of those students who wrote at least one function in Groups Studied and DidNotStudy. It is found that, leaving out those students who did not write anything, the modus of the number of correct functions is four and two in Groups Studied and DidNotStudy, respectively. Furthermore, 54% of Group Studied and 13% of Group DidNotStudy named only correct functions. Another difference between the two groups is the number of students listing more than seven functions. In Group DidNotStudy, there are hardly any students who wrote that number of functions. These results show that studying spreadsheeting in school would train more conscious end-users than self-studies (Figure 17).
One might argue that there is no need for remembering the function names since wizards, tips, helps, etc. would guide end-users in finding the correct function(s). However, this is not so, because browsing the interfaces and looking for ideas requires slow thinking [64], whose processes are proved erroneous, leading to serious spreadsheet errors [39,80,84,85]. Instead, with a reasonable cognitive load [29,30,76], the names, the arguments, and the semantics of the functions must be memorized to allow end-users to activate fast thinking, which would lessen spreadsheet errors. Schema construction and applying the built schemata in solving novel problems is widely accepted and applied in teaching mathematics [86].
“Each problem that I solved became a rule which served afterwards to solve other problems” [87], declared Descartes. This idea plays a crucial role in Pólya’s concept-based problem-solving approach [86]. Unfortunately, cognitive load [88], schema construction [88,89], fast and slow thinking [40,64,90], and concept-based problem-solving [86] are not well-known in informatics, which might be explained by the distractor role of the digital devices, both hardware and software, the dominance of folk-pedagogy [50], and the lack of expert teachers [45] in this novel science.
6.6. SOLO Categories: The Level of Understanding
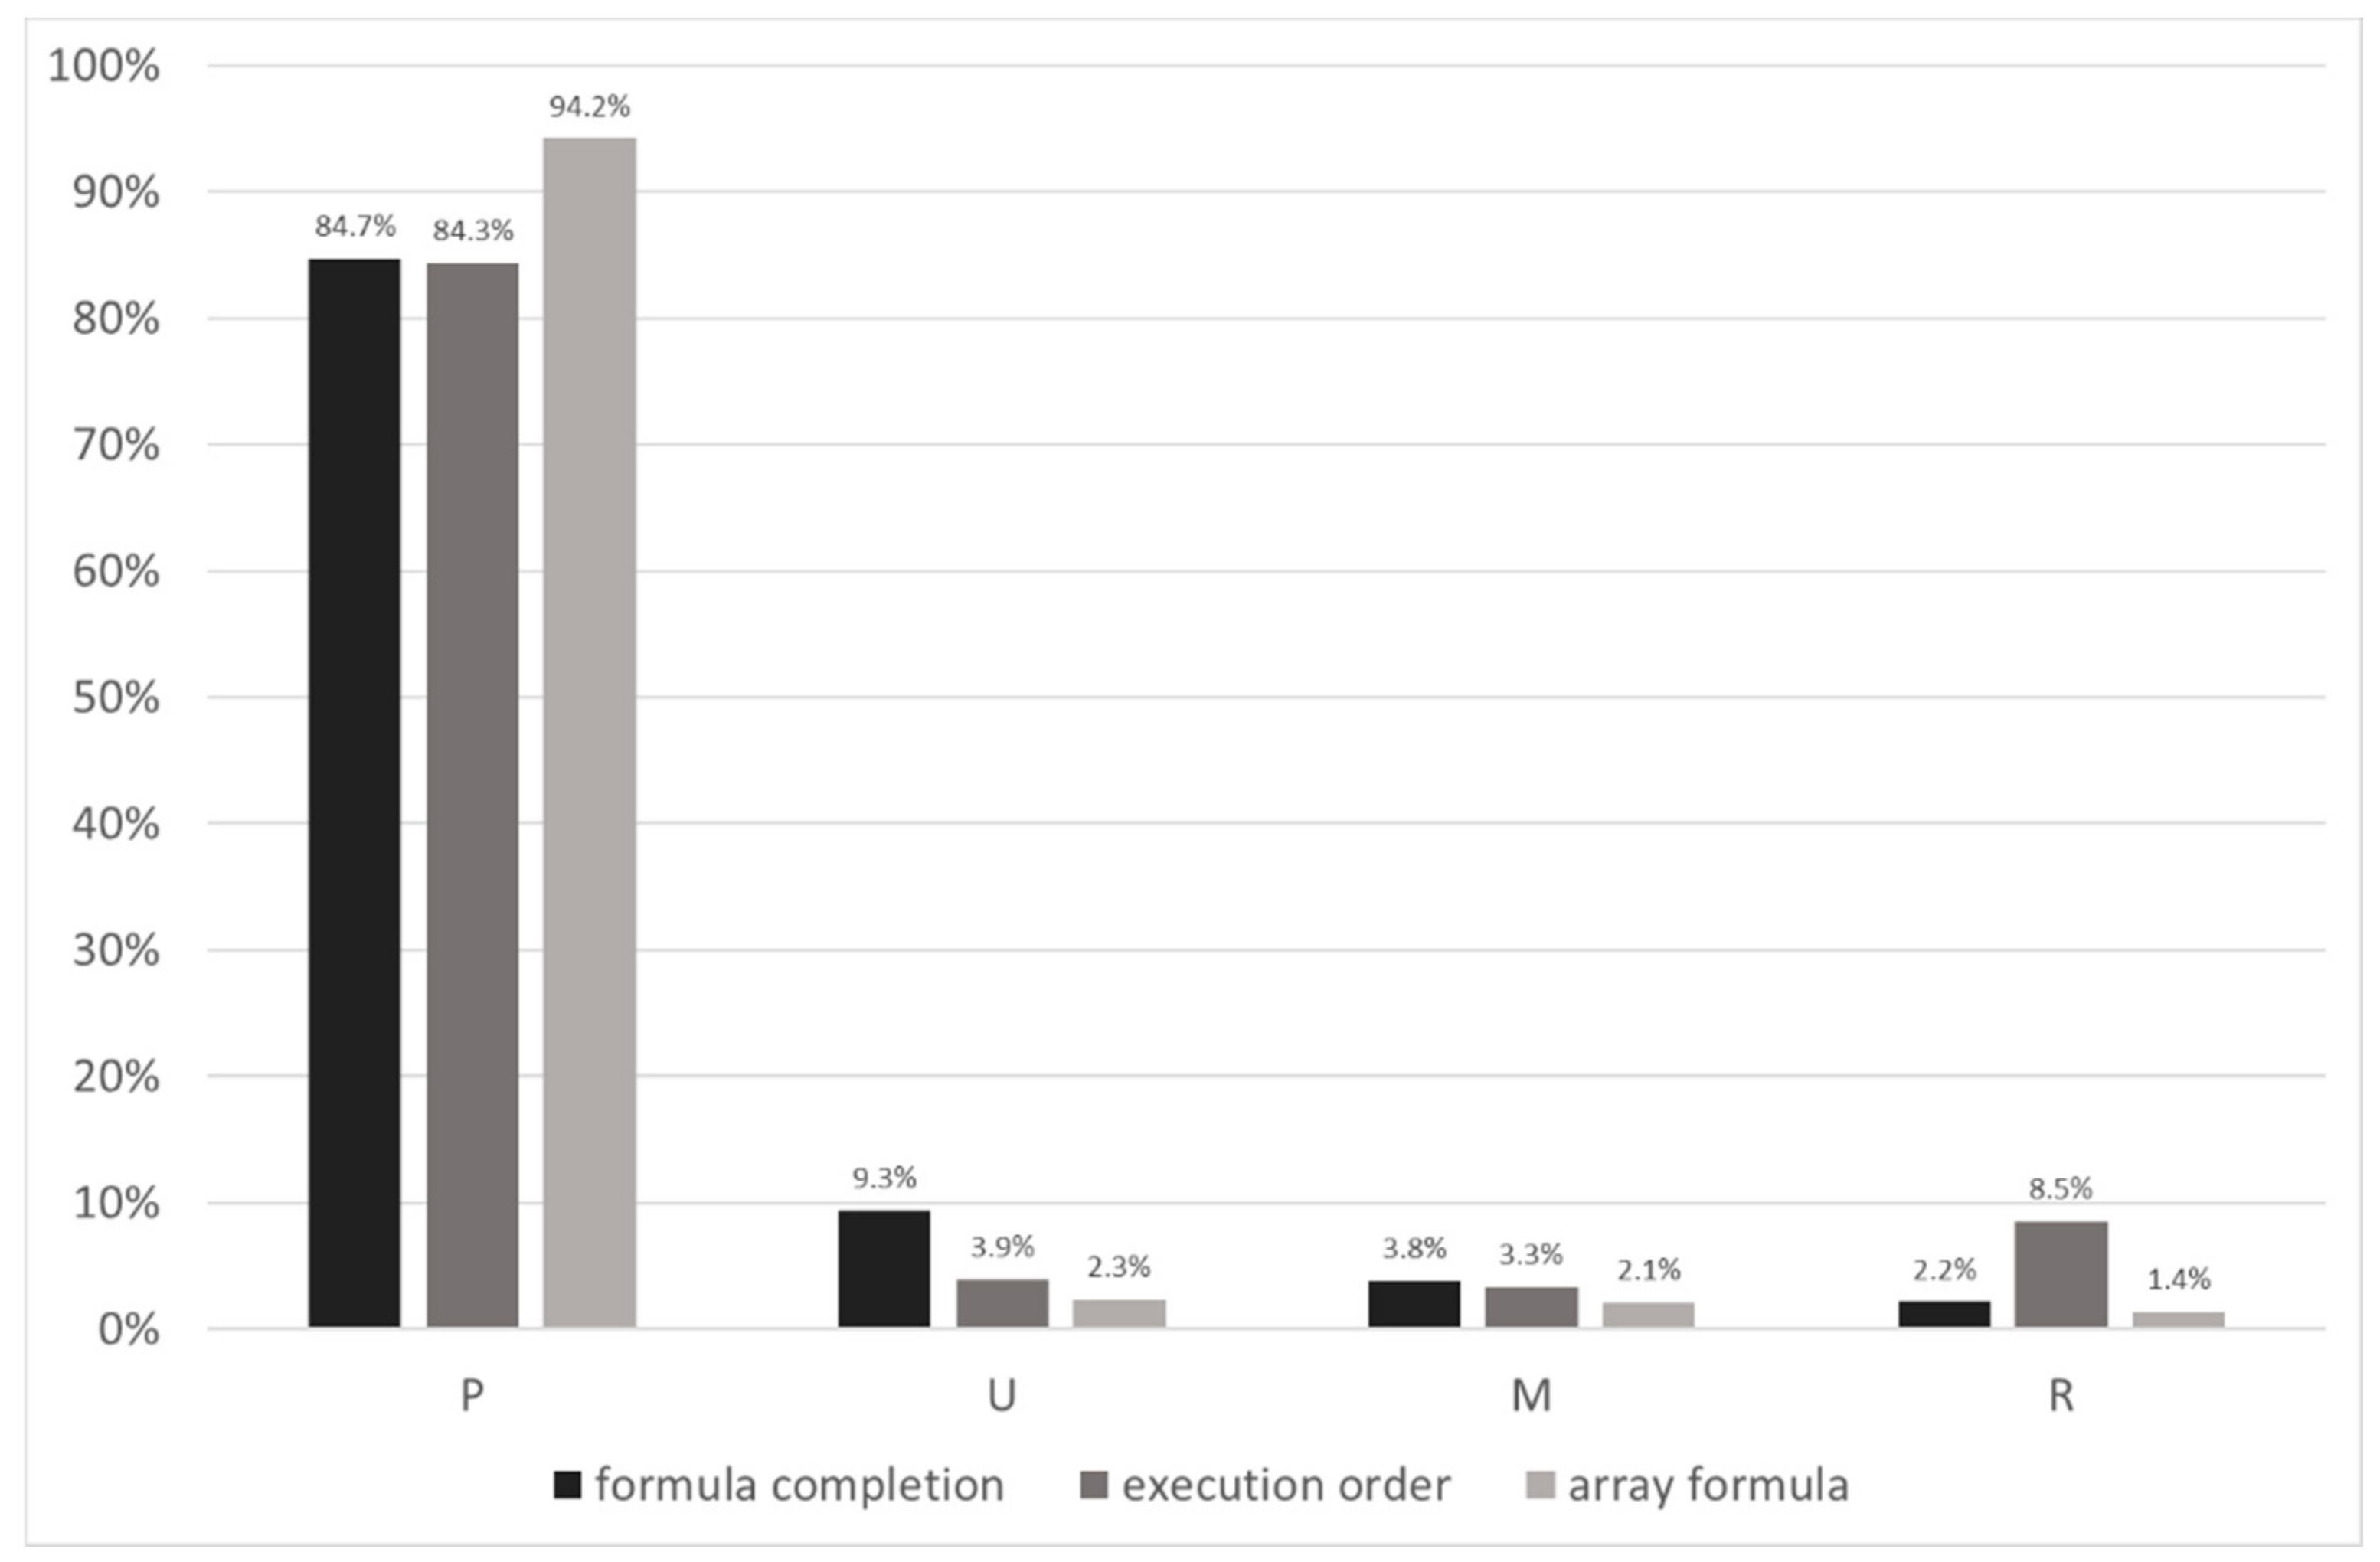
Beyond calculating the score of the students, the results are converted into the spreadsheet SOLO categories [49]. Based on the categorization, the frequency and the relative frequency of the students are calculated. The analysis reveals that the most frequent SOLO category is pre-structural (P) in all three tasks (Figure 18).
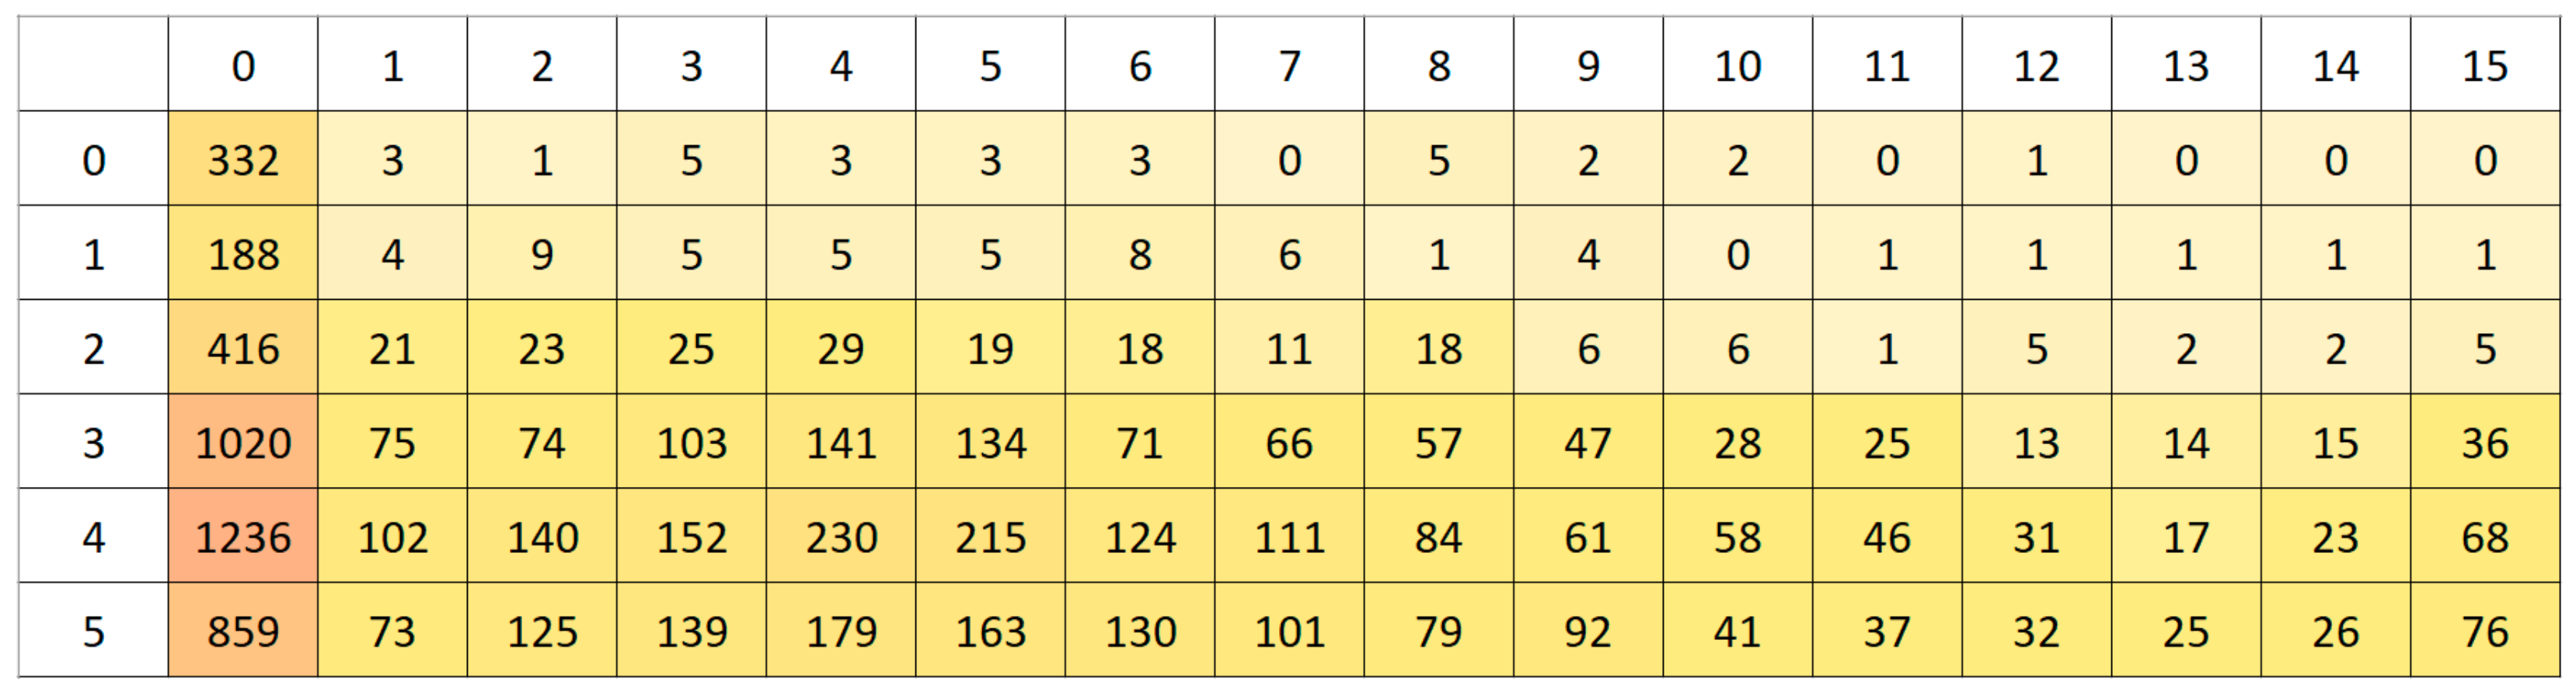
Furthermore, based on the SOLO categories of the three tasks, a cumulative SOLO category is assigned to the result of each student. Considering all of the possible outcomes (64), the number of triads forming the cumulative SOLO categories is presented in Table 14.
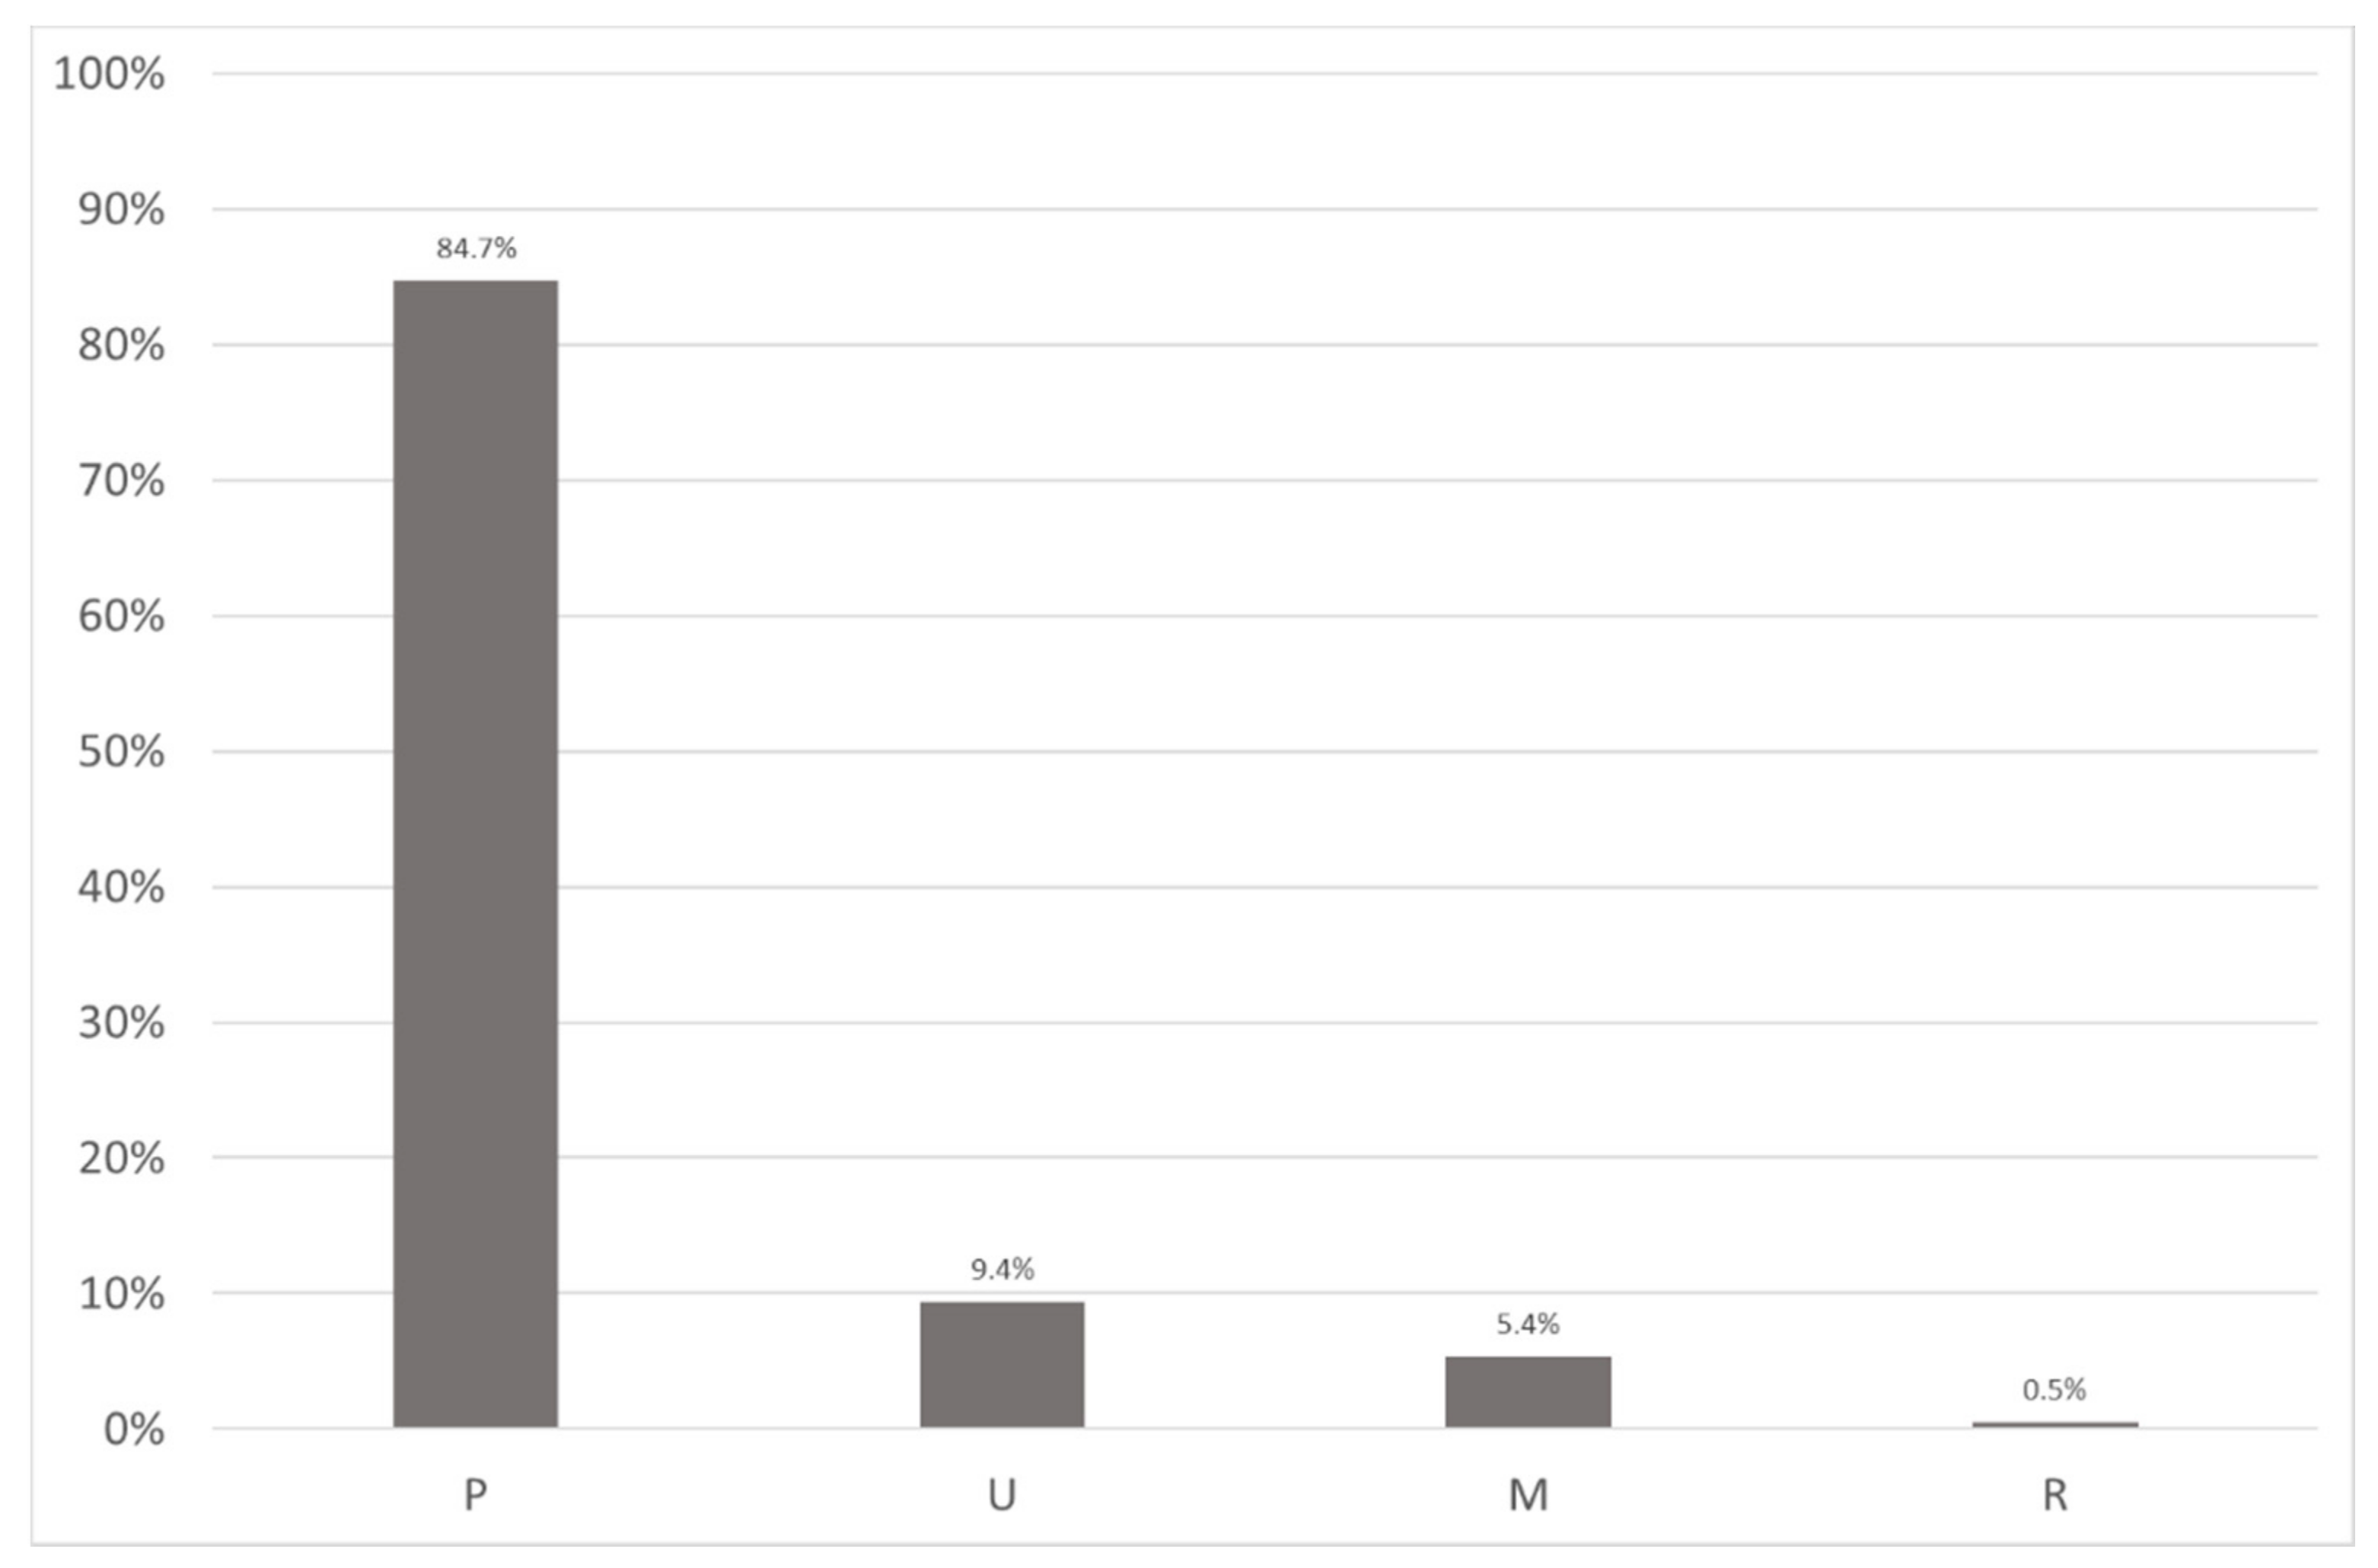
The cumulative SOLO categories reveal the same results as the unique SOLO categories: the students’ level of understanding is primarily pre-structural (Figure 19).
The comparison of the SOLO categories of the students’ self-assessment (Figure 15) and their results (Figure 19) reveals that the self-assessment values are much higher than the students’ real knowledge. Table 15 presents the number of students in the comparison of the self-assessment (A-P, A-U, A-M, A-R) and the results (R-P, R-U, R-M, R-R). The following can be revealed:
- Diagonal of the matrix: the number of those students who gave a proper self-assessment value.
- Upper triangle of the matrix: the number of those students who overestimated their knowledge.
- Lower triangle of the matrix: the number of those students who underestimated their knowledge.
In general, 12% of the students (952) were able to estimate their spreadsheet knowledge correctly (Table 15, diagonal, white cells with bold font style), 86% of them (6916) gave higher self-assessment values than their actual knowledge (Table 15, upper triangle, white cells with normal style), and 2% (133) underestimated their knowledge (Table 15, lower triangle, gray cells).
In the comparison of the students’ results and their self-assessment values, we found that there is no relationship between the achievement and self-assessment values. Thus, our Hypothesis H1 is rejected.
7. Relationships beyond the Results
7.1. Self-Assessment vs. Classroom Activities
Among the listed classroom activities, we examined what might influence self-assessment and the proficiency level of students’ knowledge. In general, we were looking for activities that might have a direct influence on the students’ awareness of the processes of studying and doing spreadsheet management. Linear regression revealed that there is a weak relationship between the classroom activities and the self-assessment values (R < 0.2). We can conclude that no activities can be found, which alone has a significant effect on the students’ self-assessment values. Furthermore, one must note here that the strongest relation is found between the activity of typing spreadsheet tables and the self-assessment values (R = 0.207). This finding is in complete accordance with previous results from analyzing the spreadsheet chapters of official coursebooks [10,11,12,62,70]. Coursebooks do not provide sample files with real-world data, but require students to type fictitious sample data in spreadsheet workbooks [63].
In a further examination, a cluster analysis formulated two distinct groups with a low and high number of activities. Those who marked higher number of activities are more self-confident, and their results are also higher compared to the cluster with the low number of activities. We can conclude that the students’ self-assessment values are based on the number of different activities, and not on the effectiveness of teaching.
Based on these findings, we cannot confirm Hypothesis H2.
7.2. Number of Functions vs. Self-Assessment
We investigated the relationship between the number of listed and correct functions and the self-evaluation values. A weak relationship is found between the examined parameters (R = 0.232 and R = 0.217, respectively).
Consequently, we cannot prove that the number of learned functions has any effect on the self-evaluation values. This finding is further supported by the frequency of correct functions in the groups of the self-assessment values (Figure 20). The three most frequent groups are where the self-assessment values are 4, 3, and 5, and the number of the correct function is 0. Students are rather confident considering their spreadsheet knowledge, but could not name any function.
7.3. Number of Functions vs. Results
Based on the correct functions written by the students, a frequency list was created. In the three tasks the SUM(), AVERAGE(), IF(), and LEFT() functions are mentioned. Their positions in the list are 1, 2, 5, and 20, respectively.
A medium relation is revealed between the formula completion and the execution order tasks vs. the number of functions (Table 16). This can be explained by the high position of the functions in the frequency list, where the knowledge might arrive from the classroom activities mentioned in the Chapter “General section”.
On the contrary, a weak relation is revealed between the array formula task and the number of listed and correct functions (Table 16). This finding is in complete accordance with the results detailed in the Chapter ”Students’ results in the spreadsheet tasks”. Those results revealed that pieces of knowledge are recognizable, but students are not able to synthesize their knowledge. Consequently, they cannot reach the relational level of understanding. In this case, students are familiar with the names of the functions, at least with the SUM() and the IF(), but cannot understand the relation between them accompanied with the LEFT() function (Table 16).
Considering Hypothesis H3, it can be partially confirmed. On the one hand, a medium correlation is found between the results of the formula completion and the execution order tasks vs. the learned functions. On the other hand, a weak correlation is found between the array formula task vs. the learned functions.
8. Conclusions
Previous research proved that teaching spreadsheeting from a programming aspect [27,28,73,74] is much more effective [71,75,76,77] than the widely accepted tool-centered low-mathability methods. The surface approach methods—focusing on the teaching of how the user interface works, typing spreadsheet tables, browsing wizards and help, coursebooks introducing as many functions as possible, and softwares offering newer and newer functions and features—do not support schema construction. Without schemata built up in the long-term memory, fast and slow thinking [64] cannot be applied effectively [81], which leads to erroneous spreadsheet documents [81,84], and ultimately to serious financial losses, both in human and machine resources [85].
The present study provides the details of the spreadsheet section of a nationwide testing of Grades 7–10 students in Hungary. The test focuses on the students’ problem-solving skills, how knowledge-transfer elements are activated, and which classroom activities form the students’ self-assessment values. The results of three spreadsheet tasks are evaluated by the SOLO categories of understanding, which is a widely accepted method in teaching programming. In accordance with the programming nature of the tasks presented in the test, four levels of both spreadsheeting and self-assessment SOLO categories are set up.
The self-assessment values provided by the students reveal a strong confidence in their spreadsheet knowledge, especially with those students who studied spreadsheeting in school. On the contrary, most of the students’ results based on the three tasks of the test are pre-structural (84.7%), which means that no recognizable pieces of knowledge are present. The students’ results demonstrate that the decontextualized, tool-centered, low-mathability approaches that characterize computer science education are inadequate for developing students’ problem-solving and computational thinking skills [28,41,42,59,62,73,74,75,76,77,78]. Furthermore, in complete accordance with the Dunning–Kruger effect [91], the pre-structural level of understanding (missing the point) prevents students from seeing what they do not know. It is also found that students form their self-assessment values based on the number of different activities carried out in classes, among which typing spreadsheet tables is the most frequent.
Considering the activation of knowledge-transfer items, the results reveal that some pieces from mathematics allow students to reach the relational level of understanding in the specific task. However, hardly any traces of spreadsheet knowledge-transfer are evident, which prevents students from transforming pieces of knowledge from one task to another, or, in other words, from classroom activities to problem-solving, and from knowing the names of functions to applying them at the relational level of understanding.
The results of the test proved that girls performed better than boys did in the programming-oriented spreadsheet problems. This finding, along with previously published similar results, call attention to the negative effect of gender stereotypes, namely that tertiary informatics education suits boys better than girls. The high number of overconfident male students might explain the extremely high attrition rate in informatics education [42]. Based on these findings, the lack of informaticians in the labor market might be improved by encouraging girls to study informatics, as it is expressed in Soloway’s [22] and Ben-Ari’s [24] papers.
At present, studying spreadsheeting seems to be only for the sake of learning how the user interface works, without any meaningful further aims. We can conclude from the results of the test that spreadsheet education at this stage does not support the development of students’ computational thinking and algorithmic skills. As a result, students cannot reach the relational level of understanding, not to mention the extended abstract category, which is one level above relational. One must also note that—contrary to Prensky’s unproven claims considering digital generations [52,53]—even digital children are in great need of educational support. To provide this support, we must have expert teachers [26,40,45] who can break away from the widely accepted tool-centered, low-mathability teaching and testing approaches, and switch to high-mathability problem-solving approaches [29,30,57,58,75,76].
Author Contributions
Conceptualization, T.N. and M.C.; methodology, T.N., M.C. and P.B.; validation, T.N., M.C. and P.B.; formal analysis, T.N., M.C. and P.B.; resources, T.N. and M.C.; data curation, T.N.; writing—original draft preparation, T.N., M.C. and P.B.; writing—review and editing, T.N., M.C. and P.B.; visualization, T.N. and M.C.; supervision, M.C.; project administration, P.B.; funding acquisition, T.N., M.C. and P.B. All authors have read and agreed to the published version of the manuscript.
Funding
This work was supported by the construction EFOP-3.6.3-VEKOP-16-2017-00002. The project was supported by the European Union, co-financed by the European Social Fund.
Institutional Review Board Statement
Ethical review and approval were waived for this study, due to structure of the test, where only the schools are recorded strictly and occasionally the grades.
Informed Consent Statement
Not applicable.
Data Availability Statement
Not applicable.
Conflicts of Interest
The authors declare no conflict of interest.
References
- Zsakó, L. National Base Curriculum 2020. In Hungarian: Informatika Nemzeti Alaptanterv 2020; INFODIDACT 2015; Péter, S., László, Z., Eds.; Webdidaktika Alapítvány: Zamárdi, Magyarország, 2015; Available online: https://people.inf.elte.hu/szlavi/InfoDidact15/Manuscripts/ZsL.pdf (accessed on 16 July 2021).
- Informatics Education in Europe: Are We All in The Same Boat? ACM 2013. Available online: https://www.informatics-europe.org/images/documents/informatics-education-acm-ie.pdf (accessed on 16 July 2021).
- Informatics Education in Europe: Are We All in The Same Boat? ACM 2017. Available online: https://dl.acm.org/doi/pdf/10.1145/3106077 (accessed on 16 July 2021).
- National Base Curriculum 1995. In Hungarian: 130/1995. (X. 26.) Korm. Rendelete a Nemzeti Alaptanterv Kiadásáról, Beveze-téséről és Alkalmazásáról; Korona Kiadó: Budapest, Hungary, 1995; ISBN 963 8153 87 3.
- National Base Curriculum 2009. In Hungarian: 202/2007. (VII. 31.) Korm. Rendelete a Nemzeti Alaptanterv Kiadásáról, Beveze-téséről és Alkalmazásáról. Available online: http://www.nefmi.gov.hu/letolt/kozokt/nat_070926.pdf (accessed on 12 June 2021).
- National Base Curriculum 2012. In Hungarian: 110/2012. (VI. 4.) Korm. Rendelete a Nemzeti Alaptanterv Kiadásáról, Bevezetéséről és Alkalmazásáról. Available online: http://ofi.hu/sites/default/files/attachments/mk_nat_20121.pdf (accessed on 12 June 2021).
- National Base Curriculum 2020. In Hungarian: 5/2020. (I. 31.) Korm. Rendelete a Nemzeti Alaptanterv Kiadásáról, Bevezetéséről és Alkalmazásáról Szóló 110/2012. (VI. 4.). Available online: http://ofi.hu/sites/default/files/attachments/mk_nat_20121.pdf (accessed on 12 June 2021).
- Frame Curricula for Primary School Grades 5–8 Compulsory Subjects 2.2.15. In Hungarian: Kerettanterv az Általános Iskola 5–8. Évfolyamára. Kötelező Tantárgyak 2.2.15. Available online: http://kerettanterv.ofi.hu/02_melleklet_5-8/2.2.15_informat_5-8.doc (accessed on 12 June 2021).
- Frame Curricula for Grammar School Grades 9–12. Compulsory Subjects 3.2.16. In Hungarian: Kerettanterv a Gimnáziumok 9–12. Évfolyama Számára. Kötelező Tantárgyak 3.2.16. Available online: http://kerettanterv.ofi.hu/03_melleklet_9-12/3.2.16_informat_9-12.doc (accessed on 12 June 2021).
- Nagy, T.K. Analyzing the Informatics Frame Curricula. In Hungarian: Az Informatika Kerettanterv Elemzése. 3th International Interdisciplinary Conference 2018. Available online: https://detep.unideb.hu/sites/default/files/upload_documents/kotet_interdisz_3.pdf (accessed on 16 July 2021).
- Nagy, T.K.; Csernoch, M. Measuring the Level of Computer Problem Solving Abilities in Teaching Informatics. In Hungarian: Számítógépes Problémamegoldás Mérése az Informatika órán; Péter, S., László, Z., Eds.; InfoDidact Conference 2018 Budapest; Webdidaktika, Alapítvány: Zamárdi, Magyarország, 2019; Available online: https://people.inf.elte.hu/szlavi/InfoDidact18/Infodidact2018.pdf (accessed on 16 July 2021).
- Nagy, T.K.; Csernoch, M. The Paradox of the Hungarian Frame Curricula in Informatics. In Turkish Online Journal of Educational Technology. INTE 2018. Available online: http://www.tojet.net/special/2018_12_3.pdf (accessed on 16 July 2021).
- Frame Curricula for Primary School Grades 1–4. In Hungarian: Kerettanterv az Általános Iskola 1–4. Évfolyamára. Available online: https://www.oktatas.hu/pub_bin/dload/kozoktatas/kerettanterv/Digitalis_kultura_A.docx (accessed on 16 July 2021).
- Frame Curricula for Primary School Grades 5–8. In Hungarian: Kerettanterv az Általános Iskola 5–8. Évfolyamára. Available online: https://www.oktatas.hu/pub_bin/dload/kozoktatas/kerettanterv/Digitalis_kultura_F.docx (accessed on 16 July 2021).
- Gove, M. Michael Gove Speech at the BETT Show 2012. Published 13 January 2012. Digital Literacy Campaign. Available online: http://www.theguardian.com/education/2012/jan/11/digital-literacy-michael-gove-speech (accessed on 16 July 2021).
- Bell, T.; Newton, H. Unplugging Computer Science. In Improving Computer Science Education; Kadijevich, D.M., Angeli, C., Schulte, C., Eds.; Routledge: London, UK, 2013. [Google Scholar]
- Gander, W. Informatics in Schools?—Urgently Needed! ECSS 2012 20–21 November 2012, Barcelona. Available online: http://www.inf.ethz.ch/personal/gander/talks/GanderECSS2012.pdf (accessed on 17 June 2021).
- Hromkovic, J.; Steffen, B. Why Teaching Informatics in Schools Is as Important as Teaching Mathematics and Natural Sciences? 2011. Available online: http://0-link-springer-com.brum.beds.ac.uk/chapter/10.1007/978-3-642-24722-4_3?no-access=true#page-1 (accessed on 14 June 2021).
- Wing, J.M. Computational thinking. Commun. ACM 2006, 49, 33–35. [Google Scholar] [CrossRef]
- Baranyi, P.; Gilányi, A. Mathability: Emulating and enhancing human mathematical capabilities. In Proceedings of the 2013 IEEE 4th International Conference on Cognitive Infocommunications (CogInfoCom), Budapest, Hungary, 2–5 December 2013; pp. 555–558. [Google Scholar] [CrossRef]
- Baranyi, P.; Csapo, A.; Sallai, G. Cognitive Infocommunications (CogInfoCom); Springer International Publishing: Cham, Switzerland, 2015; p. 191. Available online: http://0-www-springer-com.brum.beds.ac.uk/us/book/9783319196077#aboutBook (accessed on 16 July 2021).
- Soloway, E. Should we teach students to program? Commun. ACM 1993, 36, 21–24. [Google Scholar] [CrossRef]
- Booth, S. Learning to Program: A Phenomenographic Perspective; Acta Universitatis Gothoburgensis: Gothenburg, Sweden, 1992. [Google Scholar]
- Ben-Ari, M. Non-myths about programming. Commun. ACM 2011, 54. [Google Scholar] [CrossRef]
- Mishra, P.; Koehler, M. Technological pedagogical content knowledge: A framework for teacher knowledge. Teach. Coll. Rec. 2006, 108, 1017–1054. [Google Scholar] [CrossRef]
- Chen, J.A.; Morris, D.B.; Mansour, N. Science Teachers’ Beliefs. Perceptions of Efficacy and the Nature of Scientific Knowledge and Knowing. In International Handbook of Research on Teachers’ Beliefs; Fives, H., Gill, M.G., Eds.; Routledge: London, UK, 2015. [Google Scholar]
- Warren, P. Learning to Program: Spreadsheets, Scripting and HCI. In Proceedings of the Sixth Australasian Conference on Computing Education 30, Dunedin, New Zealand, 18–22 January 2004; pp. 327–333. Available online: http://0-dl-acm-org.brum.beds.ac.uk/citation.cfm?id=979968.980012 (accessed on 16 June 2021).
- Sestoft, P. Spreadsheet Technology; Version 0.12 of 2012-01-31; IT University Technical Report ITU-TR-2011-142; IT University of Copenhagen: Copenhagen, Denmark, 2011. [Google Scholar]
- Csernoch, M. Programming with Spreadsheet Functions: Sprego. In Hungarian, Programozás Táblázatkezelő Függvényekkel—Sprego; Műszaki Könyvkiadó: Budapest, Hungary, 2014. [Google Scholar]
- Csernoch, M.; Biró, P. Sprego Programming. Spreadsheets in Education (eJSiE), 2015, Volume 8. Available online: https://sie.scholasticahq.com/article/4638-sprego-programming (accessed on 17 July 2021).
- Aho, A.V. Computation and computational thinking. Comput. J. 2012, 55, 832–835. [Google Scholar] [CrossRef]
- Selby, C.; Woollard, J. Computational Thinking: The Developing Definition. In Proceedings of the ITiCSE Conference, Canterbury, UK, 1–3 July 2013; Available online: https://people.cs.vt.edu/~kafura/CS6604/Papers/CT-Developing-Definition.pdf (accessed on 16 June 2021).
- Mannila, L.; Dagiene, V.; Demo, B.; Grgurina, N.; Mirolo, C.; Rolandsson, L.; Settle, A. Computational thinking in K-9 education. In Proceedings of the Working Group Reports of the 2014 on Innovation & Technology in Computer Science Education Conference, Uppsala, Sweden, 21–25 June 2014; pp. 1–29. [Google Scholar]
- Tedre, M.; Denning, P.J. The long quest for computational thinking. In Proceedings of the 16th Koli Calling International Conference on Computing Education Research, Koli, Finland, 24–27 November 2016; pp. 120–129. [Google Scholar]
- Denning, P.J. Remaining trouble spots with computational thinking. Commun. ACM 2017, 60, 33–39. [Google Scholar] [CrossRef]
- Bower, M.; Wood, L.N.; Lai, J.W.M.; Howe, C.; Lister, R.; Mason, R. Improving the Computational Thinking Pedagogical Capabilities. Aust. J. Teach. Educ. 2017, 42, 53–72. [Google Scholar] [CrossRef] [Green Version]
- Shute, V.J.; Sun, C.; Asbell-Clarke, J. Demystifying computational thinking. Educ. Res. Rev. 2017, 22, 142–158. [Google Scholar] [CrossRef]
- Freiermuth, K.; Hromkovic, J.; Steffen, B. Creating and Testing Textbooks for Secondary Schools. In Proceedings of the 3rd International Conference on Informatics in Secondary Schools—Evolution and Perspectives: Informatics Education—Supporting Computational Thinking; Springer: Berlin/Heidelberg, Germany, 2008. [Google Scholar] [CrossRef]
- Garrett, N. Textbooks for Responsible Data Analysis in Excel. J. Educ. Bus. 2015, 90, 169–174. [Google Scholar] [CrossRef]
- Csernoch, M. Thinking Fast and Slow in Computer Problem Solving. J. Softw. Eng. Appl. 2017, 10, 1–31. [Google Scholar] [CrossRef] [Green Version]
- Biró, P.; Csernoch, M.; Abari, K.; Máth, J. Testing Algorithmic and Application Skills. Turk. Online J. Educ. Technol. Spec. 2015, 536–543. Available online: http://www.tojet.net/special/2015_8_1.pdf (accessed on 18 July 2021).
- Csernoch, M.; Biró, P.; Máth, J.; Abari, K. Testing Algorithmic Skills in Traditional and Non-Traditional Programming Environments. Inform. Educ. 2015, 14, 175–197. [Google Scholar] [CrossRef] [Green Version]
- Angeli, C. Teaching Spreadsheets: A TPCK Perspective. In Improving Computer Science Education; Kadijevich, D.M., Angeli, C., Schulte, C., Eds.; Routledge: London, UK, 2013. [Google Scholar]
- Angeli, C.; Valanides, N. Technological Pedagogical Content Knowledge. Exploring, Developing, and Assessing TPCK; Springer: Boston, MA, USA, 2015. [Google Scholar] [CrossRef]
- Hattie, J. Visible Learning for Teachers: Maximizing Impact on Learning; Routledge: London, UK, 2012. [Google Scholar]
- OECD—PISA 2009 Results: Students on Line: Digital Technologies and Performance, 2011 (Volume VI). Available online: https://www.oecd.org/pisa/pisaproducts/48270093.pdf (accessed on 18 July 2021).
- NJSzT—Nemes Tihamér International Informatics Contest—Programming. In Hungarian: Nemes Tihamér Nemzetközi Informatikai Tanulmányi Verseny—Programozás. 2020. Available online: http://nemes.inf.elte.hu/ (accessed on 15 May 2021).
- NJSzT—Nemes Tihamér International Informatics Contest—Applied Informatics. In Hungarian: Nemes Tihamér Nemzetközi Informatikai Tanulmányi Verseny—Alkalmazás Kategória. 2020. Available online: http://tehetseg.inf.elte.hu/nemesa/index.html (accessed on 16 June 2021).
- Biró, P.; Csernoch, M. Deep and surface metacognitive processes in non-traditional programming tasks. In Proceedings of the 5th IEEE International Conference on Cognitive Info-communications Conference, Vietri sul Mare, Italy, 4–5 November 2014; pp. 49–54. [Google Scholar] [CrossRef]
- Lister, R. After the gold rush: Toward sustainable scholarship in computing. In Proceedings of the Tenth Conference on Australasian Computing Education, Wollongong, Australia, 22–25 January 2008; Volume 78. [Google Scholar]
- Csernoch, M.; Biró, P. Are digital natives spreadsheet natives? In Proceedings of the EuSpRIG 2019 Conference Spreadsheet Risk Management, Nice, France, 27–31 May 2019; pp. 1–12. [Google Scholar]
- Prensky, M. Digital Natives, Digital Immigrants. On the Horizon, MCB University Press, Volume 9, October 2001. Available online: http://www.marcprensky.com/writing/Prensky%20-%20Digital%20Natives,%20Digital%20Immigrants%20-%20Part1.pdf (accessed on 14 June 2020).
- Kirschner, P.A.; De Bruyckere, P. The myths of the digital native and the multitasker. Teach. Teach. Educ. 2017, 67, 135–142. [Google Scholar] [CrossRef]
- Kirschner, P.A.; Sweller, J.; Clark, R.E. Why Minimal Guidance During Instruction Does Not Work: An Analysis of the Failure of Constructivist Discovery, Problem-Based, Experiential, and Inquiry-Based Teaching. Educ. Psychol. 2006, 41, 75–86. [Google Scholar] [CrossRef]
- Sebestyén, K. Can you also Be a Teacher of Informatics(?). Hungarian: Te Is Lehetsz Informatikatanár (?). INFODIDACT 2014: Informatika Szakmódszertani Konferencia (ed. Szlávi Péter, Zsakó László), 2014. 2014. Available online: http://people.inf.elte.hu/szlavi/InfoDidact14/Manuscripts/SK.pdf (accessed on 16 May 2021).
- Csernoch, M.; Biró, P. First year students’ attitude to computer problem solving. In Proceedings of the IEEE 8th International Conference on Cognitive InfoCommunications: CogInfoCom, Debrecen, Hungary, 11–14 September 2017; pp. 225–230. [Google Scholar]
- Biró, P.; Csernoch, M. The mathability of computer problem solving approaches. In Proceedings of the 2015 6th IEEE International Conference on Cognitive Infocommunications (CogInfoCom2015), Gyor, Hungary, 19–21 October 2015; pp. 111–114. [Google Scholar] [CrossRef]
- Biró, P.; Csernoch, M. The mathability of spreadsheet tools. In Proceedings of the 2015 6th IEEE International Conference on Cognitive Infocommunications (CogInfoCom2015), Gyor, Hungary, 19–21 October 2015; pp. 105–110. [Google Scholar] [CrossRef]
- Biró, P.; Csernoch, M. Maths problems in pseudo-codes compared to computer usage. In Proceedings of the END2018: International conference on Education and New Developments, Lisboa, Portugal, 24–26 June 2018; pp. 341–346. [Google Scholar]
- OECD—PISA 2015 Results (Volume I). Excellence and Equity in Education. Published on 6 December 2016. Available online: https://read.oecd.org/10.1787/9789264266490-en?format=pdf (accessed on 10 September 2021).
- OECD—PISA 2018 Results (Volume I). What Students Know and Can Do. Published on 3 December 2019. Available online: https://read.oecd.org/10.1787/5f07c754-en?format=pdf (accessed on 10 September 2021).
- Csernoch, M.; Papp, P. Spreadsheeting is problem solving? In Hungarian: Táblázatkezelés is problémamegoldás? In Proceedings of the InfoDidact Conference, Budapest, Hungary, 18–20 November 2019; pp. 187–202. [Google Scholar]
- Dancsó, T.; Korom, P. Informatics for Grades 9–10. In Hungarian: Informatika 9–10. A Gimnáziumok Számára; Nemzedékek Tudása Tankönyvkiadó (Oktatáskutató és Fejlesztő Intézet): Budapest, Hungary, 2013. [Google Scholar]
- Kahneman, D. Thinking, Fast and Slow; Farrar, Straus and Giroux: New York, NY, USA, 2011. [Google Scholar]
- Sheard, J.; Carbone, A.; Lister, R.; Simon, B.; Thompson, E.; Whalley, J.L. Going SOLO to assess novice programmers. SIGCSE Bull. 2008, 40, 209–213. [Google Scholar] [CrossRef] [Green Version]
- Biggs, J.B.; Collis, K.E. Evaluating the Quality of Learning: The SOLO Taxonomy; Academic Press: New York, NY, USA, 1982. [Google Scholar]
- Social Blade, Top 250 YouTubers in Hungary Sorted by SB Rank, 2018. Available online: https://socialblade.com/youtube/top/country/hu (accessed on 12 May 2021).
- Csernoch, M.; Dani, E. Data-structure validator: An application of the HY-DE model. In Proceedings of the 8th IEEE Inter-national Conference on Cognitive Infocommunications, Debrecen, Hungary, 11–14 September 2017; pp. 197–202. [Google Scholar]
- Csernoch, M. From webtables to datatables. In Proceedings of the EuSpRIG 2019 Conference Spreadsheet Risk Management, Nice, France, 27–31 May 2019; pp. 1–22. [Google Scholar]
- Nagy, T.; Csernoch, M.; Máth, J. Cross-curricular connections and knowledge-transfer elements in data management. Acta Polytech. Hung. 2021. accepted for publication. [Google Scholar]
- Booth, S. Learning to Program: A Phenomenographic Perspective; Goteborg Studies in Educational Sciences 89; Acta Univesitatis Gothoburgenis: Gothenburg, Sweden, 1992. [Google Scholar]
- Burnett, M.M.; Scaffidi, C. End-User Development. In The Encyclopedia of Human-Computer Interaction, 2nd ed.; Interaction Design Foundation: London, UK, 2012; Available online: https://www.interaction-design.org/literature/book/the-encyclopedia-of-human-computer-interaction-2nd-ed/end-user-development (accessed on 14 July 2020).
- Hubwieser, P. Functional Modelling in Secondary Schools Using Spreadsheets. Educ. Inf. Technol. 2004, 9, 175–183. [Google Scholar] [CrossRef]
- Abraham, R.; Burnett, M.; Erwig, M. Spreadsheet Programming. In Wiley Encyclopedia of Computer Science and Engineering; Wiley: Hoboken, NJ, USA, 2009. [Google Scholar] [CrossRef] [Green Version]
- Csapó, G.; Csernoch, M.; Abari, K. Sprego: Case study on the effectiveness of teaching spreadsheet management with schema construction. Educ. Inf. Technol. 2020, 25, 1585–1605. [Google Scholar] [CrossRef] [Green Version]
- Csapó, G.; Sebestyén, K.; Csernoch, M.; Abari, K. Case study: Developing long-term knowledge with Sprego. Educ. Inf. Technol. 2020, 26, 965–982. [Google Scholar] [CrossRef]
- Takács, V.L.; Bubnó, K. Mathability in Business Education. Acta Polytech. Hung. 2021. accepted for publication. [Google Scholar]
- Lister, R.; Simon, B.; Thompson, E.; Whalley, J.L.; Prasad, C. Not seeing the forest for the trees: Novice programmers and the SOLO taxonomy. In Proceedings of the 11th Annual SIGCSE Conference on Innovation and Technology in Computer Science Education, New York, NY, USA, 12–15 March 2006; pp. 118–122. [Google Scholar]
- Ahadi, A.; Lister, R.; Lal, S.; Leinonen, J.; Hellas, A. Performance and Consistency in Learning to Program. In Proceedings of the Nineteenth Australasian Computing Education Conference (ACE ‘17). Association for Computing Machinery, New York, NY, USA, 2–4 February 2017; pp. 11–16. [Google Scholar] [CrossRef] [Green Version]
- Stout, J.; Tamer, B. Collaborative learning eliminates the negative impact of gender stereotypes on women’s self-concept. In Proceedings of the 47th ACM Technical Symposium on Computing Science Education (SIGCSE ‘16). Association for Computing Machinery, New York, NY, USA, 3–5 March 2016; p. 496. [Google Scholar] [CrossRef]
- Osztián, E. Interactive, Multi-Sensory Electronic Teaching-Learning Environment for Developing Computational Thinking Skills. In Hungarian: Interaktív, Többérzékszerves Elektronikus Oktatási Környezet a Számítógépes Gondolkodás Fejlesztéséhez. Ph.D. Dissertation, University of Debrecen, Debrecen, Hungary, 2021. Available online: https://dea.lib.unideb.hu/dea/handle/2437/302091 (accessed on 8 July 2021).
- European Qualifications Framework. Description of the Eight EQF Levels. Available online: https://europa.eu/europass/en/description-eight-eqf-levels (accessed on 10 September 2021).
- Carretero, S.; Vuorikari, R.; Punie, Y. DigComp 2.1 the Digital Competence Framework for Citizens with Eight Proficiency Levels and Examples of Use. Available online: https://op.europa.eu/en/publication-detail/-/publication/3c5e7879-308f-11e7-9412-01aa75ed71a1/language-en (accessed on 10 September 2021).
- Panko, R.; Port, D. End User Computing: The Dark Matter (and Dark Energy) of Corporate It. J. Organ. End User Comput. 2013, 25, 1–19. [Google Scholar] [CrossRef]
- EuSpRIG Horror Stories. European Spreadsheet Risk Interest Group (2021). Available online: http://www.eusprig.org/horror-stories.htm (accessed on 14 June 2021).
- Pólya, G. How To Solve It. A New Aspect of Mathematical Method; (2nd Edition 1957); Princeton University Press: Princeton, NJ, USA, 1954. [Google Scholar]
- Descartes, R.; Lessing, J. Rosenwald Collection, Discours de la Methode Pour Bien Conduire sa Raison, & Chercher la Verité dans les Sciences. Plus La Dioptriqve. Les Meteores. Et La Geometrie. Qui sont des Essais de cete Methode”. A Leyde, De li’mprimerie de I. Maire, 1637. Available online: https://www.loc.gov/item/32034972/ (accessed on 30 January 2021).
- Sweller, J.; Ayres, P.; Kalyuga, S. Cognitive Load Theory. Explorations in the Learning Sciences; Instructional Systems and Performance Technologies; Springer: Berlin, Germany, 2011. [Google Scholar]
- Rother, M. Toyota Kata: Managing People for Improvement, Adaptiveness and Superior Results, 1st ed.; McGraw-Hill Education: New York, NY, USA, 2009. [Google Scholar]
- Panko, R. The Cognitive Science of Spreadsheet Errors: Why Thinking is Bad. In Proceedings of the 2013 46th Hawaii International Conference on System Sciences, Wailea, HI, USA, 7–10 January 2013; Volume 10, pp. 4013–4022. [Google Scholar] [CrossRef]
- Kruger, J.; Dunning, D. Unskilled and Unaware of It: How Difficulties in Recognizing One’s Own Incompetence Lead to Inflated Self-Assessments. J. Personal. Soc. Psychol. 1999, 77, 1121–1134. [Google Scholar] [CrossRef]
Figure 1.
The results of PISA 2009: Students On Line. The red rectangle highlights the results of Hungarian students.
Figure 1.
The results of PISA 2009: Students On Line. The red rectangle highlights the results of Hungarian students.

Figure 2.
Boring and useless tasks from the official course book of informatics [63] to teach mathematical operators.
Figure 2.
Boring and useless tasks from the official course book of informatics [63] to teach mathematical operators.

Figure 3.
Boring and useless tasks from the official course book of informatics [63] to teach spreadsheet functions.
Figure 3.
Boring and useless tasks from the official course book of informatics [63] to teach spreadsheet functions.

Figure 4.
Checking the syntactical awareness of students with two uncompleted spreadsheet formulae.

Figure 5.
The solutions of the formula completion task. In Hungarian Excel, instead of a comma, a semi-colon is used to separate the two arguments (right).
Figure 5.
The solutions of the formula completion task. In Hungarian Excel, instead of a comma, a semi-colon is used to separate the two arguments (right).

Figure 6.
Task for deciding on the execution order of the expression.

Figure 7.
A sample table and an array formula are presented to answer the “What does the formula do?” question. The formula in Hungarian is {=SZUM(HA(BAL(A2:A251)=“L”;1))}.
Figure 7.
A sample table and an array formula are presented to answer the “What does the formula do?” question. The formula in Hungarian is {=SZUM(HA(BAL(A2:A251)=“L”;1))}.

Figure 8.
The comparison of the results of girls and boys in Grades 7–10. (a) Formula completion; (b) execution order; and (c) array formula.
Figure 8.
The comparison of the results of girls and boys in Grades 7–10. (a) Formula completion; (b) execution order; and (c) array formula.


Figure 9.
The results of the formula completion task in Groups Studied and DidNotStudy.

Figure 10.
The results of the execution order task in Groups Studied and DidNotStudy.

Figure 11.
The results of those students who scored at least one item in the formula completion task.
Figure 11.
The results of those students who scored at least one item in the formula completion task.

Figure 12.
The results of those students who scored at least one item in the execution order task.

Figure 13.
Self-assessment in relation to studying spreadsheet management in school.

Figure 14.
The SOLO categories in Grades 7–10 assigned to the self-assessment values.

Figure 15.
The cumulative SOLO categories assigned to the self-assessment values.

Figure 16.
The number of students from those who listed at least one string, writing 0–15 correct functions.
Figure 16.
The number of students from those who listed at least one string, writing 0–15 correct functions.

Figure 17.
The number of students from those who listed at least one string, writing 0–15 correct functions in Groups Studied and DidNotStudy.
Figure 17.
The number of students from those who listed at least one string, writing 0–15 correct functions in Groups Studied and DidNotStudy.

Figure 18.
The students’ results in the three tasks, evaluated by the spreadsheet SOLO categories of understanding.
Figure 18.
The students’ results in the three tasks, evaluated by the spreadsheet SOLO categories of understanding.

Figure 19.
The students’ results evaluated by the cumulative SOLO categories.

Figure 20.
The frequency of correct functions in the groups based on the self-assessment values (0–5).
Figure 20.
The frequency of correct functions in the groups based on the self-assessment values (0–5).


Table 1.
The number of lessons assigned to the subject of informatics per week according to the national base curricula since 1995 [4,5,6,7].
| Grades | |||||||||||||
|---|---|---|---|---|---|---|---|---|---|---|---|---|---|
| 1. | 2. | 3. | 4. | 5. | 6. | 7. | 8. | 9. | 10. | 11. | 12. | Sum | |
| 1995 | no classes are given, only intervals compared to other subjects | ||||||||||||
| 2009 | 0.5 | 1 | 0.5 | 1 | 1 | 1 | 1.5 | 1 | 1.5 | 1 | 10 | ||
| 2012 | – | – | – | – | – | 1 | 1 | 1 | 1 | 1 | – | – | 5 |
| 2020 | – | – | 1 | 1 | 1 | 1 | 1 | 1 | 2 | 1 | 2 | – | 11 |
Table 2.
SOLO categories assigned to the items of the formula completion task.
| Score | SOLO Category |
|---|---|
| 8 | relational |
| 7 | relational |
| 6 | multi-structural |
| 5 | uni-structural |
| 4 | uni-structural |
| 3, if there is one reference operator, one closing parenthesis, and one explanation (only the equal sign is missing from one of the formulae) | uni-structural |
| 4, if only two equal signs and two closing parentheses are given | pre-structural |
| 3 | pre-structural |
| 2 | pre-structural |
| 1 | pre-structural |
| 0 | pre-structural |
Table 3.
The solution of the sequence/order task.
| Step 1 | Calculating the Average or Calling the AVERAGE() Function |
|---|---|
| Step 2 | subtracting 50 from the average or subtracting |
| Step 3 | asking a yes/no question: the difference is less than 50? or asking a question |
| Step 4 | calling the IF() function |
Table 4.
The SOLO categories assigned to the items of the order of execution task.
| Score | SOLO Category |
|---|---|
| 6 | relational |
| 5, if the first or the last item is listed as first or last (the placement of the first or the last step is not correct) | relational |
| 5 | multi-structural |
| 4 | uni-structural |
| 3 | uni-structural |
| 2, if these two items arrive from steps (items 2–4) | uni-structural |
| 2 | pre-structural |
| 1 | pre-structural |
| 0 | pre-structural |
Table 5.
The answers to the array formula task with the points and the SOLO categories assigned to the answers.
Table 5.
The answers to the array formula task with the points and the SOLO categories assigned to the answers.
| Statement | Score | SOLO Category |
|---|---|---|
| the number of usernames starting with the character L (or l) | 4 | relational |
| counts | 3 | multi-structural |
| calculates a sum with L | 3 | multi-structural |
| calculates a sum | 2 | uni-structural |
| starting with L (or l) | 1 | uni-structural |
| 1 character from left | 1 | pre-structural |
| description of a loop | 1 | pre-structural |
| tried to solve it but the solution is pre-structural | 0 | pre-structural |
| claiming the formula is incorrect | 0 | pre-structural |
Table 6.
The number of students who studied spreadsheet management in school (Studied), did not study spreadsheet management in school (DidNotStudy), or did not answer the question (NoAnswer).
Table 6.
The number of students who studied spreadsheet management in school (Studied), did not study spreadsheet management in school (DidNotStudy), or did not answer the question (NoAnswer).
| Grade | |||||
|---|---|---|---|---|---|
| 7 | 8 | 9 | 10 | Total | |
| Studied | 981 | 1439 | 2423 | 2043 | 6886 |
| DidNotStudy | 444 | 72 | 277 | 126 | 919 |
| NoAnswer | 136 | 128 | 265 | 183 | 712 |
| 1561 | 1639 | 2965 | 2352 | 8517 | |
Table 7.
Students’ results in the three spreadsheet tasks in Grades 7–10.
| Grades | ||||||
|---|---|---|---|---|---|---|
| Task | 7 | 8 | 9 | 10 | Average | Max |
| formula completion | 0.75 | 1.28 | 1.28 | 1.79 | 1.32 | 8 |
| execution order | 0.54 | 0.89 | 0.74 | 1.21 | 0.86 | 6 |
| array formula | 0.08 | 0.14 | 0.15 | 0.29 | 0.18 | 4 |
Table 8.
In the formula completion task, the relationship between the closing parentheses of the formulas—1st) and 2nd)—and the other items: equal sign, reference operator, and reference.
Table 8.
In the formula completion task, the relationship between the closing parentheses of the formulas—1st) and 2nd)—and the other items: equal sign, reference operator, and reference.
| 2nd) | 1st = | 1st ref. op. | 1st reference | |
| 1st) | 0.707 | 0.451 | 0.820 | 0.323 |
| 1st) | 2nd = | 2nd ref. op. | 2nd reference | |
| 2nd) | 0.707 | 0.508 | 0.549 | 0.324 |
Table 9.
Boys’ and girls’ results in the three tasks.
| Boys | Girls | All | |
|---|---|---|---|
| formula completion | 1.23 | 1.43 | 1.32 |
| execution order | 0.81 | 0.92 | 0.86 |
| array formula | 0.17 | 0.18 | 0.18 |
Table 10.
Students’ results in the formula completion tasks in Grades 7–10.
| Total | 7 | 8 | 9 | 10 | |
|---|---|---|---|---|---|
| All | 1.32 | 0.75 | 1.28 | 1.28 | 1.79 |
| Studied | 1.52 | 1.06 | 1.37 | 1.42 | 1.96 |
| DidNotStudy | 0.27 | 0.16 | 0.44 | 0.32 | 0.44 |
| NoAnswer | 0.82 | 0.40 | 0.79 | 1.02 | 0.87 |
Table 11.
Students’ results in the execution order tasks in Grades 7–10.
| Total | 7 | 8 | 9 | 10 | |
|---|---|---|---|---|---|
| All | 0.86 | 0.54 | 0.89 | 0.74 | 1.21 |
| Studied | 0.99 | 0.78 | 0.95 | 0.82 | 1.33 |
| DidNotStudy | 0.14 | 0.09 | 0.26 | 0.17 | 0.17 |
| NoAnswer | 0.56 | 0.29 | 0.58 | 0.62 | 0.66 |
Table 12.
The SOLO categories of the self-assessment values compared to the levels of proficiency in PISA 2018 [61].
Table 12.
The SOLO categories of the self-assessment values compared to the levels of proficiency in PISA 2018 [61].
| Score | SOLO Category | Levels of Science Proficiency in PISA 2018 |
|---|---|---|
| 5 | relational or extended abstract | explain unfamiliar and more complex phenomena |
| 4 | multi-structural | two or more independent variables |
| 3 | uni-structural | moderately complex content knowledge |
| 2 | uni-structural | everyday content knowledge and basic procedural knowledge |
| 1 | pre-structural | low achievers |
| 0 | pre-structural |
Table 13.
The number of students writing 0–15 correct functions.
| Grades | ||||||
|---|---|---|---|---|---|---|
| 7 | 8 | 9 | 10 | Total | ||
| Number of functions | 0 | 43 | 49 | 102 | 95 | 289 |
| 1 | 71 | 92 | 65 | 49 | 277 | |
| 2 | 116 | 99 | 84 | 56 | 355 | |
| 3 | 57 | 150 | 105 | 103 | 415 | |
| 4 | 95 | 162 | 138 | 168 | 563 | |
| 5 | 33 | 194 | 168 | 131 | 526 | |
| 6 | 11 | 72 | 104 | 149 | 336 | |
| 7 | 16 | 45 | 100 | 128 | 289 | |
| 8 | 11 | 28 | 94 | 96 | 229 | |
| 9 | 4 | 25 | 90 | 82 | 201 | |
| 10 | 4 | 16 | 51 | 64 | 135 | |
| 11 | 1 | 14 | 24 | 64 | 103 | |
| 12 | 0 | 10 | 26 | 40 | 76 | |
| 13 | 1 | 3 | 18 | 37 | 59 | |
| 14 | 0 | 2 | 29 | 33 | 64 | |
| 15 | 0 | 7 | 57 | 120 | 184 | |
Table 14.
The number of SOLO triads assigned to the cumulative SOLO categories.
| Cumulative SOLO Category | Number of SOLO Triads |
|---|---|
| P | 5 |
| U | 22 |
| M | 33 |
| R | 4 |
Table 15.
The SOLO categories of the self-assessment values compared to the results of the students.
Table 15.
The SOLO categories of the self-assessment values compared to the results of the students.
| A-P | A-U | A-M | A-R | |
|---|---|---|---|---|
| R-P | 586 | 2235 | 2199 | 1700 |
| R-U | 9 | 190 | 320 | 270 |
| R-M | 5 | 93 | 161 | 192 |
| R-R | 0 | 8 | 18 | 15 |
Table 16.
Relationship between the results and the number of correct and listed functions.
| Task | Relationship | |
|---|---|---|
| Correct Functions | Listed Functions | |
| formula completion | 0.436 | 0.427 |
| execution order | 0.423 | 0.415 |
| array formula | 0.223 | 0.223 |
Publisher’s Note: MDPI stays neutral with regard to jurisdictional claims in published maps and institutional affiliations. |
© 2021 by the authors. Licensee MDPI, Basel, Switzerland. This article is an open access article distributed under the terms and conditions of the Creative Commons Attribution (CC BY) license (https://creativecommons.org/licenses/by/4.0/).
Share and Cite
MDPI and ACS Style
Nagy, T.; Csernoch, M.; Biró, P. The Comparison of Students’ Self-Assessment, Gender, and Programming-Oriented Spreadsheet Skills. Educ. Sci. 2021, 11, 590. https://0-doi-org.brum.beds.ac.uk/10.3390/educsci11100590
AMA Style
Nagy T, Csernoch M, Biró P. The Comparison of Students’ Self-Assessment, Gender, and Programming-Oriented Spreadsheet Skills. Education Sciences. 2021; 11(10):590. https://0-doi-org.brum.beds.ac.uk/10.3390/educsci11100590
Chicago/Turabian StyleNagy, Tímea, Mária Csernoch, and Piroska Biró. 2021. "The Comparison of Students’ Self-Assessment, Gender, and Programming-Oriented Spreadsheet Skills" Education Sciences 11, no. 10: 590. https://0-doi-org.brum.beds.ac.uk/10.3390/educsci11100590
Note that from the first issue of 2016, this journal uses article numbers instead of page numbers. See further details here.