Article

A Framework for Identifying Sequences of Interactions That Cause Usability Problems in Collaborative Systems

by
Santos Bringas
1,*,†,
Rafael Duque
2,†,
Alicia Nieto-Reyes
2,
Cristina Tîrnăucă
2 and
José Luis Montaña
2
1
Fundación Centro Tecnológico de Componentes CTC, 39011 Santander, Spain
2
Department of Mathematics, Statistics and Computer Science, Universidad de Cantabria, 39005 Santander, Spain
*
Author to whom correspondence should be addressed.
These authors contributed equally to this work.
Submission received: 22 December 2020 / Revised: 27 January 2021 / Accepted: 3 February 2021 / Published: 5 February 2021

Abstract

:
Collaborative systems support shared spaces, where groups of users exchange interactions. In order to ensure the usability of these systems, an intuitive interactions’ organization and that each user has awareness information to know the activity of others are necessary. Usability laboratories allow evaluators to verify these requirements. However, laboratory usability evaluations can be problematic for reproducing mobile and ubiquitous contexts, as they restrict the place and time in which the user interacts with the system. This paper presents a framework for building software support that it collects human–machine interactions in mobile and ubiquitous contexts and outputs an assessment of the system’s usability. This framework is constructed through learning that is based on neural networks, identifying sequences of interactions related to usability problems when users carry out collaborative activities. The paper includes a case study that puts the framework into action during the development process of a smartphone application that supports collaborative sport betting.

1. Introduction and Motivation

Current software methodologies promote user participation to evaluate the prototypes generated in each iteration of the life cycle development [1]. This user feedback is a valuable source of information for eliciting and validating requirements. In order to obtain an evaluation of requirements related to the interaction with the system, the users can experiment with the usage of the system and indicate their degree of satisfaction [2]. The observations that evaluators make of this usage of the system are also a valuable source of information, as it allows them to identify problems and give support to the user.
Thanks to new interaction paradigms that are based on mobile and ubiquitous computing, systems can be used at any time from anywhere. Thus, laboratory usability evaluations do not reproduce these mobile and ubiquitous contexts, as the place and time in which the user interacts with the system is restricted. Evaluations in real contexts should enable the user to choose the places and moments to interact with the system under evaluation. However, the evaluations in these real contexts make it difficult for the evaluators to observe the user’s interactions. A solution for this is to use software support that collects human–machine interactions and outputs information on the user behaviour and produces an assessment of the system’s usability [3].
These usability problems can be caused not only by visual issues of the user interface (widgets, colors, etc.) [4], but also by an organization of tasks and activities that are not adapted to the user’s mental model. Task analysis is a widely used technique in the field of Human–Computer Interaction that generates task models [5] that describe the activities supported by interactive systems. Therefore, usability evaluations supported by software tools [3] should integrate mechanisms that observe user interactions and perform an analysis that determines to what extent the task model is adapted to the natural behavior of the user.
Sometimes the sequences of activities of the task model are carried out in collaboration with other users (exchange of messages in a chat, coordination of activities in a calendar, collaborative editors, etc.). In this context, a lack of effectiveness of the features that should enable the users to collaborate in the shared spaces of the system. In a more specific way, a user can have difficulties to collaborate with other users in the following two situations: (i) synchronous collaboration, the users are simultaneously interacting in the same space and (ii) asynchronous collaboration, a user starts a work session and should be aware of the previous interactions of other users in the shared spaces while he/she was disconnected from the system. Awareness information allows for a user to be aware of the activities of others. The content of this information depends on the type of collaborative activities (synchronous or asynchronous) that are carried out by users. For this reason, one challenge that arises is building software, to support evaluations, which identifies the type of collaborative activity of the users (synchronous or asynchronous) and verifies that the awareness mechanisms ensure the system’s usability.
This paper proposes a framework for identifying usability problems in performing a sequence of interactions that can involve collaboration with other users. This framework is based on a three stage procedure: (i) define a model of the interactions supported by the system and how they are sequenced to carry out the user tasks; (ii) learn a neural network model that predicts usability metrics values using only information of the interactions that were performed by real users; and (iii) use the neural network model to identify the sequence of interactions that leads to usability problems, because of not being adapted to the individual or collaborative behaviour of the users.
The remainder of this article is organized, as follows. Section 2 reviews the main contributions related to automatic analysis of usability problems. Section 3 describes our framework for carrying out the evaluations. Section 4 discusses a case study, in which the framework has been applied to evaluate a smartphone application that supports collaborative sports betting. Section 5 analyzes the conclusions that are drawn from this work.

2. Background and Work of Others

ISO/IEC 25010 product quality model defines usability as "the degree to which a product or system can be used by specified users to achieve specified goals with effectiveness, efficiency, and satisfaction in a specified context of use". The usability evaluation methods are usually classified into four categories [6]: (i) heuristic methods—one or more experts inspect the system to find usability problems, (ii) observation methods—information related to users interacting with the system is collected, (iii) surveys—users answer questionnaires and/or interviews, and (iv) experimental methods—usability laboratories and software support, such as logging tools are used. The experimental methods can save the evaluator’s effort by applying support that automatically stores the user interactions and calculates usability metrics. Thus, data mining-based techniques [7] can be applied to process log files and output information that analyzes these characteristics of effectiveness, efficiency, and satisfaction. In most cases, there is a correlation between the subjective metrics that assess user satisfaction and objective metrics of the user performance that can be calculated from log repositories, according to Nielsen and Levy [8]. MINE RULE [9] is a data mining language that supports queries to identify usage patterns (navigation paths, frequently visited user interfaces, etc.) that are to be analyzed. Harms and Grabowski [10] present a proposal that processes log files, generates task trees with the user actions, and identifies usability smells. The values that these usability metrics take must be interpreted in such a way that they have an impact on the next set of iterations of the software development process. In the case of mobile and ubiquitous computing, these experimental methods must be applied in tests that reproduce the physical and social context in which the system under evaluation will be used. For this reason, Kjeldskov and Stage [11] describe a framework that studies the impact of physical motion on the usability of mobile systems. Moumane et al. [12] propose a framework for calculating the usability metrics in mobile environments while using ISO 9241 [13] and ISO 25062 [14] standards as references.
The values that usability metrics take may indicate problems in interacting with the system. However, the evaluators must carry out the task of looking for the causes of these problems. Formal methods can automate the identification of problems with the organization of the sequences of interactions supported by the system. These methods are a set of well-defined mathematical languages and techniques for the specification, modelling, and verification of systems [15]. Several notations, like CTT (Concur Task Trees) [16], GOMS (Goals, Operators, Methods, and Selection Rules) [17], EOFM (Enhanced Operator Function Model) [18], and HAMSTER [19] have been proposed to specify the task models. Propp et al. [20] plan usability evaluations that include test cases in which the users should perform all of the activities in the task model. There, user interactions are analyzed by evaluators who do not use automatic software support. Lecerof and Paternò [21] propose an evaluation method while using the CTT notation that quantifies the difficulties of performing the task model activities (activities that are never performed, failures to follow the sequence of activities, etc.). In a similar way, the EOFM [18] notation is used for evaluation purposes to identify user behaviors that had not been expected. The task models can be updated with the results of these evaluations [22]. Martinie et al. [23] enriched the HAMSTER task modeling notation [19] to introduce usability-related concepts, like the complexity or information workload that is associated with a task.
Martinez et al. [24] define collaborative interaction that is supported by groupware as “an action that affects or can affect the collaborative process. The main requirement for an action to be considered a possible interaction is that the action itself or its effect can be perceived by at least a member of the group distinct of the one that performed the action”. One of the first usability studies of groupware systems found how awareness mechanisms had a clear influence on usability [25]. Awareness information usually provides information of shared workspace state and social interactions between users [26]. Berkman et al. [27] propose a measurement model for assessing the usability of shared workspace systems, which include variables that measure quality of awareness of collaborative interactions. Geszten et al. [28] described a method to study, in usability laboratories, the relation between awareness mechanisms and usability problems. Pinelle et al. [29] have proposed a specific task analysis technique for collaborative systems, called Collaboration Usability Analysis (CUA). This technique enables evaluators to simulate the realistic ways of carrying out a collaborative task and identifying usability problems with the user interface. In order to avoid these usability problems, the collaborative user interfaces should show awareness information that enables the users to know the activities of others [30]. A traditional taxonomy that classifies the collaborative systems into synchronous and asynchronous has been used to understand the mechanisms to show the information of others [31]. Thus, Chounta and Avouris [32] point out that synchronous collaboration requires that user interfaces show real-time information of the interactions of other users. However, asynchronous collaborative systems do not provide real-time information on the actions of other users, although they should describe the progressive modifications of shared spaces over a long period of time [33]. A collaborative system can combine both synchronous and asynchronous interactions.
Nowadays, it is possible to apply artificial intelligence, due to its great evolution, to software engineering and the evaluation of applications and systems. Actually, there exists methods that take advantage of artificial intelligence techniques to evaluate the usability of a system or an application. Some of these works present decision support systems to help evaluators identify critical points in the analyzed systems [34]; others incorporate machine learning algorithms, which are based on neural networks, to improve the evaluation process through the analysis of the interactions with the system [35]. Machine learning models can be used to process different user interactions. These data will be composed of the succession of actions made during the user interaction, in the form of time series. Some works proposed in recent years have obtained promising results using One-Dimensional Convolutional Neural Networks (1D-CNNs) to analyze time series data in very different domains. Bringas et al. [36] presents a 1D-CNN to process data from accelerometers to predict Alzheimer’s disease stage. Abdeljaber et al. [37] propose an adaptative 1D-CNN to detect structural damage by analyzing the vibration of the materials. Lee et al. [38] use 1D-CNNs to recognize human activities through the analysis of triaxial accelerometers. Our work proposes a framework to identify usability problems that are related to sequences of interactions that can imply collaboration between users, both synchronously and asynchronously. A 1D-CNN is presented to analyze the retrieved data from user and, thus, give a prediction of the usability attributes that are established in the general framework.

3. Framework

This section shows our framework proposal for identifying sequences of interactions that cause usability problems. This framework is based on a process of three phases:
  • A task model represents the system and sequences of interactions to be evaluated.
  • A neural network performs a learning task to predict the level of usability while using the interactions performed by the users. A machine learning procedure processes a log repository with sequences of interactions performed by real users of the system. This log repository also includes evaluations of the users that assess their experiences with the system in performing these sequence of interactions.
  • The obtained neural network is used to generate usability predictions from new sequences of interactions.
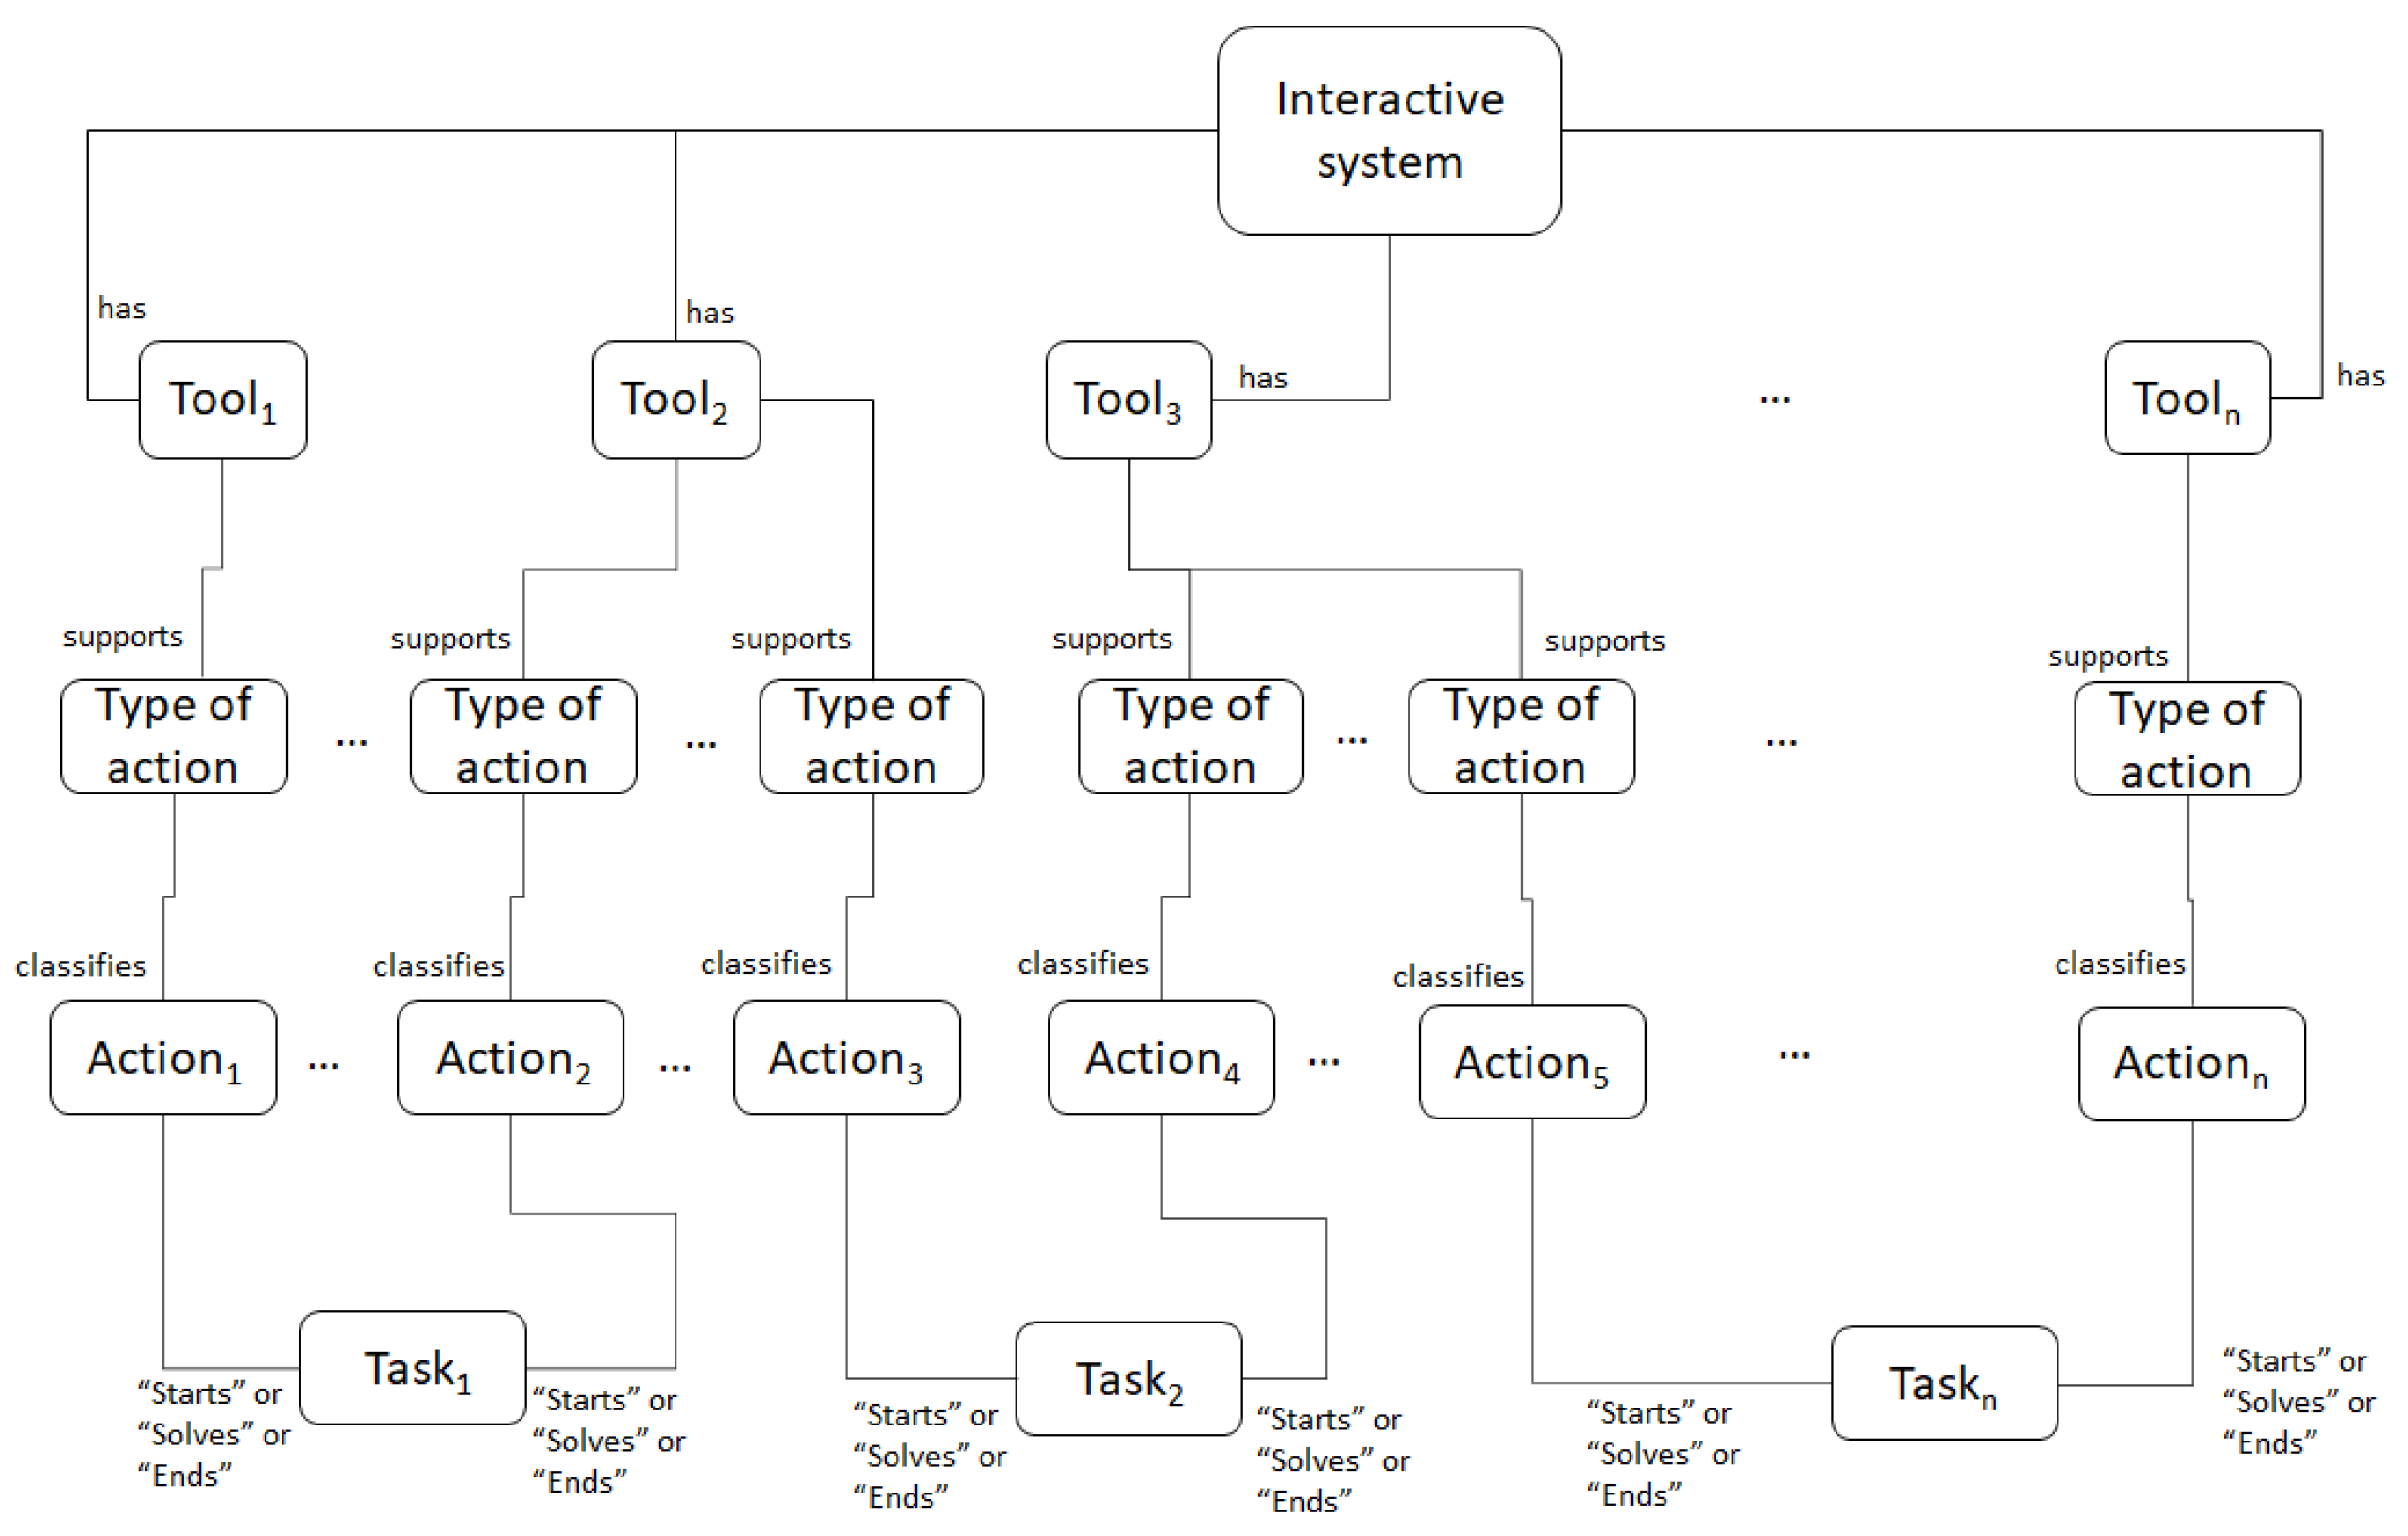
3.1. Task Model

The objective of this phase is to generate a model of the actions supported by an interactive system and how they can be sequenced by the user. The framework processes this model in order to extract information of the actions that are supported by the system under evaluation. The model consists of the following four types of elements:
  • Interactive system: it enables the interaction between humans and computers.
  • Tool: component of the interactive system that supports interactions with the users.
  • Action: cognitive or physical act of the user that changes the state of the interactive system or uses information provided by a system tool.
  • Task: a set of actions that have a common goal.
These elements are represented and related in a hierarchical structure of four levels (see Figure 1). The root element of the structure defines the interactive system to be evaluated. The second hierarchical level is made up of the tools integrated in the system (for example, a chat, an editor, a toolbar, etc.).
The evaluators classify the actions that are supported by each tool at the third level of the hierarchy. This classification is based on a dual model of the process of interaction [39], in which a set of users can participate. This dual model includes a relational space in which users perform actions to interact with other users and a content space, in which users perform actions to carry out a task. The actions of the relational space are classified as communicative or protocol-based. An action is considered to be communicative when there is an exchange of messages between participants. Although the protocol-based action does not imply a dialogue between participants, it does help to coordinate or harmonize the collaborative process; for instance, by means of voting for a proposal. Actions in the content space are classified as instrumental or cognitive. Instrumental actions interact with an element of a workspace (modifying a document in an editor or inserting cells on a spreadsheet, for example.). Cognitive actions do not modify any element. However, a cognitive action can use an element of a workspace for other purposes, for instance, making a personal copy of it.
Finally, the fourth level of the hierarchy includes the name of each action. Moreover, a set of temporal relationships are used to describe how the actions contribute to carrying out each task. The concept of task is considered to be a part of the interaction process that produces some artefacts or results of interest. For this, each action can be related to a task using the following relationships: (i) start relationship, an action is performed by the user when he/she starts a new task; (ii) end relationship, the action implies that a task is finished, and (iii) solve relationship, an action helps to solve a task, but it does not start or end the task.

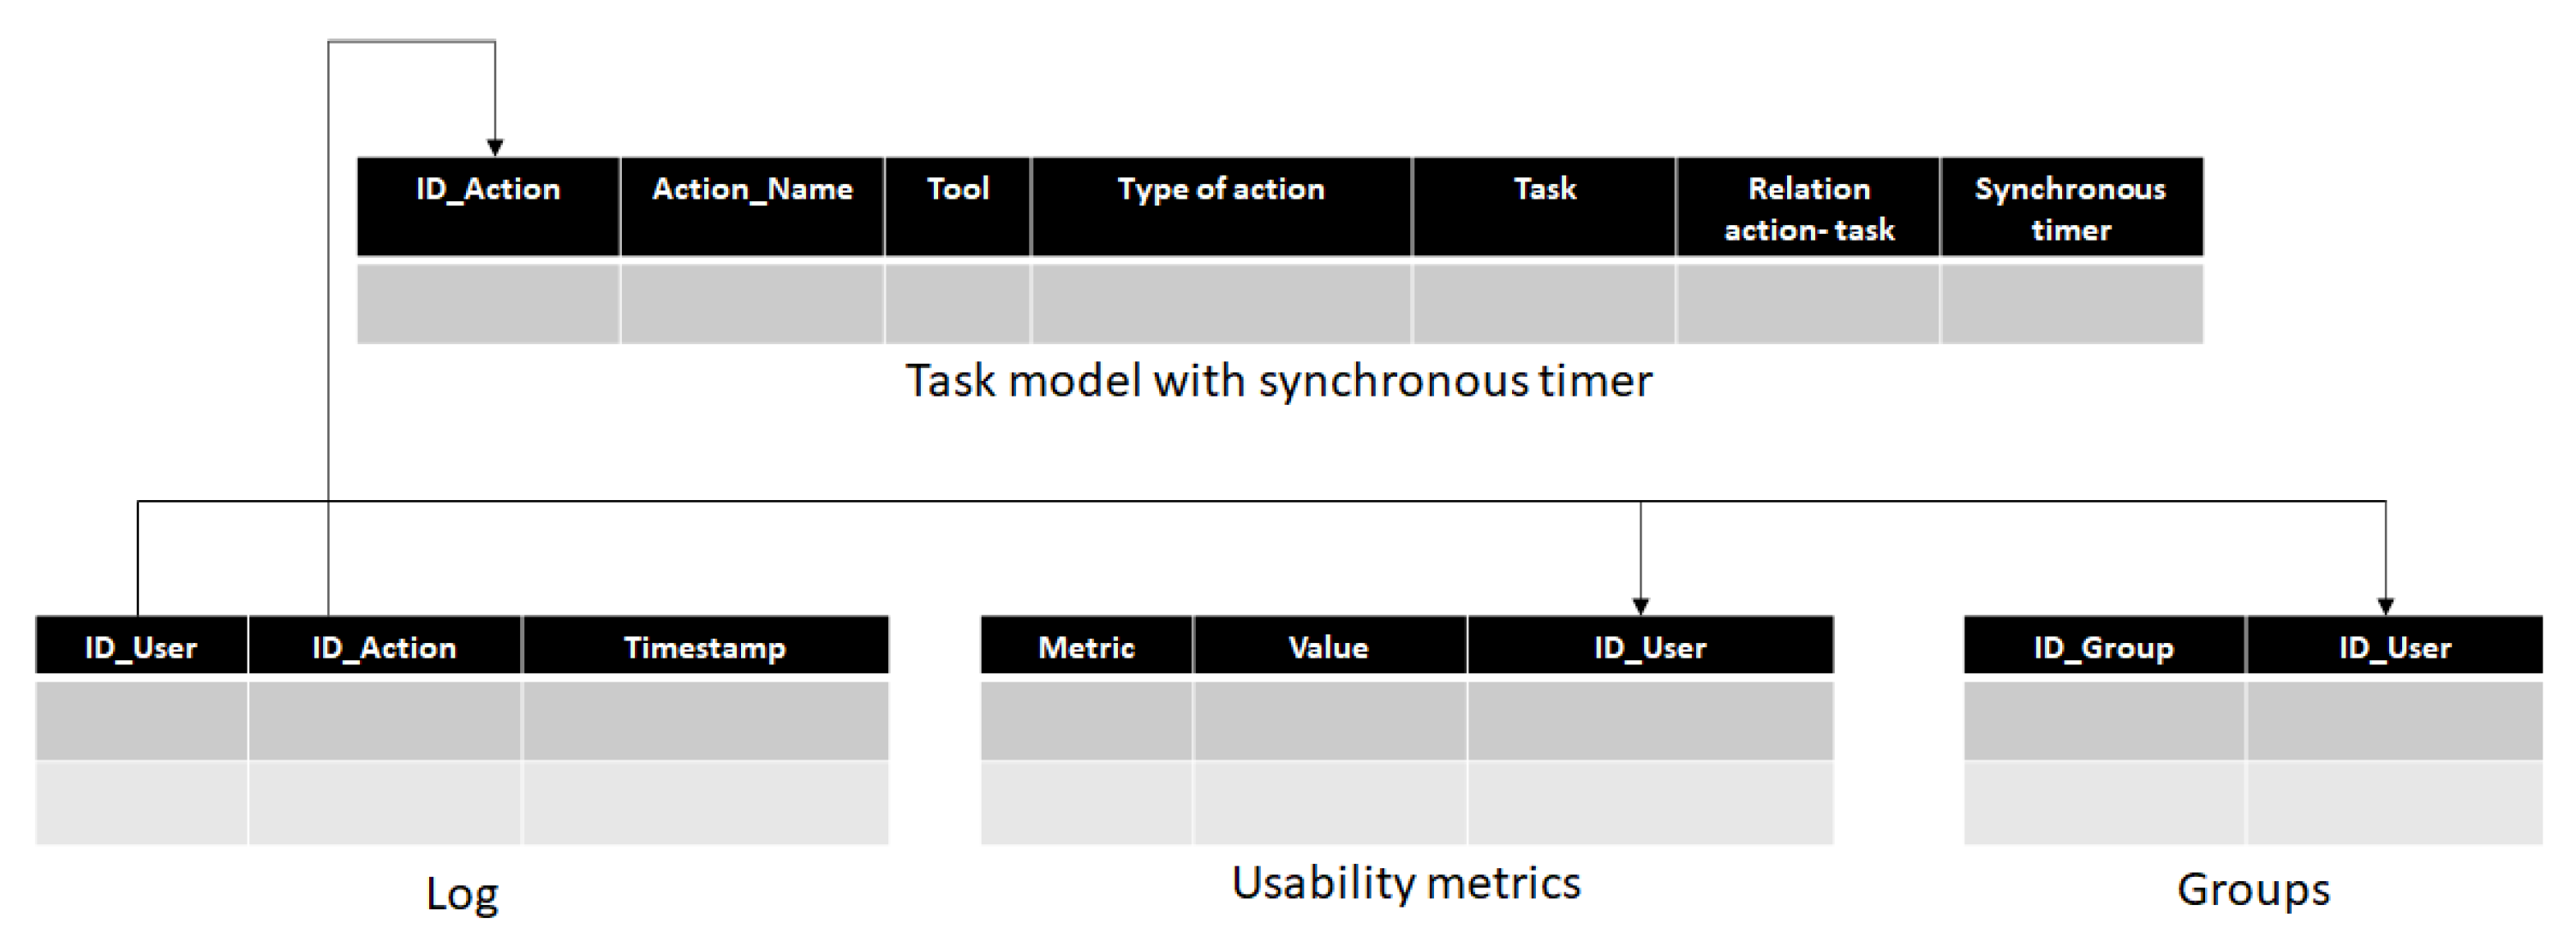
3.2. Data Collection from User Interactions

The framework makes use of an information repository that consists of four elements (see Figure 2):
  • Log files: the users’ interactions are collected with their timestamps (one per action).
  • Usability metrics: in order to measure the usability of the system, several metrics can be used. The framework used the following five usability metrics that can take numerical values (from 1, worst value, to 5, best value):
    Execution Speed: time required to carry out the tasks in the system
    Error rate: number of mistakes during the interaction process
    Ease of learning: effort to learn how to use the system
    Memory load: ease of remembering how to use the system
    Satisfaction: degree of pleasure in using the system
  • Composition of the user group: it provides information on the composition of user groups that have been created to collaborate through the system. A users’ group consists of users who interact with each other using communicative or protocol-based actions.
  • Task model with time intervals to discriminate synchronous and asynchronous collaboration: based on the analysis that was carried out and described previously, a task model classifies the different actions into communicative, protocol-based, cognitive, and instrumental. Communicative and protocol-based ones are sequenced in a synchronous or asynchronous collaborative way, depending on the time interval between the interactions of different users of the same group. The user of the framework must define a maximum time interval in order to consider a sequence of two interactions as synchronous. For example, a chat system for sharing opinions can be transformed into a (sort of) forum if the users do not respond within a short period of time. Thus, if users expect quick responses from other users, they may lose interest in the application, which alters their perception of this functionality.
In order to generate this information, it is necessary that the system integrates mechanisms that collect user interactions and generate log files. In addition, user participation is necessary to quantify the metric values after interacting with the system. Some of the users are asked to give their opinion, in a range between 1 and 5, regarding the selected usability attributes. The procedure to select these users is detailed below in Section 3.3.2 (alpha and beta users). The evaluator must identify the time intervals that allow for discriminating each collaborative action (protocol-based or communicative) for the cases in which the following interactions occur fast enough to consider them as a synchronous sequence.

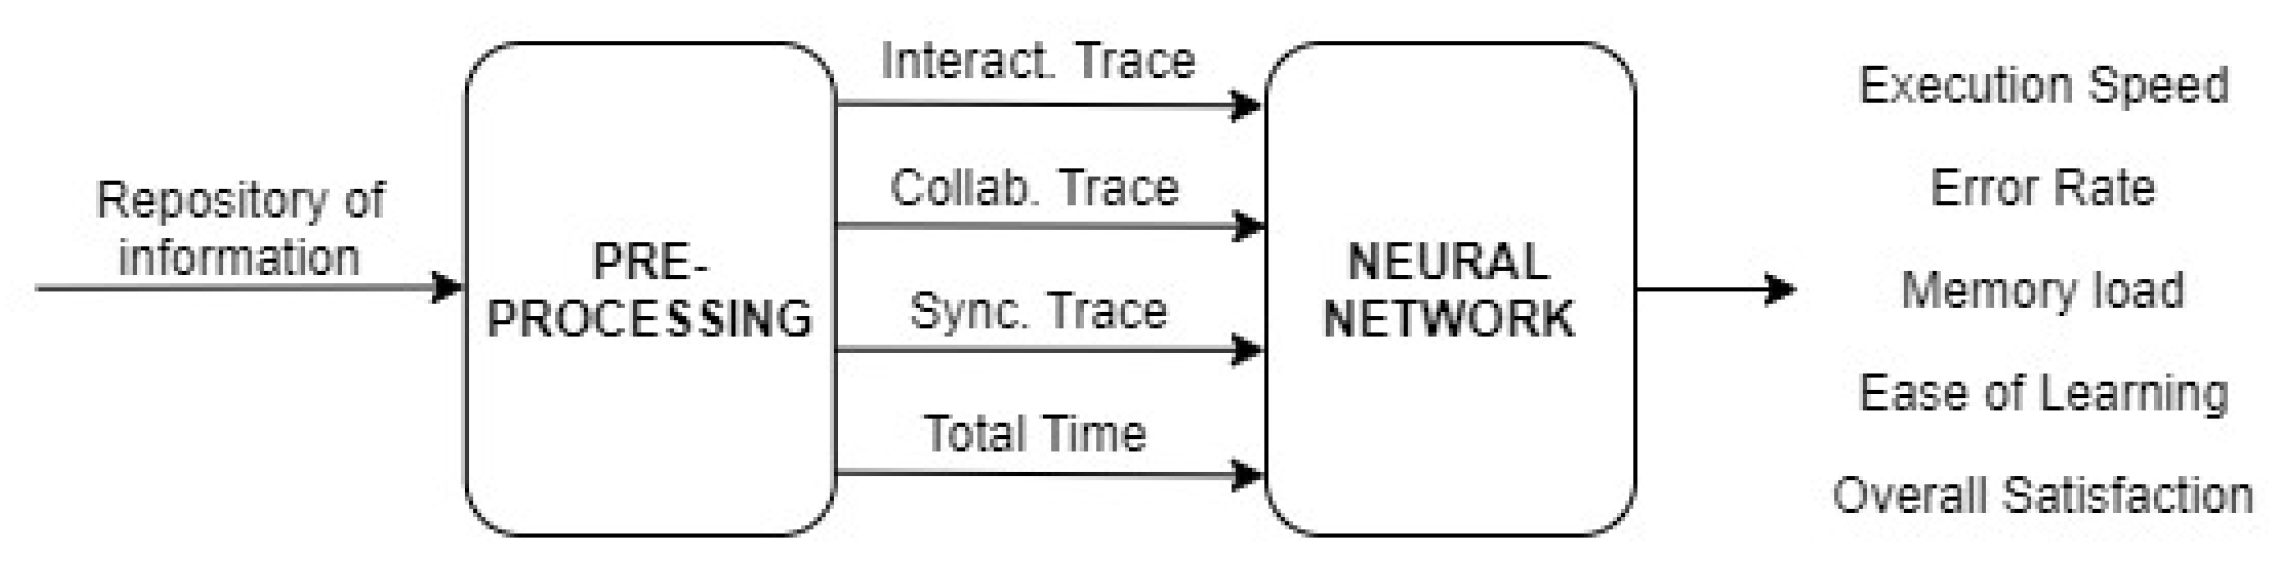
3.3. Usability Prediction

Finally, after having created a model that describes the actions that users can perform in the application and obtaining a dataset relating user action’s traces with usability attributes, a machine learning model can be designed and trained with these data. This model will learn the relations among the sequences of specific actions, collaborative actions, synchronous actions, and the total time spent using the app, in order to predict the usability of the system, based on the feedback given by the users.
It is necessary that all entries have the same format and form in order to make a correct design of the neural network to take advantage of this data. This implies the following:
  • Traces are generated with the same task model.
  • Traces are in numerical format, as most machine learning systems only allow for numerical data as inputs (integers or decimals). This can be done by relating each action to a number.
  • Traces have the same length. This can be solved in two ways: (i) determine a maximum number of interactions and cut out the longest ones, or (ii) match all traces to the longest one with zero-padding (add zeros at the end until the length is the desired one). This last option is used in this work.
Thus, a preprocessing step is needed to formalize all of the input data for the selected machine learning model. This preprocessing is explained in Section 3.3.1, as well as the proposed 1D-Convolutional Neural Network that is used to conduct the data analysis.

3.3.1. Data Preprocessing

The framework processes the log repository to generate the following three traces:
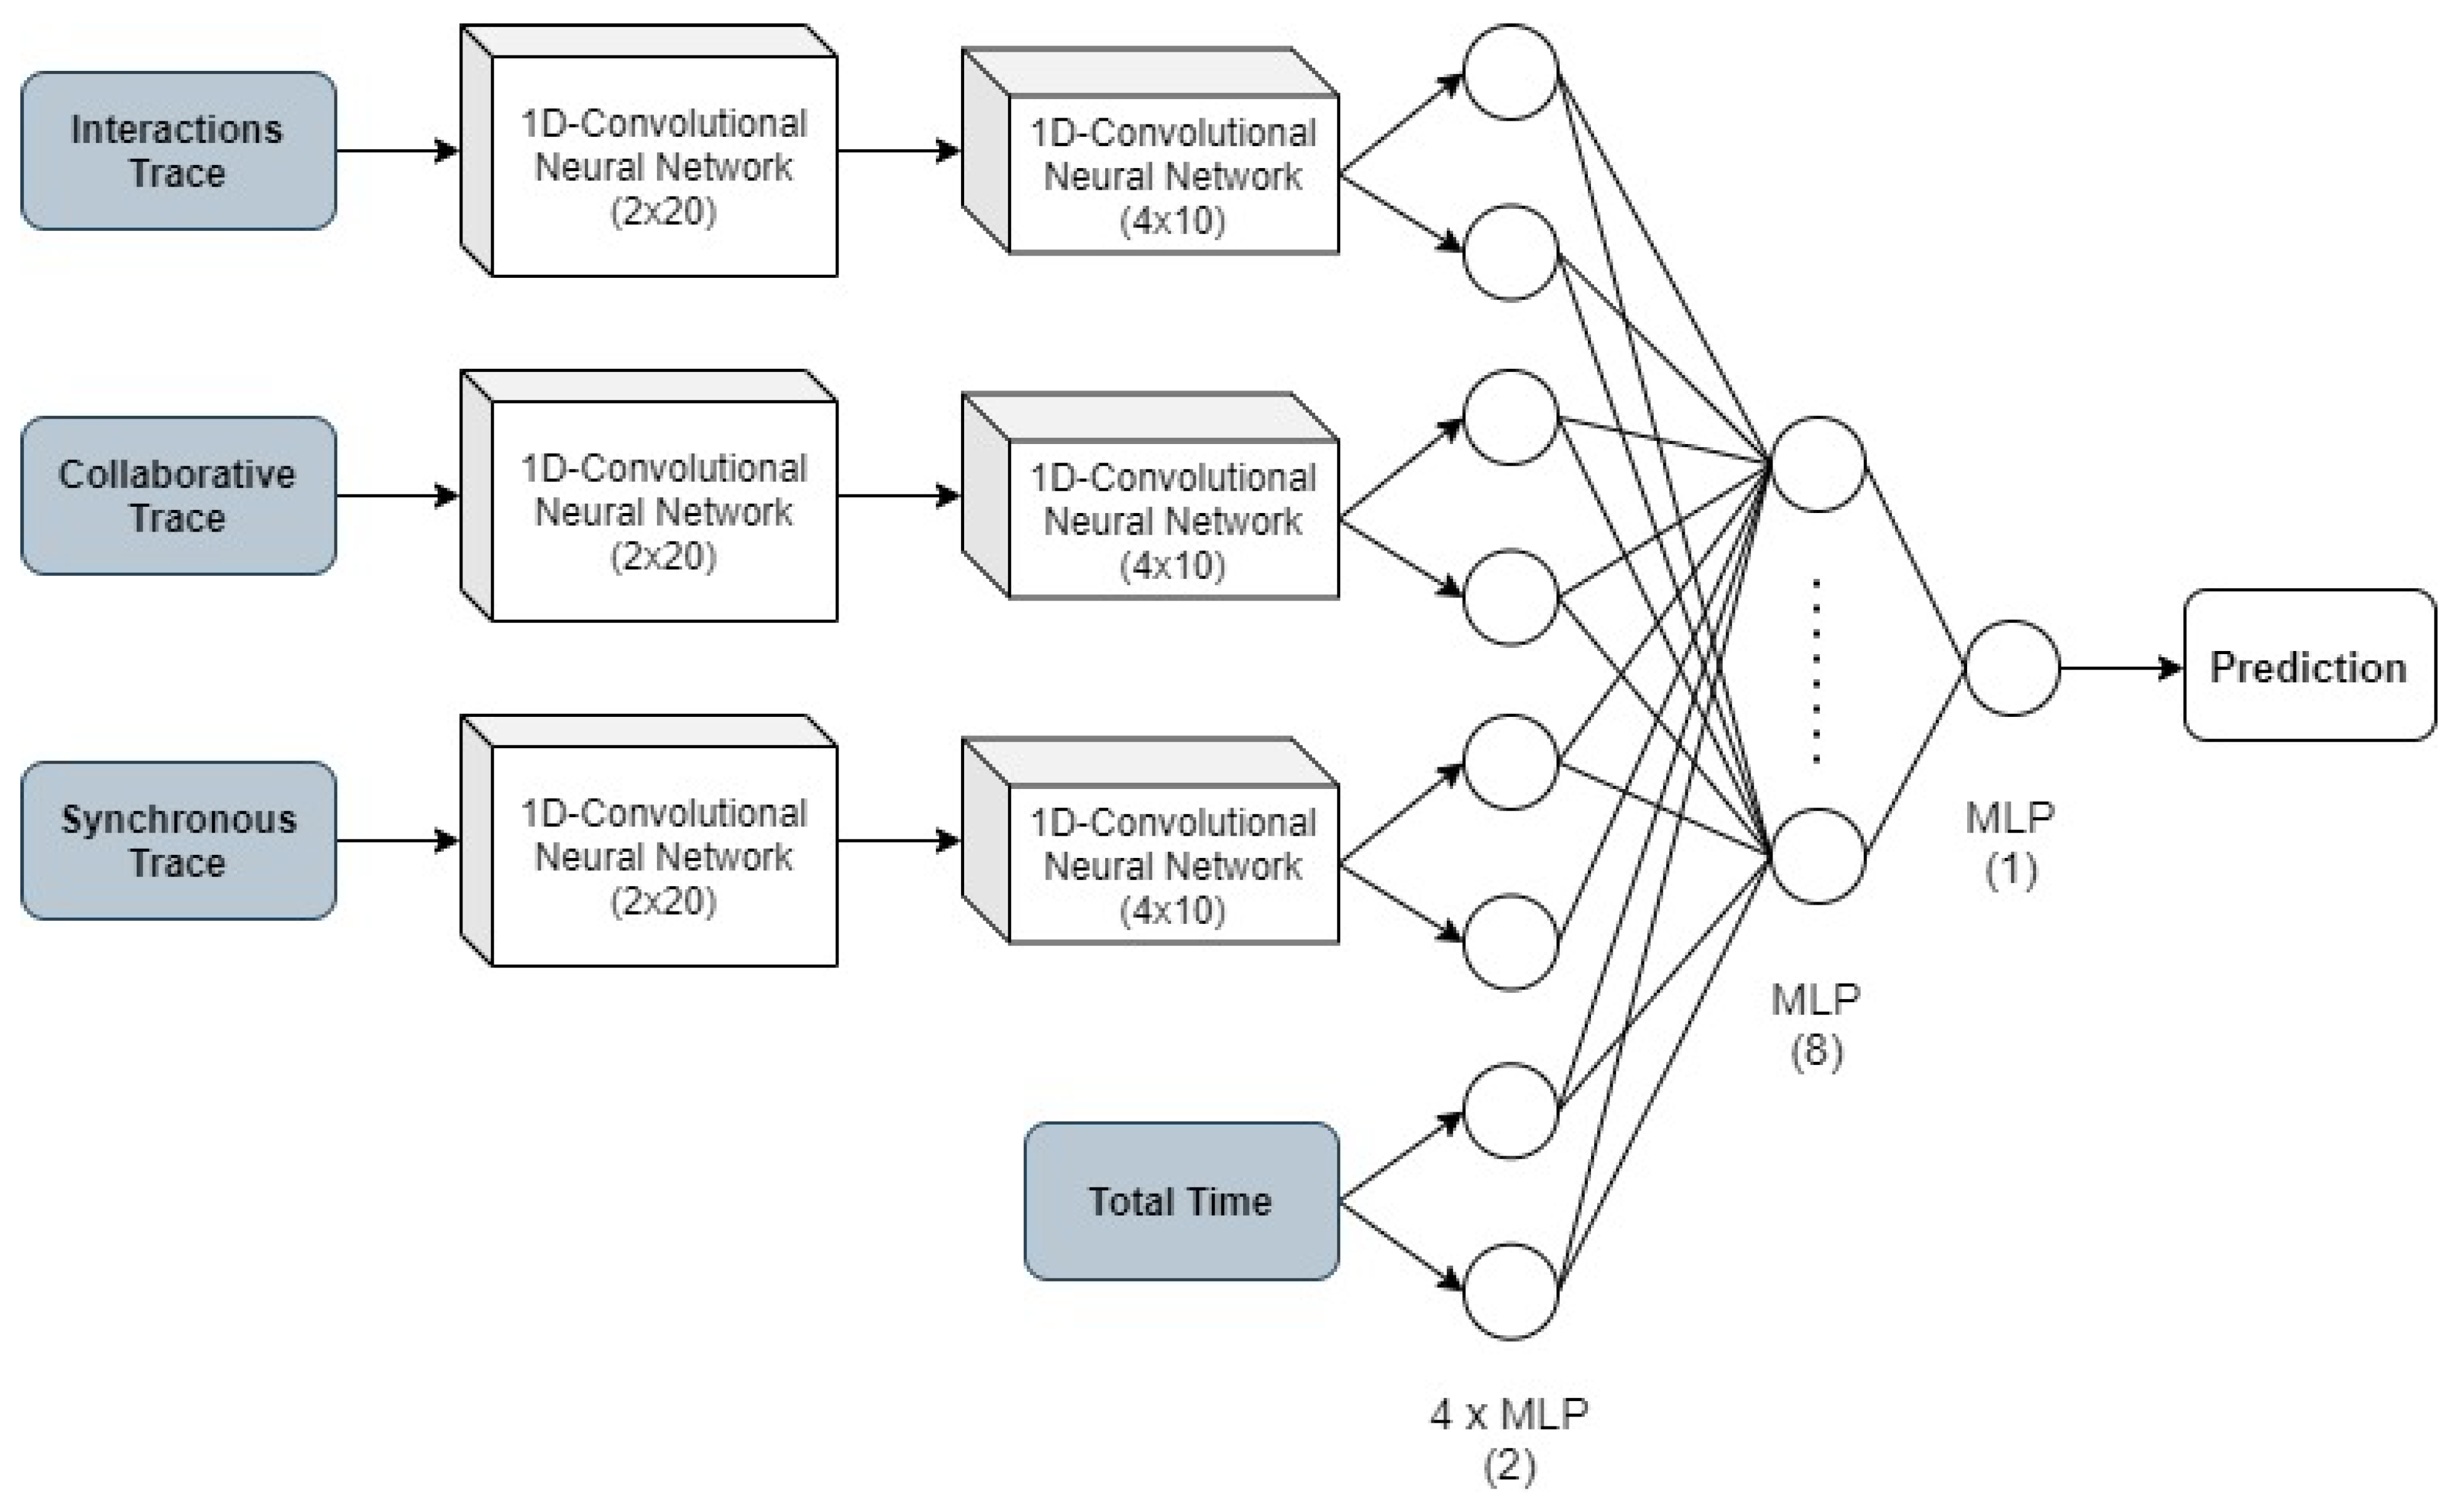
  • Trace of interactions: it collects the identifiers of the interactions that are performed by each user. These identifiers are unique values that identify an action performed by the user (for example, accessing a section of the app or sending a message to another user). These identifiers are set during the task model analysis.
  • Trace of collaborative actions: it collects whether each user interaction is collaborative (they are boolean values). These are generated with the task model and the interactions’ trace, determining whether an action is collaborative or not.
  • Trace of synchronous actions: it registers whether the collaborative user interactions are sequenced into the synchronous interval (they are boolean values). These are generated with the task model and the interactions’ trace, determining whether an action is synchronous or not.
Table 1 shows an example of these three traces. They have the same length and order, since the collaborative and synchronous traces are generated from the interactions trace, analyzing each action of the trace one-by-one. To complement this, the total time of the user interaction process is obtained. These different traces and the total time spent using the app serves as input for the intelligent system proposed: an artificial neural network. For each one of the different metrics, there must be a different neural network, which is trained in an independent process. In this case, there will be five different networks, one for each usability attribute established. Figure 3 shows the complete diagram.

3.3.2. Proposed Neural Network

The three traces need a higher pre-processing than the time datum due to their length. Because of that, a One-Dimensional Convolutional Neural Network (1D-CNN) has been chosen to process these inputs. CNNs are specialized in analyzing images, although they have also been used with time series data, since they work with the data locally, computing adjacent variables jointly.
Many recent examples have taken advantage of 1D Convolutional Neural Networks to undertake data analysis similar to those proposed, obtaining excellent results [36,37,38]. Therefore, we have chosen this option for the implementation of the machine learning system to process the information.
This work proposes a simple architecture that uses the three sequence of traces as well as the total time of execution of the user as inputs. This network can be used for the analysis of different applications, if traces and times are obtained in the same way, performing the indicated pre-processing. In addition, this type of network allows for a transfer of knowledge (called Transfer Learning) between already trained networks, taking advantage of a network trained for a similar problem, avoiding the tedious time of configuring and training the net and obtaining acceptable results. Moreover, because the network starts from a better state, it will converge earlier than if it starts from a random state.
Figure 4 shows the proposed network. The four different inputs (three traces and the time datum) are initially analyzed separately in their respective subnets. Each one of these four inputs will be individually and independently analyzed, having the network four parts (or heads) on the first layers. Each one of these parts will extract the relevant information of the (respective) input data and, in the final layers, join all in a single vector of information, process it, and then give a final prediction. Each of the three traces is analyzed by two 1D-CNN layers, which will extract information while taking the location of these data into account and reducing the dimensionality of them in the process. After that, a fully connected layer is linked to each one of the four heads to compress the information and characteristics obtained to a few neurons. Finally, two more layers are added to process that information and give a final prediction with a single neuron. The prediction is a single float number in the range determined by user scores (for example, 1–5).
Once again, it should be noted that a simple machine learning model is proposed, so that it can be trained quickly and without requiring large computer resources. The purpose of this is that it can be widely used for the analysis of the usability of applications, serving as support for app developers and evaluators. A more complex model can be used, using the proposed one as a reference, if it is considered that the application used or the data obtained are more complex, thus increasing the number of neurons or layers of the model.
To train the system, the user of the framework must divide the original dataset into alpha and beta users, similar to how the division train/test is performed for common machine learning applications. The alpha users will be used to perform the network training, while the beta users will be used to obtain the final results. The criteria to select these users are open, although it is recommended to make the groups in two batches: the first people to use the app will be the alpha users, who will be asked for their opinion on the five usability metrics after the trial; the following users will be the beta users. All of the users’ activities will be monitored in order to obtain the necessary traces for the proposed analysis. Another option is to ask for the opinion of random users, with these being the alpha users and the rest beta users.
Because the prediction is a simple regression, the proposed metric is the Mean Absolute Error (MAE), but other metrics that are used in similar problems may be used, such as Mean Squared Error, Log Error, etc. To know whether the trained model has learned well or not, the framework uses the Zero-Rule. The Zero-Rule is based on returning, as a prediction, the predominant class (the most repeated) in the training data set and calculating the error metric with the test set, which is, the difference between the prediction (predominant class in training) and the actual value. A baseline metric is obtained by averaging these errors in absolute value.
These metrics will serve as a baseline for the trained model, and the predicted metric should be considerably better than this baseline. After performing a network training with the obtained data, there are three different scenarios, depending on whether the system learns well or not from the data (with the alpha users) and if the predicted results (with the beta users) are correct or not, based on the Zero-Rule base metrics:
  • The system does not learn from the data or, in other words, it does not predict well: this can be due the to lack of data in the system, so more data are needed (thus, collecting more data is required). If after collecting a large amount of data, the error is still high, the system cannot learn from this data. It can be deduced that users (even very similar ones) gave very different answers for this usability attribute.
  • The system learns well from the data, which is, the obtained error is low. Two cases can occur:
    A high value is predicted: this means that the system, for the analyzed usability attribute, has a high value that translates into a good user experience.
    A low value is predicted: in this case, it can be deduced that the users have not had a good experience using the application (within that usability attribute), so that the scope must be improved. For example, if the usability attribute Memory load has a low predicted value the developers should improve the structure of the application to favor a better navigation through the application to improve the learning process of the interface, its elements, and internal links.
The main characteristic that stands out in the choice of neural networks is their capacity to adapt to any problem and obtain good results with little adjustment, and more so in the case of networks with few layers (without being shallow networks). Transfer Learning can be used to reduce training times and improve the convergence, so weights that are learned in this work can be used for other applications.
The framework incorporates the tool that was developed by Tîrnăucă et al. [40] to visualize through graphs those sequences of interactions performed by users that would be associated with poor usability levels according to the prediction of the neural network. In this way, the user of the framework can observe the sequences of interactions that are related to these low levels of usability.

4. Application of the Framework

This section describes a case study in which the framework is used to carry out an evaluation of the usability of a mobile system supporting collaborative sports betting. Figure 5 (left panel) shows the main user interface of this system. The system manages a list of sports events on which the user places bets. Subsequently, the user requests the collaboration of a group of users to predict the result of the sport event and to discuss the amount of money to bet. For this purpose, the system includes a voting panel (see the center panel of Figure 5) that enables the user to propose an amount of money to bet and a prediction of the result of the sports event. The other group members vote on the panel as to whether to accept or reject the proposal. When each member of the group accepts the proposal, the result automatically appears on the list of the user’s bets. A structured chat is also available for users to exchange ideas regarding the best way to generate a bet (see right panel of Figure 5). This chat offers a set of predefined conversational acts, but users have the possibility of creating their own messages. The features of these tools are described in an interactive tutorial (see the left panel of Figure 5).

4.1. Task Analysis

The first step in the use of the framework was to define a task model whose root element identifies the sports betting system. The second level of the hierarchy integrates the six tools or spaces in the system (see Table 2): (i) the tool to propose a new bet, (ii) the list of the user’s bets, (iii) the voting panel, (iv) the structured chat, (v) the space to create new groups, and (vi) the tutorial. The actions that are supported by the structured chat are classified as communicative, because they enable the users to exchange messages and the actions supported by the voting tool as protocol-based, as they are used to reach an agreement regarding the bets. When the users come to an agreement, the system automatically performs an instrumental action that creates a new bet in the space of the user bets. The actions that are supported by the new group space are classified as protocol-based, as they enable the users to reach an agreement about the composition of a new group. The tutorial supports a cognitive action that enables the users to know the application features. The task model includes the two following tasks:
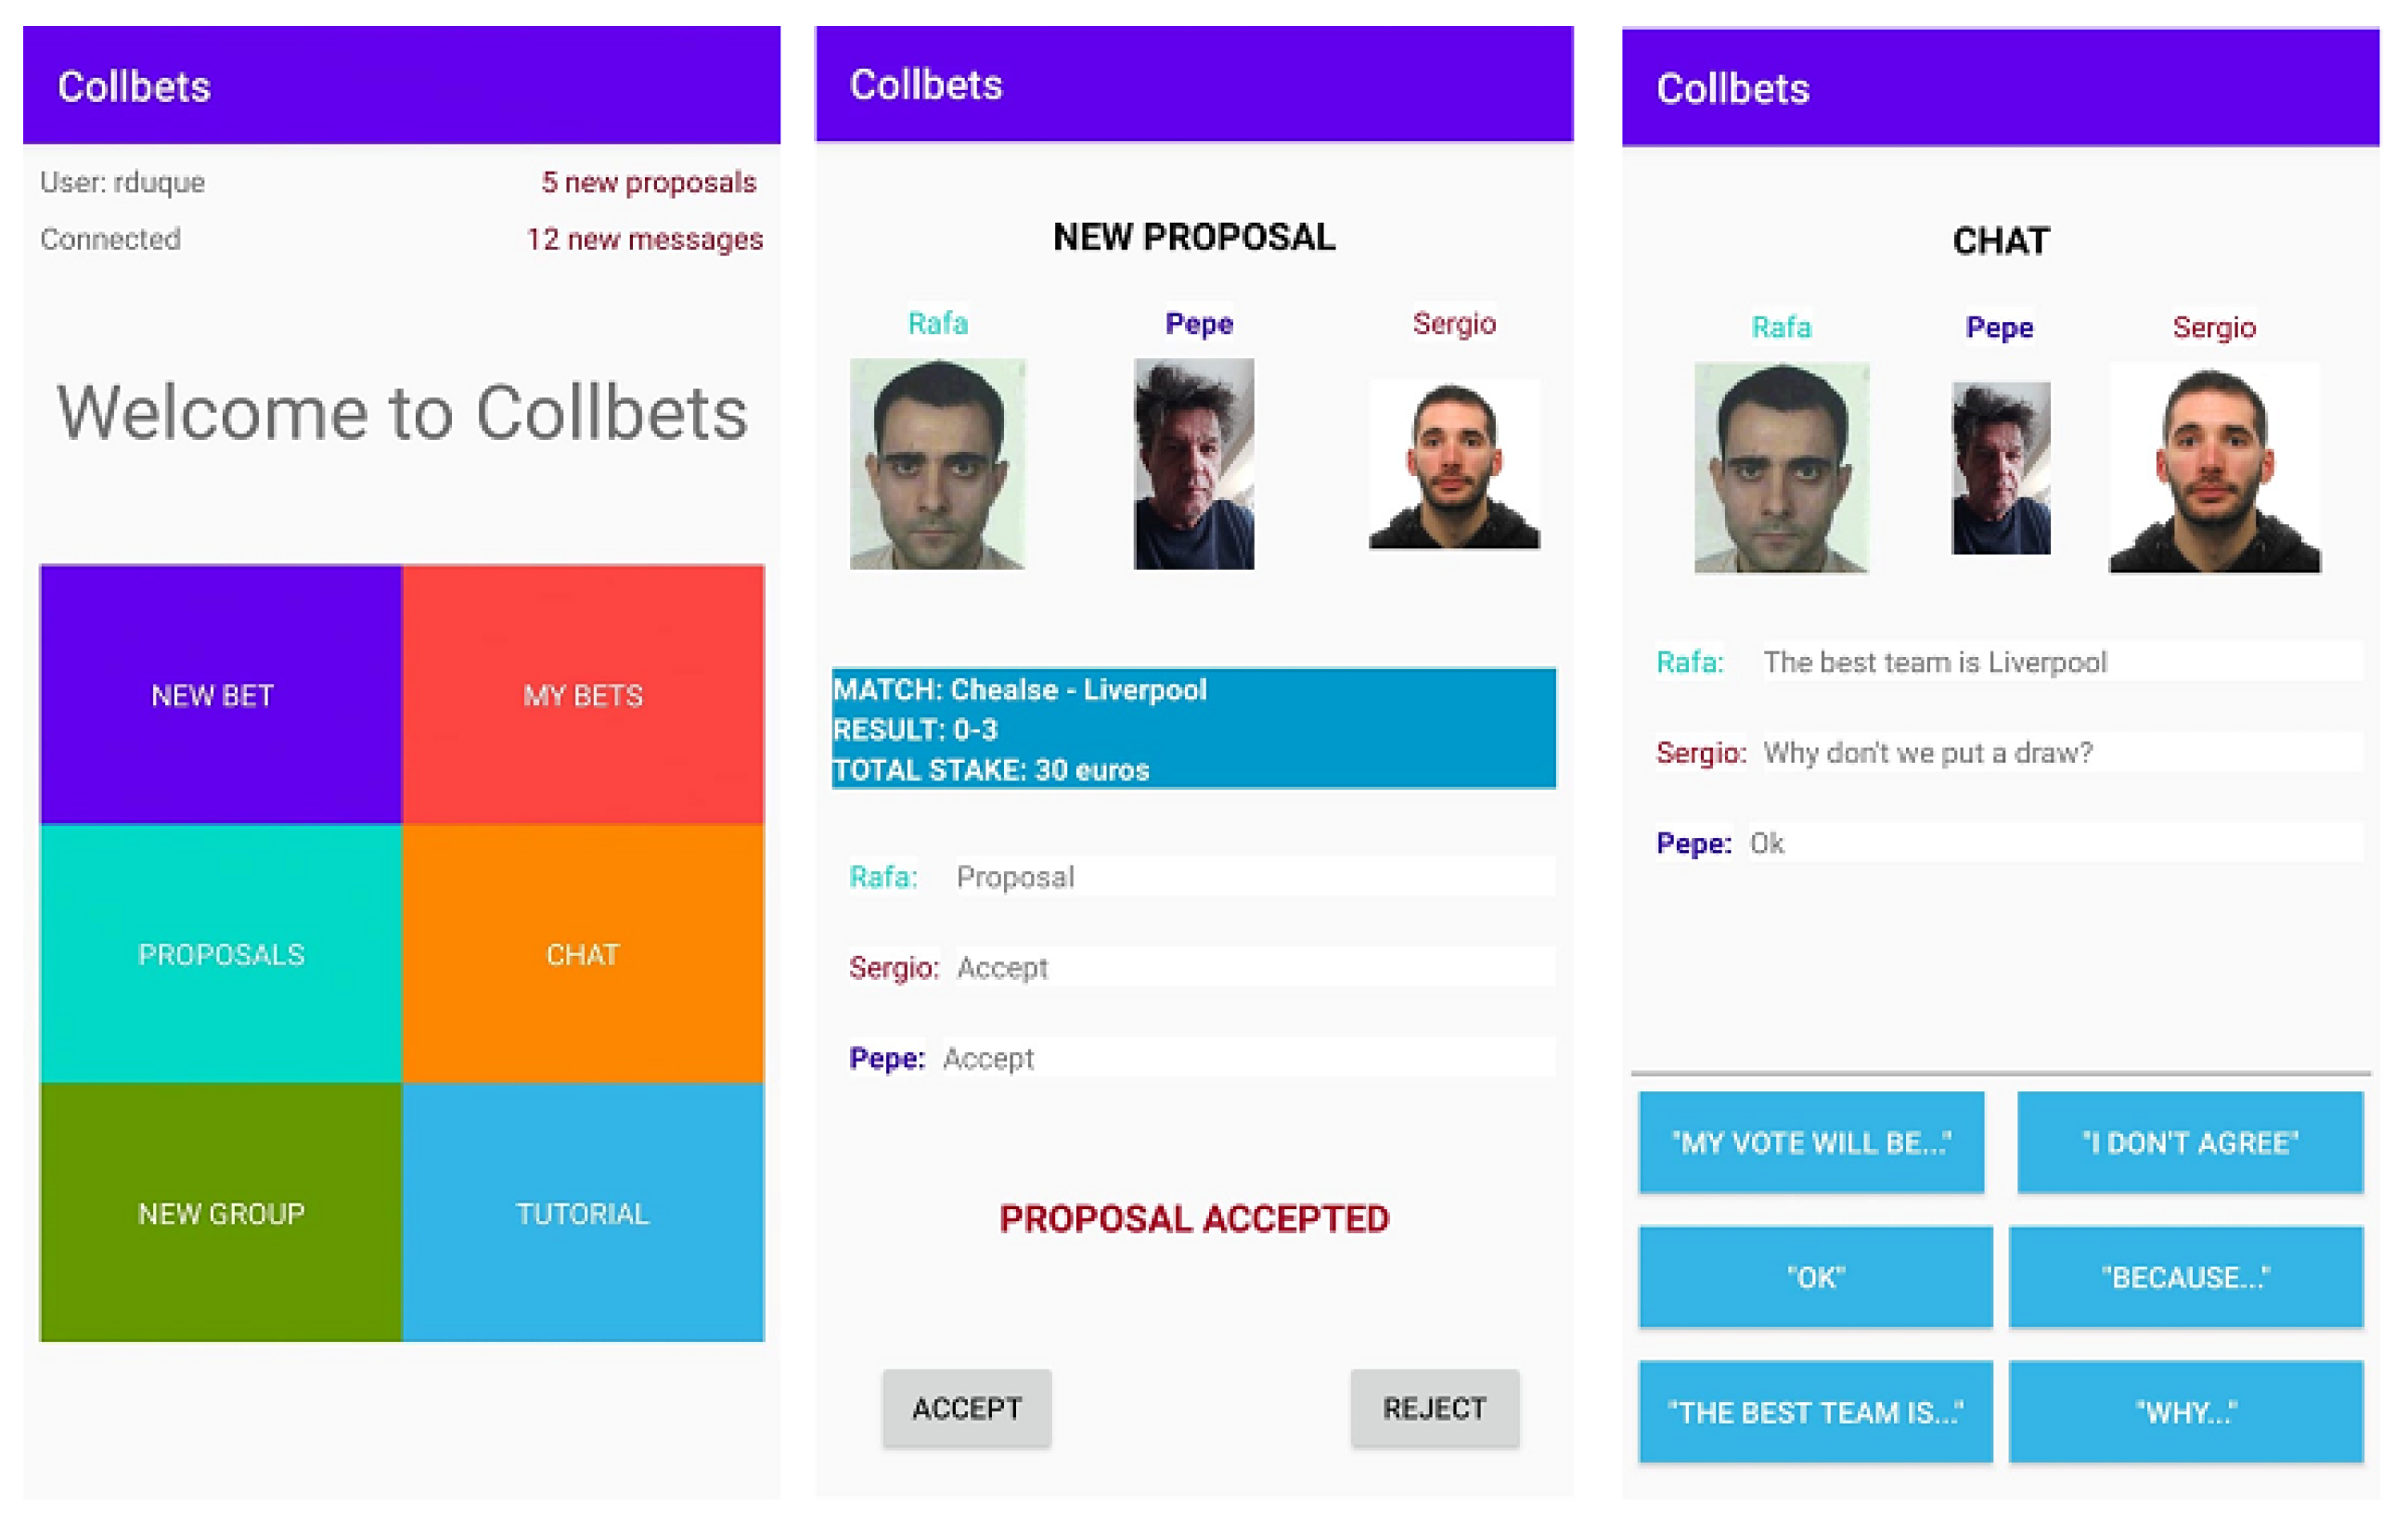
  • Creating a group This task generates groups of users who collaborate to make common bets. The new group space supports actions that start, solve, and finish this task. This space allows for a user to invite other users of the system to create a group.
  • Making a bet. The user employs the new bet space to start this task. The voting panel is used to solve the task of making a bet by means of actions that reject or accept each proposal. The actions of the chat also help the user to carry out the task of making a bet by means of a discussion about the bets. When all of the members of the groups have voted for the proposal, the task of making a bet is finished.
The tutorial tool enables the user to know how the system’s actions support both tasks.

4.2. Experiments and Results

Twenty-eight users participated in the case study interacting with the system to generate five bets. These users were randomly grouped into seven groups of four members. When they finished, they assessed their experience through five usability metrics.
Table 3 shows the statistics (mean and variance) that were extracted from the scores (between 1 and 5) given by the different users in each of the different established usability metrics. It is clearly observable that there is disparity among the opinions of the users, including both satisfied and dissatisfied users with the application. From the traces of their interactions with the system through the analysis of the proposed framework, it is possible to extract which are the points that need to be enhanced to improve the general opinion on the application.
The neural network that is described in Figure 4 shows an example of a neural network that can be used to solve this problem. Indeed, it is the one used for these tests. After collecting the data, it must be pre-processed as a whole in the way described in Section 3.3 to normalize it. In this process, the three input traces are also generated, as well as the times of the interactions that were carried out by the users and the maximum waiting time between user interactions to be considered synchronous. With this, four different data entries are obtained, which will be given to the neural network to be processed (established in 60 s for this case). As described in previous sections, in order to perform a training and testing of the network, it is necessary to select some alpha users, used for network training, and check the viability of the network for each of the usability attribute; and, some beta users, used to predict the metrics, which is, if the model says that a usability attribute is good or bad. The case study used twenty-one alpha users and seven beta users, which were chosen at random.
In this specific case, and due to the reduced size of the obtained dataset, it has been decided to use the K-Fold Cross Validation technique [41]: it consists of dividing the dataset in k groups of equal or similar size and making k training processes; in each of them, a group will be selected for testing. while the rest will be used to train the model, going through all of the groups once. This type of training serves to check the effectiveness of the selected model; in this particular case, it is used to see, for each of the different usability metrics, if the model can learn well from the data. If the average of results is good (taking the Zero-Rule value as a reference), we take, as reference, the last trained model and obtain with it the results of good/bad for that specific usability value. For each of the different results obtained, it is explained how to interpret it. For the experiments that were carried out, a k = 4 (4 partitions/iterations) has been used for the K-Fold process, each of them during 1000 epochs. Adam [42] has been used as an optimizer and MAE (Mean Average Error) as loss function.
Table 4 shows the obtained results and exposes the three different scenarios described in the Section 3.3. A list of the cases in which each of these three results is found is shown below, so that it serves as an example of how to analyze these outputs:
  • The system does not learn from the data: it occurs in the second case (error rate) in which the error of the system is worst than the baseline (or reference value) given by the Zero-Rule. This indicates that more user data are needed for this particular case or that users have very different impressions.
  • The system learns well from the data, which is, the obtained error is low. Two cases can occur:
    A high value is predicted: the third (Memory load) and the fourth (Ease of learning) cases are in these situations. Thus, developers can deduce that users have a good experience learning and remembering how to use the application and these are aspects that should not be prioritized.
    A low value is predicted: the first (Execution Speed) and fifth case (Overall Satisfaction) have low prediction values, so it can be inferred that the developers should enhance the performance of the app in order to reduce load times, possible bugs, etc.; and, also improve the implementation of the app in general in order to satisfy the users. On the other hand, it is true that the predicted value is at 2.5 (mean value between 1 and 5), but, generally, this value can be considered to be low and developers should be aimed at obtaining a valuation in the range of 4–5.
By analyzing the traces of beta users obtained, it is possible to determine which patterns are causing problems. In this way, developers will be able to know which tasks or groups of tasks should carry more modifications, being able to concentrate the improvements to be made even more in order to enhance the experience of the users. Figure 6 shows an analysis done with a beta user whose predicted value for the Execution Speed was very low.
In this example, the evaluator can extract that the user has had difficulties using the application and, through the analysis of the traces and with the help of the generated graph (like the one in Figure 6), detect the interactions or sequences that have problems. Looking at this specific case, it can be clearly seen that the interactions of “Access to Chat” and “Send New Bet” are repeated in a loop with a high probability (0.5 and 0.67 respectively), so it is highly probable that there are problems with these interactions in particular (load errors, low execution speed, etc.), also knowing that the predicted score of Execution Speed is low.
After this analysis, it will be possible to improve the application and make a second (or other) version from these indicators. After obtaining these versions, this process can be repeated. It would not be necessary to retrain the network and only a smaller number of users can be used as compared with the first time, similar to the number of beta users. With a few iterations of this process, developers will be able to improve the different aspects of their application using only traces of user interactions.

4.3. Discussion

The framework support for performing task analysis has made it possible to categorize all of the system actions. Although there are other similar proposals for carrying out task analysis (see Section 2), this framework includes specific support to categorize collaborative tasks (protocol-based and communicative) that allows the evaluation process to detect usability failures that arerelated to them. This categorization of collaborative tasks enables the evaluators a preliminary approach of the type of usability problems: difficulties to coordinate activities in shared spaces (sequence of interactions with protocol-based actions) or to exchange information between users (sequence of interactions with communicative actions).
The framework can be applied to groupware systems that generate log files with the information and structure explained in Section 3. Moreover, real users that assess the system are required. The framework can be considered to be a tool for carrying out a usability evaluation method that is based on software support. This kind of methods are known as experimental according to the classification put forward by Preece et al. [6]. These methods are traditionally put in action in usability laboratories. This framework replaces this equipment of usability laboratories by software support that can collect interactions in mobile and ubiquitous contexts. Although the experimental methods have previously been applied to evaluate systems in collaborative and mobile contexts with the help of automatic support [12,28], they require the participation of experts that interpret data (metrics’ values, interactions, etc.). The framework includes a functionality to graphically visualize the sequences of interactions that are related to usability problems in order to facilitate the work of these experts.
The machine learning techniques process usability assessments that are made by the users and the interactions they perform with the system. The result is a neural network that is specifically tailored to the system under test and its users. For this, the framework can be considered to be a flexible instrument that adapts the evaluation to different systems and user profiles.
Although the framework visualizes graphs with sequences of interactions that are linked to usability problems, it is a black box model that does not allow us to know the specific causes for these difficulties (poor interface design, lack of awareness information, errors in the task model, etc.). Therefore, the framework only automates part of the evaluation tasks and the participation of human–computer interaction experts would be necessary to explore the specific causes of these usability problems.

5. Conclusions

The paper describes a framework for identifying interaction sequences that cause usability problems. These interactions can be performed by an individual user or in a collaborative way. The framework processes task models to know the sequence of interactions that are supported by the system under evaluation. The framework proposes a specific notation for generating task models that include information on the features of the system to support collaborative interactions.
The sequences of interactions of the task model are evaluated by a neural network that outputs an assessment of the usability. This neural network is learnt from repositories with interactions that were performed by real users and their assessments of the system’s usability. The complexity and size of the task model can involve that these log repositories do not cover all of the sequences of interactions of the task model. For this, the framework integrates a procedure that explores all the sequences of interactions of the task model that, after being evaluated by a neural network, make a prediction of the usability level.
The framework has been applied to evaluate a mobile system that supports collaborative sports betting. The results indicate that the framework allows for automating the search for sequences of interactions that generate low levels of usability to carry out collaborative activities. Once the framework identifies these sequences that cause usability problems, an expert should analyze the modifications to solve these difficulties (modify the task model, enrich the knowledge information). For this reason, in the future, we intend to integrate this framework into a more global methodology to study usability with the participation of experts.

Author Contributions

Conceptualization, S.B., R.D., C.T. and J.L.M.; Formal analysis, S.B. and R.D.; Investigation, S.B. and R.D.; Methodology, S.B. and R.D.; Resources, A.N.-R.; Software, A.N.-R.; Supervision, R.D.; Writing—original draft, S.B.; Writing—review and editing, R.D., A.N.-R., C.T. and J.L.M. All authors have read and agreed to the published version of the manuscript.

Funding

This research and the APC was funded by the University of Cantabria and the Government of Cantabria through the industrial doctorate grant DI27, given to Santos Bringas. Alicia Nieto-Reyes was supported by a Spanish Ministerio de Ciencia, Innovación y Universidades grant MTM2017-86061-C2-2-P.

Conflicts of Interest

The authors declare no conflict of interest.

References

  1. Zaina, L.A.; Álvaro, A. A design methodology for user-centered innovation in the software development area. J. Syst. Softw. 2015, 110, 155–177. [Google Scholar] [CrossRef]
  2. Larusdottir, M.; Gulliksen, J.; Cajander, Å. A license to kill–Improving UCSD in Agile development. J. Syst. Softw. 2017, 123, 214–222. [Google Scholar] [CrossRef]
  3. Ivory, M.Y.; Hearst, M.A. The State of the Art in Automating Usability Evaluation of User Interfaces. ACM Comput. Surv. 2001, 33, 470–516. [Google Scholar] [CrossRef]
  4. Madan, A.; Dubey, S.K. Usability Evaluation Methods: A Literature Review. Int. J. Eng. Sci. Technol. 2012, 4, 590–599. [Google Scholar]
  5. Sears, A.; Jacko, J.A. The Human-Computer Interaction Handbook: Fundamentals, Evolving Technologies, and Emerging Applications (Human Factors and Ergonomics Series); L. Erlbaum Associates Inc.: Hillsdale, NJ, USA, 2007. [Google Scholar]
  6. Preece, J.; Benyon, D.; University, O. A Guide to Usability: Human Factors in Computing, 1st ed.; Addison-Wesley Longman Publishing Co., Inc.: Boston, MA, USA, 1993. [Google Scholar]
  7. Fraternali, P.; Lanzi, P.L.; Matera, M.; Maurino, A. Model-driven Web Usage Analysis for the Evaluation of Web Application Quality. J. Web Eng. 2004, 3, 124–152. [Google Scholar]
  8. Nielsen, J.; Levy, J. Measuring usability: Preference vs. performance. Commun. ACM 1994, 37, 66–75. [Google Scholar] [CrossRef]
  9. Meo, R.; Lanzi, P.L.; Matera, M.; Esposito, R. Integrating Web Conceptual Modeling and Web Usage Mining. In Advances in Web Mining and Web Usage Analysis; Mobasher, B., Nasraoui, O., Liu, B., Masand, B., Eds.; Springer: Berlin/Heidelberg, Germany, 2006; pp. 135–148. [Google Scholar]
  10. Harms, P.; Grabowski, J. Usage-Based Automatic Detection of Usability Smells. In Proceedings of the 5th IFIP WG 13.2 International Conference on Human-Centered Software Engineering (HCSE 2014), Paderborn, Germany, 16–18 September 2014; Springer: Berlin/Heidelberg, Germany, 2014; Volume 8742, pp. 217–234. [Google Scholar] [CrossRef] [Green Version]
  11. Kjeldskov, J.; Stage, J. New techniques for usability evaluation of mobile systems. Int. J. Hum. Comput. Stud. 2004, 60, 599–620. [Google Scholar] [CrossRef] [Green Version]
  12. Moumane, K.; Idri, A.; Abran, A. Usability evaluation of mobile applications using ISO 9241 and ISO 25062 standards. SpringerPlus 2016, 5, 548. [Google Scholar] [CrossRef] [Green Version]
  13. ISO. Ergonomics of Human-System Interaction—Part 11: Usability: Definitions and Concepts; Standard ISO 9241-11; International Organization for Standardization: Geneva, Switzerland, 2000. [Google Scholar]
  14. ISO. Software Engineering—Software Product Quality Requirements and Evaluation (SQuaRE)—Common Industry Format (CIF) for Usability Test Reports; Standard ISO/IEC 25062:2006; International Organization for Standardization: Geneva, Switzerland, 2006. [Google Scholar]
  15. Wing, J.M. A Specifier’s Introduction to Formal Methods. Computer 1990, 23, 8–23. [Google Scholar] [CrossRef]
  16. Paternò, F. Model-Based Design and Evaluation of Interactive Applications, 1st ed.; Springer: London, UK, 1999. [Google Scholar]
  17. John, B.; Vera, A.; Matessa, M.; Freed, M.; Remington, R. Automating CPM-GOMS. In Proceedings of the SIGCHI Conference on Human Factors in Computing Systems (CHI ’02), Minneapolis, MN, USA, 20–25 April 2002; pp. 147–154. [Google Scholar]
  18. Bolton, M.L.; Bass, E.J. Enhanced operator function model: A generic human task behavior modeling language. In Proceedings of the 2009 IEEE International Conference on Systems, Man and Cybernetics, San Antonio, TX, USA, 11–14 October 2009; pp. 2904–2911. [Google Scholar] [CrossRef]
  19. Fahssi, R.M.; Martinie, C.; Palanque, P. HAMSTERS: Un environnement d’édition et de simulation de modèles de tâches (Démonstration). In Proceedings of the 26e Conférence Francophone sur L’Interaction Homme-Machine, Lille, France, 28–31 October 2014; pp. 5–6. [Google Scholar]
  20. Propp, S.; Buchholz, G.; Forbrig, P. Task Model-Based Usability Evaluation for Smart Environments. In Proceedings of the 2nd Conference on Human-Centered Software Engineering and 7th International Workshop on Task Models and Diagrams (HCSE-TAMODIA ’08), Pisa, Italy, 25–26 September 2008; Springer: Berlin/Heidelberg, Germany, 2008; pp. 29–40. [Google Scholar]
  21. Lecerof, A.; Paternò, F. Automatic Support for Usability Evaluation. IEEE Trans. Softw. Eng. 1998, 24, 863–888. [Google Scholar] [CrossRef] [Green Version]
  22. Bernhaupt, R.; Palanque, P.; Manciet, F.; Martinie, C. User-Test Results Injection into Task-Based Design Process for the Assessment and Improvement of Both Usability and User Experience. In Human-Centered and Error-Resilient Systems Development; Bogdan, C., Gulliksen, J., Sauer, S., Forbrig, P., Winckler, M., Johnson, C., Palanque, P., Bernhaupt, R., Kis, F., Eds.; Springer International Publishing: Cham, Switzerland, 2016; pp. 56–72. [Google Scholar]
  23. Martinie, C.; Palanque, P.; Ragosta, M.; Fahssi, R. Extending Procedural Task Models by Systematic Explicit Integration of Objects, Knowledge and Information. In Proceedings of the 31st European Conference on Cognitive Ergonomics (ECCE ’13), Belfast, UK, 10–13 September 2019; ACM: New York, NY, USA, 2013; pp. 23:1–23:10. [Google Scholar] [CrossRef]
  24. Martinez, A.; De la Fuente, P.; Dimitriadis, Y. Towards an xml-based representation of collaborative action. In Designing for Change in Networked Learning Environments; Springer: Berlin/Heidelberg, Germany, 2003; pp. 379–383. [Google Scholar]
  25. Gutwin, C.; Greenberg, S. Effects of Awareness Support on Groupware Usability. In Proceedings of the CHI ’98 Conference on Human Factors in Computing Systems, Los Angeles, CA, USA, 18–23 April 1998; pp. 511–518. [Google Scholar] [CrossRef] [Green Version]
  26. Gutwin, C.; Greenberg, S. A Descriptive Framework of Workspace Awareness for Real-Time Groupware. Comput. Supported Coop. Work 2002, 11, 411–446. [Google Scholar] [CrossRef]
  27. İlker Berkman, M.; Karahoca, D.; Karahoca, A. A Measurement and Structural Model for Usability Evaluation of Shared Workspace Groupware. Int. J. Hum. Comput. Interact. 2018, 34, 35–56. [Google Scholar] [CrossRef]
  28. Geszten, D.; Hámornik, B.P.; Hercegfi, K. Exploring awareness related usability problems of collaborative software with a team usability testing approach. In Proceedings of the 2018 9th IEEE International Conference on Cognitive Infocommunications (CogInfoCom), Budapest, Hungary, 22–24 August 2018; pp. 000045–000050. [Google Scholar] [CrossRef]
  29. Pinelle, D.; Gutwin, C.; Greenberg, S. Task Analysis for Groupware Usability Evaluation: Modeling Shared-Workspace Tasks with the Mechanics of Collaboration. ACM Trans. Comput. Hum. Interact. 2003, 10, 281–311. [Google Scholar] [CrossRef]
  30. Collazos, C.A.; Gutiérrez, F.L.; Gallardo, J.; Ortega, M.; Fardoun, H.M.; Díaz, A.I.M. Descriptive theory of awareness for groupware development. J. Ambient Intell. Humaniz. Comput. 2019, 10, 4789–4818. [Google Scholar] [CrossRef]
  31. Lopez, G.; Guerrero, L.A. Awareness Supporting Technologies Used in Collaborative Systems: A Systematic Literature Review. In Proceedings of the 2017 ACM Conference on Computer Supported Cooperative Work and Social Computing (CSCW ’17), Portland, OR, USA, 25 February–1 March 2017; Association for Computing Machinery: New York, NY, USA, 2017; pp. 808–820. [Google Scholar] [CrossRef]
  32. Chounta, I.; Avouris, N. Study of the Effect of Awareness on Synchronous Collaborative Problem-Solving. In Proceedings of the 2010 International Conference on Intelligent Networking and Collaborative Systems, Thessaloniki, Greece, 24–26 November 2010; pp. 153–160. [Google Scholar]
  33. Schumann, J.; Buttler, T.; Lukosch, S. An Approach for Asynchronous Awareness Support in Collaborative Non-Linear Storytelling. Comput. Support. Coop. Work. J. Collab. Comput. (Online) 2013, 22, 271–308. [Google Scholar] [CrossRef] [Green Version]
  34. Oztekin, A. A decision support system for usability evaluation of web-based information systems. Expert Syst. Appl. 2011, 38, 2110–2118. [Google Scholar] [CrossRef]
  35. Oztekin, A.; Delen, D.; Turkyilmaz, A.; Zaim, S. A machine learning-based usability evaluation method for eLearning systems. Decis. Support Syst. 2013, 56, 63–73. [Google Scholar] [CrossRef]
  36. Bringas, S.; Salomón, S.; Duque, R.; Lage, C.; Montaña, J.L. Alzheimer’s Disease stage identification using deep learning models. J. Biomed. Inform. 2020, 109, 103514. [Google Scholar] [CrossRef]
  37. Abdeljaber, O.; Avci, O.; Kiranyaz, S.; Gabbouj, M.; Inman, D.J. Real-time vibration-based structural damage detection using one-dimensional convolutional neural networks. J. Sound Vib. 2017, 388, 154–170. [Google Scholar] [CrossRef]
  38. Lee, S.M.; Yoon, S.M.; Cho, H. Human activity recognition from accelerometer data using Convolutional Neural Network. In Proceedings of the 2017 IEEE International Conference on Big Data and Smart Computing (Bigcomp), Jeju, Korea, 13–16 February 2017; pp. 131–134. [Google Scholar]
  39. Barron, B. When Smart Groups Fail. J. Learn. Sci. 2003, 12, 307–359. [Google Scholar] [CrossRef]
  40. Tîrnăucă, C.; Duque, R.; Montaña, J.L. User interaction modeling and profile extraction in interactive systems: A groupware application case study. Sensors 2017, 17, 1669. [Google Scholar] [CrossRef] [PubMed] [Green Version]
  41. Russell, S.; Norvig, P. Artificial Intelligence: A Modern Approach, 3rd ed.; Prentice Hall: Upper Saddle River, NJ, USA, 2010. [Google Scholar]
  42. Kingma, D.P.; Ba, J. Adam: A method for stochastic optimization. arXiv 2014, arXiv:1412.6980. [Google Scholar]
Figure 1. Structure of the task models.
Electronics 10 00388 g001
Figure 2. Repository of information.
Electronics 10 00388 g002
Figure 3. Diagram of the proposed solution.
Electronics 10 00388 g003
Figure 4. Architecture of the proposed network.
Electronics 10 00388 g004
Figure 5. Main user interface of the system (left panel), voting panel (center panel), and structured chat (right panel).
Electronics 10 00388 g005
Figure 6. Analysis of interaction data sequences of a user. The nodes represent the actions performed by the user and the links the probability that an action will be next. The predicted value for that user regarding the Execution Speed is 1.102.
Electronics 10 00388 g006
Table 1. Example of datum of a user.
Interactions Trace5425153
Collab. Trace1011011
Sync. Trace1010001
Time1256.2 s
Table 2. Task model.
ToolActionKind of ActionRelation with Task
ChatFreeCommunicativeSolve the task of making a bet
Why
Because
I think that
I don’t agree
The best team is
My vote will be
Voting PanelAcceptProtocol-basedSolve the task of making a bet
RejectSolve the task of making a bet
AcceptedEnd the task of making a bet
Rejected
New BetSendProtocol-basedStart the task of making a bet
TutorialAccessCognitiveSolve the task of making a bet
My BetsAccessCognitiveSolve the task of making a bet
Add MatchInstrumentalSolve the task of making a bet
New GroupNew NameProtocol-basedStart the task of creating a group
Add PersonSolve the task of creating a group
Select GroupSolve the task of creating a group
RenameSolve the task of creating a group
Send InvitationSolve the task of creating a group
Accept InvitationFinish the task of creating a group
Reject InvitationFinish the task of creating a group
Table 3. Statistics of the different attributes of usability given by all users, values are in range [1–5].
Usability AttributesAverage (Variance)
Execution Speed3.95 (± 1.598)
Error Rate3.400 (± 2.390)
Memory load3.275 (± 1.699)
Ease of learning3.600 (± 2.360)
Overall Satisfaction3.450 (± 1.598)
Table 4. Obtained results.
Usability AttributesTrain Error (Variance)Zero-RuleMean Prediction
Execution Speed0.732 (± 0.231)1.2861.816
Error Rate1.295 (± 0.866)1.1192.057
Memory load0.941 (± 0.328)1.2174.390
Ease of learning0.748 (± 0.195)1.1194.445
Overall Satisfaction0.966 (± 0.402)1.0002.685
Publisher’s Note: MDPI stays neutral with regard to jurisdictional claims in published maps and institutional affiliations.

