Article

A Novel Method for Establishing an Efficiency Map of IPMSMs for EV Propulsion Based on the Finite-Element Method and a Neural Network

1
Department of Electrical and Computer Engineering, Sungkyunkwan University, Suwon 16419, Korea
2
Electrical Power System Engineering Design Team, Hyundai-Transys, Hwaseong 18280, Korea
3
Department of Electrical Engineering, Chosun University, Gwangju 61452, Korea
*
Author to whom correspondence should be addressed.
Submission received: 16 March 2021 / Revised: 23 April 2021 / Accepted: 28 April 2021 / Published: 29 April 2021

Abstract

:
In this paper, we introduce a novel method for establishing an efficiency map of interior permanent-magnet synchronous motors that are used for electric vehicle propulsion, by employing the finite-element method (FEM) and a neural network (NN) to reduce the analysis time. The electro-magnetic analysis of motors using the FEM, particularly iron loss analysis, is significantly time-consuming owing to the nonlinearity and the post-processing. Moreover, to obtain an efficiency map, a data map of the d-q flux linkages based on the d-q currents should be established. At this stage, we compute the flux densities in all the elements, and they are learned by the NN to obtain a function of the d-q currents. Subsequently, the iron losses at all operating points are calculated using the learned data via the harmonic loss method. The results of the proposed method indicate that the time required to obtain the efficiency map is reduced; furthermore, the results are validated via a comparison with the FEM results.

1. Introduction

Interior permanent-magnet synchronous motors (IPMSMs) have been widely used for electric vehicle (EV) propulsion owing to their high torque density, high efficiency, and wide operating range, which are attributed to their high saliency and the use of rare-earth permanent-magnets [1,2,3,4].
Given that EVs have wide operating regions, the establishment of an efficiency map for propulsion motors is highly time-consuming. Moreover, to identify the input current at each operating point, a data map of the d- and q-axis flux linkages based on the d- and q-axis currents should be obtained previously [5,6]. Copper loss and torque can be calculated using coil resistance and mapping data, whereas the finite-element method (FEM), which requires a long analysis time owing to the nonlinearity and the post-processing, should be used to calculate iron loss accurately. For these reasons, establishing an efficiency map for EV propulsion motors is costly and time-consuming.
Meanwhile, because the driving distance of EVs per charge with identical battery capacity is a crucial design requirement, it is essential to establish an efficiency map, and design for matching maximum efficiency distribution and energy consumption regions [4]. For this requirement, a proper motor concept should be chosen by comparing the efficiency distribution of each model [7]. Moreover, for the designed model, the efficiency maps according to the several driving conditions, such as the current and voltage constrains(minimum, nominal, and maximum conditions), and the operating temperature(low and high temperatures), are required for control strategy [8,9]. However, it is not easy to carry out these analyses owing to a high time cost, as explained previously.
To address these weaknesses, we proposed a novel method for obtaining an efficiency map of IPMSMs for EV propulsion by employing machine learning. Learning techniques have been used in various methods involving motors owing to their remarkable prediction performance. Asanuma et al. investigated topology optimization method of IPMSM by combining a genetic algorithm with a convolution neural network (NN) [10], and Qian et al. proposed a motor control method using an iterative learning control method for speed ripple minimization [11]. Furthermore, it has been widely used for the diagnosis of motor faults. Kao et al. and Zaman et al. presented an effective motor fault diagnosis algorithms by applying convolution NN and graph-based semi-supervised learning, respectively [12,13]. In this paper, we apply a NN for calculating the iron loss at all operating points within a reduced time. The NN and the FEM are combined to accurately predict the flux density data at each operation point, and the iron loss is calculated using these data, the frequency, and the loss coefficients [14,15]. Using the proposed method, an efficiency map of propulsion IPMSM is obtained, and validated through a comparison with the FEM results. Moreover, the approach is applied to a modified motor model for further validation.

2. The Process of the Proposed Method

The conventional and proposed methods for establishing an efficiency map are depicted in Figure 1. In the conventional method, shown in Figure 1a, a data map, for which the analyzed points are defined as shown in Figure 2, of the d-q flux linkages according to the d-q currents are composed via the two-dimensional FEM (2D-FEM) software, JMAG. The input current at each operating point is defined by calculating maximum torque per ampere under the limit conditions, such as the maximum current and DC battery voltage, and used equations are as follows [16]:
V d = R i d ω λ q
V q = R i q + ω λ d
V p h = V d 2 + V q 2
T e = 3 2 P 2 { λ d i q λ q i d }
where R and ω are the phase resistance and angular velocity, respectively, and d , q , i d , and i q are the d-q flux linkages and d-q currents, respectively. Using the mapping data, the d-q and phase voltages, and torque, which are expressed as V d , V q , V p h , and T e , are calculated by the above equations.
Subsequently, the iron loss is analyzed at defined points to obtain the efficiency map, which is also carried out using 2D-FEM. By contrast, the proposed method requires the radial and tangential (R-T) components of the flux density, which only depends on the d-q currents regardless of frequency owing to the post-processing for iron loss calculation, at all the elements on the electrical steel, in addition to the d-q flux linkages for composing the data map, as shown in Figure 1b. Next, the harmonic orders of the obtained R-T flux densities are analyzed using fast Fourier transform (FFT), and the relationship between these data and the d-q currents is learned by employing an NN. Then, the harmonic orders of the flux density at all the operating points are defined using the learned data, and the loss coefficients are determined based on each harmonic of the flux density and frequency. Finally, the iron loss is calculated using the harmonic loss method [15].

3. Establishing an Efficiency Map of a Propulsion Motor Using the Proposed Method

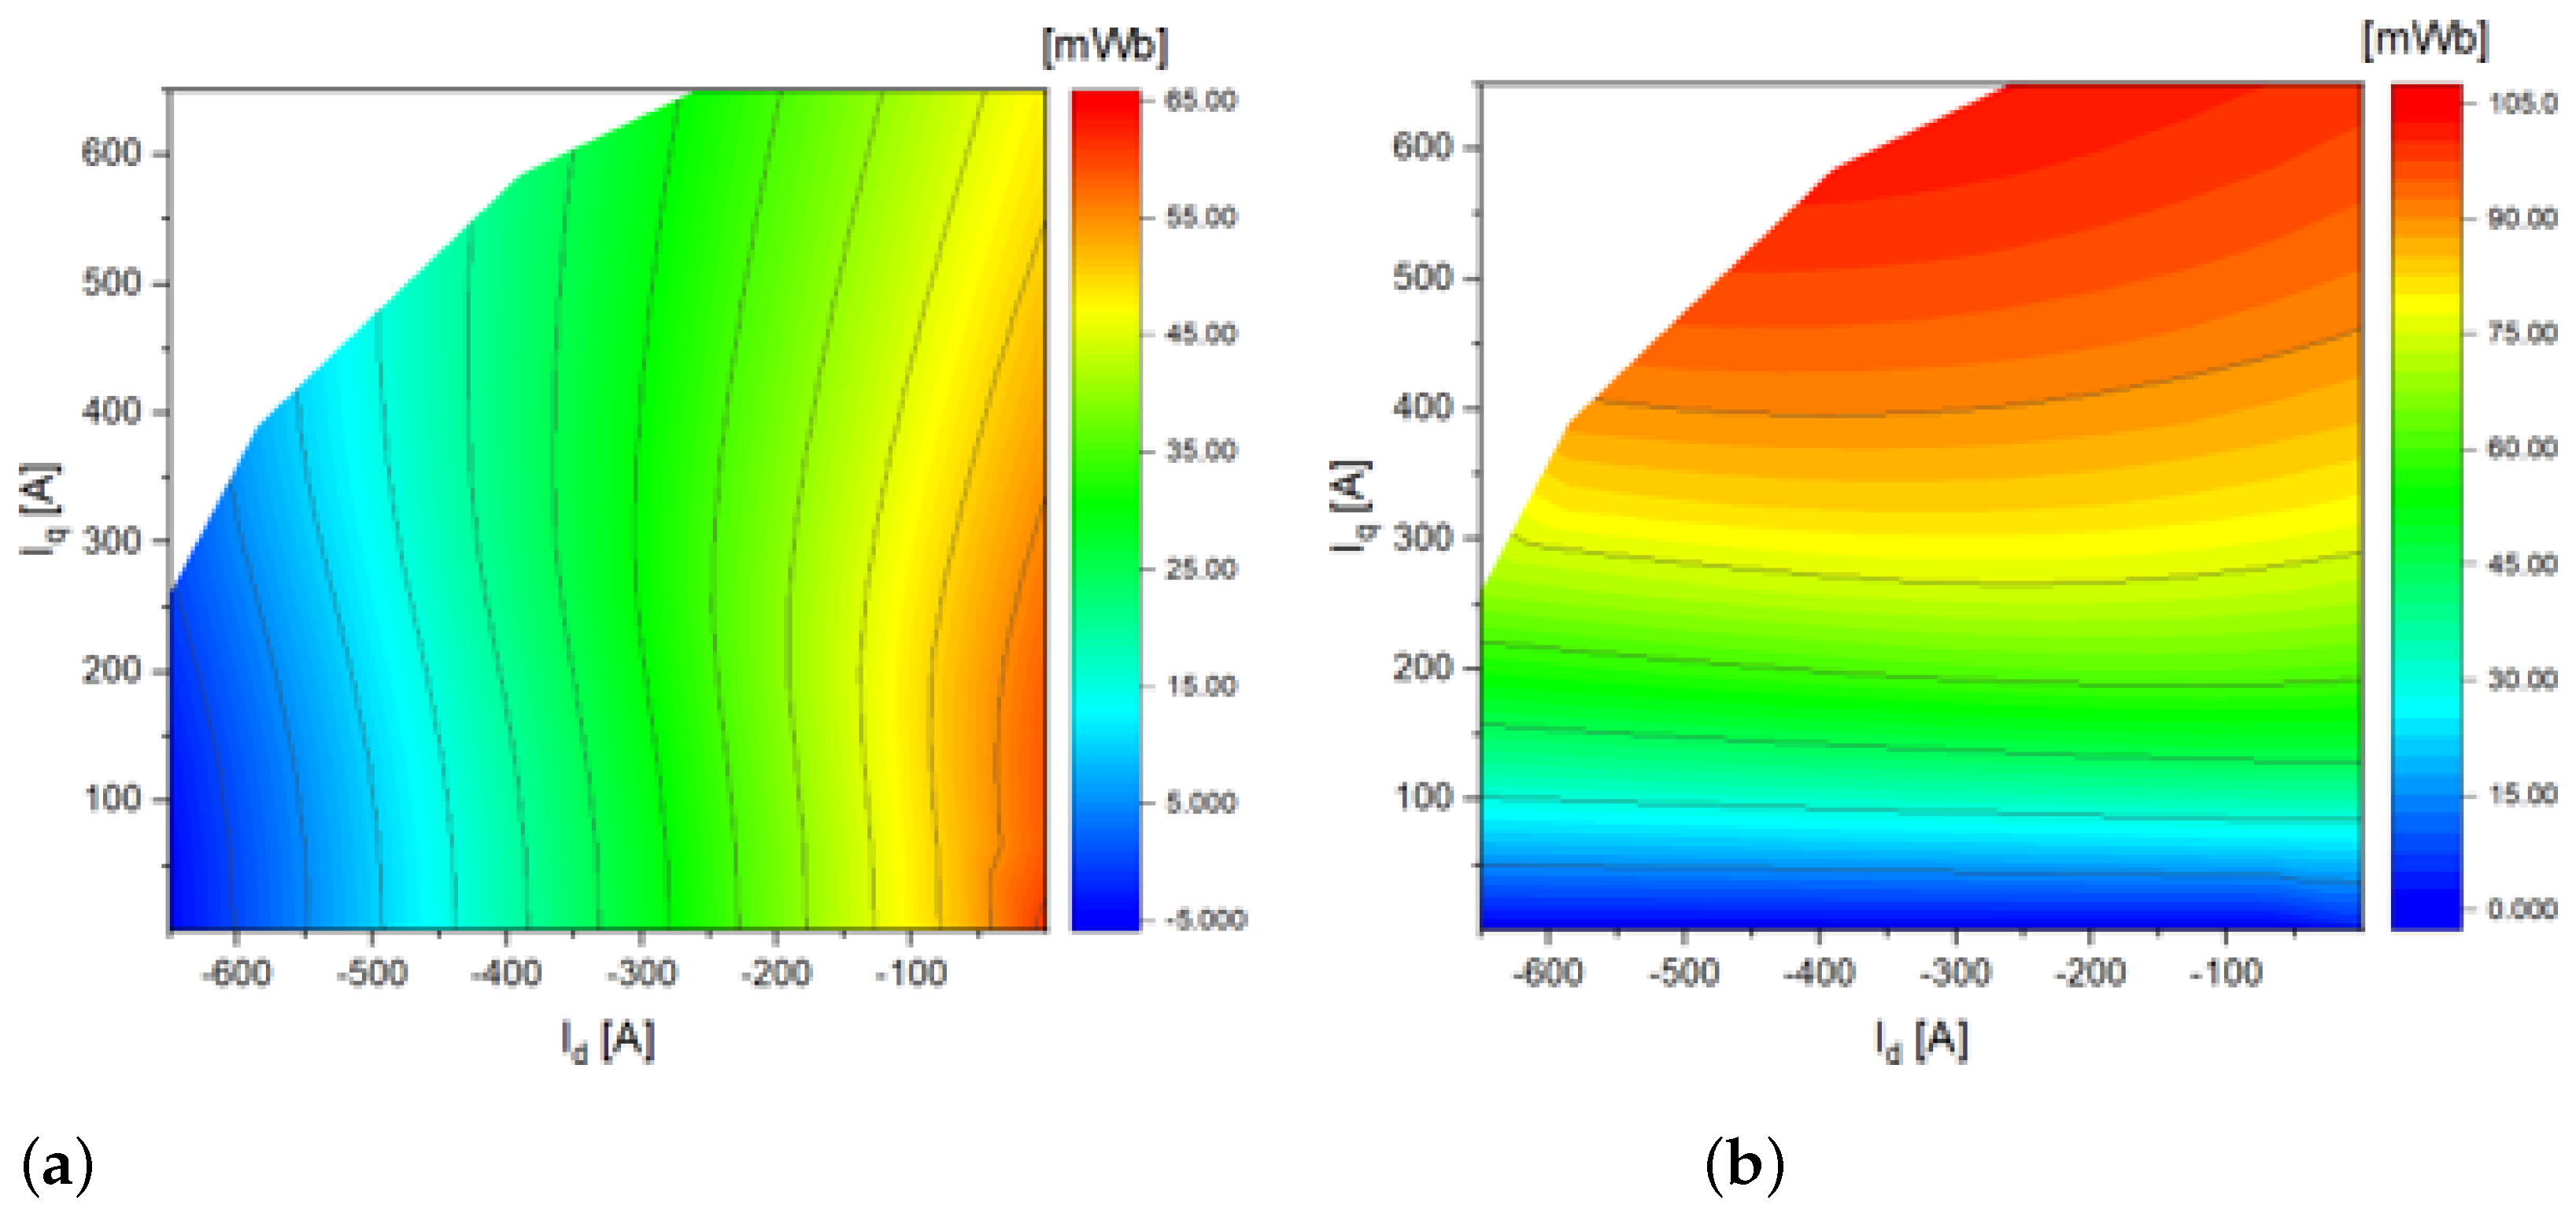
3.1. Composing a Data Map of the Analyzed Motor

The analyzed motor is IPMSM, shown in Figure 3, with a maximum rated power of 80 kW (300 Nm at 2550 rpm), and its detailed specifications are listed in Table 1. For the 2D-FEM, elements are generated as shown in Figure 4. Because of the many elements in the stator, only the flux density in one-third part is computed and learned to enhance the learning performance by reducing the amount of output data [17].
Analysis for the data map is carried out at 83 points according to the d-q currents, and the resultant d-q flux linkages and R-T flux densities are computed as shown in Figure 5 and Figure 6, respectively. In the case of the conventional method, because d-q parameters are repeated over six cycles owing to the phase harmonics [15], the analysis for mapping data is carried out only for a sixth period [5]. On the other hand, for the proposed method, because the waveforms of the R-T flux densities should be computed at this stage, an electrical half-period analysis is requisite. That is why the period of the flux density waveform on stator is identical with electrical period as shown in Figure 6a. The analysis time of both methods for the data map are compared in Table 2.

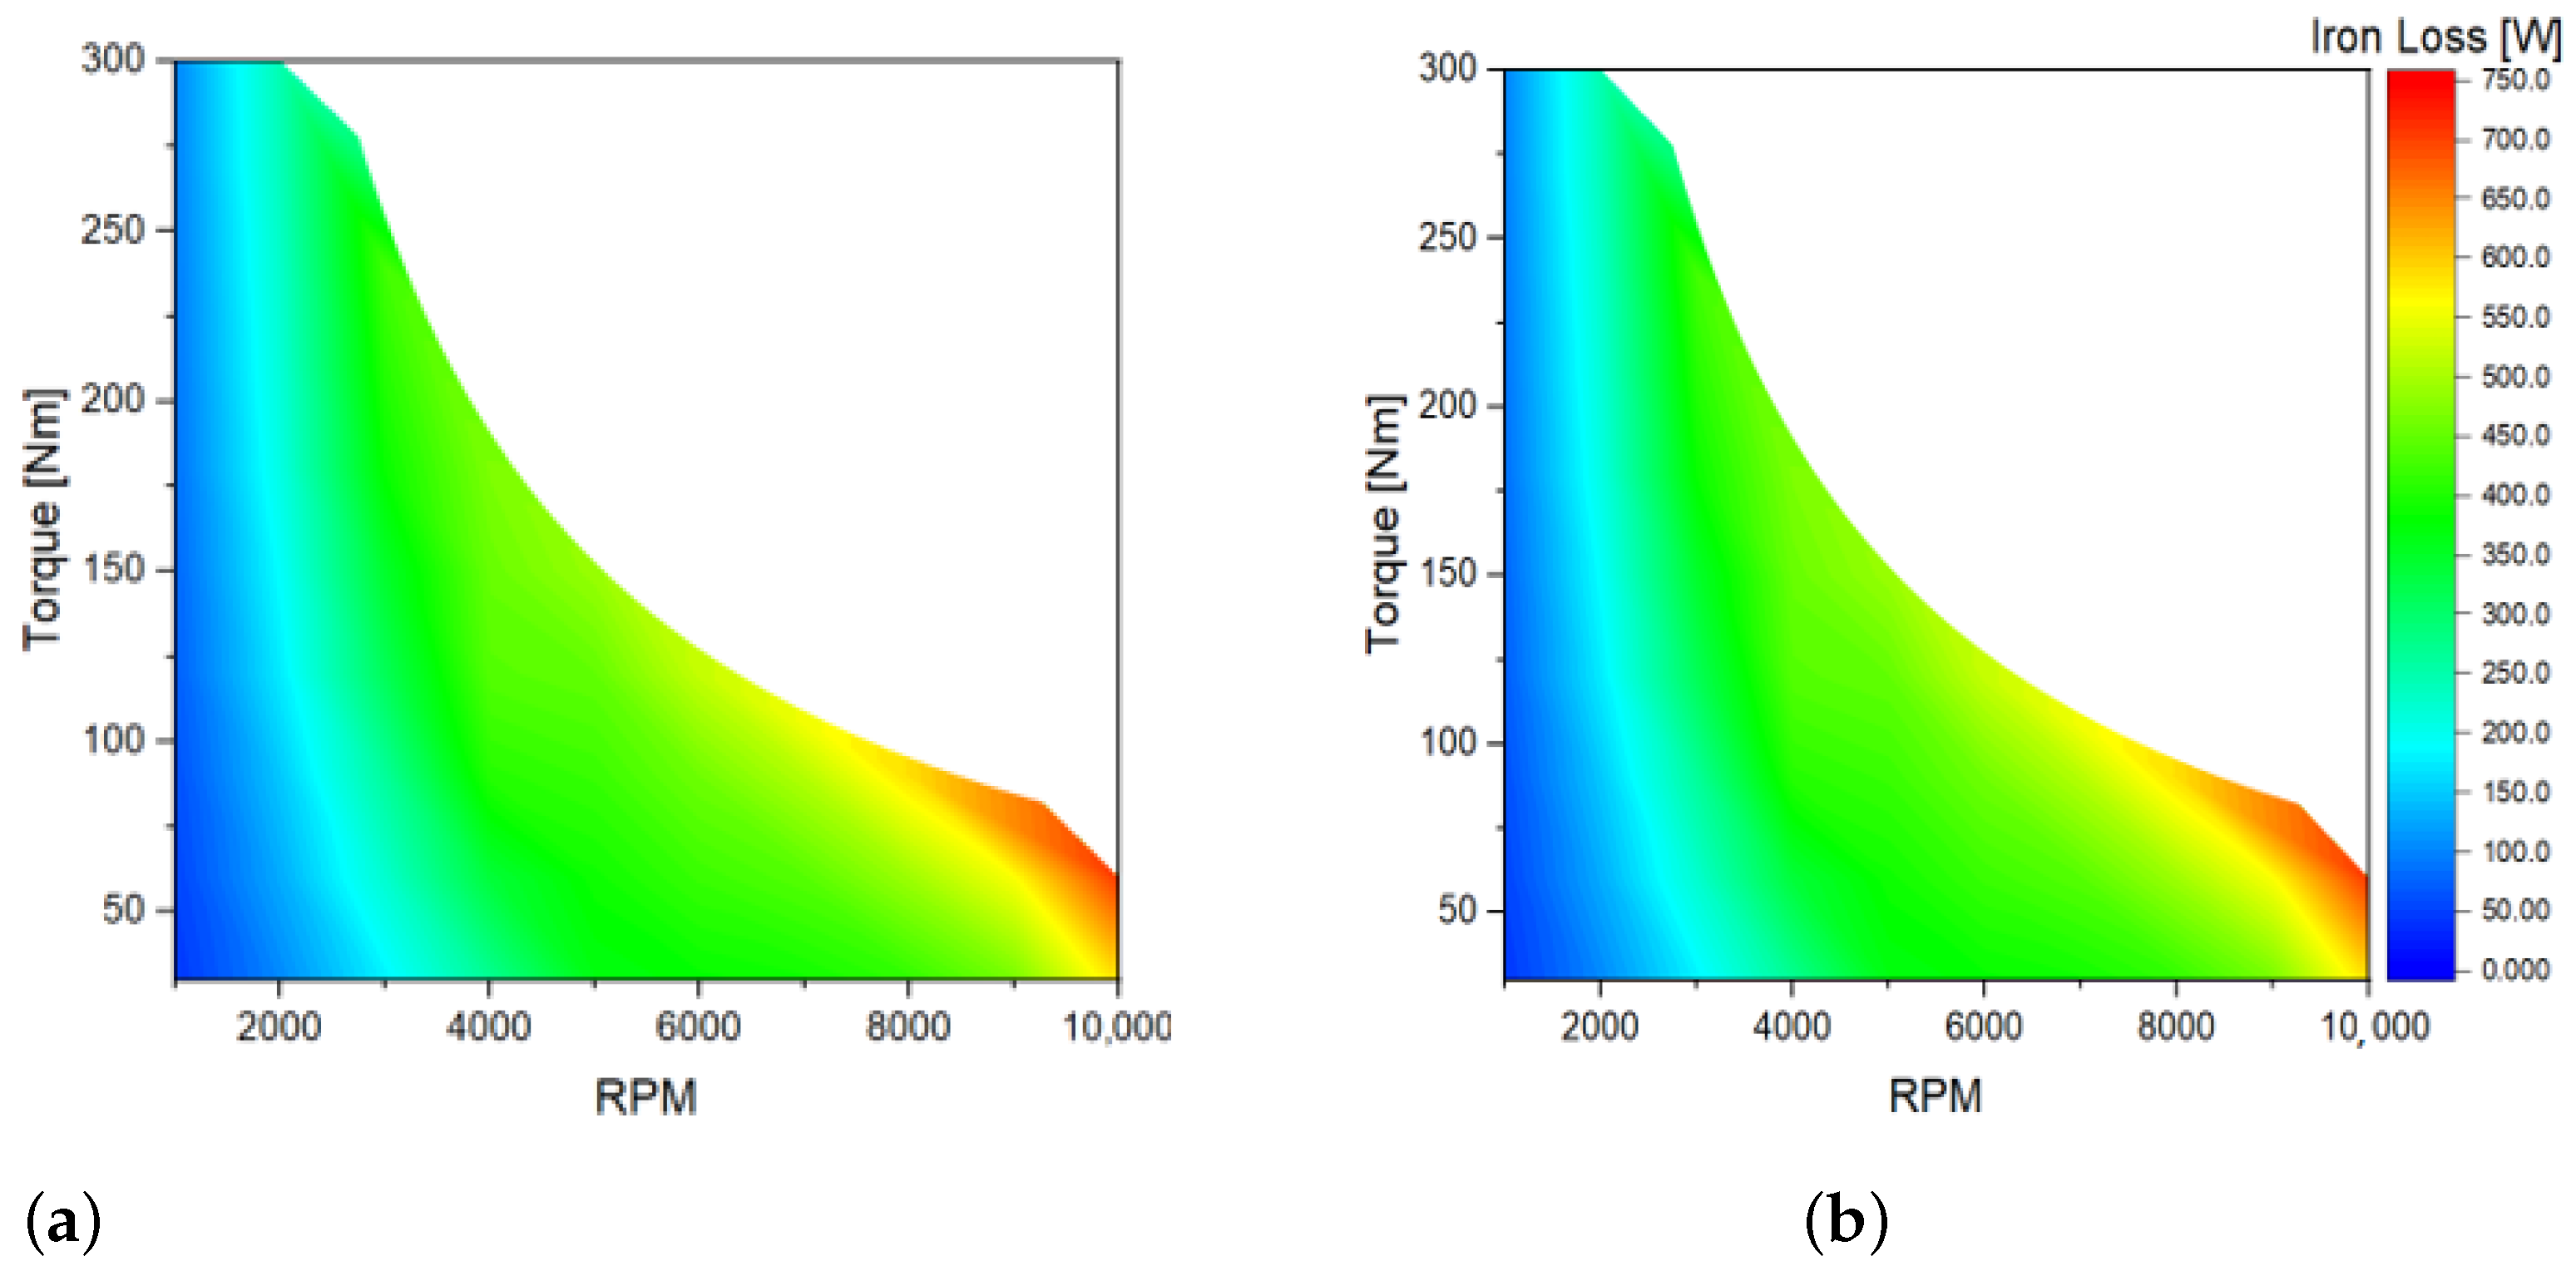
3.2. Calculating Iron Loss Using the Harmonic Loss Method

The iron loss density w i [W/kg] is calculated using the sum of the eddy current and the hysteresis loss densities, w e and w h , as follows [14]:
w i = w e + w h = B 2 f ( k e f + k h )
where B means maximum flux density, and f is its frequency. k e and k h denote the coefficients of the eddy current and hysteresis losses, respectively, which are experimental values. Equation (1) can be modified as follows:
w i B 2 f = k e f + k h
Figure 7 shows the graph of Equation (2) according to frequency. Because the loss coefficients k e and k h are respectively determined as the gradient and intercept in Figure 7, they depend on the frequency and the flux density. Finally, the eddy current and hysteresis losses, W e and W h , are calculated by the harmonic loss method, which employs the harmonic orders of the flux density, obtained by FFT of waveform as shown in Figure 8, at each element and the loss coefficients as follows [15]:
W e = ρ V n = 1 k e ( f n , B ) f n 2 ( B r , n 2 + B t , n 2 ) d v
W h = ρ V n = 1 k h ( f n , B ) f n ( B r , n 2 + B t , n 2 ) d v
where ρ represents the density of the steel. The nth harmonics of R-T flux densities ( B r , n and B t , n ), in Equations (3) and (4), for the iron loss analysis at each operating point are computed via the FEM in the case of the conventional method, whereas we can obtain it using the learning method in the proposed method, of which process is explained in next section. Based on the flux density obtained by learned data, the losses and efficiency are respectively calculated using Equations (3) and (4), and the following equation:
E f f i c i e n c y ( % ) = T e ω T e ω + 3 I r m s 2 R + W e + W h × 100
where T e and mean torque and angular velocity, respectively. I r m s and R denote the root mean square value of input current and phase resistance, respectively, used to calculate copper loss. The efficiencies at all the operating points are calculated using Equation (5), then we can establish an efficiency map of the propulsion motors using only data map without loss analysis based on the FEM.

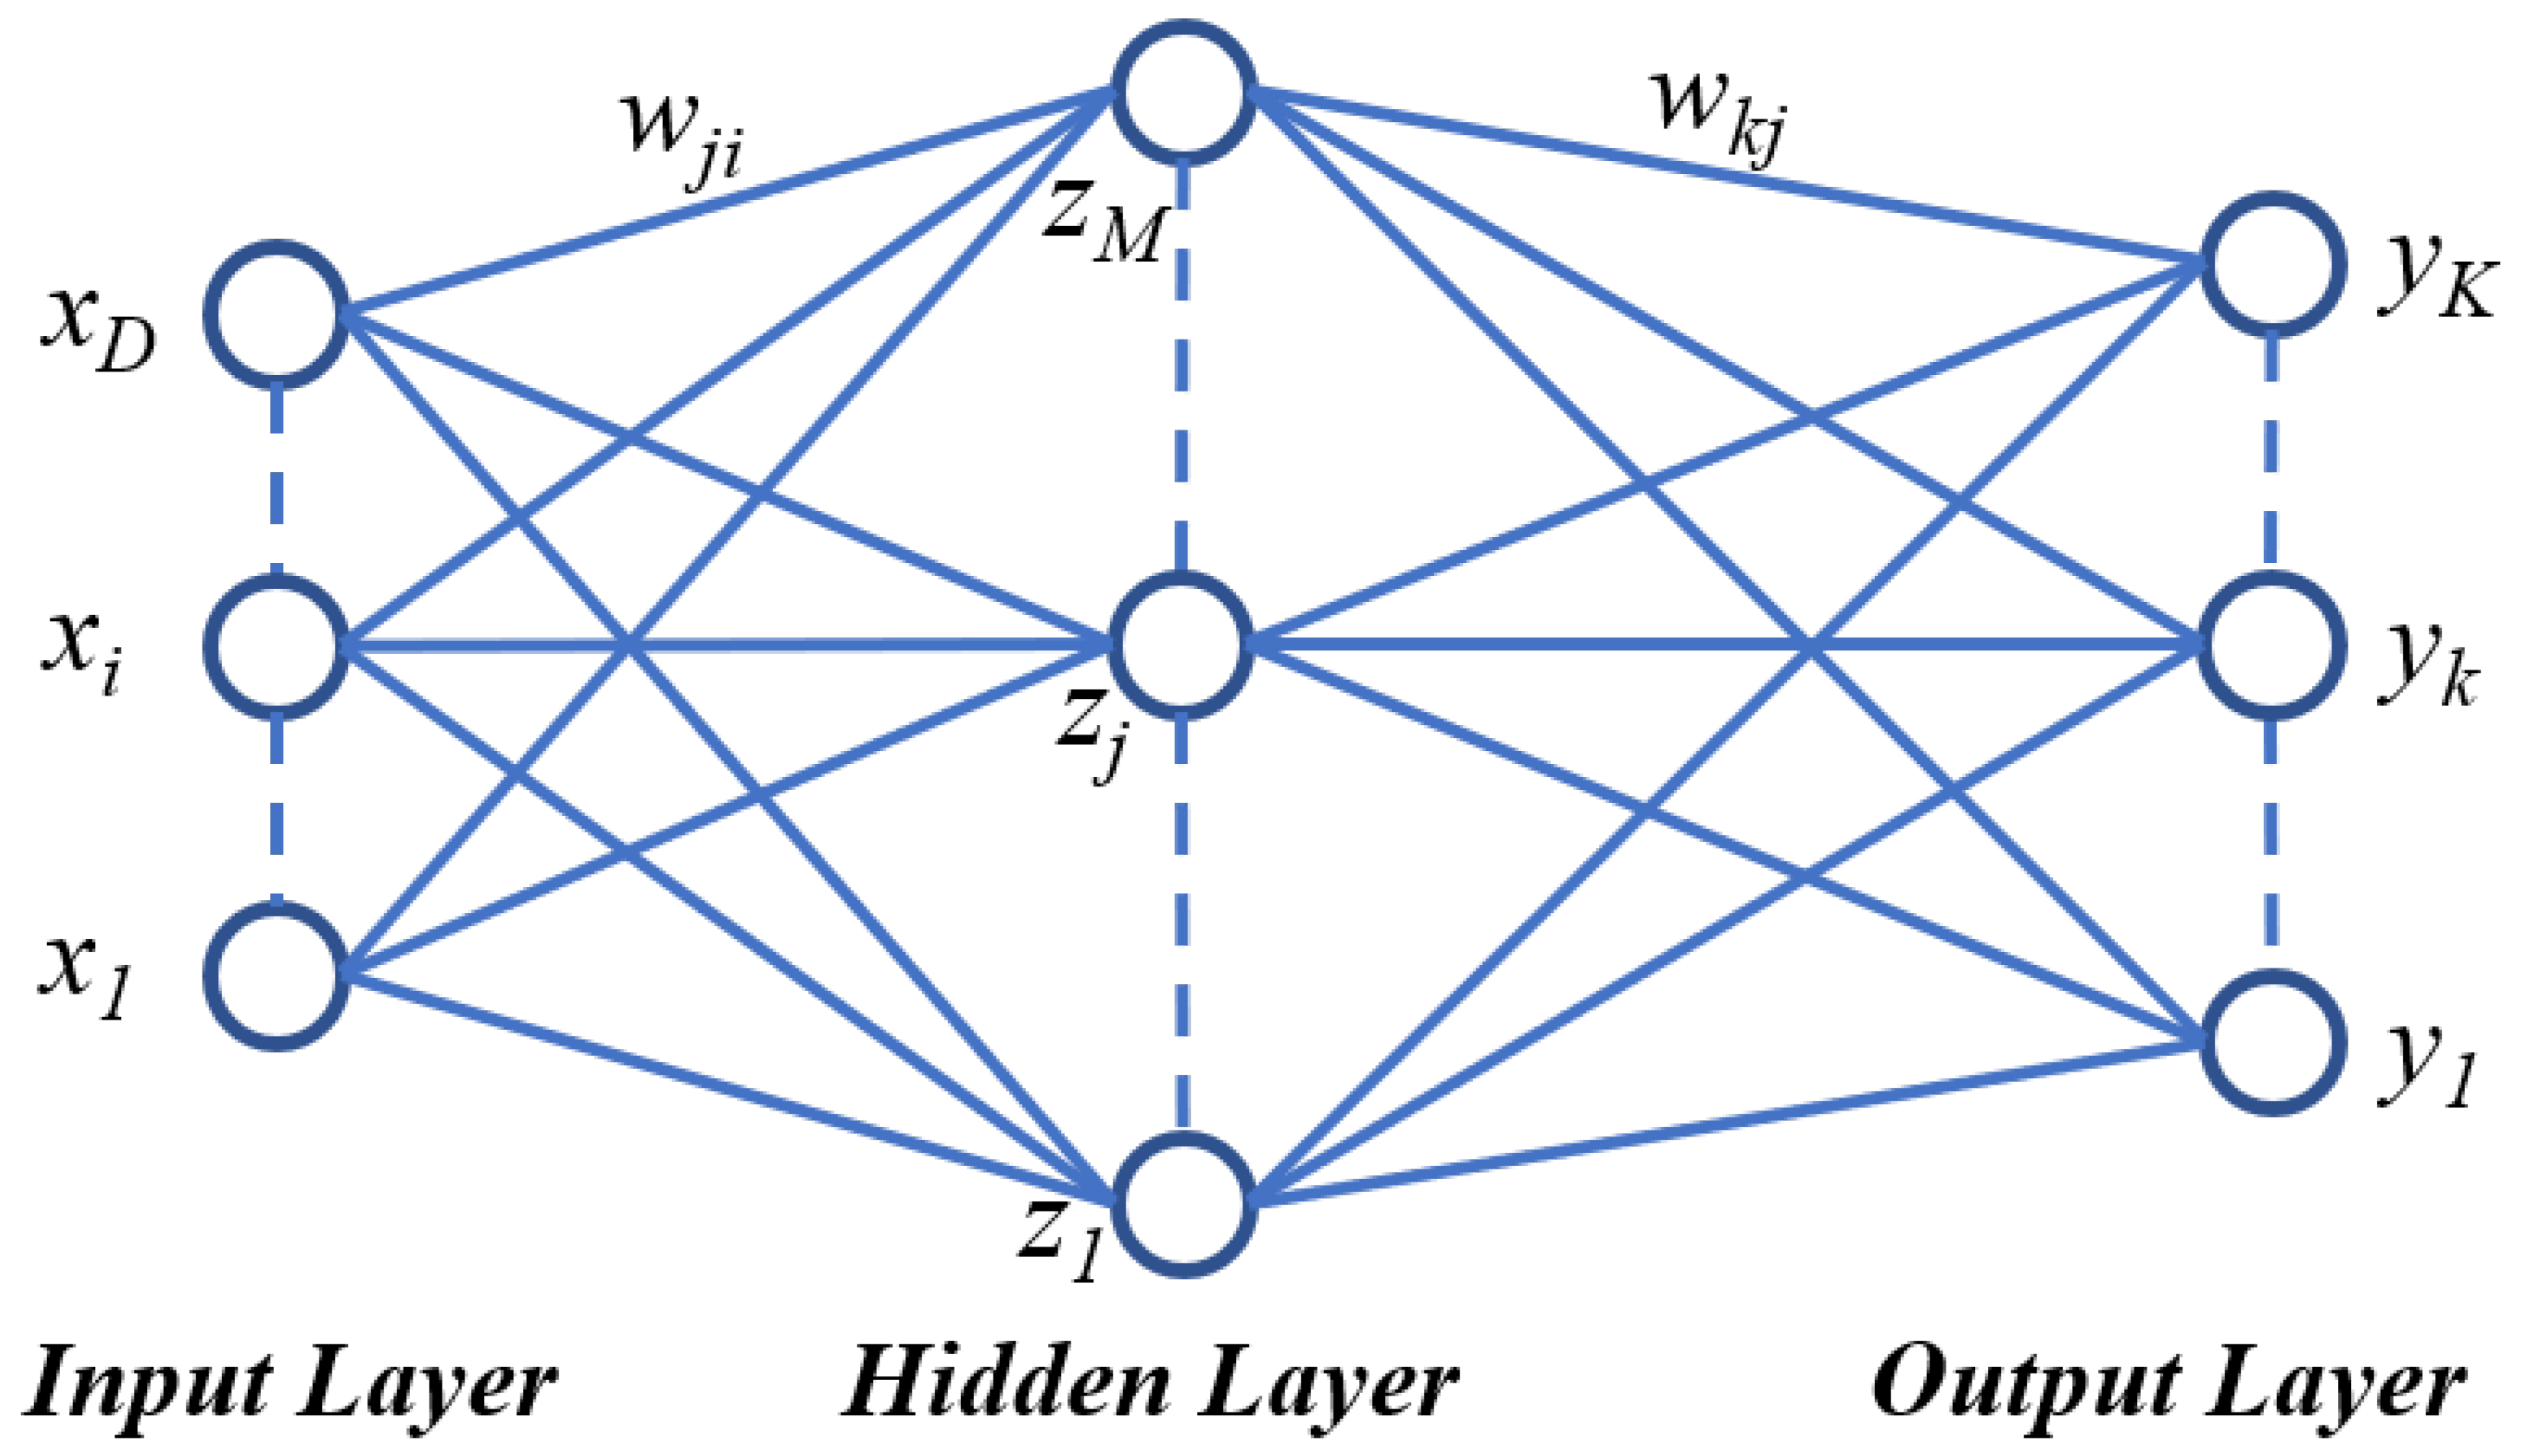
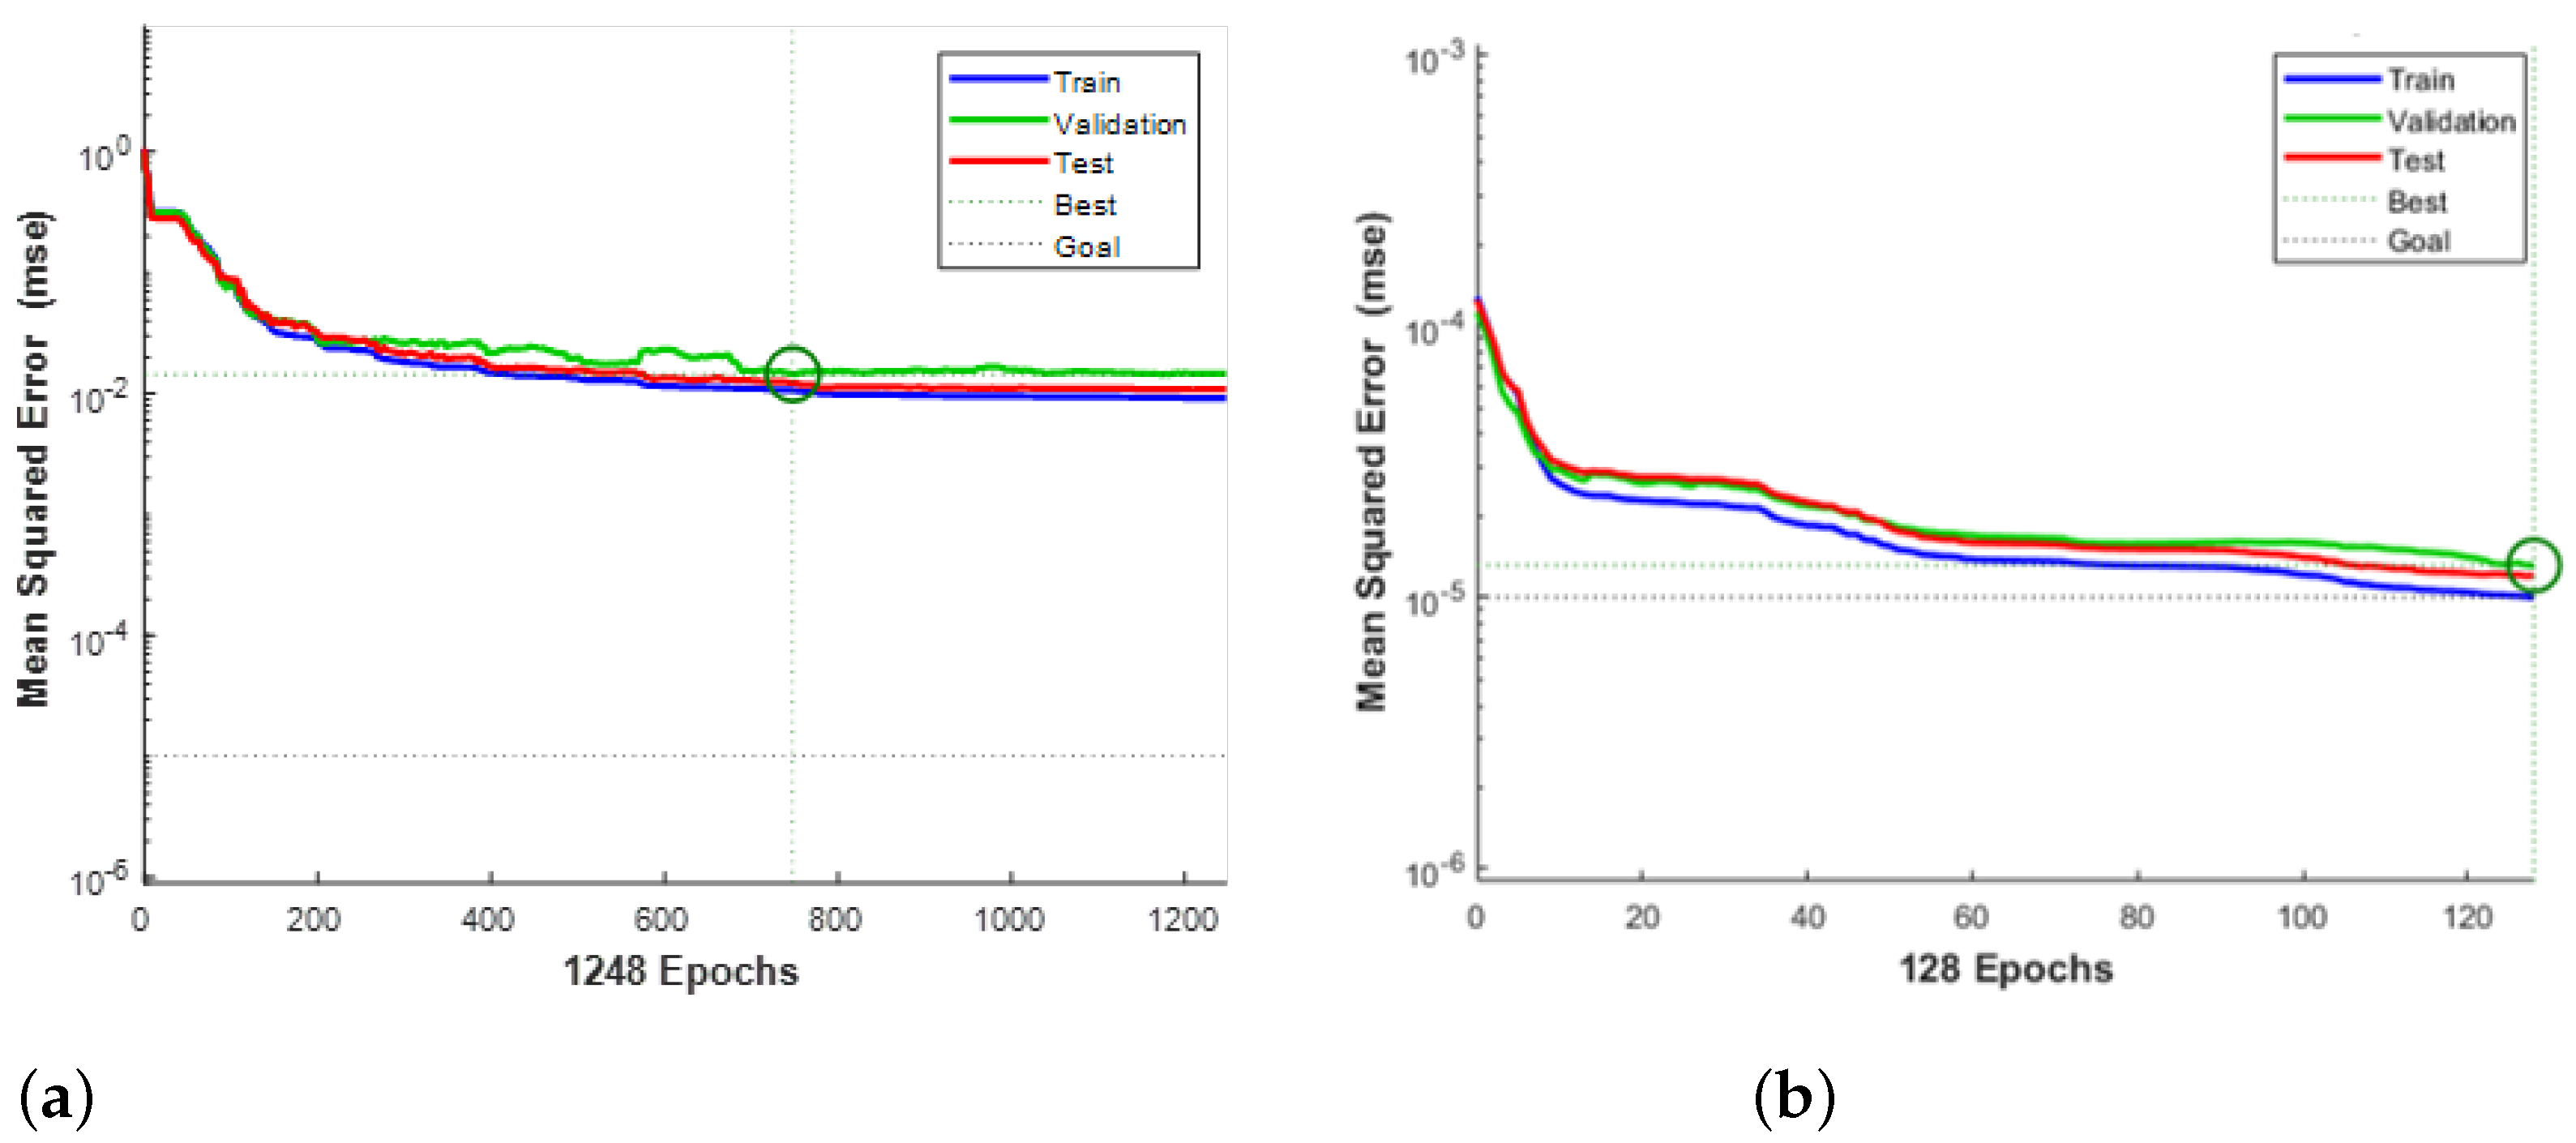
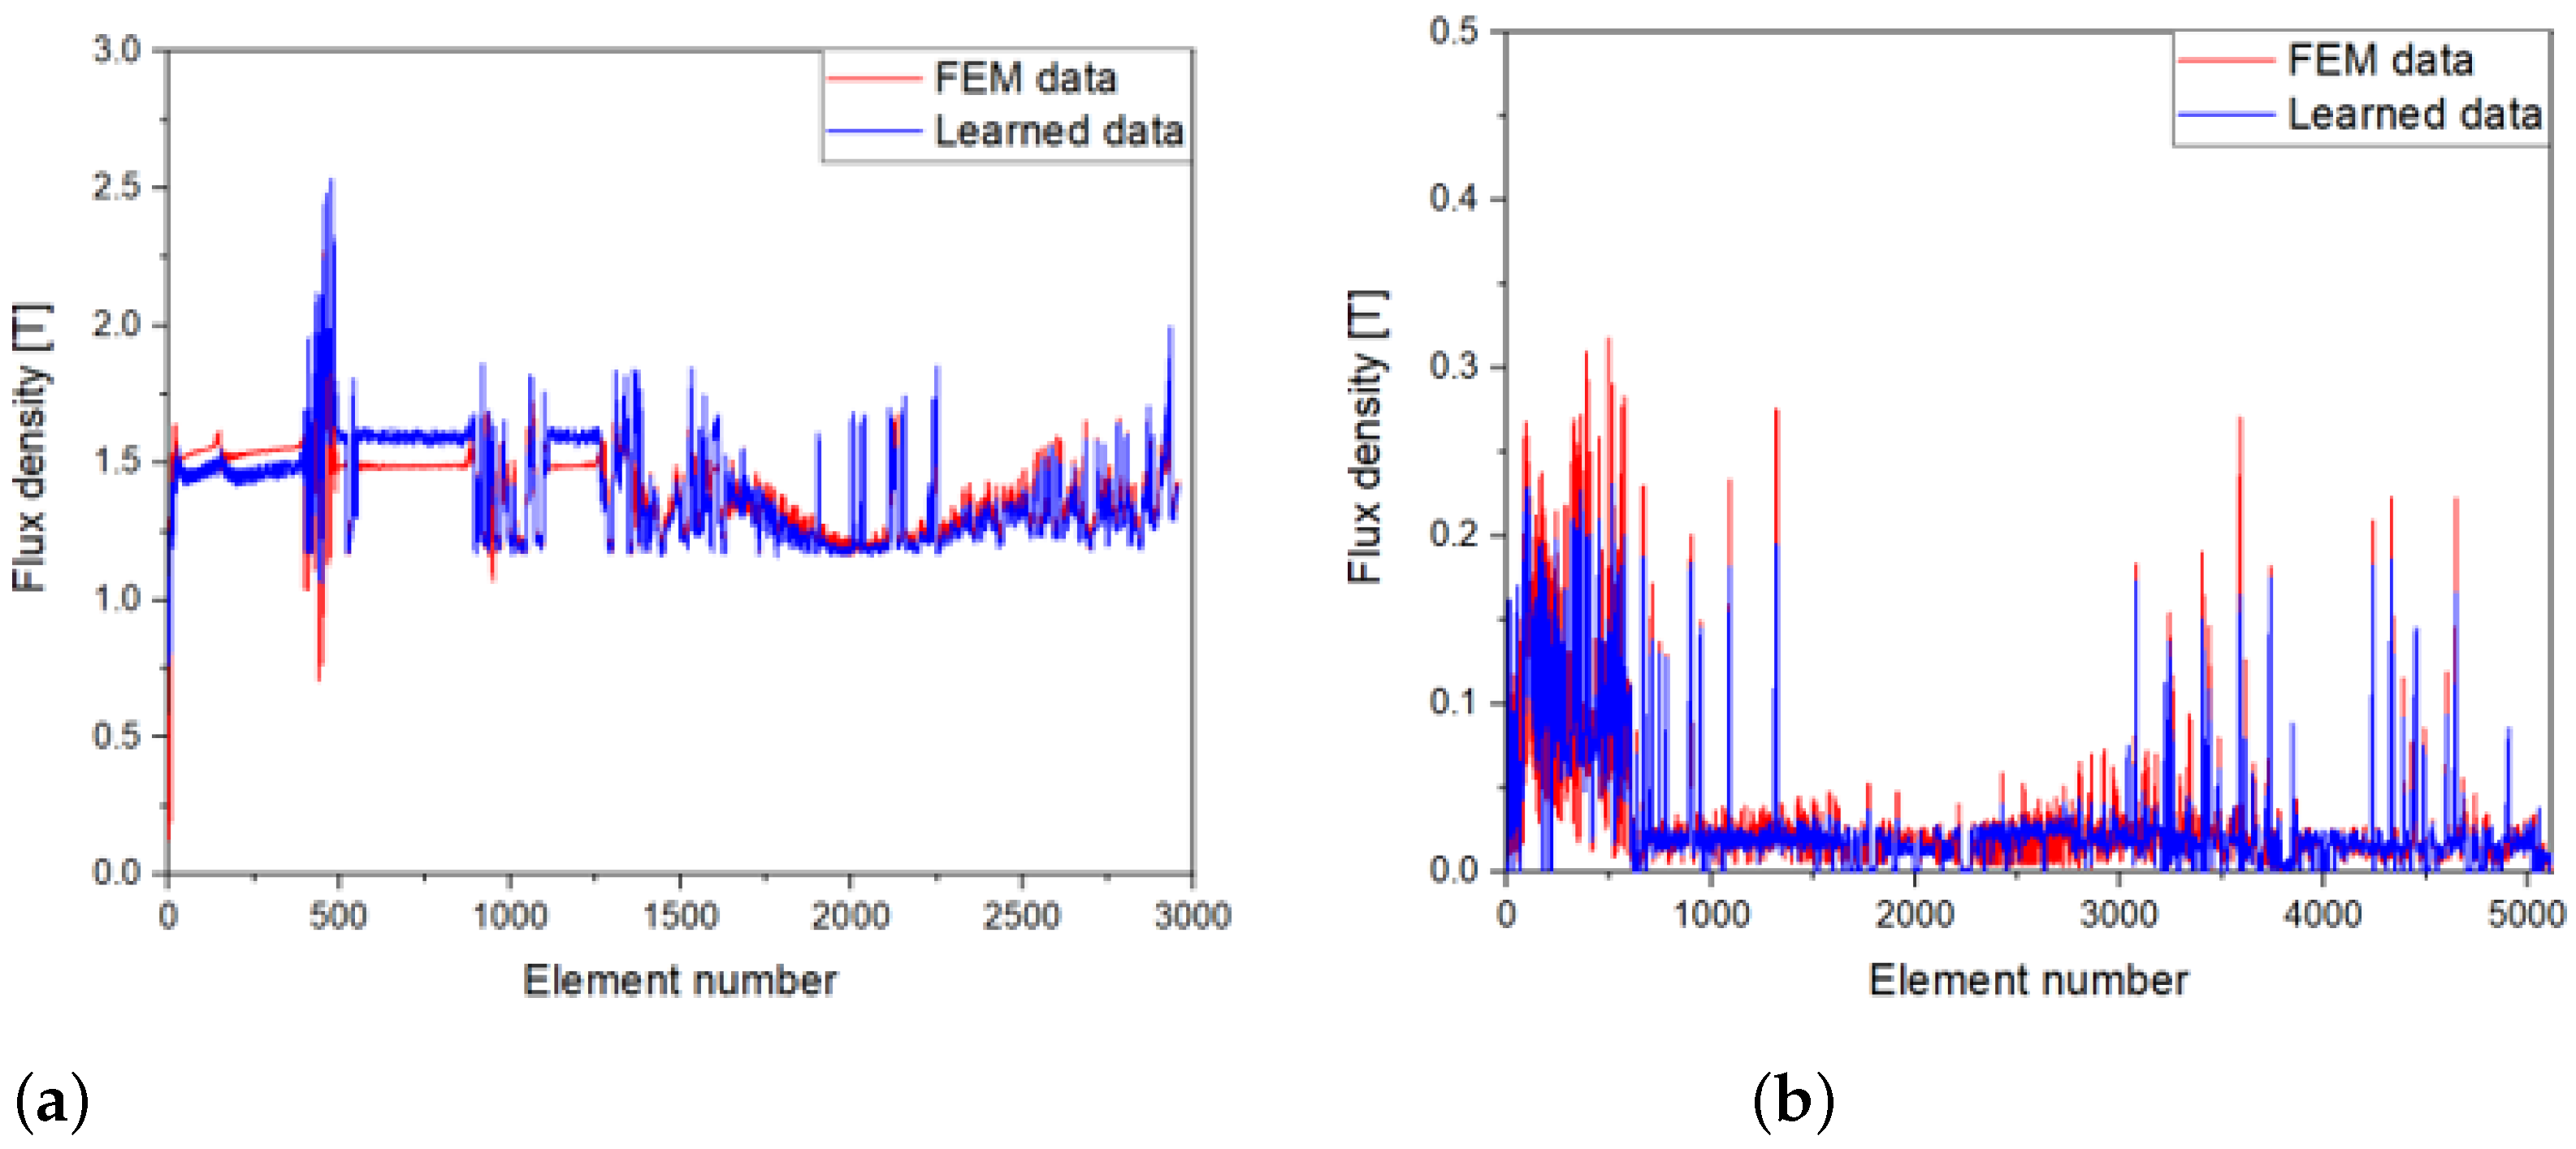
3.3. Learning Process for Flux Density Based on the NN

A NN is a learning model for obtaining non-linear functions that can be applied to a system with numerous input and output data. A diagram of a NN, which comprises input x, hidden z, and output layers y, is presented in Figure 9, and the relationship between these layers is expressed using weights w j i and w k j , biases w j 0 and w k 0 , and activation functions h and σ, as indicated by Equations (6) and (7) [18]:
z j = h ( i = 1 D w j i x i + w j 0 )
y k = σ ( j = 1 M w k j z j + w k 0 )
where D, M, and K mean the number of inputs, hidden, and output units, respectively. In this study, the harmonic orders of flux density, as shown in Figure 8, in all elements of the steel are obtained when establishing the data map, and learned by the NN to make a function of the d-q currents. Accordingly, the parameter D and K are set as 2 and 2956 or 5114, respectively, which mean d-q currents and the number of mesh elements on the stator or rotor as shown in Figure 10, to learn each harmonic order on the elements; hence, total 60 learning models are established to obtain the harmonics from 1st to 60th order. The parameters and activation function applied to learning model are listed in Table 3. Training set means the number of analysis points for the data map as shown in Figure 2, and Logistic sigmoid function, which is widely used for learning model, is employed for activation function [18,19,20,21,22]. The ratio of training, test, and validation samples are determined as 0.7, 0.15, and 0.15, respectively, and learning process is carried out by employing MATLAB Neural Network Pattern Recognition tool.
With above parameters, the examples of learning performance, which is defined as mean squared error, on the stator and rotor are depicted in Figure 11. Additionally, the learned harmonics on the elements are compared with FEM data in Figure 12. The 1st and 12th harmonic orders are chosen as examples on the stator and rotor, respectively, because they are most significant orders on each part as shown in Figure 8, and the learning results seem to agree well.

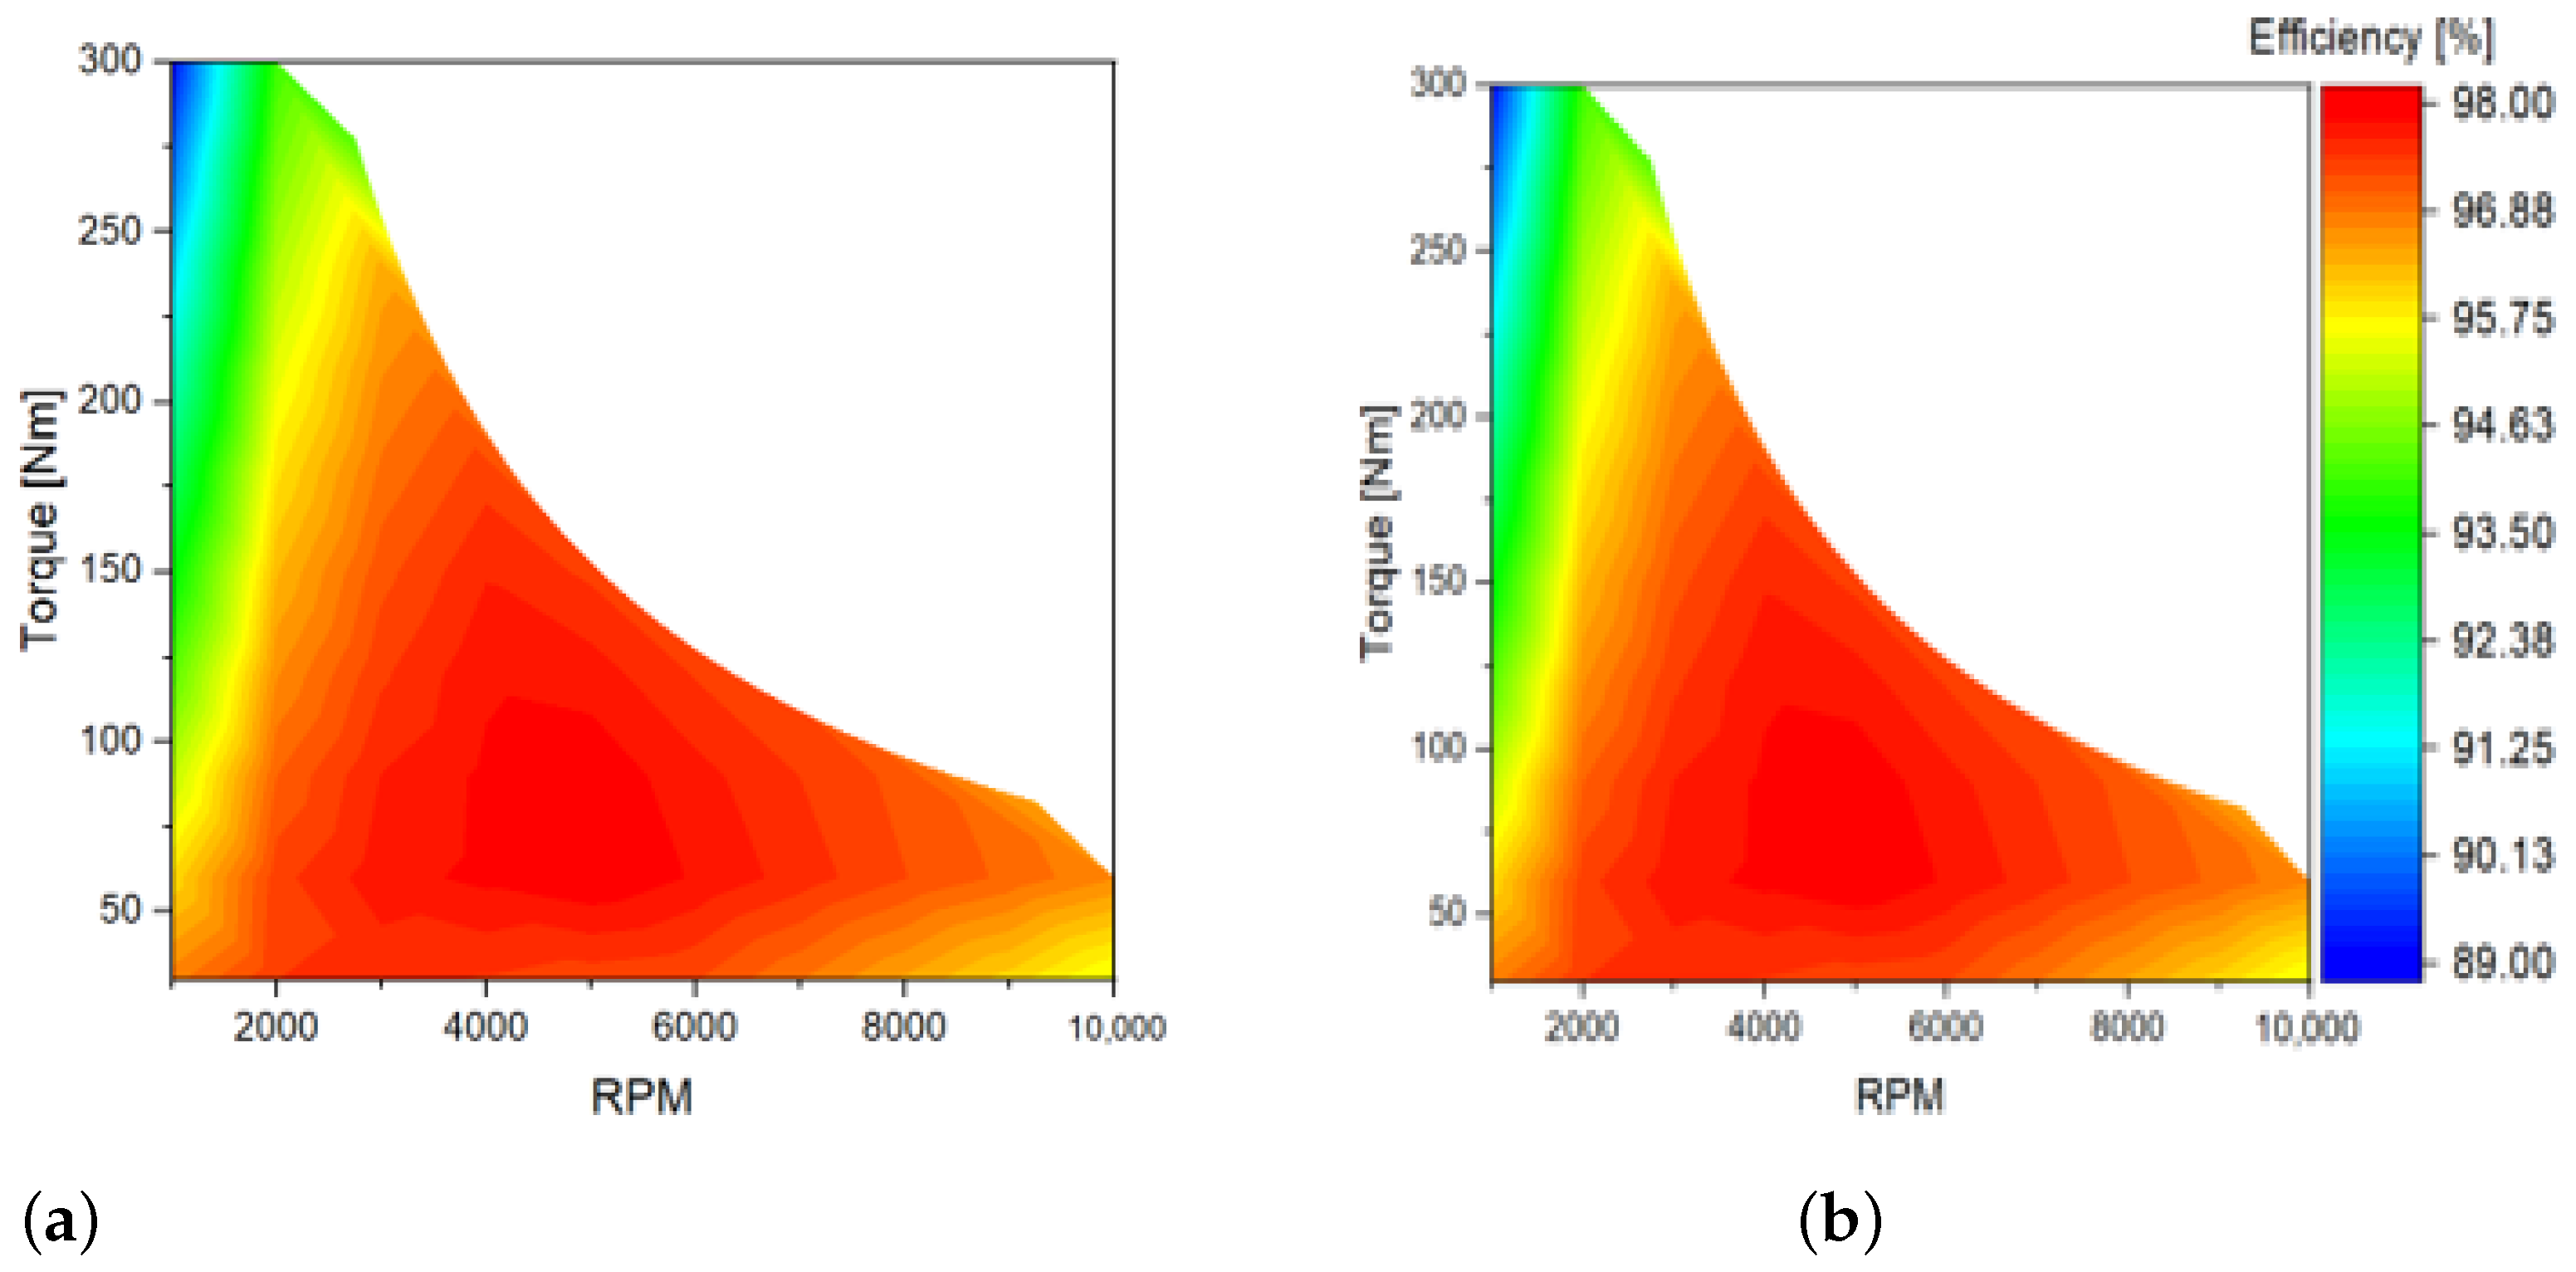
4. Results of the Proposed Method

We define 53 operating points to obtain the efficiency map, as shown in Figure 13, and determine the input d-q currents at each point based on the data map. Additionally, the flux density harmonics at all the points are computed using the learned data, and the iron losses are calculated using Equations (3) and (4). The results, including the iron loss and efficiency maps, of the conventional (FEM) and proposed methods are compared, as shown in Figure 14 and Figure 15, respectively, using a computer with a 3.60 GHz CPU and 32.0 GB memory.
As shown in Table 4, the performance of the proposed method are compared with those of the conventional method. In the case of the proposed method, the learning time is 420 s, and the time required for the loss calculation using Equations (3) and (4) is only 5 s per point; thus, the total time to establish the efficiency map is 2594 s. However, 95 s per point is required for the loss analysis when using the conventional method, and the total time is 5865 s, which is more than 2.3 times that required for the proposed method. The maximum error ratios of iron loss and efficiency among the 53 points are 7.3% and 0.096%, respectively.
The results obtained using the proposed method, as shown in Figure 14 and Figure 15, and Table 4, agree well with the results of the conventional method, and the time consumed is also significantly reduced by approximately 55.8%. These results illustrate the effectiveness of the proposed approach in obtaining the efficiency map within reduced time, and ensure the high accuracy by employing a NN.

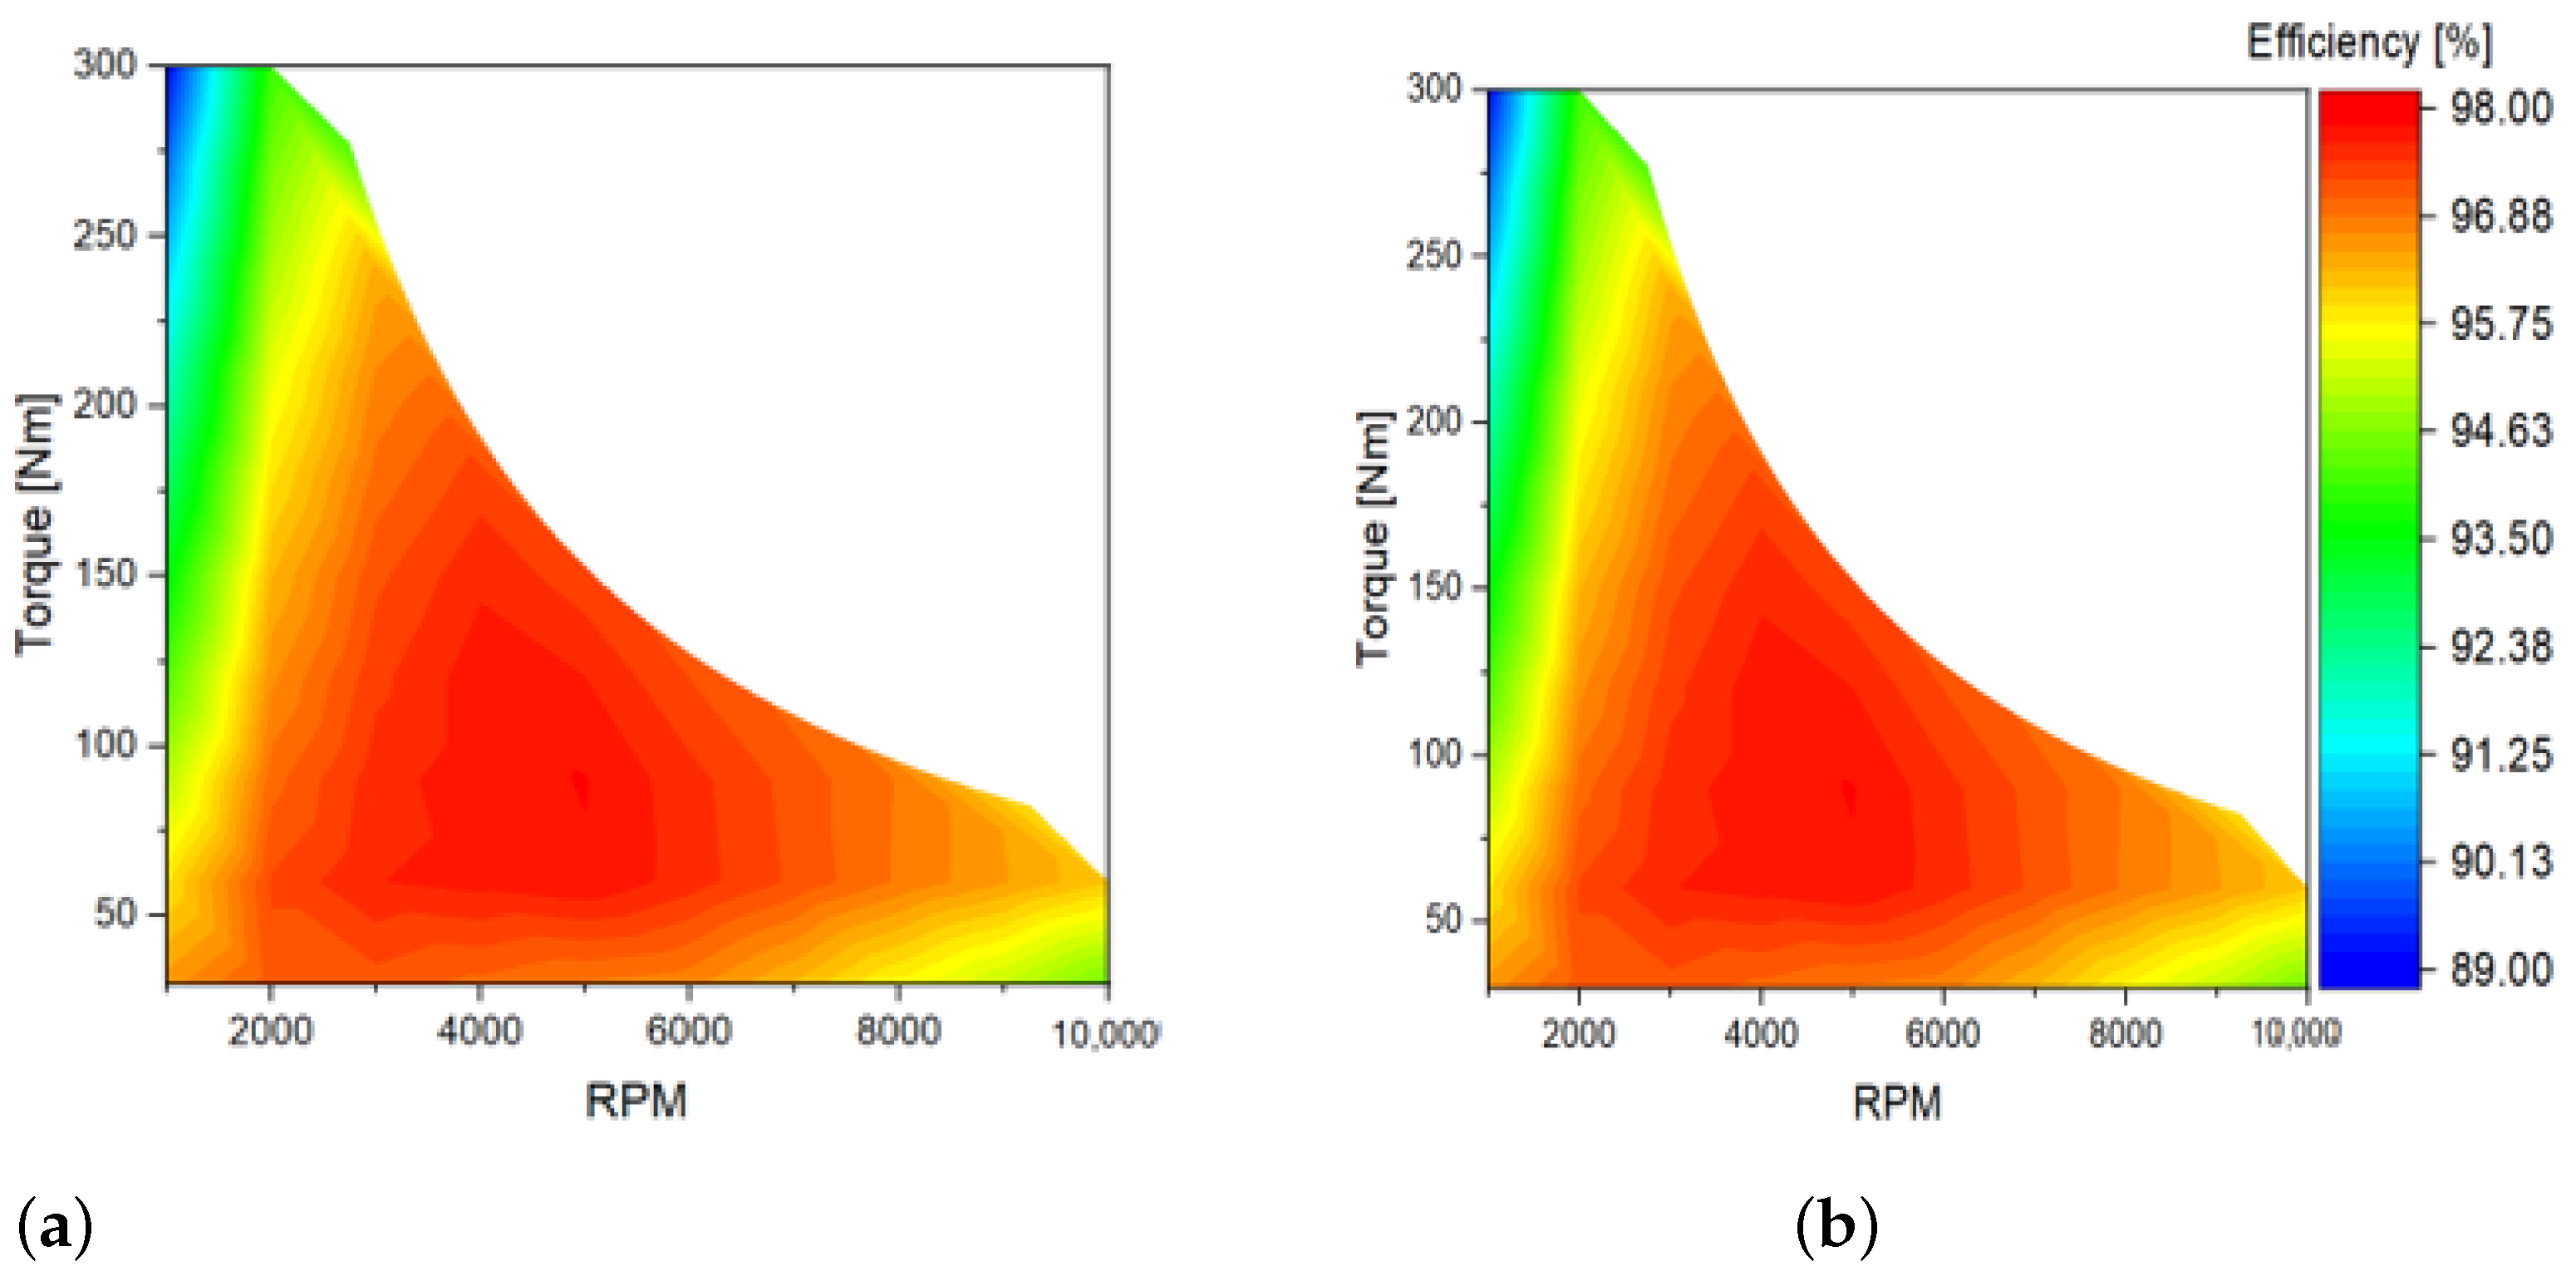
5. Additional Analysis for Validation of the Proposed Method by Applying Modified Model

5.1. Configuration of Modified Model

As discussed in the previous section, we establish the efficiency map by using FEM and NN, and the results are found to be highly accurate. However, to further validate the performance of the proposed method, we analyze a modified model applied 2-layered permanent-magnet rotor, as shown in Figure 16, with the design specifications shown in Table 1.

5.2. Analysis and Validation of the Proposed Method

The validation is carried out by employing the identical learning parameters expressed in Table 3. Of course, the number of output units of the rotor are changed to 4,333 owing to the modified configuration. The operating points are also same as those in Figure 13. Using the proposed method, the learning process for the modified model is carried out, and the learned harmonics that are also chosen as the 1st and 12th harmonic orders of flux density on all the elements are compared with the FEM data in Figure 17.
The learning results agree well along with the results in Figure 12. Using the learned data, iron loss and efficiency maps are established and compared with those obtained using the conventional method as shown in Figure 18 and Figure 19, and the detailed results are presented in Table 5. The total time required to establish the efficiency map using the proposed method is reduced by 58.7%, i.e., from 5623 s to 2322 s. The maximum error ratios of the iron loss and efficiency are 6.5% and 0.01%, respectively. There are differences between the analysis times listed in Table 4 and Table 5, because the number of elements in both rotor models is not same as explained previously. From the analysis time and accuracy points of view, it is apparent that the performance of the proposed method is validated by the further analysis of the modified model.

6. Conclusions

In the case of motors with a wide operating region, such as EV propulsion motors, because it is essential to obtain efficiency map, the FEM has been used to analyze iron loss. Although this approach has high accuracy, it is highly time-consuming owing to the nonlinearity and post-processing required for calculating iron loss. Therefore, in this paper, we introduced a novel method that employs the FEM and an NN to obtain an efficiency map of the propulsion IPMSMs.
When carrying out the analysis for the data map, the harmonic orders of the flux density for all the elements on the electrical steel are computed and learned by applying the NN. Using the learned data, we calculate the iron loss at each operating point via the harmonic loss method, and establish an efficiency map.
As above-mentioned, compared with the conventional method, the proposed approach reduced the computational time while also maintaining high accuracy. Moreover, further validation is carried out by applying the modified rotor model, and the results agree with those of the conventional method. These results indicate that the proposed method has high performance in establishing the efficiency map of propulsion motors by combining the FEM and learning methods.

Author Contributions

Conceptualization, C.-H.K. and J.C.; Data curation, J.C.; Investigation and Writing—original draft, S.-B.J.; Writing—review & editing, J.H.L., Y.-J.K., and S.-Y.J.; Project administration, S.-Y.J. All authors have read and agreed to the published version of the manuscript.

Funding

This research was supported by the “Human Resources Program in Energy Technology” of the Korea Institute of Energy Technology Evaluation and Planning (KETEP), granted financial resource from the Ministry of Trade, Industry & Energy, Republic of Korea (No. 20184030202190), and National Research Foundation of Korea (NRF) grant funded by the Korea Government (MSIT). (No. 2018R1A2B2006961).

Conflicts of Interest

The authors declare no conflict of interest.

References

  1. Chau, K.T.; Chan, C.C.; Liu, C. Overview of permanent-magnet brushless drives for electric and hybrid electric vehicles. IEEE Trans. Ind. Electron. 2008, 55, 2246–2257. [Google Scholar] [CrossRef] [Green Version]
  2. Seo, J.H.; Kwak, S.Y.; Jung, S.Y.; Lee, C.G.; Chung, T.K.; Jung, H.K. A Research on Iron Loss of IPMSM With a Fractional Number of Slot Per Pole. IEEE Trans. Magn. 2009, 45, 1824–1827. [Google Scholar] [CrossRef]
  3. Dutta, R.; Rahman, M.F. Design and analysis of an interior permanent magnet (IPM) machine with very wide constant power operation range. IEEE Trans. Energy Convers. 2008, 23, 25–33. [Google Scholar] [CrossRef]
  4. Jung, H.C.; Park, G.J.; Kim, D.J.; Jung, S.Y. Optimal Design and Validation of IPMSM for Maximum Efficiency Distribution Compatible to Energy Consumption Areas of HD-EV. IEEE Trans. Magn. 2017, 53. [Google Scholar] [CrossRef]
  5. Chen, X.; Wang, J.B.; Sen, B.; Lazari, P.; Sun, T.F. A High-Fidelity and Computationally Efficient Model for Interior Permanent-Magnet Machines Considering the Magnetic Saturation, Spatial Harmonics, and Iron Loss Effect. IEEE Trans. Ind. Electron. 2015, 62, 4044–4055. [Google Scholar] [CrossRef]
  6. Zhu, S.; Wang, H.; Zhang, J.W.; Lu, Z.P.; Cheng, M. Fast Calculation of Carrier Harmonic Loss in Permanent Magnet of IPMSM Under PWM VSI Supply Over Entire Working Range. IEEE Trans. Energy Convers. 2019, 34, 1581–1592. [Google Scholar] [CrossRef]
  7. Krasopoulos, C.T.; Beniakar, M.E.; Kladas, A.G. Multicriteria PM Motor Design Based on ANFIS Evaluation of EV Driving Cycle Efficiency. IEEE Trans. Transport. Electrific. 2018, 4, 525–535. [Google Scholar] [CrossRef]
  8. Mohammadi, M.H.; Lowther, D.A. A Computational Study of Efficiency Map Calculation for Synchronous AC Motor Drives Including Cross-Coupling and Saturation Effects. IEEE Trans. Magn. 2017, 53. [Google Scholar] [CrossRef]
  9. Stipetic, S.; Goss, J.; Zarko, D.; Popescu, M. Calculation of Efficiency Maps Using a Scalable Saturated Model of Synchronous Permanent Magnet Machines. IEEE Trans. Ind. Appl. 2018, 54, 4257–4267. [Google Scholar] [CrossRef]
  10. Asanuma, J.; Doi, S.; Igarashi, H. Transfer Learning through Deep Learning: Application to Topology Optimization of Electric Motor. IEEE Trans. Magn. 2020, 56. [Google Scholar] [CrossRef]
  11. Qian, W.; Panda, S.K.; Xu, J.X. Speed ripple minimization in PM synchronous motor using iterative learning control. IEEE Trans. Energy Convers. 2005, 20, 53–61. [Google Scholar] [CrossRef]
  12. Kao, I.H.; Wang, W.J.; Lai, Y.H.; Perng, J.W. Analysis of Permanent Magnet Synchronous Motor Fault Diagnosis Based on Learning. IEEE Trans. Instrum. Meas 2019, 68, 310–324. [Google Scholar] [CrossRef]
  13. Zaman, S.M.K.; Liang, X.D. An Effective Induction Motor Fault Diagnosis Approach Using Graph-Based Semi-Supervised Learning. IEEE Access 2021, 9, 7471–7482. [Google Scholar] [CrossRef]
  14. Ionel, D.M.; Popescu, M.; McGilp, M.I.; Miller, T.J.E.; Dellinger, S.J.; Heideman, R.J. Computation of core losses in electrical machines using improved models for laminated steel. IEEE Trans. Ind. Appl. 2007, 43, 1554–1564. [Google Scholar] [CrossRef] [Green Version]
  15. Yamazaki, K.; Kato, Y. Iron loss analysis of interior permanent-magnet synchronous motors-variation of main loss factors due to driving condition. IEEE Trans. Ind. Appl 2006, 42, 1045–1052. [Google Scholar] [CrossRef]
  16. Sul, S.K. Control of Electric Machine Drive System; IEEE Press Series on Power Engineering; Wiley-IEEE: Hoboken, NJ, USA, 2011. [Google Scholar]
  17. Park, G.J.; Son, B.; Kim, Y.J.; Jung, S.Y. Reducing computational time strategy for estimating core loss with spatial and temporal periodicity. In Proceedings of the 2016 IEEE Transportation Electrification Conference and Expo, Asia-Pacific (ITEC Asia-Pacific), Busan, Korea, 1–4 June 2016; pp. 460–464. [Google Scholar]
  18. Bishop, C.M. Pattern Recognition and Machine Learning; Information Science and Statistics; Springer: New York, NY, USA, 2006; pp. 225–290. [Google Scholar]
  19. Nicolas, P.R. Scala for Machine Learning, 2nd ed.; Build Systems for Data Processing, Machine Learning, and Deep Learning; Packt: Birmingham, UK, 2017. [Google Scholar]
  20. Lin, F.J.; Shen, P.H.; Yang, S.L.; Chou, P.H. Recurrent radial basis function network-based fuzzy neural network control for permanent-magnet linear synchronous motor Servo drive. IEEE Trans. Magn. 2006, 42, 3694–3705. [Google Scholar] [CrossRef]
  21. Lin, F.J.; Wai, R.J.; Duan, R.Y. Neural-network controller for parallel-resonant ultrasonic motor drive. IEEE Trans. Control Syst. Technol. 1999, 7, 494–501. [Google Scholar]
  22. Wai, R.J.; Yao, J.X.; Lee, J.D. Backstepping Fuzzy-Neural-Network Control Design for Hybrid Maglev Transportation System. IEEE Trans. Neural Netw. Learn. Syst. 2015, 26, 302–317. [Google Scholar] [PubMed]
Figure 1. Flowcharts for establishing an efficiency map: (a) conventional method (b) proposed method.
Electronics 10 01049 g001
Figure 2. Analyzed points for the data map considering the maximum current.
Electronics 10 01049 g002
Figure 3. Propulsion motor.
Electronics 10 01049 g003
Figure 4. Mesh for the 2D-FEM.
Electronics 10 01049 g004
Figure 5. Flux linkage data map based on the d-q currents: (a) d-axis (b) q-axis.
Electronics 10 01049 g005
Figure 6. Sample of R-T flux density waveform at (a) Point1 (stator) (b) Point2 (rotor).
Electronics 10 01049 g006
Figure 7. Iron loss density per frequency and flux density according to the frequency (30PNF1600).
Electronics 10 01049 g007
Figure 8. Sample of harmonic orders of flux density: (a) Point1 (stator) (b) Point2 (rotor).
Electronics 10 01049 g008
Figure 9. Structure of the NN diagram.
Electronics 10 01049 g009
Figure 10. Learning diagram (e.g.,: nth harmonic order): (a) stator. (b) rotor.
Electronics 10 01049 g010
Figure 11. Example of learning performance: (a) stator. (b) rotor.
Electronics 10 01049 g011
Figure 12. Comparison of harmonics by FEM and learning model: (a) stator. (b) rotor.
Electronics 10 01049 g012
Figure 13. Analyzed operating points of the propulsion IPMSM.
Electronics 10 01049 g013
Figure 14. Iron loss maps: (a) conventional method. (b) proposed method.
Electronics 10 01049 g014
Figure 15. Efficiency maps: (a) conventional method. (b) proposed method.
Electronics 10 01049 g015
Figure 16. Modified model with a 2-layered permanent-magnet rotor
Electronics 10 01049 g016
Figure 17. Comparison of harmonics by the FEM and learning model for the modified model: (a) stator. (b) rotor.
Electronics 10 01049 g017
Figure 18. Iron loss maps: (a) conventional method. (b) proposed method.
Electronics 10 01049 g018
Figure 19. Efficiency maps: (a) conventional method. (b) proposed method.
Electronics 10 01049 g019
Table 1. Design specification of analyzed motor.
ParameterValue
Poles & slots8 & 48
Stack length [mm]117.2
Outer diameter [mm]250
Steel of stator & rotor30PNF1600
Magnet gradeN46UH
Max. current density [A r m s /mm 2 ]15
Current limit [A p k ]640
Battery voltage [V d c ]265
Max. speed [rpm]10,000
Table 2. Computation time for obtaining data map of both methods.
ParameterConventional MethodProposed Method
Analyzed Points83
Analysis Step21 (1/6 Period)61 (1/2 Period)
Analysis Time (s)1023
Total Time (s)8301909
Table 3. Learning Parameters.
ParametersValue
Training set83
Activation functionLogistic sigmoid
Input unit (d-q currents)2
Output unit (Mesh elements)Stator2956
Rotor5114
Table 4. Comparison of Results
PerformanceConventional MethodProposed Method
Data map Analysis (s)8301909
Analyzed Points53 Points
Learning Time (s)-420
Analysis Time (s)955
Total Time (s)58652594
Max. Error (%)Iron Loss-7.3
Efficiency-0.096
Table 5. Comparison of Analysis Results
PerformanceConventional MethodProposed Method
Data map Analysis (s)7471660
Analyzed Points53 Points
Learning Time (s)-397
Analysis Time (s)925
Total Time (s)56232322
Max. Error (%)Iron Loss-6.5
Efficiency-0.10
Publisher’s Note: MDPI stays neutral with regard to jurisdictional claims in published maps and institutional affiliations.

