
Evaluation of Multi-Objective Optimization Techniques for Resilience Enhancement of Electric Vehicles


1
Department of Electrical and Computer Engineering, University of Alberta, Edmonton, AB T6G 2G2, Canada
2
Department of Electrical Engineering, Incheon National University, 12-1 Songdo-dong, Yeonsu-gu, Incheon 22012, Korea
3
Research Institute for Northeast Asian Super Grid, Incheon National University, 119 Academy-ro, Yeonsu-gu, Incheon 22012, Korea
*
Author to whom correspondence should be addressed.
Electronics 2021, 10(23), 3030; https://0-doi-org.brum.beds.ac.uk/10.3390/electronics10233030
Submission received: 2 November 2021
/
Revised: 25 November 2021
/
Accepted: 1 December 2021
/
Published: 4 December 2021
(This article belongs to the Special Issue 10th Anniversary of Electronics: Related Researches in Electrical and Autonomous Vehicles)
Abstract
:The pervasiveness of electric vehicles (EVs) has increased recently, which results in the interdependence of power and transport networks. Power outages may adversely impact the transportation sector, and the available energy may not be sufficient to meet the needs of all EVs during such events. In addition, EVs will be used for diverse purposes in the future, ranging from personal usage to emergency response. Therefore, the allocation of energy to different EVs may have different degrees of societal-, community-, and individual-level benefits. To capture these diverse aspects, the energy allocation problem to EVs during outages is modeled as a multiobjective optimization (MOO) problem in this study. Three indices are formulated to quantify the value of different EVs for societies, communities, and individuals during outages, and, correspondingly, three objective functions are formulated. The formulated MOO problem is solved using the five most widely used MOO solution methods, and their performance is evaluated. These methods include the weighted-sum method, lexicographic method, normal boundary intersection method, min–max method, and nondominated sorting genetic algorithm II. To compare the performance of these methods, two indices are proposed in this study, which include the demand fulfillment index and total demand fulfillment index. The former is for analyzing the demand fulfillment ratio of different priority EVs, while the latter is for the demand fulfillment analysis of the whole EV fleet requiring a recharge. In addition, the computational complexity, variance, and additional constraints required by each method are also analyzed. The simulation results have shown that the lexicographic method has the best performance when the relative priorities are known, while the min–max method is the most suitable method if the priorities are not known.
1. Introduction
Multi-objective optimization (MOO) is generally used to solve problems involving two or more conflicting objectives, and most of the problems in the real world are multi-objective in nature [1]. In contrast to single-objective optimization problems, a single solution generally cannot minimize/maximize all the objective functions simultaneously in MOO problems [2]. Instead, several solutions can be considered as optimal considering trade-offs among the different objectives. The set of all these possible optimal solutions form a Pareto front. A solution is known as Pareto optimal if none of the objective functions can be improved without deteriorating other objective functions. All Pareto optimal solutions are considered equally good if no preference information is provided [3]. Due to the ability to provide acceptable solutions for various complex real-world problems, MOO is used in several fields, including power systems and microgrids [4,5,6,7,8].
A multi-objective sizing problem is formulated [4] considering three objectives, which include the loss of power supply, cost of energy, and dumped energy in microgrids. The developed model is solved using a multi-objective grey wolf optimizer. Similarly, goal-programming is used [5] to solve a MOO problem where the degradation of batteries and curtailment of renewables in off-grid microgrids are the two conflicting objectives. The smoothness of the power output and total annual power amount are simultaneously considered [6] for an integrated hydro/PV system. A non-dominated sorting genetic algorithm (NSGA-II) is utilized to solve the formulated problem. Similarly, the dimensioning of the hybrid power systems, including renewables, is considered [7] for optimality and robustness. A multi-objective genetic algorithm is used to solve the planning problem. A MOO problem is formulated [8] for a hybrid storage system for maximizing the utilization, reducing energy consumption, and preventing overcharging of the energy storage system.
Recently, due to the enhanced penetration of electric vehicles (EVs), several studies are being conducted on applying MOO for various aspects of EVs [9,10,11,12,13]. A MOO problem is formulated [9] for maximizing the profit while minimizing the deviation of profit for different EVs. The epsilon-constraint method is used to solve the formulated problem. Economic loss and peak-to-valley deviations of EVs are considered as the two competing objectives in one study [10], and a modified weight aggregated particle swarm optimization algorithm is used. The power quality requirements of microgrids and user requirements of EVs are considered in another study [11], and a dynamic programming-based model is developed to solve the MOO problem. Different uncertainties in the market price and demand response are considered for EVs in another study [12], and a MOO problem is formulated. The two objectives considered are the cost and deviation of cost, and the weighted sum (WS) method, along with a fuzzy engine, is used to solve the problem. The fuel consumption cost and emissions are considered [13] for a parameter matching optimization problem in EVs. To solve the problem, the MOO problem is transformed into a single-objective optimization problem using the weighted-sum method.
Due to the enhanced penetration of EVs, the interdependence of transport and power networks has increased. It could be challenging to provide power to EVs during major power outages. In addition, EVs are predicted to be the major source of transportation in the future; i.e., they will be used for diverse purposes ranging from personal use to emergency response [14]. The allocation of energy to EVs during power outages is a challenging issue, and it can be modeled as a MOO problem. Recently, a few studies have been conducted on the energy allocation of EVs during major power outages. The prioritization of EVs is considered in particular studies [15,16] to allocate available energy to EVs during different events. Several factors are considered [15] to determine the EV priority, such as battery energy level, distance to be traveled, and EV battery capacity. A game-theoretic approach is used [16], and a priority factor is included in the utility function to prioritize different classes of EVs. The energy allocation to EVs is considered as a MOO problem in one study [14], and social welfare, community wellbeing, and individual satisfaction are considered as the objectives.
However, there are several methods for solving MOO problems, such as methods with a prior articulation of the preferences, methods with a posterior articulation of the preferences, methods with no articulation of the preferences, and multi-objective heuristic methods [2]. Some methods could be more beneficial for some cases than others. Therefore, it is required to analyze all these categories of MOO methods and determine the most suitable candidate for the problem at hand. Power allocation to EVs is a new yet critical issue for the future regarding transportation systems during outages. There is no such study on the comparison of different MOO methods for energy allocation to EVs during outages. In addition, indices are required to compare/analyze the performance of different methods on the same scale.
An attempt is made in this study to address the research gaps mentioned in the previous paragraph. Firstly, a MOO problem is formulated for allocating energy to EVs during outages. The developed MOO problem comprises three objective functions, one each for the societal level, community level, and individual level benefits of allocating energy to a particular EV. Then, one index is formulated for each of the three benefit levels mentioned above. Finally, EVs are ranked based on their value for society, the community, and individuals using the three indices. Five major MOO methods are selected, and their performance is analyzed for allocating energy to EVs during power outages. At least one method is selected from the three major categories of MOO, which includes methods with prior, posterior, and no articulation of preferences. In addition, the performance of the NSGA-II is also analyzed. To compare the performance of these methods, two indices are also proposed in this study: the demand fulfillment index and total demand fulfillment index. The demand fulfillment index considers the relative priority of different EVs while evaluating the number of EVs with the demand being fulfilled. However, the total demand fulfillment index compares the total number of EVs requiring a recharge to the total number of EVs with the demand being fulfilled. The performance of all five methods is compared based on the proposed indices. In addition, several other factors, such as the variance, computational complexity, and additional required constraints, are also compared for all the methods.
2. Multi-Objective Optimization Methods and Energy Allocation to EVs
MOO, also known as vector optimization, is the process of simultaneously optimizing a set of objective functions [2]. Therefore, MOO techniques are known to be more realistic options for designers due to their ability to satisfy several objectives simultaneously [1]. However, even for a trivial problem, it is unlikely to find a single solution that optimizes all the functions at the same time [3]. In most cases, the objective functions are conflicting in nature, i.e., optimizing one can deteriorate the other and vice versa. Therefore, the goal of MOO techniques is to find a trade-off between these conflicting objectives. There could be several trade-off solutions for each MOO problem, and these solutions are known as Pareto optimal solutions. A solution is known to be Pareto optimal if none of the objective functions can be improved without deteriorating other objective functions. The set of all the Pareto optimal solutions is known as the Pareto front. All the solutions in the Pareto front are considered equally good and are considered optimal if there is no specific preference for any particular solution.
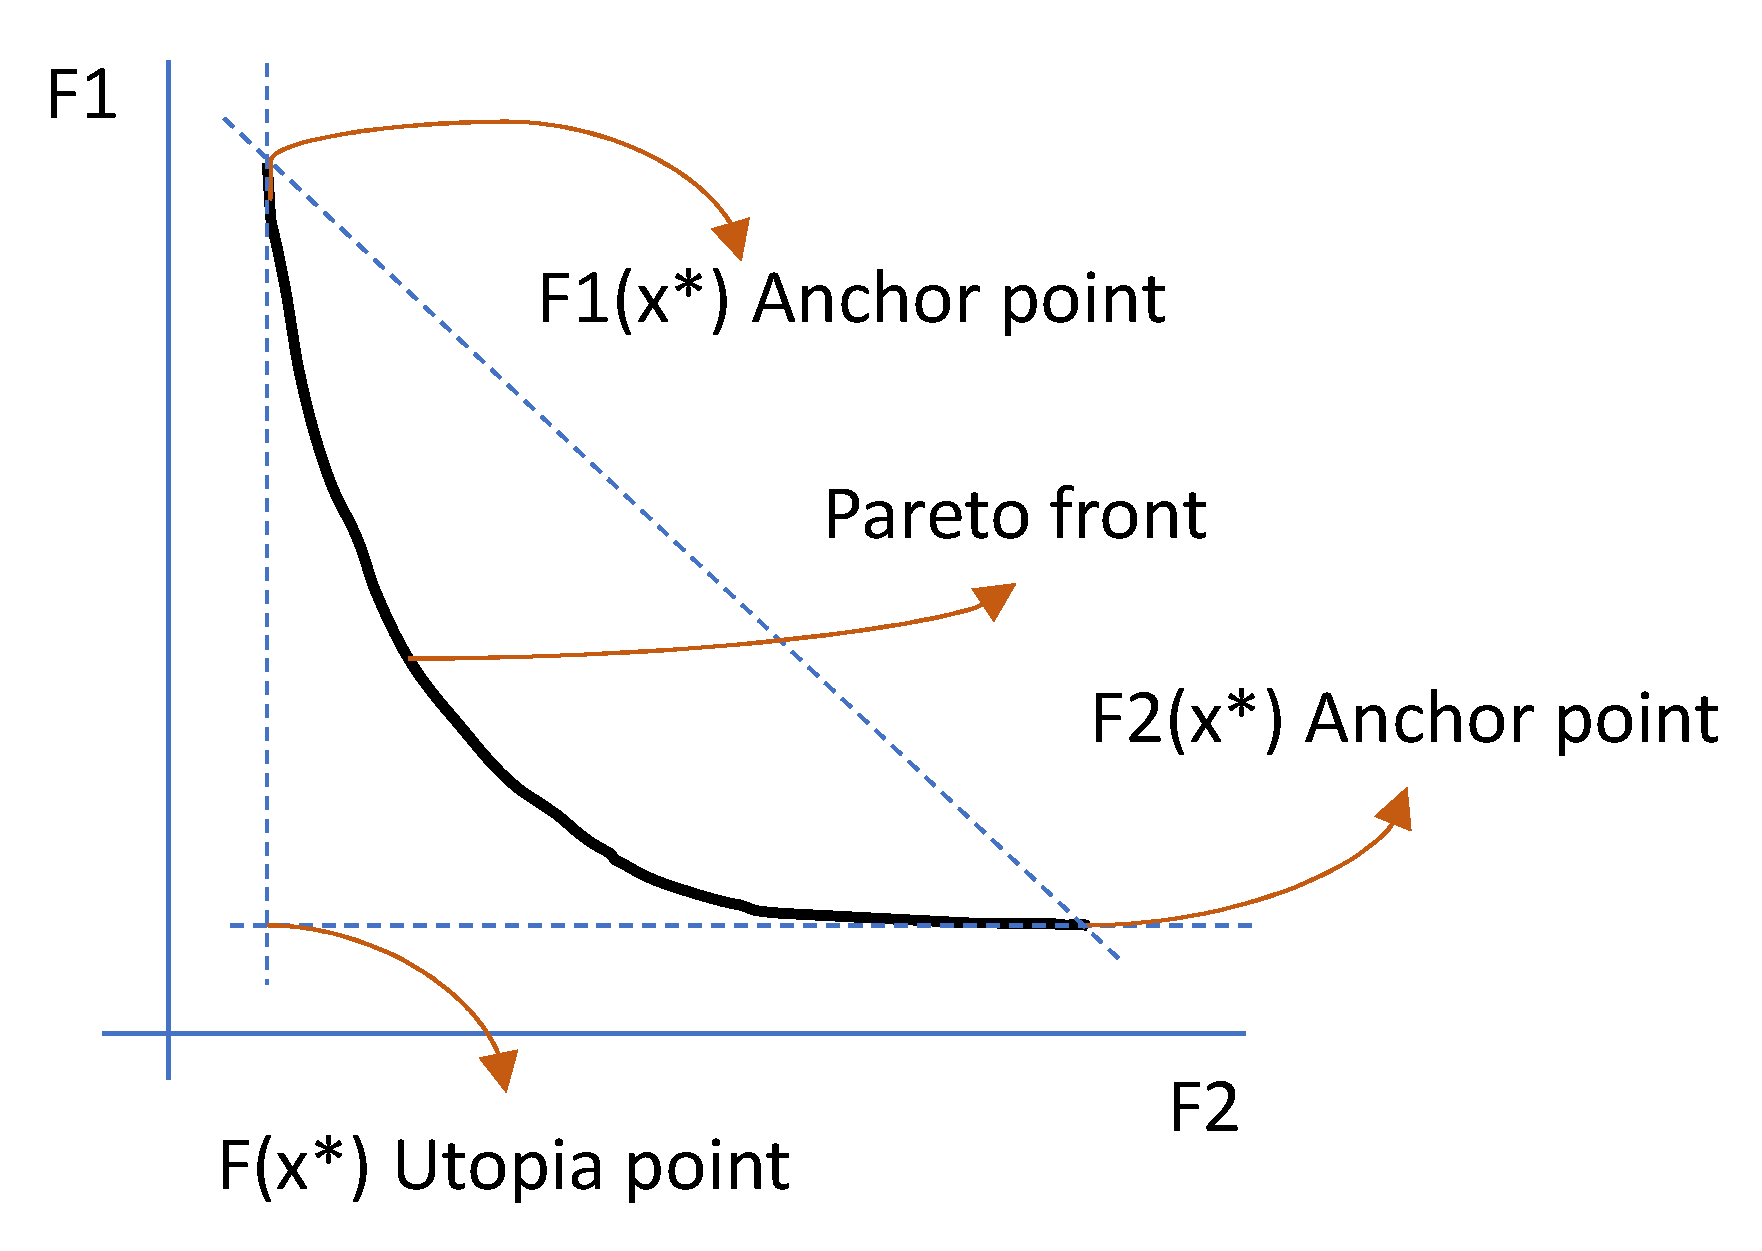
For the sake of visualization, an overview of a hypothetical bi-objective optimization problem is shown in Figure 1. In Figure 1, the anchor points refer to the optimal points of the individual objective functions. In addition, the anchor points refer to the worst value for the other objective function in the case of bi-objective functions [17]. The utopia point is the ideal point where both the objective functions are optimized, which is generally unattainable. However, several methods try to minimize the distance from the utopia point. Finally, all the points on the Pareto front are attainable.
2.1. Categorization of Multi-Objective Optimization Techniques
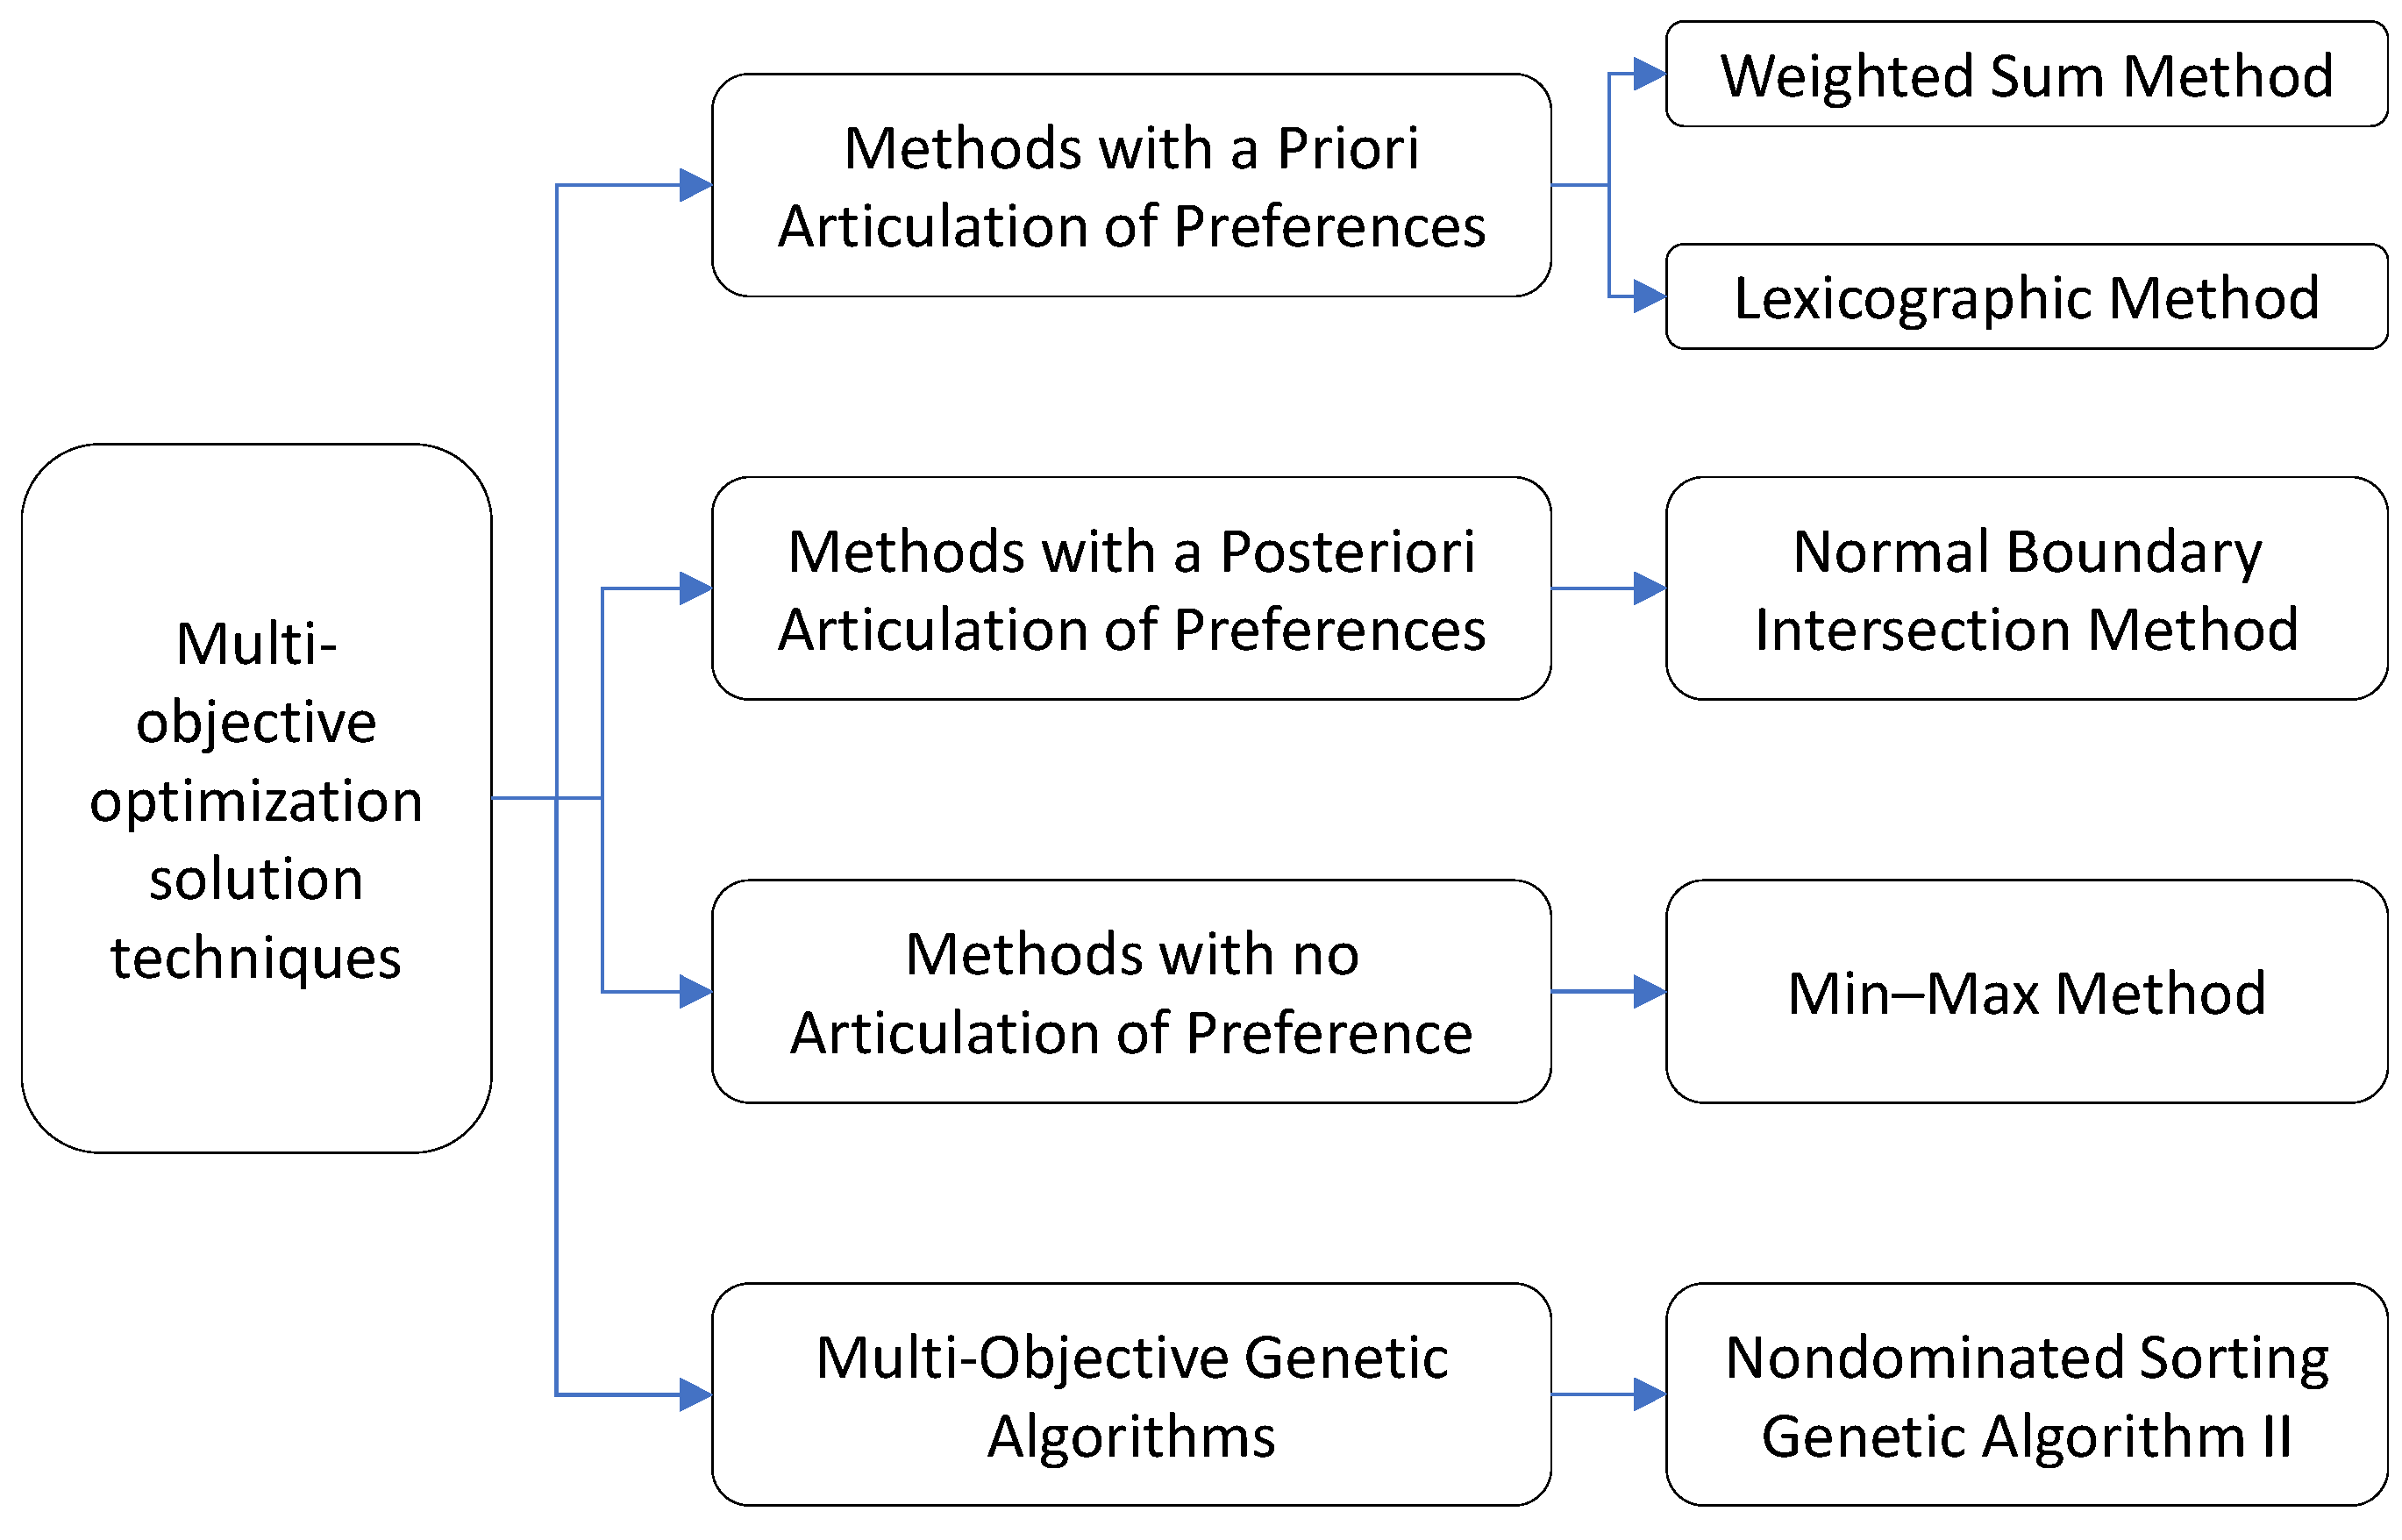
The MOO techniques can be divided into three major groups based on the articulation of preferences. These groups comprise methods with a prior articulation of preferences, methods with a posterior articulation of preferences, and methods with no preferences. In the first case (prior articulation), the preference or priority of different objective functions is known in advance and this information is provided to the optimization algorithm. In the case of the second group (posterior articulation), the Pareto front is obtained first and then an optimal solution is selected from the Pareto front. In addition to these three categories, multi-objective genetic algorithms are also widely used for solving MOO problems. Therefore, an overview of all four of these categories and their representative examples is shown in Figure 2. The performance of all the methods shown in Figure 2 is compared for an energy allocation problem to EVs during system contingencies.
2.2. Energy Allocation to EVs during Contingencies
2.2.1. Power Contingencies and EVs
The penetration of EVs is increasing across the globe in order to reduce the carbon emissions from the transport sector. It is predicted in the Global EV Outlook 2021 report that the size of the EV fleet will reach between 145 and 230 million by 2030 [18]. In the near future, EVs will not only be used for the personal commute but also emergency services, for example, by firefighters and hospitals. In addition, EVs will also be used for evacuation during major outages. During power outages, the locally available energy may not be sufficient to fulfill the needs of all the EVs. Therefore, different factors need to be considered to prioritize EVs and allocate the available energy. Recently, the allocation of power to EVs during major outages has been considered in several studies. For example, a non-cooperative game model is proposed in one case [16], and the energy fulfillment of higher priority EVs is ensured first by including a priority factor in the utility function of the EVs. In another study [14], three objectives are formulated for allocating energy to EVs. These objectives are social welfare, community wellbeing, and individual satisfaction. In another study, the EVs are prioritized and energy allocation is scheduled [19] during both normal congestion and power outages.
Meanwhile, the integration of stationary energy storage and renewables in fast-charging stations is also being studied [20,21,22]. These local resources can reduce the grid impacts of EVs during normal operation and can enhance the resilience of EVs during outages. However, due to the absence of connection with the grid and scarcity of locally available energy, additional factors need to be considered to prioritize EVs during outages. These factors could be the required energy, occupants of EVs, trip purpose, energy level, and time by which recharge is required. Based on these factors and the available energy, different objectives could be formulated. For example, the allocation of energy to all EVs provides individual satisfaction, but the community wellbeing and social welfare depend on the trip purpose and the occupants of the EVs since it is predicted that EVs will be the major source of transportation in the future and will be used for diverse purposes, ranging from personal use to public transport and emergency response. Therefore, these objectives need to be considered in allocating energy to EVs during power outages.
2.2.2. MOO for Power Allocation to EVs
To allocate energy to EVs during contingencies, a MOO problem is formulated in this section, similar to [14]. The overall objective of the MOO problem is to maximize the satisfaction of EV owners/communities using three objective functions as given by (1). The problem is formulated in such a way that the first objective function (2) has the highest precedence; it is followed by the second objective function (3), and the third objective function (4) has the least precedence. The first objective refers to societal-level benefits that can be achieved by allocating energy to a certain EV. The second objective refers to community-level benefits, and, finally, the third objective refers to individual-level benefits, which can be achieved by allocating energy to a certain EV. represent the rank of nth EV corresponding to the first, second, and third objectives. These indices are formulated based on the trip purpose, occupants of EVs, departure time, and the difference between available and required energy. The vector in Equations (2)–(4) is a binary vector that indicates whether the required energy of EVs is fulfilled or not. As indicated by (5), the binary variable takes a value of 1 if the energy allocated to the nth EV () is greater than the required energy (). Otherwise, the binary variable corresponding to the nth EV takes a value of zero. Similarly, represents the energy deficit for nth EV and is computed as in (6). Equation (7) implies that energy allocated to each EV should be less than or equal to the amount of energy required by that EV. Finally, Equation (8) implies that the total amount of allocated energy to all EVs should be less than or equal to the available energy ().
where,
subject to
3. Overview of Selected MOO Techniques
The performance of five MOO techniques is analyzed in this study for the energy allocation problem to EVs as described above. At least one method is selected from the four categories (prior articulation, posterior articulation, no articulation, and genetic algorithms). In addition, two indices are proposed in this study to compare the performance of these techniques and determine the most suitable method for the said problem. Therefore, in the following sections, an overview of all five techniques along with the proposed indices are presented.
3.1. Weighted-Sum Method
The WS method belongs to the methods with a prior articulation of preferences, and it is known to be the most widely used MOO method [17]. In this method, all the objectives are combined to form a single-objective function, as given by (9). Different weights () are assigned to each objective function. Generally, the weights need to fulfill certain conditions, as shown in (10). If the weights are positive and the problem is convex, this method can find the global optimal point.
Subject to
Equations (4)–(7)
3.2. Lexicographic Method
The lexicographic method (LEX) also belongs to the group of methods with a prior articulation of preferences. In this method, the objective functions are arranged in the order of their priority. Then, the most important objective function is solved first, as shown in (11). Then, the second objective function is solved and an additional constraint is added, as given by (12). The additional constraint implies that the first objective function is not allowed to deteriorate from its optimal point (xj*). This process is repeated till all the objective functions are solved or a unique solution is obtained [2]. It can be observed that, in this method, i − 1 constraints are added after solving each objective function, where “i” refers to the number of the current objective function.
Subject to
Equations (4)–(7)
3.3. Normal Boundary Intersection Method
The normal boundary intersection (NBI) method belongs to the group of methods with a posterior articulation of preferences [23]. A generalized formulation for the normal boundary intersection method is shown in Equations (13)–(16). is the payoff matrix of size n x n. Each entry in the payoff matrix can be computed as outlined in (14), where the diagonal elements will be zero. is a vector of positive scalers, and the sum of all elements in each row is equal to 1. The quasi-normal vector can be computed using (16), where e is a column vector of ones. In the case of NBI, the solution point is independent of how the objective functions are scaled [17].
Subject to
Equations (4)–(7)
3.4. Min–Max Method
This min–max (MM) method belongs to the category of MOO algorithm with no articulation of preferences. In some cases, it is difficult for the designers to articulate preferences or provide a preference for any particular objective function. This method provides a way to solve such MOO problems without any articulation of preferences. The MM method can be solved by defining an additional variable as given by (17). Then, all the objective functions are constrained to be not below the variable , as given by (18).
Subject to
Equations (4)–(7)
3.5. Nondominated Sorting Genetic Algorithm II
The nondominated sorting genetic algorithm II (NSGA-II) [24] is the revised version of the original NSGA [25]. The off-spring values () can be generated from parent values () using Equations (19) and (20). The value is computed using (21), where is a random number between 0 and 1 while is the user-defined crossover parameter [17]. Finally, the crowding distance is computed using (22). is the fitness value of the jth objective function at iteration i. Similarly, represent the maximum and minimum values for the jth function.
3.6. Performance Evaluation Indices
To compare the performance of all five MOO techniques, discussed in the previous sections, two indices are proposed in this study. The objective of the energy allocation problem to EVs is to maximize the number of EVs with fulfilled energy demands. Therefore, the first index is formulated to evaluate the number of EVs under priority level i with demand being fulfilled, as given by (23), where is the number of EVs in priority level i with energy demand fulfilled under MOO scheme s. Higher values of demand fulfillment index () represent a higher number of EVs with demand being fulfilled and vice versa. The second index determines the total number of EVs with demand being fulfilled and is named as total demand fulfillment index (). In (24), is the total number of EVs with energy demand fulfilled under MOO scheme s.
4. Simulation Results
In this section, the performance of the five MOO techniques, discussed in the previous section, is analyzed individually for the energy allocation problem. Specifically, the Pareto front of the different MOO methods is discussed. In the next section, several performance metrics are used to compare the performance of all five techniques. NSGA-II was implemented in Java [26] and CPLEX [27] was integrated with Java for carrying out the optimization in the remaining four methods.
4.1. Input Data
The data required to solve the MOO problem are the required energy by each EV and the values of three indices for each EV, as shown in Equations (2)–(4). For the sake of visualization, a fleet of 15 EVs is considered, similar to [14]. The rank factors of all the EVs and required energy by each EV are taken from [14]. An overview of the EV-wise rank and the required energy are shown in Table 1. The zero value in the table implies that those EVs are not contributing to that particular index due to the nature of the task and occupants of the EV. The total energy required by all the EVs is 439.5 kWh, and the available energy is 220 kWh.
4.2. Weighted-Sum Method
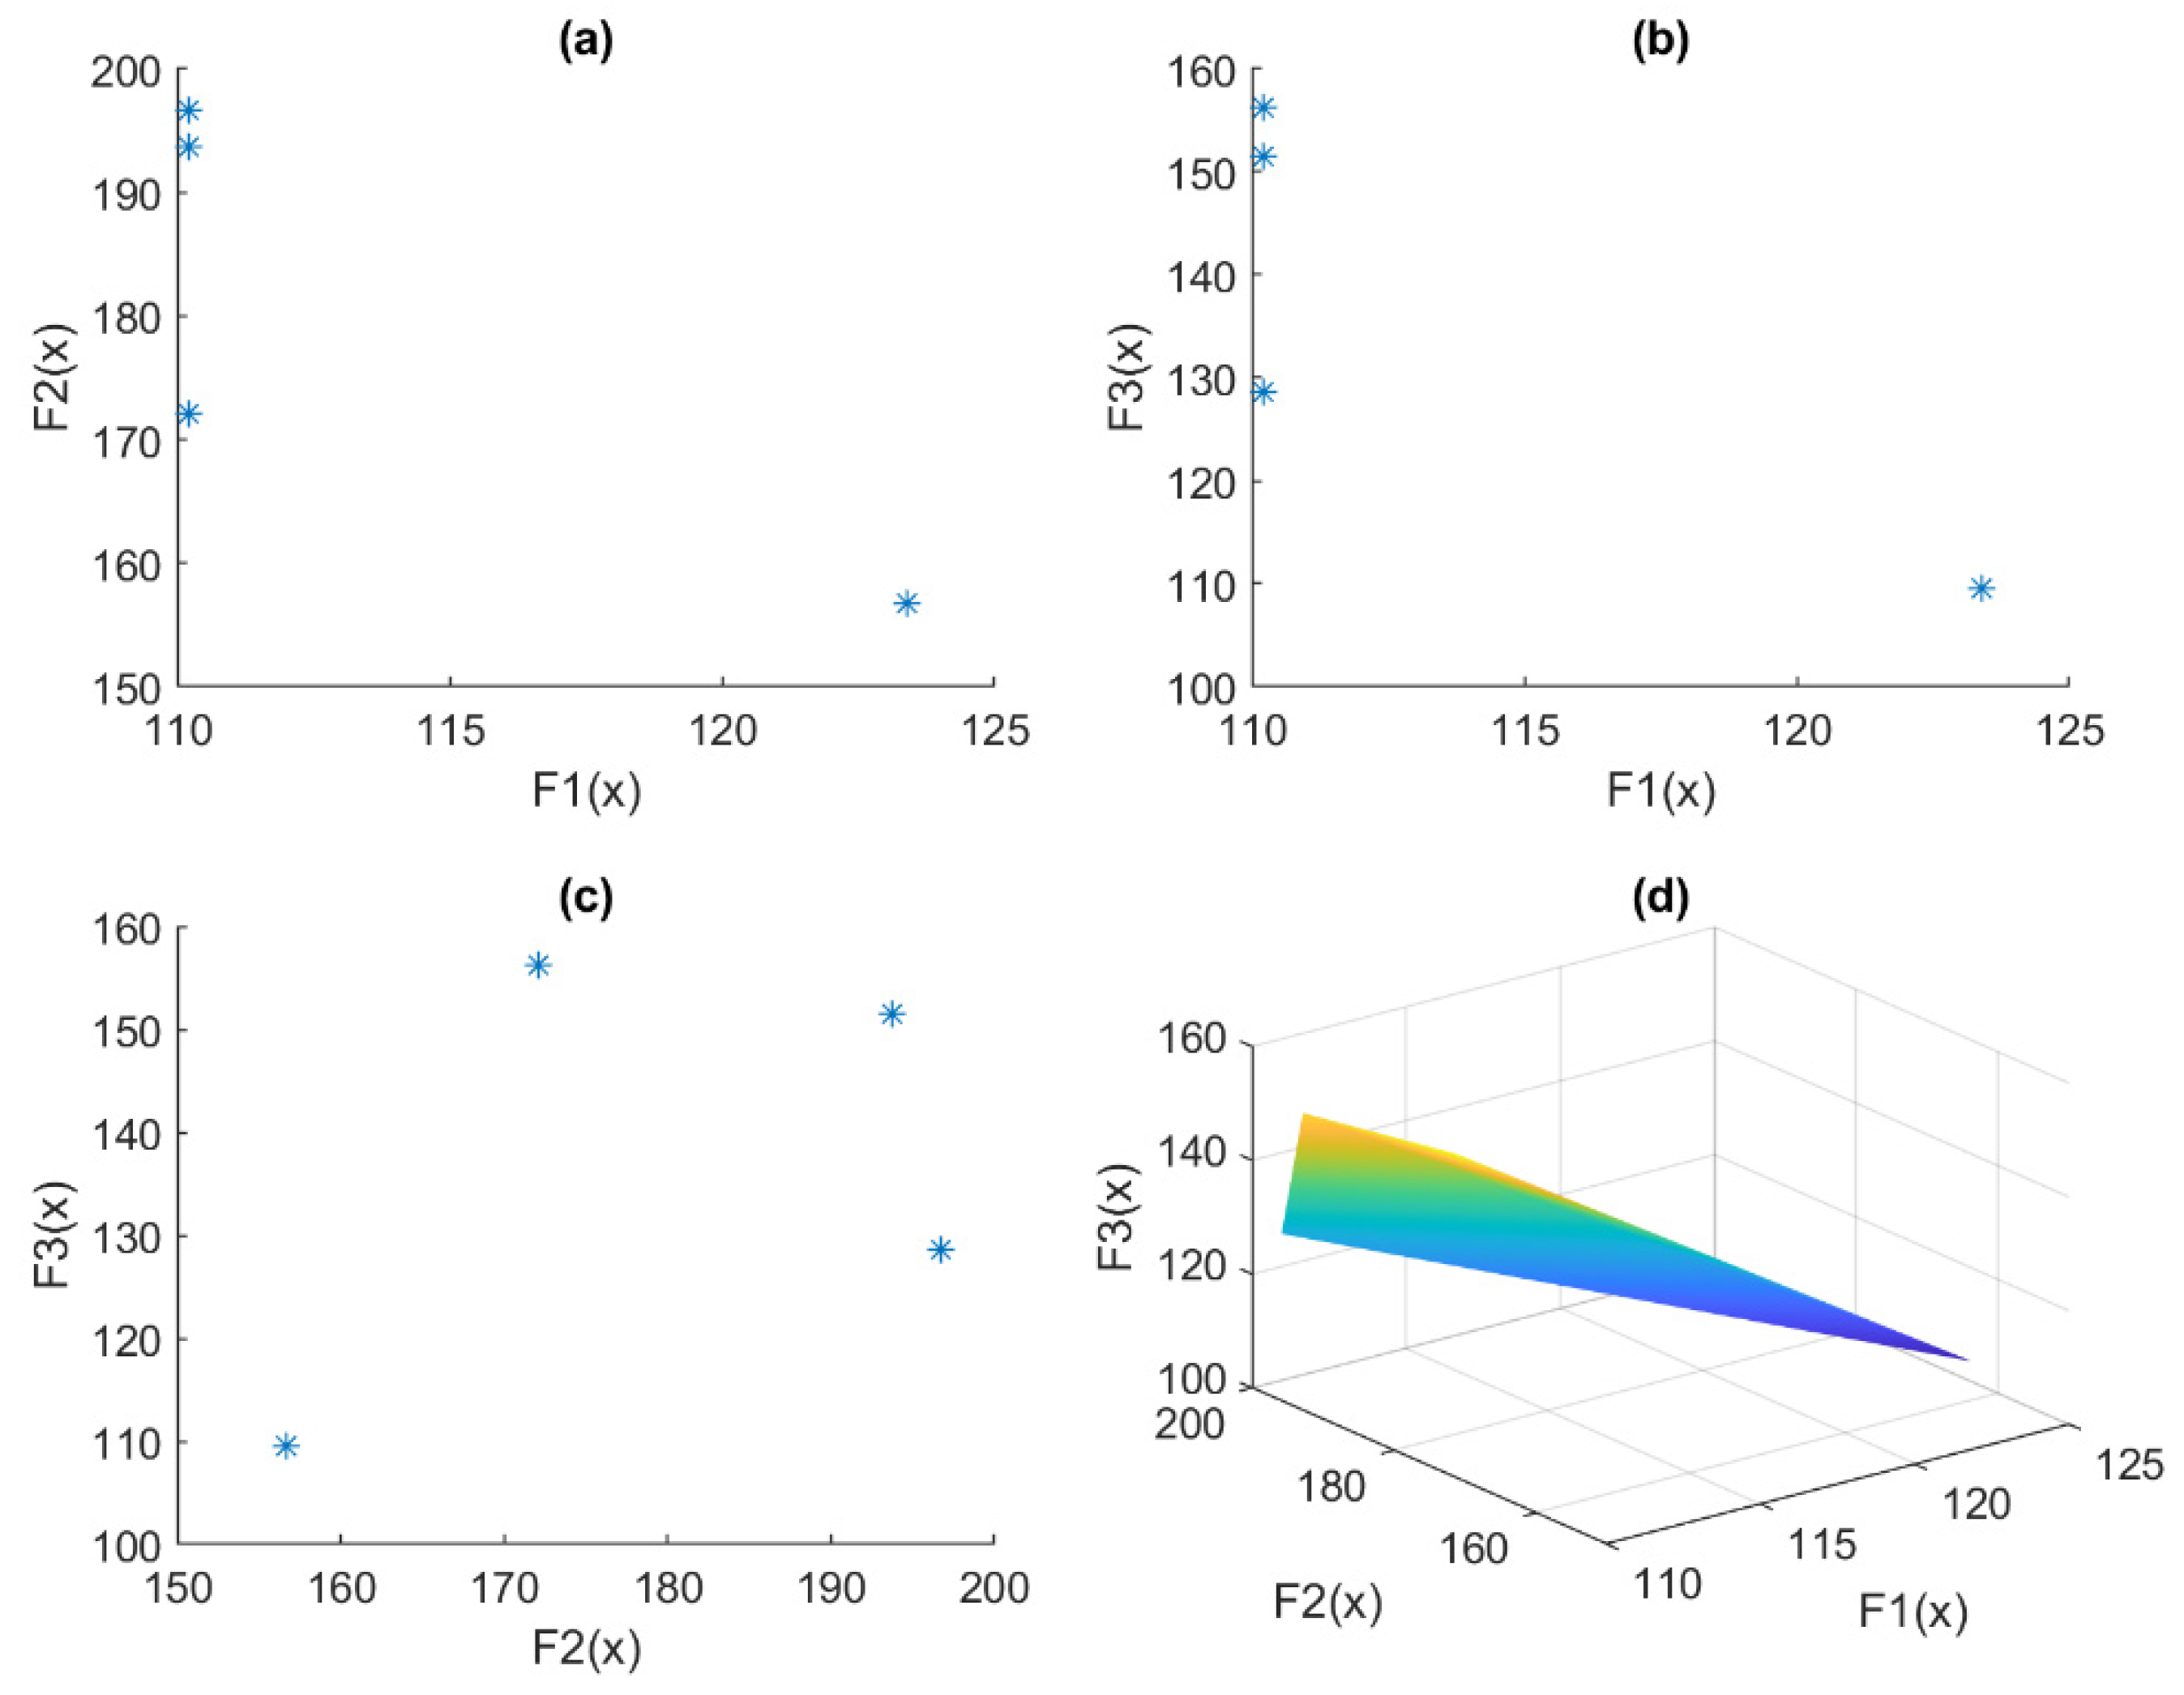
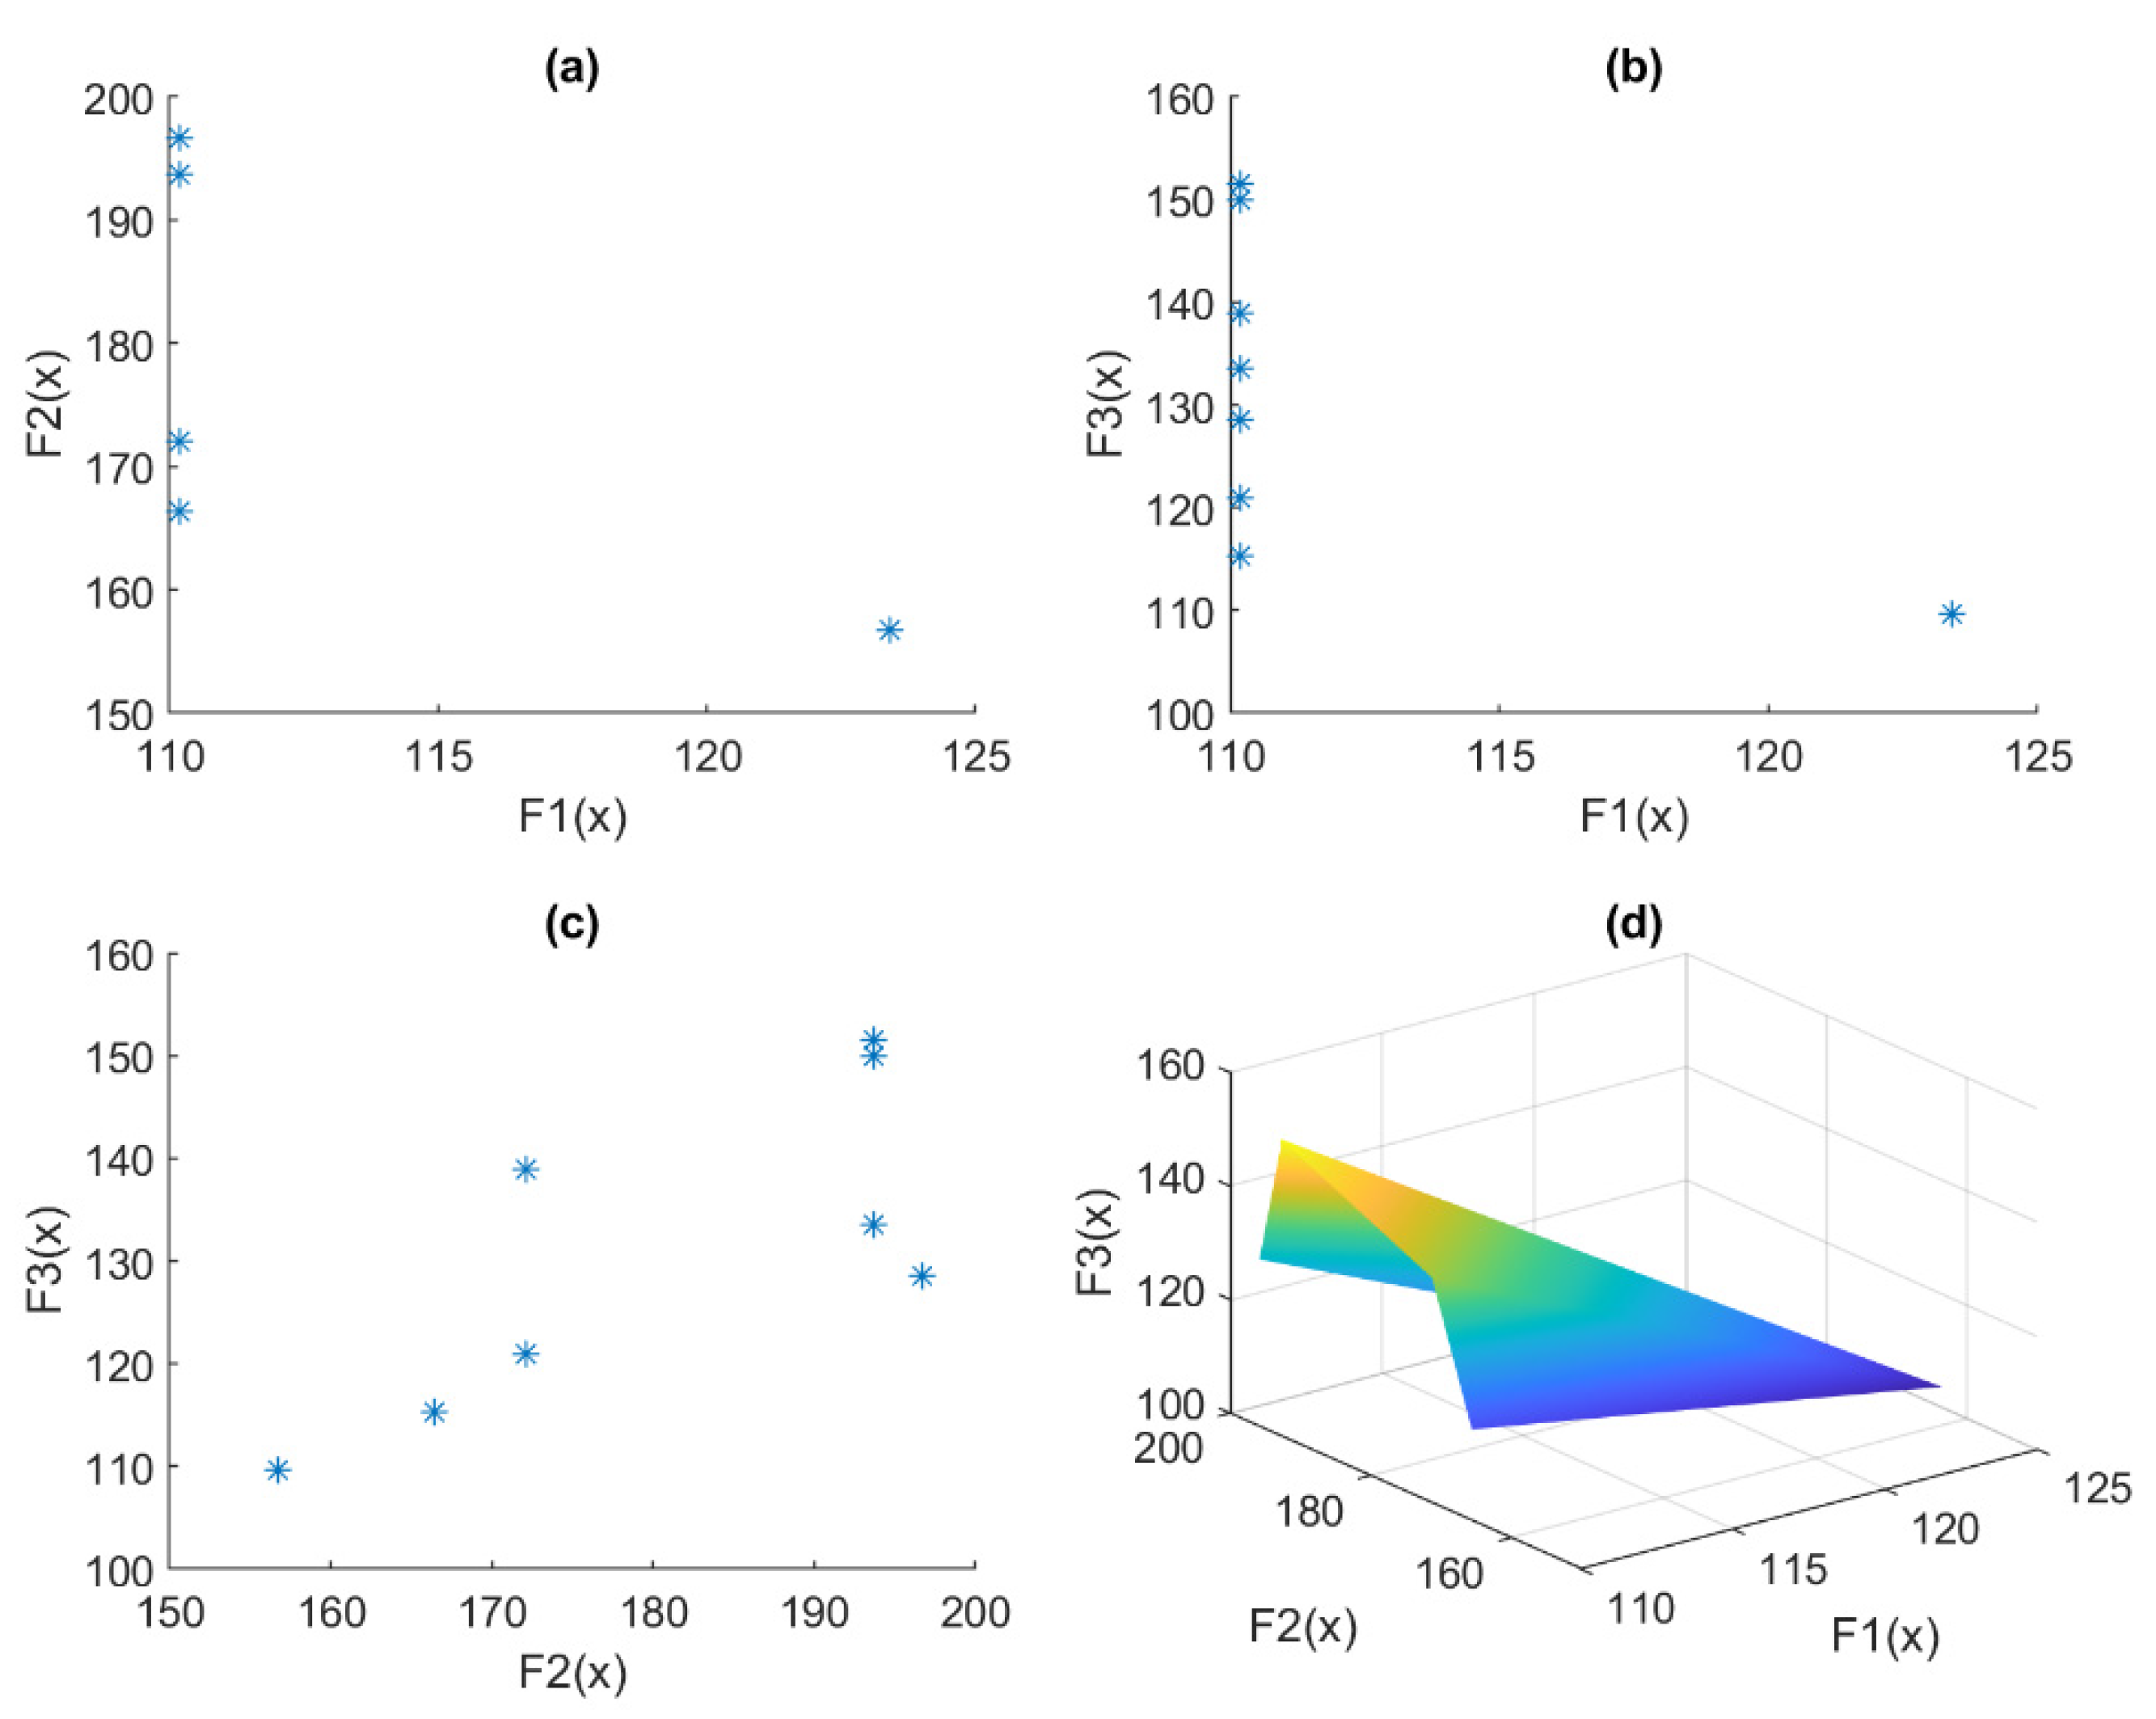
In the case of the WS method, the weights of all three functions are varied and five extreme cases are simulated, as shown in Table 2. The values of the objective functions are recorded for each case and the results are shown in Figure 3. For the sake of visualization, three pairs of the three objective functions (F1, F2, and F3) are made and the results are shown in Figure 3a–c. In addition, Figure 3d gives an overview of all three of the functions together. It can be observed from the result that the outcome changes with the change in weights, which is a drawback of the WS method. In the case of the WS method, determining the optimal weights for each method is another optimization problem. If the weights are not optimal, the outcome may not be optimal and may also not be in accordance with the preferences of the designers and policymakers.
4.3. Lexicographic Method
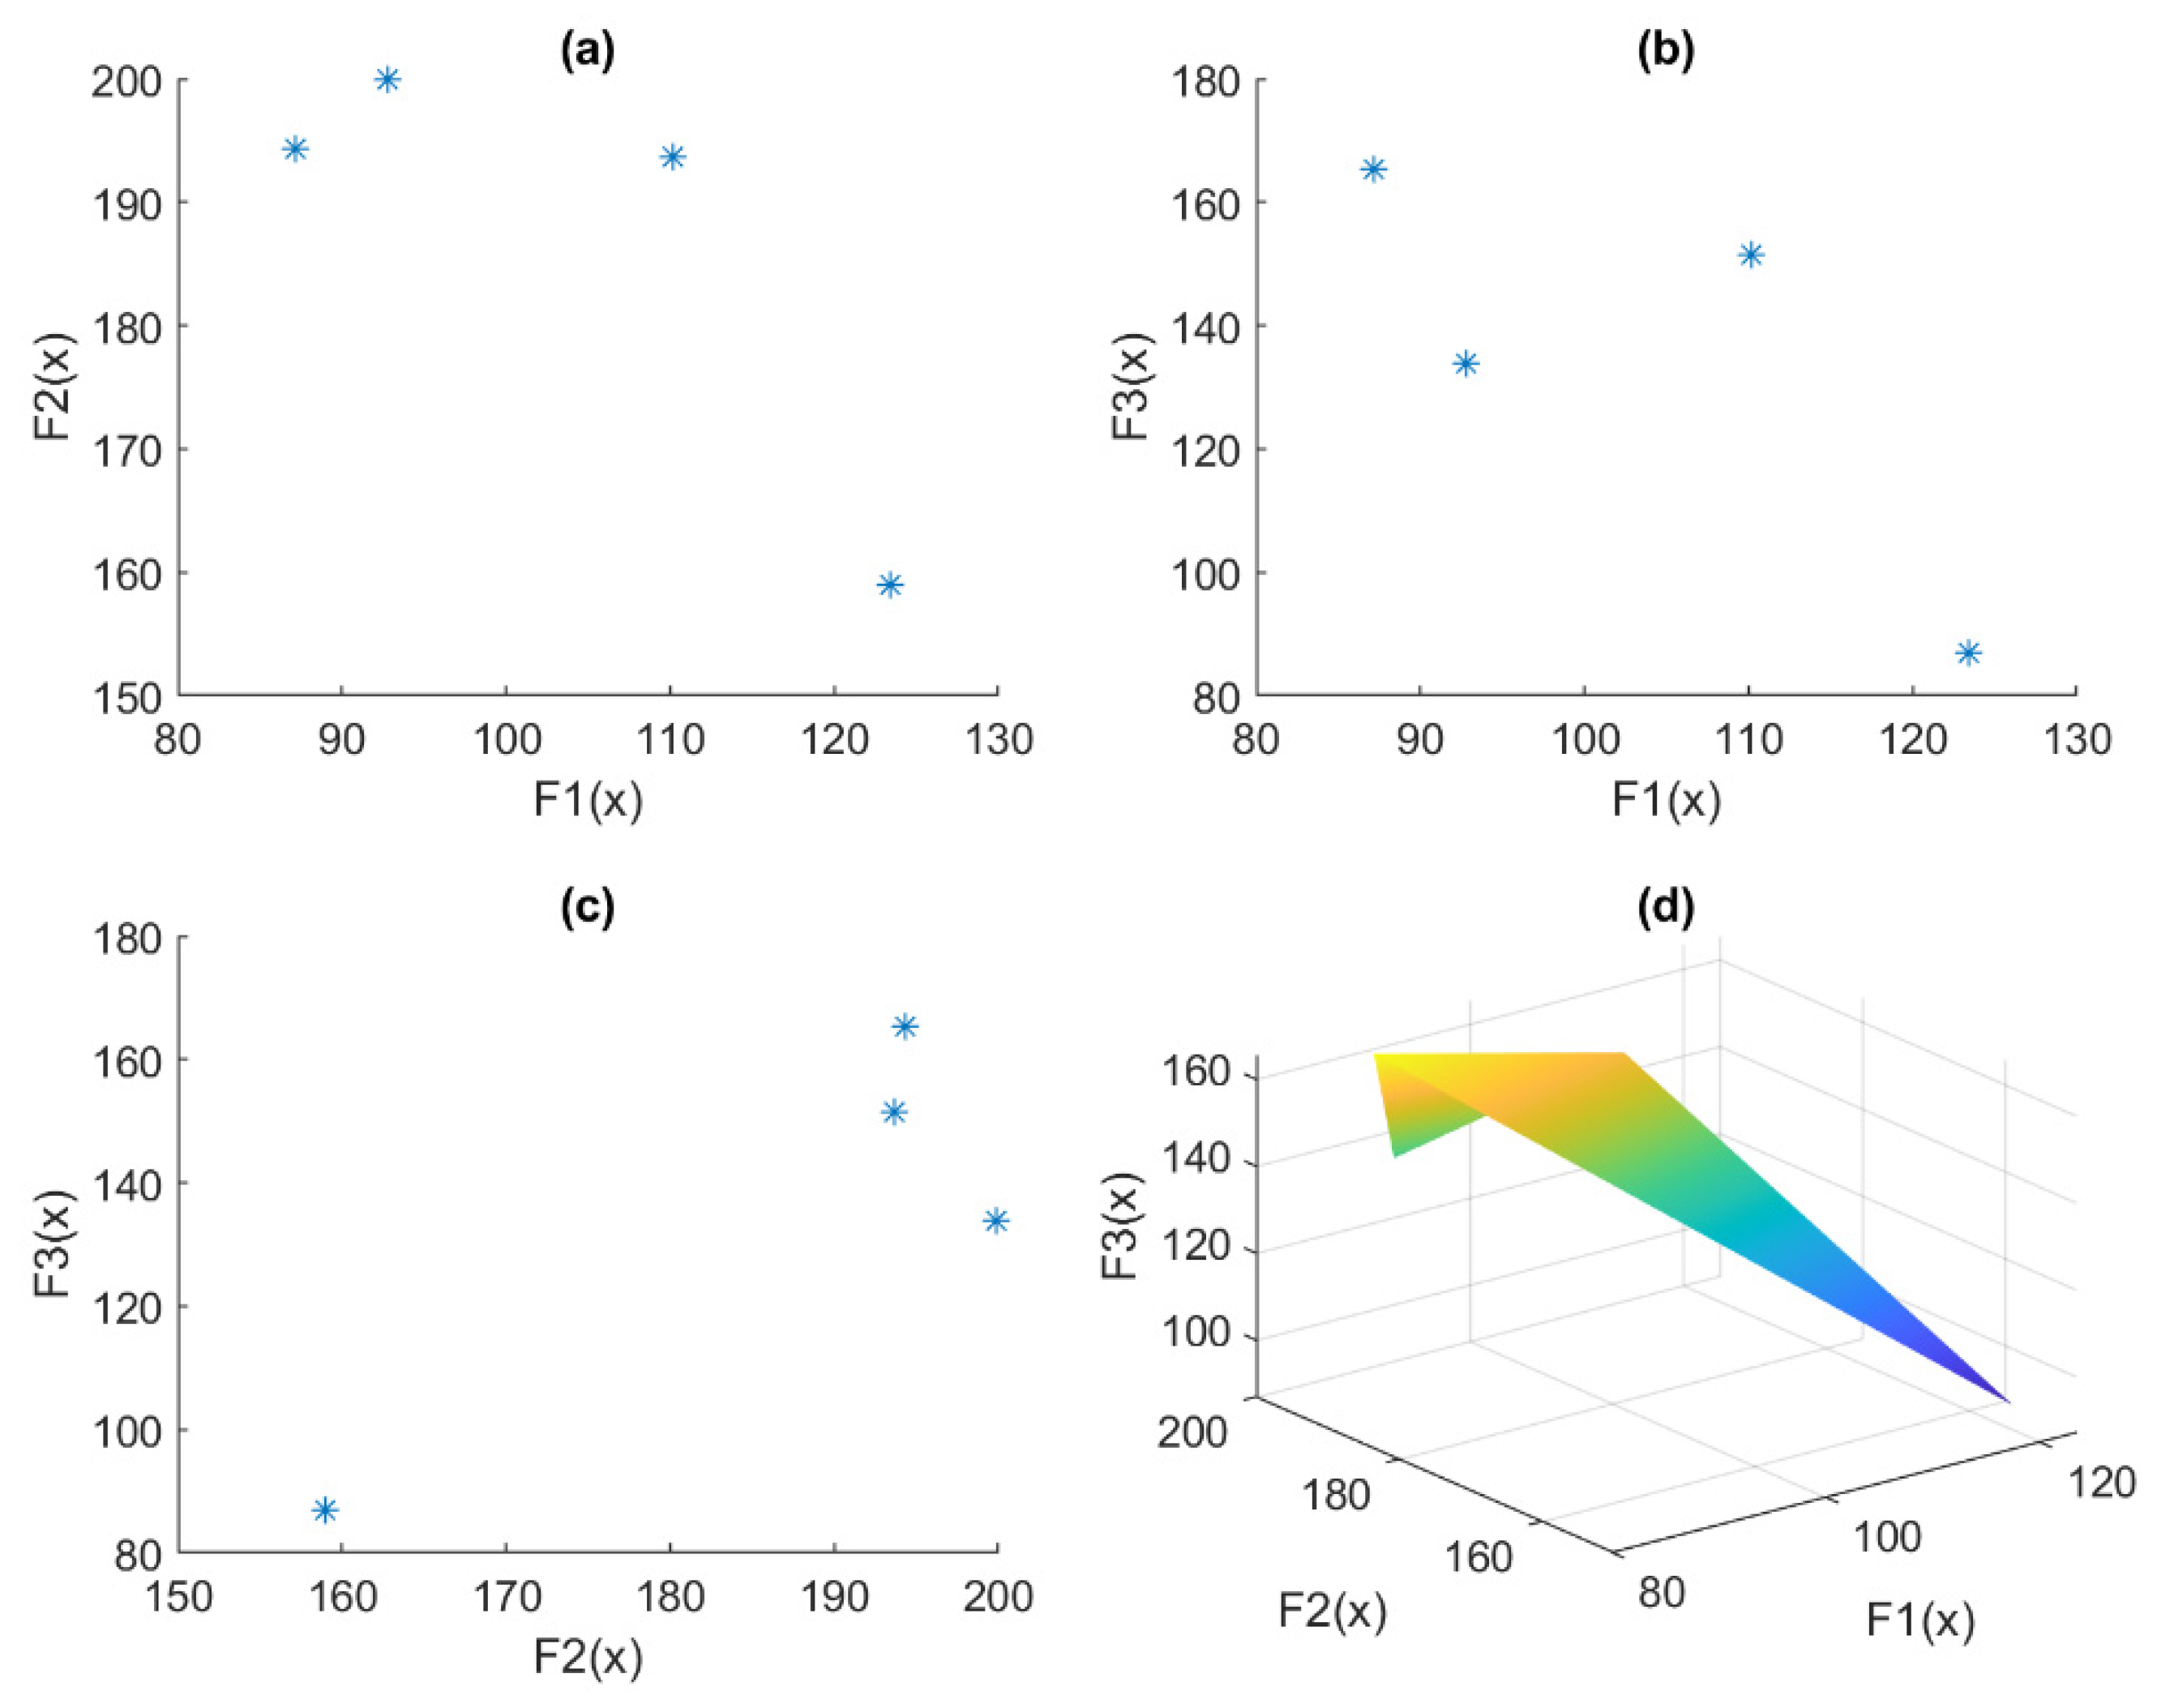
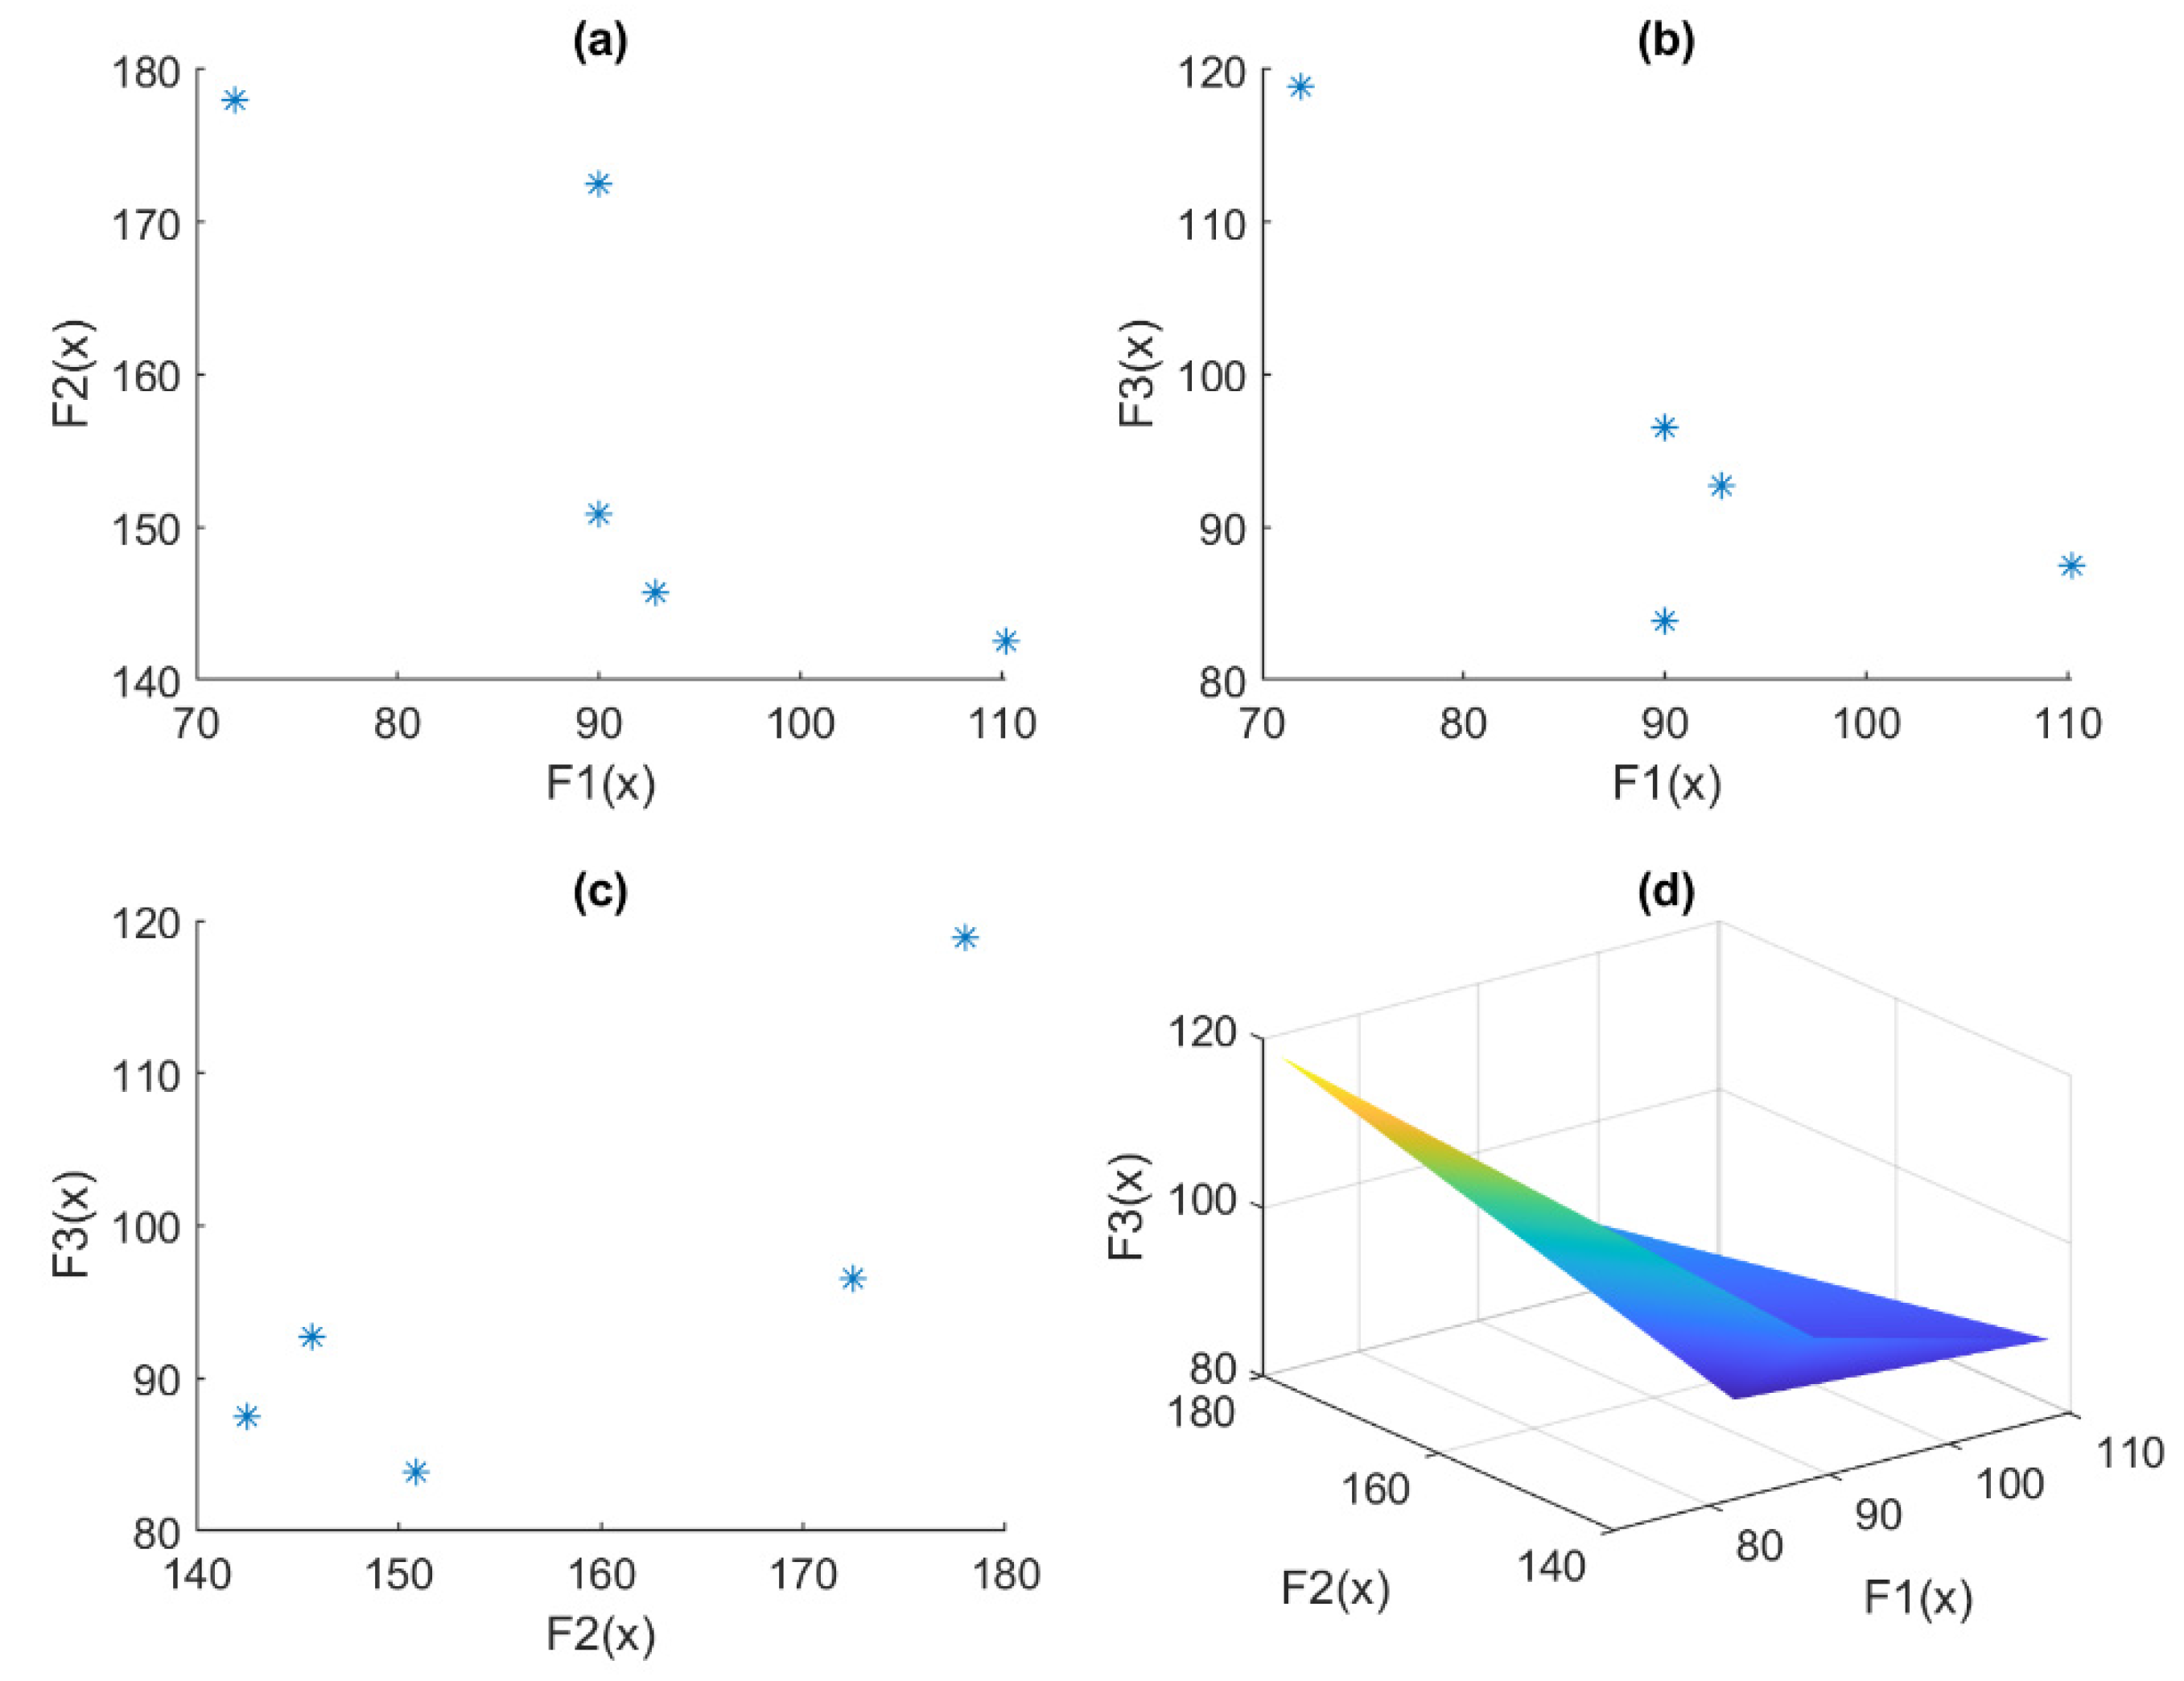
In the case of the LEX method, the priority of all three of the objective functions needs to be defined. The LEX method is not prone to the weights of the individual functions, and it gives the same outcome irrespective of the magnitude of the weights; it only compares the relative values of each function. To cover all possible cases, four cases are simulated by considering the different priorities of the three objective functions (F1, F2, F3), as shown in Table 2. In the first case, all three objectives are given the same priority, while, in the other three cases, each objective is given the highest priority, respectively. The results of all four cases are shown in Figure 4. In the case of the LEX method, only these four unique outcomes were recorded. All other combinations have given the same results due to the consideration of the relative priority of different objectives in the LEX method.
4.4. Normal Boundary Intersection Method
The NBI is the method with a posterior articulation of preferences. Therefore, all possible combinations of different weights need to be evaluated first and the policymakers will choose one of the outcomes. Therefore, the weights of all three of the functions (F1, F2, and F3) are varied in the range of 0.8 to 0.1 and the corresponding value of the optimization parameter β is monitored. The values of the weights and the corresponding value of β for each run are shown in Table 3. Some of the combinations have resulted in infeasible outcomes and those combinations are omitted from the results.
The results of all three of the objective functions are shown in Figure 5 for the NBI method. It can be observed that the number of outcomes is higher than the previous two methods due to the evaluation of all feasible combinations of the three objective functions. However, it can be noticed that each combination does not produce a unique result for the objective functions. Some of the combinations give the same results, which is evident from the number of points in Figure 5 and the total number of runs, listed in Table 3. However, it provides a better picture to the policymakers for making decisions based on their preferences while analyzing all possible combinations.
4.5. Min–Max Method
The MM method produces only one unique solution due to the absence of any preferences. The energy allocated to each EV by the MM method is shown in Table 4. The binary variable () indicated whether the energy demand of the particular EV is fulfilled or not, while is the deficit energy amount. It can be observed that the MM method has allocated energy to 8 EVs, while 7 EVs have a deficit of energy. However, due to the absence of any preference, the selected EV is not based on its importance, which was the case for the previous methods. The value of β was 110.2 for the MM method.
4.6. Nondominated Sorting Genetic Algorithm II
In the case of NSGA-II, the Pareto front is obtained by running the algorithm several times and filtering the best Pareto solutions. The obtained results for the NSGA-II are shown in Figure 6. It can be observed that the NSGA-II also provides several unique solutions for the energy allocation problem to EVs. The range of objective functions for NSGA-II is slightly different from the first three methods (WS, LEX, and NBI). However, these solutions need to be analyzed for their quality considering different metrics/indices. The comparison of all five of the methods is presented in the following section.
5. Discussion and Analysis
In this section, the performance of the five MOO techniques discussed in the previous sections is compared. In the first part, the performance is analyzed using the proposed indices. In the second part, the complexity and the variance in the results are analyzed.
5.1. Evaluation via Performance Indices
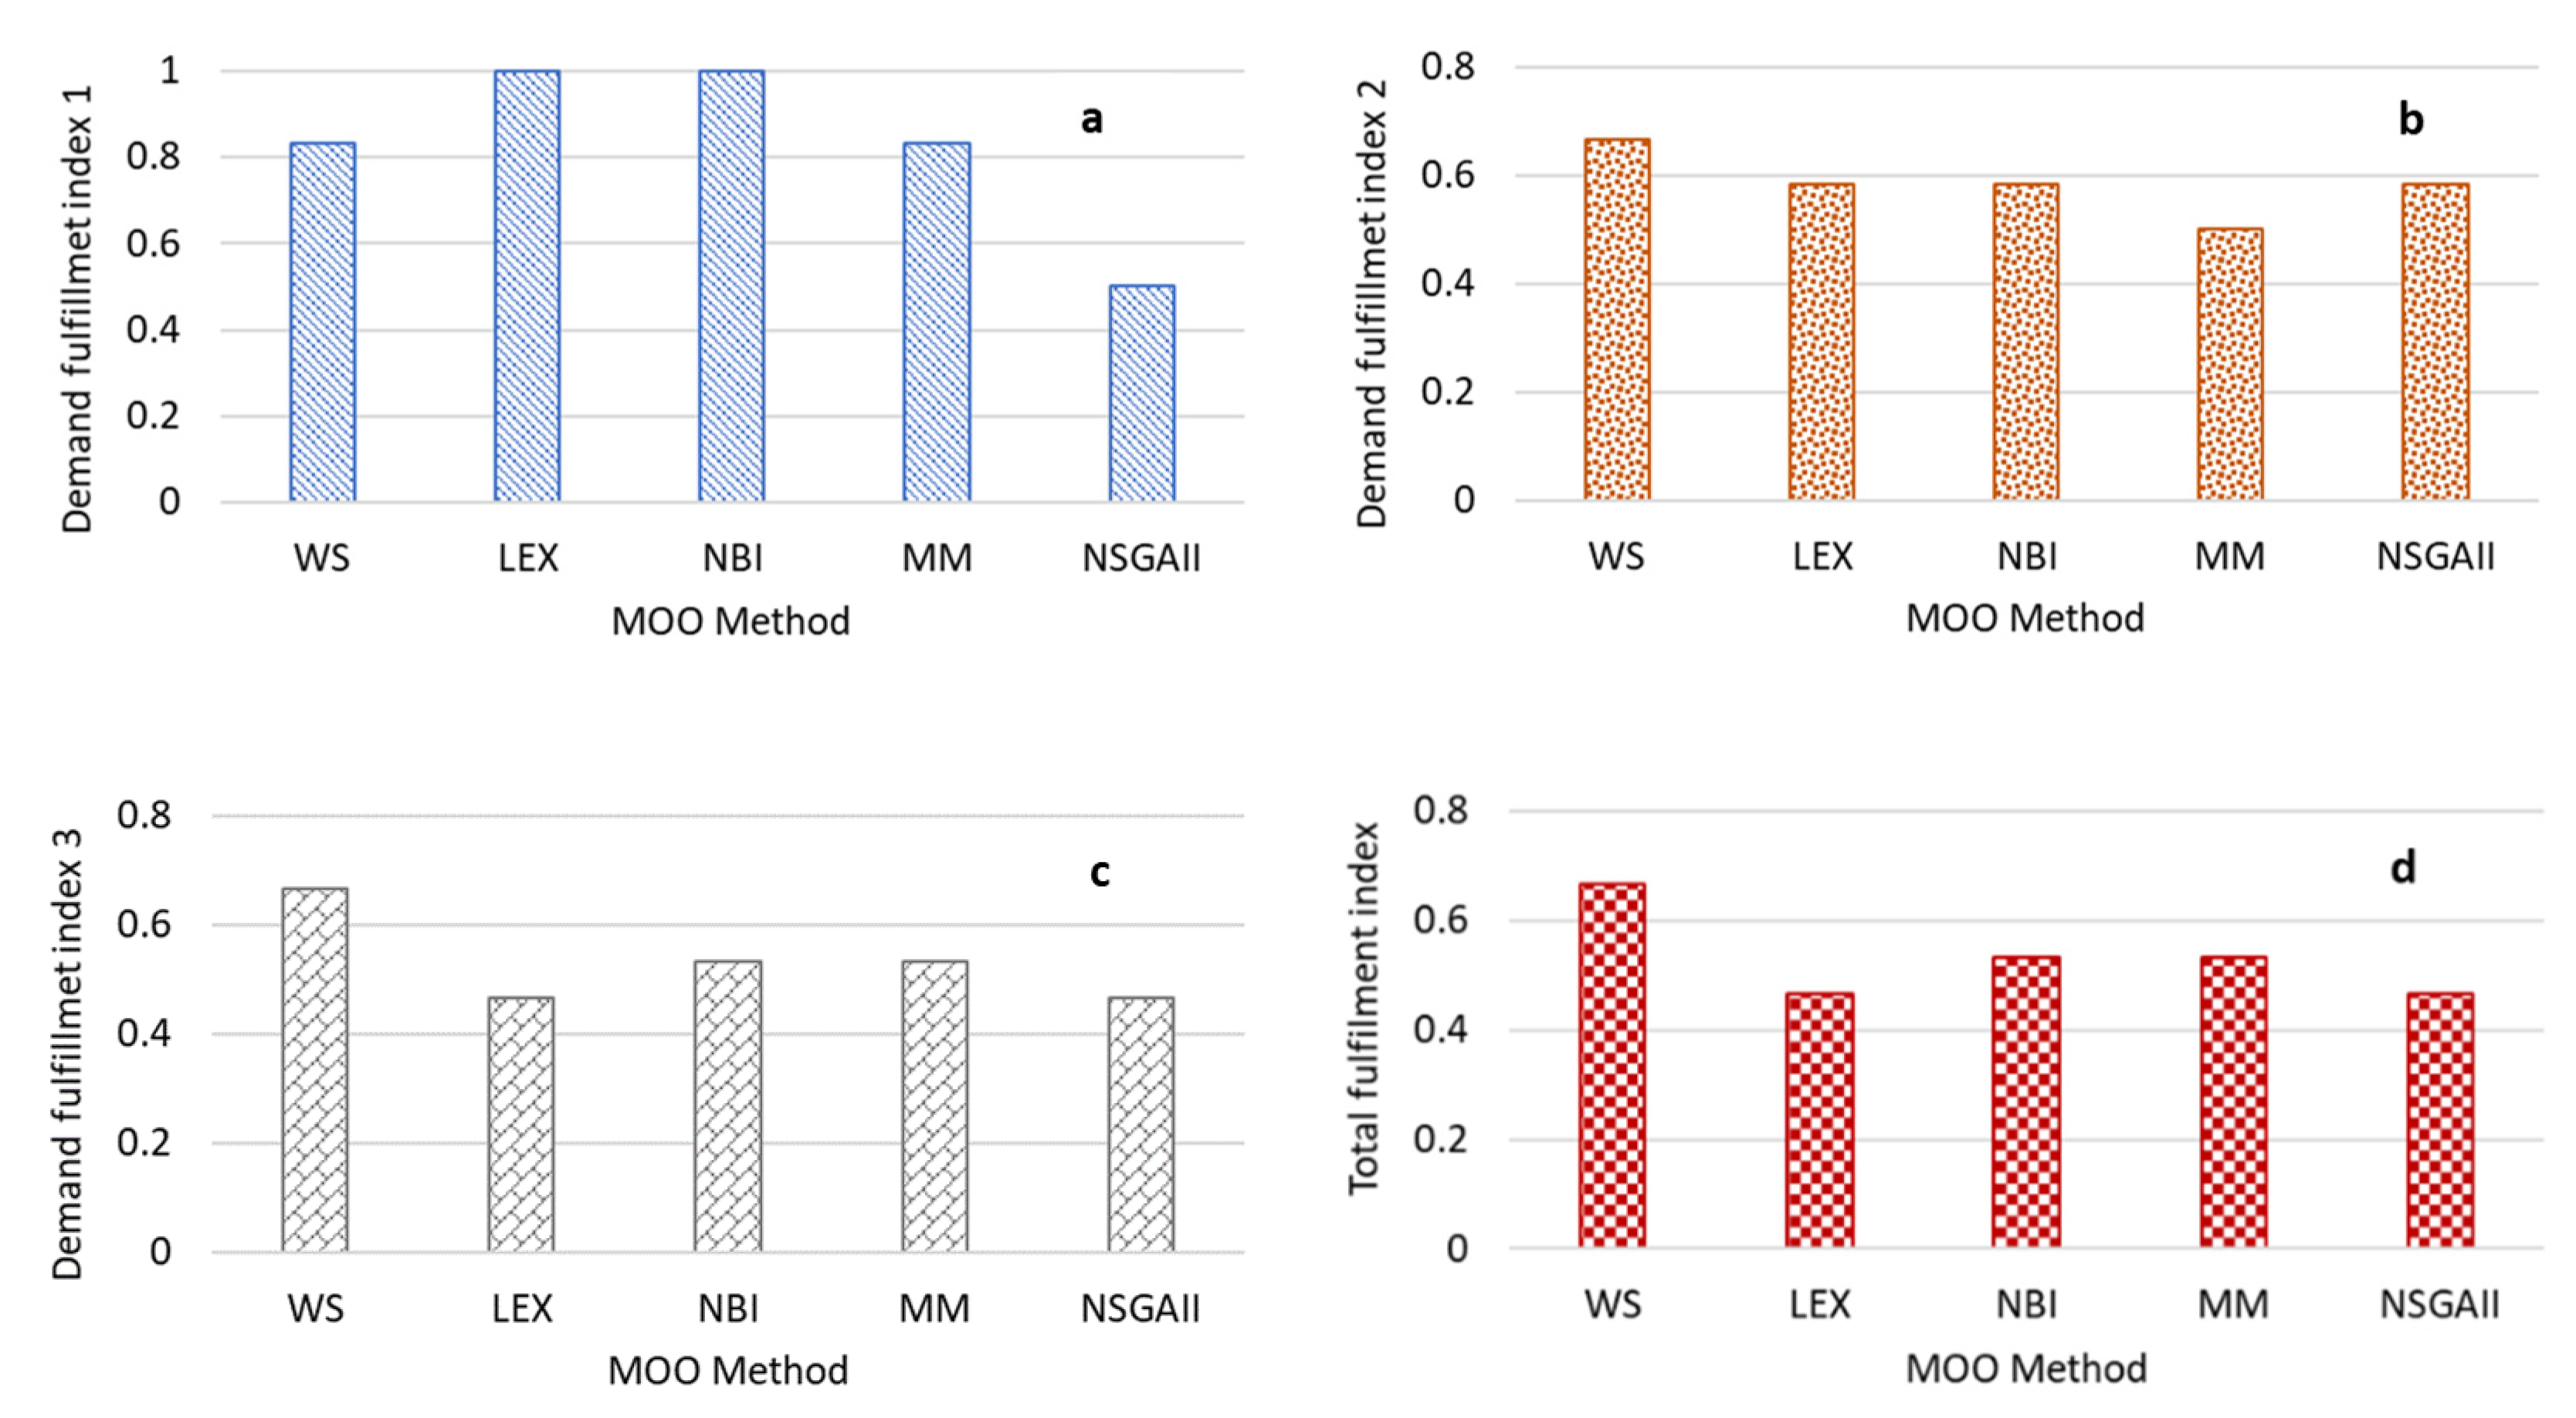
The two indices proposed in this study are used in this section to analyze the performance of the five MOO methods. The first index (demand fulfillment index, DI) indicates the ratio of EVs with a particular rank to the total number of EVs having a non-zero value for that rank. Higher values imply more EVs with demand being fulfilled and vice versa. It can be observed from Figure 7a that DI1 is the highest in the case of LEX and NBI, while it is the lowest for the NSGA-II. The value on DI2 is the highest for WS and lowest for MM, while the value of DI3 is the highest for WS and lowest for LEX. Since the priority of F1 is the highest and that of F3 is the lowest, the results of LEX and NBI will be considered better. The WS is increasing the values of DI2 and DI3 at the cost of DI1, which is generally not preferred.
Similarly, the second index (total fulfillment index, TI) shows the ratio of the total number of EVs with demand being fulfilled to the total number of EVs requiring a recharge. It can be observed from Figure 7d that the value of TI is the highest for the WS method, while it is the lowest for the NSGA-II and LEX methods. The highest value in the WS is due to the consideration of the accumulated indices in the case of the WS, while, in the case of LEX, higher priority ranks are preferred irrespective of their accumulated indices. In the case of NSGA-II, there is no specific preference for any particular rank.
If other factors are not considered, the performance of LEX and NBI is suitable for objectives with clear priority/preferences due to their ability to maximize the allocation based on the priority. The performance of NSGA-II was the lowest in most of the cases, thus making it unsuitable for this problem. Finally, the WS method is better for maximizing the total number of EVs having their demands fulfilled at the cost of some degradation in the performance of the higher rank EVs. However, other factors also need to be considered to determine the best suitable candidate method, which is discussed in the following section.
5.2. Complexity and Variance Analysis
In the previous section, the best-performing case was selected for each method. However, in the case of the WS, LEX, and NBI methods, the outcome changes with a change in the priority or weights. Therefore, the maximum and minimum number of EVs survived by different methods and their variance is tabulated in Table 5. It can be observed that the variance is maximum for the LEX while it is minimum for the NBI method (the MM and NSGA give single unique solutions). The higher variance in the LEX is due to a significant change in the outcome with the change in the priorities of the objective functions.
In terms of additional constraints, only one additional constraint is required for WS, while NBI and MM require I number of additional constraints, where I is the number of objective functions. Similarly, in the case of LEX, I-1 additional constraints are required, while NSGA-II does not require any additional constraints. An increase in the number of objective functions could increase the complexity of the problem where additional constraints are required.
The computational complexity of WS is the lowest due to the requirement of scalers only and a single additional constraint, while the complexity of NBI is higher due to the requirement of several runs and having I number of additional constraints. Similarly, the computational complexity of NSGA-II is also higher due to the requirement of more time in finding the optimal solution. MM and LEX have a medium level of complexity, where MM requires I additional constraints but provides a single solution. LEX requires I-1 additional constraints and provides different solutions based on the priority.
The analysis in this section and the previous section shows that NSGA-II is not suitable for this problem due to lower performance despite having higher computational complexity. LEX is the most suitable method if the priority of different EVs is known due to its ability to allocate energy based on the priority, similar to the findings of [14]. In addition, it has a medium level of computational complexity. MM is suitable for cases where the priority is not known, and it can provide a single unique solution with a medium level of computational complexity.
6. Conclusions
A multi-objective optimization problem was developed for allocating energy to electric vehicles during power outages. Three objective functions were developed based on three indices to quantify the benefits of different electric vehicles for societies, communities, and individuals. The performance of five multi-objective optimization methods was analyzed for solving the formulated problem. At least one method was selected from the three major categories of the multi-objective optimization, which include methods with a prior articulation, methods with a posterior articulation, and methods with no articulation of preferences. In addition, the well-known non-dominated sorting genetic algorithm was also considered. Two indices were proposed and used to analyze the performance of all five methods. The comparison showed that the lexicographic method has the best performance if the relative preference/priority of the different objectives is known in advance. In addition, the computational complexity of this method is not too high. The min–max method also showed a reasonable performance and is suitable if the priority of different objective functions is not known. This method also has a medium level of computational complexity. The performance of the non-dominated sorting genetic algorithm was the lowest, and it had higher computational complexity as well. Therefore, it is not deemed suitable for the energy allocation problem to electric vehicles.
Author Contributions
Conceptualization, A.H.; project administration, H.-M.K.; formal analysis, A.H.; writing—original draft preparation, A.H.; writing—review and editing, H.-M.K.; All authors have read and agreed to the published version of the manuscript.
Funding
This work was supported by the Incheon National University Research Grant in 2021.
Conflicts of Interest
The authors declare no conflict of interest.
References
- Motta, R.D.S.; Afonso, S.M.; Lyra, P.R. A modified NBI and NC method for the solution of N-multiobjective optimization problems. Struct. Multidiscip. Optim. 2012, 46, 239–259. [Google Scholar] [CrossRef]
- Chang, K.H. Multiobjective optimization and advanced topics. In Design Theory and Methods Using CAD/CAE: The Computer Aided Engineering Design Series; Elsevier: Amsterdam, The Netherlands, 2015; pp. 325–406. [Google Scholar]
- Marler, R.T.; Arora, J.S. Survey of multi-objective optimization methods for engineering. Struct. Multidiscip. Optim. 2004, 26, 369–395. [Google Scholar] [CrossRef]
- Zhu, W.; Guo, J.; Zhao, G. Multi-objective sizing optimization of hybrid renewable energy microgrid in a stand-alone marine context. Electronics 2021, 10, 174. [Google Scholar] [CrossRef]
- Hussain, A.; Kim, H.M. Goal-programming-based multi-objective optimization in off-grid microgrids. Sustainability 2020, 12, 8119. [Google Scholar] [CrossRef]
- Li, F.F.; Qiu, J. Multi-objective optimization for integrated hydro–photovoltaic power system. Appl. Energy 2016, 167, 377–384. [Google Scholar] [CrossRef]
- Roberts, J.J.; Cassula, A.M.; Silveira, J.L.; da Costa Bortoni, E.; Mendiburu, A.Z. Robust multi-objective optimization of a renewable based hybrid power system. Appl. Energy 2018, 223, 52–68. [Google Scholar] [CrossRef] [Green Version]
- Pan, C.; Tao, S.; Fan, H.; Shu, M.; Zhang, Y.; Sun, Y. Multi-objective optimization of a battery-supercapacitor hybrid energy storage system based on the concept of cyber-physical system. Electronics 2021, 10, 1801. [Google Scholar] [CrossRef]
- Ahmadi-Nezamabad, H.; Zand, M.; Alizadeh, A.; Vosoogh, M.; Nojavan, S. Multi-objective optimization based robust scheduling of electric vehicles aggregator. Sustain. Cities Soc. 2019, 47, 101494. [Google Scholar] [CrossRef]
- Kang, Q.; Feng, S.; Zhou, M.; Ammari, A.C.; Sedraoui, K. Optimal load scheduling of plug-in hybrid electric vehicles via weight-aggregation multi-objective evolutionary algorithms. IEEE Trans. Intell. Transp. Syst. 2017, 18, 2557–2568. [Google Scholar] [CrossRef]
- Shahab, M.; Wang, S.; Junejo, A.K. Improved control strategy for three-phase microgrid management with electric vehicles using multi objective optimization algorithm. Energies 2021, 14, 1146. [Google Scholar] [CrossRef]
- Marzoghi, A.F.; Bahramara, S.; Adabi, F.; Nojavan, S. Interval multi-objective optimization of hydrogen storage based intelligent parking lot of electric vehicles under peak demand management. J. Energy Storage 2020, 27, 101123. [Google Scholar] [CrossRef]
- Fu, X.; Zhang, Q.; Tang, J.; Wang, C. Parameter matching optimization of a powertrain system of hybrid electric vehicles based on multi-objective optimization. Electronics 2019, 8, 875. [Google Scholar] [CrossRef] [Green Version]
- Hussain, A.; Kim, H.M. EV prioritization and power allocation during outages: A lexicographic method-based multi-objective optimization approach. IEEE Trans. Transp. Electrif. 2021, 7, 2474–2487. [Google Scholar] [CrossRef]
- Bari, N.; Haque, A.; Ahuja, G.; Kurukuru, V.B. Priority based power delivery system for electric vehicle charging. In European, Asian, Middle Eastern, North African Conference on Management & Information Systems; Springer: Cham, Switzerland, 2021; pp. 36–45. [Google Scholar]
- Alsabbagh, A.; Yin, H.; Ma, C. Distributed charging management of multi-class electric vehicles with different charging priorities. IET Gener. Transm. Distrib. 2019, 13, 5257–5264. [Google Scholar] [CrossRef]
- Lalonde, N. Multiobjective Optimization Algorithm Benchmarking and Design under Parameter Uncertainty. Ph.D. Thesis, Queen’s University, Kingston, ON, Canada, 2009. [Google Scholar]
- IEA. Global EV Outlook 2021-Accelerating Ambitions despite the Pandemic. 2021. Available online: www.iea.org/t&c/ (accessed on 7 September 2021).
- Feng, N.; Yan, L.; Wu, K.; Shi, M.; Zhou, J.; Chen, X. Hierarchical optimization of electric vehicle system charging plan based on the scheduling priority. J. Circuits Syst. Comput. 2019, 28, 1950221. [Google Scholar]
- Ivanova, A.; Chassin, D.; Aguado, J.; Crawford, C.; Djilali, N. Techno-economic feasibility of a photovoltaic-equipped plug-in electric vehicle public parking lot with coordinated charging. IET Energy Syst. Integr. 2020, 2, 261–272. [Google Scholar] [CrossRef]
- Kothandaraman Raghavan, A. PV Enabled Net-Zero EV Charging Station: System Design and Simulation Study. Master’s thesis, University of Waterloo, Waterloo, ON, Canada, 2018. [Google Scholar]
- Hussain, A.; Bui, V.H.; Kim, H.M. Optimal sizing of battery energy storage system in a fast EV charging station considering power outages. IEEE Trans. Transp. Electrif. 2020, 6, 453–463. [Google Scholar] [CrossRef]
- Das, I.; Dennis, J.E. Normal-boundary intersection: A new method for generating the Pareto surface in nonlinear multicriteria optimization problems. SIAM J. Optim. 1998, 8, 631–657. [Google Scholar] [CrossRef] [Green Version]
- Deb, K.; Pratap, A.; Agarwal, S.; Meyarivan, T.A.M.T. A fast and elitist multiobjective genetic algorithm: NSGA-II. IEEE Trans. Evol. Comput. 2002, 6, 182–197. [Google Scholar] [CrossRef] [Green Version]
- Srinivas, N.; Deb, K. Muiltiobjective optimization using nondominated sorting in genetic algorithms. Evol. Comput. 1994, 2, 221–248. [Google Scholar] [CrossRef]
- Apache NetBeans. Available online: https://netbeans.org/ (accessed on 1 November 2021).
- IBM. ILOG CPLEX V12.7 User’s Manual for CPLEX 2015; CPLEX Division, ILOG: Incline Village, NV, USA, 2015. [Google Scholar]
Figure 1.
Demonstration of Pareto front for a bi-objective optimization problem.

Figure 2.
Categorization of multi-objective optimization techniques.

Figure 3.
Results of WS method: (a) F1 vs. F2; (b) F1 vs. F3; (c) F2 vs. F3; (d) 3D plot.

Figure 4.
Results of LEX method: (a) F1 vs. F2; (b) F1 vs. F3; (c) F2 vs. F3; (d) 3D plot.

Figure 5.
Results of NBI method: (a) F1 vs. F2; (b) F1 vs. F3; (c) F2 vs. F3; (d) 3D plot.

Figure 6.
Results of NSGA-II method: (a) F1 vs. F2; (b) F1 vs. F3; (c) F2 vs. F3; (d) 3D plot.

Figure 7.
Performance analysis using proposed indices: (a) DI1; (b) DI2; (c) DI3; (d) TI.


Table 1.
EV-wise rank and required energy data.
| EV ID(n) | Required Energy (kWh) | |||
|---|---|---|---|---|
| 1 | 26.2 | 17.4 | 18.4 | 7.4 |
| 2 | 12.5 | 28.7 | 29.7 | 18.7 |
| 3 | 17.6 | 20.2 | 21.2 | 18.2 |
| 4 | 62.6 | 0 | 7.7 | 1.7 |
| 5 | 23.8 | 0 | 21.6 | 12.6 |
| 6 | 11.4 | 0 | 0 | 17.9 |
| 7 | 54.8 | 0 | 6.5 | 3.5 |
| 8 | 34.2 | 0 | 24.6 | 7.6 |
| 9 | 57.6 | 13.2 | 14.2 | 3.2 |
| 10 | 23.5 | 0 | 29.6 | 14.6 |
| 11 | 49.9 | 23 | 24 | 11 |
| 12 | 30.6 | 20.9 | 21.9 | 13.9 |
| 13 | 17.2 | 0 | 0 | 17.3 |
| 14 | 7.1 | 0 | 27.3 | 18.3 |
| 15 | 10.5 | 0 | 0 | 18.9 |
Table 2.
Weights used for WS and LEX methods.
| Case | WS Method | LEX Method | ||||
|---|---|---|---|---|---|---|
| W1 | W2 | W3 | P1 | P2 | P3 | |
| Case 1 | 5 | 1 | 9 | 1 | 1 | 1 |
| Case 2 | 9 | 5 | 1 | 2 | 3 | 1 |
| Case 3 | 5 | 9 | 1 | 2 | 1 | 3 |
| Case 4 | 9 | 1 | 1 | 3 | 2 | 1 |
| Case 5 | 1 | 1 | 1 | - | - | - |
Table 3.
Weight values and results of the NBI method.
| Run | w1 | w2 | w3 | β | Run | w1 | w2 | w3 | β |
|---|---|---|---|---|---|---|---|---|---|
| 1 | 0.1 | 0.1 | 0.8 | 0.003 | 9 | 0.3 | 0.4 | 0.3 | 0.148 |
| 2 | 0.1 | 0.2 | 0.7 | 0.038 | 20 | 0.3 | 0.5 | 0.2 | 0.140 |
| 3 | 0.1 | 0.3 | 0.6 | 0.055 | 21 | 0.3 | 0.6 | 0.1 | 0.131 |
| 4 | 0.1 | 0.4 | 0.5 | 0.048 | 22 | 0.4 | 0.1 | 0.5 | 0.119 |
| 5 | 0.1 | 0.5 | 0.4 | 0.041 | 23 | 0.4 | 0.2 | 0.4 | 0.111 |
| 6 | 0.1 | 0.6 | 0.3 | 0.033 | 24 | 0.4 | 0.3 | 0.3 | 0.102 |
| 7 | 0.1 | 0.7 | 0.2 | 0.055 | 25 | 0.4 | 0.4 | 0.2 | 0.094 |
| 8 | 0.1 | 0.8 | 0.1 | 0.058 | 26 | 0.4 | 0.5 | 0.1 | 0.086 |
| 9 | 0.2 | 0.1 | 0.7 | 0.068 | 27 | 0.5 | 0.1 | 0.4 | 0.065 |
| 10 | 0.2 | 0.2 | 0.6 | 0.103 | 28 | 0.5 | 0.2 | 0.3 | 0.057 |
| 11 | 0.2 | 0.3 | 0.5 | 0.138 | 29 | 0.5 | 0.3 | 0.2 | 0.048 |
| 12 | 0.2 | 0.4 | 0.4 | 0.133 | 30 | 0.5 | 0.4 | 0.1 | 0.040 |
| 13 | 0.2 | 0.5 | 0.3 | 0.126 | 31 | 0.6 | 0.1 | 0.3 | 0.011 |
| 14 | 0.2 | 0.6 | 0.2 | 0.119 | 32 | 0.6 | 0.2 | 0.2 | 0.003 |
| 15 | 0.2 | 0.7 | 0.1 | 0.120 | 33 | 0.6 | 0.3 | 0.1 | 0.002 |
| 16 | 0.3 | 0.1 | 0.6 | 0.133 | 34 | 0.7 | 0.1 | 0.2 | 0.096 |
| 17 | 0.3 | 0.2 | 0.5 | 0.165 | 35 | 0.7 | 0.2 | 0.1 | 0.088 |
| 18 | 0.3 | 0.3 | 0.4 | 0.157 | 36 | 0.8 | 0.1 | 0.1 | 0.100 |
Table 4.
Optimization results of the min–max method.
| EV ID (n) | ||||
|---|---|---|---|---|
| 1 | 1 | 0 | 26.2 | 26.2 |
| 2 | 1 | 0 | 12.5 | 12.5 |
| 3 | 1 | 0 | 17.6 | 17.6 |
| 4 | 0 | 14.2 | 48.4 | 62.6 |
| 5 | 0 | 23.8 | 0 | 23.8 |
| 6 | 0 | 11.4 | 0 | 11.4 |
| 7 | 0 | 54.8 | 0 | 54.8 |
| 8 | 0 | 34.2 | 0 | 34.2 |
| 9 | 0 | 57.6 | 0 | 57.6 |
| 10 | 0 | 23.5 | 0 | 23.5 |
| 11 | 1 | 0 | 49.9 | 49.9 |
| 12 | 1 | 0 | 30.6 | 30.6 |
| 13 | 1 | 0 | 17.2 | 17.2 |
| 14 | 1 | 0 | 7.1 | 7.1 |
| 15 | 1 | 0 | 10.5 | 10.5 |
Table 5.
Comparison of MOO techniques.
| Factor | WS | LEX | NBI | MM | NSGA-II |
|---|---|---|---|---|---|
| Max. EVs | 10 | 11 | 10 | 8 | 7 |
| Min. EVs | 8 | 7 | 8 | 8 | 7 |
| Variance | 0.64 | 2.188 | 0.627 | n/a | n/a |
| Additional constraints | 1 | I-1 | I | I | 0 |
| Computational complexity | Low | Medium | High | Medium | High |
Publisher’s Note: MDPI stays neutral with regard to jurisdictional claims in published maps and institutional affiliations. |
© 2021 by the authors. Licensee MDPI, Basel, Switzerland. This article is an open access article distributed under the terms and conditions of the Creative Commons Attribution (CC BY) license (https://creativecommons.org/licenses/by/4.0/).
Share and Cite
MDPI and ACS Style
Hussain, A.; Kim, H.-M. Evaluation of Multi-Objective Optimization Techniques for Resilience Enhancement of Electric Vehicles. Electronics 2021, 10, 3030. https://0-doi-org.brum.beds.ac.uk/10.3390/electronics10233030
AMA Style
Hussain A, Kim H-M. Evaluation of Multi-Objective Optimization Techniques for Resilience Enhancement of Electric Vehicles. Electronics. 2021; 10(23):3030. https://0-doi-org.brum.beds.ac.uk/10.3390/electronics10233030
Chicago/Turabian StyleHussain, Akhtar, and Hak-Man Kim. 2021. "Evaluation of Multi-Objective Optimization Techniques for Resilience Enhancement of Electric Vehicles" Electronics 10, no. 23: 3030. https://0-doi-org.brum.beds.ac.uk/10.3390/electronics10233030
Note that from the first issue of 2016, this journal uses article numbers instead of page numbers. See further details here.