Article

Accurate Photovoltaic Models Based on an Adaptive Opposition Artificial Hummingbird Algorithm

1
Department of Electrical Engineering, Faculty of Engineering, Aswan University, Aswan 81542, Egypt
2
Department of Electrical Engineering, College of Engineering, Jouf University, Sakaka 72388, Saudi Arabia
3
Electrical Power and Machines Department, Faculty of Engineering, Ain Shams University, Cairo 11517, Egypt
*
Author to whom correspondence should be addressed.
Submission received: 17 December 2021 / Revised: 14 January 2022 / Accepted: 17 January 2022 / Published: 20 January 2022

Abstract

:
The greater the demand for energy, the more important it is to improve and develop permanent energy sources, because of their advantages over non-renewable energy sources. With the development of artificial intelligence algorithms and the presence of so many data, the evolution of simulation models has increased. In this research, an improvement to one recent optimization algorithm called the artificial hummingbird algorithm (AHA) is proposed. An adaptive opposition approach is suggested to select whether or not to use an opposition-based learning (OBL) method. This improvement is developed based on adding an adaptive updating mechanism to enable the original algorithm to obtain more accurate results with more complex problems, and is called the adaptive opposition artificial hummingbird algorithm (AOAHA). The proposed AOAHA was tested on 23 benchmark functions and compared with the original algorithm and other recent optimization algorithms such as supply–demand-based optimization (SDO), wild horse optimizer (WHO), and tunicate swarm algorithm (TSA). The proposed algorithm was applied to obtain accurate models for solar cell systems, which are the basis of solar power plants, in order to increase their efficiency, thus increasing the efficiency of the whole system. The experiments were carried out on two important models—the static and dynamic models—so that the proposed model would be more representative of real systems. Two applications for static models have been proposed: In the first application, the AOAHA satisfies the best root-mean-square values (0.0009825181). In the second application, the performance of the AOAHA is satisfied in all variable irradiance for the system. The results were evaluated in more than one way, taking into account the comparison with other modern and powerful optimization techniques. Improvement showed its potential through its satisfactory results in the tests that were applied to it.

1. Introduction

The remarkable development of communication systems and easy access to information are the main factors in the development of artificial intelligence algorithms that, in turn, look at the utilization of these data and produce results that help improve the performance of multiple systems [1]. This improvement has had the effect of increasing the efficiency of these systems, thereby increasing the economic return and guiding the vision for the future. Energy sources are some of the most important systems that researchers have been concerned with developing and making the best use of, because of their economic and strategic value to the whole world. Therefore, this has had a severe impact in increasing the search space around the application of artificial intelligence algorithms to obtain ideal models for these systems, so that developers can study the performance of these systems in the laboratory and, thus, save on high manufacturing costs [2].
Modeling of solar systems is one of the contemporary research topics, although it is not a modern research idea, emphasizing its importance, as well as the importance of the improvement algorithms that have begun to intervene in many topics, changing old views on them [3,4,5].
If we consider photovoltaic (PV) models, there are many studies that have been presented in the past and recently. The most popular PV models are the dynamic and static PV models. The static PV models are based on equivalent circuits containing resistance and diodes [6], because the characteristics of PV cells are similar to those of the semiconductor P–N junction (diode) [7]. The popular static models are the single-diode model (SDM), double-diode model (DDM), and three-diode model (TDM). From the names of these models, it is clear that they are distinguished by the number of diodes in the model. The SDM has one diode to represent the diffusion current in the P–N junction [8,9,10], a resistance connected in series with the diode to represent the total resistance of the semiconductor material at the neutral region, and a resistance connected in parallel with the diode to represent the total current leakage resistance across the P–N junction of the solar cell. The DDM has two diodes, one series resistance, and one parallel resistance; the second diode represents the recombination effect in the P–N junction [11,12,13,14]. The TDM has three diodes, one series resistance, and one parallel resistance; the third diode represents the effect of leakage current and grain boundaries [15,16,17]. The total estimated parameters for the SDM, DDM, and TDM are five, seven, and nine parameters, respectively. Although increasing the number of diodes has an effect of increasing the model’s accuracy, the model’s complexity is also increased. Dynamic PV models have been developed to represent the effect of switching and load variation, along with the connection between the PV system and the load. The two most popular PV dynamic models are transfer function models: the integral order model (IOM), and the fractional order model (FOM) [18,19].
As for the application of optimization algorithms to obtain an accurate PV model, many previous studies have been carried out for this purpose [20]. The rapid development of population-based optimization algorithms has enhanced this research area, due to their being meta-heuristic and derivative-free algorithms, unlike greedy algorithms—which solve problems locally in each step, thus depending on finding the best solution in each step based on the previous step—and convex algorithms (e.g., gradient descent algorithms) that depend on the convex function. Therefore, population-based algorithms are suitable for complex and nonlinear functions such as the objective functions of PV models [20,21]. The main challenge in the estimation of PV models’ parameters is the nonlinear characteristics of the PV systems, requiring a robust optimization algorithm for this optimization problem. A review of the recent work in this area was presented in [21]. In this study, a collection of recent work on the estimation of PV parameters is discussed. Approximately 29 optimization algorithms are reviewed, such as ABC, MPSO, SSA, and ITLBO. In each reference, the main points discussed are the PV model type, the different applications and case studies proposed, the evaluation methods, and the obtained results. The TDM has seen many applications in the literature, due to its efficiency in representing PV modules such as polycrystalline MSX-60, monocrystalline CS6K-280M and multicrystalline KC200GT. Some studies have applied optimization algorithms to estimate all nine parameters of the TDM, while others tried to estimate two parameters analytically and the rest using optimization algorithms [22]. In this work, the proposed optimization algorithm was used to estimate all nine parameters of the TDM, in order to check and compare its performance with other optimization algorithms through such complex problems.
Different modified algorithms have been proposed in studies such as [23,24,25,26]. The AHA is one of the recently proposed algorithms, inspired by the special flight abilities of hummingbirds and their intelligent foraging strategies [27]. The AOAHA is proposed as an enhanced version of the AHA using an adaptive method. The main advantage of the adaptation technique is that the enhancement technique is employed when the algorithm fails to find good solutions. Therefore, the proposed AOAHA improves the performance of the original algorithm by increasing the exploration and exploitation balance, thus decreasing the probability of local optima problems. The AOAHA was tested through benchmark functions and applied to estimate the parameters of the static TDM and dynamic IOM and FOM through several applications. The obtained results were analyzed and compared with an original algorithm and other recent algorithms through different evaluation methods.
The main contributions of this paper can be described as follows:
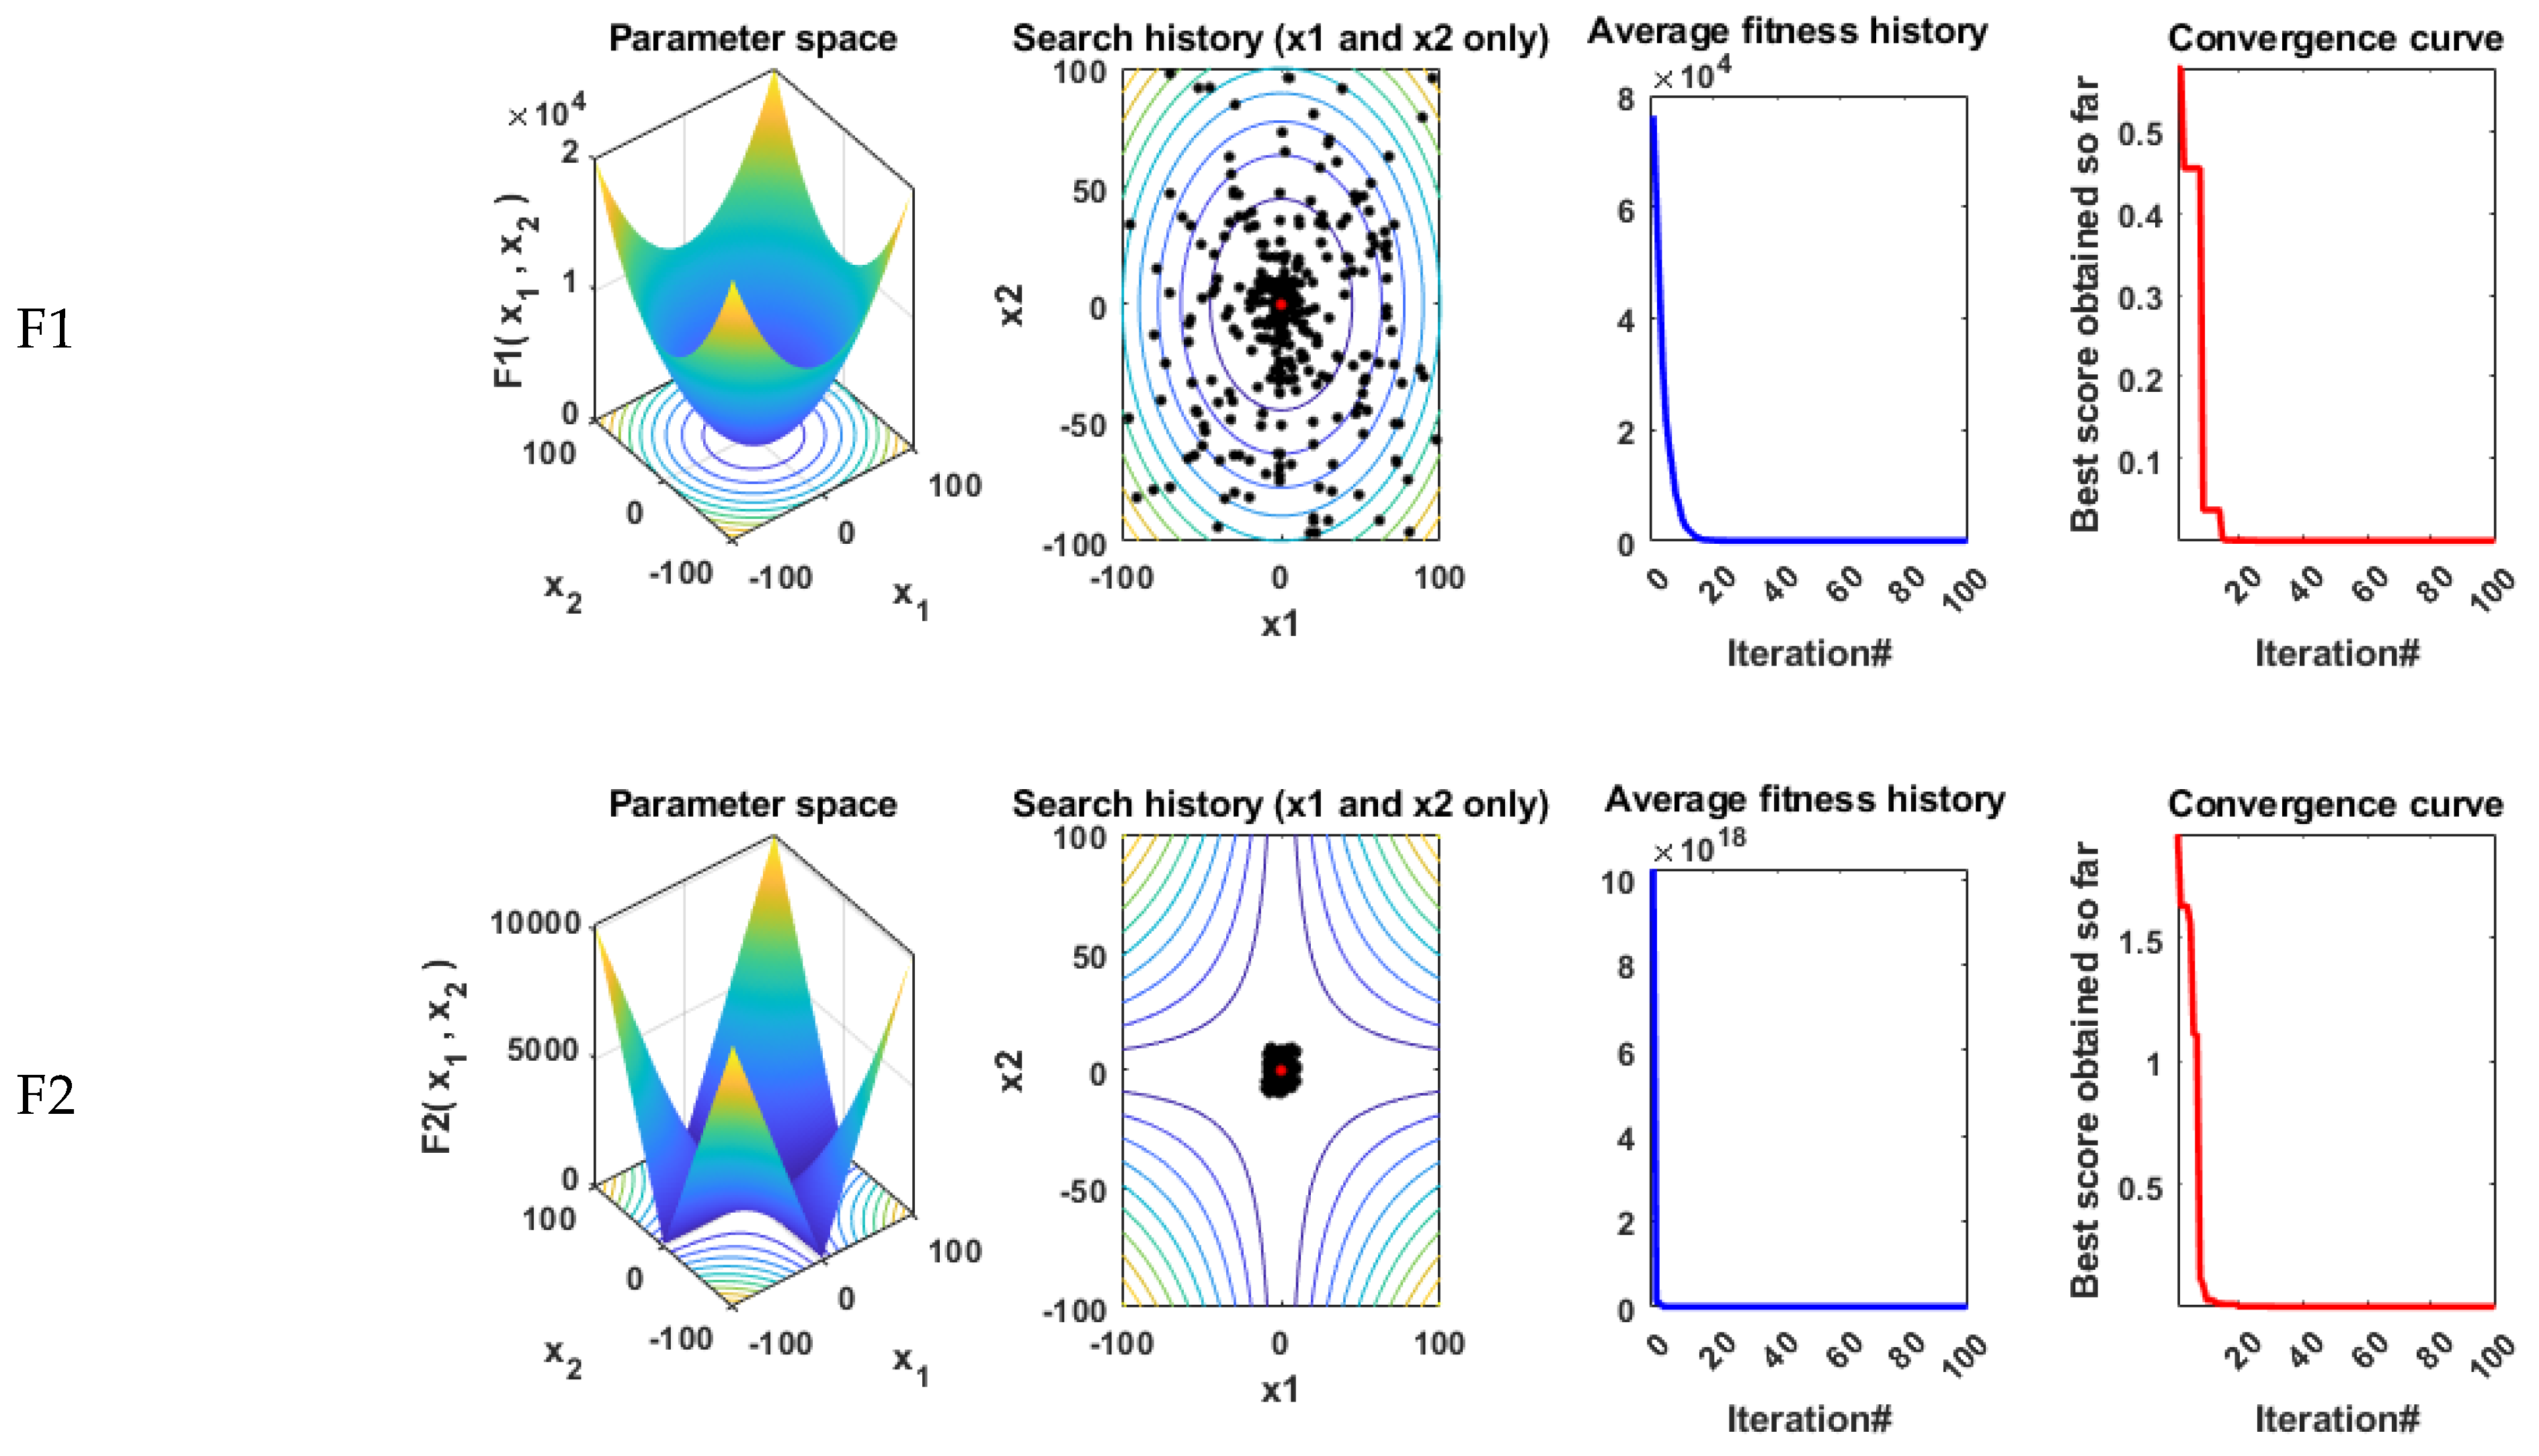
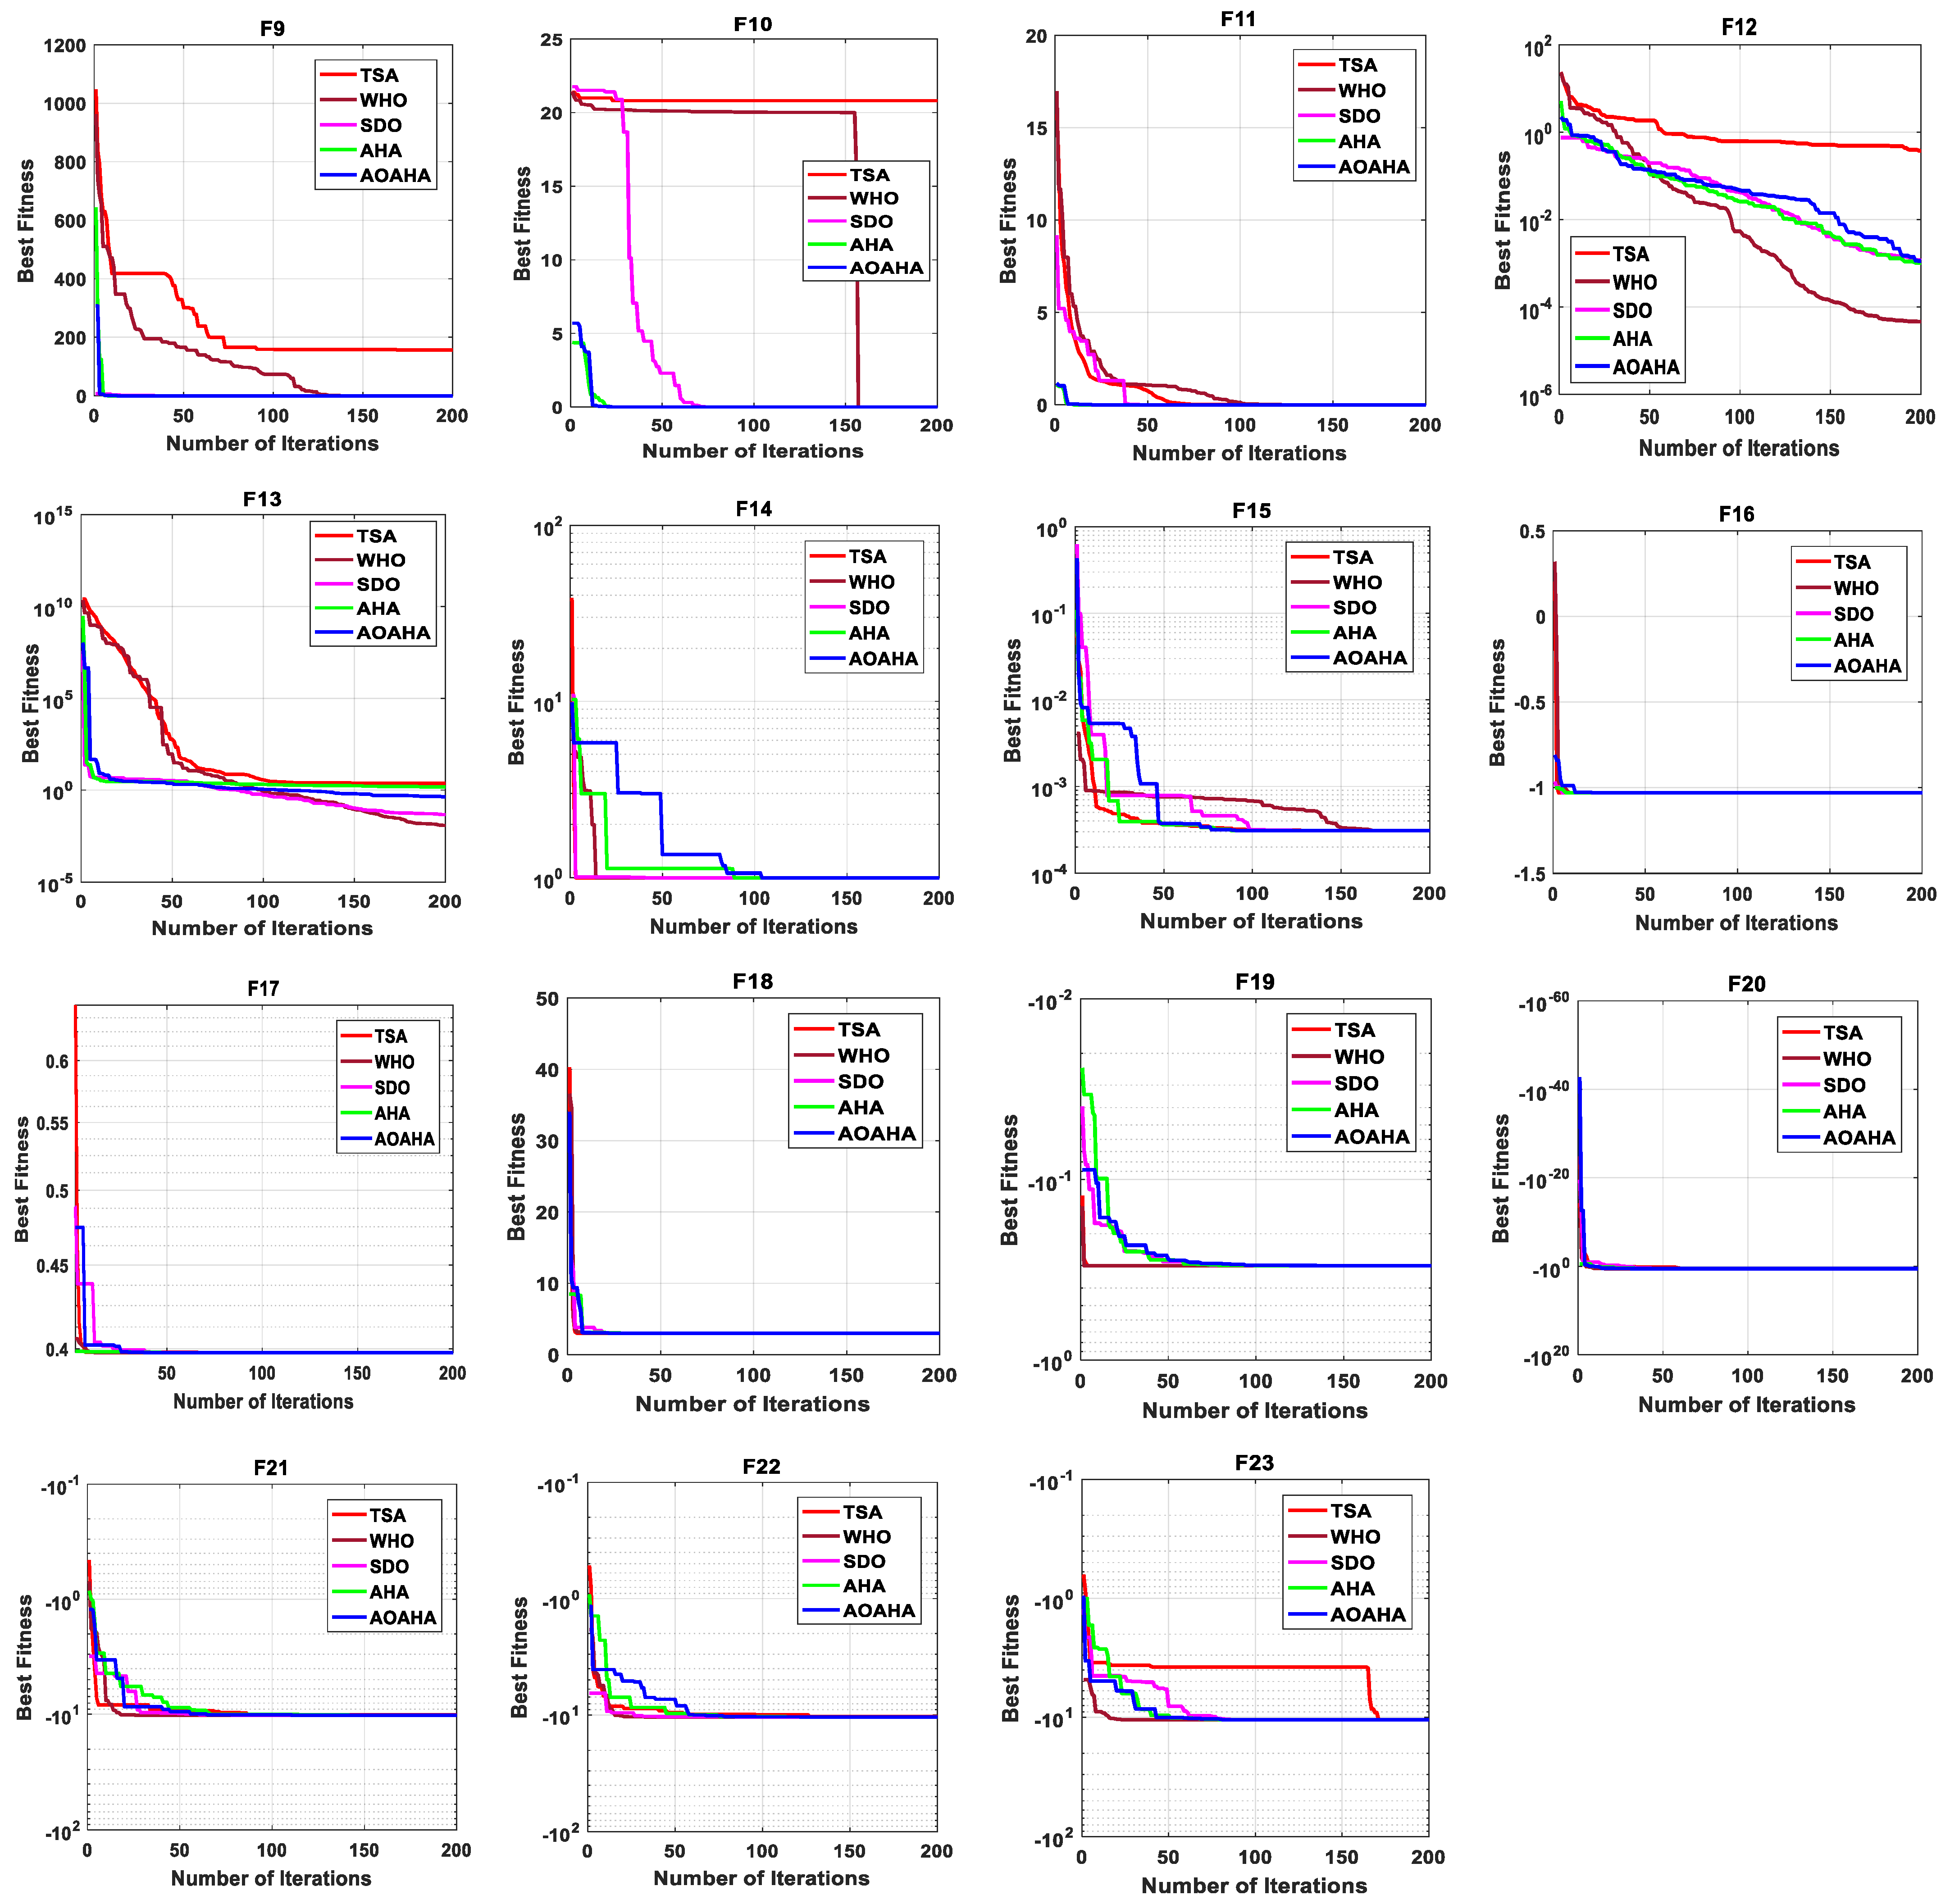
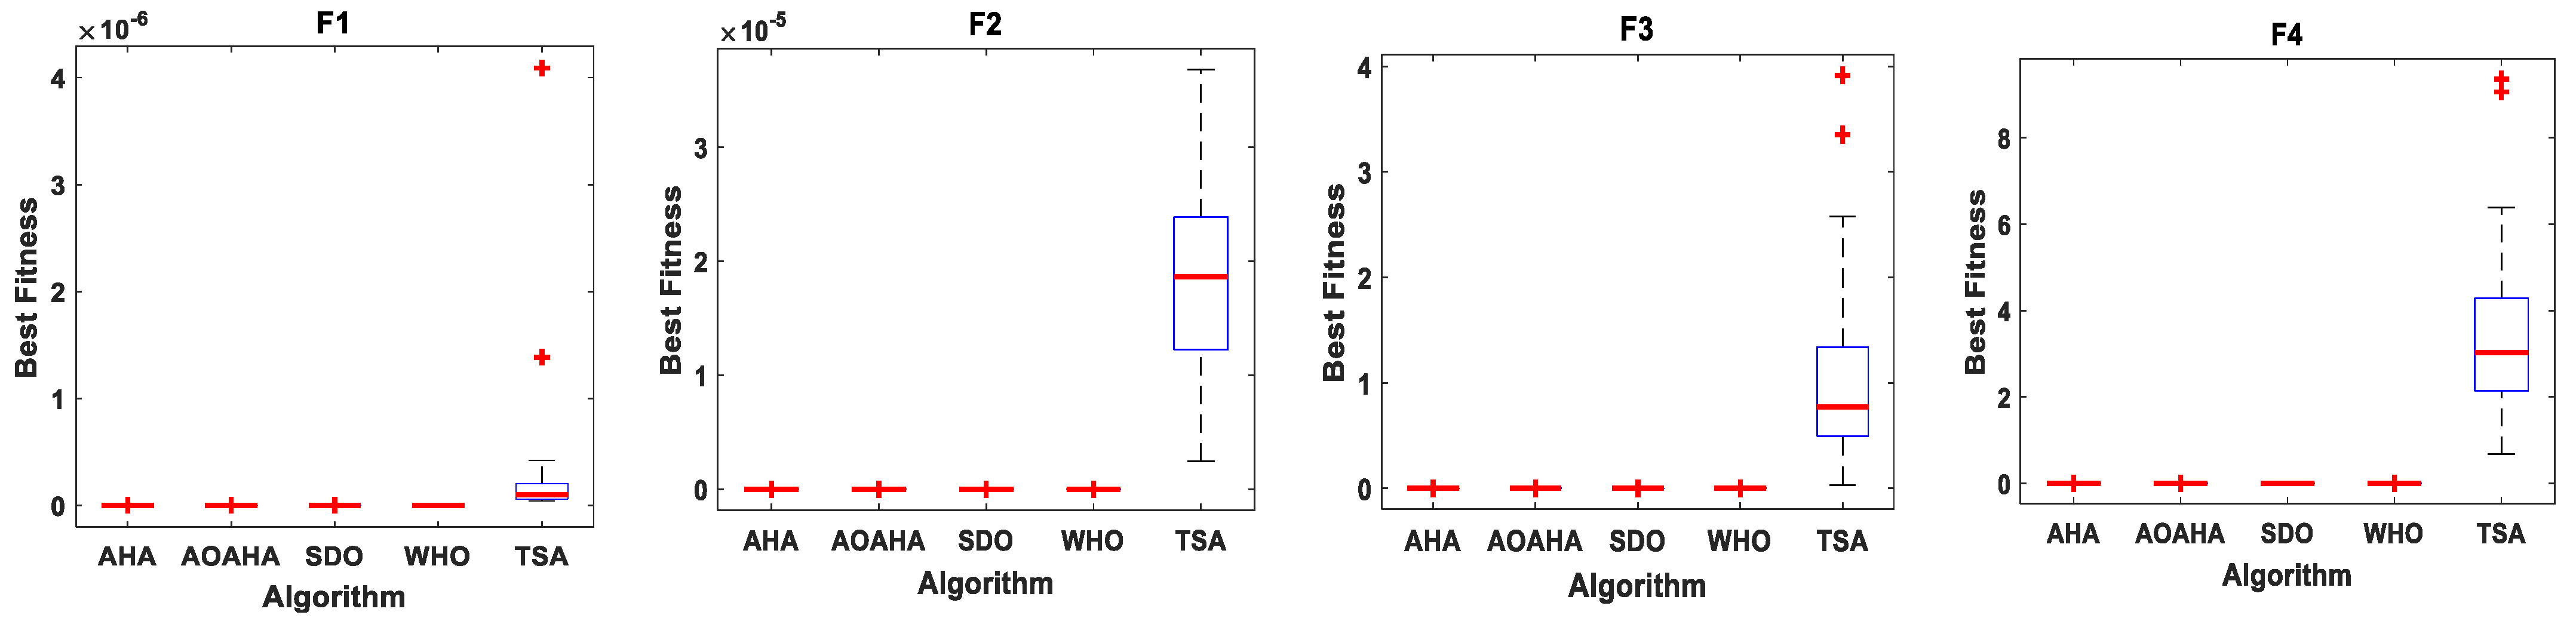
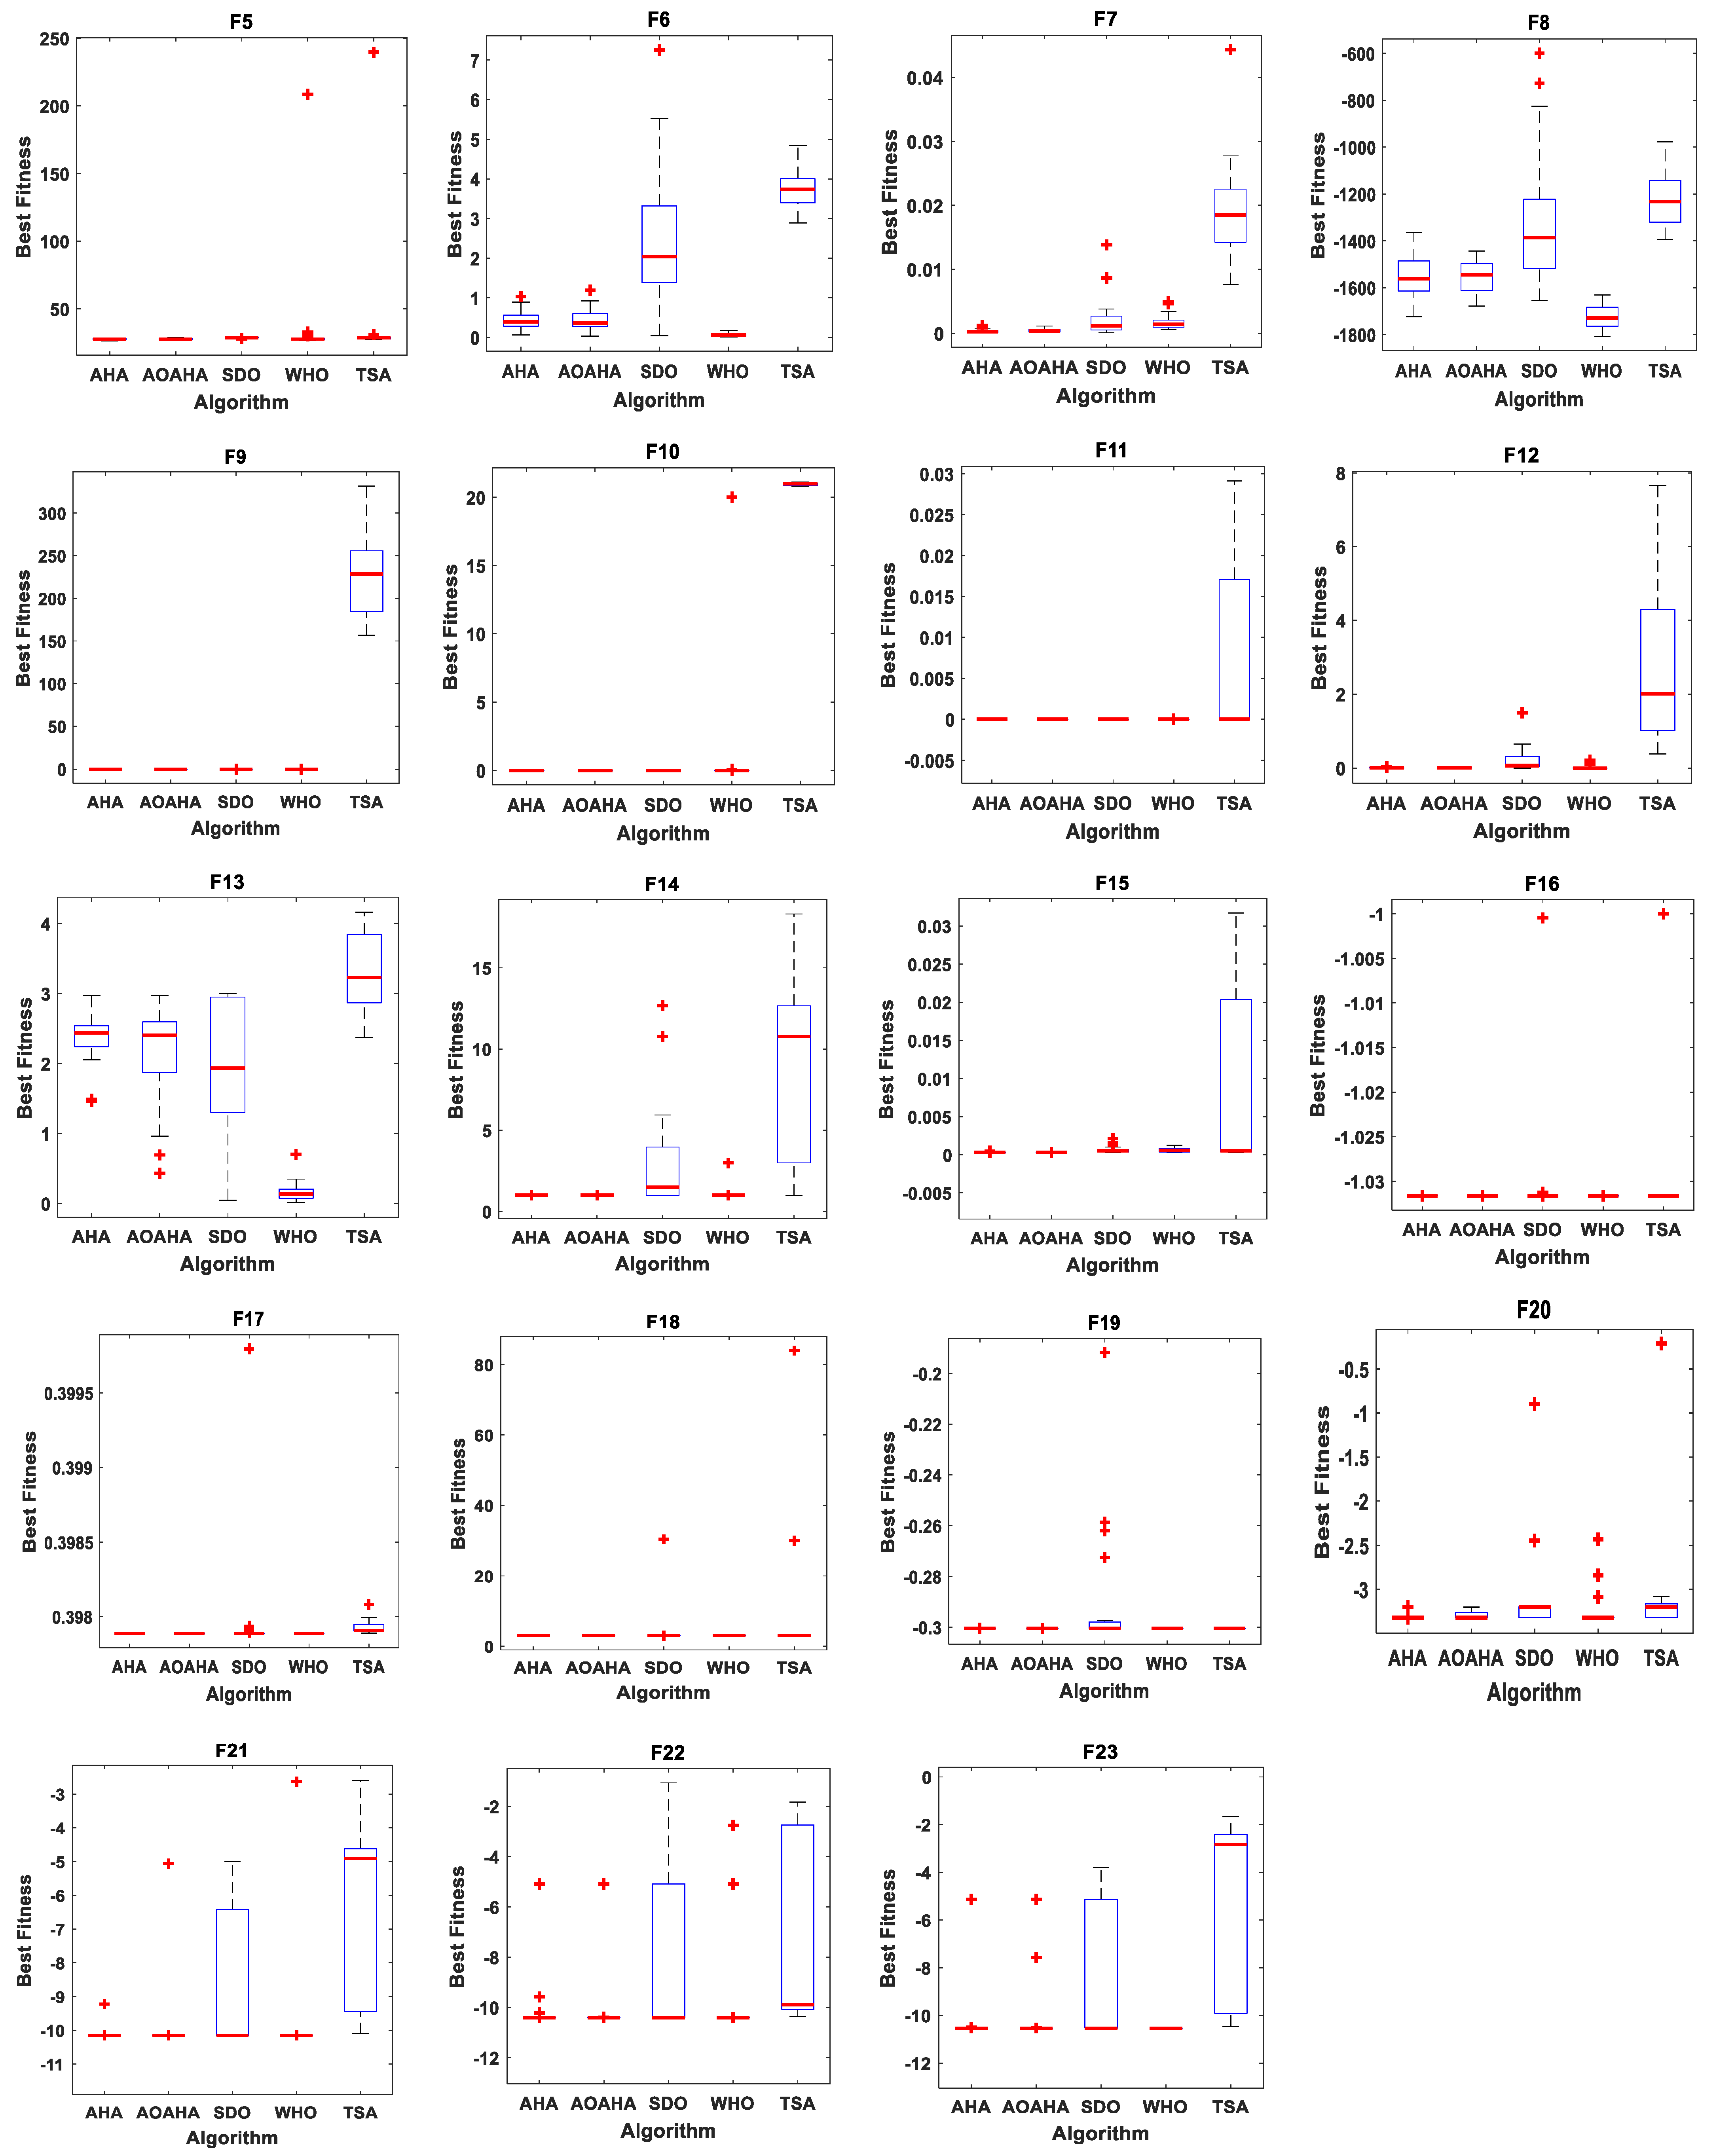
  • A novel enhanced algorithm (AOAHA) has been proposed and tested through unimodal, multimodal, and composite benchmark functions, totaling 23 benchmark functions;
  • The enhancement was based on an adaptive opposition approach that suggests whether or not to use an opposition-based learning (OBL) method;
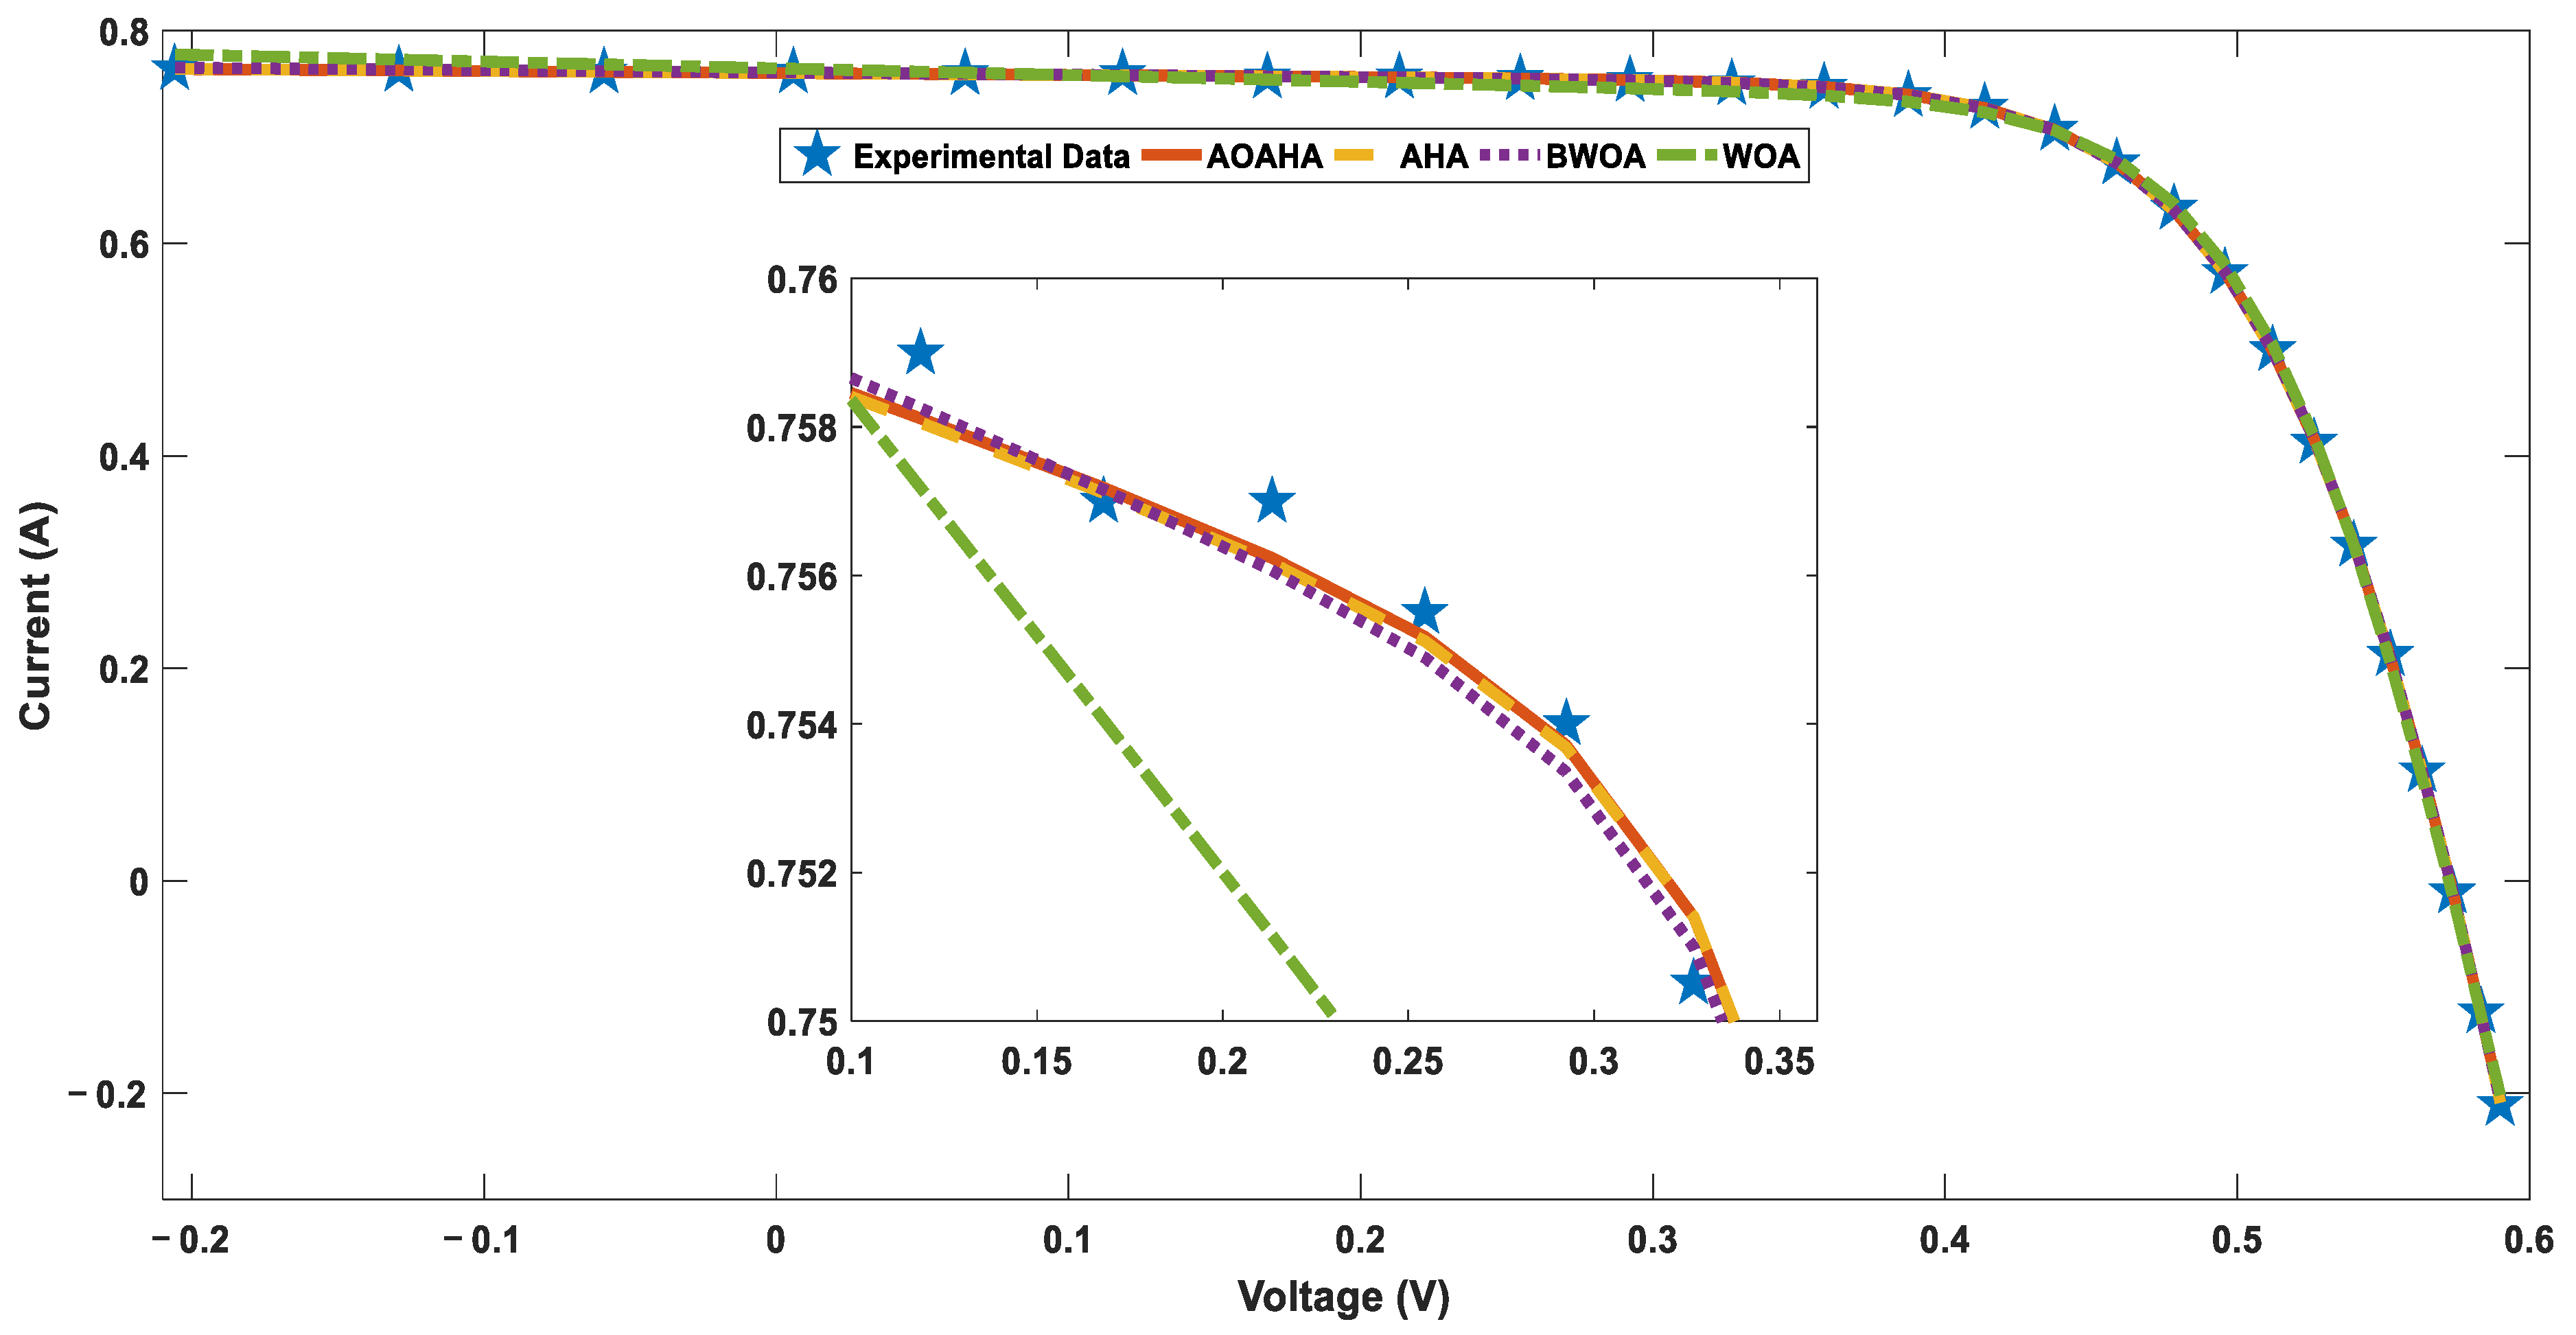
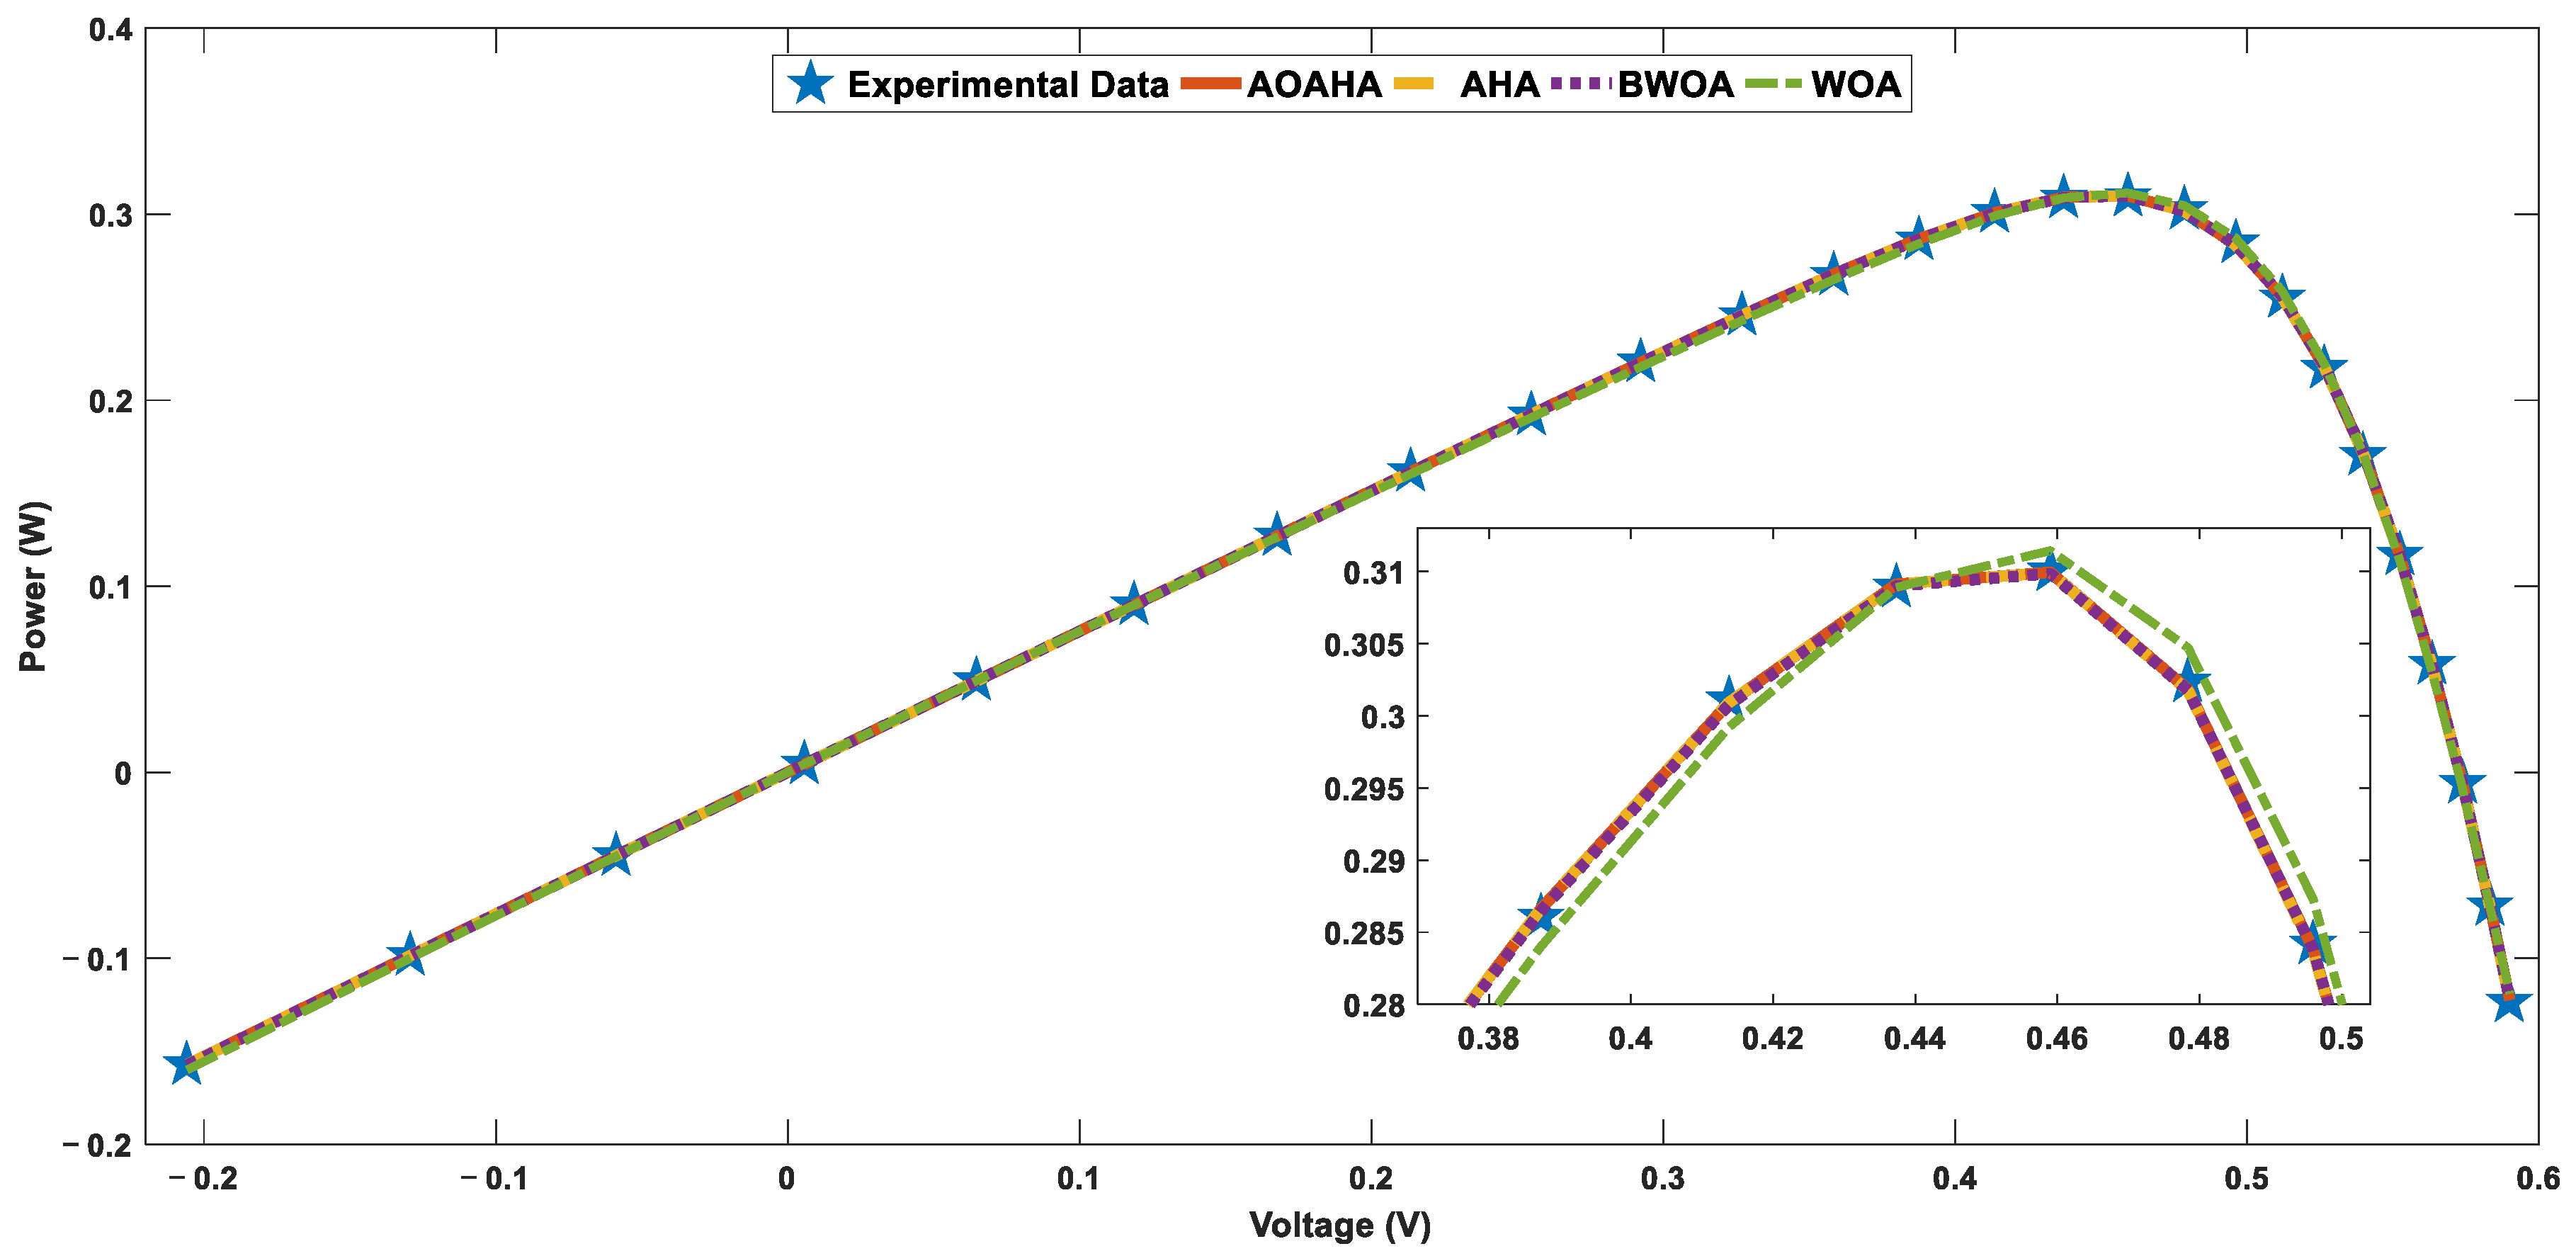
  • AOAHA was applied to estimate accurate PV models with consideration of a complex optimization problem, due to the nonlinearities in the PV system’s behavior;
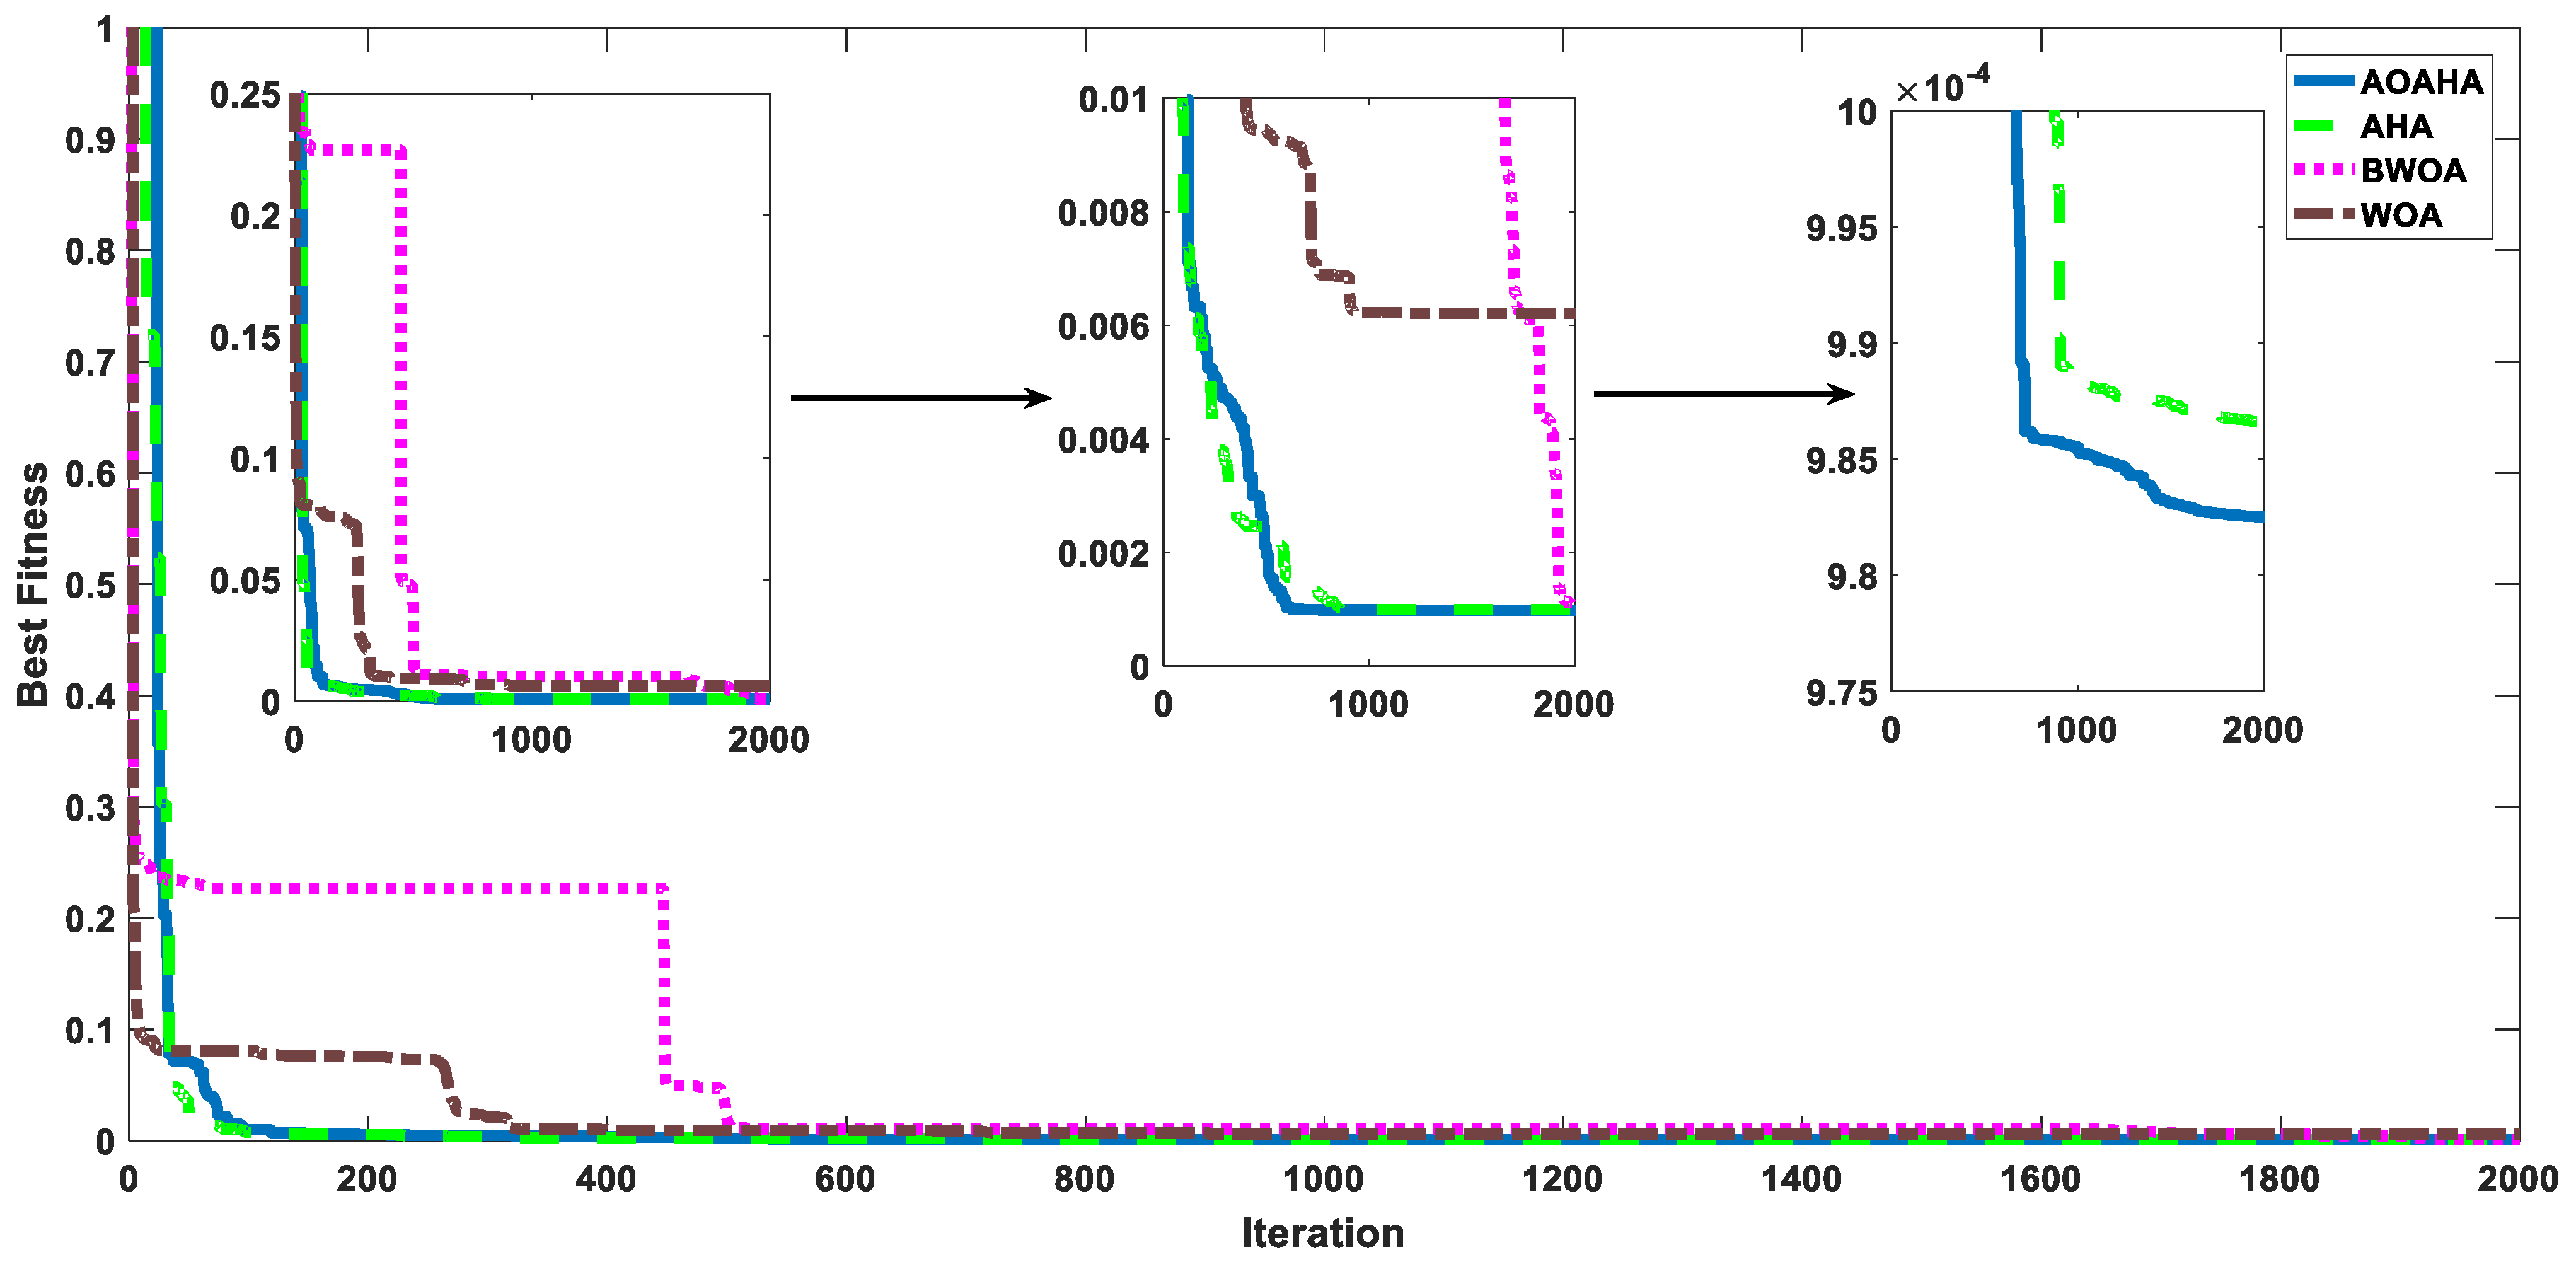
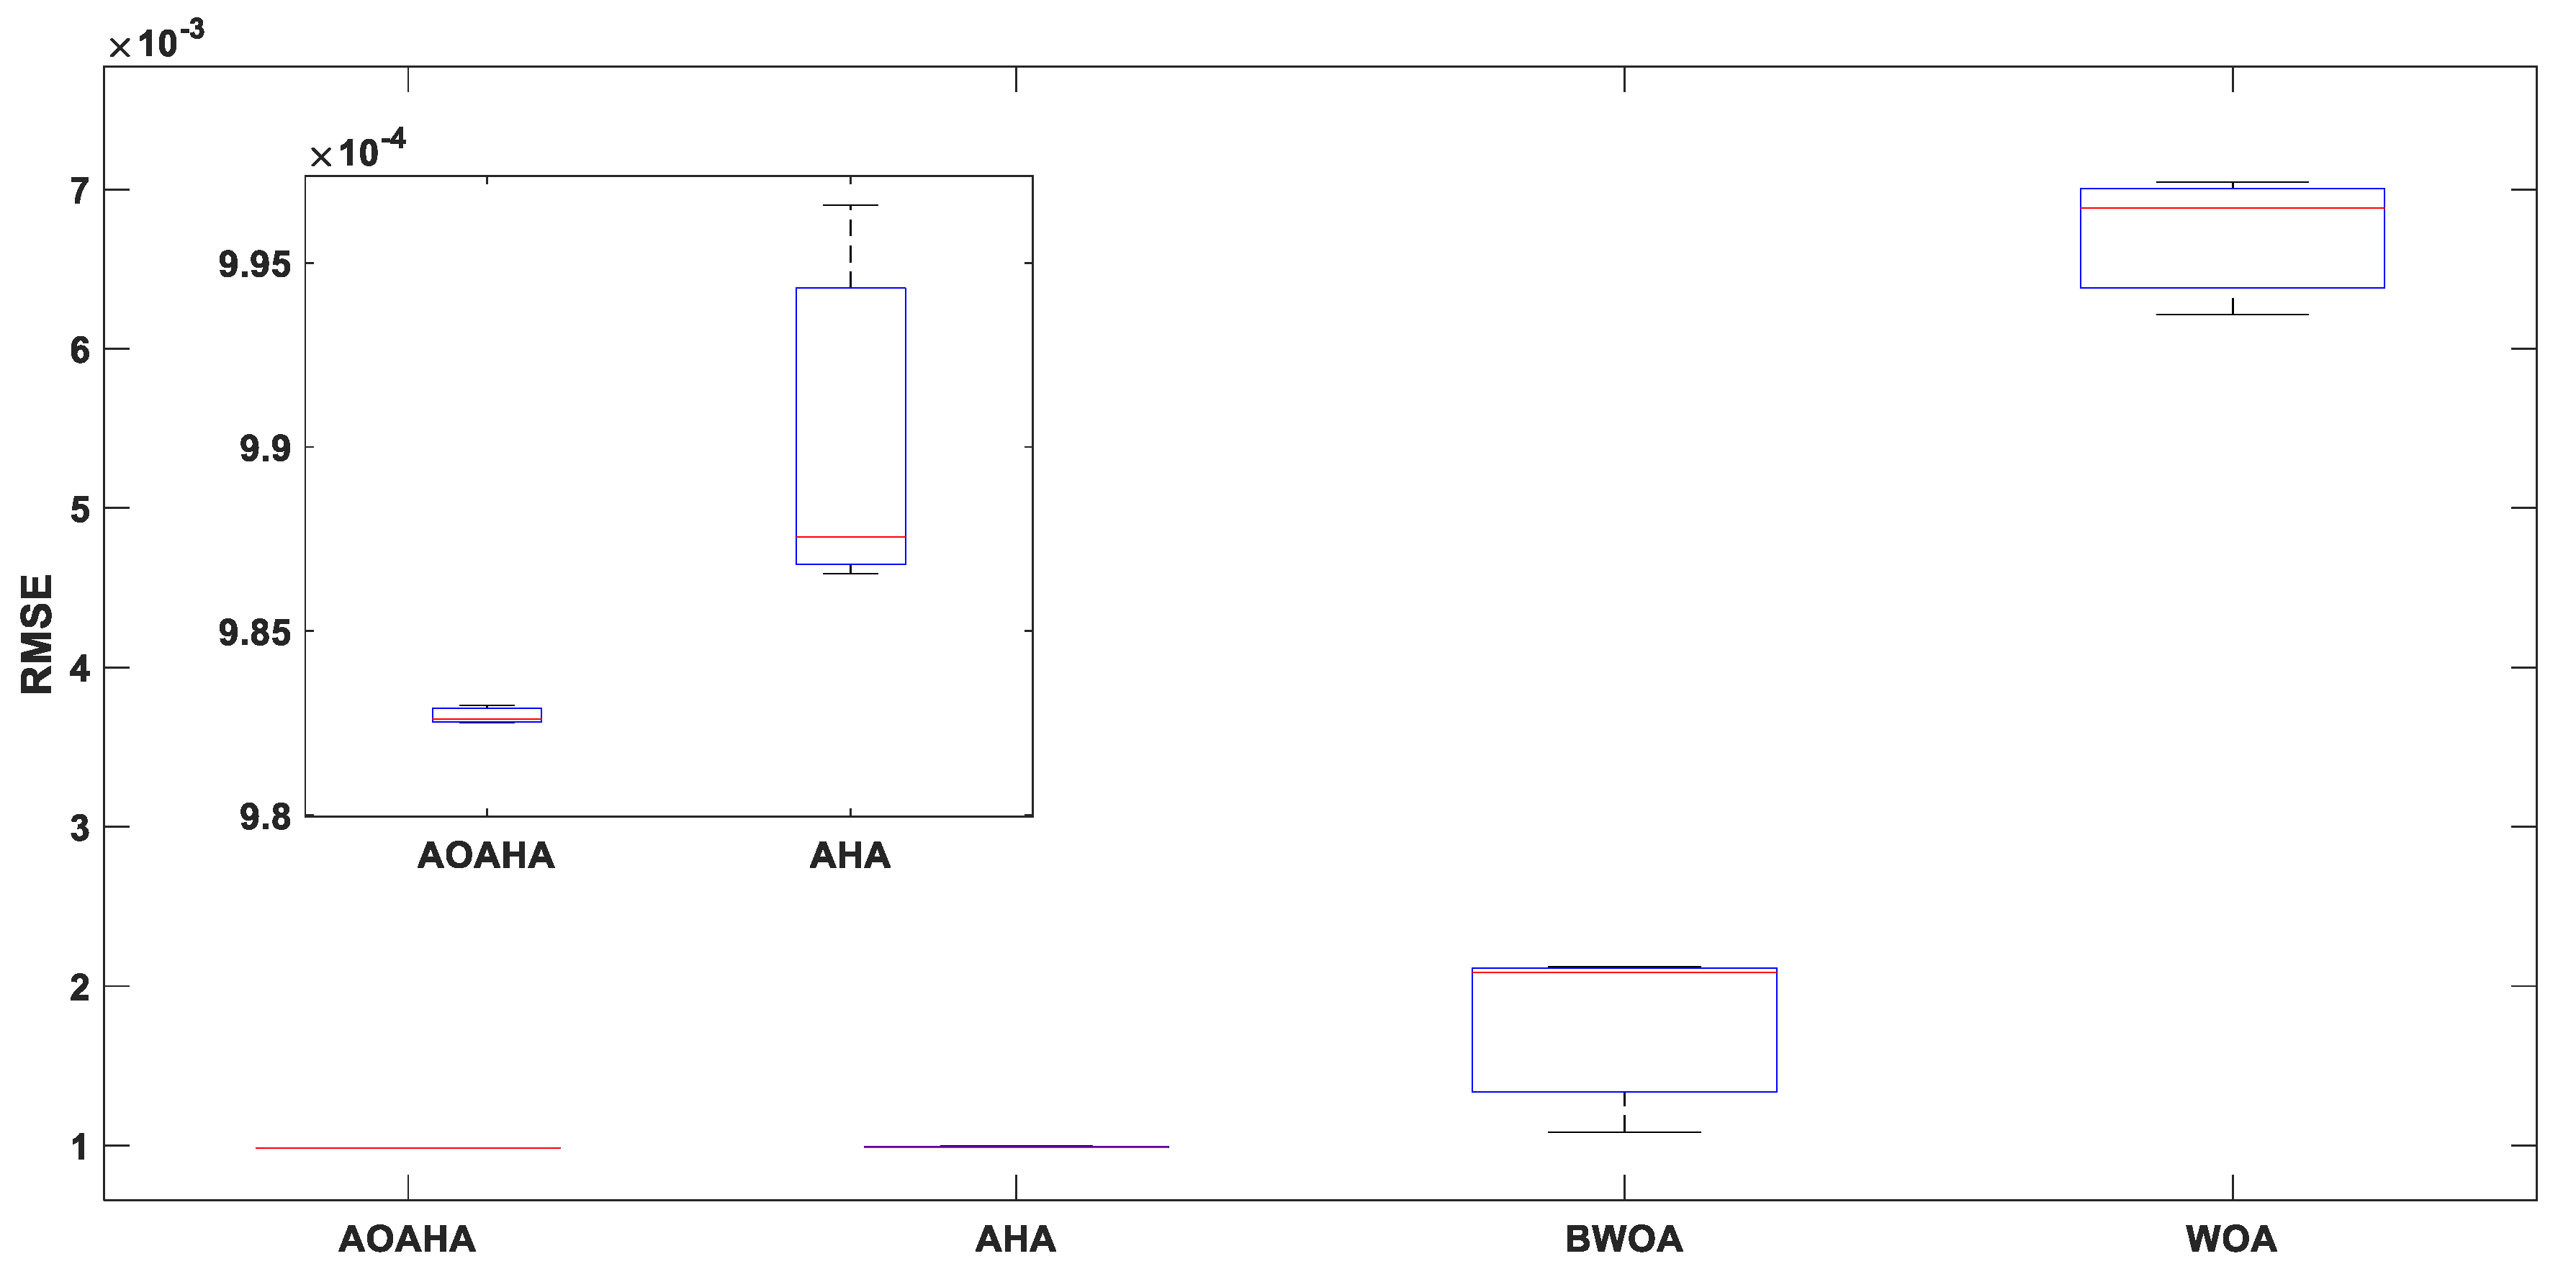
  • The estimated models and the algorithm behavior were evaluated through different evaluation methods, such as RMSE, absolute error statistical analysis, and algorithm convergence curves;
  • The proposed algorithm gives better results than the original and other recent algorithms, both in the benchmark functions and in the real PV application. The enhancement approach increased the exploration and exploitation balance of the original algorithm, as well as its probability of avoiding local optima problems.
The rest of this paper is arranged as follows:
Section 2 presents the PV models (static and dynamic). The proposed AOAHA is discussed in Section 3. The obtained results and their analysis are discussed in Section 4. Section 5 presents the conclusions.

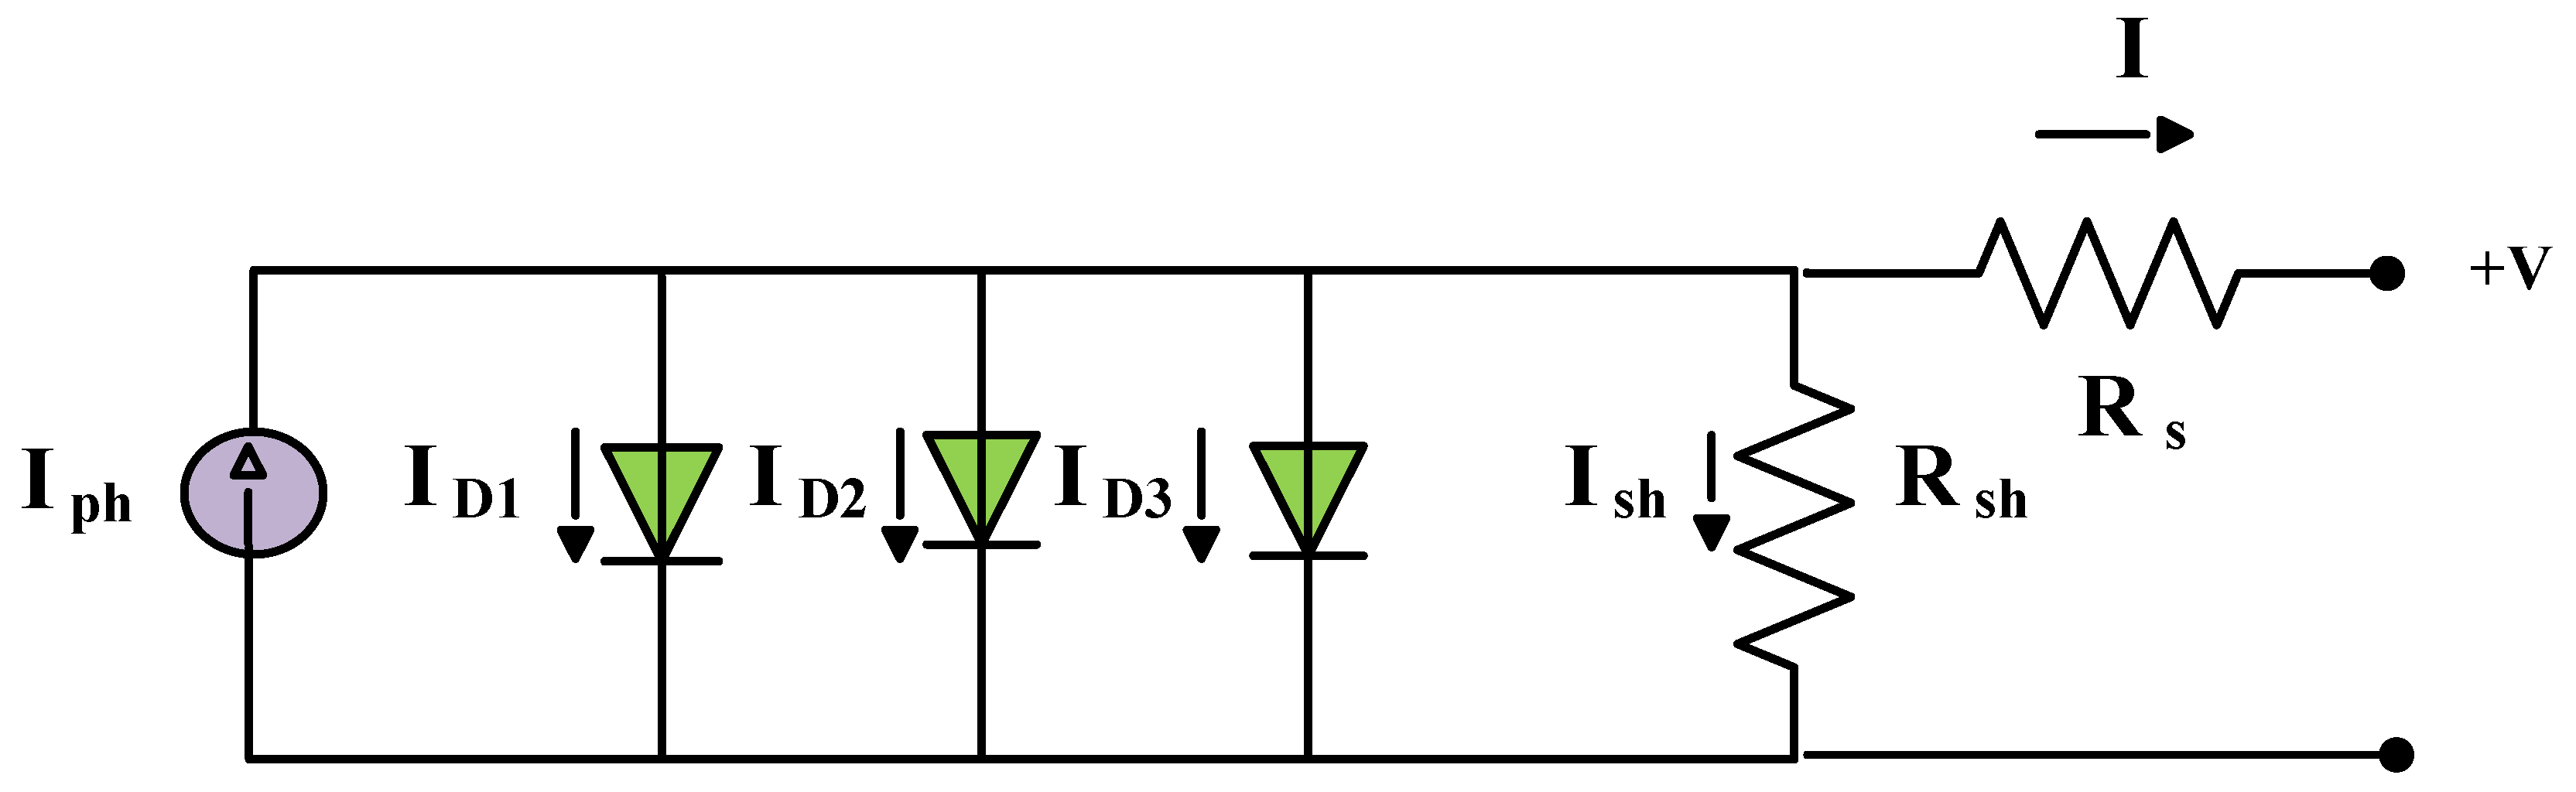
2. PV Models (Static and Dynamic)

In this section, the static and dynamic PV models are presented. From the static PV models, the TDM was selected. The main dynamic models (IOM and FOM) are also discussed.

2.1. Static TDM

The TDM has three diodes connected in parallel with one another, a resistance connected in series with the group of diodes to represent the total semiconductor material at neutral regions resistance, a resistance connected in parallel with the group of diodes to represent the total current leakage resistance across the P–N junction of the solar cell, and a current source connected in parallel with the group of diodes to represent the photo generated, as shown in Figure 1. The TDM has nine parameters, if x is considered a vector of model parameters x = [x1, x2, x3, x4, x5, x6, x7, x8, x9] equivalent to [Rs, Rsh, Iph, Is1, Is2, Is3, η1, η2, η3]. The TDM is described by Equations (1) and (2). The objective function of the TDM is described by Equation (3).
I = I p h I D 1 I D 2 I D 3 I s h
where I is the real PV system output current, I p h is a current source representing the generated current from the photons, I D 1 ,   I D 2 , and   I D 2 represent the current of the first, second, and third diodes, respectively, and I s h is the current of shunt resistance.
I = I p h I s 1 [ e x p ( q ( V + R s . I ) η 1 . K . T ) 1 ] I s 2 [ e x p ( q ( V + R s . I ) η 2 . K . T ) 1 ] I s 3 [ e x p ( q ( V + R s . I ) η 3 . K . T ) 1 ] V + R s . I R s h
where V is the PV system output voltage, R s   and   R s h are the series and shunt resistance, respectively, η 1 , η 2 ,   and   η 3 are the ideality factor of the first, second, and third diodes, respectively, K is a constant of =1.380 × 10⁻²³ (J/Ko), and q is a constant of 1.602 × 10⁻¹⁹ (C) coulombs.
F T D ( V , I , X ) = I X 3 X 4 [ e x p ( q ( V + R s . I ) X 7 . K . T ) 1 ] X 5 [ e x p ( q ( V + R s . I ) X 8 . K . T ) 1 ] X 6 [ e x p ( q ( V + R s . I ) X 9 . K . T ) 1 ] V + X 1 . I X 2
where F T D is the objective function of the TDM.

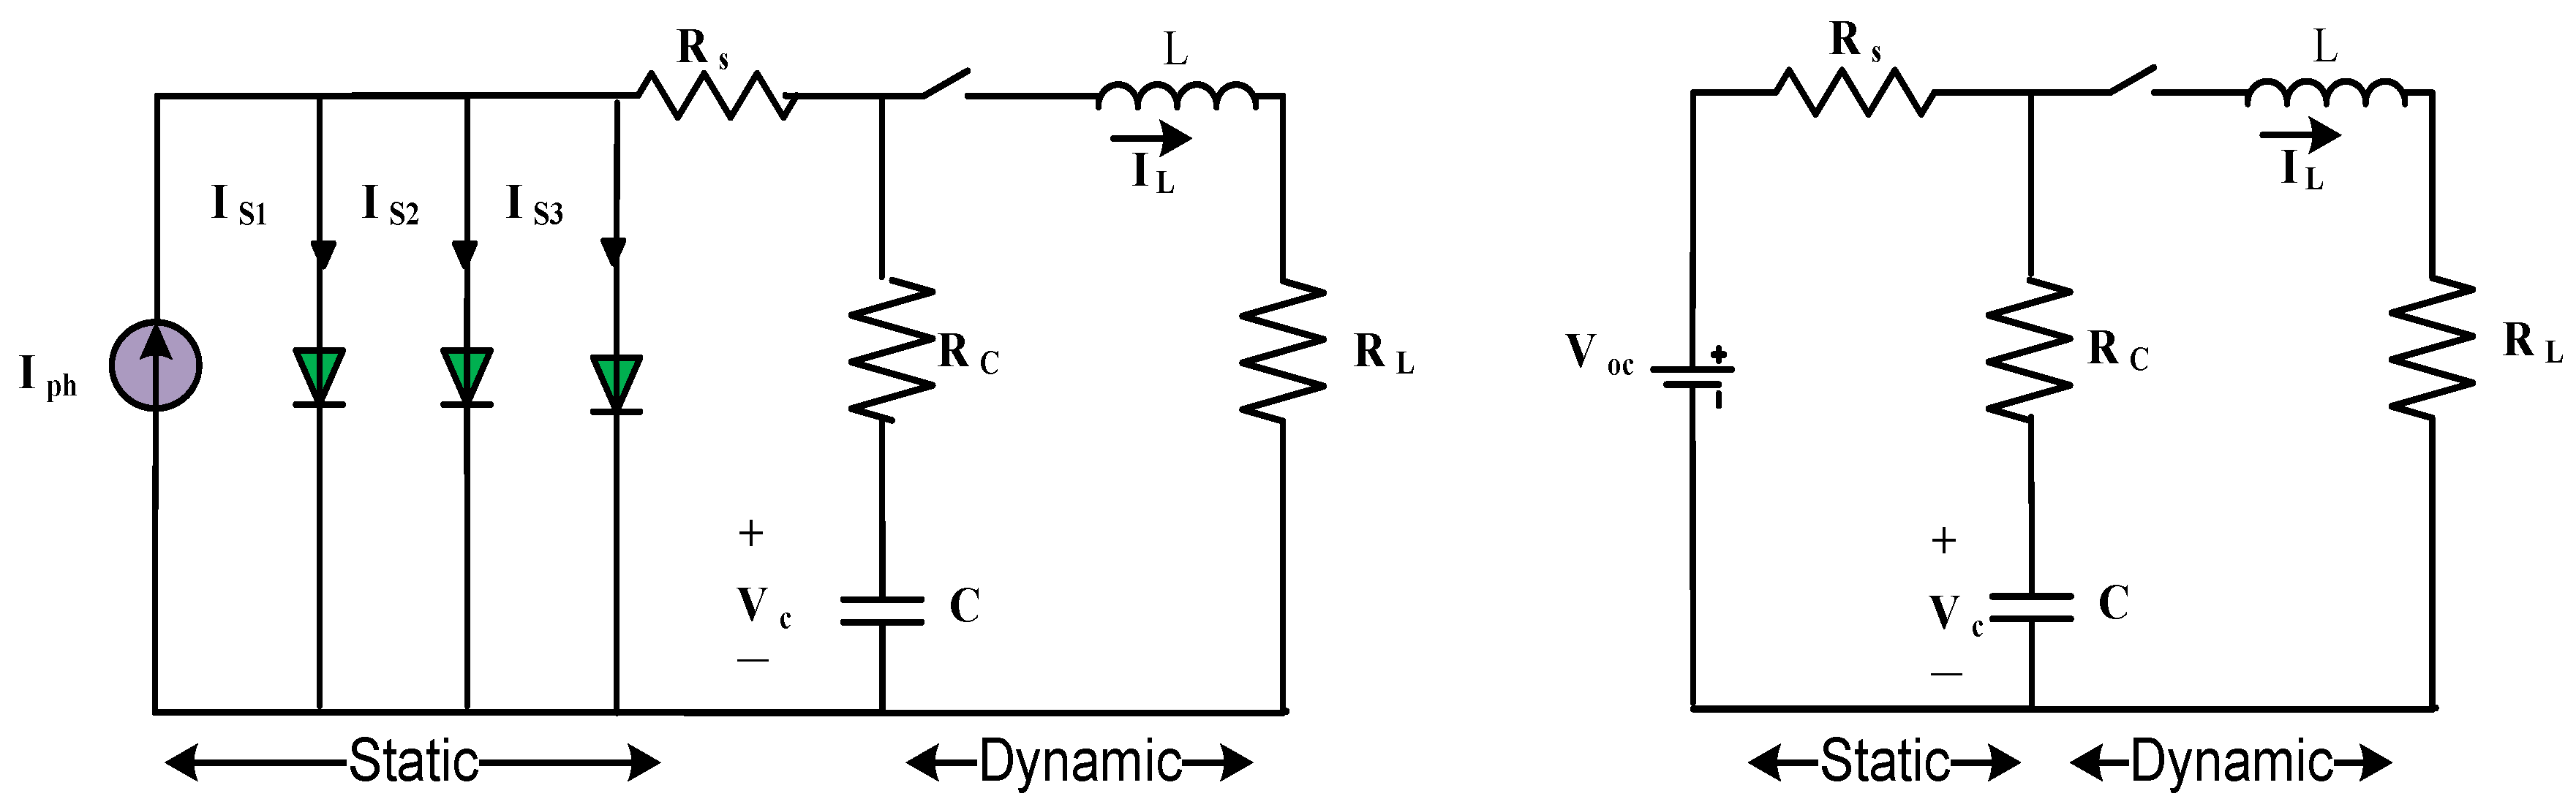
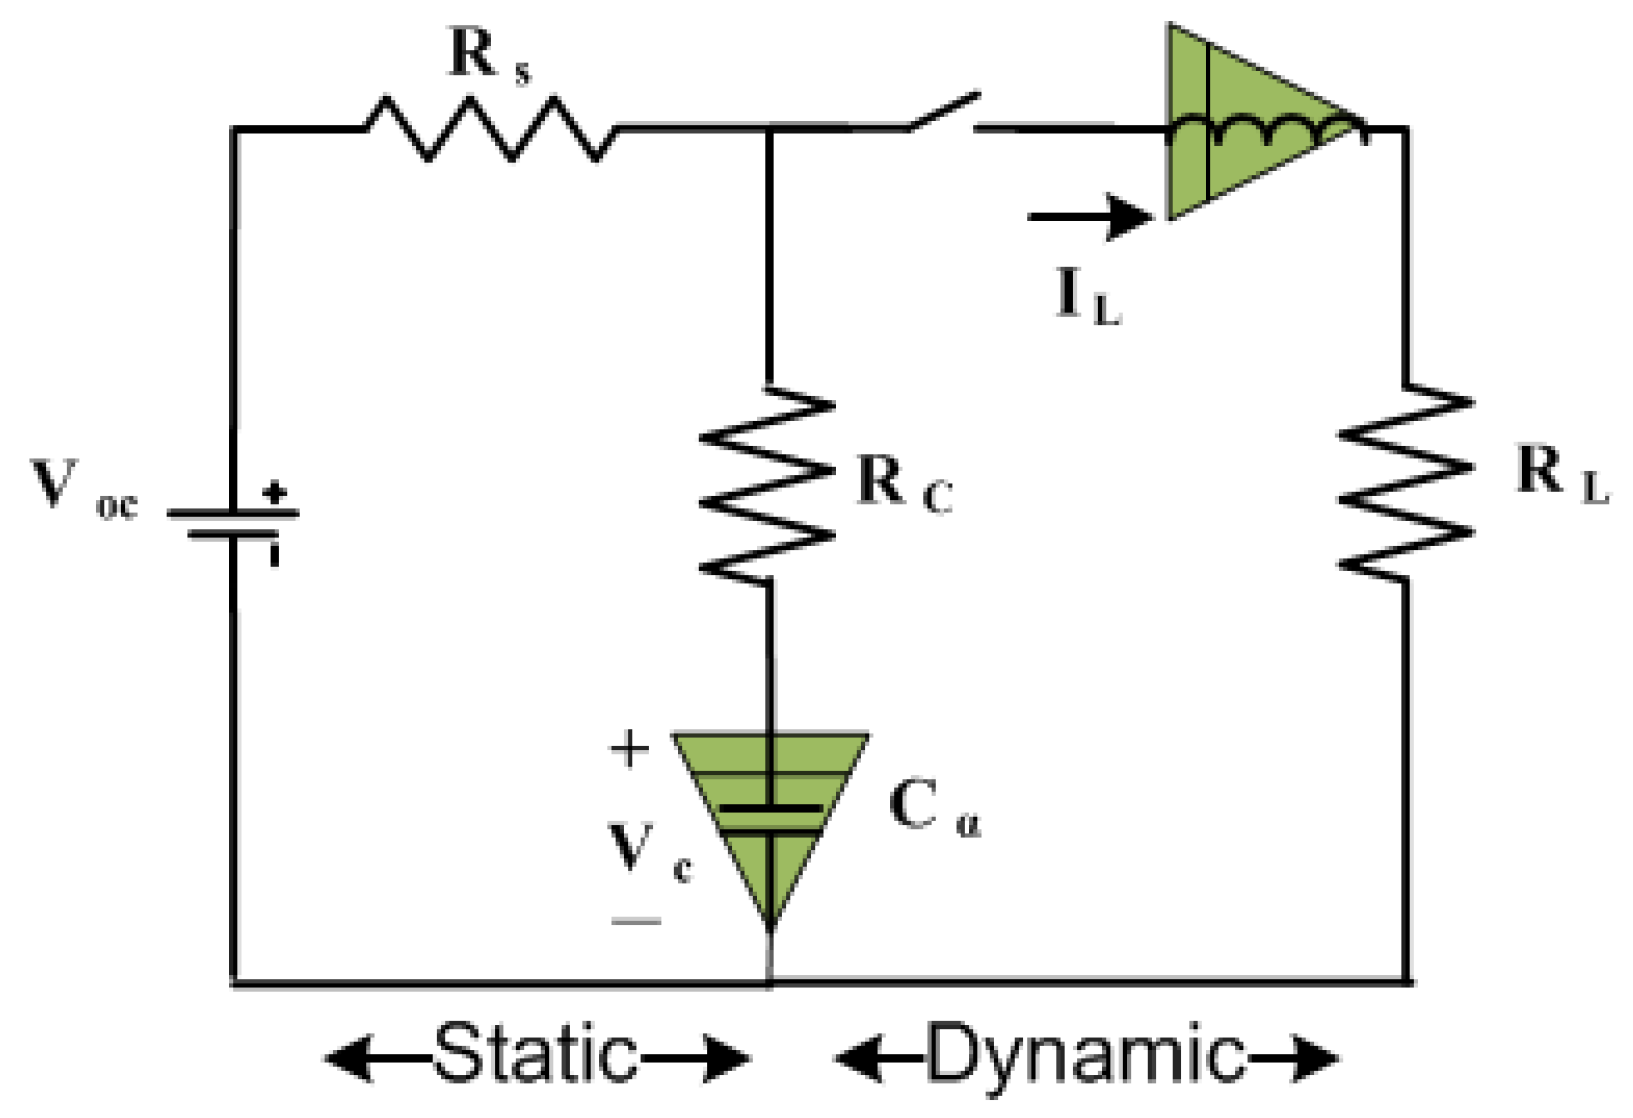
2.2. Dynamic PV Model

Dynamic PV models have been proposed in the literature to represent the effects of load and switching, as well as the connection between the load and the PV source. The two main models are the integral and fractional order dynamic PV models.
The integral order model (IOM) is a second-order transfer function model. The IOM consists of two parts—one for static and the other for dynamic—as shown in Figure 2, and consists of the following:
-
V o c : Constant voltage source (static part);
-
R S : Series resistance to represent the static model (static part);
-
C : Capacitor for junction capacitance (dynamic part);
-
R c : Resistance for conductance (dynamic part);
-
L : The connected cables’ inductance is represented by the coil inductance (dynamic part);
-
R L : Resistance to represent the load (dynamic part).
There are a total of three estimated parameters for the IOM ( R c , C ,   and   L ); the IOM is represented by Equations (4) and (5).
i L ( s ) = V oc s a 11 ( s + b 1 ) + b 2 ( s a 11 ) ( s a 22 ) ( s a 11 ) a 12 a 21
( a 11   a 12 a 21   a 22 ) = ( 1 C ( R c + R s )   R S C ( R c + R s ) R S L ( R c + R s )   [ R L R c + R s R c + R L R s ] L ( R c + R s )   )
( b 1   b 2 ) = ( 1 C ( R c + R s ) R c L ( R c + R s ) )
In transfer function models, the fractional orders are used to represent some components that cannot be represented though the IOM. The FOM can represent the fractional capacitor and capacitance and the fractional inductance, as shown in Figure 3. The fractional order of capacitance and inductance are represented by α and β, respectively. The total number of FOM parameters is five ( R c , C ,   L ,   α ,   and   β ); the FOM is represented by Equations (6) and (7).
i L ( s ) = V oc s a 11 ( s α + b 1 ) + b 2 ( s α a 11 ) ( s β a 22 ) ( s α a 11 ) a 12 a 21
( a 11   a 12 a 21   a 22 ) = ( 1 C α ( R c + R s )   R S C α ( R c + R s ) R S L β ( R c + R s )   [ R L R c + R s R c + R L R s ] L β ( R c + R s )   )
( b 1 b 2 ) = ( 1 C α ( R c + R s ) R c L β ( R c + R s ) )

3. The Proposed Optimization Methodology

This section briefly defines the basics of the artificial hummingbird algorithm (AHA). Then, the process of the proposed adaptive opposition artificial hummingbird algorithm (AOAHA) is described.

3.1. Artificial Hummingbird Algorithm (AHA)

The AHA is an optimization technique inspired by the foraging and flight of hummingbirds, as presented in [27]. The three main models of this algorithm are presented as follows:
(a)
Guided foraging
In this foraging model, three flight behaviors are used in foraging (omnidirectional, diagonal, and axial flight). Figure 4 presents these three flight behaviors in 3D space. The equation simulating this guided foraging and a candidate food source can be obtained as follows:
v i ( t + 1 ) = x i , t a ( t ) + h . b . ( x i ( t ) X i , t a ( t ) ) h   ~   N ( 0 , 1 )
where x i , t a ( t ) represents the position of the target food source, h denotes the guided factor, and x i ( t ) is the position of the ith food source at time t.
The position update of the ith food source is as follows:
x A i ( t ) = { x i ( t )           f ( x i ( t ) )   f ( v i ( t + 1 ) ) v i ( t + 1 )     f ( x i ( t ) ) > f ( v i ( t + 1 ) )
where f ( x i ( t ) ) and f ( v i ( t + 1 ) ) are the value of function fitness for x i ( t ) and v i ( t + 1 ) , respectively.
(b)
Territorial foraging
The following equation represents the local search of hummingbirds in the territorial foraging strategy:
v i ( t + 1 ) = x i ( t ) + g . b . ( x i ( t ) ) g   ~   N ( 0 , 1 )
where g denotes the territorial factor.
(c)
Migration foraging
The mathematical equation for the migration foraging of a hummingbird is presented as follows:
x w o r ( t + 1 ) = l b + r . ( u b l b )
where x w o r   represents the source of food with worst population rate of nectar refilling, r is a random factor, and u b and l b are the upper and lower limit ranges, respectively.

3.2. Adaptive Opposition Artificial Hummingbird Algorithm (AOAHA)

It is suggested to use an adaptive approach to select whether or not to use an opposition-based learning (OBL) method. This idea is used to further improve the exploration ability; furthermore, it ensures the maximization of the exploitation stage by replacing one random search agent with the best one in the updated position [28].
(a)
Opposition-based learning
OBL uses the position x o i ( t ) in the search space, which is the accurate opposite of the position x i ( t ) of the ith food source, and compares it to update the position of the next iterations. This method helps to reduce the chances of being trapped in the local optima with developed convergence. The x o i ( t ) position is calculated as follows:
x o i j ( t ) = min ( x i ( t ) ) + max ( x i ( t ) x i j ( t ) )
where j = 1,2,…,d. d denotes the dimension.
The position of the ith food source is as follows:
x i ( t ) = { x o i ( t )           f ( x o i ( t ) )   f ( x i ( t ) ) x i ( t )             f ( x o i ( t ) ) > f ( x i ( t ) )
where f ( x o i ( t ) ) is the value of function fitness for x o i ( t ) .
(b)
Adaptive decision strategy
The adaptive decision helps to further improve exploration through the OBL when needed. Finally, the position updates using the adaptive decision strategy of AOAHA, which is shown as follows:
x i ( t + 1 ) = { x A i ( t )           f ( x A i ( t ) )   f ( x i ( t ) ) x i ( t )             f ( x A i ( t ) ) > f ( x i ( t ) )

4. Results

4.1. The Performance of the AOAHA

The proficiency and performance of the proposed AOAHA technique were evaluated based on several benchmark functions, using he statistical measurements such as best values, mean values, median values, worst values, and standard deviation (STD) for the best solutions acquired by the AOAHA and the other state-of-the-art optimization algorithms. The results achieved with the proposed AOAHA were compared with three recent algorithms—supply–demand-based optimization (SDO) [29], wild horse optimizer (WHO) [30], and tunicate swarm algorithm (TSA) [31]—and the original artificial hummingbird algorithm (AHA). Figure 5 shows the qualitative metrics on F1, F2, F3, F5, F6, F8, F10, F12, F15, F18, and F22, with 2D views of the functions, convergence curve, average fitness history, and search history.
Table 1, Table 2 and Table 3 show the statistical results of the AOAHA and other recent algorithms when applied for the unimodal benchmark functions, multimodal benchmark functions, and composite benchmark functions, respectively. The best values were achieved with the AOAHA, AHA, SDO, WHO, and TSA algorithms, as shown in bold. It can clearly be seen that the AOAHA technique attains the best solutions for most of these benchmark functions. The convergence curves of these algorithms for these functions are presented in Figure 6, while the boxplots for each algorithm for these functions are presented in Figure 7. From those figures, it is clear that the AOAHA algorithm reaches a stable point for all functions, and the boxplots of the AOAHA algorithm are very narrow and stable for most functions compared to the other algorithms.

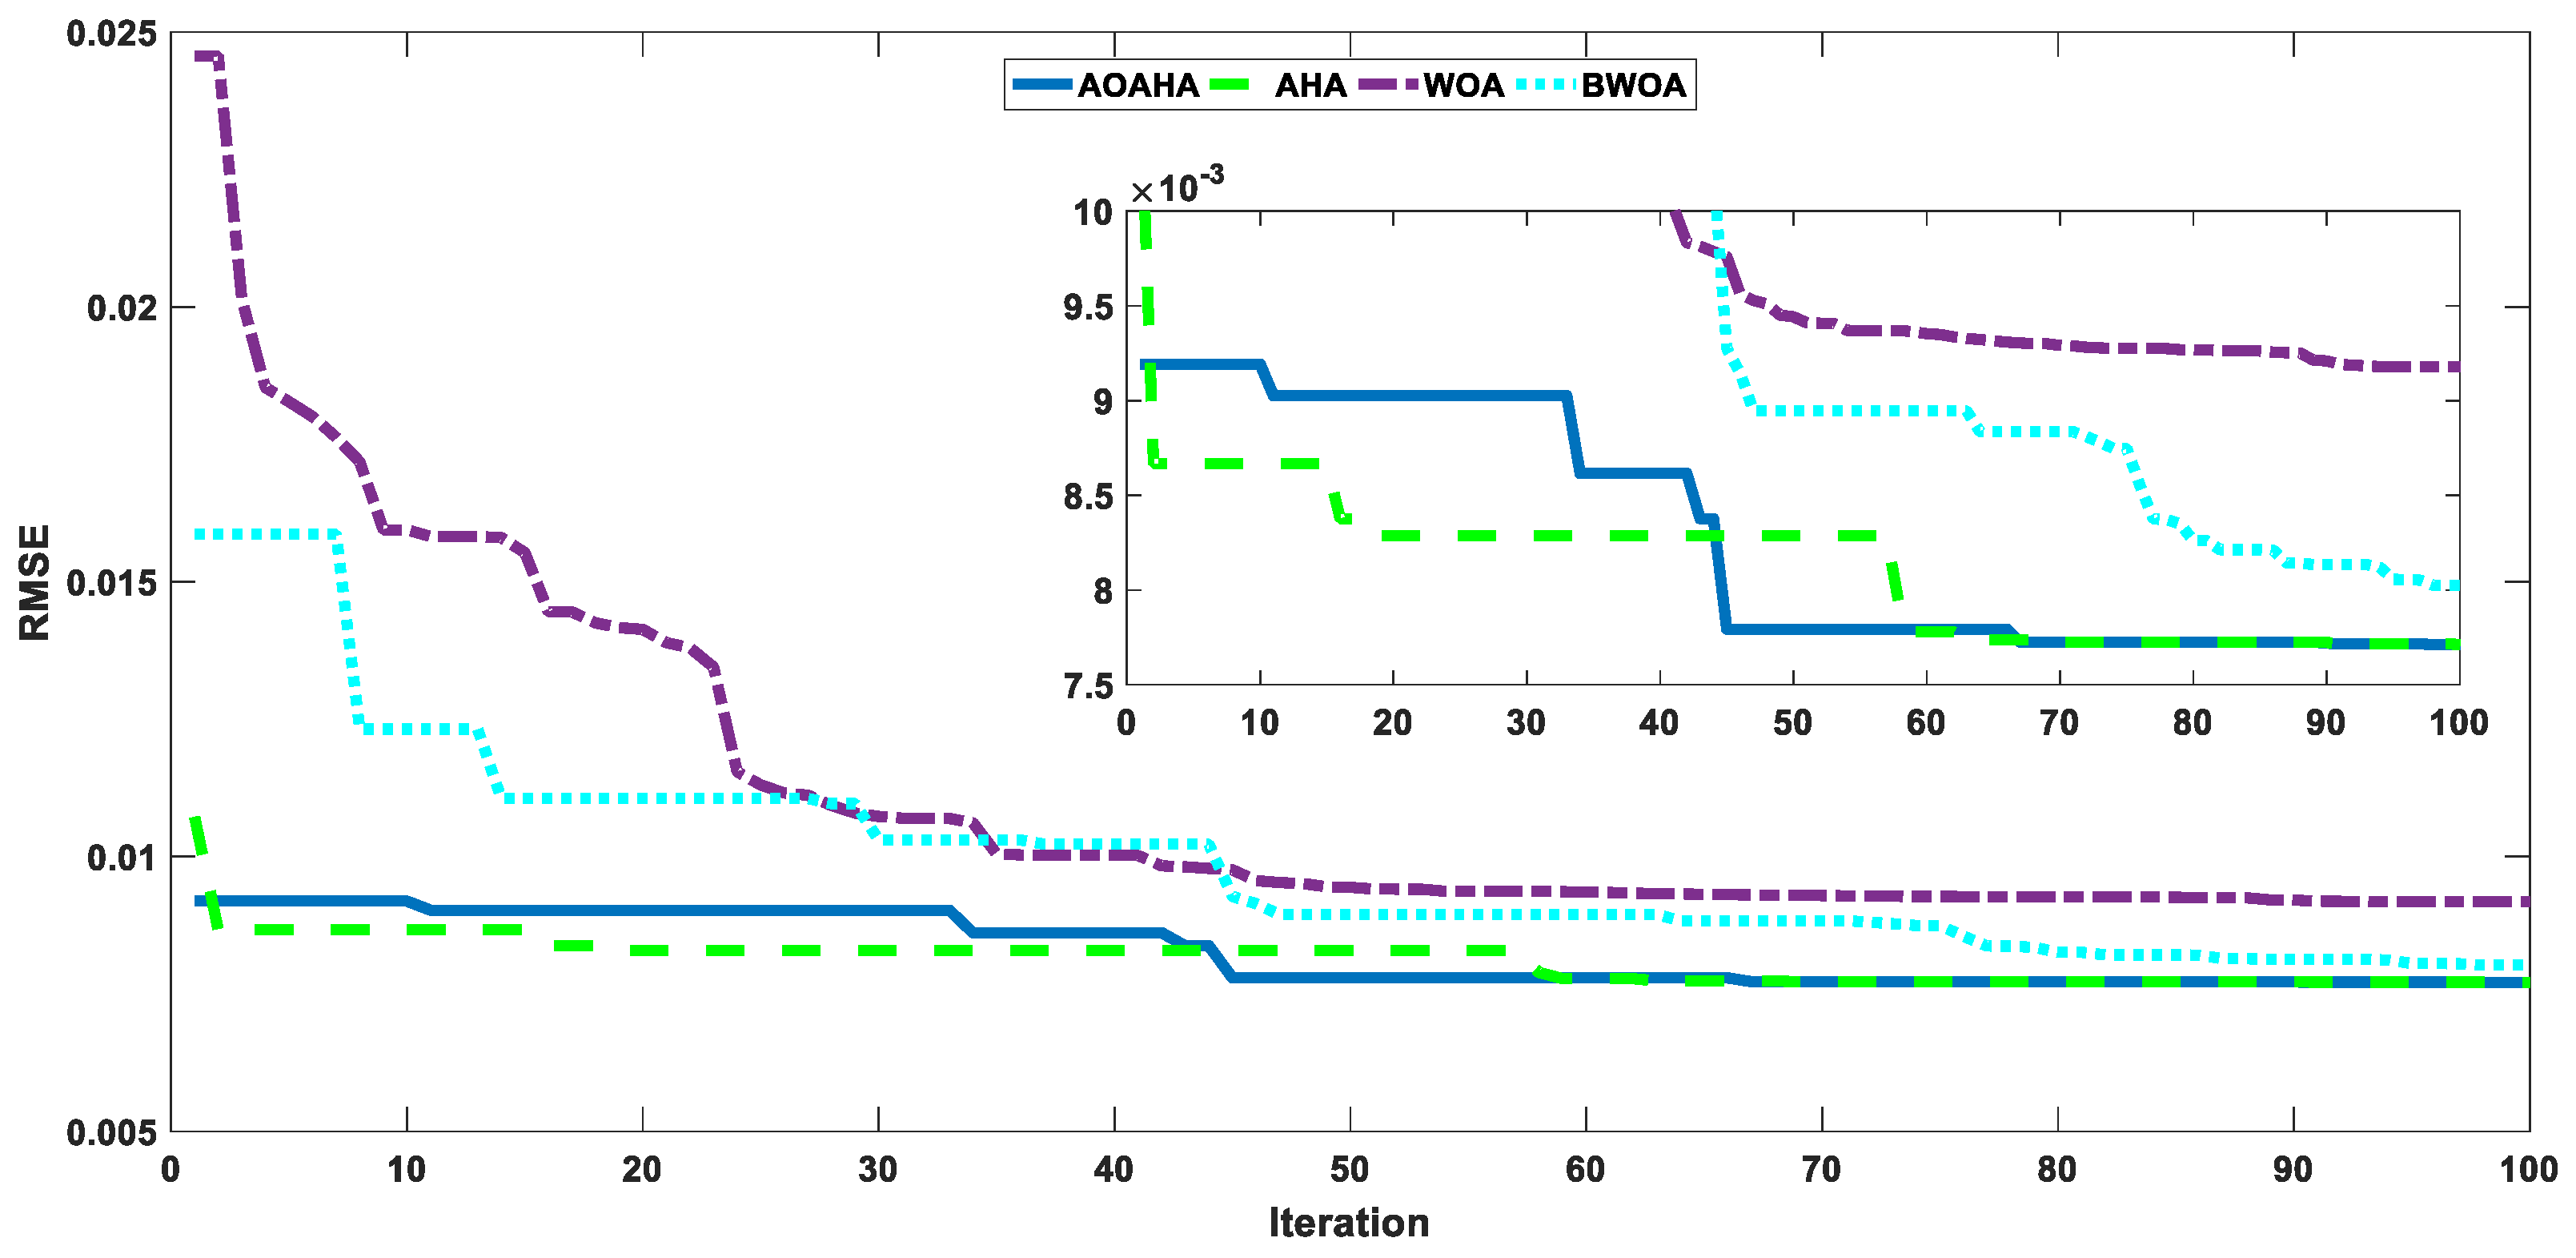
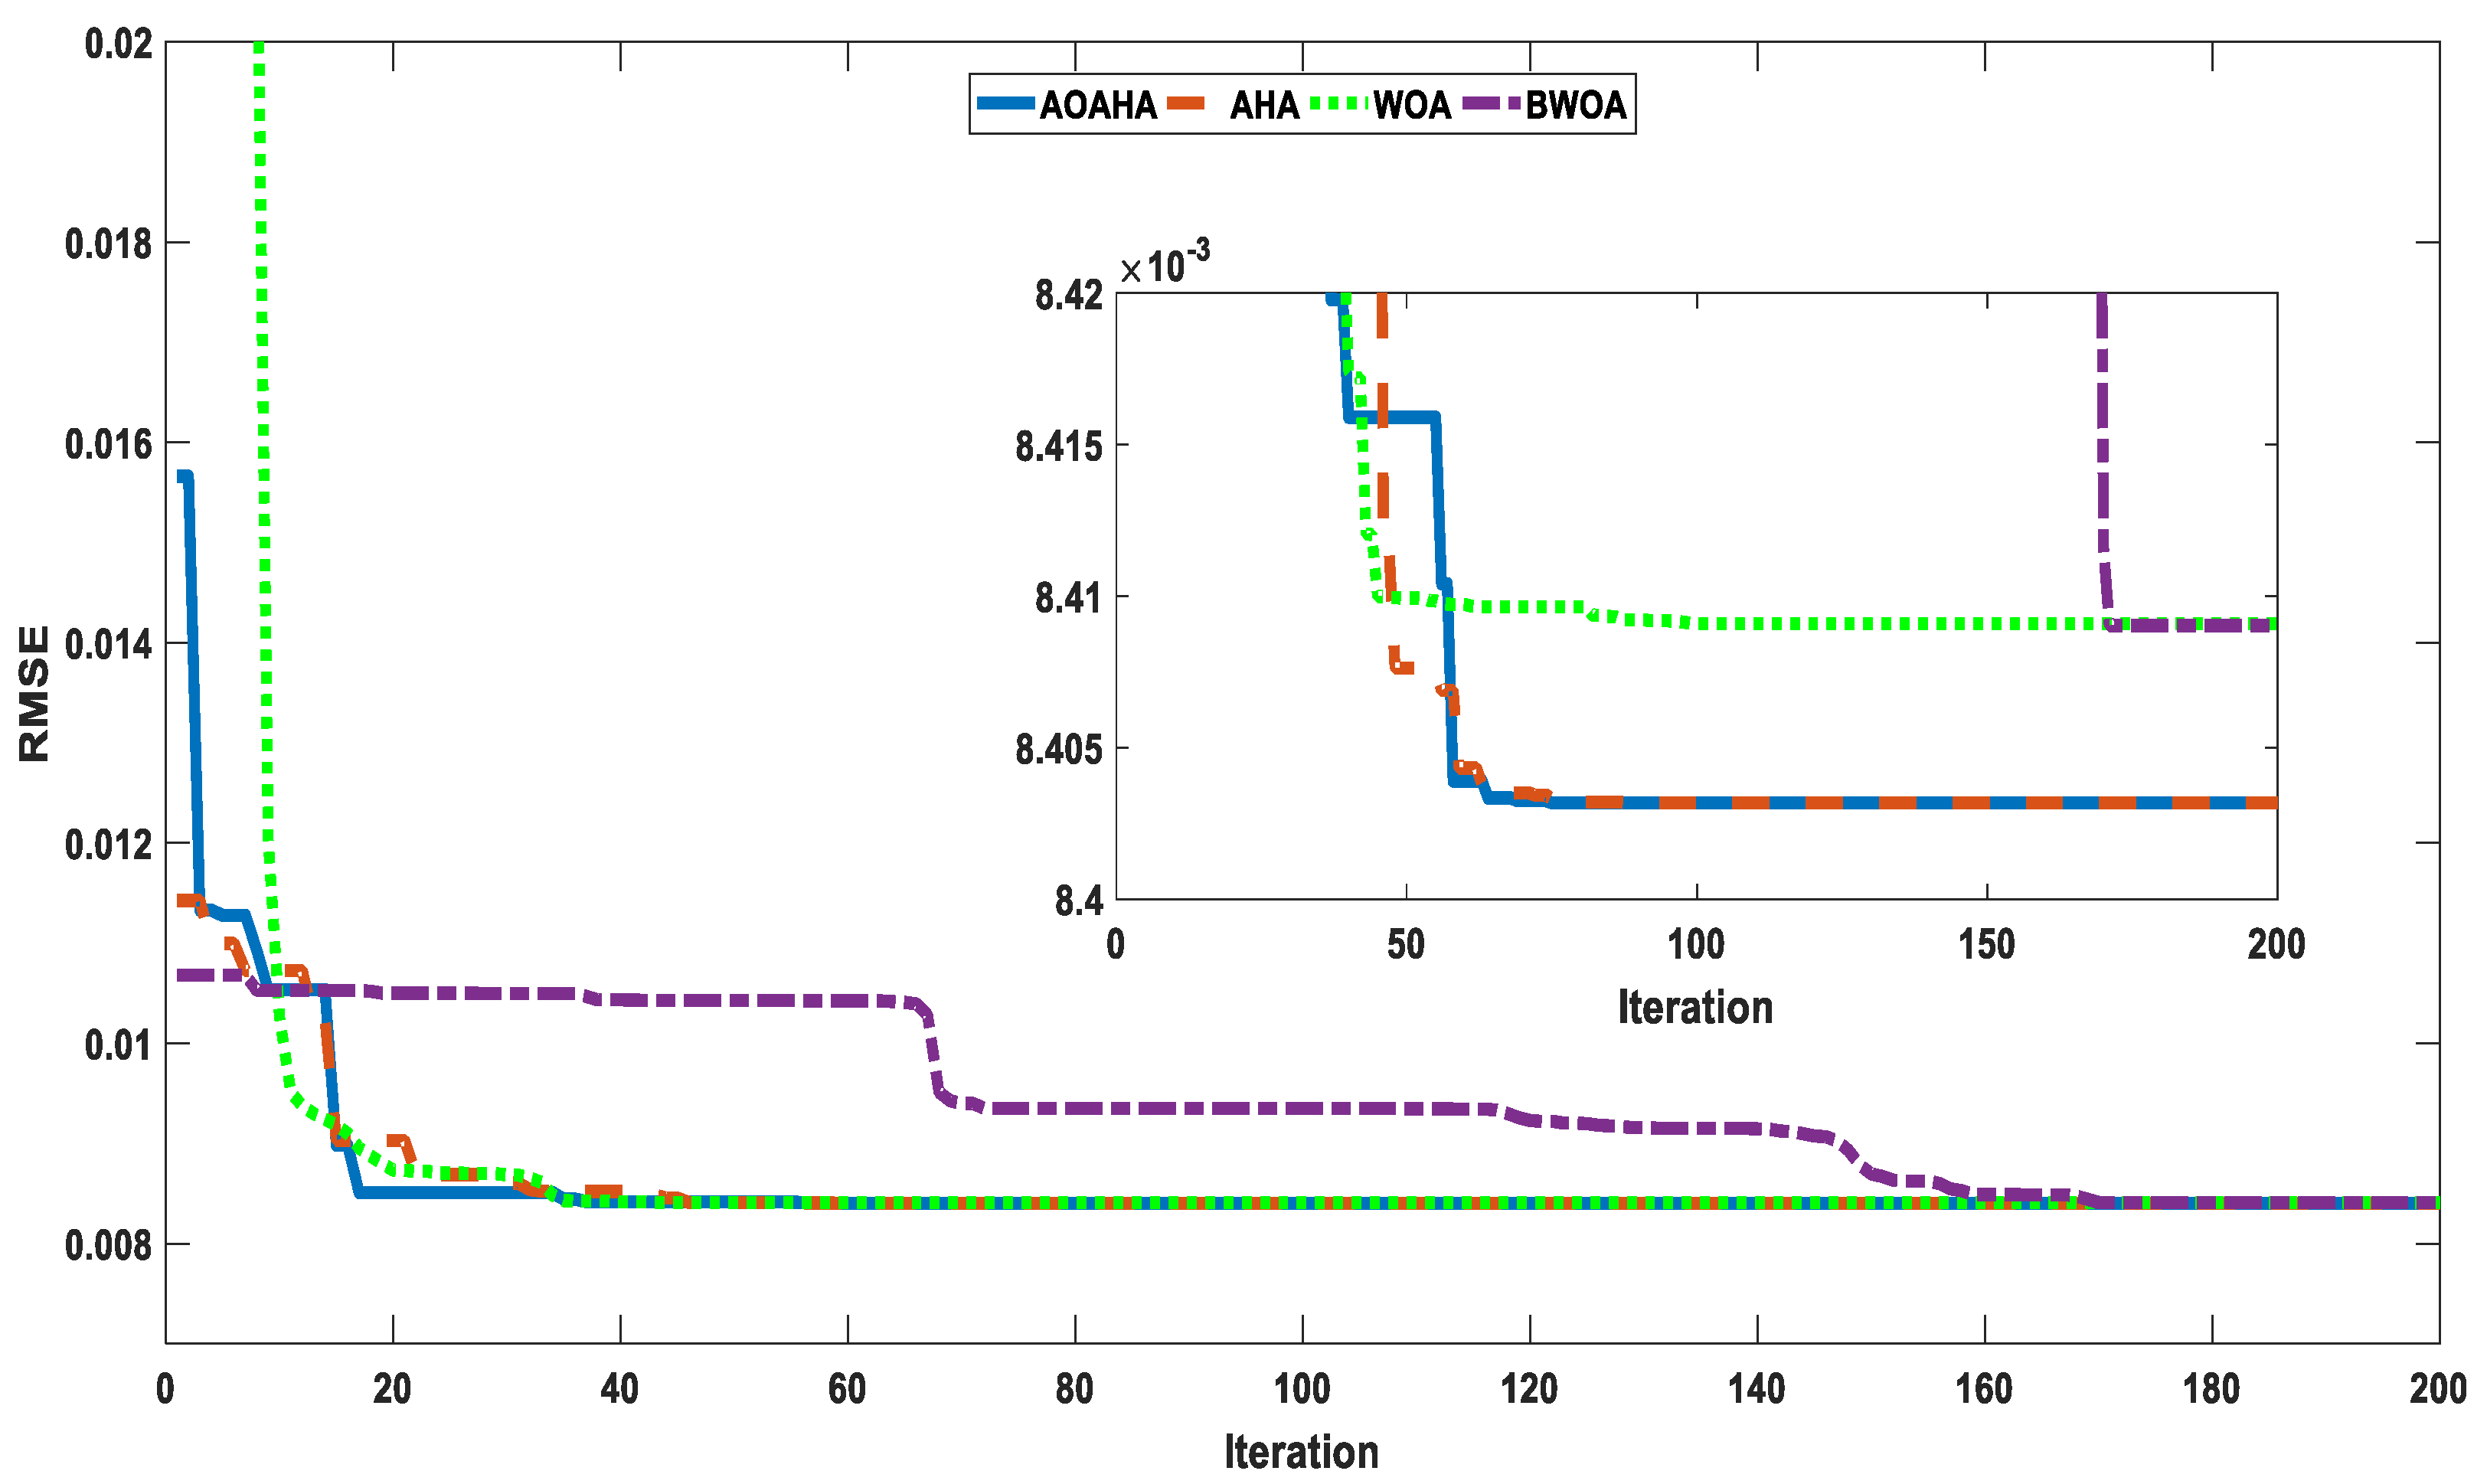
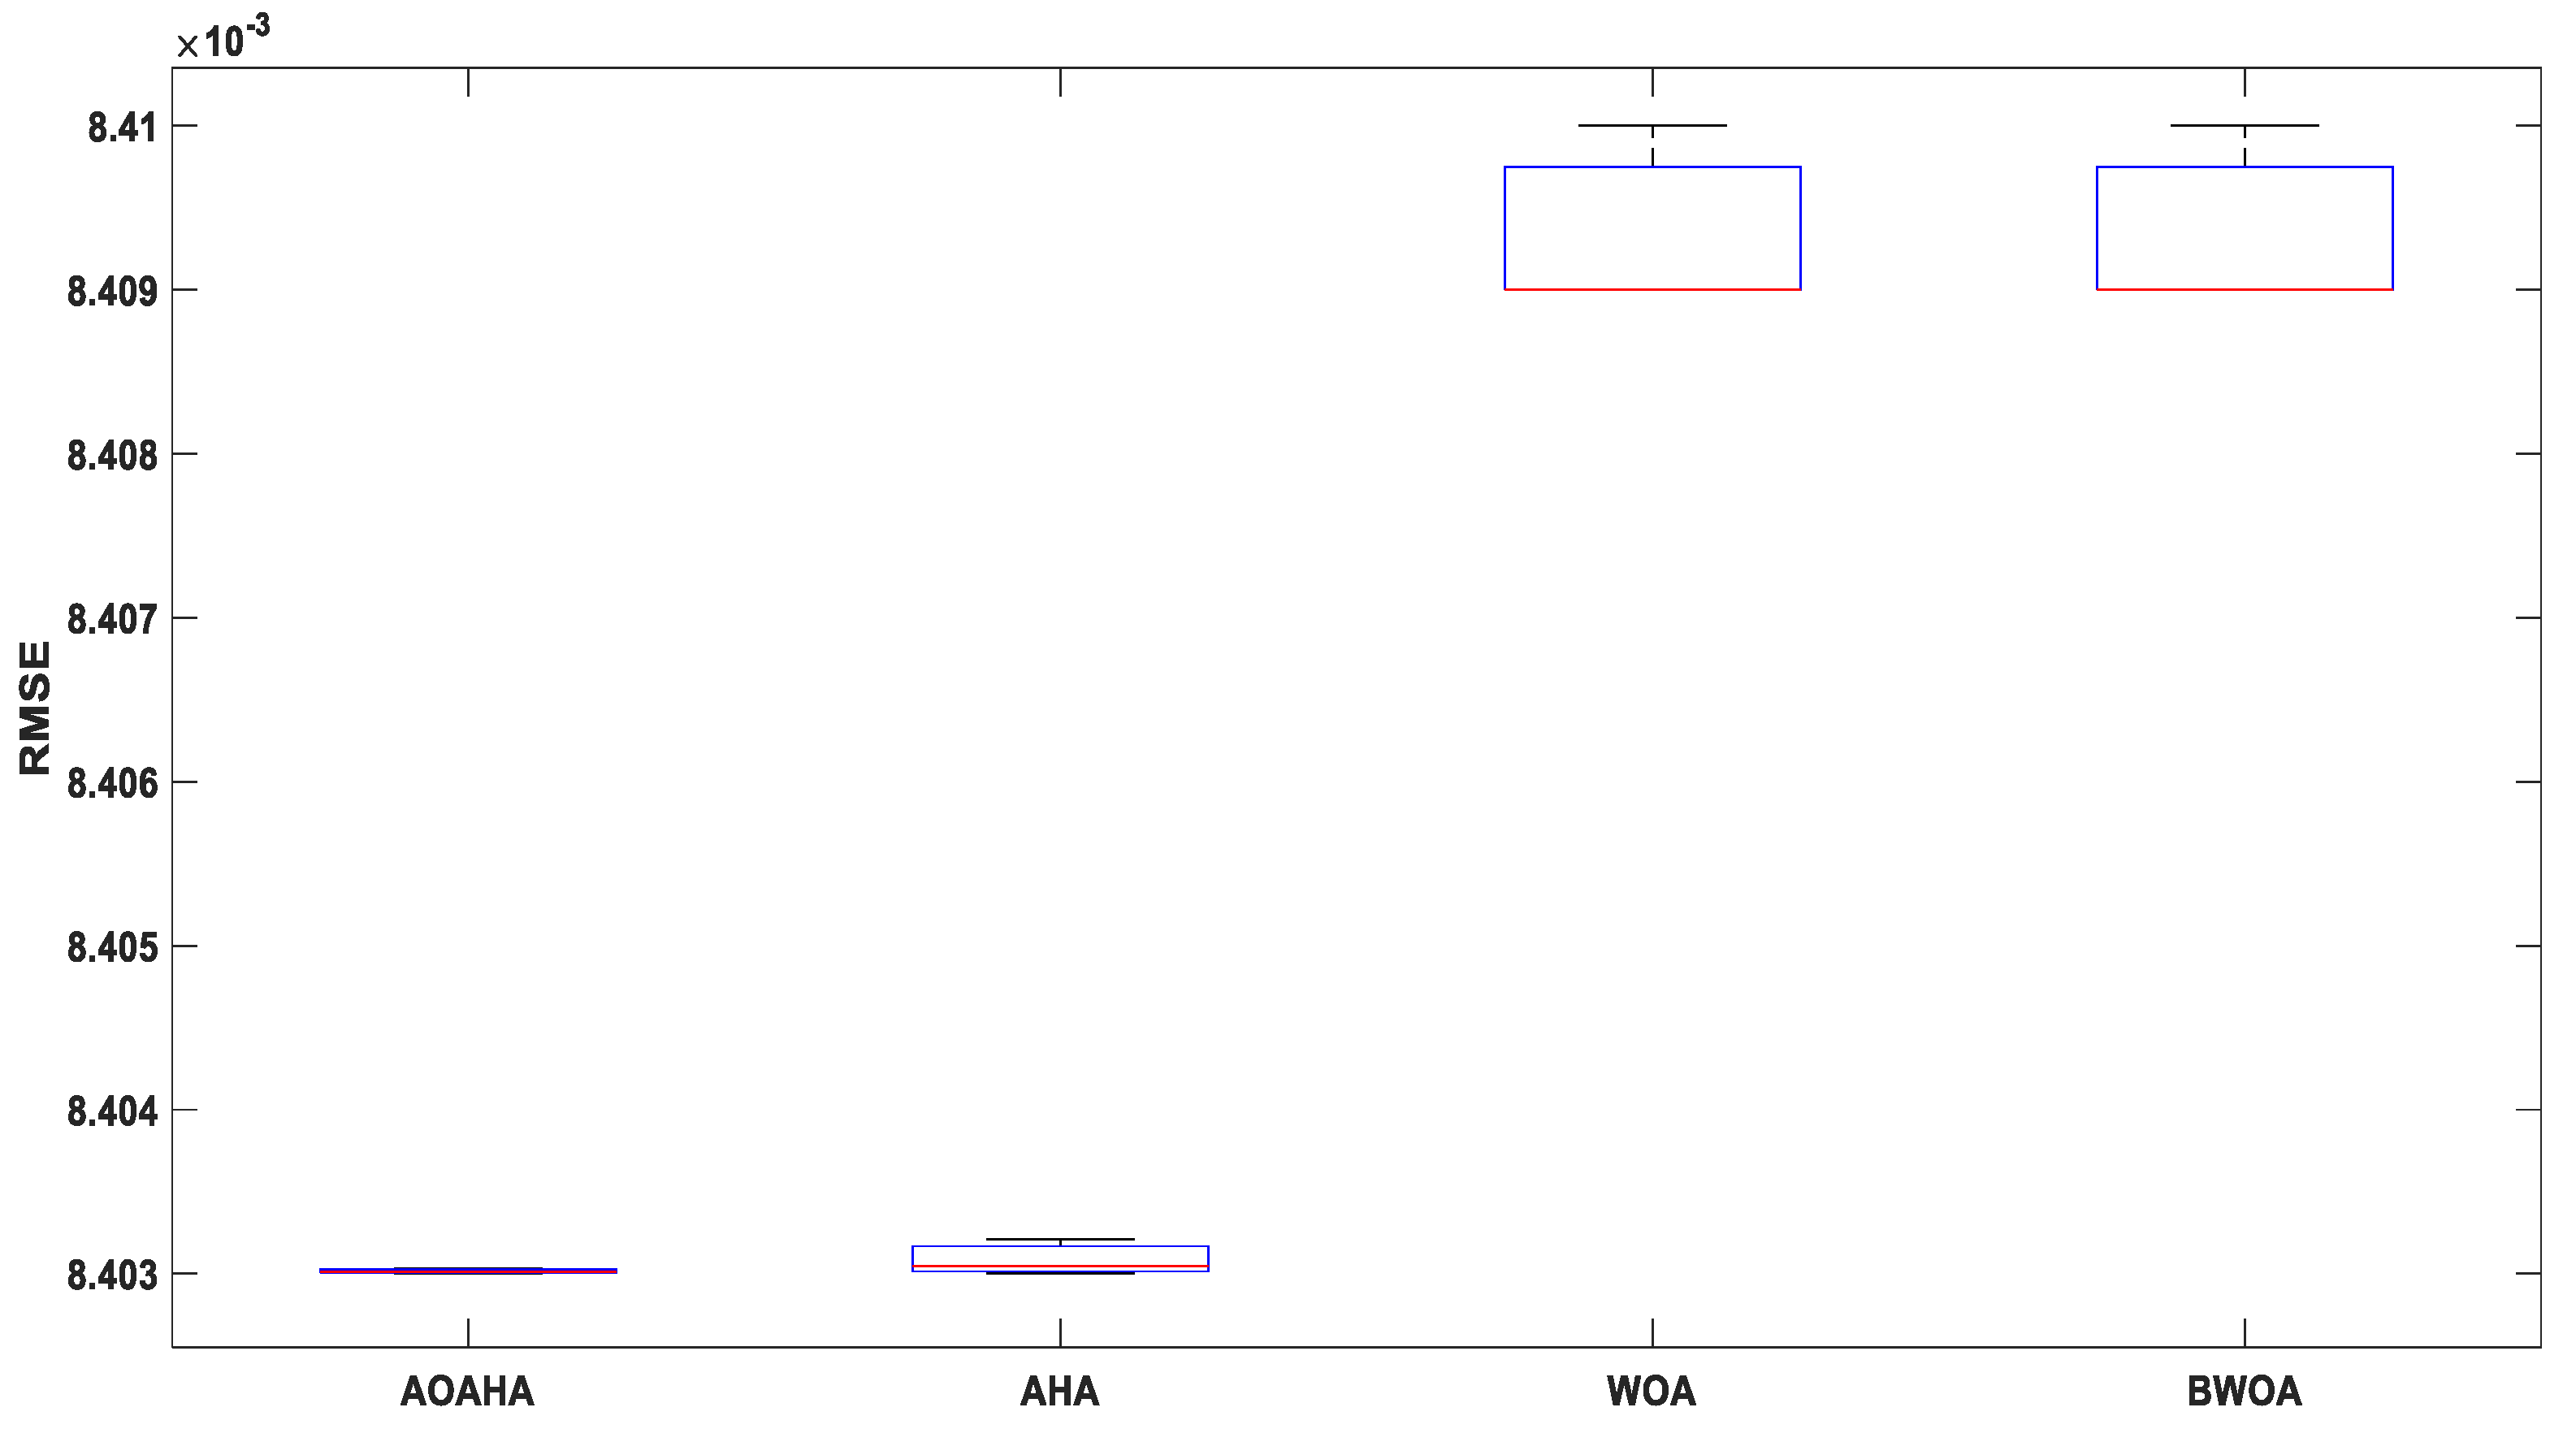
4.2. Real-World Application

In this subsection, the AOAHA is evaluated through the application of estimated PV parameters of the static TDM and dynamic IOM/FOM. The obtained results are evaluated and compared with the original algorithm and other recent optimization algorithms.

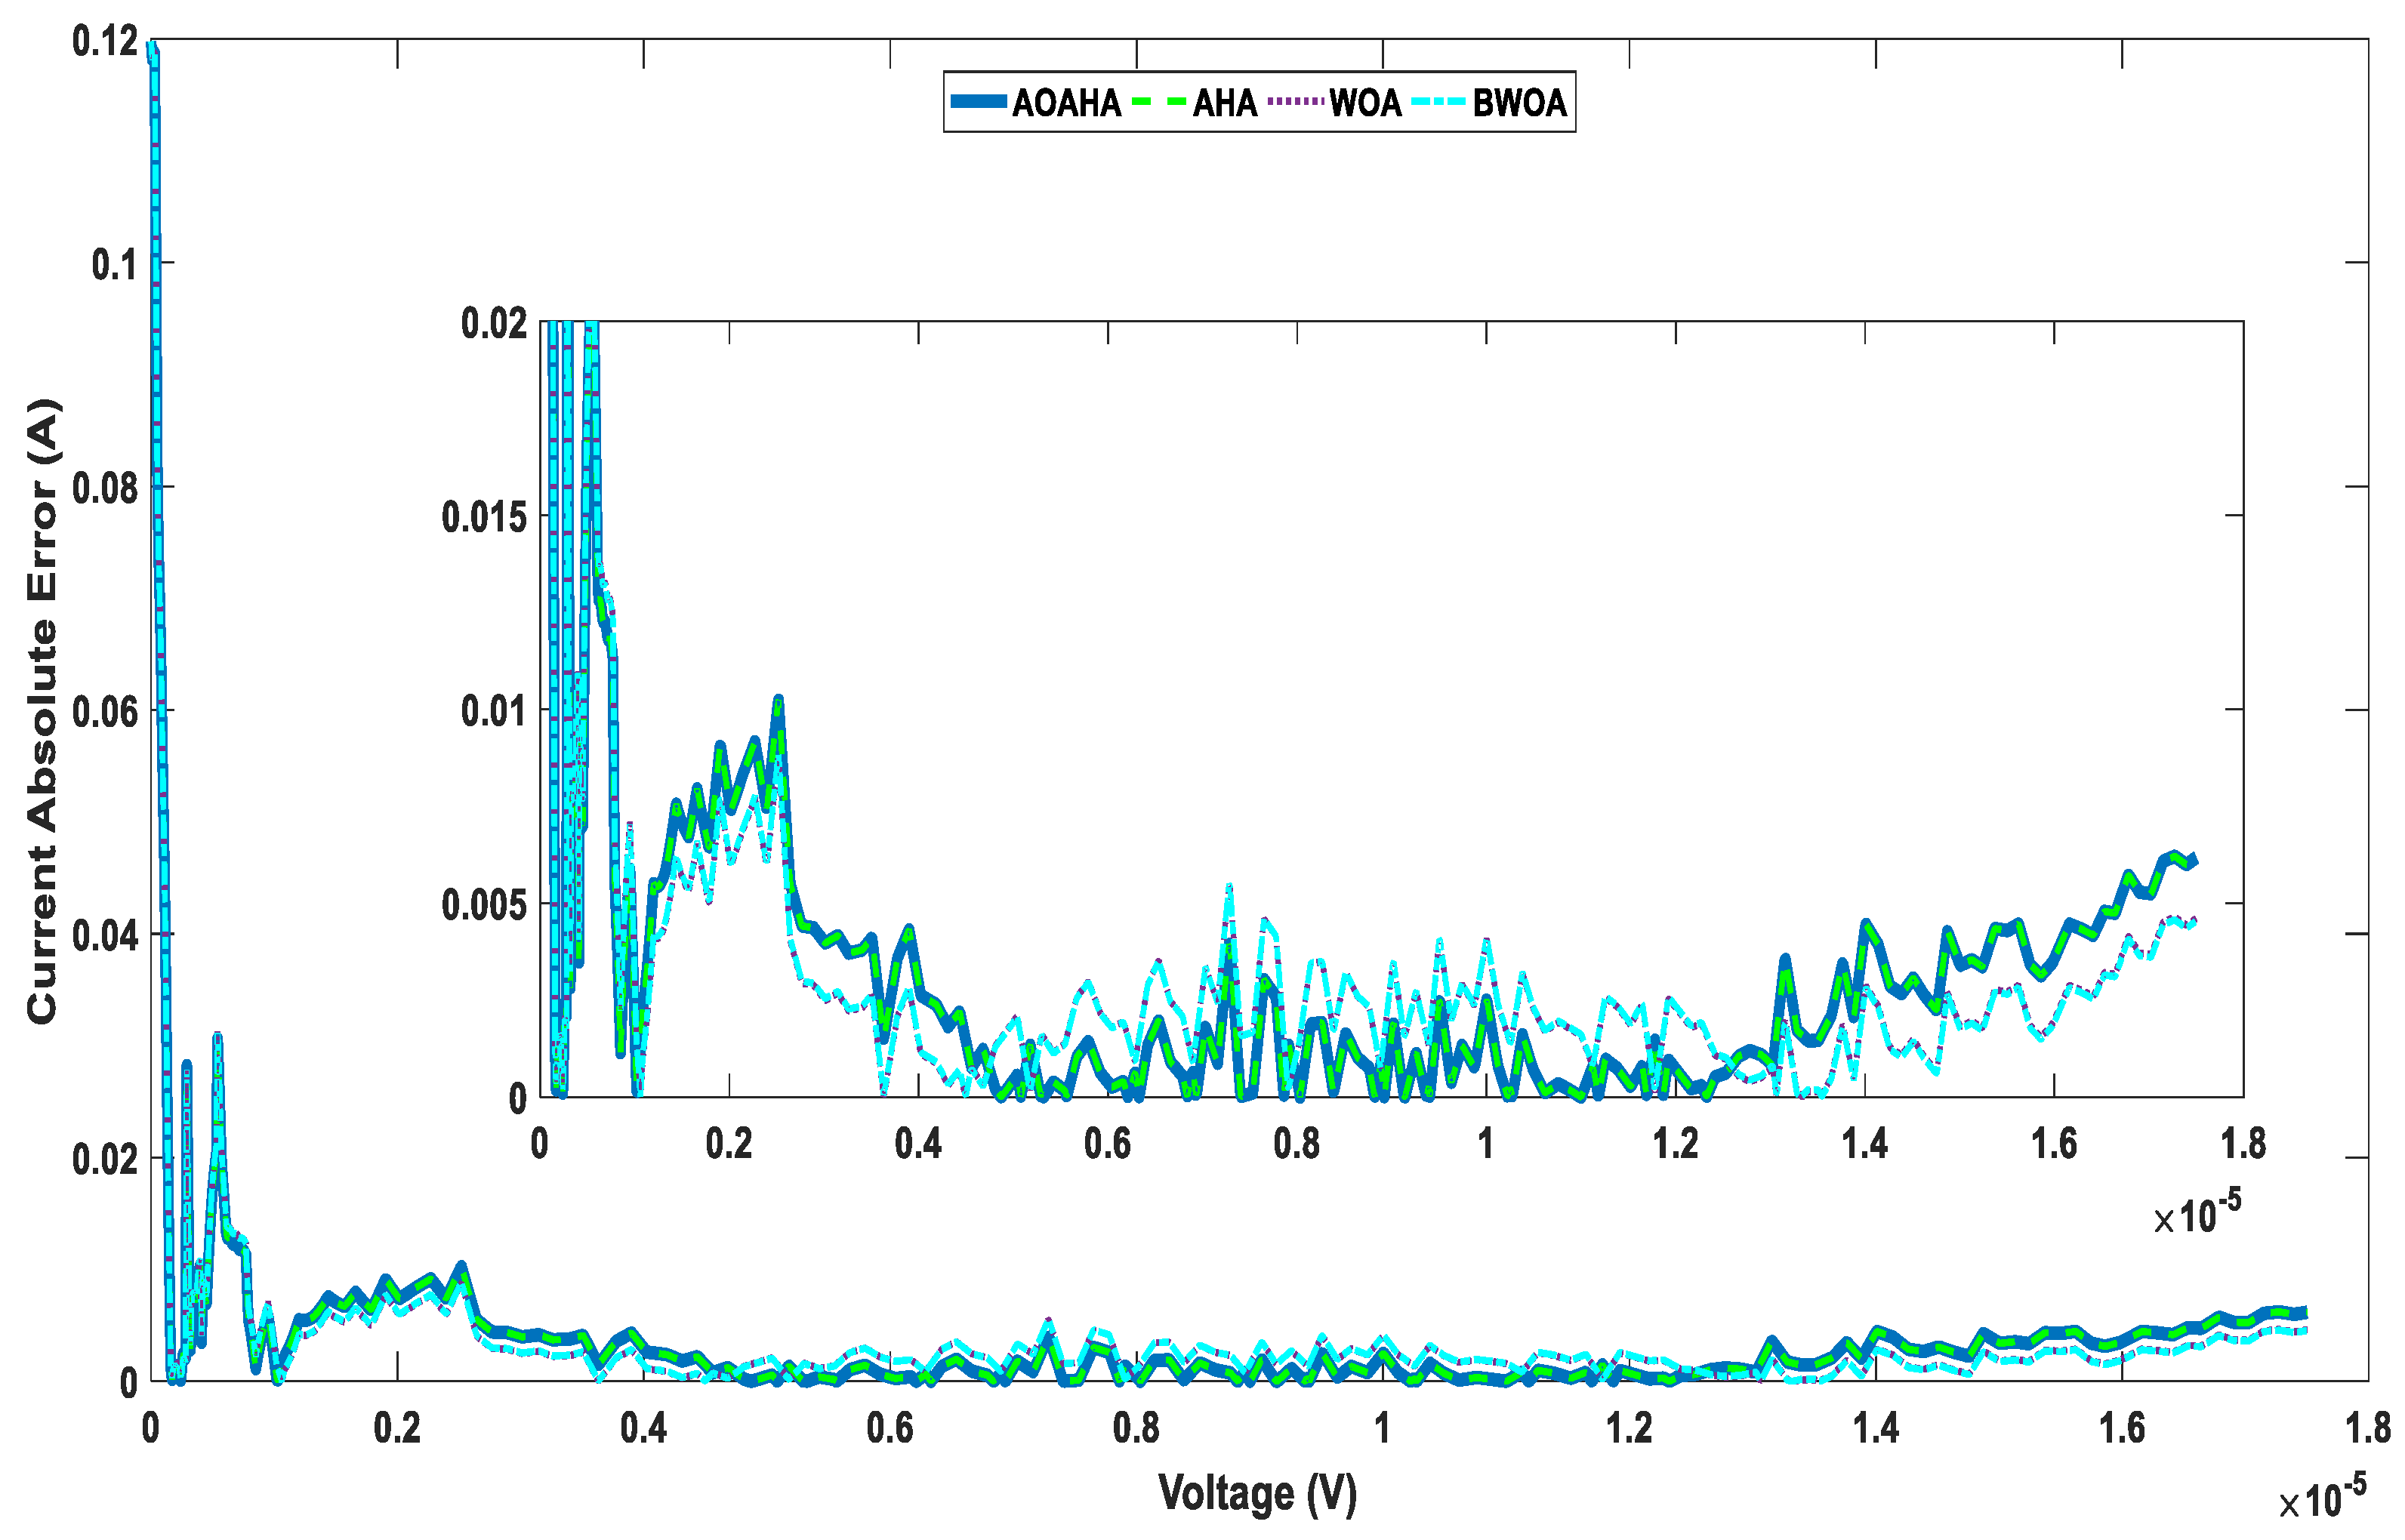
4.2.1. Application 1

In this application, the AOAHA was applied for parameter estimation of the static TDM, using the real data from 57 mm diameter commercial France R.T.C silicon solar cells. The data were captured under 1000 W/m2 irradiance, and at a temperature of 33 °C [10]. Table 4 presents the upper and lower ranges of the nine parameters for the TDM. Table 5 presents the obtained parameters through the proposed and the original algorithms (AOAHA and AHA, respectively) over two more recent algorithms: WOA and BWOA. Table 5 also presents the obtained root-mean-square error (RMSE) (Equation (15)) calculated for all algorithms. It is clear from Table 5 that the AOAHA has the best RMSE value. To present and compare the algorithms’ behavior through searching processes, the convergence curves for all compared algorithms are presented in Figure 8. The stability of the results for all compared algorithms was compared through the statistical analysis of the obtained RMSE values from 30 independent runs, and this analysis is presented in Table 6. The statistical analysis aimed to compare the minimum, maximum, average, and standard deviation values. A graphical presentation of the statistical analysis is presented through the boxplots in Figure 9. An inner-boxplot figure was added to clarify the comparison between the proposed and the original algorithms. The AOAHA achieved the best statistical results for minimum, maximum, average, and standard deviation in terms of stability and robustness. The best fit model to the real data is the model that achieved the least RMSE in comparison to other models, as made clear from the current–voltage characteristics and power–voltage characteristics (Figure 10 and Figure 11, respectively), along with the current absolute error (Equation (16)) and power absolute error (Equation (15)) (Figure 12 and Figure 13, respectively).
R M S E = 1 N K = 1 N f 2 ( V t m , I t m , X )
Current   Absolute   error = ( I I e s t i m a t e d ) 2 2
Power   Absolute   error = ( P P e s t i m a t e d ) 2 2
where f is the objective function in Equation (3), V t m and I t m measure the output voltage and current from the real system, respectively, N is the number of measured data, I and I e s t i m a t e d are the real and estimated output current, respectively, and P and P e s t i m a t e d are the real and estimated output power, respectively.

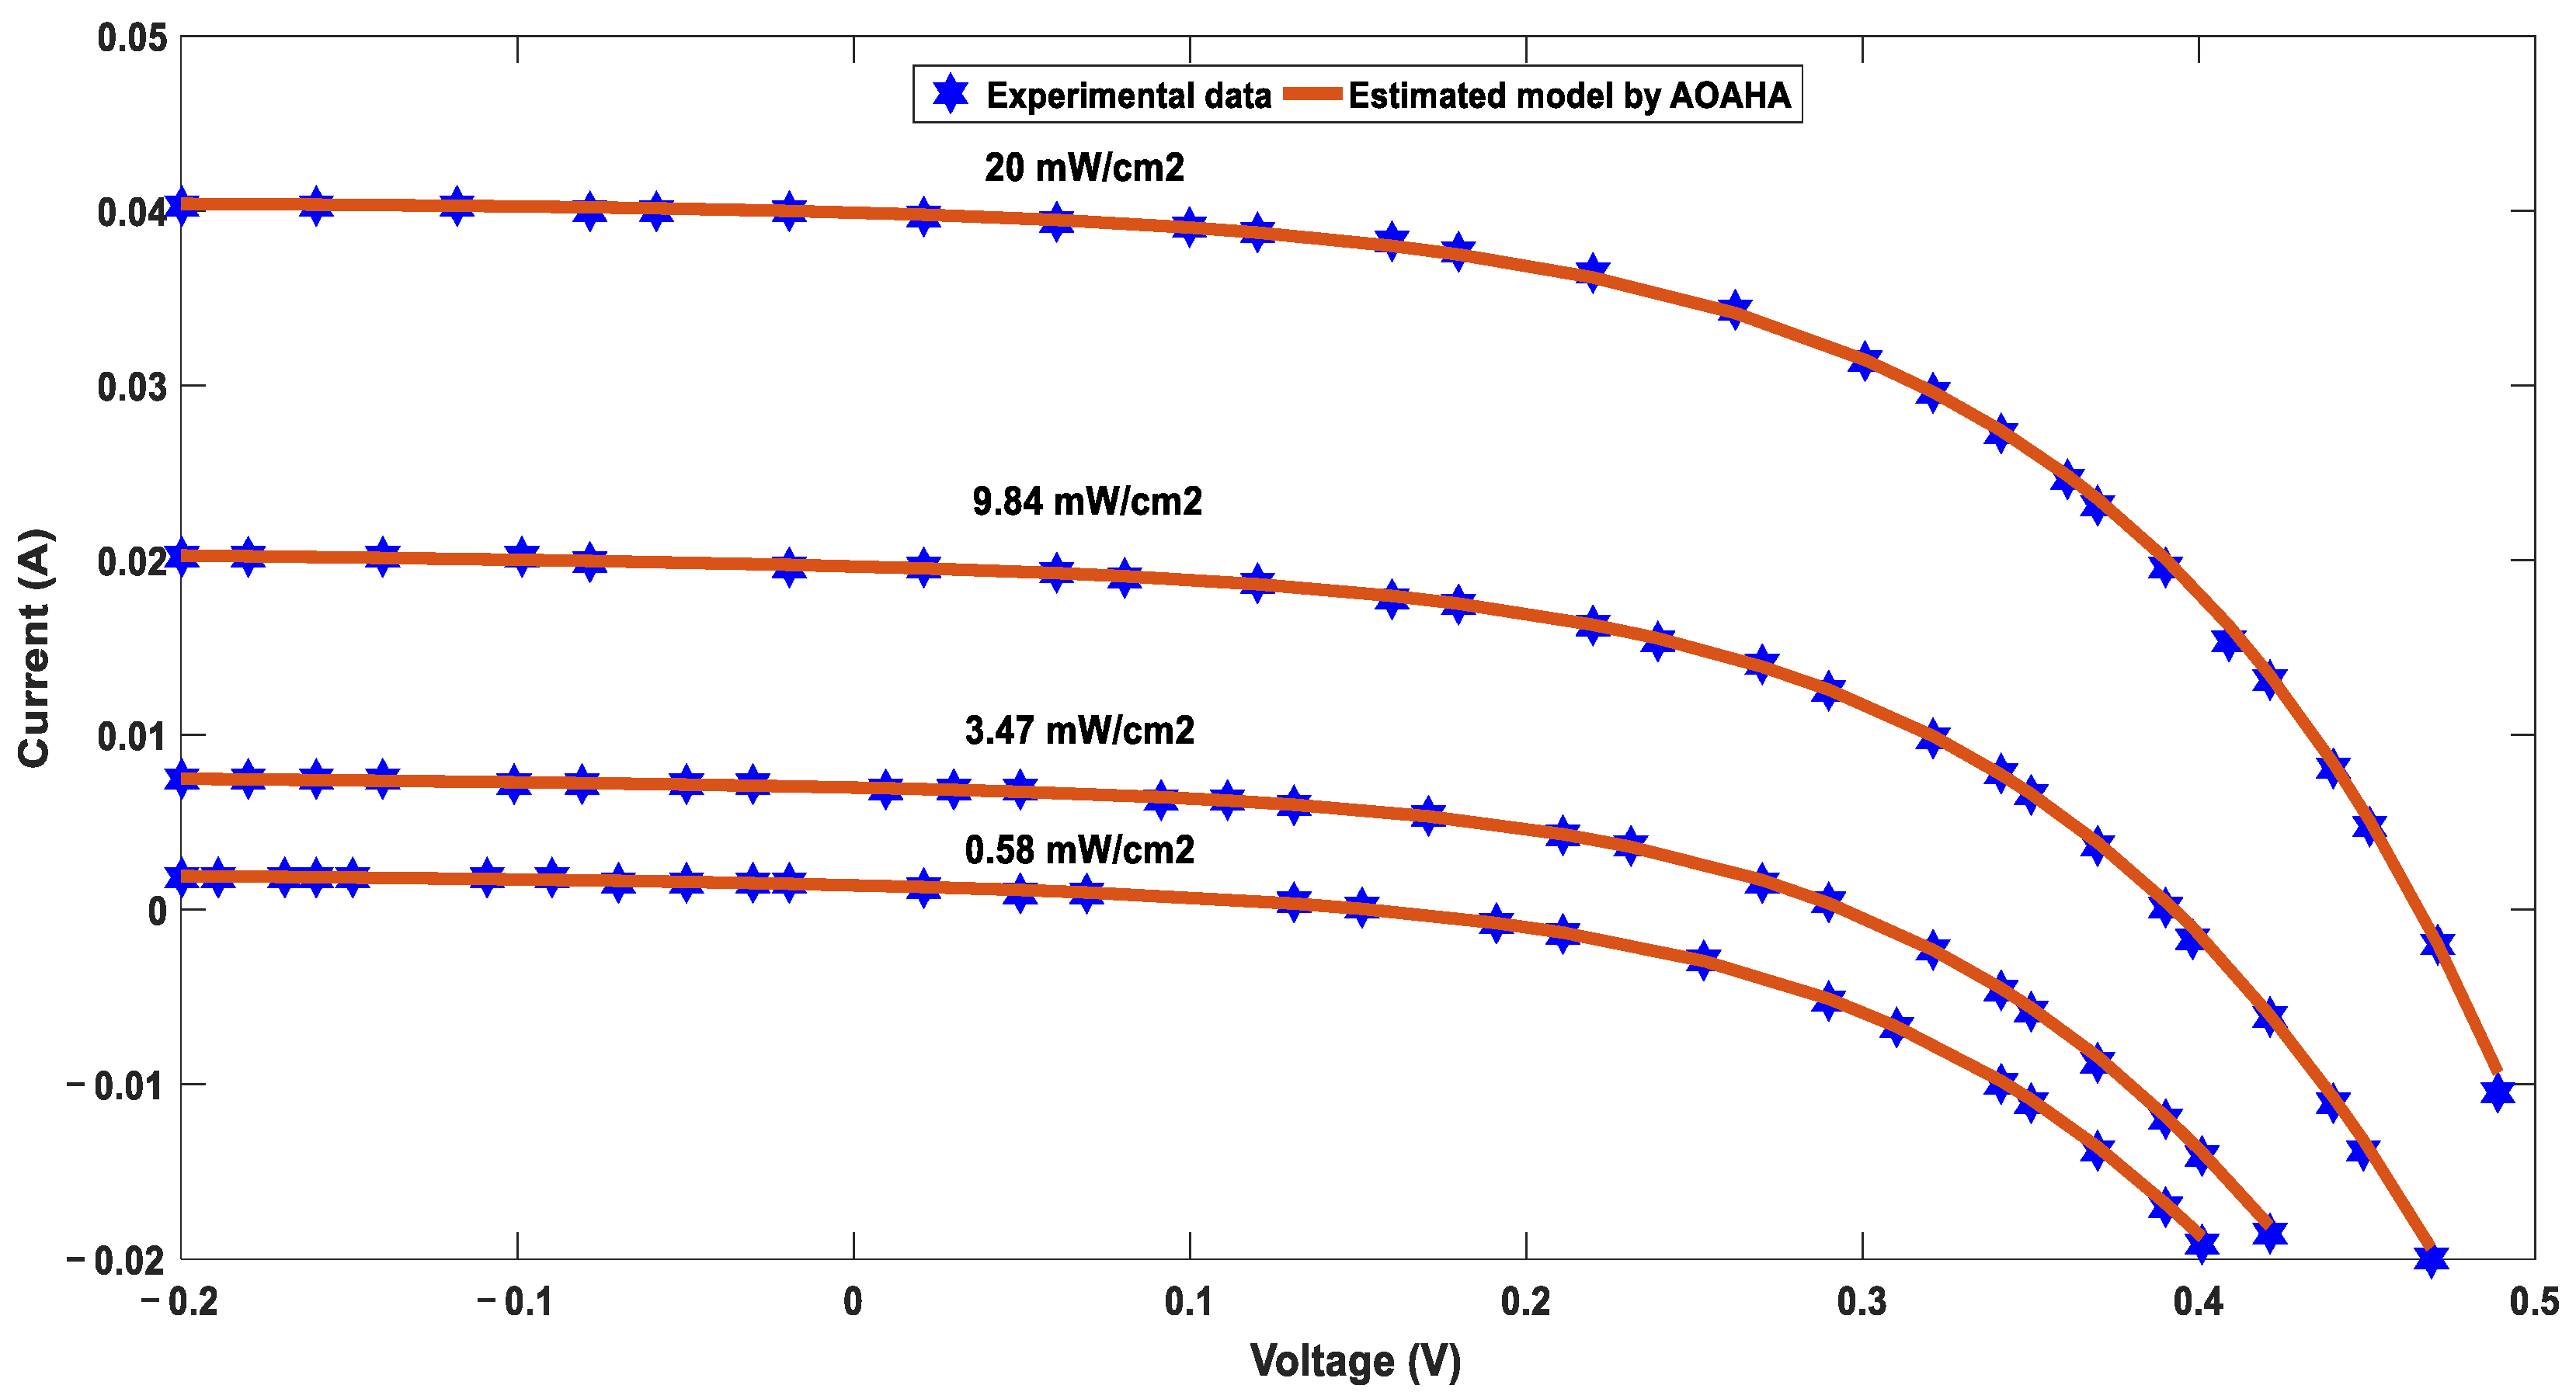
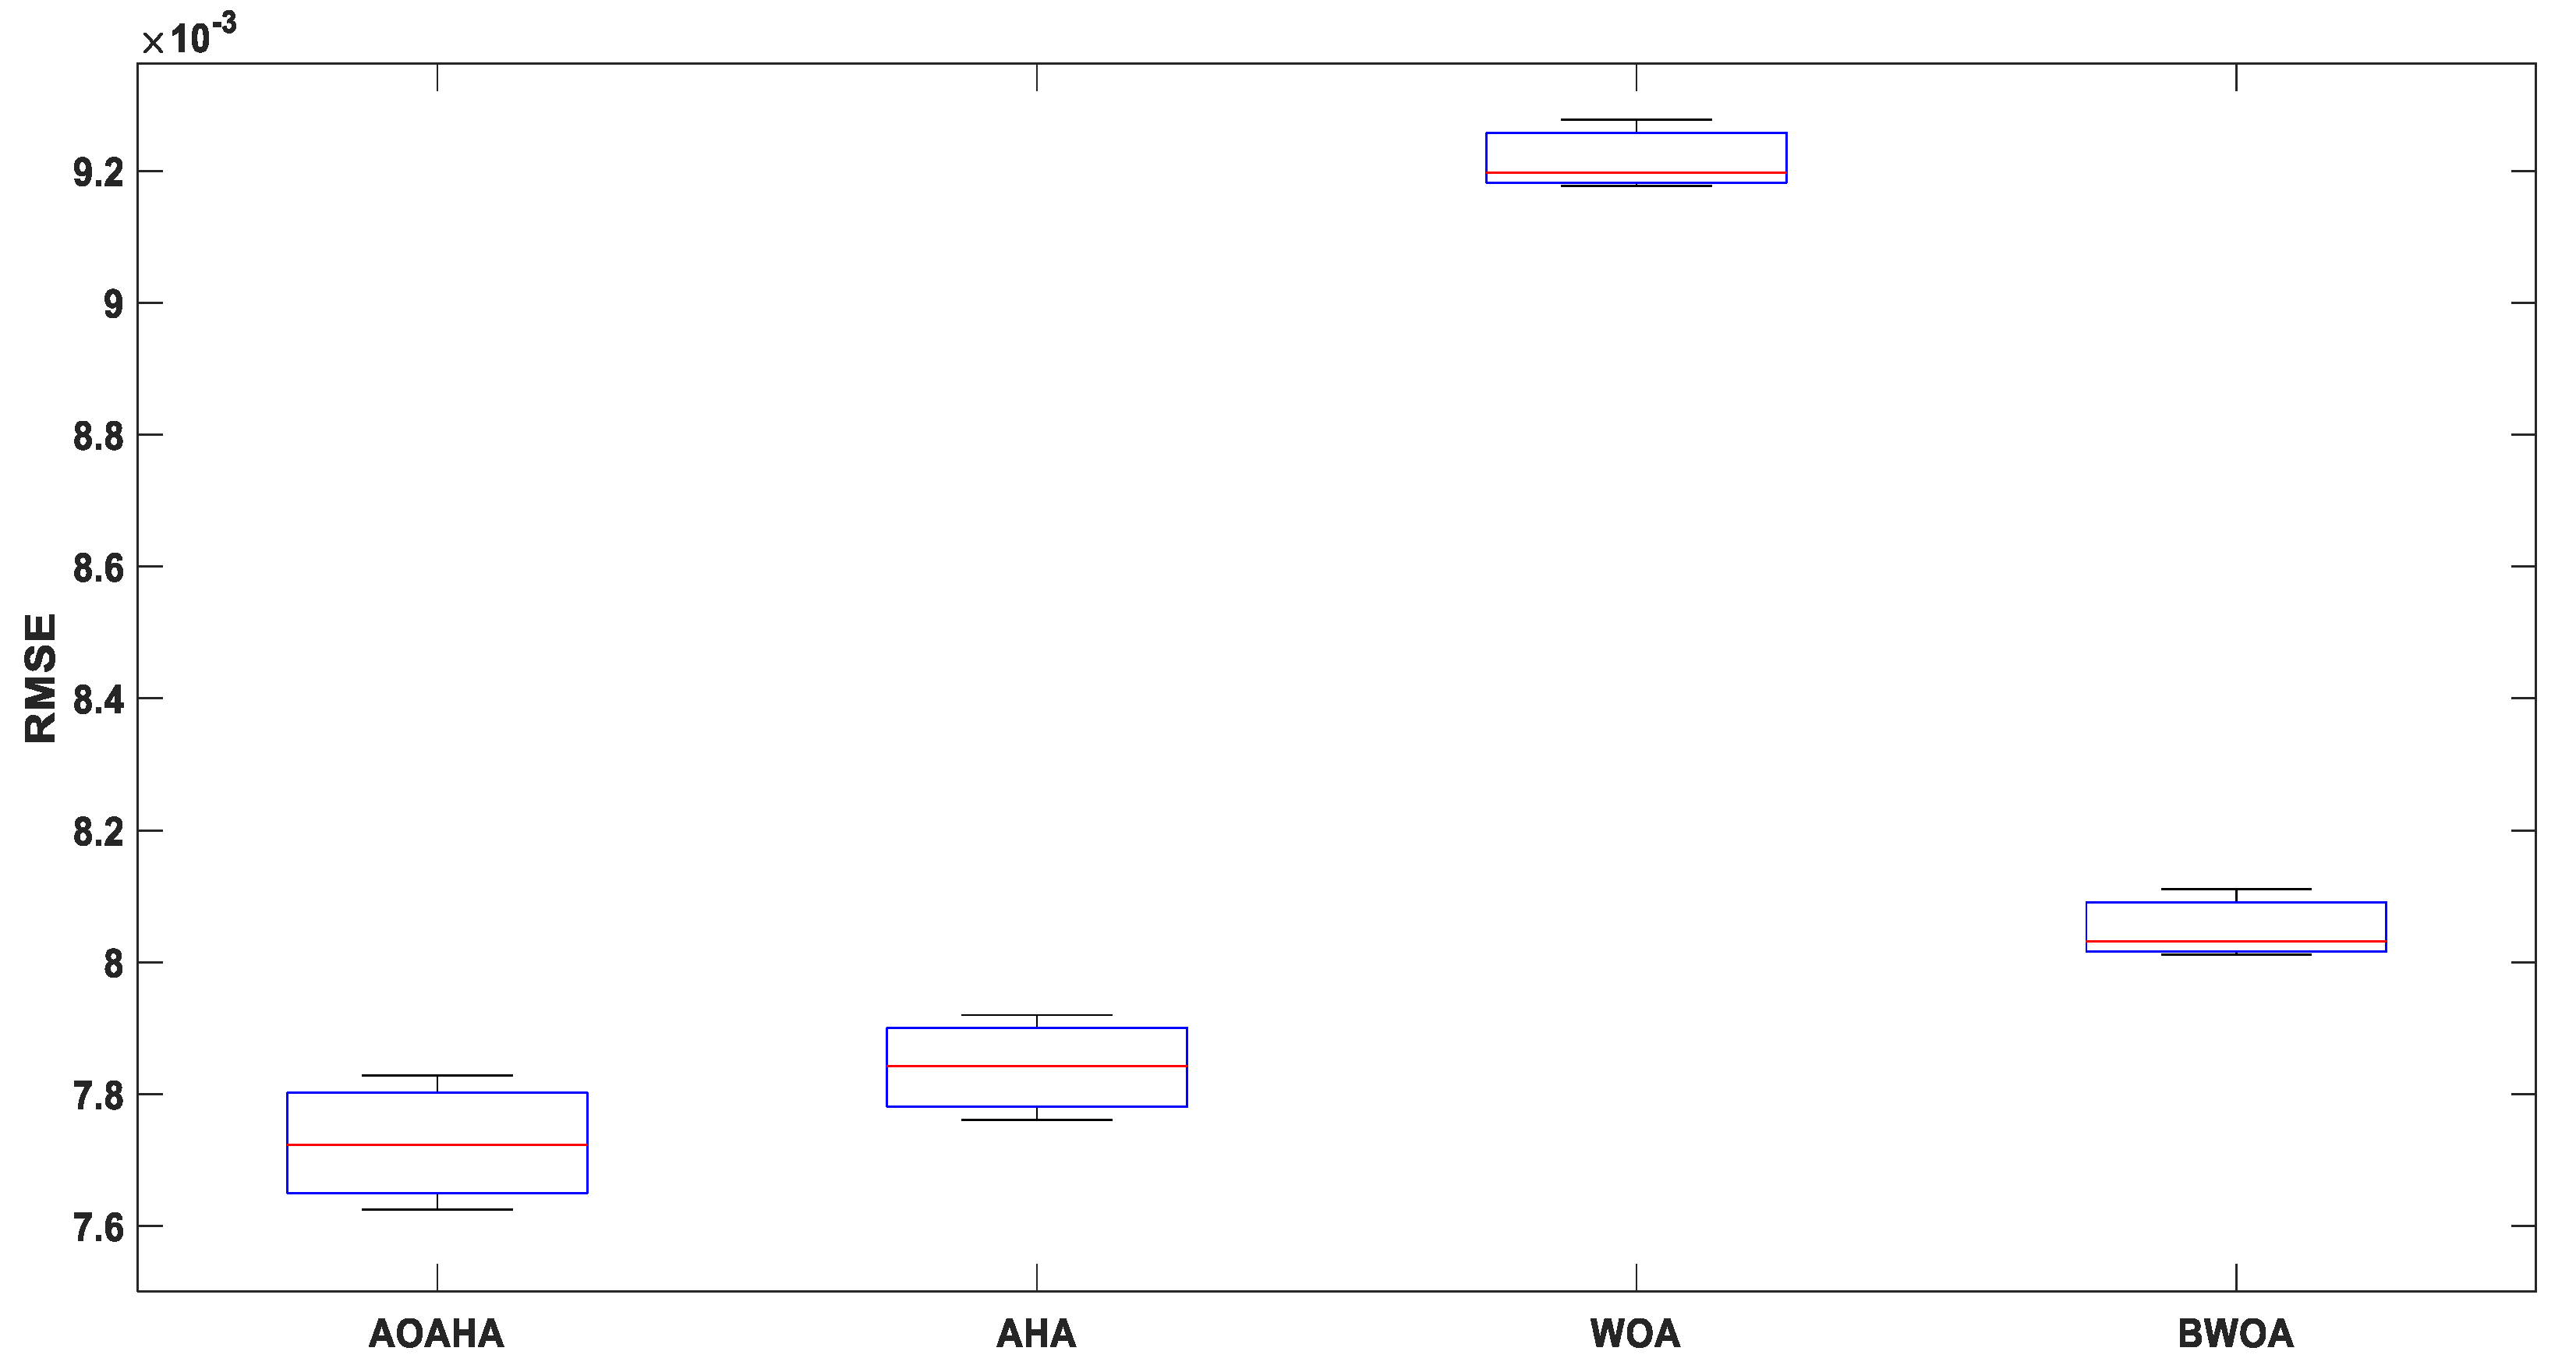
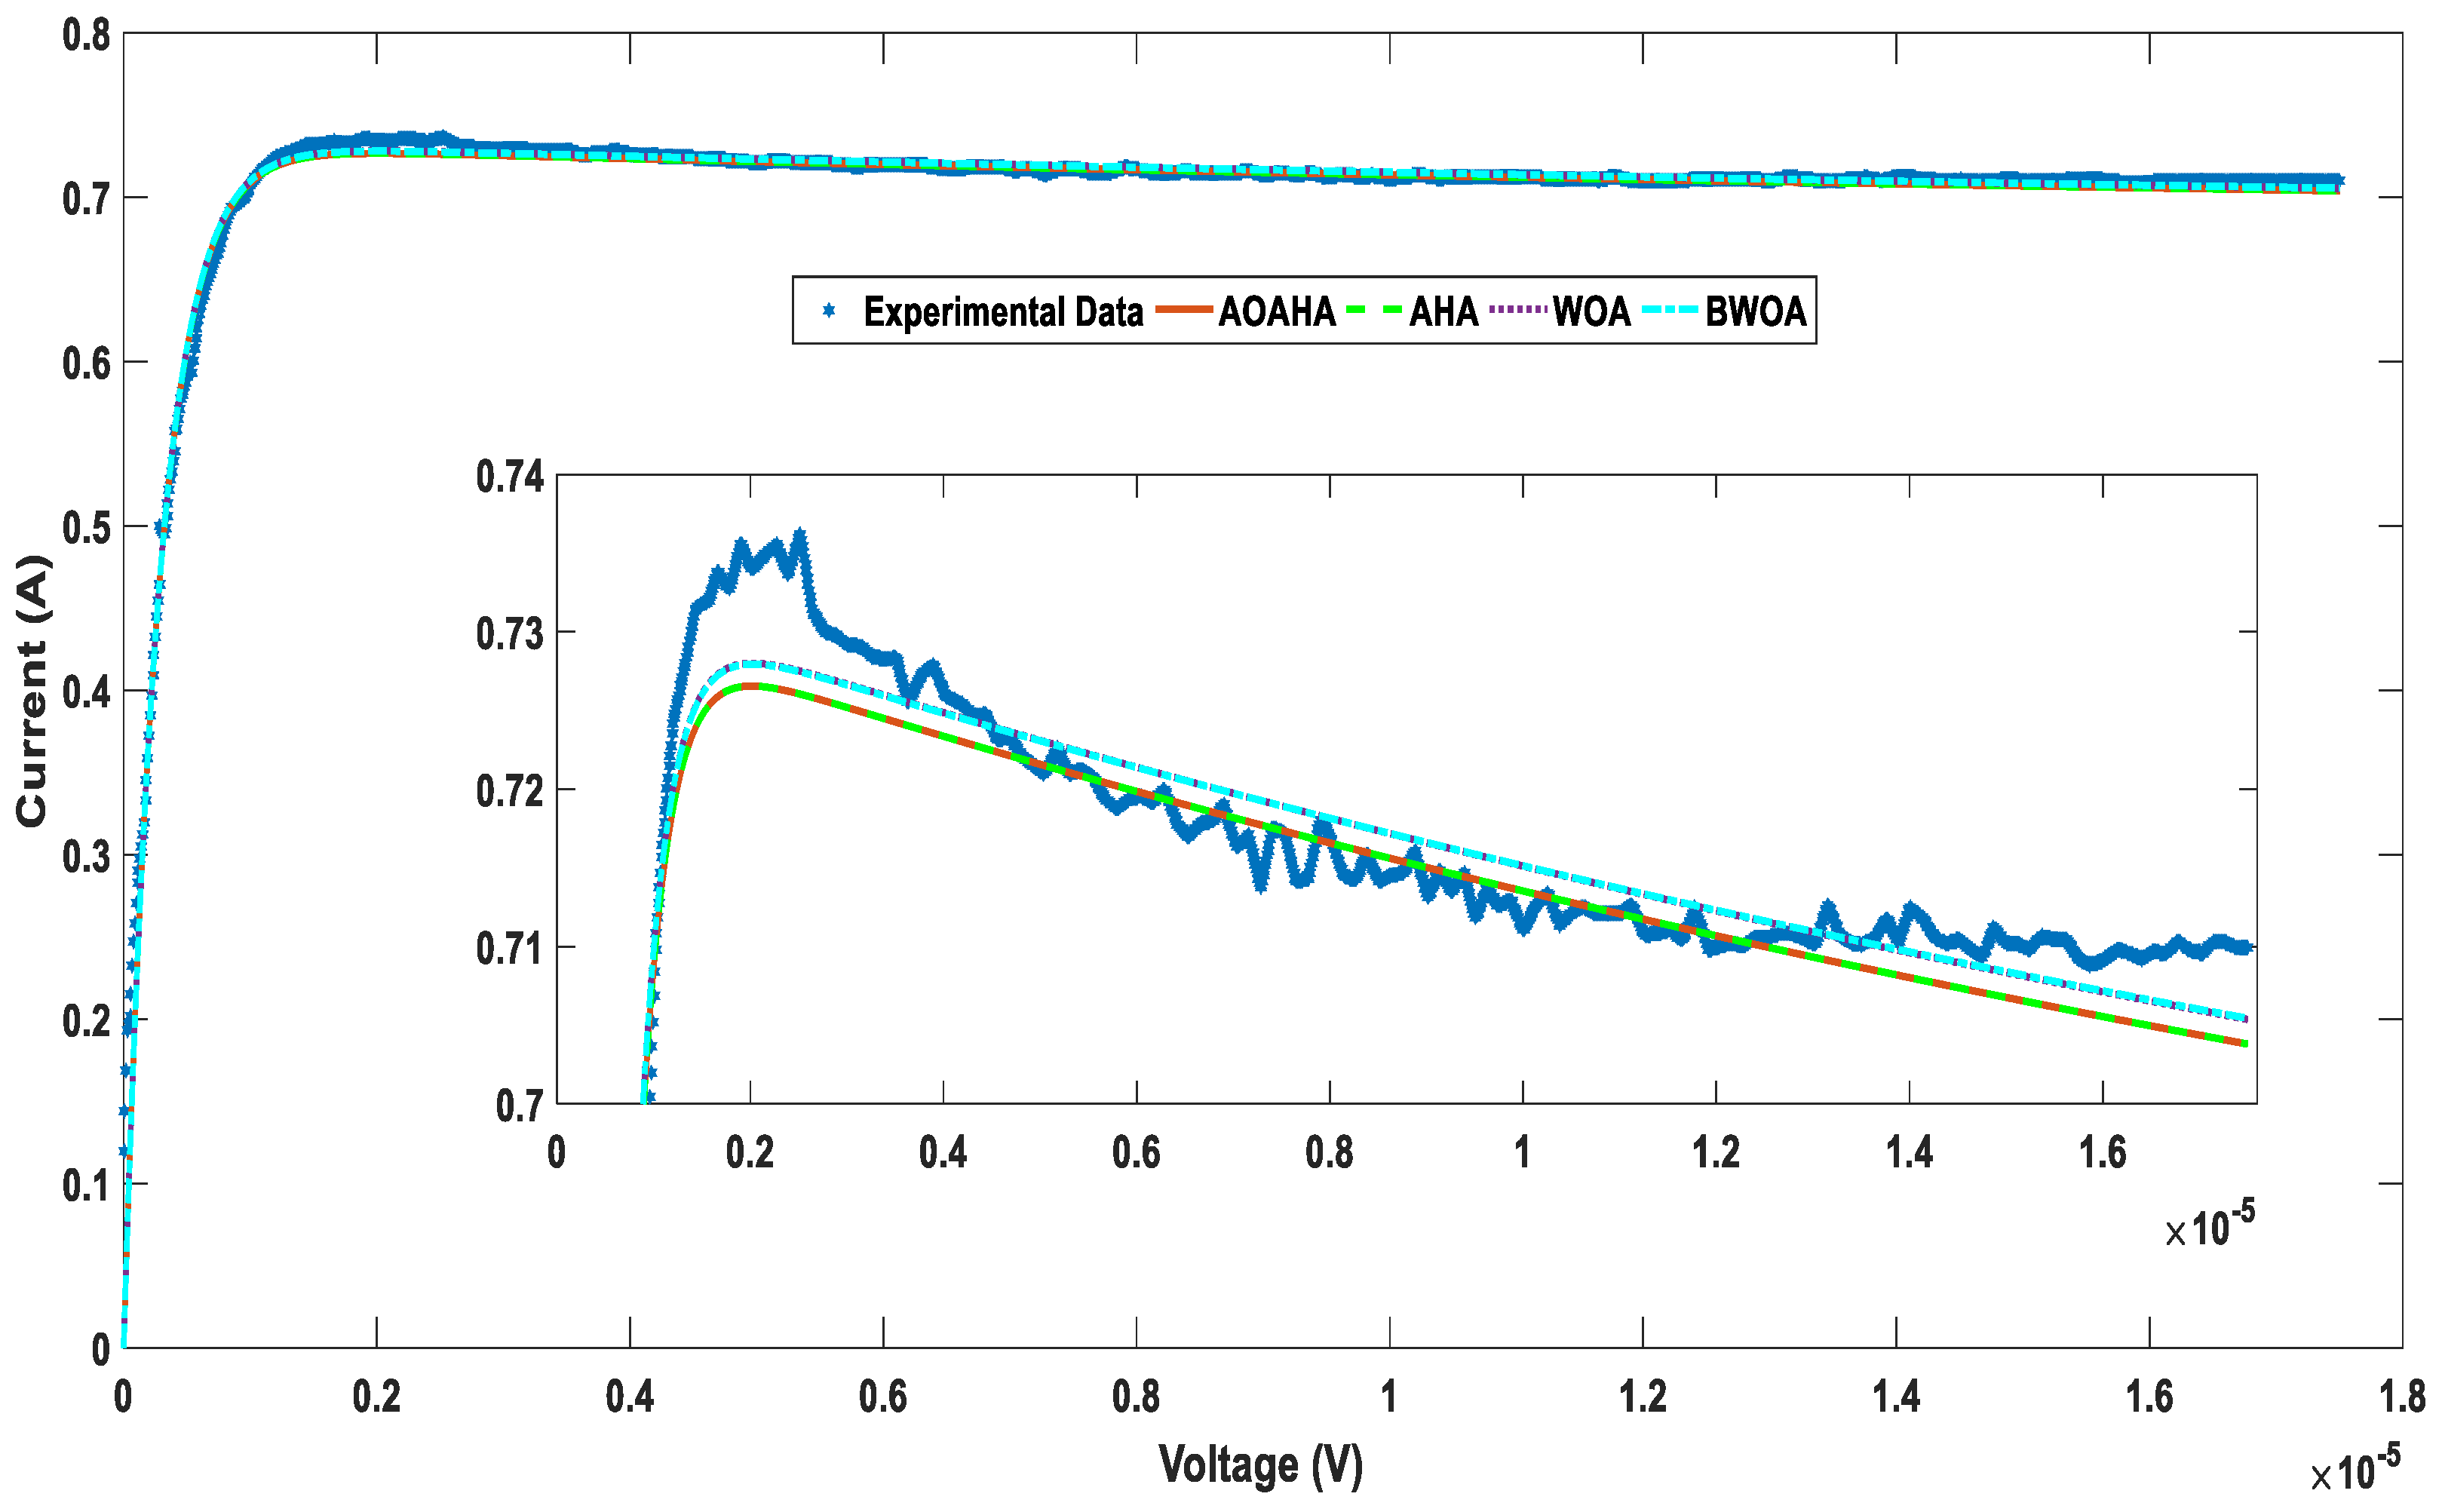
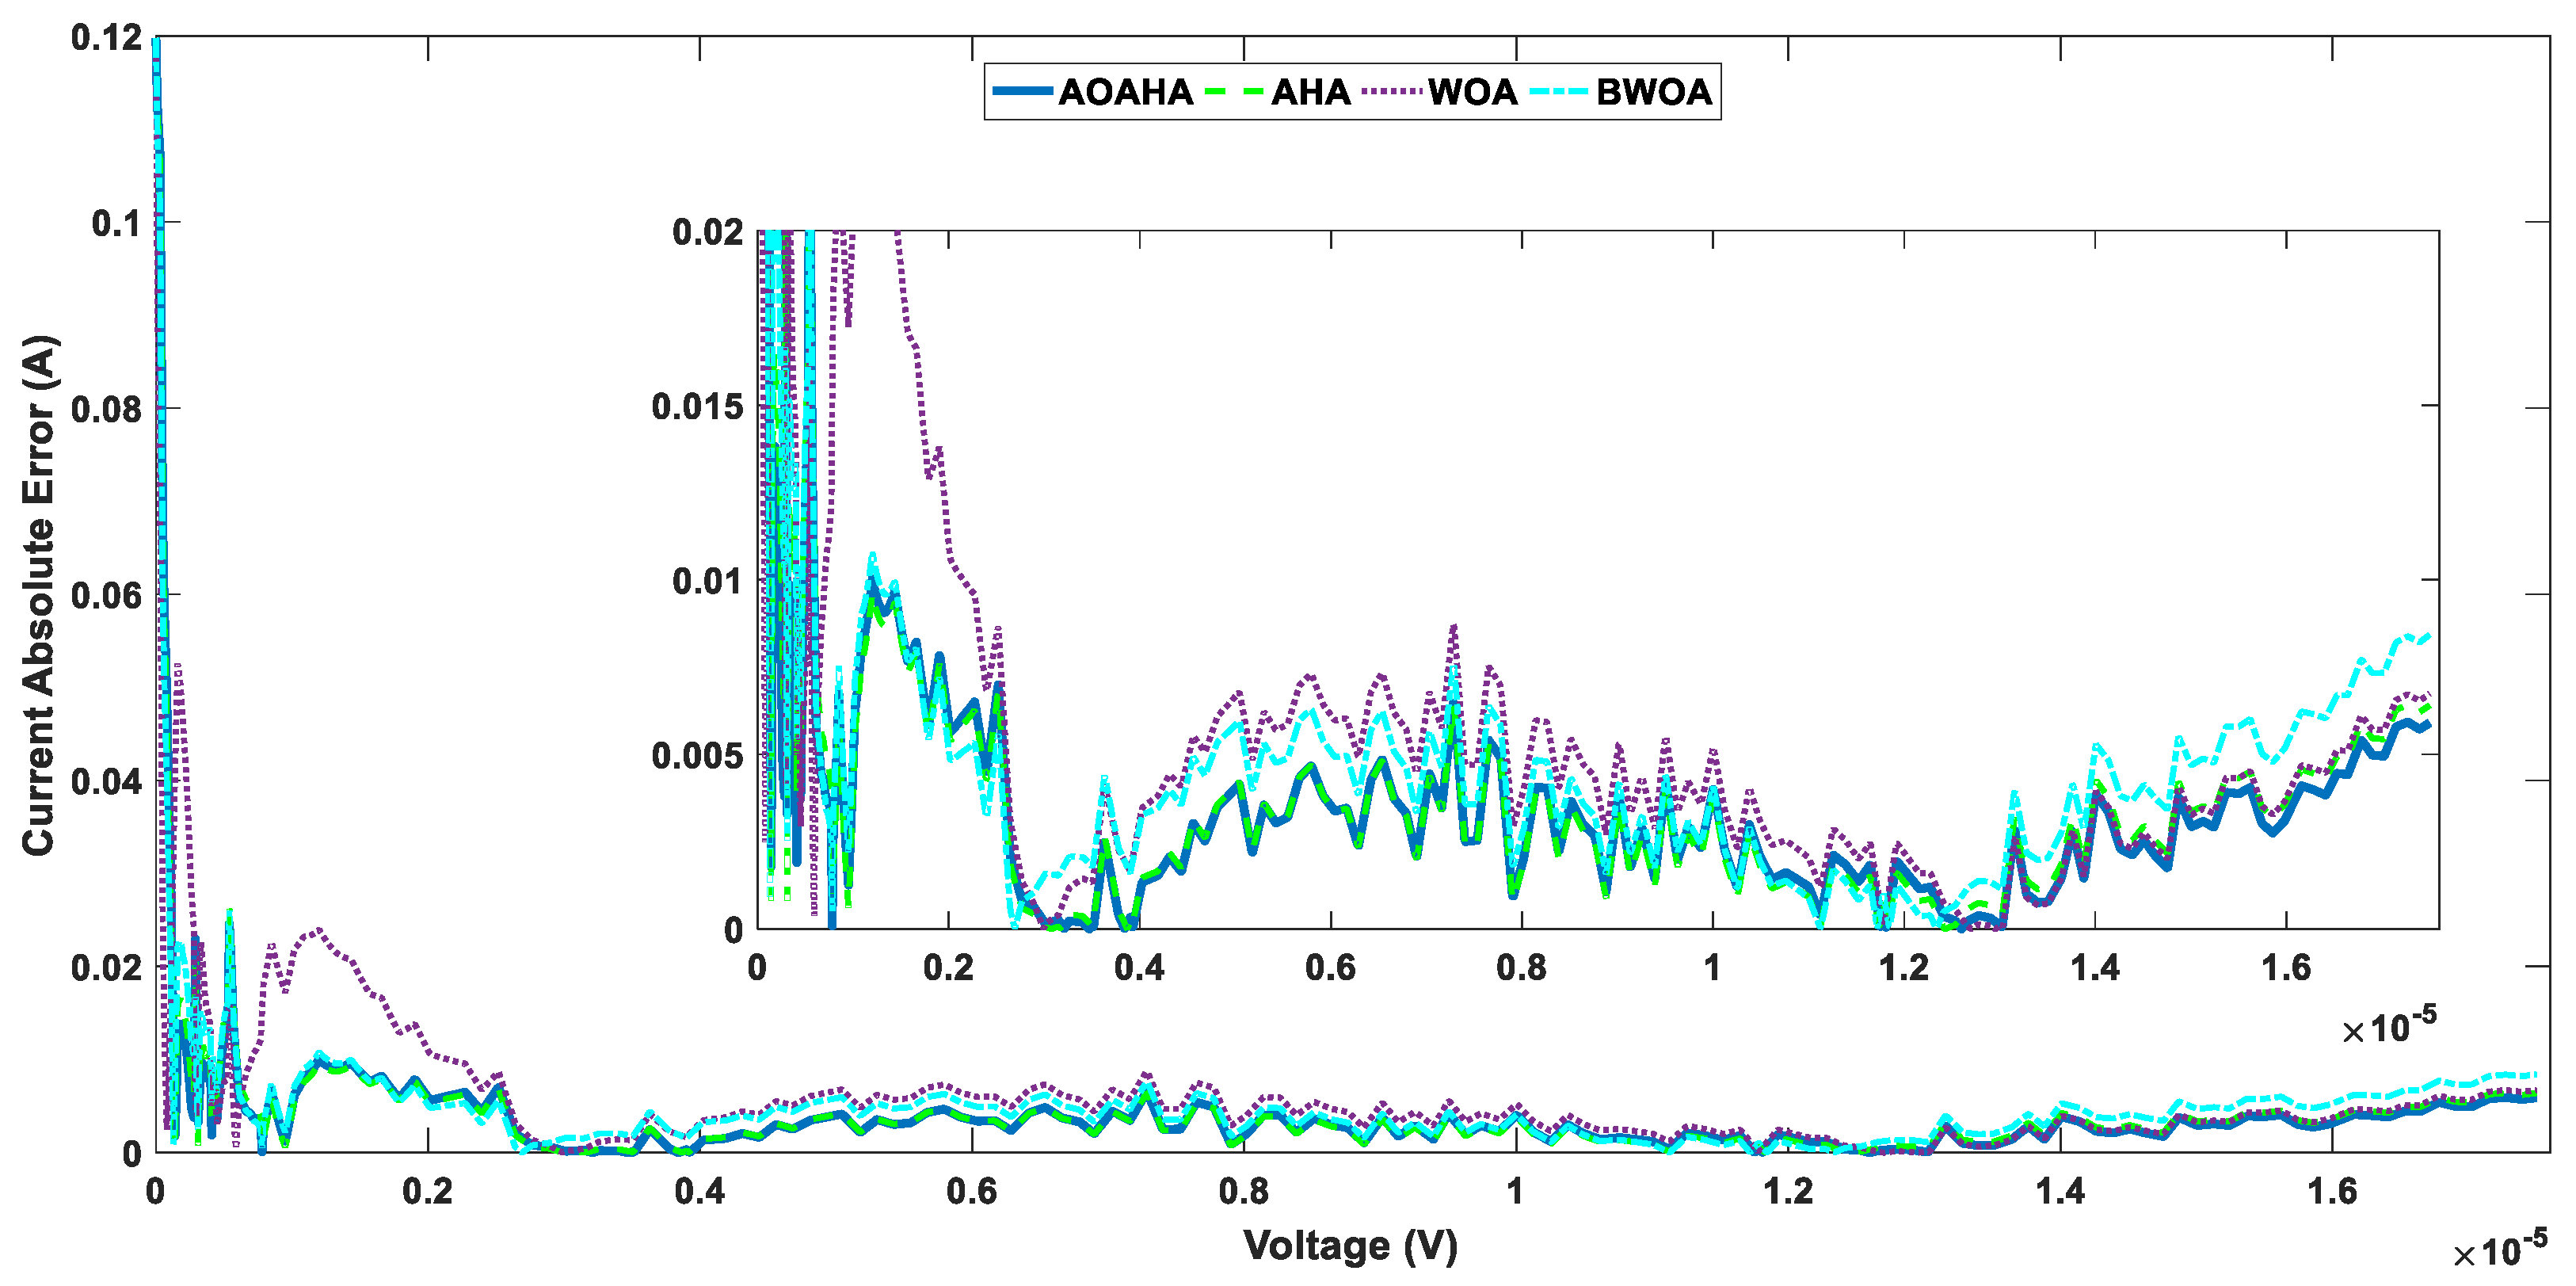
4.2.2. Application 2

In this application, the AOAHA was applied for parameter estimation of the static TDM using the real data from a 7.7 cm2 partition of a multicrystalline Q6-1380 solar cell at different levels of irradiance. The data were captured at room temperature at irradiance of 20 mW/m2, 9.84 mW/m2, 3.47 mW/m2, and 0.58 mW/m2 [32]. Table 7 presents the upper and lower ranges of the nine parameters for the TDM. Table 3 presents the obtained parameters through the proposed and the original algorithms (AOAHA and AHA, respectively), along with WOA and BWOA. Table 8 also presents the obtained RMSE calculated for all algorithms at different irradiance. Although the AOAHA has the same RMSE value as the AHA at irradiance od 20 mW/cm2 and 9.84 mW/m2, the AOAHA has the best RMSE at irradiance of 3.47 mW/m2 and 0.58 mW/m2. Figure 14 presents the RMSE values for all algorithms at different irradiance levels. To present and compare the algorithms’ behavior through searching processes, the convergence curves for all compared algorithms are presented in Figure 15. The AOAHA has the best and fastest convergence in all cases. The behavior of the TDM model estimated by the AOAHA for different irradiance was compared with real data, as presented in Figure 16.

4.2.3. Application 3

In this application, the AOAHA was applied for parameter estimation of dynamic PV models (IOM and FOM) using the real data from a PV module at a temperature of 25 °C and irradiance of 655 W/m2.The connected load (Rl) was 23.1 ohm. Table 9 presents the upper and lower ranges of the three parameters for the IOM and the five parameters for the FOM.
Table 10 and Table 11 present the obtained parameters from the proposed and the original algorithm for the IOM and FOM, respectively; they also present the RMSE obtained for all compared algorithms for the IOM and FOM, respectively. From the RMSE values, the AOAHA and AHA have the same results, which are better than those of the other algorithms; additionally, the results obtained by the FOM are more accurate than those obtained by the IOM model. To present and compare the algorithms’ behavior through the searching processes of the IOM and FOM, the convergence curves for all compared algorithms are presented in Figure 17 and Figure 18, respectively. The statistical analysis of 30 independent runs for the IOM and FOM are presented in Table 12 and Table 13, respectively, and graphically presented in boxplots in Figure 19 and Figure 20, respectively. From the IOM statistical analysis, although the AOAHA and AHA have the same minimum values, the AOAHA has better average, maximum, and standard deviation values than the AHA and all other compared algorithms. From the FOM statistical analysis, although the AHA has better standard deviation than the AOAHA, the latter has better minimum, average, and maximum values than the AHA and all other compared algorithms. Figure 21 and Figure 22 present the load–current curve for the real experimental data and all algorithms for the IOM and FOM, respectively.
Figure 23 and Figure 24 present the current absolute error curve of all algorithms for the IOM and FOM, respectively.

5. Conclusions

In this paper, a novel enhanced optimization algorithm was proposed. The enhanced algorithm is called the AOAHA. The enhancement is based on adding an adaptive part to the original AHA algorithm. The new algorithm was evaluated though benchmark functions and through real applications. The benchmark functions comprised 23 unimodal, multimodal, and composite functions. The real applications were for the parameter estimation of a PV static TDM for 57 mm diameter commercial France R.T.C silicon solar cells, multicrystalline Q6-1380 solar cells at different levels of irradiance, and dynamic IOM and dynamic FOM for a PV module at a temperature of 25 °C and irradiance level of 655 W/m2 through a connected load of Rl = 23.1. The obtained results for all tests were evaluated by comparing the results using different factors. RMSE and IAE were used to check the accuracy. The algorithm robustness was tested by running the algorithms in 30 independent runs and comparing the obtained results through statistical analysis. The values calculated in the statistical analysis were the minimum, maximum, average, and standard deviation. The AOAHA had the best performance in the majority of the tests. From the RMSE obtained for the IOM and FOM, the dynamic FOM is more accurate than the IOM. Different types of PV models and different applications, along with different operation conditions, were used to test the proposed algorithm from different sides, and satisfied a good performance in all tests. For future work, the proposed algorithm can be applied to estimate PV model parameters for large PV systems and complex problems such as optimal power flow economic emission dispatch with renewable energy resources for large scale power systems and optimal residential load scheduling for photovoltaic systems [33].

Author Contributions

Conceptualization, A.R., S.K. and M.H.H.; data curation, E.M.A. and H.M.H.; formal analysis, A.R., S.K. and M.H.H.; funding acquisition, E.M.A. and H.M.H.; investigation, A.R., S.K. and M.H.H.; methodology, A.R., S.K. and M.H.H.; project administration, E.M.A. and H.M.H.; resources, E.M.A. and H.M.H.; software, A.R., M.H.H. and S.K.; supervision, E.M.A. and H.M.H.; validation, A.R., S.K. and M.H.H.; visualization, E.M.A. and H.M.H.; writing—original draft, A.R., S.K. and M.H.H.; writing—review and editing, E.M.A., and H.M.H. All authors have read and agreed to the published version of the manuscript.

Funding

This work is funded by the Deanship of Scientific Research at Jouf University under grant No (DSR-2021-02-0311).

Institutional Review Board Statement

Not applicable.

Informed Consent Statement

Not applicable.

Data Availability Statement

Not applicable.

Conflicts of Interest

The authors declare no conflict of interest.

Nomenclature

SymbolDescription
TDMThree-diode model
DDMDouble-diode model
SDMSingle-diode model
IOMIntegral order model
FOMFractional order model
AHAArtificial hummingbird algorithm
AOAHAAdaptive opposition artificial hummingbird algorithm
PVPhotovoltaic
VTerminal voltage
IPV module output current
IphCurrent source generated from the photons
RMSERoot-mean-square error
η1Ideality factor for the first diode (diffusion of current components)
η2Ideality factor for the second diode (recombination of current components)
T (Ko)Photocell temperature (Kelvin)
η3Ideality factor for the third diode (leakage of current components)
RsSeries resistance to represent the total resistance of the semiconductor material at neutral regions
RshShunt resistance to represent the total resistance for the current leakage in the P–N junction of the solar cell
Is1Current passing through the first diode
Is2Current passing through the second diode
Kconstant of = 1.380 × 10⁻²³ (J/Ko)
q1.602 × 10−19 (C) coulombs.
ABCArtificial bee colony
MPSOMutant particle swarm optimization
SSASalp swarm algorithm
ITLBOImproved teaching–learning-based optimization

References

  1. Kaliraj, P.; Devi, T. Artificial Intelligence Theory, Models, and Applications, 2nd ed.; 206 B/W Illustrations; Auerbach Publications: Boca Raton, FL, USA, 2021; p. 506. [Google Scholar]
  2. He, Q.; Zheng, H.; Ma, X.; Wang, L.; Kong, H.; Zhu, Z. Artificial intelligence application in a renewable energy-driven desalination system: A critical review. Energy AI 2022, 7, 100123. [Google Scholar] [CrossRef]
  3. Sarita, K.; Devarapalli, R.; Rai, P. Modeling and control of dynamic battery storage system used in hybrid grid. Energy Storage 2020, 2, e146. [Google Scholar] [CrossRef] [Green Version]
  4. Surendra, H.H.; Seshachalam, D.; Sudhindra, K.R. Design of Standalone Solar Power Plantusing System Advisor Model in Indian Context. Int. J. Recent Technol. Eng. (IJRTE) 2020, 5, 2277–3878. [Google Scholar]
  5. Baschieri, D.; Magni, C.A.; Marchioni, A. Comprehensive Financial Modeling of Solar PV Systems. In Proceedings of the 37th European Photovoltaic Solar Energy Conference and Exhibition, Lisbon, Portugal, 7–11 September 2020. [Google Scholar]
  6. Qais, M.H.; Hasanien, H.M.; Alghuwainem, S. Transient search optimization for electrical parameters estimation of photovoltaic module based on datasheet values. Energy Convers. Manag. 2020, 214, 112904. [Google Scholar] [CrossRef]
  7. Ramadan, A.; Kamel, S.; Korashy, A.; Yu, J. Photovoltaic Cells Parameter Estimation Using an Enhanced Teaching Learning Based Optimization Algorithm. Iran. J. Sci. Technol. 2019, 44, 767–779. [Google Scholar] [CrossRef]
  8. Piliougine, M.; Guejia-Burbano, R.A.; Petrone, G.; Sánchez-Pacheco, F.J.; Mora-López, L.; Sidrach-de-Cardon, M. Parameters extraction of single diode model for degraded photovoltaic modules. Renew. Energy 2021, 164, 674–686. [Google Scholar] [CrossRef]
  9. Ramadan, A.; Kamel, S.; Ibrahim, A.A. Parameters Estimation of Photovoltaic Cells Using Self-adaptive Multi-population Rao Optimization Algorithm. Aswan Univ. J. Sci. Technol. 2021, 31, 34. [Google Scholar]
  10. Stornelli, V.; Muttillo, M.; de Rubeis, T.; Nardi, I. A New Simplified Five-Parameter Estimation Method for Single-Diode Model of Photovoltaic Panels. Energies 2019, 12, 4271. [Google Scholar] [CrossRef] [Green Version]
  11. Messaoud, R.B. Extraction of uncertain parameters of double-diode model of a photovoltaic panel using Ant Lion Optimization. Appl. Sci. 2018, 2, 239. [Google Scholar] [CrossRef] [Green Version]
  12. Ramadan, A.; Kamel, S.; Taha, I.B.M.; Tostado-Véliz, M. Parameter Estimation of Modified Double-Diode and Triple-Diode Photovoltaic Models Based on Wild Horse Optimizer. Electronics 2021, 10, 2308. [Google Scholar] [CrossRef]
  13. Suganya, T.; Rajendran, V.; Mangaiyarkarasi, P. “Parameters Extraction of the Double Diode Model for the Polycrystalline Silicon Solar Cells” Advances in Computing and Data Sciences. ICACDS 2021. Communications in Computer and Information Science; Springer: Berlin/Heidelberg, Germany, 2021; Volume 1440. [Google Scholar]
  14. Yaqoob, S.J.; Saleh, A.L.; Motahhir, S.; Agyekum, E.B.; Nayyar, A.; Qureshi, B. Comparative study with practical validation of photovoltaic monocrystalline module for single and double diode models. Sci. Rep. 2021, 11, 19153. [Google Scholar] [CrossRef]
  15. Ramadan, A.; Kamel, S.; Hussein, M.M.; Hassan, M.H. A New Application of Chaos Game Optimization Algorithm for Parameters Extraction of Three Diode Photovoltaic model. IEEE Access 2021, 9, 51582–51594. [Google Scholar] [CrossRef]
  16. Houssein, E.H.; Zaki, G.N.; Diabb, A.A.Z.; Younis, E.M. An efficient Manta Ray Foraging Optimization algorithm for parameter extraction of three-diode photovoltaic model. Comput. Electr. Eng. 2021, 94, 107304. [Google Scholar] [CrossRef]
  17. Ramadan, A.; Kamel, S.; Khurshaid, T.; Oh, S.R.; Rhee, S.B. Parameter Extraction of Three Diode Solar Photovoltaic Model Using Improved Grey Wolf Optimizer. Sustainability 2021, 13, 6963. [Google Scholar] [CrossRef]
  18. Qin, L.; Xie, S.; Yang, C.; Cao, J. “Dynamic model and dynamic characteristics of solar cell” Conference Paper in Zhongguo Dianji Gongcheng Xuebao. In Proceedings of the Chinese Society of Electrical Engineering, Melbourne, Australia, 3–6 June 2013. [Google Scholar]
  19. Yousri, D.; Allam, D.; Eteibaa, M.B.; Suganthanb, P.N. Static and dynamic photovoltaic models’ parameters identification using Chaotic Heterogeneous Comprehensive Learning Particle Swarm Optimizer variants. Energy Convers. Manag. 2019, 182, 546–563. [Google Scholar] [CrossRef]
  20. Maniraj, B.; Fathima, A.P. Parameter extraction of solar photovoltaic modules using various optimization techniques: A review. J. Phys. Conf. Ser. 2020, 1716, 012001. [Google Scholar] [CrossRef]
  21. Venkateswari, R.; Rajasekar, N. Review on parameter estimation techniques of solar photovoltaic systems. Int. Trans. Electr. Energ. Syst. 2021, 31, e13113. [Google Scholar] [CrossRef]
  22. Soliman, M.A.; Al-Durra, A.; Hasanien, H.M. Electrical Parameters Identifica-tion of Three-Diode Photovoltaic Model Based on Equilibrium Optimizer Algorithm. IEEE Access 2021, 9, 41891–41901. [Google Scholar] [CrossRef]
  23. Joshi, H.; Arora, S. Enhanced Grey Wolf Optimization Algorithm for Global Optimization. Fundam. Inform. 2017, 153, 235–264. [Google Scholar] [CrossRef]
  24. Tao, Q.; Guo, H.; Li, J.; Gao, K.; Han, Y. Improved migrating birds optimization algorithm to solve hybrid flowshop scheduling problem with lot-streaming. Inst. Electr. Electron. Eng. Access 2020, 8, 89782–89792. [Google Scholar]
  25. Cheng, J.; Zhao, W. Chaotic enhanced colliding bodies optimization algorithm for structural reliability analysis. Adv. Struct. Eng. 2020, 23, 438–453. [Google Scholar] [CrossRef]
  26. Alghamdi, M.A.; Khan, M.F.N.; Khan, A.K.; Khan, I.; Ahmed, A.; Kiani, A.T.; Khan, M.A. PV Model Parameter Estimation Using Modified FPA With Dynamic Switch Probability and Step Size Function. IEEE Access 2021, 9, 42027–42044. [Google Scholar]
  27. Zhaoa, W.; Wanga, L.; Seyedali, M. Artificial hummingbird algorithm: A new bio-inspired optimizer with its engineering applications. Comput. Methods Appl. Mech. Eng. 2022, 388, 114194. [Google Scholar] [CrossRef]
  28. Naik, M.K.; Panda, R.; Abraham, A. Adaptive opposition slime mould algorithm. Soft Comput. 2021, 25, 14297–14313. [Google Scholar] [CrossRef]
  29. Zhao, W.; Wang, L.; Zhang, Z. Supply-demand-based optimization: A novel economics-inspired algorithm for global optimization. IEEE Access 2019, 7, 73182–73206. [Google Scholar] [CrossRef]
  30. Naruei, I.; Keynia, F. Wild horse optimizer: A new meta-heuristic algorithm for solving engineering optimization problems. Eng. Comput. 2021, 1–32. [Google Scholar] [CrossRef]
  31. Kaur, S.; Awasthi, L.K.; Sangal, A.L.; Dhiman, G. Tunicate Swarm Algorithm: A new bio-inspired based metaheuristic paradigm for global optimization. Eng. Appl. Artif. Intell. 2020, 90, 103541. [Google Scholar] [CrossRef]
  32. Allam, D.; Yousri, D.A.; Eteiba, M.B. Parameters extraction of the three diode model for the multi-crystalline solar cell/module using Moth-Flame Optimization Algorithm. Energy Convers. Manag. 2016, 123, 535–548. [Google Scholar] [CrossRef]
  33. Hafeez, G.; Javaid, N.; Iqbal, S.; Khan, F.A. Optimal Residential Load Scheduling Under Utility and Rooftop Photovoltaic Units. Energies 2018, 11, 611. [Google Scholar] [CrossRef] [Green Version]
Figure 1. TDM.
Figure 1. TDM.
Electronics 11 00318 g001
Figure 2. Integral order model.
Electronics 11 00318 g002
Figure 3. Fractional order model.
Electronics 11 00318 g003
Figure 4. Three flight behaviors in 3D space.
Electronics 11 00318 g004
Figure 5. Qualitative metrics of 12 benchmark functions: 2D views of the functions, search history, average fitness history, and convergence curve using the AOAHA technique.
Electronics 11 00318 g005aElectronics 11 00318 g005bElectronics 11 00318 g005c
Figure 6. The convergence curves of all algorithms for 23 benchmark functions.
Electronics 11 00318 g006aElectronics 11 00318 g006b
Figure 7. Boxplots for all algorithms for 23 benchmark functions.
Electronics 11 00318 g007aElectronics 11 00318 g007b
Figure 8. The convergence curve of all algorithms of the TDM.
Electronics 11 00318 g008
Figure 9. Boxplot figure of all algorithms for 30 independent runs in the case of the TDM.
Electronics 11 00318 g009
Figure 10. Current–voltage characteristics estimated by all algorithms for the TDM.
Electronics 11 00318 g010
Figure 11. Power–voltage characteristics estimated by all algorithms for the TDM.
Electronics 11 00318 g011
Figure 12. Current absolute error estimated by all algorithms for the TDM.
Electronics 11 00318 g012
Figure 13. Power absolute error estimated by all algorithms for the TDM.
Electronics 11 00318 g013
Figure 14. Summary of the obtained RMSE by all algorithms at different irradiances.
Electronics 11 00318 g014
Figure 15. Convergence curves for all algorithms at different irradiances.
Electronics 11 00318 g015aElectronics 11 00318 g015b
Figure 16. Voltage–current characteristic curves for the real data and AOAHA at different irradiances.
Electronics 11 00318 g016
Figure 17. Convergence curves of all algorithms for the IOM.
Electronics 11 00318 g017
Figure 18. Convergence curves of all algorithms for the FOM.
Electronics 11 00318 g018
Figure 19. Boxplot figure of all algorithms for 30 independent runs in the case of the IOM.
Electronics 11 00318 g019
Figure 20. Boxplot figure of all algorithms for 30 independent runs in the case of the FOM.
Electronics 11 00318 g020
Figure 21. Load–current curve of real data and the estimated IOM by different algorithms.
Electronics 11 00318 g021
Figure 22. Load–current curve of real data and the estimated FOM by different algorithms.
Electronics 11 00318 g022
Figure 23. Current absolute error of the estimated IOM by different algorithms.
Electronics 11 00318 g023
Figure 24. Current absolute error of the estimated FOM by different algorithms.
Electronics 11 00318 g024
Table 1. Results of unimodal benchmark functions.
FunctionAOAHAAHASDOWHOTSA
F1Best1.29 × 10−663.01 × 10−661.39 × 10−555.08 × 10−213.79 × 10⁻⁸
Mean9.14 × 10−563.87 × 10−531.49 × 10−512.13 × 10−184.64 × 10⁻⁷
Median4.31 × 10−593.32 × 10−593.74 × 10−546.47 × 10−191.17 × 10⁻⁷
Worst1.54 × 10−547.66 × 10−528.43 × 10−518.56 × 10−184.09 × 10⁻⁶
STD3.48 × 10−551.71 × 10−522.99 × 10−512.98 × 10−181.15 × 10⁻⁶
F2Best6.71 × 10−354.74 × 10−341.83 × 10−294.13 × 10−132.44 × 10⁻⁶
Mean5.66 × 10−291.07 × 10−293.76 × 10−251.3 × 10−101.9 × 10⁻⁵
Median1.12 × 10−303.11 × 10−311.13 × 10−265.29 × 10−111.86 × 10⁻⁵
Worst4.08 × 10−289.48 × 10−293.98 × 10−246.34 × 10−103.68 × 10⁻⁵
STD1.25 × 10−282.51 × 10−299.1 × 10−251.77 × 10−109.44 × 10⁻⁶
F3Best2.43 × 10−613.15 × 10−616.27 × 10−465.13 × 10−130.027608
Mean1.59 × 10−504.36 × 10−486.91 × 10−341.2 × 10−81.122677
Median3.03 × 10−541.01 × 10−541.4 × 10−396.29 × 10−110.772195
Worst3.06 × 10−496.68 × 10−471.38 × 10−322.3 × 10−73.914695
STD6.82 × 10−501.53 × 10−473.09 × 10−335.14 × 10−81.096313
F4Best1.28 × 10−325.07 × 10−291.11 × 10−265.11 × 10−90.67531
Mean3.07 × 10−244.63 × 10−264.52 × 10−233.5 × 10−73.616654
Median5.11 × 10−271.05 × 10−271.14 × 10−231 × 10−73.022253
Worst4.85 × 10−234.23 × 10−251.94 × 10−222.14 × 10−69.361516
STD1.11 × 10−231.02 × 10−256.34 × 10−236.09 × 10−72.343658
F5Best26.880626.4097427.9096726.6845127.18973
Mean27.7177127.502428.6509637.1065639.01094
Median27.6059327.4781528.7472627.6798528.66203
Worst28.7378528.5330428.98699208.5133239.7785
STD0.5977930.4722370.29502640.3704647.26339
F6Best0.0370490.0586380.0399570.0132482.886997
Mean0.4499790.4422962.5685410.0647843.800719
Median0.365320.3930542.0387790.0586653.736935
Worst1.1882721.0297677.2502510.169714.850371
STD0.3061080.2498761.8527010.0439410.527851
F7Best5.14 × 10−51.47 × 10−58.66 × 10−50.0006050.007604
Mean0.0003970.0003460.0023560.0017790.019206
Median0.0003350.0002190.0011360.0013870.018479
Worst0.0011430.0012020.0138130.0049380.04436
STD0.0002980.0002920.0033310.0012550.007628
The best values obtained are shown in bold.
Table 2. Results of multimodal benchmark functions.
FunctionAOAHAAHASDOWHOTSA
F8Best−1678.77−1724.06−1655−1807.46−1394.45
Mean−1551.15−1551.13−1312.83−1721.44−1212.82
Median−1544.23−1562.44−1385.86−1729.69−1232.52
Worst−1443.17−1364.15−598.802−1630.81−976.635
STD69.1789593.45685294.00854.13894122.0762
F9Best0.000.004.33 × 10−300.00156.667
Mean0.000.001.75 × 10−221.11 × 10−5228.0177
Median0.000.004.17 × 10−251 × 10−9228.634
Worst0.000.003.02 × 10−210.000177331.7581
STD0.000.006.75 × 10−223.96 × 10−546.40919
F10Best8.88 × 10−168.88 × 10−168.88 × 10−168.88 × 10−1620.81133
Mean8.88 × 10−168.88 × 10−168.88 × 10−161.00359720.9608
Median8.88 × 10−168.88 × 10−168.88 × 10−167.99 × 10−620.99356
Worst8.88 × 10−168.88 × 10−168.88 × 10−1620.0136921.0961
STD0.000.000.004.4745240.091505
F11Best0.000.000.000.001.3 × 10−9
Mean0.000.000.001.83 × 10−160.007018
Median0.000.000.000.001.44 × 10−8
Worst0.000.000.003.66 × 10−150.029126
STD0.000.000.008.19 × 10−160.010243
F12Best0.001120.0010290.0011524.64 × 10−50.374956
Mean0.0095530.0086540.234670.0265442.805889
Median0.0091730.0069180.0678050.0003092.009833
Worst0.0204460.0314161.4928210.2073867.656863
STD0.0056740.0075520.3520630.0568022.128936
F13Best0.4331761.4563020.0462160.0118022.372295
Mean2.1556272.3391151.8675520.1738973.298085
Median2.4017092.4360571.9342460.1368173.22876
Worst2.9691992.9695912.9999240.7008334.16073
STD0.7239350.3611110.9612840.1577160.565835
The best values obtained are shown in bold.
Table 3. Results of composite benchmark functions.
FunctionAOAHAAHASDOWHOTSA
F14Best0.9980040.9980040.9980040.9980040.998004
Mean0.9980040.9980043.4946961.0972098.298683
Median0.9980040.9980041.4950170.99800410.76318
Worst0.9980040.99800412.670512.98210518.30431
STD1.76 × 10−81.03 × 10−93.9532030.4436595.533952
F15Best0.0003070.0003070.0003070.0003070.000308
Mean0.0003080.0003180.000670.0006020.007136
Median0.0003080.0003080.0005270.0005930.000505
Worst0.000320.0004850.0021210.0012230.031699
STD2.69 × 10−63.95 × 10−50.0004730.0002860.010606
F16Best−1.03163−1.03163−1.03163−1.03163−1.03163
Mean−1.03163−1.03163−1.03005−1.03163−1.0253
Median−1.03163−1.03163−1.03163−1.03163−1.03163
Worst−1.03163−1.03163−1.00046−1.03163−0.99999
STD1.3 × 10−121.18 × 10−120.0069665.09 × 10−170.012981
F17Best0.3978870.3978870.3978870.3978870.39789
Mean0.3978870.3978870.3979870.3978870.397927
Median0.3978870.3978870.3978870.3978870.397907
Worst0.3978870.3978870.3997950.3978870.398082
STD0.000.000.0004260.004.53 × 10−5
F18Best3.003.003.003.003.000009
Mean3.003.003.003.008.400078
Median3.003.003.003.003.000084
Worst3.003.003.003.0084.00001
STD1.77 × 10−151.6 × 10−155.21 × 10−81.13 × 10−1518.78799
F19Best−0.30048−0.30048−0.30048−0.30048−0.30048
Mean−0.30047−0.30047−0.2893−0.30048−0.30048
Median−0.30047−0.30047−0.30038−0.30048−0.30048
Worst−0.30046−0.30044−0.19165−0.30048−0.30048
STD4.22 × 10−61.04 × 10−50.0265311.14 × 10−161.14 × 10⁻¹⁶
F20Best−3.322−3.322−3.322−3.322−3.32148
Mean−3.29227−3.30415−3.09697−3.21756−3.07223
Median−3.322−3.322−3.2031−3.322−3.20118
Worst−3.2031−3.2031−0.89904−2.43178−0.20816
STD0.0528190.0435520.5509860.2399080.679321
F21Best−10.1532−10.1532−10.1532−10.1532−10.0895
Mean−9.89798−10.1059−8.703−9.77706−5.89545
Median−10.1531−10.153−10.1532−10.1532−4.90994
Worst−5.0552−9.2237−4.99677−2.63047−2.58642
STD1.1398730.2076482.239521.6821332.775111
F22Best−10.4029−10.4029−10.4029−10.4029−10.3637
Mean−10.135−10.0864−8.45822−9.75463−7.02119
Median−10.4029−10.4029−10.4029−10.4029−9.8942
Worst−5.08767−5.08767−1.0677−2.75193−1.82478
STD1.1880231.191363.1286892.0311233.57071
F23Best−10.5364−10.5364−10.5364−10.5364−10.4599
Mean−10.1167−10.2621−7.90449−10.5364−5.50502
Median−10.5364−10.5364−10.5357−10.5364−2.83596
Worst−5.12848−5.12848−3.79083−10.5364−1.66783
STD1.3485281.2083883.0153191.58 × 10−153.728197
The best values obtained are shown in bold.
Table 4. Upper and lower constraints for all estimated parameters (Application 1).
ParameterSolar Cell
Lower LimitUpper Limit
Rs05
Rsh0100
Iph02
Is101
Is201
Is301
ɳ112
ɳ212
ɳ312
Table 5. Estimated parameters and RMSE of ESGBO and other algorithms for the TDM model.
AOAHAAHABWOAWOA
Rs (Ω)0.036740.0365090.0364240.045276
Rsh(Ω)55.4131554.1641646.3628915.77225
Iph(A)0.760780.7607720.7614220.766883
Is1(A)7.37 × 10−74.00 × 10−81.50 × 10−71.72 × 10−8
Is2(A)1.13 × 10−72.98 × 10−71.49 × 10−71.30 × 10−10
Is3(A)1.17 × 10−72.39 × 10−81.50 × 10−76.51 × 10−10
η11.9995891.390161.5040141.232062
η21.461871.511731.4461211.85067
η31.437121.5621591.9824611.850237
RMSE0.00098251810.00098656250.00108460.0062131083
Table 6. The statistical results of the TDM for all other algorithms.
MinimumAverageMaximumSTD
AOAHA0.00098251810.0009827090.0009829922.49687 × 10−7
AHA0.00098656250.0009902290.0009965635.50757 × 10−6
BWOA0.00108460.00176440.0021240.000589054
WOA0.00621310830.0067128060.0070440.00044033
Table 7. Upper and lower constraints for all estimated parameters (Application 2).
ParameterSolar Cell
Lower LimitUpper Limit
Rs05
Rsh05000
Iph02
Is101
Is201
Is301
η1150
η2150
η3150
Table 8. The estimated parameters and RMSE for algorithms at different irradiance.
Irradiance Level Parameters
RsRshIphIs1Is2Is3η1η2η3RMSE
At 20 mw/cm2AOAHA0.08955000.000.03990.00052892.08 × 10−102.39 × 10−104.16984.16984.16982.23 × 10−4
AHA0.08955000.000.03992.33 × 10−100.0005284.37 × 10−104.16994.16984.16992.23 × 10−4
BWOA0.09145000.000.03990.00052711.16 × 10−66.08 × 10−164.166427.137827.13752.23 × 10−4
WOA0.3963208.770.03991.18 × 10−201.07 × 10−200.000230225.47071.06963.53953.68 × 10−4
At 9.84 mw/cm2AOAHA0.7072579.490.01970.0002472.95 × 10−50.00012203.498749.264946.69181.32 × 10−4
AHA0.7057545.480.01971.49 × 10−109.74 × 10−100.0002488038.943045.87833.50191.32 × 10−4
BWOA0.7057545.520.01970.00024881.00 × 10−201.00 × 10−203.50194.861429.49601.32 × 10−4
BWOA0.1759591.450.01970.00042732.02 × 10−202.02 × 10−203.99711.93772.01792.20 × 10−4
At 3.47 mw/cm2AOAHA1.1300611.160.00702.64 × 10−81.76 × 10−41.30 × 10−940.98593.142339.64848.26 × 10−5
AHA1.1330801.830.00703.57 × 10−61.73 × 10−40.0005242144.37933.134147.80928.27 × 10−5
BWOA1.1301611.050.00701.41 × 10−191.86 × 10−150.0001757849.99549.56403.14228.26 × 10−5
BWOA0.07521224.950.00707.02 × 10−200.0003702.35 × 10−206.00383.848745.06511.49 × 10−4
At 0.58 mw/cm2AOAHA1.47044996.030.00140.0007480.0001053.25 × 10−610.29392.819714.92687.15 × 10−5
AHA1.54064944.530.00147.91 × 10−54.14 × 10−60.000650802.689921.04577.99117.10 × 10−5
BWOA1.2021956.540.00140.00051490.0001731.00 × 10−2017.61103.113849.99997.37 × 10−5
BWOA0.45131133.550.00140.00031441.60 × 10−195.35 × 10−193.654643.912045.48588.48 × 10−5
Table 9. Upper and lower constraints for all estimated parameters (Application 3).
ParameterSolar Cell
Lower LimitUpper Limit
R c 020
C 2 × 10−86 × 10−5
L 5 × 10−61× 10−4
α 0.81.1
β   0.81.1
Table 10. Estimated parameters of the IOM model for all algorithms.
AOAHAAHAWOABWOA
R c 13.7938762413.7938813.0609913.06404
C 1.57 × 10−61.57 × 10−61.70 × 10−61.71 × 10−6
L 7.50 × 10−67.50 × 10−67.50 × 10−67.50 × 10−6
RMSE0.0084030.0084030.0084090.008409
Table 11. Estimated parameters of the FOM model for all algorithms.
AOAHAAHAWOABWOA
R c 6.6687166.5521833.5131846.162661
C 9.92 × 10−69.31 × 10−61.47 × 10−53.23 × 10−6
L 1.65 × 10−51.69 × 10−59.48 × 10−52.12 × 10−5
α 0.8451270.848930.8077580.93991
β 0.9453560.9431340.8238220.927025
RMSE0.0077120.0077120.0091770.008011
Table 12. The statistical results of the IOM for all other algorithms.
MinimumAverageMaximumSTD
AOAHA0.0084030030.0084030120.0084030321.16558 × 10−8
AHA0.0084030030.0084030460.0084032079.03883 × 10−8
WOA0.0084090.0084090.008413.94 × 10−7
BWOA0.0084090.0084090.008413.36 × 10−7
Table 13. The statistical results of the FOM for all other algorithms.
MinimumAverageMaximumSTD
AOAHA0.00762535860.00772345180.00782853849.06109 × 10−5
AHA0.00776046970.00784218870.00791994536.59704 × 10−5
WOA0.0091770.00919740.0092784.50571 × 10−5
BWOA0.00801140.00803150.0081114.44423 × 10−5
Publisher’s Note: MDPI stays neutral with regard to jurisdictional claims in published maps and institutional affiliations.

