
Investigation of UAV Detection by Different Solid-State Marine Radars
by
 , , , , and
Saulius Rudys
1,2 ,
,
Paulius Ragulis
1,
Andrius Laučys
1,
Domantas Bručas
2,3,
Raimondas Pomarnacki
4 and
Darius Plonis
4,* 1
Institute of Applied Electrodynamics and Telecommunications, Vilnius University, Saulėtekio Ave. 3, 10257 Vilnius, Lithuania
2
Antanas Gustaitis’ Aviation Insitute, Vilnius Gediminas Technical University, Linkmenu Str. 28-4, 08217 Vilnius, Lithuania
3
Space Science and Technology Institute, Kirtimų Str. 33, 02244 Vilnius, Lithuania
4
Faculty of Electronics, Vilnius Gediminas Technical University, Naugarduko Str. 41, 03227 Vilnius, Lithuania
*
Author to whom correspondence should be addressed.
Electronics 2022, 11(16), 2502; https://0-doi-org.brum.beds.ac.uk/10.3390/electronics11162502
Submission received: 6 July 2022
/
Revised: 6 August 2022
/
Accepted: 8 August 2022
/
Published: 11 August 2022
(This article belongs to the Section Microwave and Wireless Communications)
Abstract
:The development of unmanned aerial vehicle (UAV) technologies provides not only benefits but also threats. UAV technologies are developing faster than means of detecting and neutralizing them. Radar technology is one of the means of UAV detection which provides the longest detection range. Today’s market provides low-cost solid-state marine radar working on FMCW and pulse-compression principles of operation. Despite such radars having attractive features, they were not designed for UAV detection. Although they are not optimal, they could be used for UAV detection. The detection possibility of UAVs by marine radars was investigated by using three types of radars and two types of small UAVs as targets. Radar cross-section measurements of the targets were made in laboratory conditions.
1. Introduction
Unmanned aerial vehicle (UAV) technologies are rapidly developing in recent years. The field of applications of UAVs is wide, from entertainment to extremely complex scientific or military applications. Unfortunately, as with any other technology, the development of UAVs provides not only benefits but also threats. Damage can be done by UAVs to airport areas or to critical infrastructure. UAVs can carry illegal items over state borders, or they can be implemented as a tool by terrorists [1,2]. UAV technologies are developing much faster than means of their control, detection, and neutralization. There are many methods of UAV detection and neutralization. Unfortunately, all of them have some serious disadvantages. The essential problems in the detection of UAVs are the small size of UAVs, weak radio wave reflection (due to composite materials implemented), low radio signal, and sound emission.
The problem of UAV detection requires the investigation of already-developed solutions applied in other areas or the search for and development of new technical and software solutions. Here we have investigated the radars for the UAV’s detection, which provide the longest-range UAV detection and are not influenced by the light; therefore, they successfully work in the dark and in different weather conditions. For this, it is necessary to determine and investigate the radar cross-section of the UAVs which are supposed to be monitored and tracked. This is related to the carrier frequency of the radar used, or the wavelength . Of course, other internal and external factors such as forests, hills, or meteorological conditions also influence on the radar, but this is not covered in the scope of this research.
To use the radars for the UAVs’ detection, several parameters have to be taken into account. These include mie and optical radar scattering, the size of antenna and radar beam width, Doppler shift extraction, distance dependency on radar equation, and the carrier frequency or wavelength that corresponds to the radar cross-section of the device to be detected and monitored. To detect and track small UAVs, an 8–12-GHz band should be used. This corresponds to the X band frequency range, which improves Doppler resolution in the short term due to the higher carrier frequency. However, typical long-distance radar frequencies are often in the S (form 2 GHz to 4 GHz), and L (form 1 GHz to 2 GHz) bands. Furthermore, using a higher than X frequency band is even better to detect UAVs; nonetheless, the range of view of such radar decreases considerably, so in practice UAVs can be seen or even heard right next door [3,4,5,6,7,8,9].
The radar types are diverse and, as an example, the authors of [10] have used the short-range revisor radar-based traveling-wave tube (TWT) technology. The results obtained showed that the TWT technology was able to properly detect and track the intended UAVs at a distance of up to 1.5 km under various environmental conditions. However, there are a couple of disadvantages of such a radar compared to FMCW radars. First, it has low energy efficiency and large dimensions. Moreover, it is important to conduct radar cross-section modeling studies of used drones to determine the area of radar frequency reflection from the them.
The technical characteristics of a radar can affect detection, and sometimes the elaborate signal analysis and detection of signatures can lead to better results [11]. In this case, by using the aforementioned simpler CW-type radar without phase modulation, an algorithm was proposed to allow a more accurate analysis. The algorithm allowed for the elimination of ambient and accidental noise, and the monitoring of the movement of the suspected objects made it possible to identify precisely that this was a UAV with a low potential risk of false detection. Another untapped but known way is to try to use the millimeter-wave radar of a mobile networks. For example, [12] uses 5G radar, which has detected electromagnetic radiation from drone engines. In this case, the authors were not only able to detect and track the UAV and the number of engines used, but also the engines’ speed by using the micro-Doppler method.
Most higher-band radars use the micro-Doppler effect to detect motors and their rotation [12,13]. The reduced distance of the observation is compensated by the higher accuracy of detection and drone classification. It is especially usefully for nano-drones detection.
Not only radar transmitters and receivers are investigated. MIMO radar antennas were used by the authors of [14]. During the study, the authors were able to successfully observe the UAV drone at a distance of 150 m, and the flight tracking corresponded to the real GPS coordinates of the drone. In this case, it is necessary to perform sufficiently complex data analyses by using fast Fourier transform and so on. A somewhat similar experiment is performed [15] by using a network of horn antennas to track a DJI Mavic Pro drone. In this case, high-speed Fourier transformation is also used for data processing, and high-quality detection and tracking is possible at up to 600 m. It is interesting to note that the movement of the drone was very slow and reached a speed of only 1.5 m/s.
We should not forget low frequencies, and in this case the simplest way would be for the authors to use a DAB-type passive radar/antenna together with the two-channel, PXI-based radio frequency signal analyzer (RFSA) [16]. In this case, at a carrier frequency of 189 MHz and a distance of up to 1.2 km, movement of the drone could be observed, but the data were not very reliable and separate software solutions were needed to perform the data analysis.
Low-cost mass production radars are of an increased interest for UAV detection. These radars usually are designed for maritime applications as surveillance radars. Radars implement different technologies such as pulsed, chirped (pulse compression), and frequency-modulated continuous-wave (FMCW) radar. Each technology has its own advantages and drawbacks. Experiments involving UAV detection by using Simrad 4G FMCW were presented in [17].
In this investigation, we will conduct research on two types of marine radar technologies. It was decided to choose the same manufacturer but different types of radars: FMCW and pulse compression. The reason to use both radars from one company is that SIMRAD© developed both pulse-compression and FMCW radars, and this allows radars to be identified as accurately as possible, as the technological and production bases of radars from other manufacturers would be completely different. There were several subjects of the study: a relatively small aircraft launched from the hands, the drone, as well as a Cessna plane and a paraglider flying near a private airfield. This work is continuation of the authors’ works [17,18] in which the authors used low-cost marine radars for the initial experiment to detect drones.
In the work, a comparison of two radar technologies and experimental setups is described. Furthermore, the calculation of the radar cross-section parameters of a small plane and a drone were measured and presented. The transmission power of the radar was experimentally evaluated and calculated, and UAV detection and tracking experiments were performed.
2. Technologies of Marine Radars
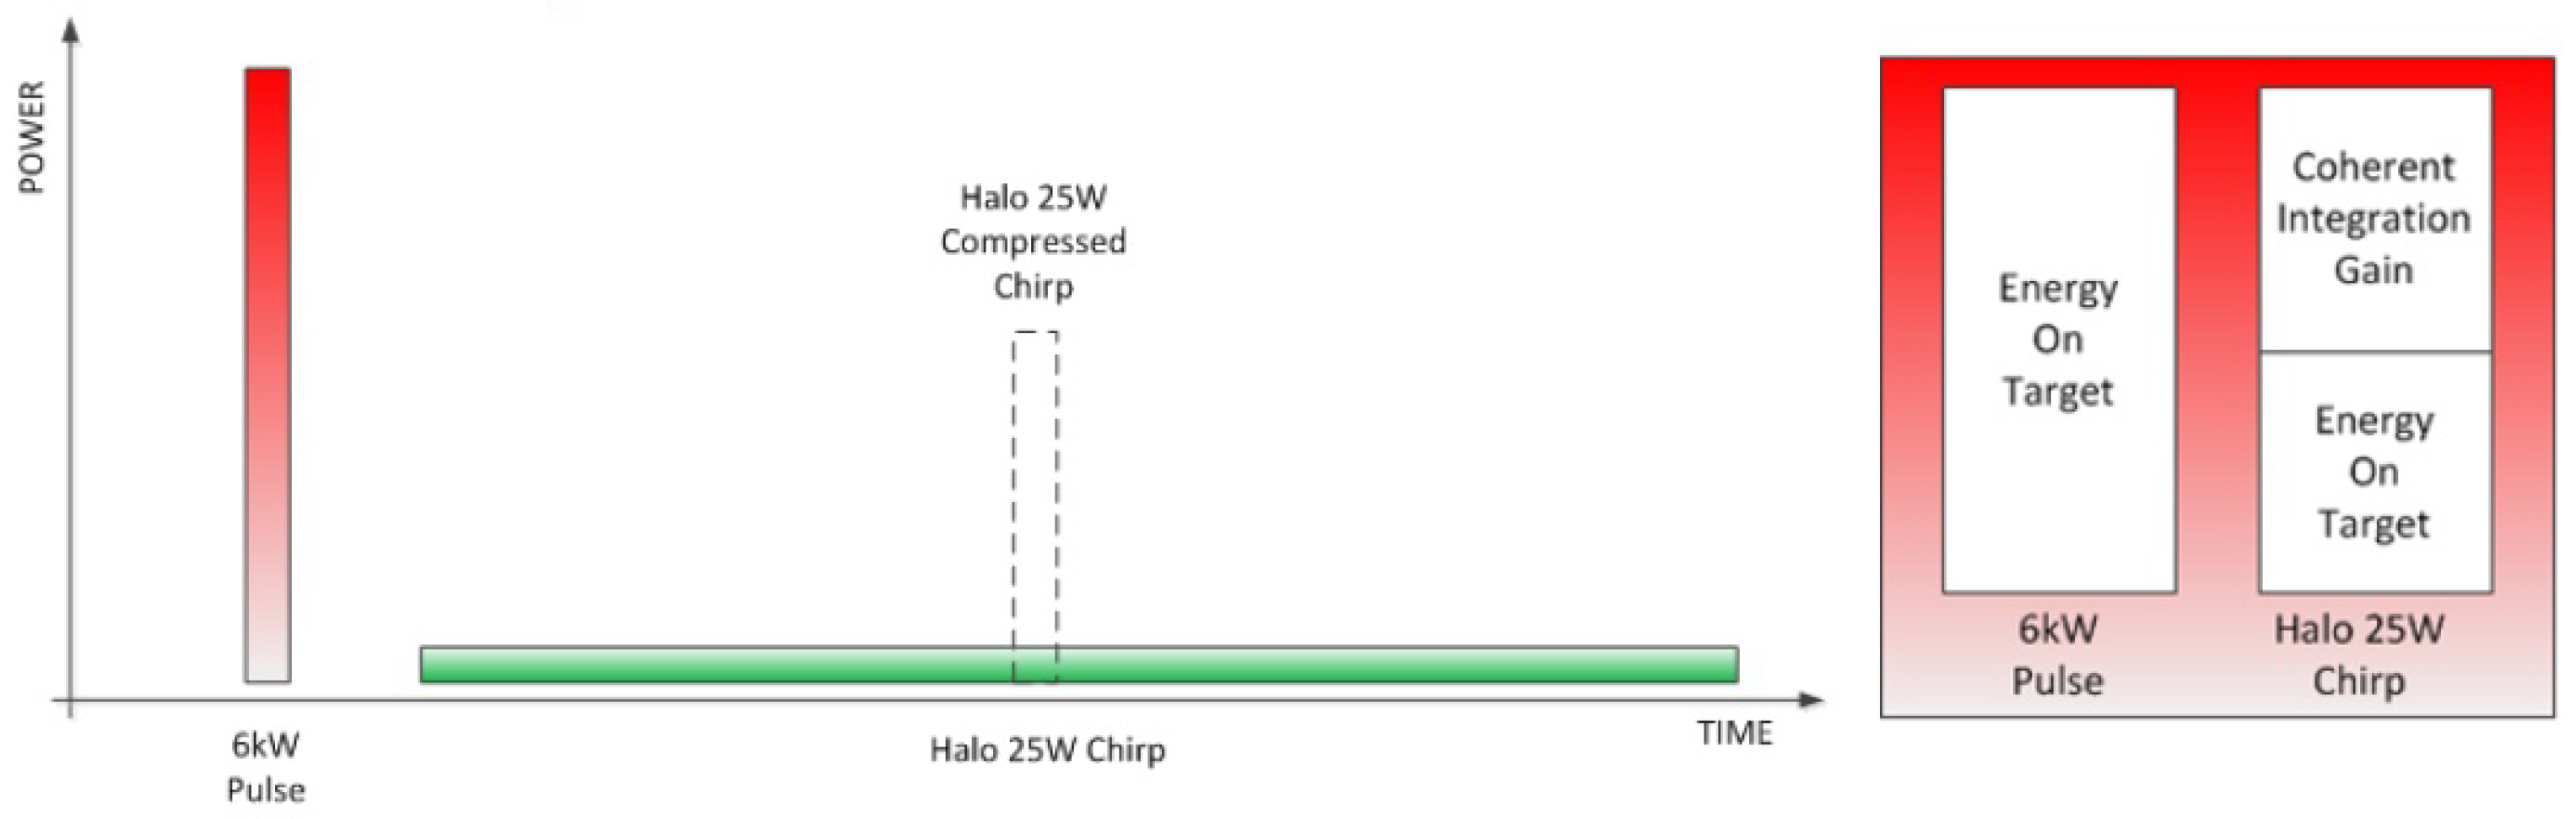
The most popular type of marine radar is currently, probably, pulsed radar. The source of the signal is a magnetron. Pulsed radar is not very stable and requires a warmup of a minute or more before operation. Usually, the power range is from 2 kW to 25 kW. These radars are effective in the long range but do not provide information in the short range. Magnetron technology has been continuously implemented. As a trend, solid-state technologies are becoming more popular now. Solid-state technology provides instant operation, close minimal range, lower power consumption, longer operational life, and higher safety. Two technologies are used now in solid-state radars—FMCW and pulse compression. Due to longer radiation time, maximal power can be decreased by hundreds of milliwatts in FMCW and tens of watts in pulse-compression radars. For example, the maximum power of Simrad Halo radar is only 25 W. According to the producer, it is approximately equal to a 6-kW magnetron radar [19]. Power can be reduced due to increasing chirped-pulse length and the possibility of coherent integration. Considerations are presented in Figure 1.
Chirp-compression technology provides blind zones in ranging because receiving is not possible during transmission in pulsed radars. The shorter is a chirped pulse, and a blind zone, but the shortening of the pulses leads to lower energy on the target and a shorter detection range. To solve these controversial requirements, chirp pulses of different lengths are radiated, and then the radar image is stitched. For detection at the closest of ranges, only very short pulses without chirps are radiated.
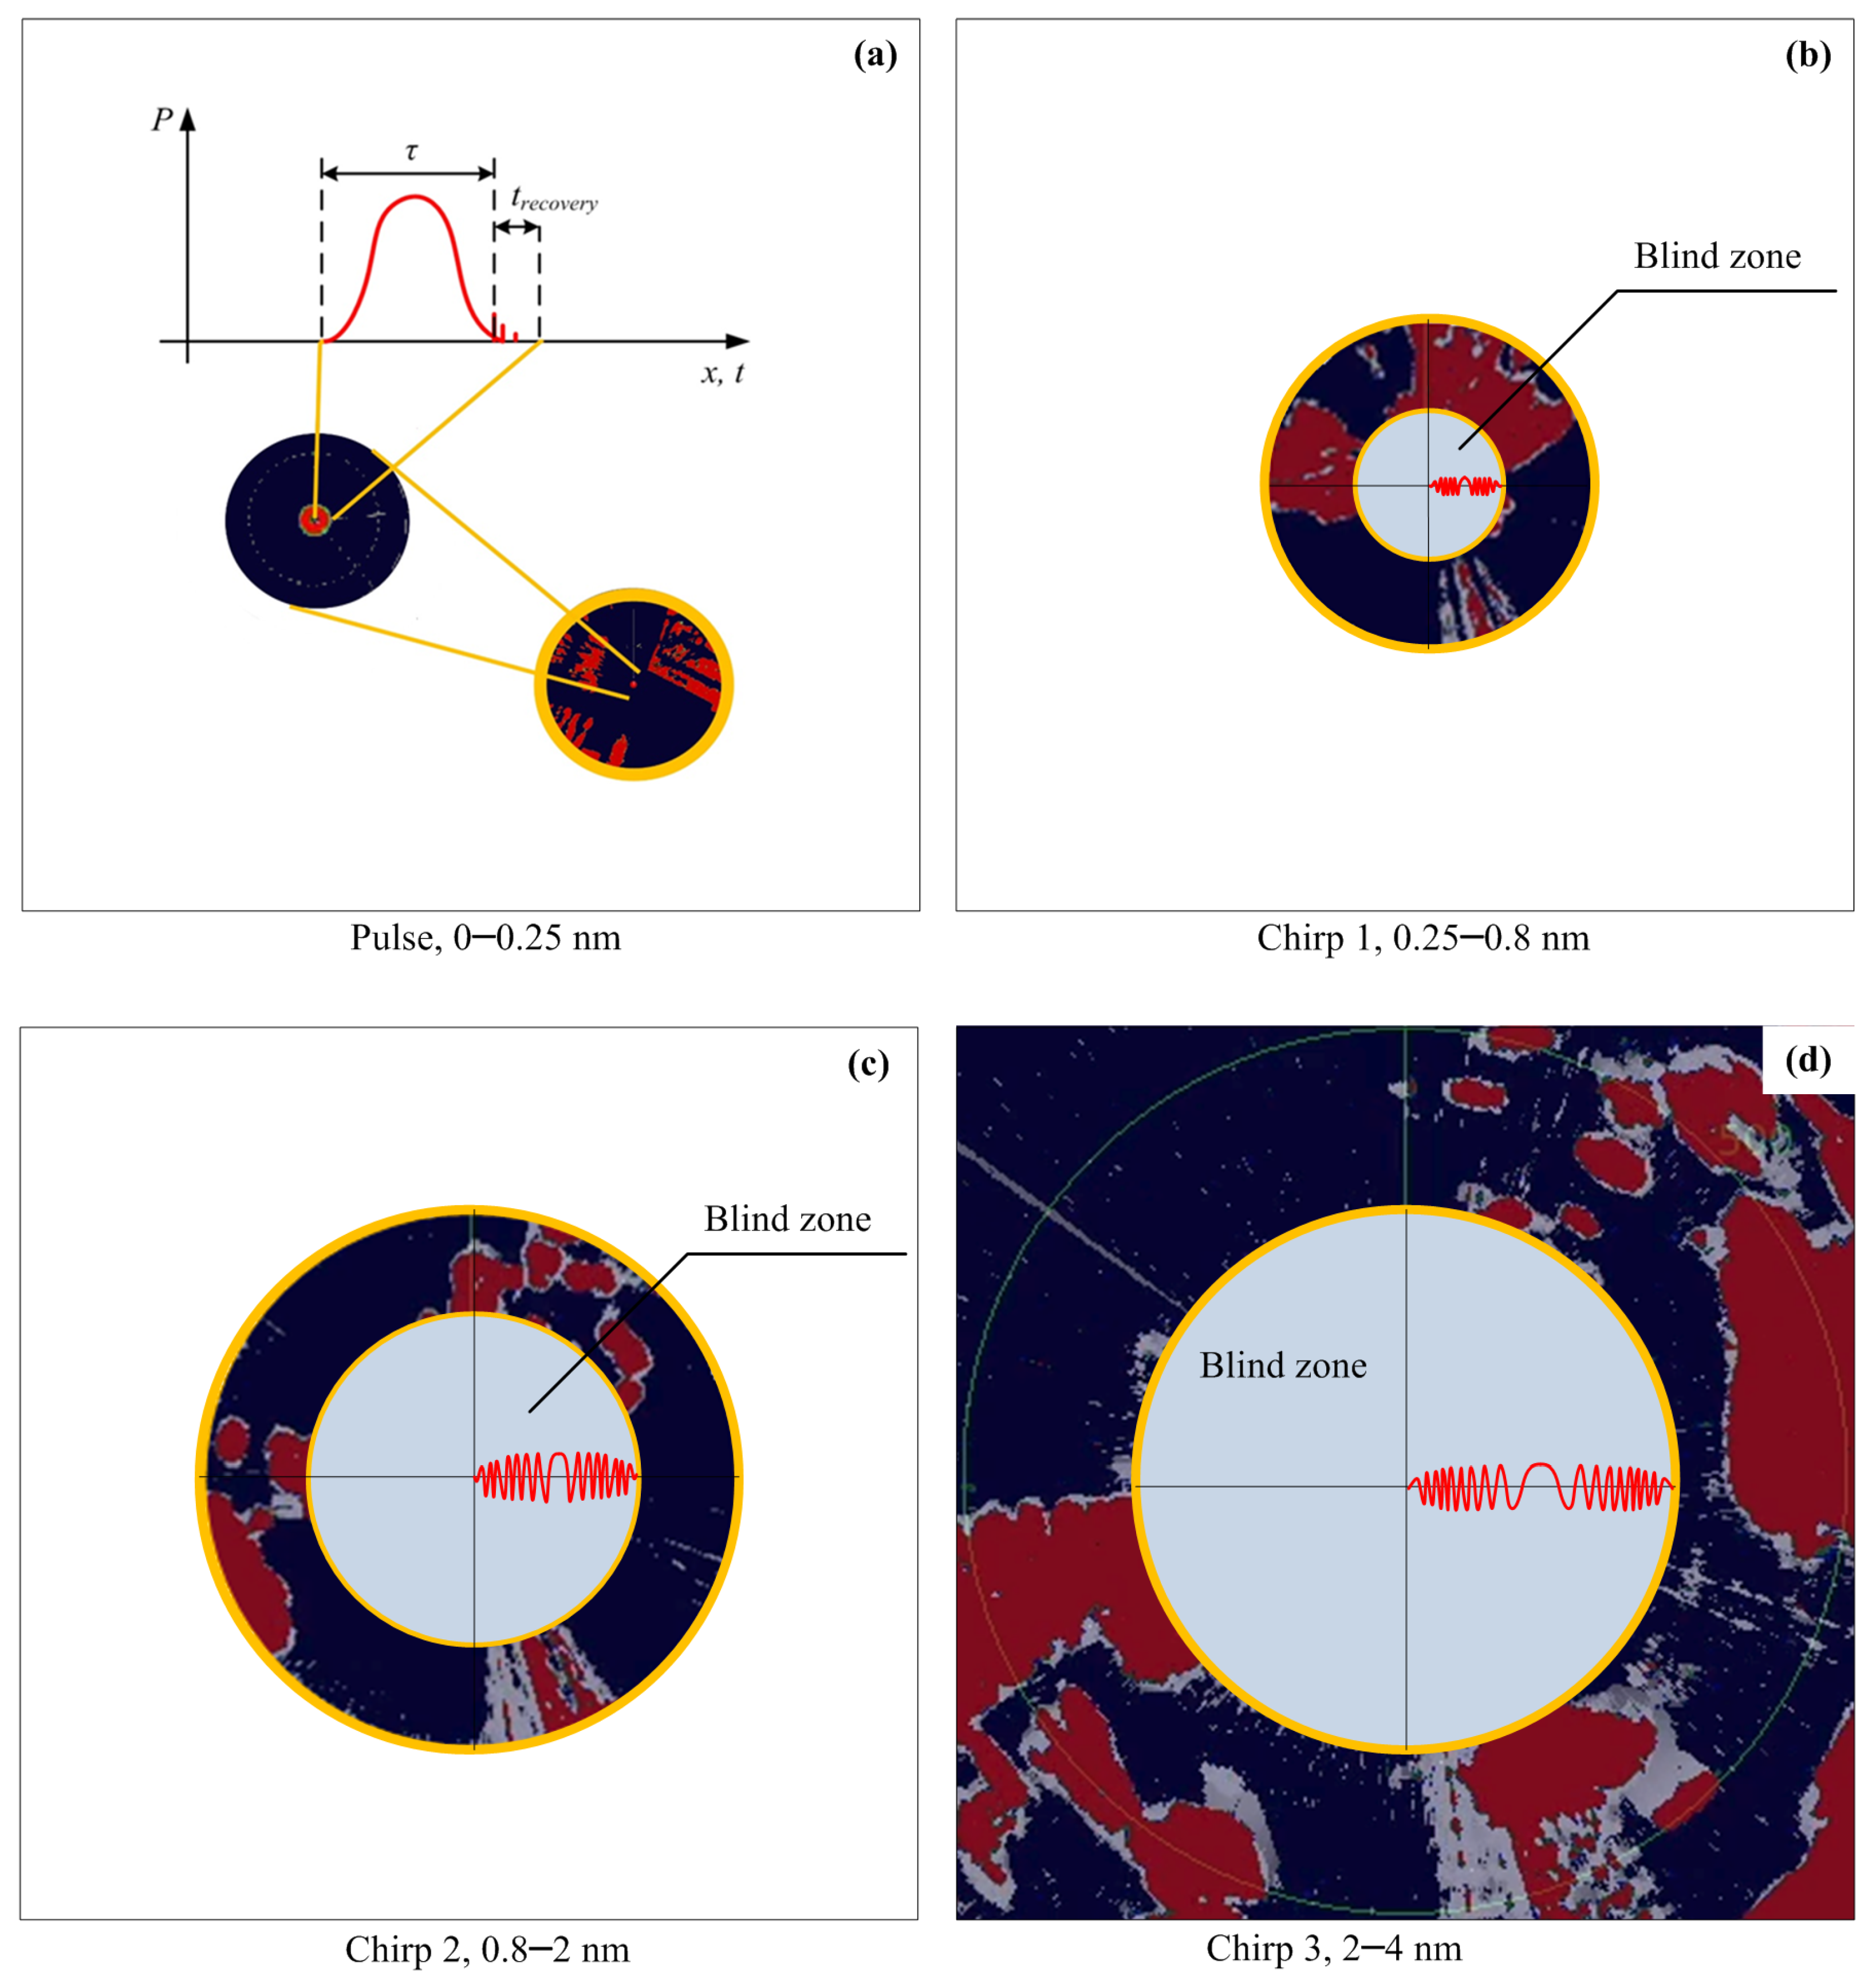
At the closest ranges, energy on target of the 25-W radar will be 240 times lower in comparison with 6-kW radar. In this case, only coherent integration gain of pulse compression radars remains an advantage over magnetron radars as shown in Figure 1. Small UAVs have very small RCS; thus detection even at the shortest ranges is difficult and requires investigation. Recently, not only FMCW but also pulse compression solid-state marine radars became available. In this contribution, we will compare three different solid-state radars with two different technologies as means of UAV detection. The radar signal stitching in Figure 2 is presented.
In Figure 2, the pulse-compression radar case is presented but not FMCW. There are no fundamental limitations (except low frequency noise) in the “blind range” for FMCW radars, because the transmitter and receiver operate simultaneously. In the case of pulsed radar (including pulse compression), the minimal measuring range (“blind range” or “main bang”) depends on the transmitting time and the recovery time of receiver :
where is the transmitting time, and is the recovery time of receiver.
In the case of pulse-compression radar, when pulses are long, the time is very short and can be ignored. At the shortest range (Figure 2a), the radar operates in the simple pulse mode.
Basically, Figure 2 helps us to understand differences and similarities of pulse-compression radar with pulse and FMCW radars and explains noise “rings” in the radar plots. Stitching edges are seen in the radar plot charts (see Figures 8b and 9b) as outer edges of noisy areas.
3. Experimental Setup
We have chosen Simrad radars. Only this producer provides low-cost marine radars of two different solid-state technologies—FMCW and pulse compression. In addition, two different types of implementation of pulse-compression radars were available. Despite output, the power of both pulse-compression radars is the same; the inner implementation is very different. Stitching ranges also are different. The width of 4G and Halo20+ antenna is almost the same; thus different technologies can be compared directly. The Halo3 antenna is almost twice wider than that of Halo20+, and the gain is twice as high. We can estimate an increase in the detection range due to the antenna, according to the radar equation as presented in the Table 1.
where is the maximum radar range, is the transmitted power (W), G is the antenna gain, is the wavelength (m), is the radar cross-section (m), and is the received power (W).
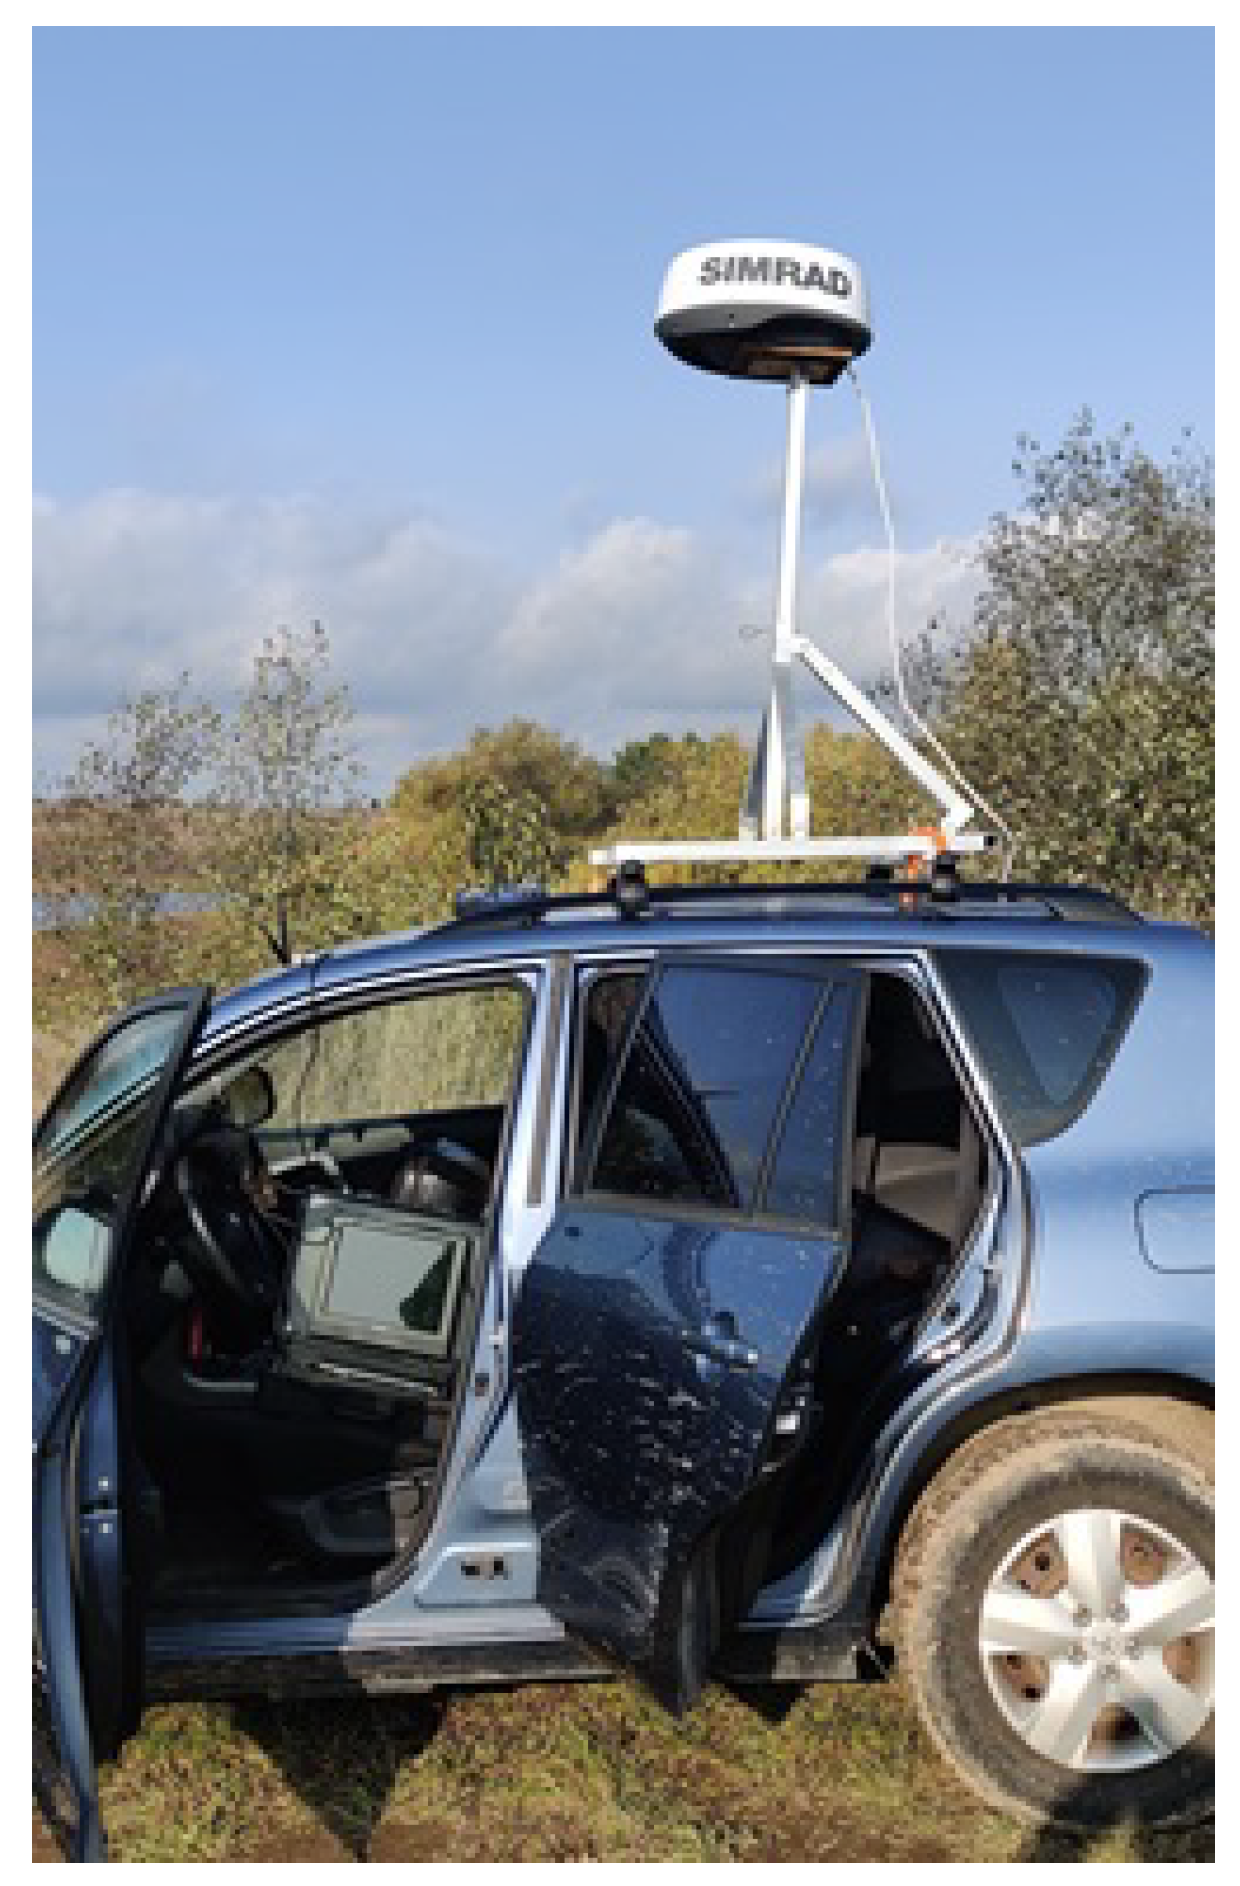
Open CPN software supports Simrad solid-state radars. It was another reason to choose Simrad radars for experiments. Radars were mounted on the top of the car and additionally lifted to 1 m in height as presented in Figure 3. By using this software, we can get access to filtered radar and uncalibrated data for chart plotting. This data can be used for further image processing to make target detection more reliable.
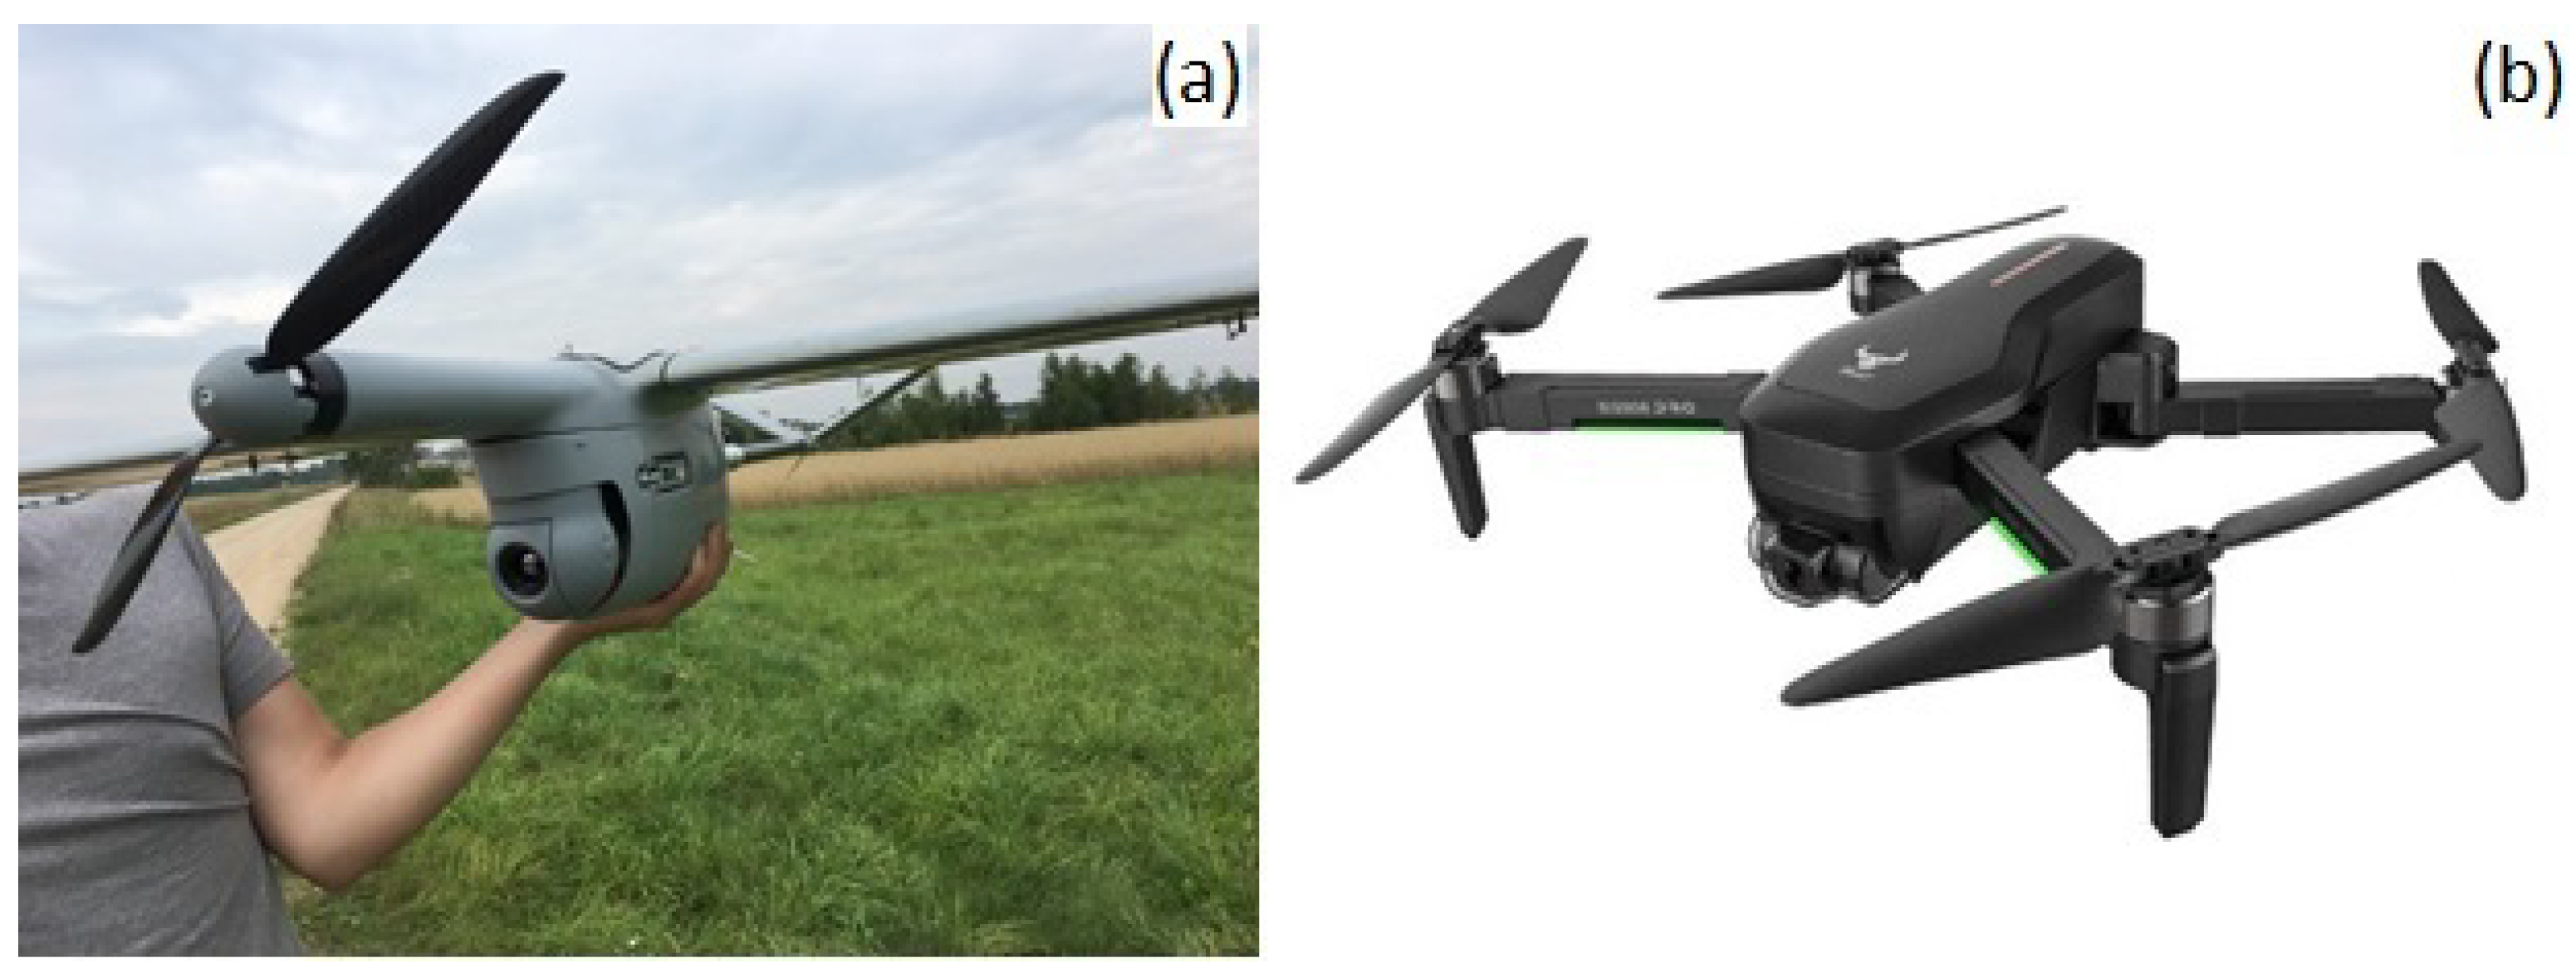
Two types of small UAVs as targets were used in the experiment—the custom-made fixed-wing UAV Buzzard Figure 4a, and the rotary-wing, mass-produced quadcopter SGH906 Figure 4b.
The fixed-wing UAV “Buzzard” is a fully composite reconnaissance, electrically powered unmanned vehicle. The airframe of the aircraft is manufactured of glass-fiber epoxy composite, with the normal number of layers of 3–6 (depending on the parts of the structure) 80 g/sq.m. glass-fiber. The fuselage has the glass-fiber composite shell with the inner structure supported by the polyester foam and plywood structures. The wings and tail surfaces are glass-fiber sandwich structures with implementation of carbon-fiber tubes as the wing spar components. The electrical brushless motor is powered by a Li-Io battery which is placed in the fuselage of the aircraft (thus corresponding to a great portion of radio reflection). The main non-radio-transparent components of the aircraft are the battery, motor, carbon-fiber tubes of the spars, and tail section. The Buzzard UAV has a wingspan of 1.8 m, mass of up to 4 kg, cruise speed of 16 m/s. It is fully automated, with telemetry control radio link working on 868 MHz frequency.
The second vehicle tested was the mass-produced quadcopter SGH906 which is a low-cost multirotor solution with very basic functions. The multirotor is made of plastics with the main non-radio transparent parts being the battery, the motors, and control equipment.
4. Results
4.1. Radar Cross-Section Measurements
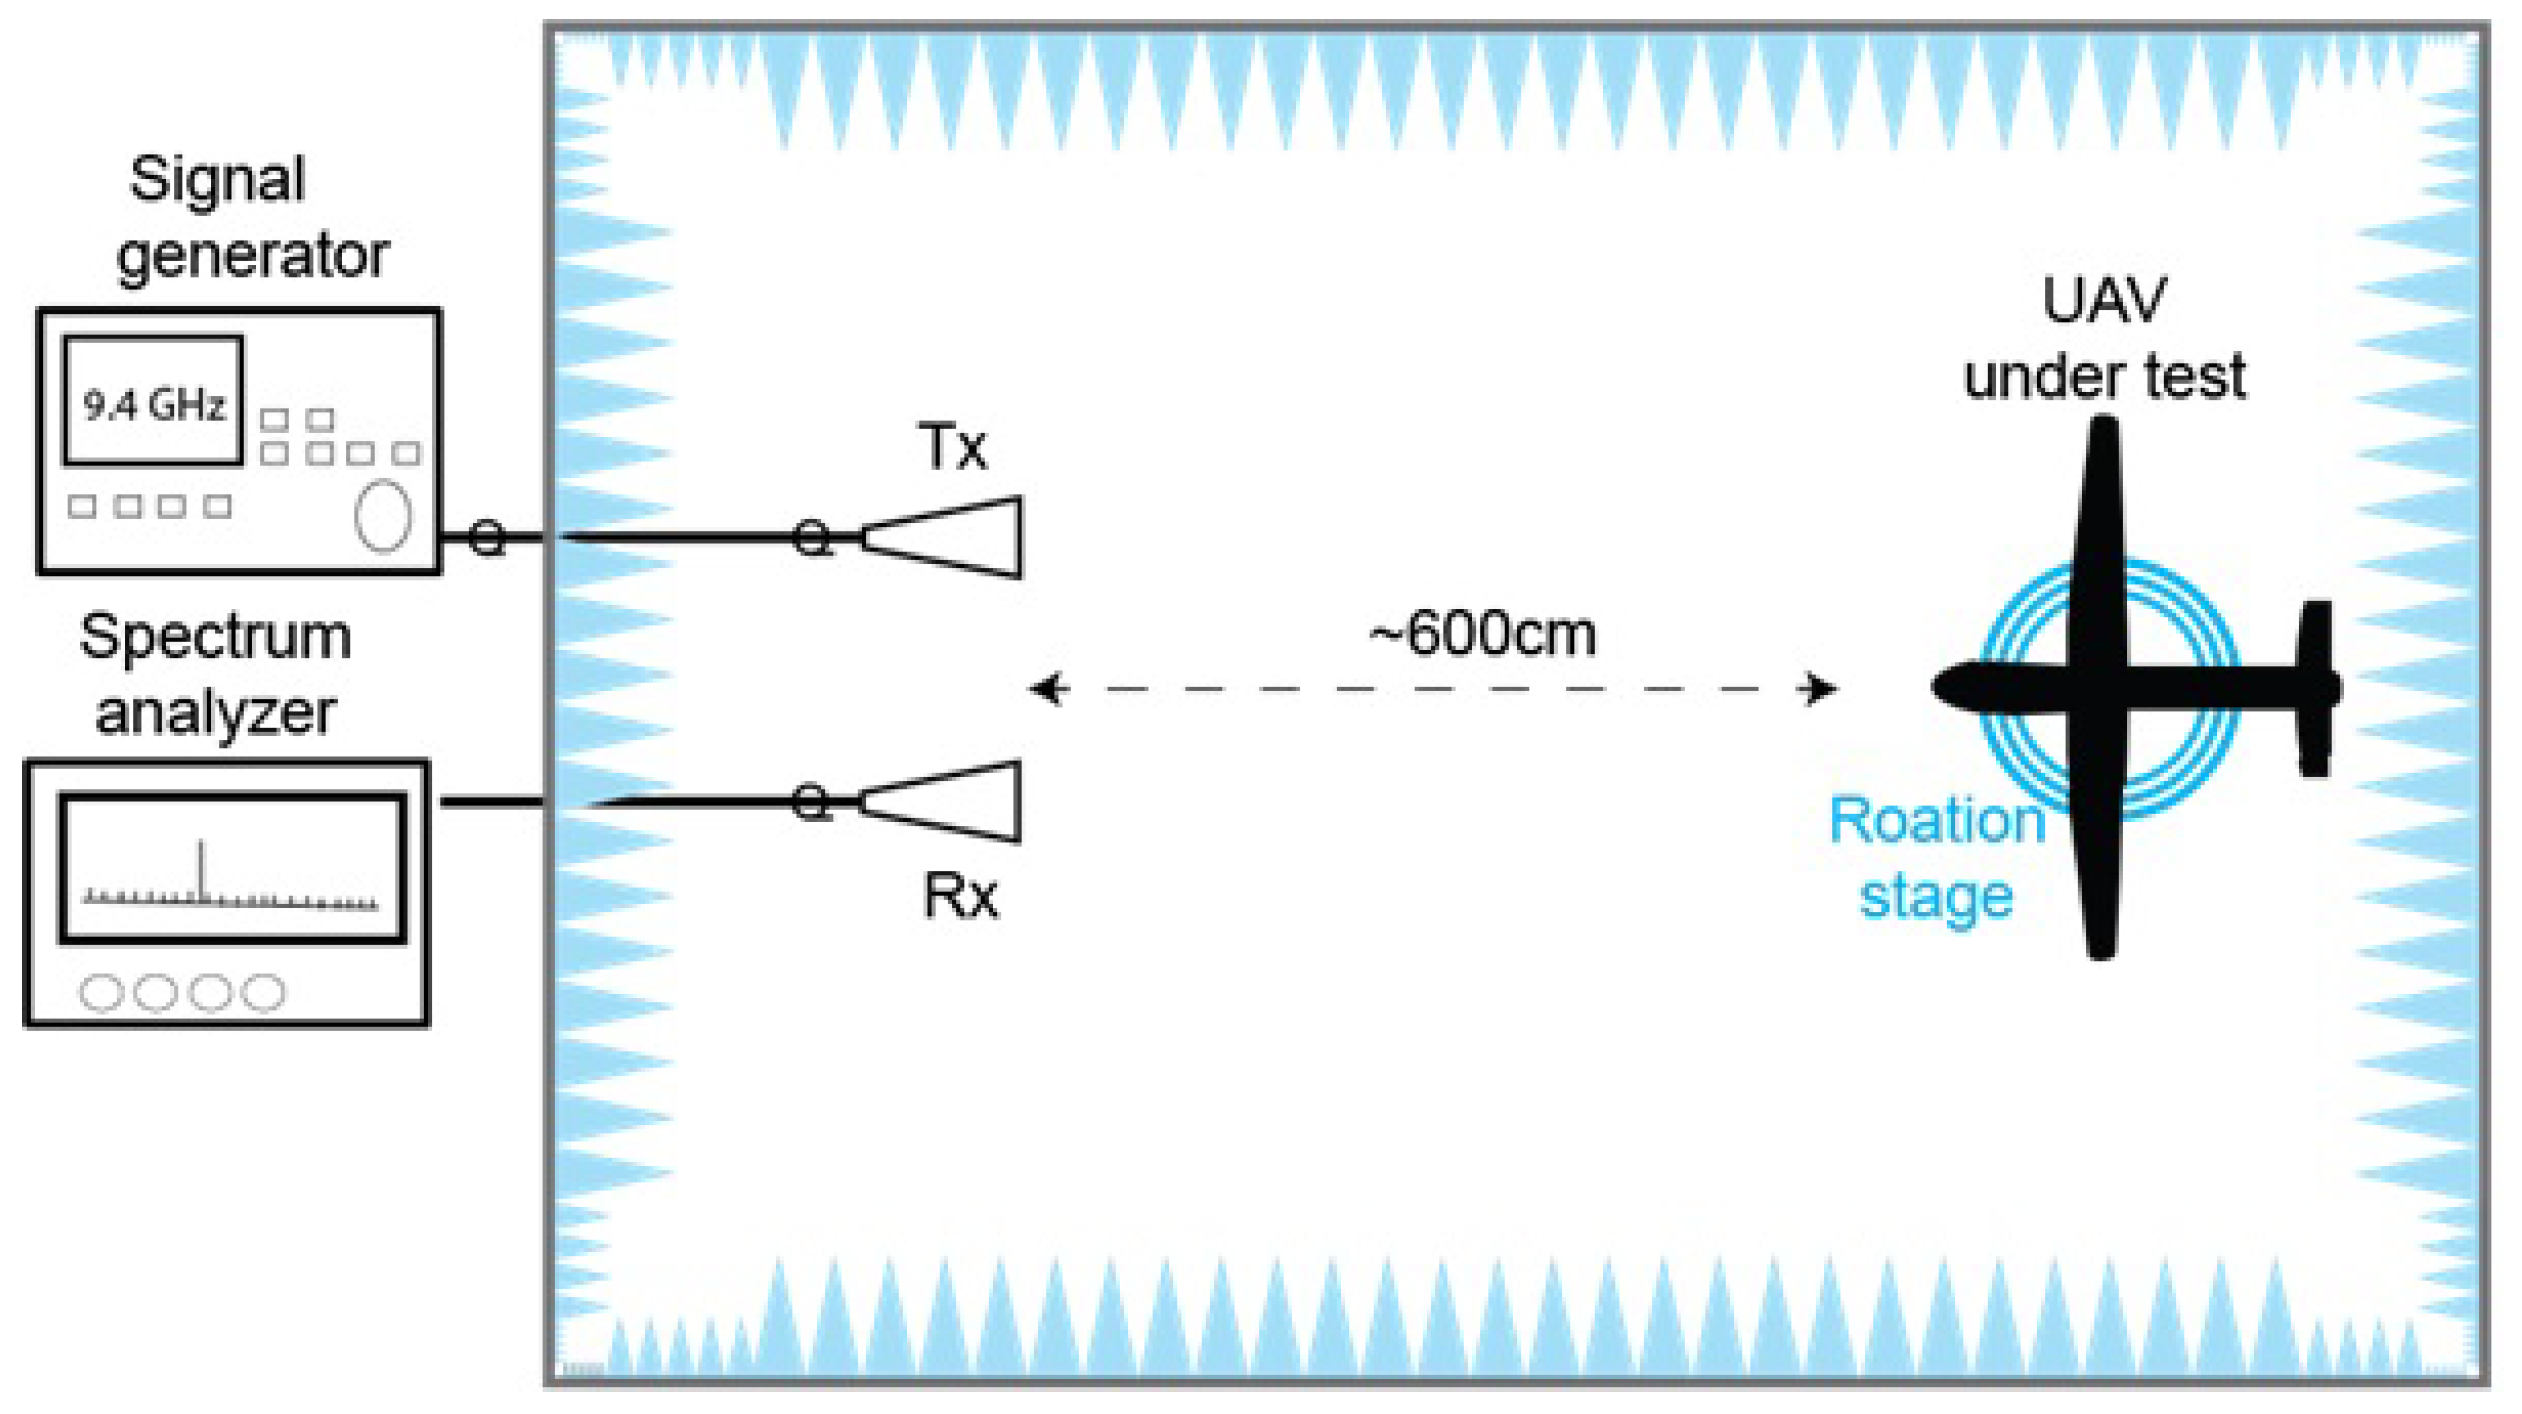
For preliminary estimation of the radar’s detection range, radar cross-section (RCS) measurements of the DJI Phantom drone were performed in fully anechoic chamber. Dimensions of the chamber are 8.4 m × 4.6 m × 3.7 m. Measurement setup is shown in Figure 5.
The transmitting and receiving horn antennas were placed approximately 6 m from the UAV under test. In order to reduce the cross talk between both antennas, the receiving antenna was placed 50 cm away from the transmitting one, and some absorbers were placed between them. To ensure high sensitivity, and repeatability of the measurements the UAV was located at the furthest distance from the antennas. In the case of the small UAV, this distance was sufficient to satisfy the far field condition. For the bigger UAV (Buzzard), the far field condition was not fully satisfied. The drone was placed on the rotational table and RCS’s values were measured by rotating the sample by 1. In order to measure RCS dependence on the tilt of the UAV, the whole rotation table was tilted. During the measurements, the tilt angle was change from to .
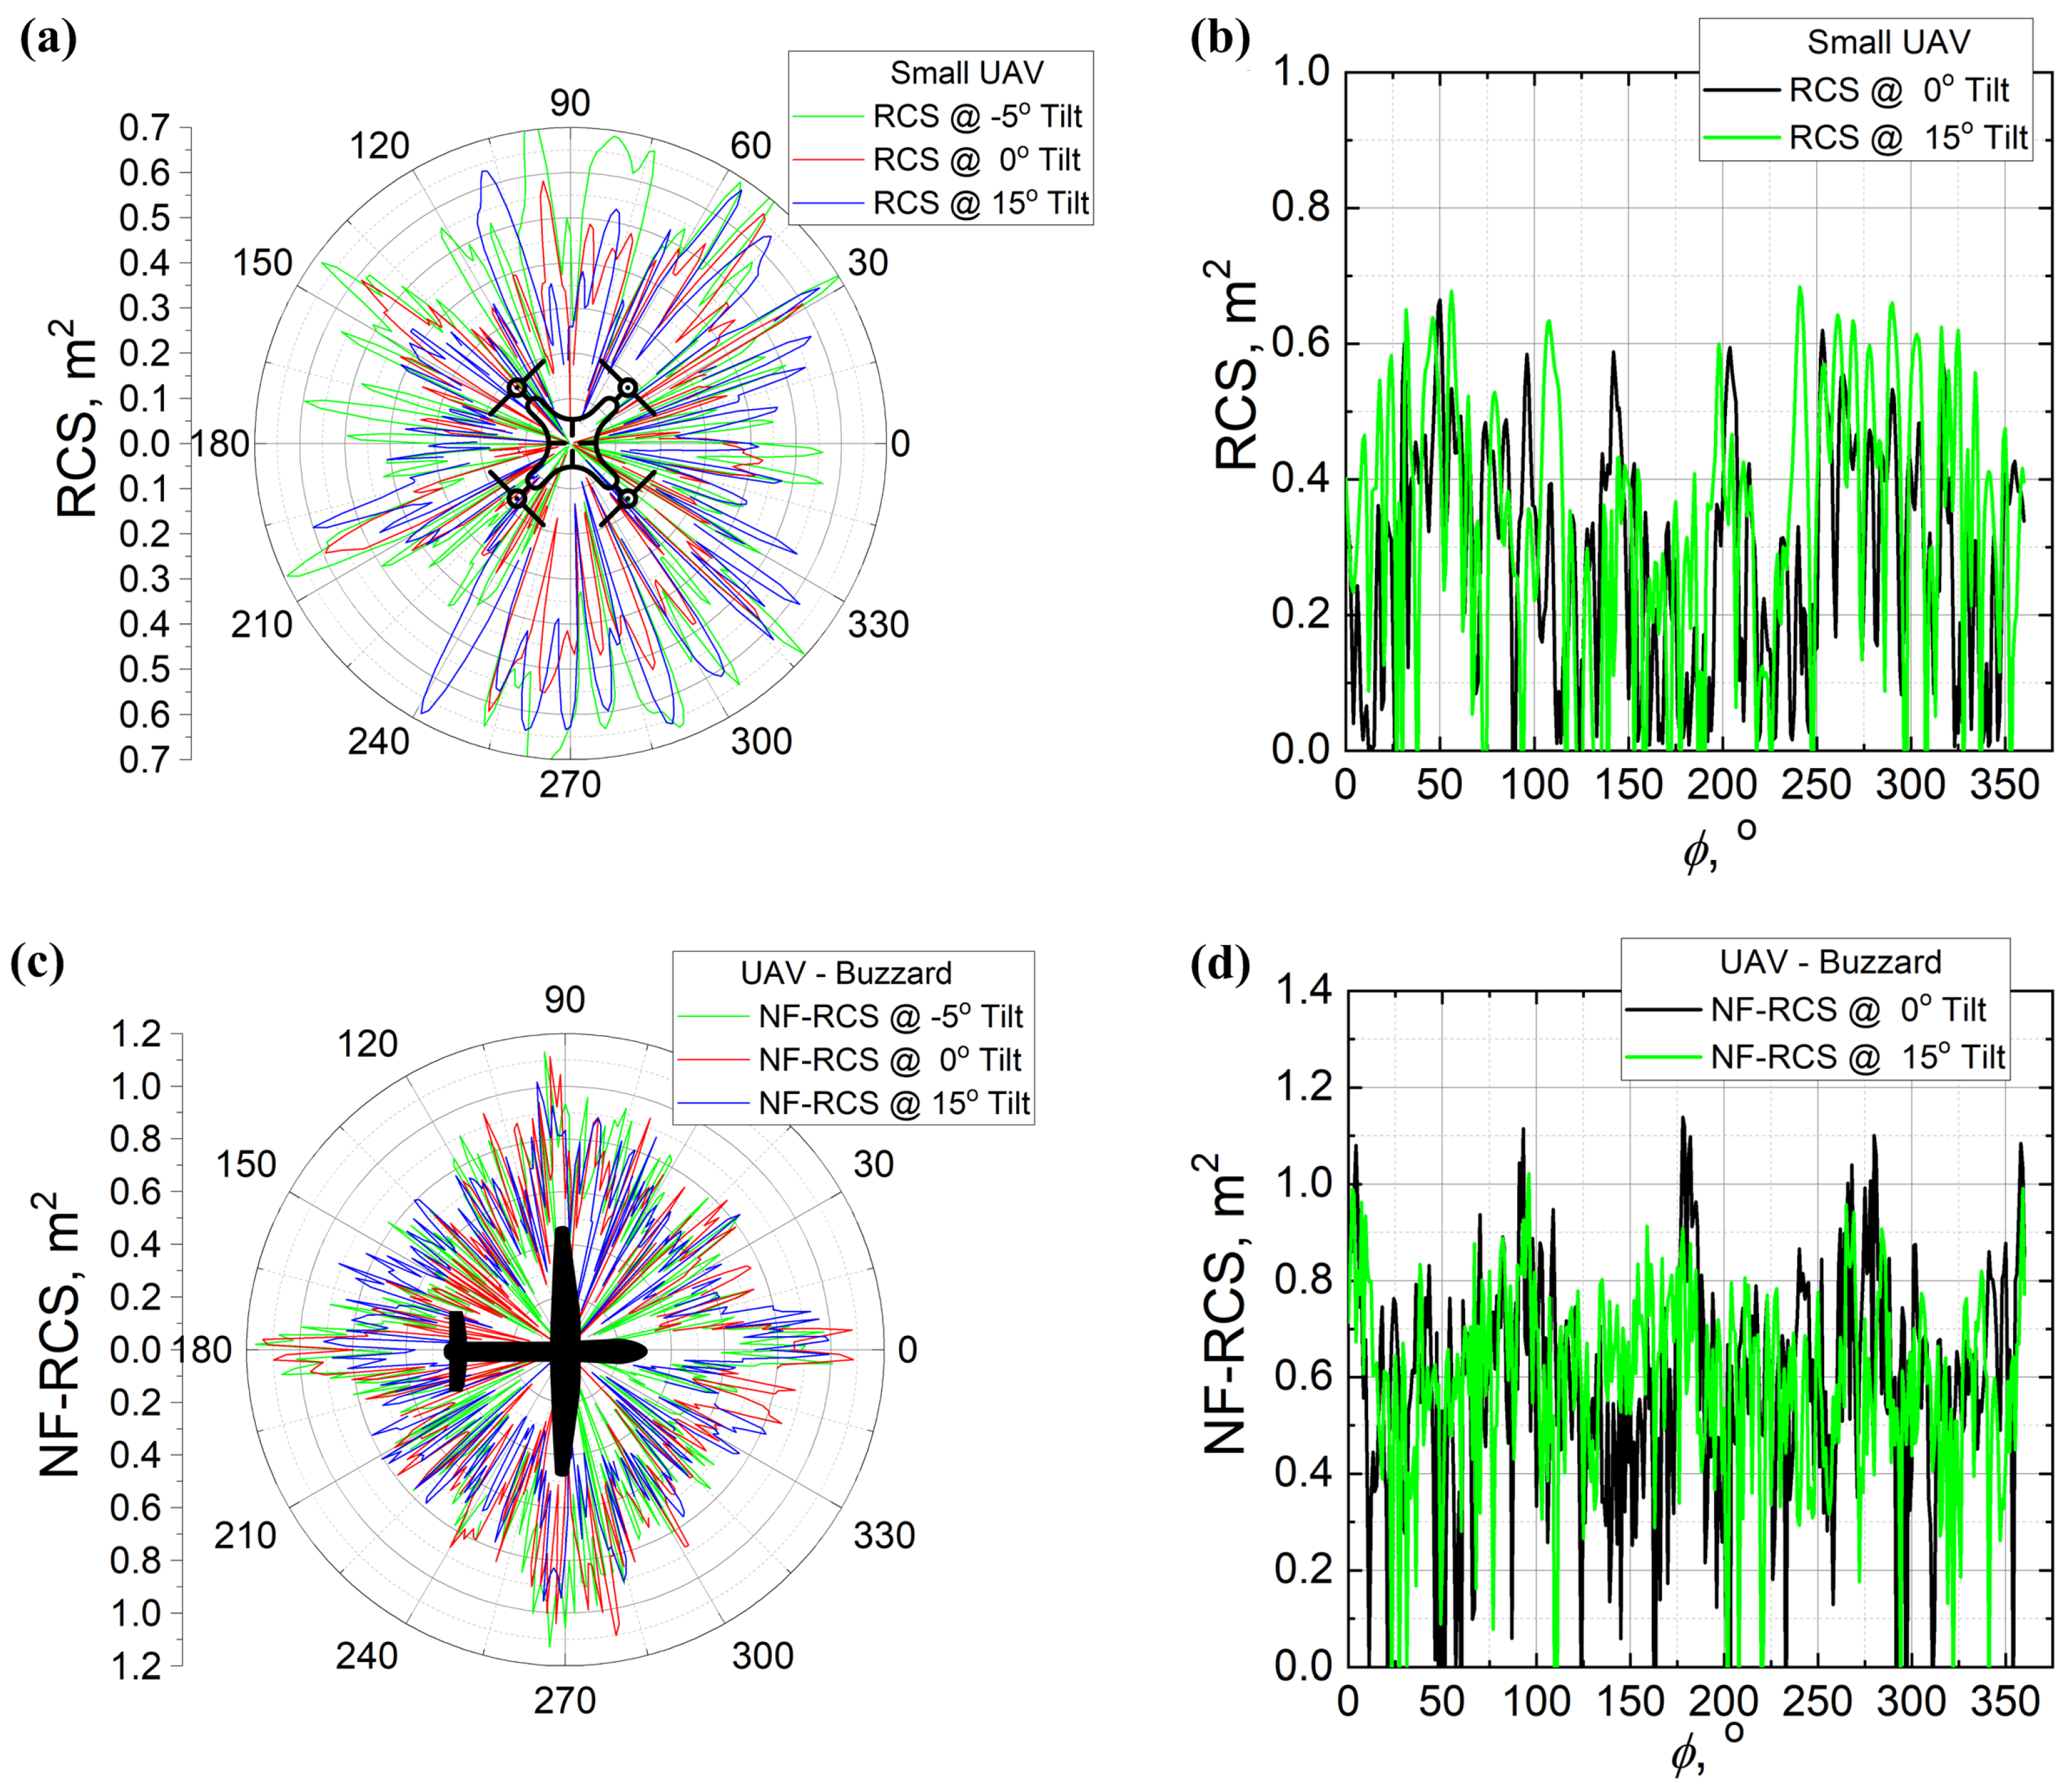
Radar cross-section measurements of UAVs are shown in Figure 6. In Figure 6a, the RCS of a small UAV is shown in polar plane, and Figure 6b shows it in phase plane. The different tilt angles are represented by different colors. From the figure we can see that the RCS of the small UAV reaches up to 0.7 . Moreover, according to the figure there is no visible tendency of RCS change due to tilt angle. On the other hand, the near-field RCS of the large Buzzard UAV (see Figure 6c,d) has some characteristics of an RCS plot. The clear RCS maximums can be distinguished at angles of 0, 90, 180, and 270 degrees. These angles represents the nose, wings, and the tail of the UAV. The near-field RCS of the UAV at these reaches 1.2 . In addition, from this figure we can see some obvious changes of near-field RCS due to tilt angle. Although tilt angles vary from to , only small changes in near-field RCS can be observed. However, when the tilt angle reaches , the decrease in near-field RCS is obvious from 1.2 to 0.8 or even lower.
4.2. Performance Estimation
One of the goals of this contribution is to compare different solid-state radar technologies. Due to unknown sensitivity of the radars’ receivers, it is not possible to calculate the detection range for a given RCS. Despite this problem, we can compare two different technologies. Both FMCW and pulse compression can perform a coherent integration of signals. Both are using chirped signals. Corresponding to these similarities, we can make the assumption that the sensitivity or detection ability of different solid-state radars is approximately the same for given energy on a target. Energy on a target is proportional to the average power. The average power of FMCW radar is almost the same as the output power. The average power of pulsed radar is
where is the peak power, is the duration of the pulse, and T is the pulse-repetition period.
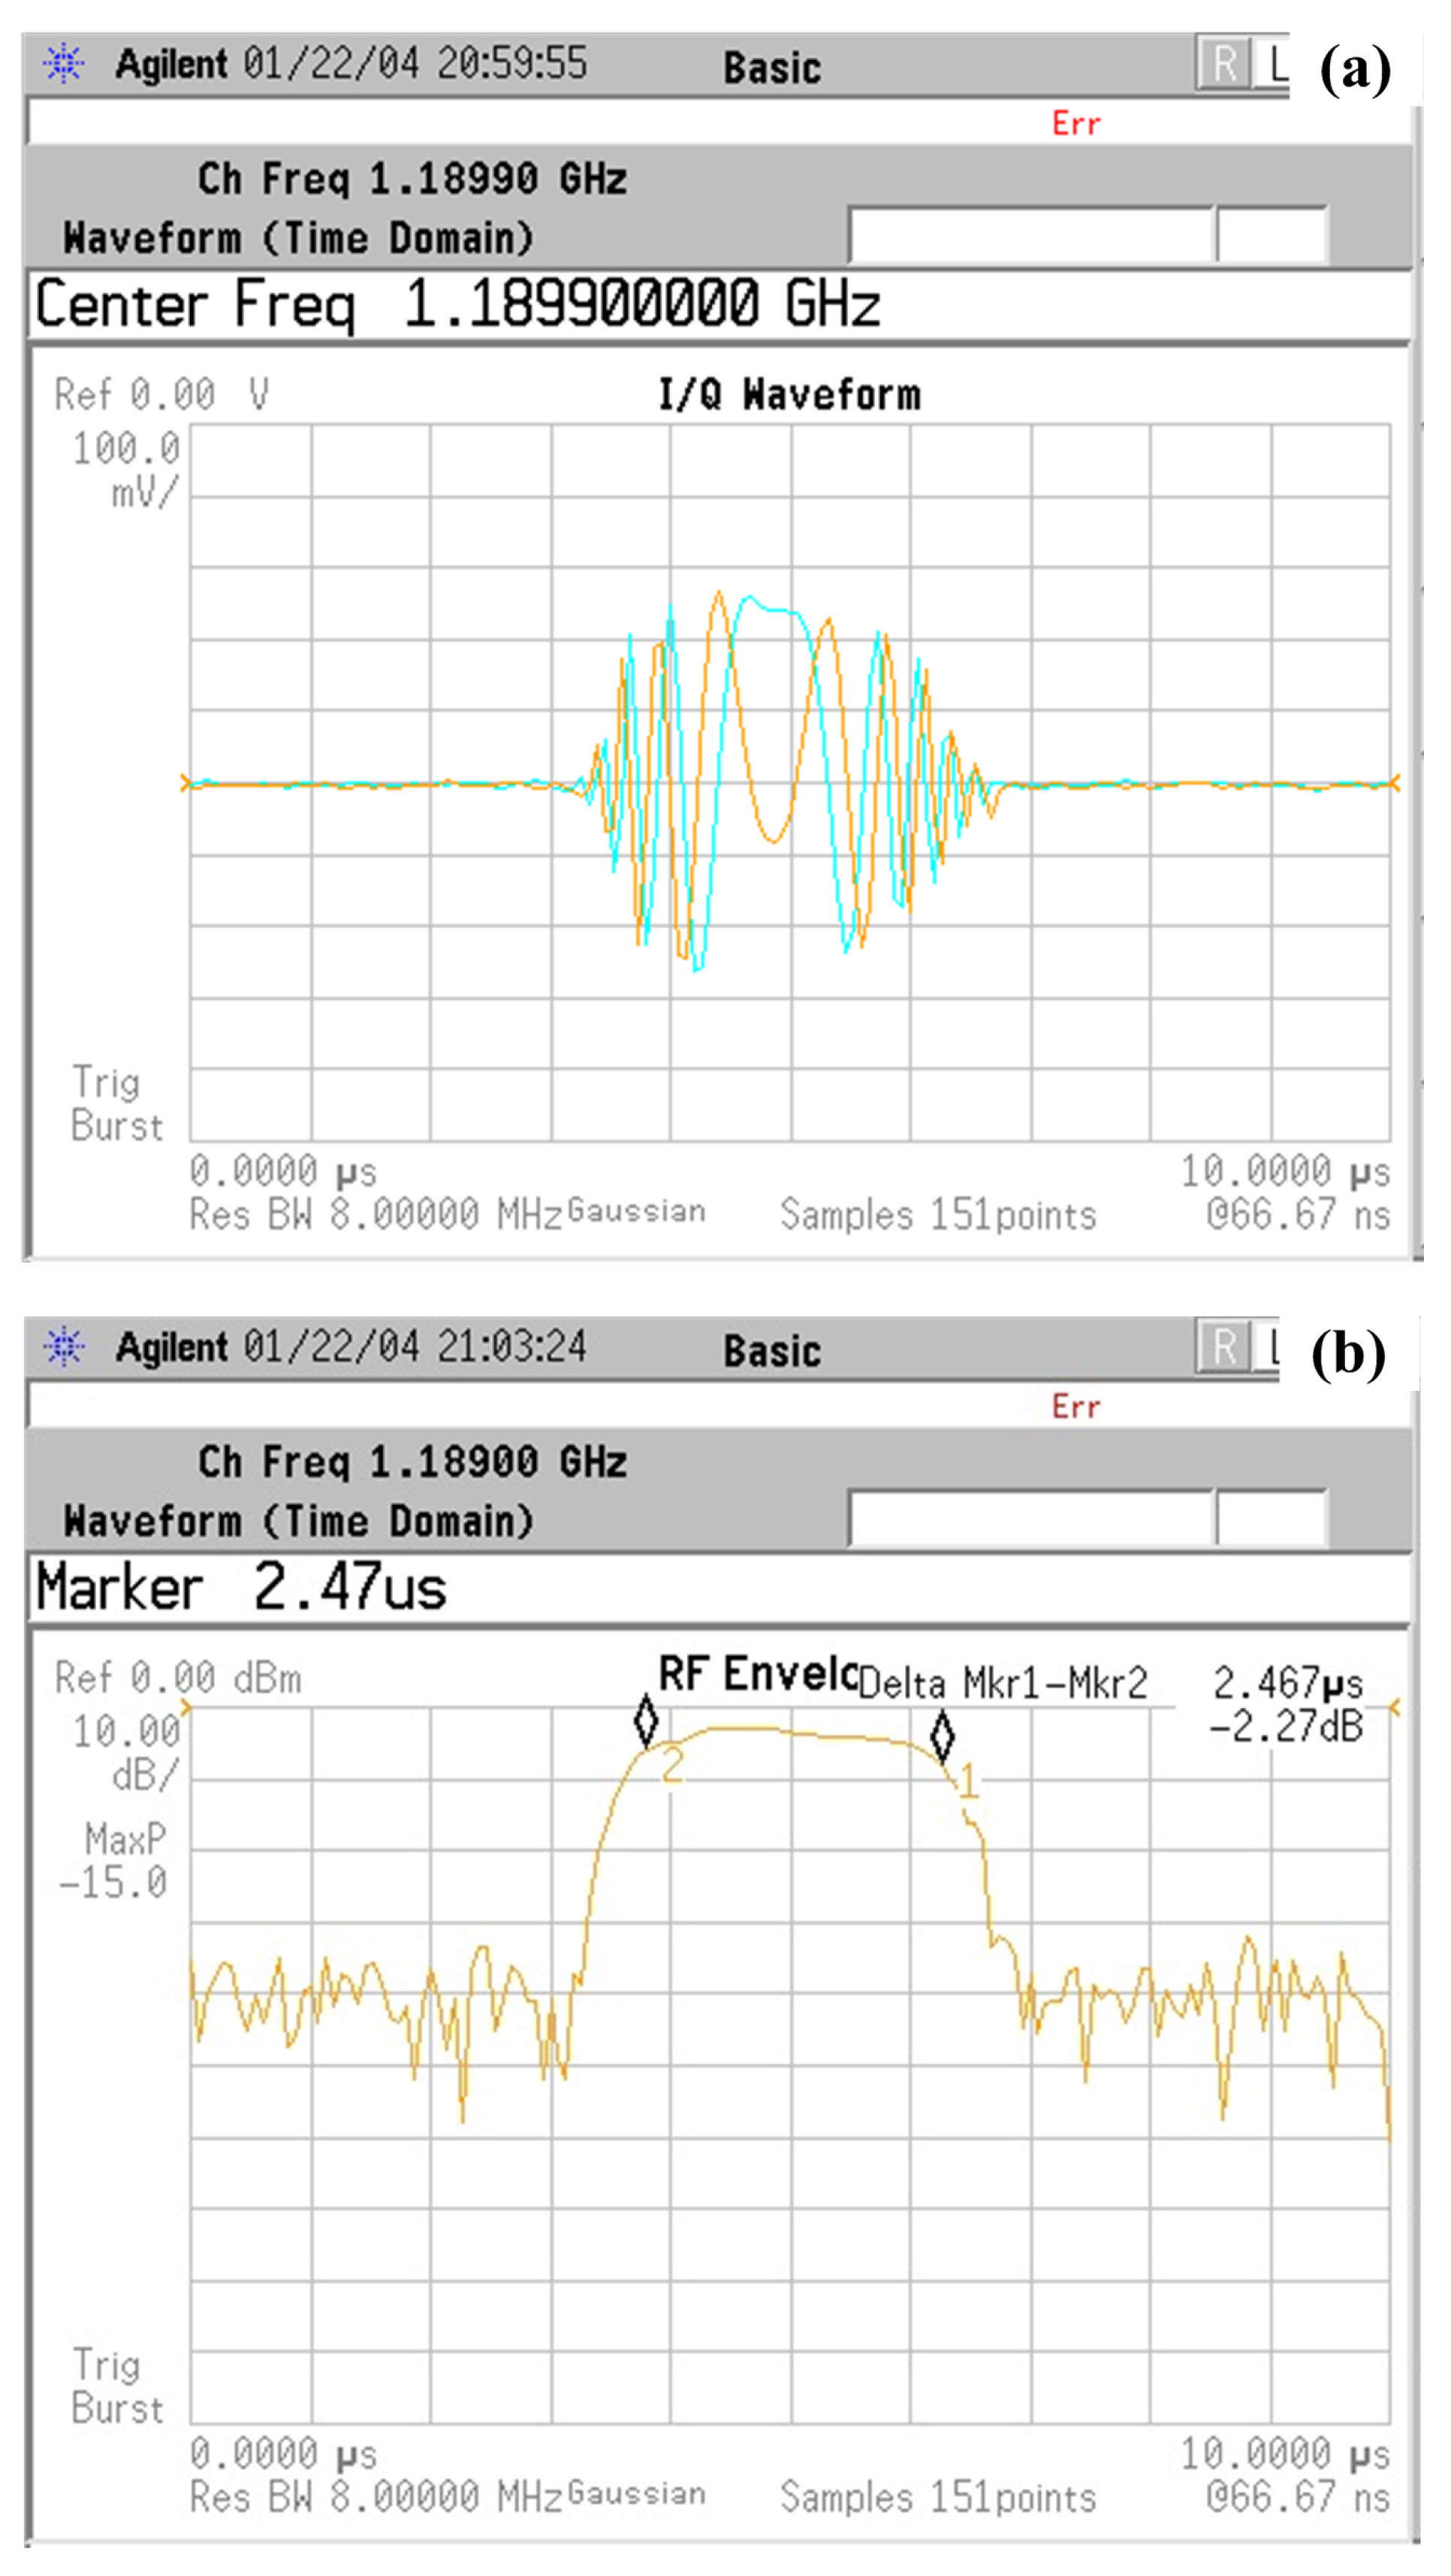
Depending on the range of view, radar emits pulses of different duration and different periods. For example, up to the detection range of 840 m, HALO3 radar in harbor mode uses a non-chirped pulse = 40 ns, and from 840 m to 1.8 km it uses a chirped pulse = 2.3 μs (Figure 7). From 1.8 km to 3.35 km, it uses a chirped pulse = 5.4 μs. When the viewing range is set up to 3 km, the period is = 700 μs.
It is possible to estimate frequency deviation of the chirped signal. The oscillation period at the edges of the signal is approximately 200 ns. It can be interpreted as “beat” frequency with central frequency. Thus, frequency deviation of the chirp is ±5 MHz.
The dependence of average power of Halo3 radar, when is 25 W on viewing range, is calculated by (3) and presented in Table 2.
According to Table 2, 4G radar (average power is 0.3 W) should outperform pulse-compression radars by up to 3.35 km. Energy on target depends not only on average power but also on exposure time. If the viewing range is longer, it means that the antenna rotation should be slower and exposure time will be longer too. All tested radars are using this strategy; thus antenna rotation was not taken into consideration.
4.3. Range Measurements
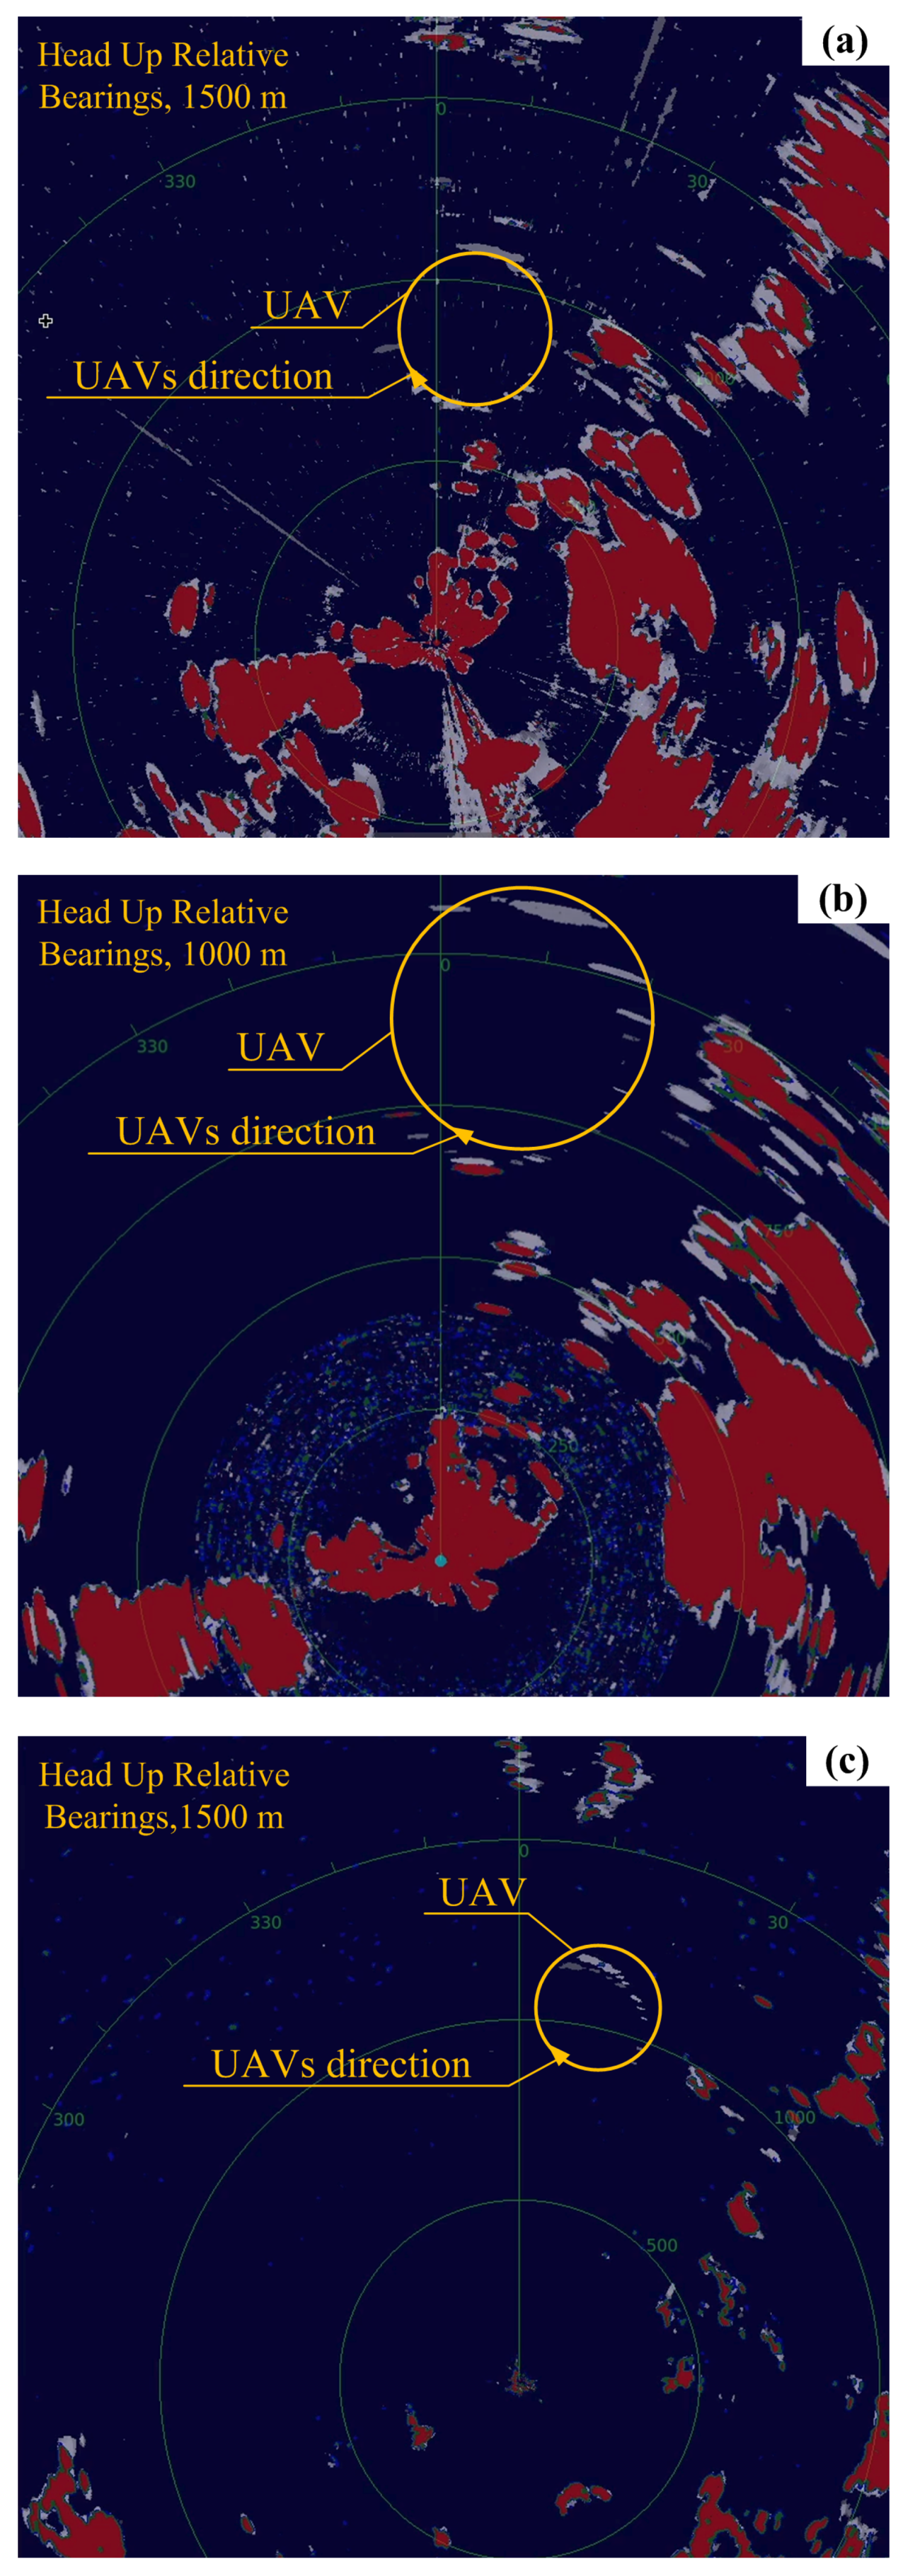
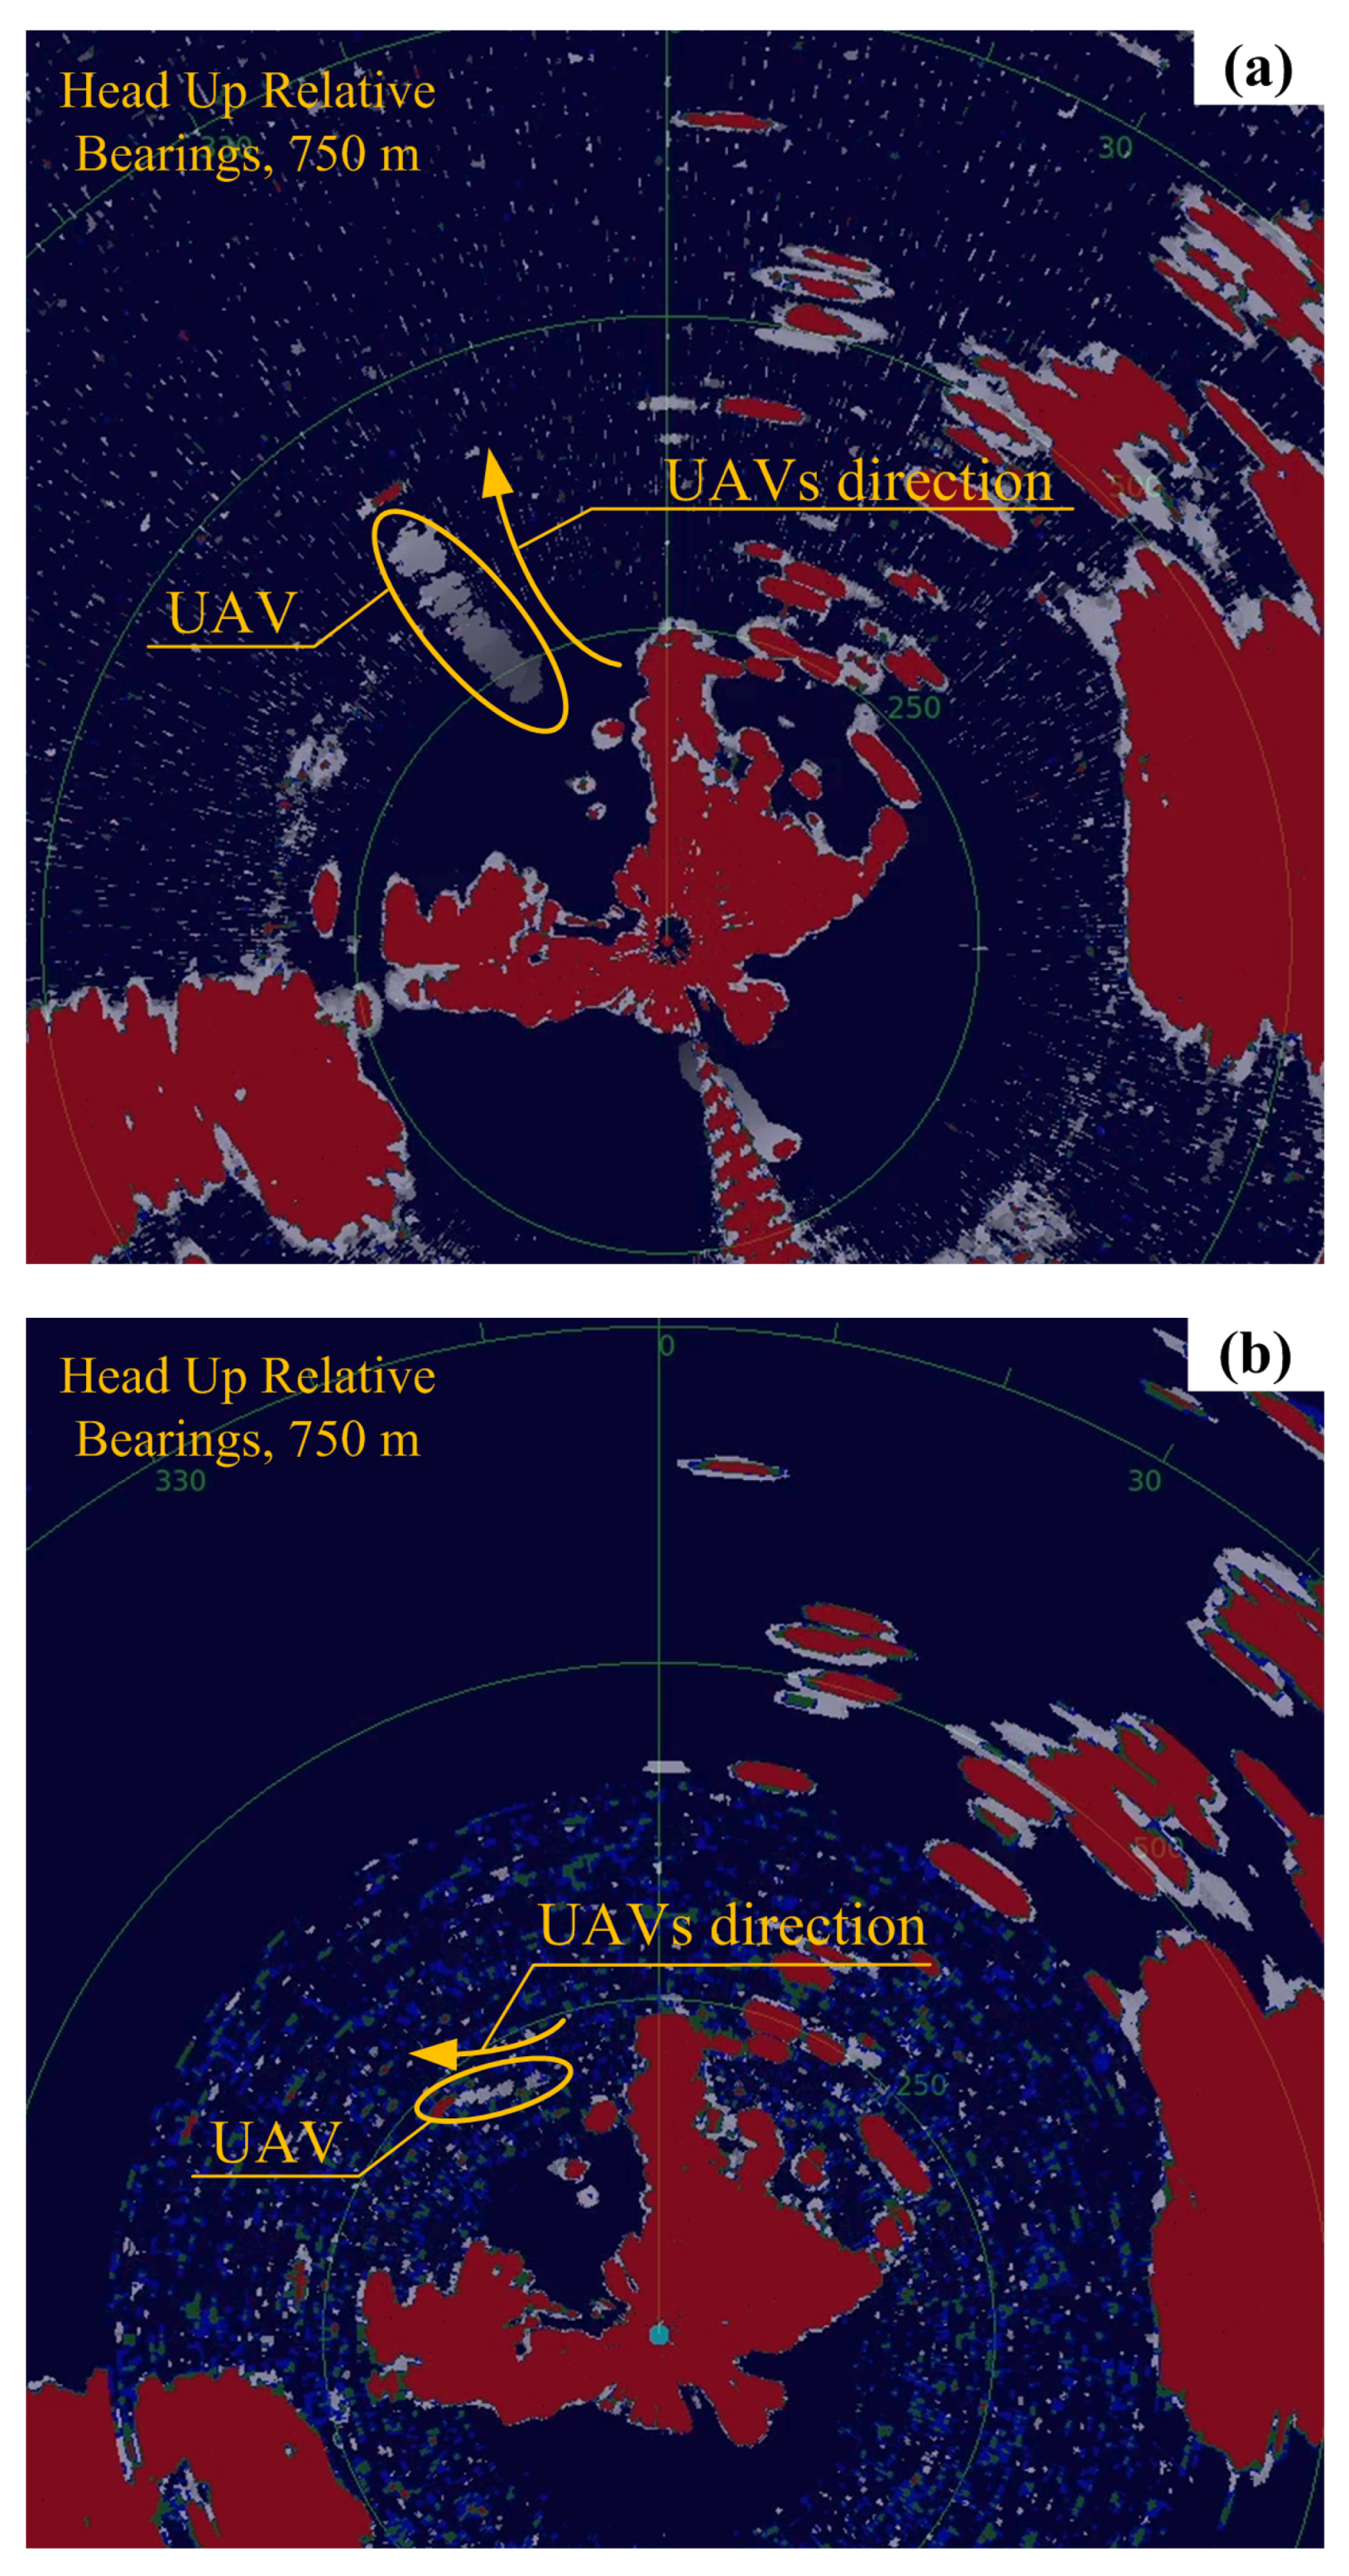
To reduce clutter, measurements were performed behind a small hill. In Figure 8 detection of fixed-wing UAV is presented. The UAV flies in a circular trajectory around the desired point at the distance of 1 km and bearing of . The visualization of points of a track was switched on. White dots are memorized tracking points. The gain of radars’ receivers was set to provide an approximately equal noise background due to the very irregular RCS of UAV (Figure 9), track of flight “flares”. The drone is detectable in the range of more than 1 km when the drone is facing the radar in its maximum RCS value direction.
Figure 8 shows not only one snapshot at certain angle, but also a track in grey. This means that previous scans are not blanked, but remain transparent in white color for some time. During a full turn of the circular trajectory, an aircraft makes a 360-degree turn around its own axis with a constant roll angle, but an inclination angle relative to the radar will be different at any moment of flight. The sector of the radar’s view to UAV is 20–30 degrees in the horizontal plane, and the angle of view changes from 10 to 20 degrees in vertical plane. Blanked places in the track means that no signal was received from the UAV. Not only RCS, but also the antenna radiation pattern in the vertical plane and interference with reflection from the ground may affect signal amplitude in the receiver.
In Figure 10, the detection of rotary-wing UAV is presented. The UAV flies in linear trajectory. This UAV was not detected at all by Halo3 radar. The 4G radar showed best results when the detection range of 400 m was achieved. It should be noted that 4G radar is the most sensitive to interferences. Only 4G radar performs interferences on a radar plot chart during our field experiments. Issues about sensitivity to various types of interferences of Simrad 4G radar are presented in [17].
The detection range of Halo20+ radar is only 250 m. Despite much higher power, the range is shorter due to a lack of chirp. At the closest range (400-m radius noisy area), radar transmits very short, unchirped, pulses and exposes low energy on the target.
5. Discussion
Two UAVs were used to investigate the possibilities of radar detection, one of which was a custom-built composite fixed-wing UAV. The other was a comercial drone. The materials from which the objects were made were different. In one case, the body was made of layers of fiber glass, and in the other case it was made of plastic.
To examine the two objects and get their RCS, both objects were placed in a fully anechoid chamber, and the signal-transmitting and receiving antennas were placed at about 6 m from the object. This distance is the largest possible distance that can be used in this chamber. The antennas are placed 50 cm apart to avoid interference. Because the dimensions of the drone are relatively small, the distance between the antennas and the drones mimics the far field conditions, but the dimensions of the fixed-wing unmanned aerial vehicle are slightly longer and already poses more difficulties in meeting the desired experimental conditions. The unmanned vehicles were placed on a rotating pallet. The tilt angle was varied from to . The microwave generator was set to operate at a constant carrier frequency of 9.4 GHz, which corresponds to the X band. The radiance was about 50 mW. The received signal was measured with an RF FSU spectrum analyser.
The drones measurement results give 0.75 , which is less than that of a normal-height human with an RCS of 1 , but significantly higher than that of a pigeon bird with RCS of 0.008 .
In the case of a fixed-wing UAV, very characteristic features are seen because this type of UAV does have an elaborate shape rather than elements concentrated in a small area (as in the case of a drone). In this case, a maximum RCS of 1.2 was measured. However, the RCS value is highly dependent on the tilt of the aircraft and may be less than 0.8 . This result is related to the fact that a falling wave is reflected from the entire fuselage of the aircraft under ideal conditions. If the plane makes a turn or in the opposite case is far enough away and the reflection is from a smaller area, we can suppose only part of the fuselage and one wing are reflected and the RCS is smaller. Therefore, the maximum values correspond to the wings, tail, or front of the aircraft.
Examining different types of radars and their capabilities yields different results. It was observed that at close distance, for example, at a distance of up to several hundred meters, the FMCW radar detects objects better, whereas at a distance of 1 km and further, better results are obtained by the pulse compressed radar. This can be explained by the fact that the FMCW radar sends a steady (by power) signal and on the short ranges average power is higher than average power of the pulsed radars. Meanwhile, during a compressed pulse, it is necessary to provide a time for signals of different widths to be monitored at different distances, in which case we have a shorter time interval because more different signals need to be transmitted in the same antenna position.
Examining the detection of drones, it was observed that due to the irregular fixed-wing RCS, some flicker of the object occurs. The UAV was observed at a distance greater than 1 km. The flicker is explained by the non-uniformity of the RCS and, accordingly, the different trajectory of the reflection of the wave, which propagates for a longer time due to a slightly distorted trajectory, thus creating the illusion that the object is albeit slightly further away. Such an effect is noticed when flying sideways to the radar when minimum reflection is present only from the fuselage of the aircraft, and when rotating or changing the altitude of the aircraft fuselage, more elements can be revealed. The rotation of axles forms different reflections, which changes the intensity of the reflection. A similar effect is seen in all three radars investigated. It should be noted that for further analysis this may serve as a clear marker for the identification of fixed-wing unmanned aerial vehicles of such size.
In detection experiments, it was observed that the Halo3 radar was completely incapable of detecting the drone. Meanwhile, Halo20+ radar was only able to detect the object at closer than 250 m. The FMCW type 4G radar performed best when it detected a drone at 400 m. According to the data provided by the manufacturer, the Halo3 radar antenna is the widest and gives the highest gain. The detection range should be 1.5 times longer (according to Table 1) than Halo20+ radar. Both radars do not use a chirped pulse over short distances and because of that they emit very low average power signals, which results in particularly poor detection capabilities. We may assume that more advanced signal processing technologies are implemented in the more recent Halo20+.
The authors have not tried to conduct experiments in heavy rain. Despite the long distance, the storm clouds are well visible. At low ranges, rain is quite transparent for the X band frequency range.
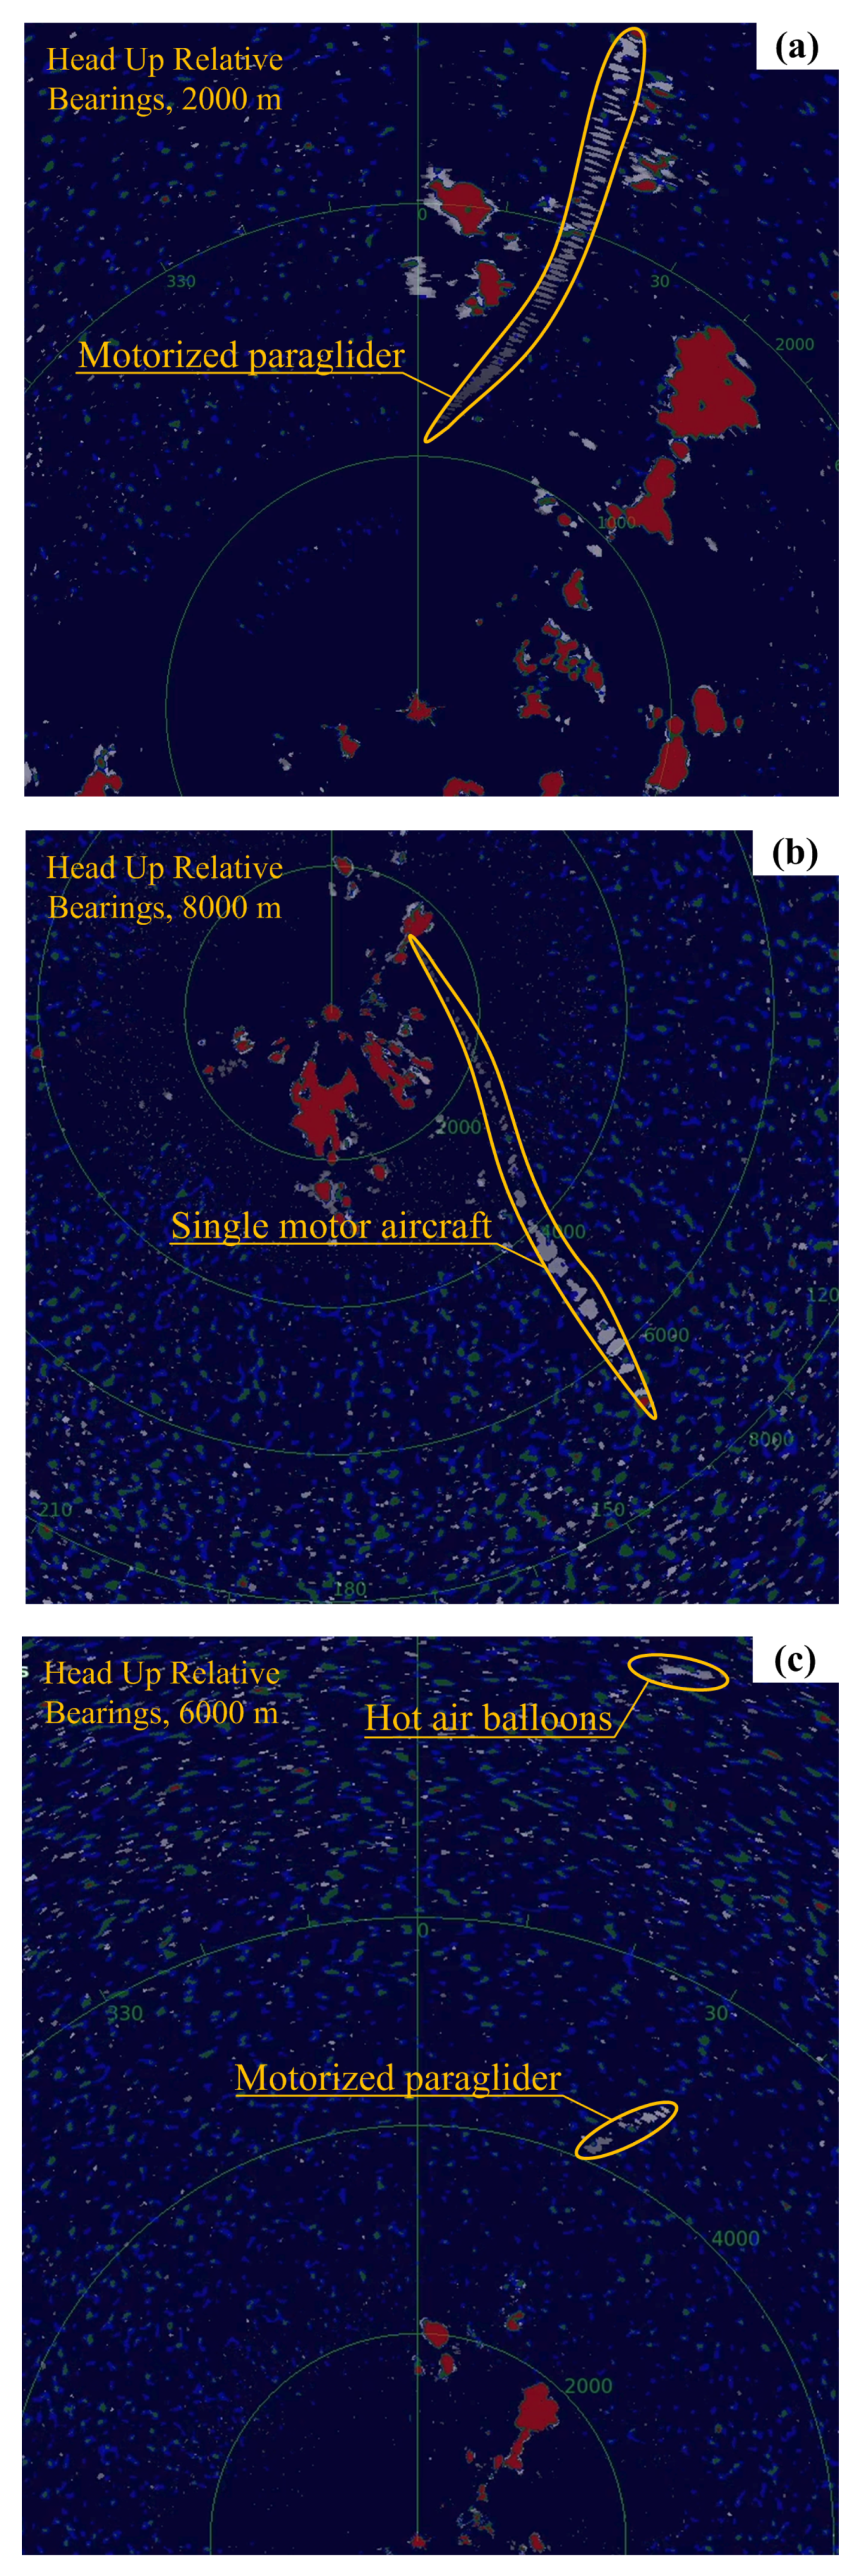
During the experiment, other flying objects were successfully observed in the territory of a nearby private aerodrome. Halo3, unlike the other two radars, was able to successfully detect and show them in the used software. The use of the examined radars provides opportunities to use open-source software, which would allow for the further development and research of new data-processing algorithms in the future, thus expanding the possibilities of the radars to detect, identify, and track objects in real time and use assistive artificial intelligence to create new functions.
6. Conclusions
Investigation showed that the detection of fixed-wing UAV by various solid-state marine radars in the range of more than a kilometer and detection of small quadcopter UAVs in the range of more than half a kilometer is possible in real-life applications. For maximum performance, the radar should be arranged in places with low clutter. The lack of clutter rejection option limits marine radar application for drone detection. Selection by the Doppler effect and highlighting of moving targets will be a useful feature for UAV detection.
Further investigation in combination with different radar usage in parallel to increase short- and long-rage detection and tracking is needed. The same is true of software, the implementation of which could improve the detection, identification, and tracking.
During the research, the RCS of the drone and the plane were measured, which are respectively 1.2 and 0.75 .
Experimental and theoretical results show FMCW technology radars are highly preferred for small RCS targets detection and tracking. However, 4G radars show interferences which are not present in the pulse-compression radars. Halo20+ radars detect drones at shorter distance better than Halo3. The dectection at range of 1 km was succesful. A hovering static UAV can be detected as easily as a moving one. We haven’t tried a smaller drone, because in our opinion, threats from smaller drones are significantly lower due to a lighter payload, a shorter flight range, and communication.
Author Contributions
Conceptualization, S.R., P.R. and A.L.; methodology, D.B. and R.P.; formal analysis, S.R., R.P. and D.P.; investigation, A.L., R.P. and D.P.; writing—original draft preparation, R.P. and D.P.; writing—review and editing, R.P. and D.P.; visualization, A.L., D.B., P.R. and S.R.; supervision, R.P. and D.P.; and funding acquisition, R.P. and D.P. All authors have read and agreed to the published version of the manuscript.
Funding
This research received funding from the European Regional Development Fund according to the supported activity “Targeted Research in Smart Specialization Areas” under Measure No. 01.2.2-LMT-K-718.
Acknowledgments
The authors would like to thank the editors and reviewers for many constructive suggestions and comments that helped improve the quality of the paper.
Conflicts of Interest
The authors declare no conflict of interest.
References
- Lykou, G.; Moustakas, D.; Gritzalis, D. Defending Airports from UAS: A Survey on Cyber-Attacks and Counter-Drone Sensing Technologies. Sensors 2020, 20, 3537. [Google Scholar] [CrossRef] [PubMed]
- Pyrgies, J. The UAVs threat to airport security: Risk analysis and mitigation. J. Airl. Airpt. Manag. 2019, 9, 63–96. [Google Scholar] [CrossRef] [Green Version]
- Rahman, S.; Robertson, D.A. Radar micro-Doppler signatures of drones and birds at K-band and W-band. Sci. Rep. 2018, 8, 17396. [Google Scholar] [CrossRef] [PubMed]
- Kolev, N.; Sivkov, Y.; Sirakov, E. K Band Radar Drone Signatures. Inf. Secur. Int. J. 2020, 47, 349–354. [Google Scholar] [CrossRef]
- Hinostroza, I.; Letertre, T.; Mazières, V. UAV detection with K band embedded FMCW radar. In Proceedings of the 2017 Mediterranean Microwave Symposium (MMS), Marseille, France, 28–30 November 2017; pp. 1–4. [Google Scholar]
- Zulkifli, S.; Balleri, A. Design and Development of K-Band FMCW Radar for Nano-Drone Detection. In Proceedings of the 2020 IEEE Radar Conference (RadarConf20), Florence, Italy, 21–25 September 2020; pp. 1–5. [Google Scholar]
- Beasley, P.; Ritchie, M.; Griffiths, H.; Miceli, W.; Inggs, M.; Lewis, S.; Kahn, B. Multistatic Radar Measurements of UAVs at X-band and L-band. In Proceedings of the 2020 IEEE Radar Conference (RadarConf20), Florence, Italy, 21–25 September 2020; pp. 1–6. [Google Scholar] [CrossRef]
- Essen, H.; Johannes, W.; Stanko, S.; Sommer, R.; Wahlen, A.; Wilcke, J. High resolution W-band UAV SAR. In Proceedings of the 2012 IEEE International Geoscience and Remote Sensing Symposium, Munich, Germany, 22–27 July 2012; pp. 5033–5036. [Google Scholar] [CrossRef]
- Caris, M.; Johannes, W.; Sieger, S.; Port, V.; Stanko, S. Detection of small UAS with W-band radar. In Proceedings of the 18th International Radar Symposium (IRS), Prague, Czech Republic, 28–30 June 2017; pp. 1–6. [Google Scholar] [CrossRef]
- Ezuma, M.; Ozdemir, O.; Anjinappa, C.K.; Gulzar, W.A.; Guvenc, I. Micro-UAV Detection with a Low-Grazing Angle Millimeter Wave Radar. In Proceedings of the 2019 IEEE Radio and Wireless Symposium (RWS), Orlando, FL, USA, 20–23 January 2019; pp. 1–4. [Google Scholar] [CrossRef] [Green Version]
- Liang, C.; Cao, N.; Lu, X.; Ye, Y. UAV Detection Using Continuous Wave Radar. In Proceedings of the 2018 IEEE International Conference on Information Communication and Signal Processing (ICICSP), Singapore, 28–30 September 2018; pp. 1–5. [Google Scholar] [CrossRef]
- Zhao, J.; Fu, X.; Yang, Z.; Xu, F. Radar-Assisted UAV Detection and Identification Based on 5G in the Internet of Things. Wirel. Commun. Mob. Comput. 2019, 2019, 2850263. [Google Scholar] [CrossRef] [Green Version]
- Zhao, C.; Luo, G.; Wang, Y.; Chen, C.; Wu, Z. UAV Recognition Based on Micro-Doppler Dynamic Attribute-Guided Augmentation Algorithm. Remote Sens. 2021, 13, 1205. [Google Scholar] [CrossRef]
- Klare, J.; Biallawons, O.; Cerutti-Maori, D. UAV detection with MIMO radar. In Proceedings of the 18th International Radar Symposium (IRS), Prague, Czech Republic, 28–30 June 2017; pp. 1–8. [Google Scholar] [CrossRef]
- Aldowesh, A.; Alnuaim, T.; Alzogaiby, A. Slow-Moving Micro-UAV detection with a small scale Digital Array Radar. In Proceedings of the 2019 IEEE Radar Conference (RadarConf), Boston, MA, USA, 22–26 April 2019; pp. 1–5. [Google Scholar]
- Schüpbach, C.; Patry, C.; Maasdorp, F.; Böniger, U.; Wellig, P. Micro-UAV detection using DAB-based passive radar. In Proceedings of the 2017 IEEE Radar Conference (RadarConf), Seattle, WA, USA, 8–12 May 2017; pp. 1037–1040. [Google Scholar] [CrossRef]
- Rudys, S.; Udris, D.; Laučys, A.; Bručas, D.; Pomarnacki, R. Functionality Investigation of the UAV Arranged FMCW Solid-State Marine Radar. Mar. Sci. Eng. 2021, 8, 887. [Google Scholar] [CrossRef]
- Laucys, A.; Rudys, S.; Kinka, M.; Ragulis, P.; Aleksandravičius, J.; Jablonskas, D.; Bručas, D.; Daugėla, E.; Mačiulis, L. Investigation of detection possibility of UAVs uing low cost marine radar. Aviation 2019, 23, 48–53. [Google Scholar] [CrossRef] [Green Version]
- PRODUCT BRIEF Halo™ Pulse Compression Radar, A REVOLUTION IN RADAR. Available online: https://newcontent.westmarine.com/content/documents/pdfs/WestAdvisor/Halo-Product-Brief.pdf (accessed on 5 July 2022).
Figure 1.
Developer’s explanation of why pulse power can be reduced in pulse compression radars [19].
Figure 1.
Developer’s explanation of why pulse power can be reduced in pulse compression radars [19].

Figure 2.
Radar signal stitching: (a) Pulse, 0–0.25 nm and explanation of “main bang“. (b) Chirp 1, 0.25–0.8 nm. (c) Chirp 2, 0.8–2 nm. (d) Chirp 3, 2–4 nm.
Figure 2.
Radar signal stitching: (a) Pulse, 0–0.25 nm and explanation of “main bang“. (b) Chirp 1, 0.25–0.8 nm. (c) Chirp 2, 0.8–2 nm. (d) Chirp 3, 2–4 nm.

Figure 3.
Arrangement of the radar on the car roof.

Figure 4.
Fixed-wing UAV Buzzard (a) and quadcopter SGH906 (b).

Figure 5.
Radar cross-section measurement setup in anechoic chamber.

Figure 6.
Radar cross-section measurements. RCS of quadcopter small UAV—polar (a) and rectangular (b) plot , near-field RCS of fixed-wing UAV Buzzard—polar (c) and rectangular (d) plot.
Figure 6.
Radar cross-section measurements. RCS of quadcopter small UAV—polar (a) and rectangular (b) plot , near-field RCS of fixed-wing UAV Buzzard—polar (c) and rectangular (d) plot.

Figure 7.
Waveform of the first chirped pulse. (a) I/Q waveform. (b) RF envelope.

Figure 8.
Detection of fixed-wing UAV by (a) Simrad 4G, (b) Halo20+, and (c) Halo3 radars.

Figure 9.
Detection of rotary-wing UAV by (a) Simrad 4G and (b) Halo20+ radars.

Figure 10.
Detection of the (a) motorized paraglider, (b) single motor aircraft, and (c) motorized paraglider and hot air balloons by Halo3 radar.
Figure 10.
Detection of the (a) motorized paraglider, (b) single motor aircraft, and (c) motorized paraglider and hot air balloons by Halo3 radar.


Table 1.
Comparison of the radars’ parameters.
| Type | Technology | Power | Antenna Width | Range Coefficient, Compared with Halo20+ |
|---|---|---|---|---|
| Simrad 4G | FMCW | 0.3 W | 38 cm | 0.93 |
| Simrad Halo 3 | Pulse compression | 25 W | 100 cm | 1.51 |
| Simrad Halo 20+ | Pulse compression | 25 W | 44 cm | 1 |
Table 2.
Average power dependency to range of view of Halo3 radar.
| Range, km | , μs | , μs | , W |
|---|---|---|---|
| 0.006–0.84 | 0.04 | 700 | 0.0014 |
| 0.84–1.8 | 2.4 | 700 | 0.086 |
| 1.8–3.35 | 5.4 | 700 | 0.193 |
| 3.35–6.7 | 13.5 | 747 | 0.452 |
| 6.7–13.4 | 29 | 1295 | 0.56 |
| 13.4–48 | 88 | 1295 | 1.7 |
| 48–118 | 88 | 1640 | 1.34 |
Publisher’s Note: MDPI stays neutral with regard to jurisdictional claims in published maps and institutional affiliations. |
© 2022 by the authors. Licensee MDPI, Basel, Switzerland. This article is an open access article distributed under the terms and conditions of the Creative Commons Attribution (CC BY) license (https://creativecommons.org/licenses/by/4.0/).
Share and Cite
MDPI and ACS Style
Rudys, S.; Ragulis, P.; Laučys, A.; Bručas, D.; Pomarnacki, R.; Plonis, D. Investigation of UAV Detection by Different Solid-State Marine Radars. Electronics 2022, 11, 2502. https://0-doi-org.brum.beds.ac.uk/10.3390/electronics11162502
AMA Style
Rudys S, Ragulis P, Laučys A, Bručas D, Pomarnacki R, Plonis D. Investigation of UAV Detection by Different Solid-State Marine Radars. Electronics. 2022; 11(16):2502. https://0-doi-org.brum.beds.ac.uk/10.3390/electronics11162502
Chicago/Turabian StyleRudys, Saulius, Paulius Ragulis, Andrius Laučys, Domantas Bručas, Raimondas Pomarnacki, and Darius Plonis. 2022. "Investigation of UAV Detection by Different Solid-State Marine Radars" Electronics 11, no. 16: 2502. https://0-doi-org.brum.beds.ac.uk/10.3390/electronics11162502
Note that from the first issue of 2016, this journal uses article numbers instead of page numbers. See further details here.