1. Introduction
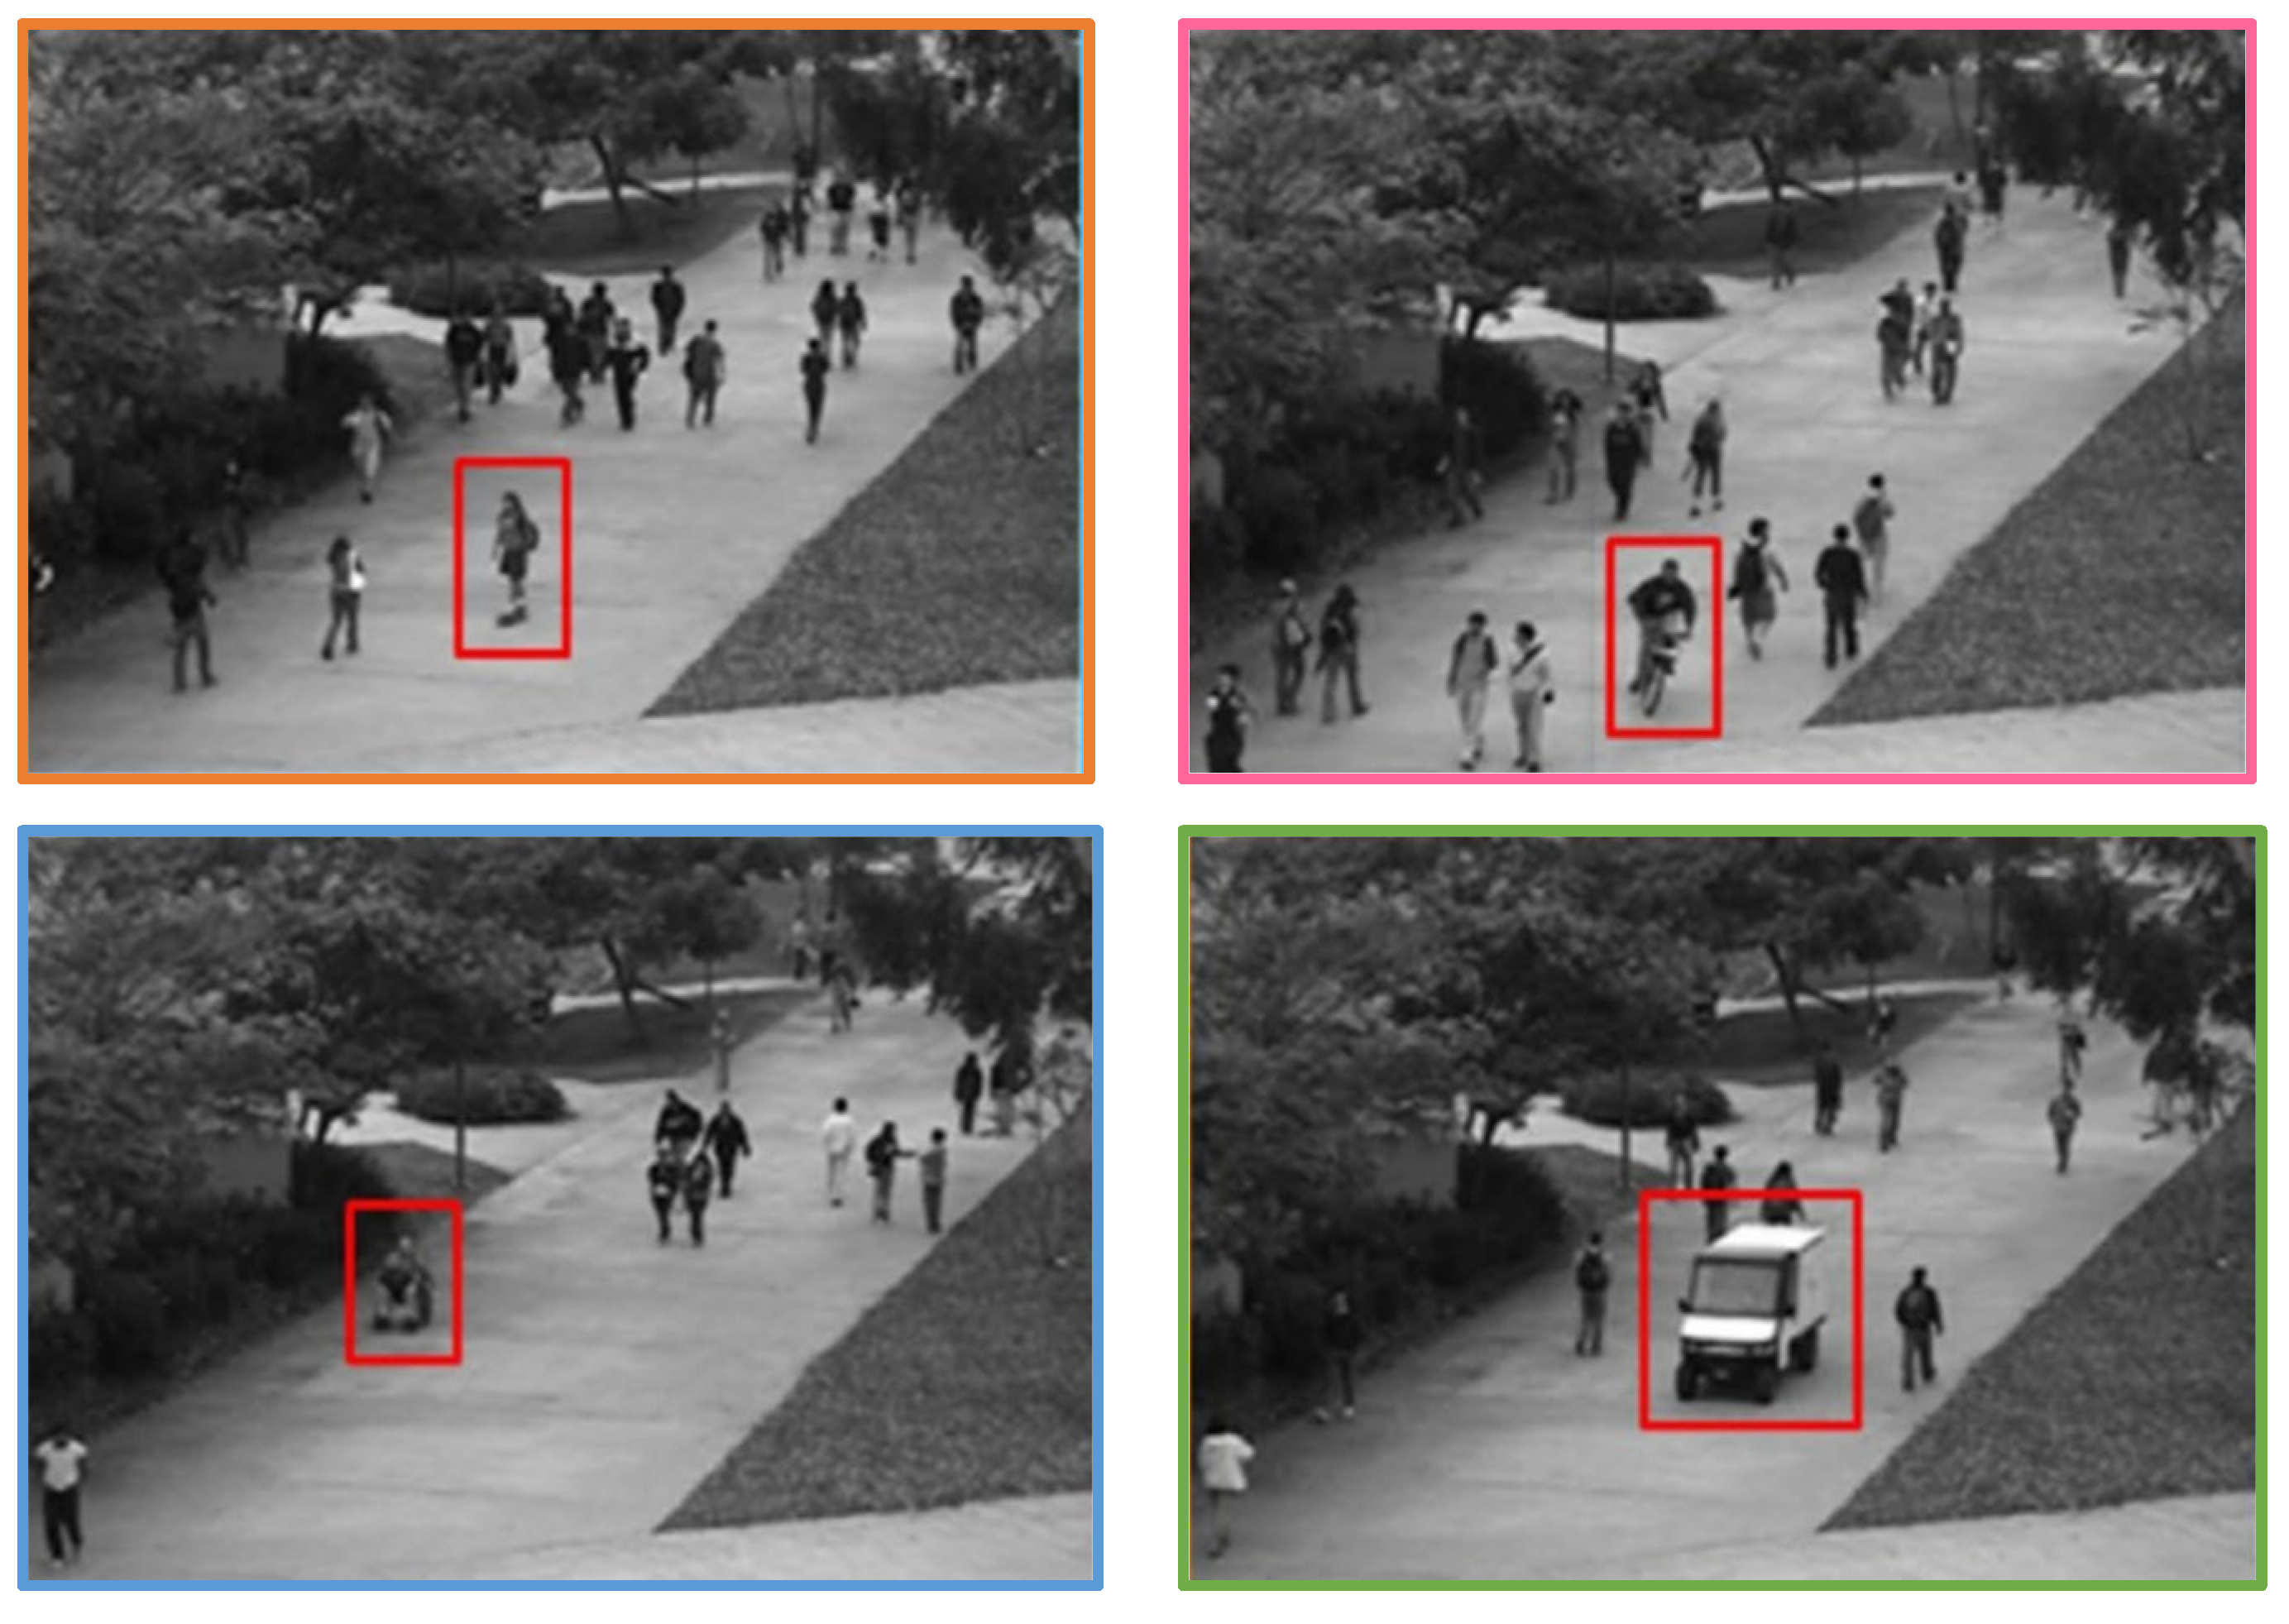
Automatic video-surveillance has emerged as an important tool to prevent crimes and violence, particularly in crowded events and places. In recent years, the installation of video cameras in both private and public places has increased dramatically. On the other hand, the advancements in technology have improved the quality of video at the cost of increased computational resources. The manual analysis of such large amounts of video data is not feasible, hence computerized processing becomes necessary. The videos of live sessions are recorded and stored for later processing. The control room can access any emergency; if an unusual gathering or rushing crowd is noticed, then they can take appropriate action. An example of video surveillance can be a public event where people rush to a common point or run away, at which point the control room can assess that there might be abnormal activity happening, as shown in
Figure 1. In this prospect, video surveillance [
1,
2] has gained significant attention from the research community. Areas such as facial recognition [
3] or dangerous object detection [
4] have been extensively researched. Automatic video-surveillance, especially crowd anomaly detection, is gaining attention. This research topic intends to explore how individuals behave in gatherings and retrieve useful features from recordings in which individuals are present, for instance, behavior analysis of a large number of spectators in a sports stadium or the automatic monitoring of pedestrian motion flow when approaching a crowded pilgrimage place to identify dangerous situations prior to a catastrophe.
For the detection of crowd anomalies, the common method used worldwide is having a control room with multiple screens showing live streams of CCTV cameras. All these activities are recorded and supervised by human entities that need to work 24/7. In addition, human-based surveillance is more prone to errors and less efficient. There is a need for an automatic crowd anomaly detection system that performs quick action, such as an announcement or generating alarms right after the detection of any kind of anomaly [
5]. Deep Learning (DL) approaches have shown outstanding results in various time series analyses and computer vision tasks. These approaches are effective for analyzing video sources, and thus employing DL for crowd anomaly detection is a popular trend. In the last few decades, researchers present many studies for the analysis of crowd behavior and detections of abnormal behaviors at public places or the spot of any particular event such as concerts, variety shows, etc. However, there are two main focus areas of these studies, either macroscopic or microscopic. The macroscopic analysis focuses on a global scale while microscopic areas work on local-scale analysis. The macroscopic or global-scale analysis considers the comparable actions as a single entity to recognize the dominant patterns of activity and ignores an individual’s activity. In short, it focuses on clusters where many similar activities are performed, such as overcrowding at one point. However, microscopic or local-scale analysis focuses on individual actions that are different from another crowd. Usually, it is difficult to monitor the individual’s actions where the crowd is dense. In addition, the challenging point in local scale analysis is to monitor different individuals acting differently at the same time [
6].
Different applications help public security to enhance their efficiency while detecting any abnormal event such as any illicit activity, collisions, irregular actions, or a fright situation. Quick action against such anomalies can save people from disasters and assist the affected persons if anyone is impacted. Deep learning methods provided state-of-the-art results in crowd anomaly detection related problems as well as excelling in other domains. The accuracy of deep learning techniques for crowd anomaly detection is also higher than other traditional methods [
1]. In traditional surveillance systems, human-based detections are prone to errors because a human eye cannot stick to a screen for long and is also not able to analyze multiple abnormal activities simultaneously. To resolve these errors, computer-vision-based automated crowd surveillance systems are used to overcome these limitations. Furthermore, these automated systems are more efficient and effective compared the to the human eye because they do not become tired and lose focus like a human [
7].
There have been many computer-vision-based studies presented in the last few years, and for different applications, a variety of algorithms have been proposed. Specifically for crowd anomalies, these techniques can be used to detect the region of interest (ROI) or event of interest (EOI) applied to vision sensors. Quick and rapid detection of the EOI will increase the system use of image or video processing; however, in crowd anomaly detections or crowd surveillance systems, videos are more commonly used as opposed to images [
8]. The processing systems become more efficient if they are fed by the data that contain EOI. Alongside crowd surveillance systems, crowd behavior detection is also a challenging task while using computer-vision-based techniques and frameworks. Automated crowd anomaly detection systems can reduce the ratio of disasters and difficulties in human-centric surveillance systems [
9]. As mentioned above, many techniques use videos to detect the ROI, especially in crowd surveillance and anomaly detection. Anomalies can appear in both crowded and uncrowded scenes, such as a cyclist or bike rider on the pedestrian path may appear as an anomaly when there is no crowd of people. Occlusion or such other events increase the difficulty of finding an abnormal event. While detecting an anomaly in videos, there may be global or local anomaly preferences [
10].
Whether the preference of anomaly detection is global or local, there may be many types of hurdles and difficulties, such as noise in environments that cannot provide clear vision; light illumination such as at the end of a day or night; or a scene of heavy rain, dispersion, and distortion [
11]. In addition to global or local anomaly selection, there can be three types of anomalies, which are point anomaly, collective anomaly, and contextual anomaly. Point anomaly is related to a local anomaly that focuses on the abnormal event or action of an individual or a few people, while the collective anomaly is like the global anomaly in that it focuses on the similar actions of many people in an area. However, the contextual anomaly is different because it focuses on the context of the instance that is anomalous like it is dependent on the environment where it is situated. An example of a contextual anomaly can be a bike rider riding on the pedestrian path or riding on the opposite lane being labelled an abnormal event while riding on the road is normal. It is important to measure the context of movement and behavior while performing anomaly detection to assess whether the context of the event or motion is normal or abnormal [
12].
Several research studies have been conducted to address the problem of crowd anomaly detection using DL approaches [
7,
9,
13]. However, the majority of these studies are limited and challenging to compare, especially when proposing and implementing new solutions, as it acquires previously established knowledge. Most of the relevant concepts in the field of crowd anomaly detection and definition itself are unclear. For instance, a group of thirty persons can be interpreted as a crowd at a bus station; however, this is unlikely to be considered as large in sports stadiums. For this reason, proposing and implementing a generic model for crowd anomaly detection is a challenging task. This study proposed a fine-tuned DL-based end to end and computationally efficient crowd anomaly detection model. The proposed model employed CNN to extract discriminative features from video frames. To establish the significance of the proposed model, its accuracy is compared with five classification models for crowd anomaly detection. The experimental results show that the proposed model outperformed other baseline classification models.
The rest of this paper is organized into four sections. In
Section 2, a compressive review of existing studies is presented.
Section 3 provides the proposed methodology, which is comprised of datasets used for experiments, pre-processing, DL method employed for anomaly detection, and evaluation parameters. In
Section 4, the results of various experiments and the significance of the observed findings are reported. Finally,
Section 5 concludes this paper.
2. Literature Review
A crowd can be defined as a large collection of people gathered for a particular purpose, such as a sports event, music event, or any similar activity. An anomaly is an unusual identity that creates a disturbance or irregular activities in the crowd or are outliers in normal distribution. The following literature provides some relevant studies performed for crowd anomaly detection in recent years.
Datasets are the basis for any technique application, and authors in this study highlight the need of datasets in the domain of crowd anomaly detection. Authors have highlighted the difference between real and simulated datasets. Real datasets provide best results but also have some problems and challenges to overcome. The main purpose of this study was to create a such dataset that provides models of crowd anomaly detection collectively instead of individual anomaly in crowd control. A case study based of MassMotion simulation tool familiarized four synthetic datasets known as SIMulated Crowd Datasets (SIMCD). These four datasets are based on single anomalies, multiple anomalies, and different predictions. Two scenarios, anomaly and prediction, were used to create four datasets. The proposed methodology completes dataset creation in five steps, and later, these datasets were processed again to make them usable. These datasets were updated with some new features: density, crowdedness, and severity levels. The generated datasets were able to train, test, validate, and evaluate the crowd anomaly detection, its behavior, and its prediction as well. The limitation of the study is that the generated datasets are purely synthetic and were never tested in a real-time environment [
14]. Ravanbakhsh and Mousavi [
15] claimed that the machine-learning-based techniques for crowd anomaly detection are not appropriate when applied in real time. They proposed a descriptive model for abnormality detection in crowd segments named Local Binary Tracklets (LBT). As the LBT was trained on normal behaviors, another framework was suggested that works together with LBT and Dense Optical Flow (DOF). This framework actively identifies abnormal behaviors in given data frames. To solve the problem of hardly accessible abnormal behaviors, the authors applied a one-class Support Vector Machine (SVM) that is also trained by normal behaviors. The results were validated through cross-comparison with other datasets having abnormal behavior. The authors only compared the computational complexity of LBT that is satisfactory; however, they did not consider the complexity of LBT+DOF framework and SVM.
In [
16], the authors proposed a social multi-instance learning framework that uses dynamic network branch and extracts crowd anomaly features including prior knowledge. The dual-branch framework can extract the semantic information of abnormal anomaly features by taking account the prior information of crowd complex interaction feature. The pre-trained C3D network model failed in feature extraction when applied on a new dataset; however, the proposed framework outperforms these challenges. This network was able to learn normal and abnormal anomaly features and detect the patterns rationally. The effectiveness of the proposed framework evaluated through the experiment results and comparison of results shows its best performance.
Ojha and Vaish [
17] used SIFT techniques to detect crowd anomalies in both structured and semi-structured crowd environments. Proposed model focus on three features of crowds: dynamics appearances, anomalies in spatial eccentricity, and flow change based on inherent eccentricity. In point of fact, this framework calculates the vector positions in picture frames and then compares calculations of pixel points in a sequence of frames. The motion of objects is noticed as vector positions and then the distance of objects is calculated to track the motion of the object or anomaly. The measured distance of the victimized object describes the speed of the moving object that could be an anomaly. Pawar and Attar [
18] proposed an unsupervised-learning-based global anomaly detection model for crowd surveillance and the detection of abnormal events. The proposed model has a one-class paradigm that was trained on the normal events and detects abnormal behaviors in surveillance videos. This model uses a convolutional autoencoder and a sequence-to-sequence long short-term memory autoencoder for pipeline sequencing of anomaly features. Experimental results show the proposed model effectiveness that it detects anomalies within 0.4 s in a video frame. However, the limitation of the proposed techniques is that GPUs are required to perform experiments. Otherwise, without GPUs, it cannot provide such efficient and effective results and accuracy.
Mehmood [
19] presented a study based on deep learning that use two-stream convolutional neural network to detect crowd anomaly. The main purpose of author was to get more accurate results with lower computational cost. To achieve this objective, the author used a two-dimensional CNN that is pre-trained for selected spatial and temporal streams while gathering the types of anomalies. Before feeding them to the CNN for training, both streams were fine-tuned using image frames, and the selected frames were RGB and staked grayscale three-channel images. This tuning and pre-processing reduced the computational cost because staked grayscale three-channel images help to learn motion features easier for temporal streams. The proposed model was applied on three datasets and obtained accuracies of 99.12%, 99.71%, and 98.81%, respectively. In this study, the authors fully utilize the spatial and temporal information of the given data and proposed a novel approach combining deep object detection and anomalies detection. To solve the problem of fuzziness in real-time surveillance, the authors created a dynamic image to extract foreground objects using deep object detection. Anomalies were divided into two groups: motion and location anomalies. The existing hand-crafted features were not appropriate, so for the motion anomalies, the authors proposed a new feature named the histogram variance of the optical flow angle (HVOFA), which is scale intensive. The object tracking helps the model to detect the abnormal behavior. In video-based crowd surveillance, objects are tiny, so the TCCF algorithm was used to resolve this issue. This technique outperforms relevant techniques but increases the computational complexity by generating images dynamically [
20].
Another machine learning technique was used by Mohan and Choksi [
21] for anomaly detection using video-based surveillance. The proposed model solves the problems of manually crowd anomaly tracing by automatic anomaly detection using principal component analysis network (PCANet) and CNN. However, when frames are used to detect and track the anomaly, then principal component analysis and support vector machine were used to tag and classify the abnormal activities and anomalies. The proposed model was applied on three datasets, which were Avenue, UCSD, and UMN; however, the Avenue dataset showed better results. To reduce the problems of manual crowd anomaly detection, the authors in this study proposed a deep Gaussian Mixture Model (GMM) that detects crowd anomalies. The proposed model had two-fold effects because it learns anomaly features and performs model building that explores patterns in video events. For feature extraction, a perfect unsupervised learning model PCANet was used that automatically extracted features. However, for model building, a deep GMM framework was used that has the ability to extract feature patterns while having limited parameters. The authors evaluated the performance of the proposed deep GMM model by using frame-, pixel-, and object-level measures applied on two datasets. The results describe that the proposed model automatically extracted features from 3D gradients, which gives clues about the motion and appearance of the anomaly [
22]. The authors in this study proposed a deep learning model to ensure the safety of pedestrians. The proposed model was entitled deep-learning-based anomaly detection technique in pedestrian walkways (DLADT-PW). This technique included some preprocessing, where each video is divided in possible sets of frames, and the model further uses these frames to map and detect anomalies. Then, image denoising is performed to remove the noise to improve the quality of image frames. These frames were further fed to a Mask-Region-based CNN supported by the DenseNet 169 model to perform anomaly detection to identify and classify them. The experimental results prove the accurate detection and classification of anomalies to enhance the safety of pedestrian walkways. However, the denoising of frames in preprocessing can remove the noise, but it also makes images blurry, and blurry images cannot provide accurate features [
23].
3. Materials and Methods
This section presents the detailed research methodology used to detect the abnormal behavior from crowd. In the proposed system, we employed three pre-trained CNNs (GoogLeNet, VGGNet, and AlexNet) to extract the automatic features from images. The features extracted by each pre-trained model were concatenated. These features were fed as input to six different machine learning algorithms for the best classification decision. Three datasets—CUHK Avenue [
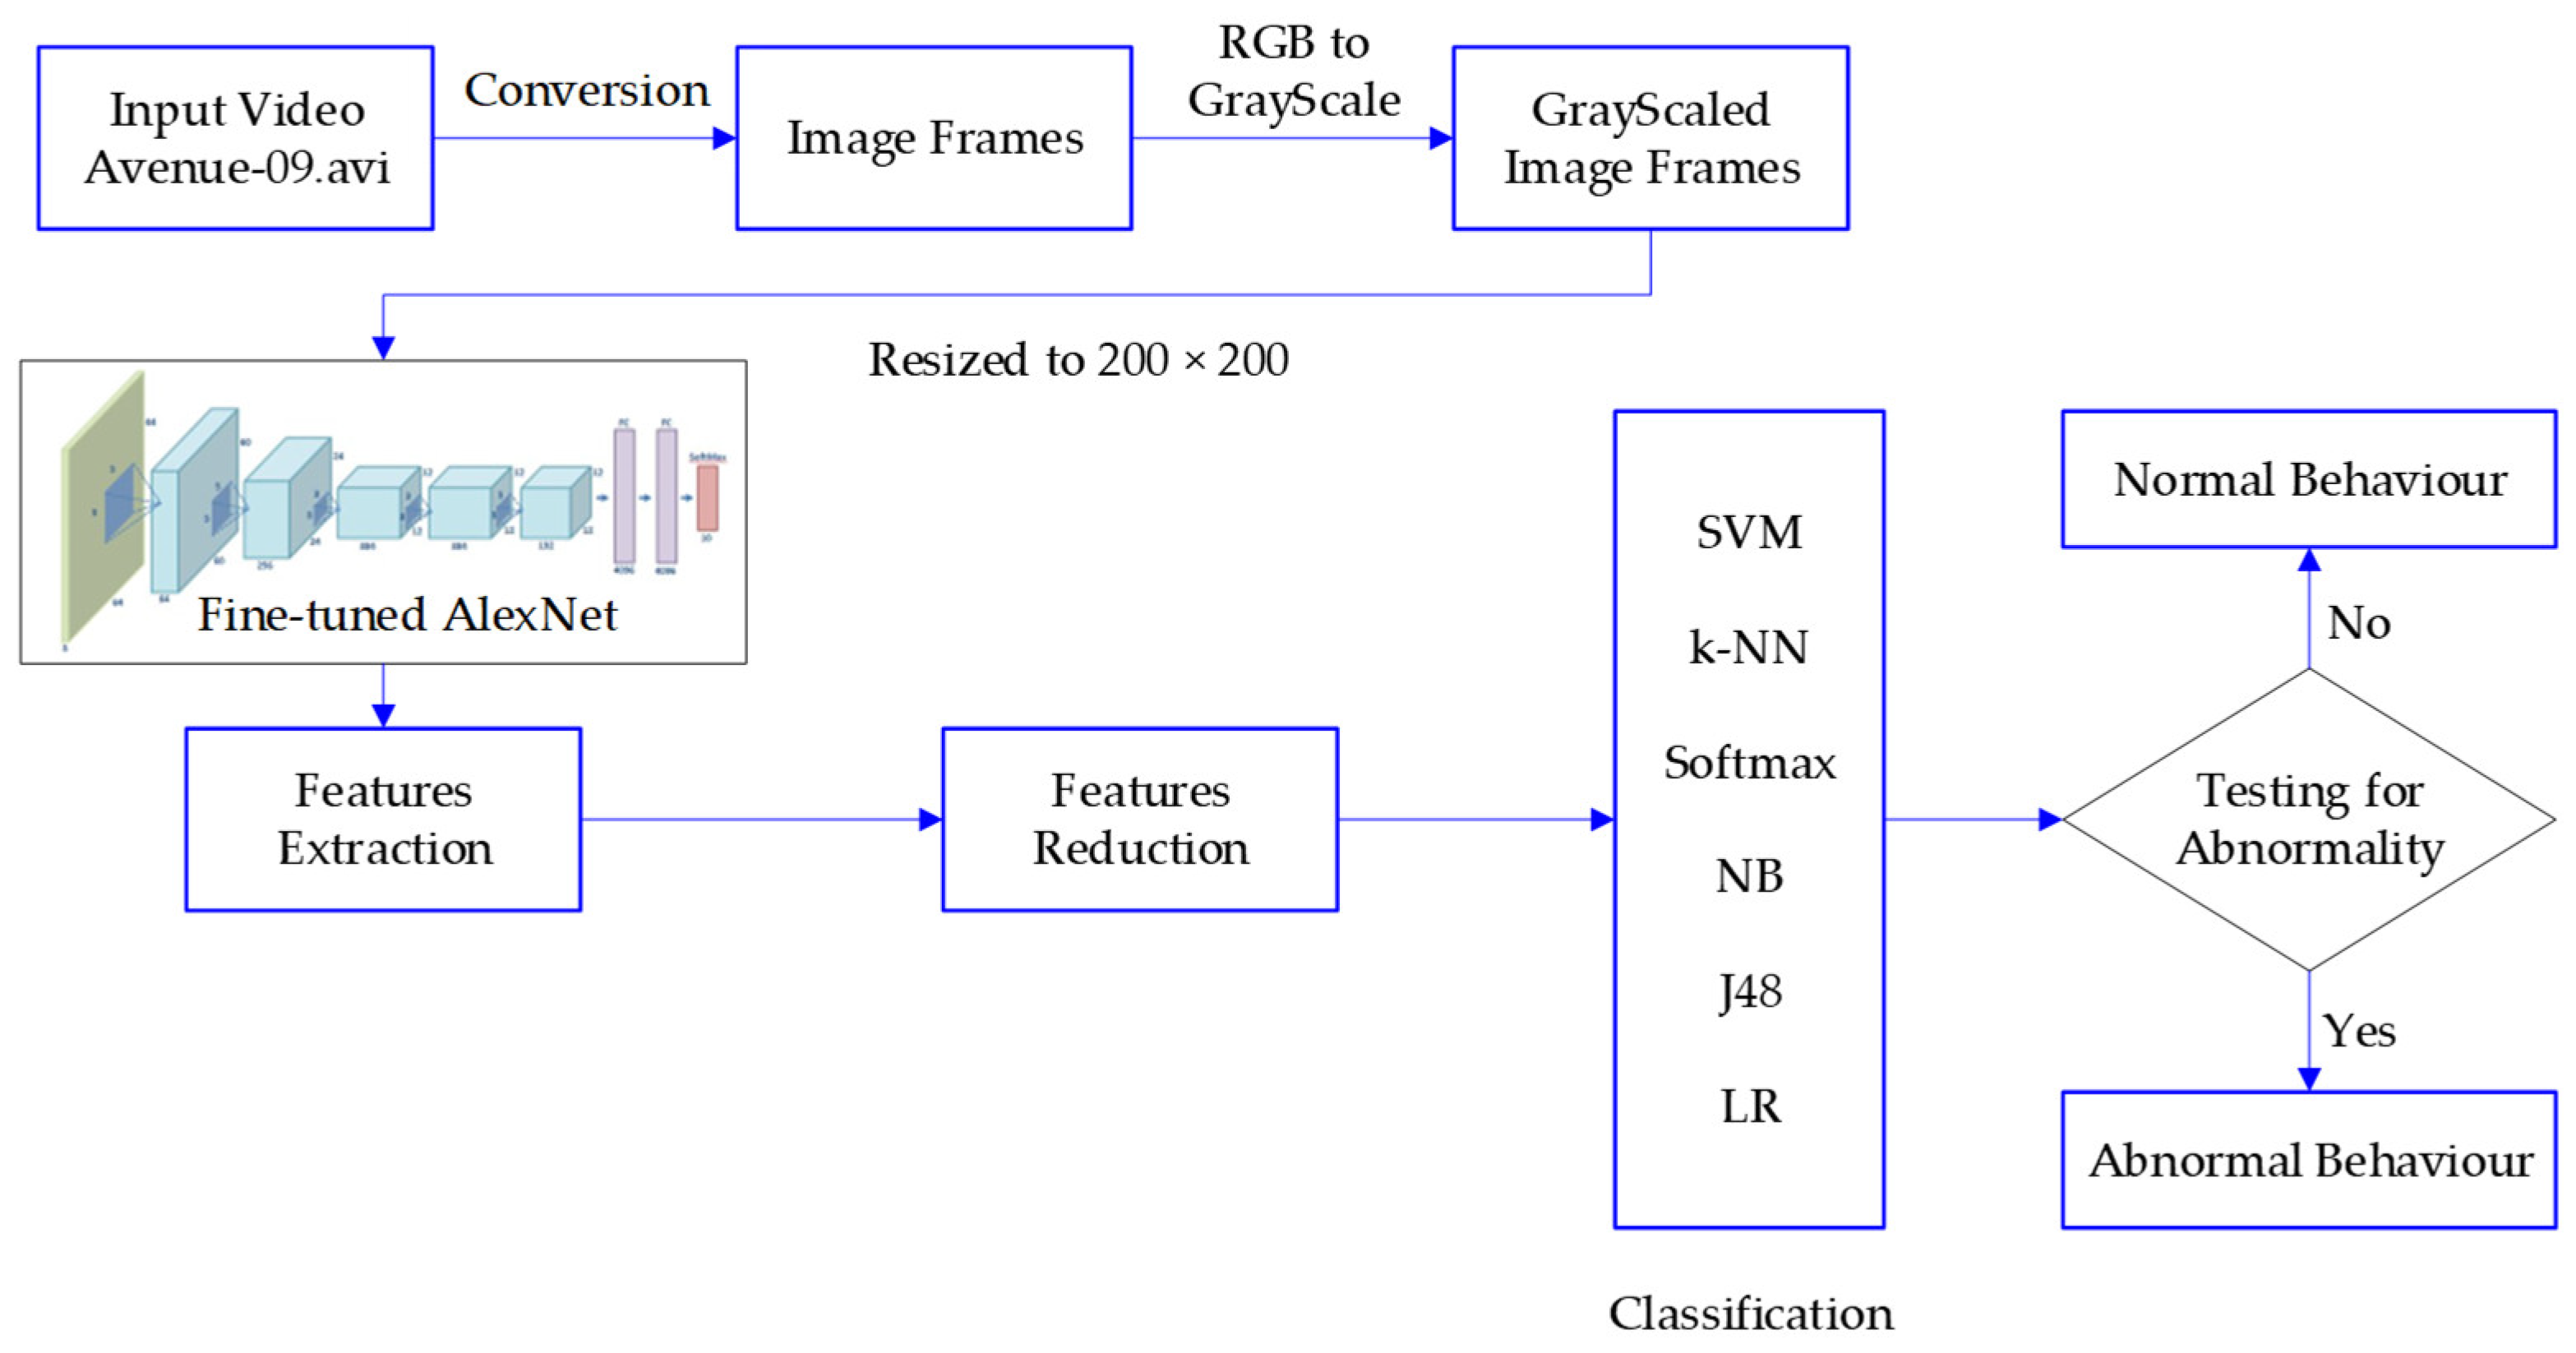
8], UCSD Ped-1, and UCSD Ped-2—were used to evaluate the proposed abnormal behavior detection system. All the experiments were performed in Spyder (Python 3.10.7) environment on a PC with 16GB RAM, 64-bit Windows 10 OS, and Intel(R) Core (TM) i7-3210M CPU. The details of the proposed method are presented in subsequent subsections. The high-level framework of the proposed technique is presented in
Figure 2, and its phases are described in subsequent subsections.
3.1. Dataset
Our proposed method for anomaly detection was evaluated using three benchmark datasets: Avenue and UCSD Ped-1 and Ped-2 datasets. All three datasets comprise the video clips of people on pedestrian sidewalks at UCSD. As well-known public datasets for anomaly detection, these have been extensively employed to evaluate the existing crowd anomaly detection systems. The Avenue dataset comprises diverse individual video clips which were broken into distinct frames, extracting a new frame after 2 frames per second (fps). The Ped-1 dataset contains 34 videos clips for model training and 36 video clips for testing. Each video comprises 200 video frames with 238 × 158 pixels at 30 frames per second (FPS). Similarly, the Ped-2 dataset contains 16 videos clips for training videos and 12 video clips for model testing. The frames of video clip in the Ped-2 dataset varies from 120 to 180 with 360 × 240 pixels. The video clip used for training only contains pedestrians. Both Ped-1 and Ped-2 datasets provide partial pixel-level abnormal labels and completed frame-level abnormal labels. We considered the frame-level data samples, as our work mainly focused on the contextual features. The abnormal labels include unexpected objects (motorcycle, bicycle, skateboard, etc.), irregular trajectory, and restricted area.
Table 1 includes the description of each dataset.
A split of 80–20% of the total video clips was used for the training and testing the model. Therefore, from the Aveneue, Ped-1, and Ped-2 datasets, a total of 26, 27, 12, and 26 video clips from the normal class and 30, 29, and 10 video clips from the anomalous class were utilized for the model training process. Similarly, a total of 6, 7, and 4 video clips from the normal class and 8, 7, and 2 video clips from the anomalous class were utilized for the model testing. The feature dimensions of each dataset are depicted in
Table 1.
3.2. Data Pre-Processing
The input video of the above three datasets were transformed into image frames. These frames were further transformed into grayscale images. As shown in
Table 1, the extracted frames from three datasets vary in size; therefore, these grayscale image frames were resized to 200 × 200 pixels, which were fed as input to the proposed model in the next phase. The image frames utilized for training were divided into two classes, namely, abnormal and normal. Both classes had approximately same number of images for unbiased training.
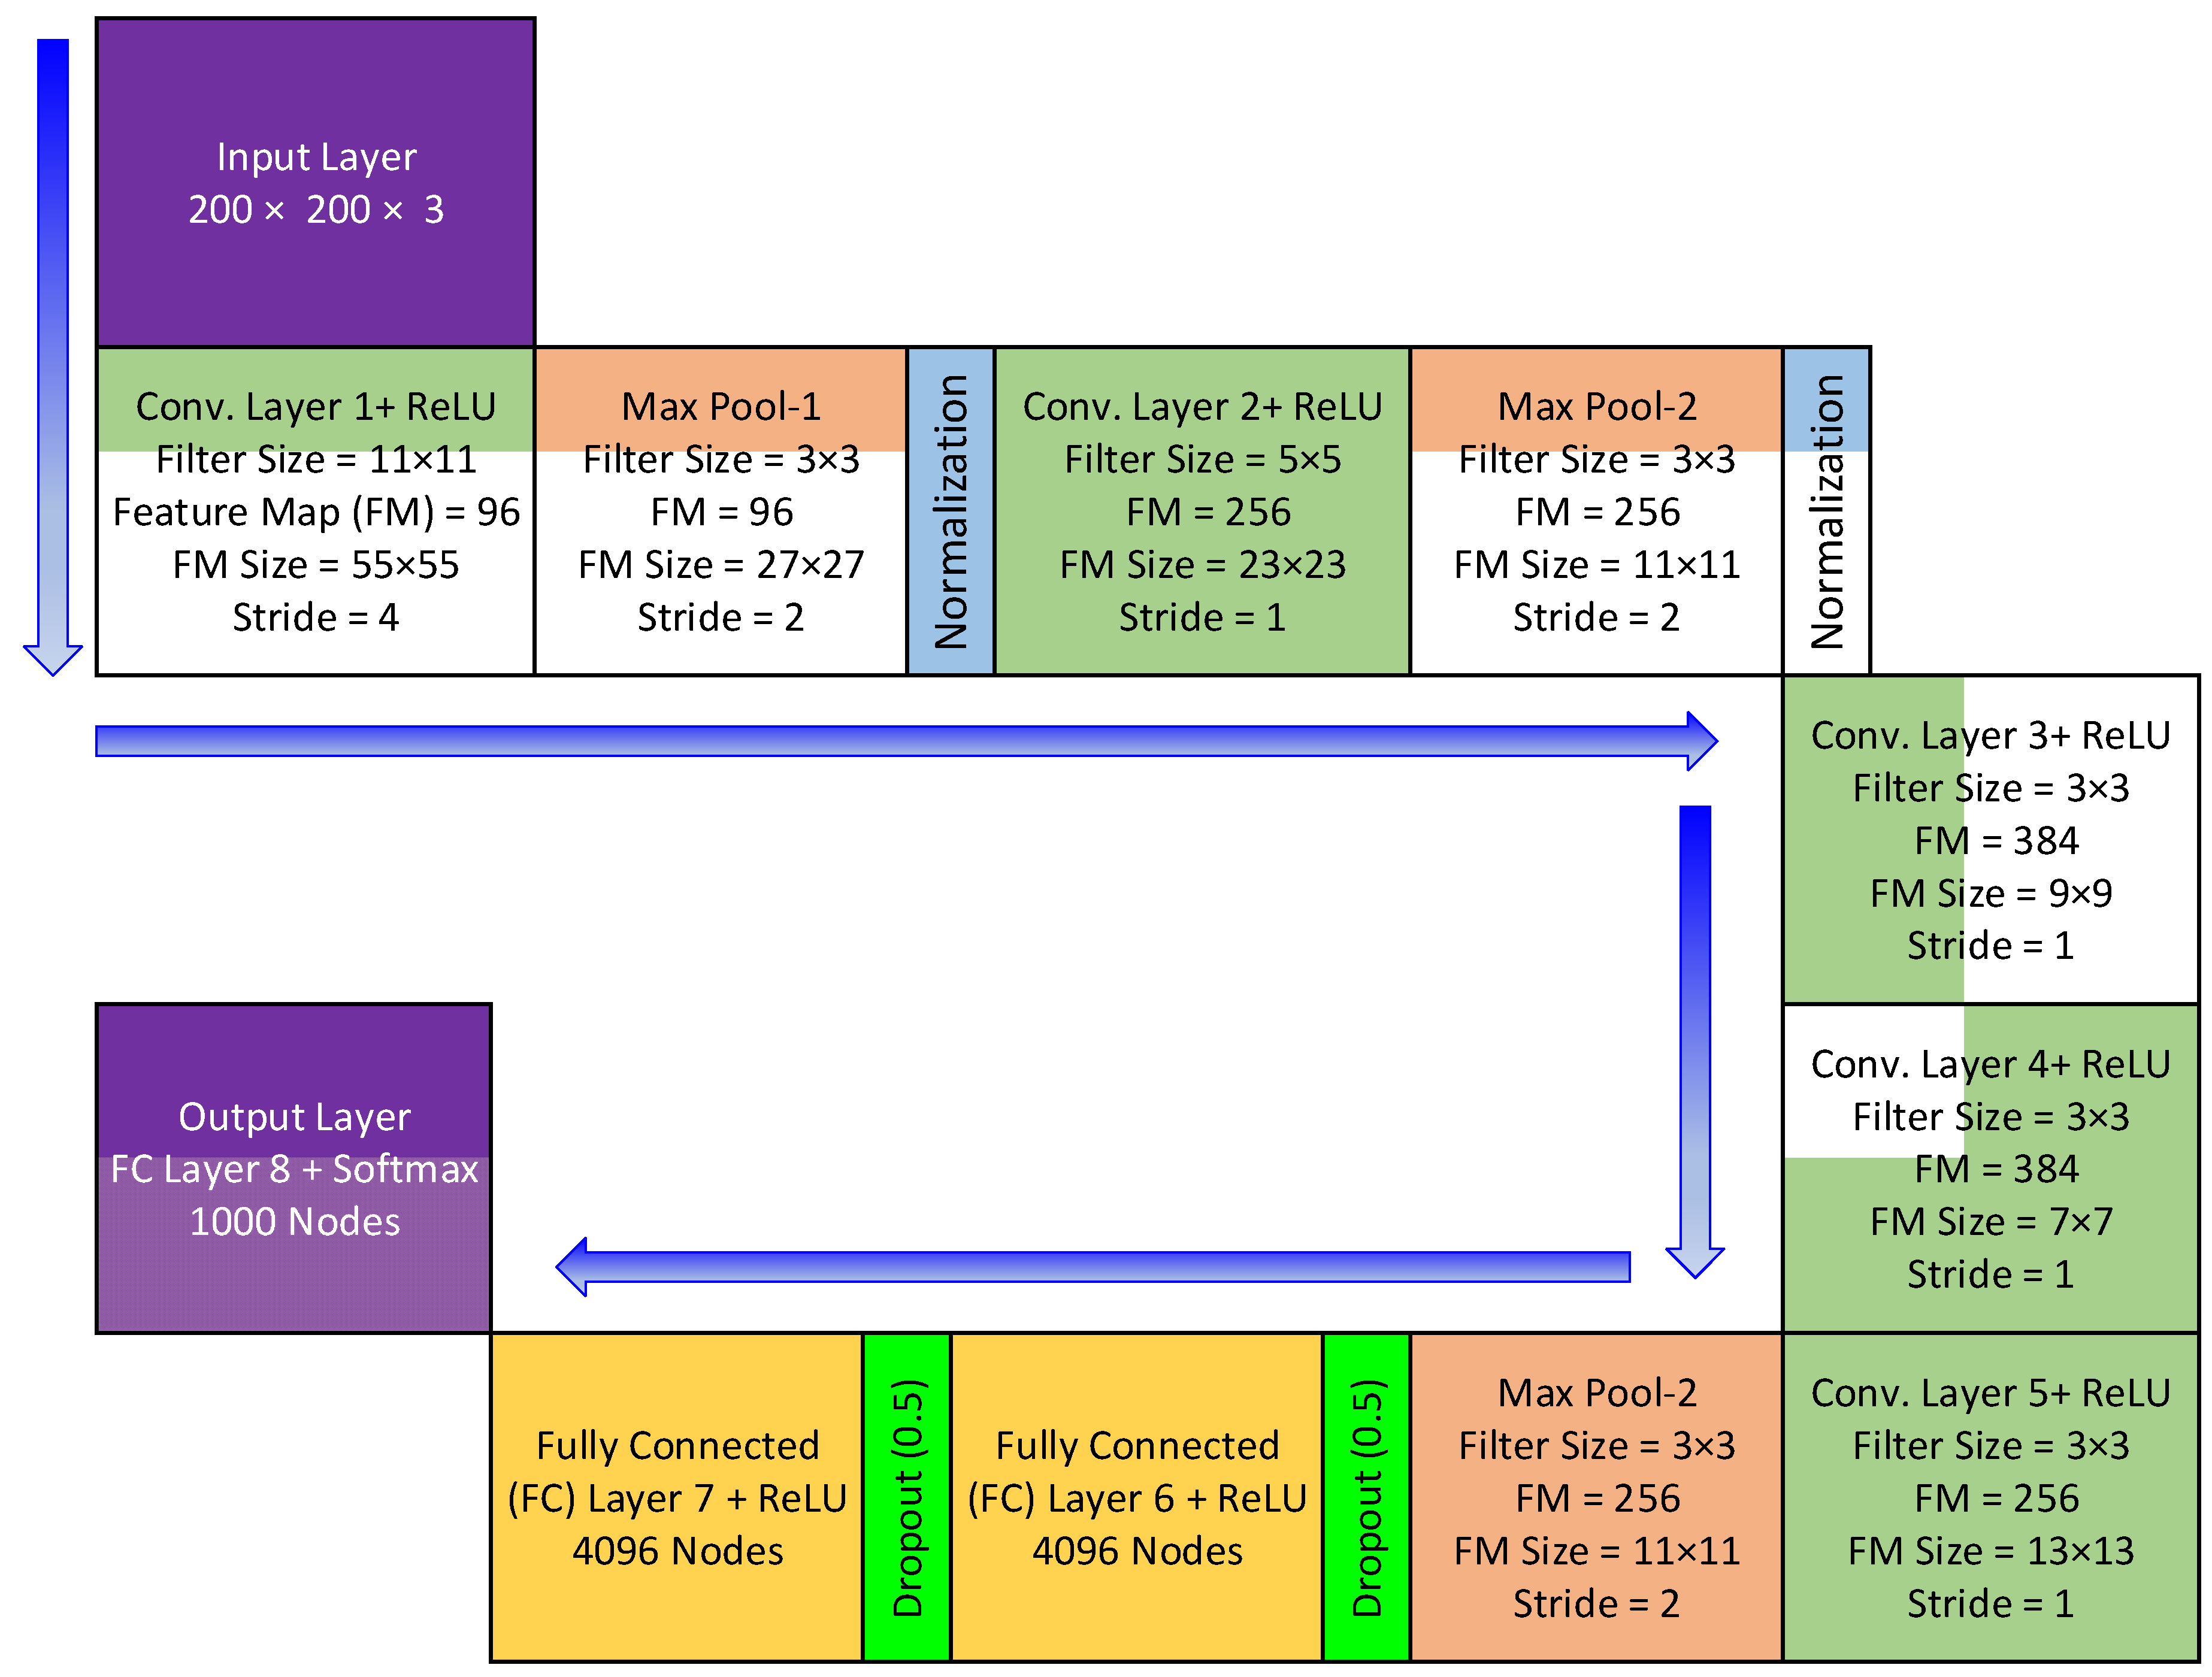
3.3. Feature Extraction through the Pre-Trained Convolutional Neural Networks
This study employed three pre-trained DL architecture, namely, AlexNet [
24], GoogleNet, and VGGNet were to retrieve the most informative features from the pre-processed images. AlexNet model was trained on one million objects for 1000 class labels, including pen, keyboard, pencil, mug, coffee, and many animals. In brief, AlexNet was comprised of five convolution (CL) and three fully connected (FC) layers. The convolution layer performs three basic operations: convolution, pooling, and activation. The purpose of the convolution operation is to apply the filter to the input matrix and produce the feature matrix. In the activation operation, high-level features are retrieved by passing each feature matrix through an activation function. The result of an activation operation is pooled to reduce its dimensionality. Afterwards, the pooled output is fed to the subsequent convolution layer. Convolution generates low-level features such as lines, points, and edges, as well as more high-level features such as shapes and particular objects. The convolution operation involves processing incoming images through filters to generate feature maps that recapitulate the existence of particular visual features. Each filter position from upper left to lower right yields a single value that is the weighted sum of the multiplication of filter coefficients with the corresponding overlay picture pixel, as determined in Equation (1):
where (
x,
y), (
m,
n) are indices,
I is an input image, and
F is a two-dimensional filter.
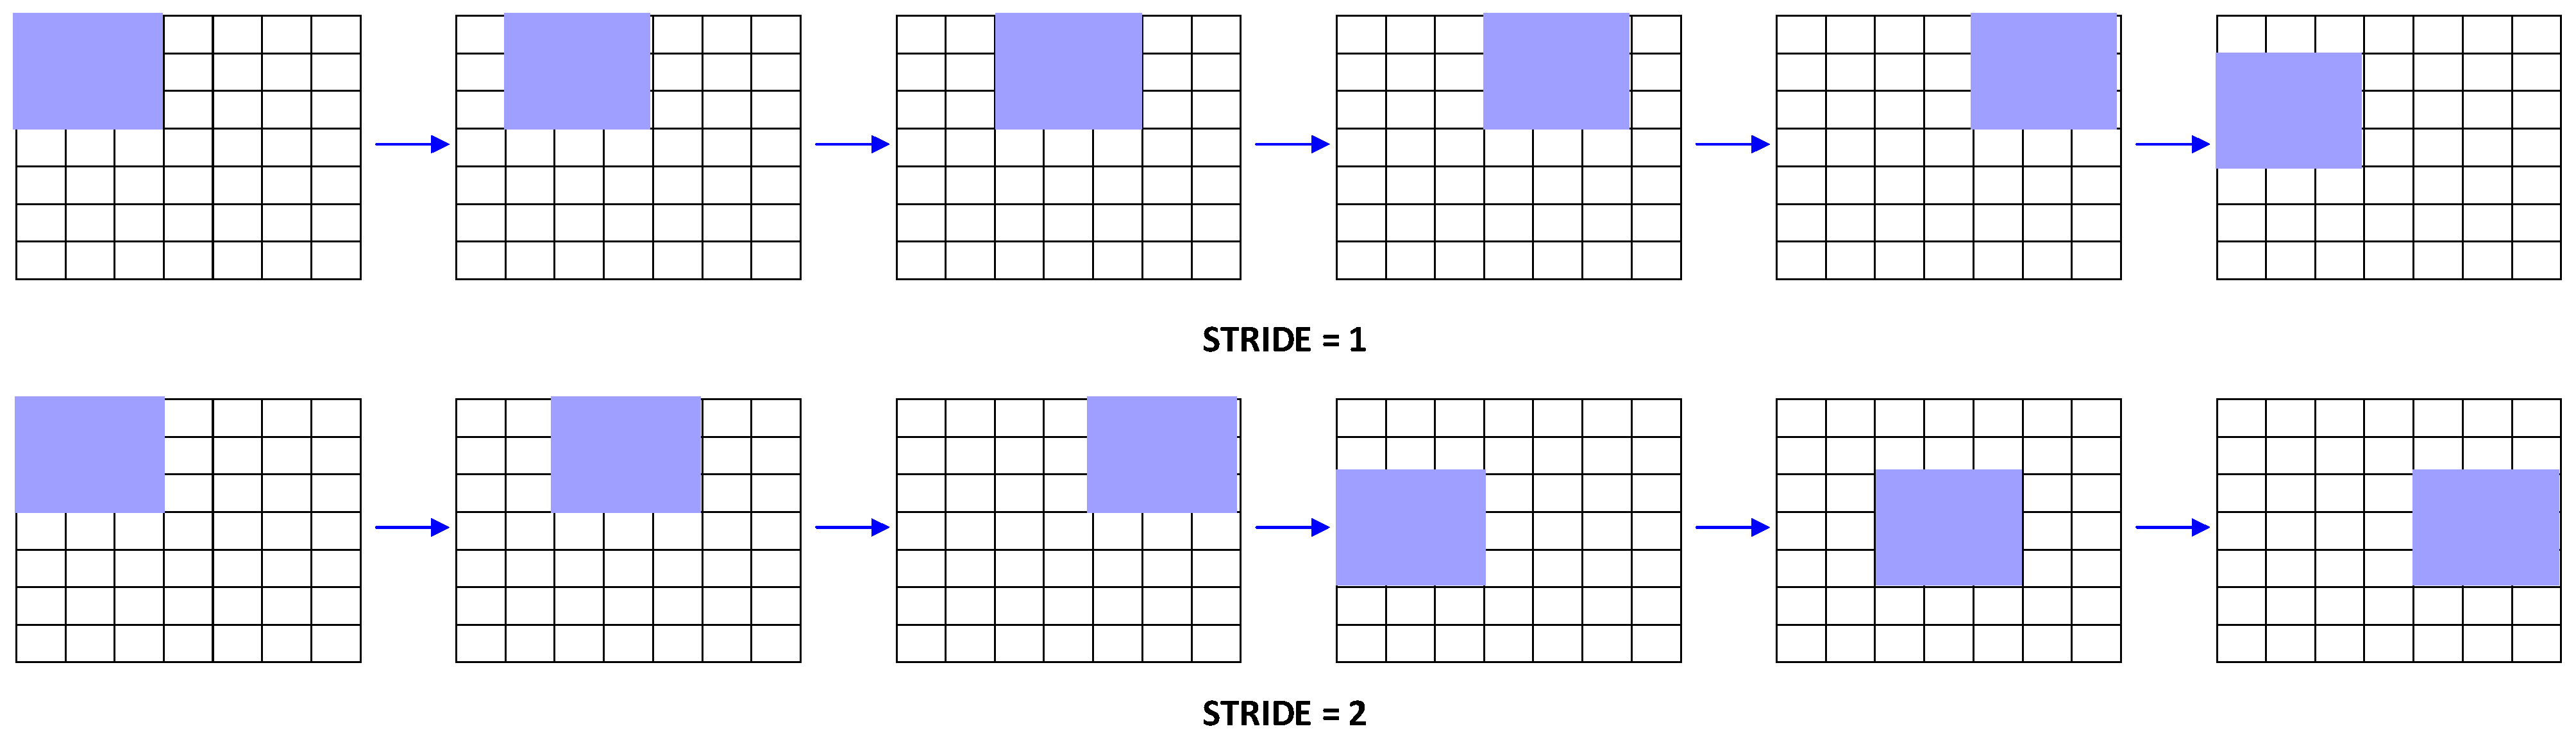
AlexNet architecture can decrease insignificant parameters, hence lowering the adverse effects of high dimensionality. Stride is the size of the filter’s image-moving steps during convolution.
Figure 3 displays the stride operation on a 7 × 7 image with a 3 × 3 filter and a stride of one in the first row and two in the second.
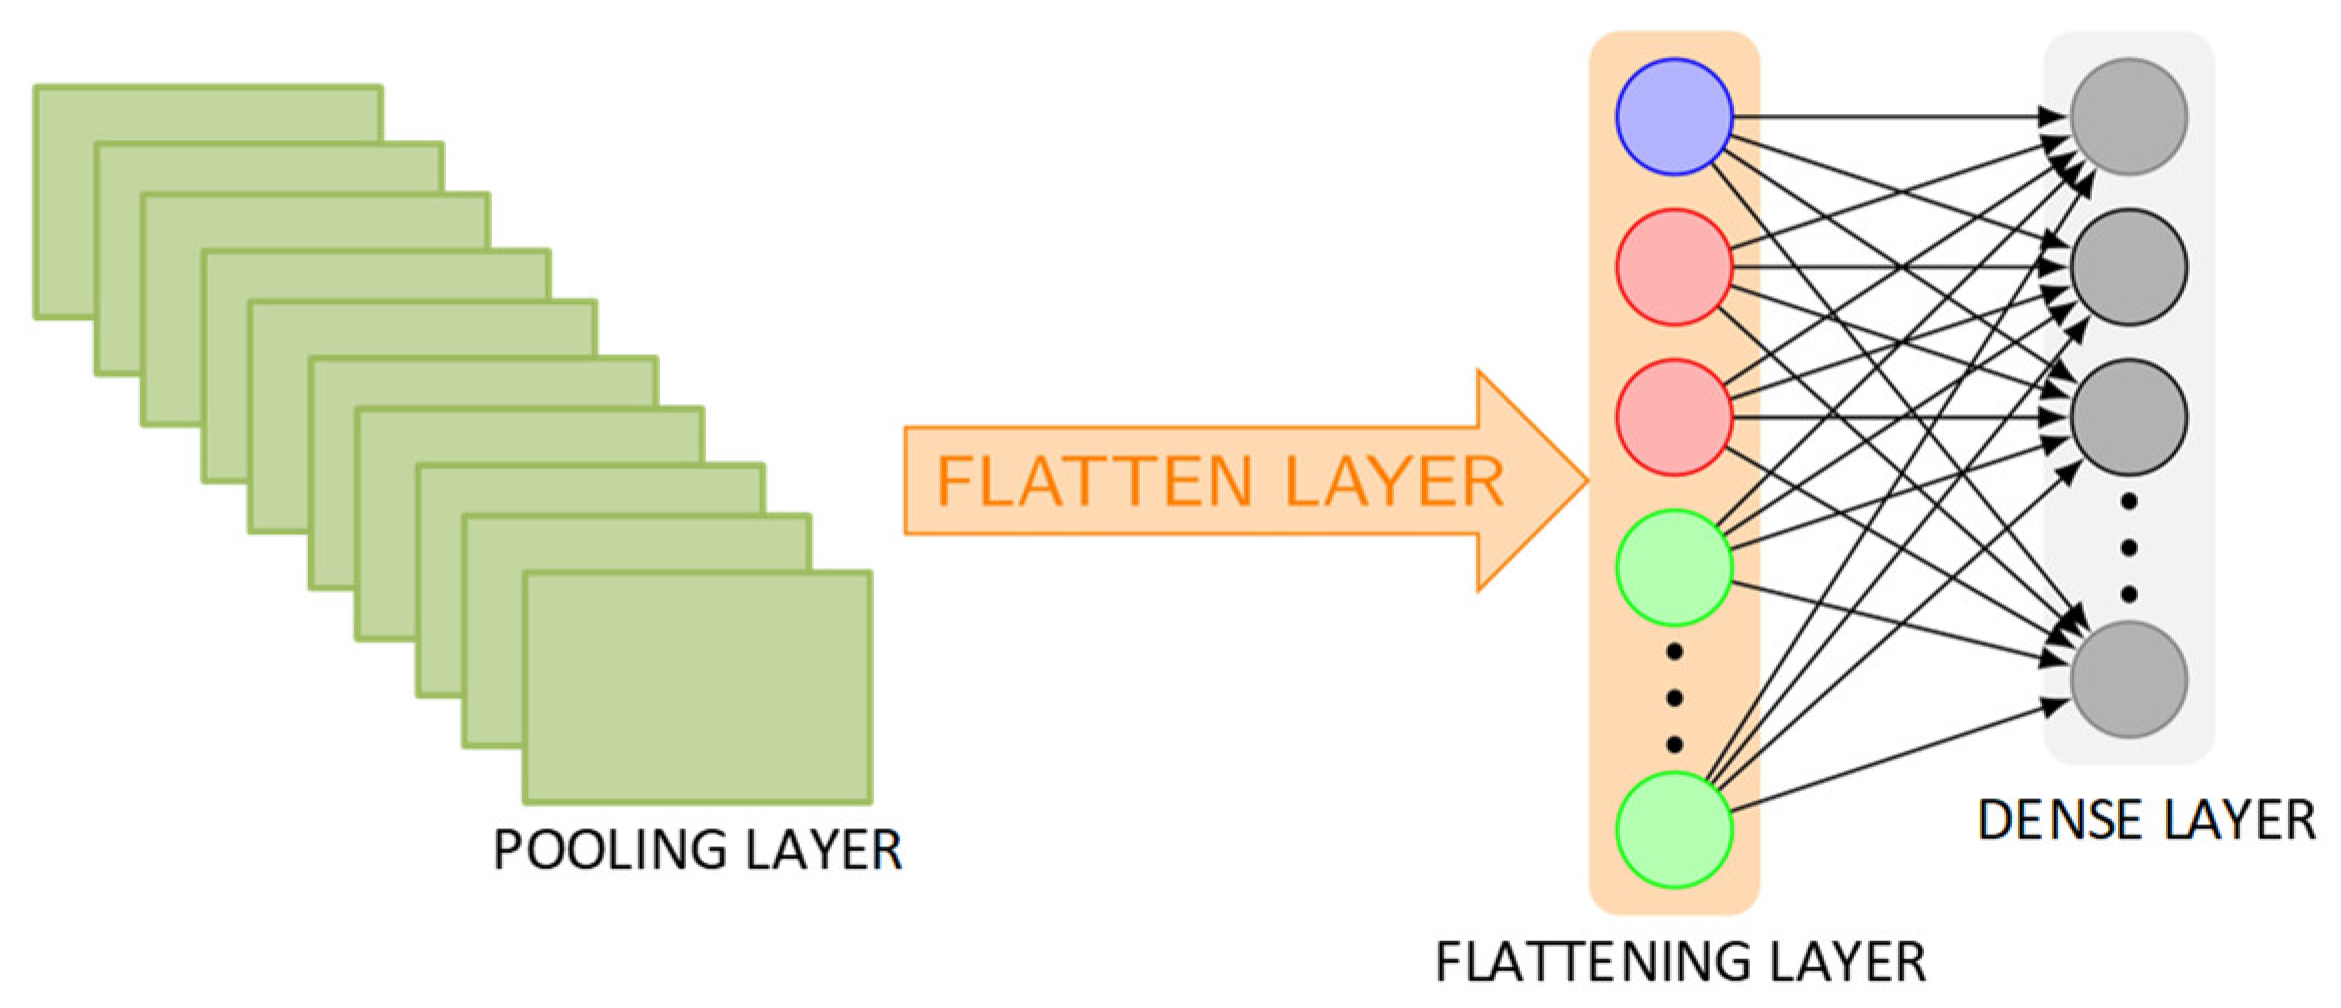
In the pooling operation, various functions such as averaging, minimum, and maximum are used to return the value from a rectangular neighborhood. The flattening layer is used to transform the convolutional layer’s output into a 1D feature vector where each unique value is represents a different feature.
Figure 4 depicts the flattening layer in action. Each node at one level is connected to every other node at the level before it, as well as the level after it, creating a layer known as the dense layer.
Moreover, the first two FC layers were dedicated to extracting high-level features at pixel level. The final FC layer of the AlexNet architecture was the classification layer to compute the probability of each class. Furthermore, a
activation function was included after each CL and FC layer to converge very quickly and avoid complex computations for GD (gradient descent) function in backpropagation. The loss function, used in the backpropagation process, maps the values of one or more parameters into a real integer that reflects a cost related to the event. During the training of the proposed model, the value of the loss function was reduced in the backpropagation process by applying the chain-rule. Moreover, the max-pool and dropout functions were employed in fine-tuned AlexNet layers to minimize the effect of overfitting issue. The max-pool function was placed after the first, second, and final CLs, while a dropout function was added in the first two FC layers. The grayscale images of size 200 × 200 were fed as to input to first convolution layer as shown in
Figure 5.
As the datasets for crowd anomaly detection comprise a small number of image frames, therefore, training the DL model from scratch may not be effective. In such cases, the transfer learning architectures plays an important role in the detection of new images, such as crowd images. Furthermore, the transfer learning models can be retrained easily on new images using a personal computer. Therefore, this study employed transfer learning by fine-tuning AlexNet to build a model for crowd anomaly detection by using less computational resources. In the construction of a fine-tuned model for anomaly detection, several experiments were performed to achieve optimum results by adjusting few parameters. The proposed model was trained using gradient descent. The other parameters adjusted are as follows: epochs of 50, momentum of 0.9, learning rate of 1 × 10⁻⁴, batch size of 16, and drop rate of 0.5. Additionally, the random sub-sampling (80–20%) method was utilized for model training and testing. The softmax classification algorithm was employed for validation process. Finally, the features were retrieved before the final layer to construct a master feature vector (MFV), which was fed as an input to six machine learning algorithms to evaluate the performance.
3.4. Feature Reduction
An MFV might not support the traditional ML algorithms to attain the exact accuracy in stipulated computational resources and time. Thus, the resulting features were optimized using two renowned feature reduction methods: IG and PCA. These helped us produce top-informed and discriminative features of the MFV subset. The feature reduction process is formed in three steps. Firstly, an FST (feature score table) was created through the MFV. Secondly, an FAT (feature accuracy table) was created through the FST. Lastly, the most accurate results were achieved using the least number of feature subsets. Three main reasons backed the selection of PCA and IG PCA methods. Firstly, in various studies, these methods have shown successful results as compared to other techniques. Secondly, the images had highly correlated features because of the common pixels among the neighboring pixels. Nevertheless, real-life images generally have some inconsistencies/noise because of varying intensity, color, and lighting effects caused by video recording devices and image-acquisition protocols. Therefore, an entropy-based feature selection technique helps to investigate pure contributions for all dimensions towards the intended class label (normal or anomaly). Thirdly, for image frames and their high dimensional data, PCA was mostly used to control the dimensionality without losing significant information. Furthermore, varying information in the data needs to be stored. Hence, PCA is a well-informed mathematical technique used to reduce the dimensionality of images and maximize the embedded information variations.
3.5. Classification Models
The extracted features were fed as input to six machine learning classifiers, namely, Support Vector Machine (SVM), Naïve Bayes (NB), Decision Tree (DT),
k-NN where
k = 1, Softmax, and Linear Regression (LR). These six machine learning classifiers were employed to evaluate which one delivers better classification results on all three datasets. Moreover, no single machine learning classifier can achieve consistently better results on each type of data [
25]. Therefore, the performance of various classification algorithms must be evaluated to determine which one delivers better results on all three datasets. Thus, this study evaluated the performance of six machine learning classifiers on the extracted features discussed in
Section 3.3.
3.6. Evaluation Parameters
The proposed model was evaluated using two evaluation metrics, namely, AUC based on the ROC curve and average accuracy. ROC curve represented by a 2D graph between FPR and TPR along the
x and
y-axis respectively to show the performance of model’s predication ability. Mathematically, FPR and TPR are defined in Equations (2) and (3):
AUC is a valuable metric and is widely utilized to evaluate the machine learning models that involve imbalanced datasets [
26]. Furthermore, this metric analyzes the model performance with respect to each class and delivers a useful performance summary of the ROC to calculate the accuracy of a model by plotting a curve and calculating the area under it.
The ratio of correctly detected image frames to the total number of image frames for detection is known as average accuracy. Mathematically, the definition of average accuracy is shown in Equation (4):
where
represents the total image frames for detection.
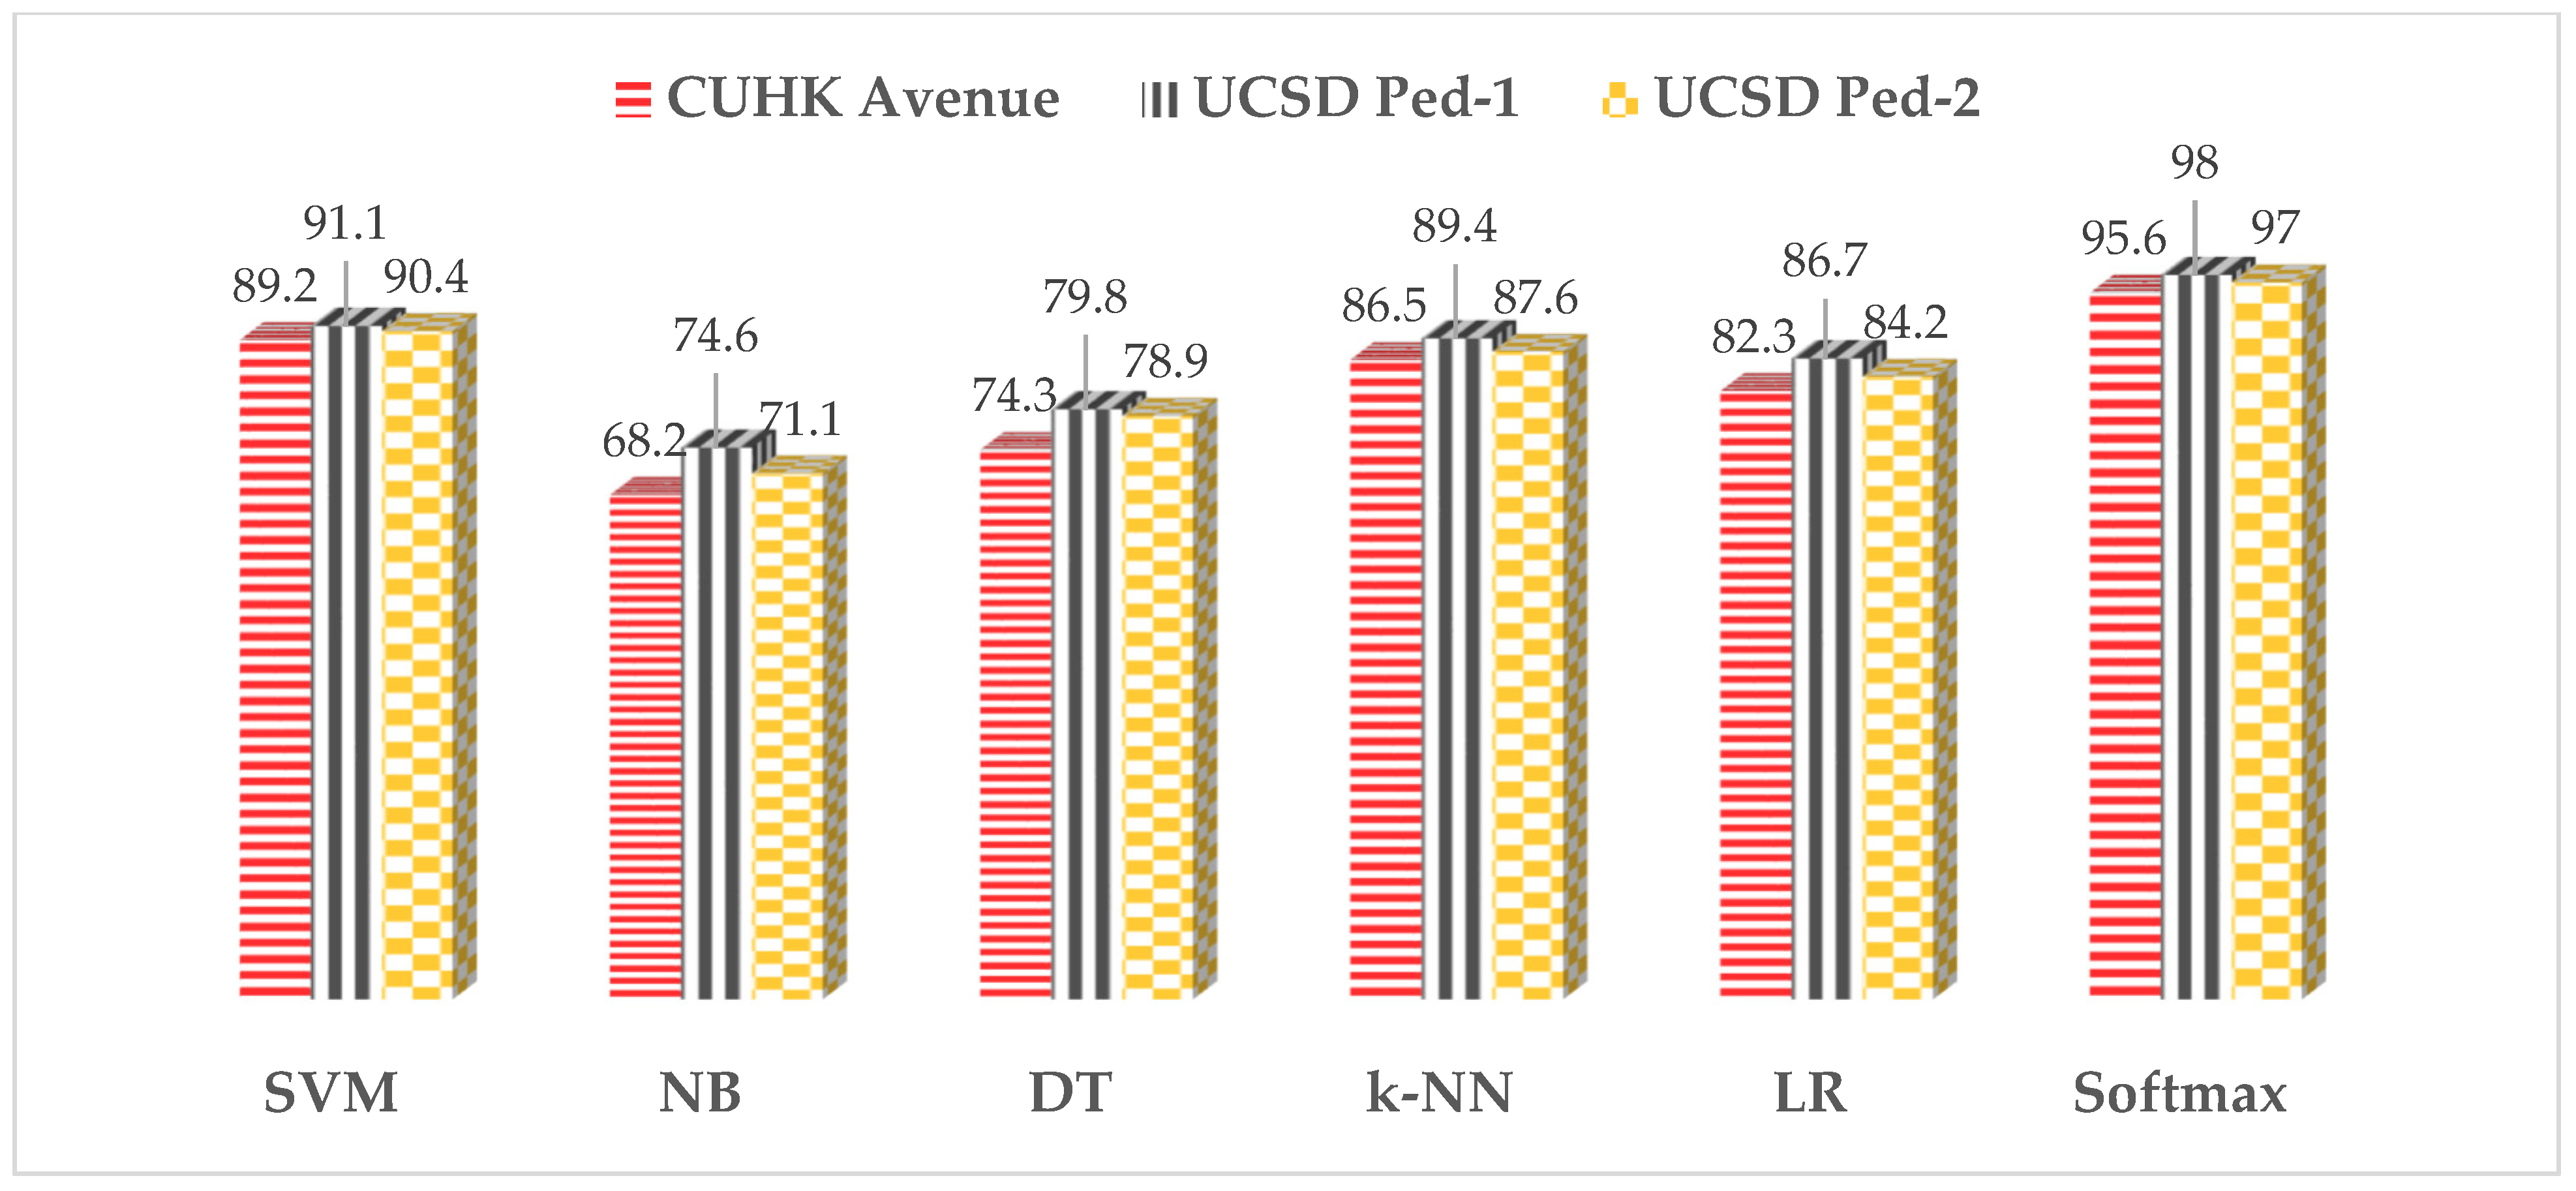
4. Experimental Results
This section presents and discusses the results of experiments conducted in terms of overall predictive accuracy and AUC. The features extracted from fine-tuned AlexNet were fed as input to six machine learning classification algorithms. In this experiment, 18 classification models (six classifiers × three datasets) were constructed and evaluated. The average accuracies of these 18 classification models are shown in
Figure 6. From the 18 classification models, it can be observed that the softmax classifier outperformed the five other machine learning classifiers by achieving an average accuracy of 9,9,9 on the Avenue, UCSD Ped-1, and UCSD Ped-2 datasets, respectively. Nevertheless, the average accuracies of the SVM were slightly less than that of the softmax classifier. The NB and DT classification algorithms achieved the lowest average accuracies on all three datasets.
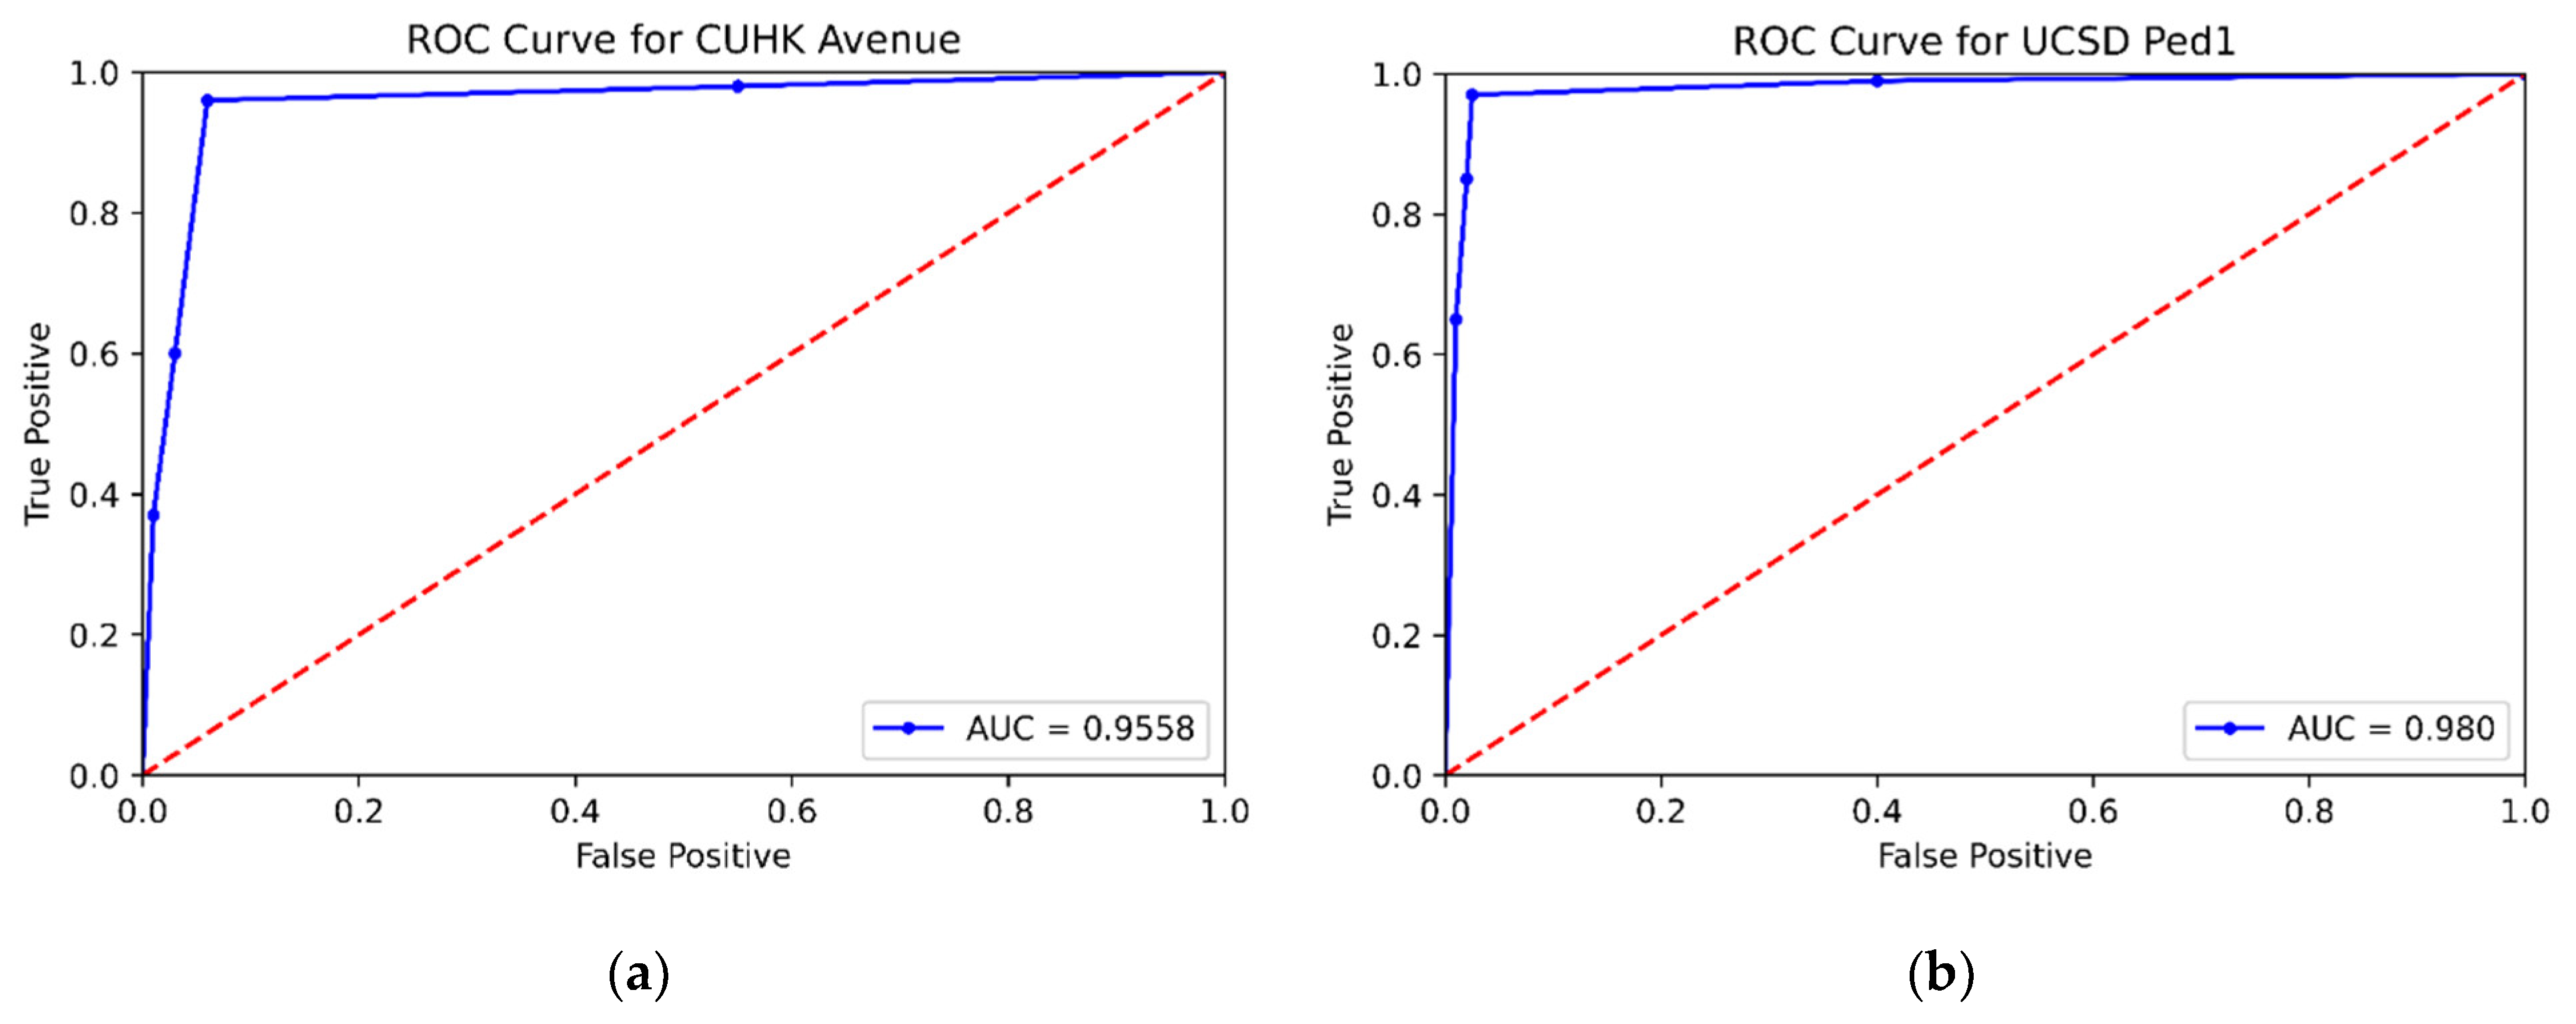
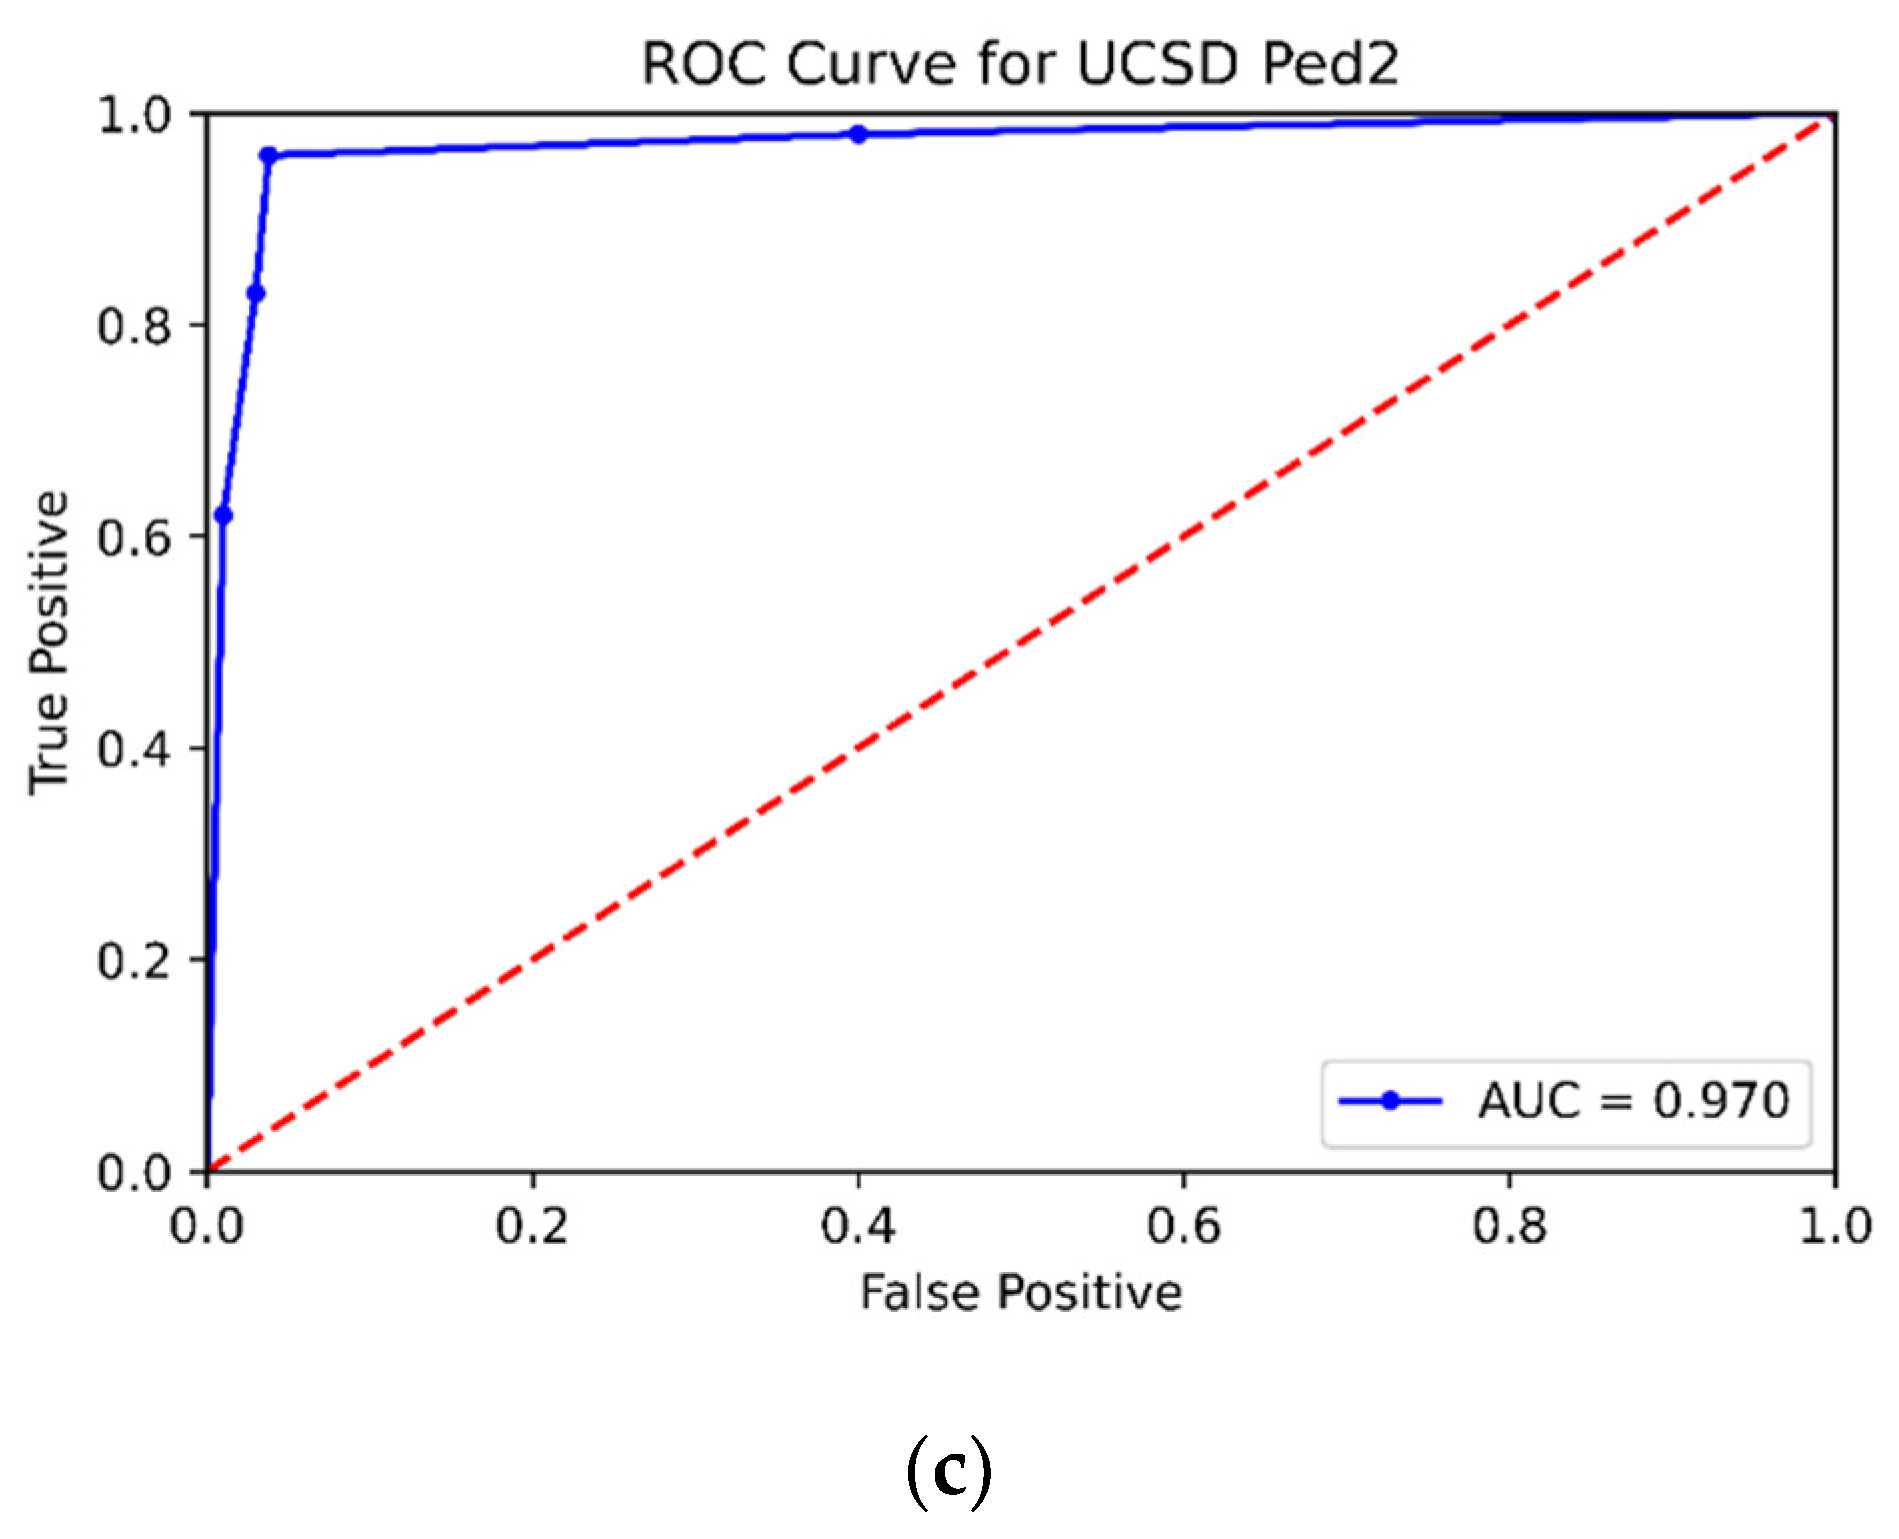
The AUC is the area under the ROC with a minimum value of 0 and a maximum value of 1, as shown in
Figure 7. A value close to 0 represents the worst performance of the classification model, whereas a value close to 1 represents the best performance of the model. The AUC values of the proposed method for all three test datasets and other existing classification models are presented in
Table 2 under the same experimental conditions (video frames, datasets, evaluation parameters, training and testing data ratio, etc.). It can be seen from
Table 2 that the proposed method achieved better results than other methods. Comparative analysis of the performance is performed based on the area under the curve, where the recurrent convolutional neural network [
6] and the fine-tuned CNN yield a maximum performance which is considerably lower than our proposed technique (98.0). In addition, the proposed method achieved 95.6%, 98%, and 97% AUC for Avenue, UCSD Ped-1, and UCSD Ped-2, respectively, which is better than the baseline supervised and unsupervised techniques in existing literature.


 ,
, 


