Article

OTL-Classifier: Towards Imaging Processing for Future Unmanned Overhead Transmission Line Maintenance

1
Hubei Collaborative Innovation Center for High-efficiency Utilization of Solar Energy, Hubei University of Technology, Wuhan 430068, China
2
Hubei Power Grid Intelligent Control and Equipment Engineering Technology Research Center, Hubei University of Technology, Wuhan 430068, China
3
Hubei Key Laboratory for High-efficiency Utilization of Solar Energy and Operation Control of Energy Storage System, School of Electrical and Electronic Engineering, Hubei University of Technology, Wuhan 430068, China
*
Authors to whom correspondence should be addressed.
Submission received: 19 September 2019 / Revised: 23 October 2019 / Accepted: 29 October 2019 / Published: 1 November 2019

Abstract

:
The global demand for electric power has been greatly increasing because of industrial development and the change in people’s daily life. A lot of overhead transmission lines have been installed to provide reliable power across long distancess. Therefore, research on overhead transmission lines inspection is very important for preventing sudden wide-area outages. In this paper, we propose an Overhead Transmission Line Classifier (OTL-Classifier) based on deep learning techniques to classify images returned by future unmanned maintenance drones or robots. In the proposed model, a binary classifier based on Inception architecture is incorporated with an auxiliary marker algorithm based on ResNet and Faster-RCNN(Faster Regions with Convolutional Neural Networks features). The binary classifier defines images with foreign objects such as balloons and kites as abnormal class, regardless the type, size, and number of the foreign objects in a single image. The auxiliary marker algorithm marks foreign objects in abnormal images, in order to provide additional help for quick location of hidden foreign objects. Our OTL-Classifier model achieves a recall rate of 95% and an error rate of 10.7% in the normal mode, and a recall rate of 100% and an error rate of 35.9% in the Warning–Review mode.

1. Introduction

Nowadays, people’s daily life and industrial facilities are highly dependent on electric power. Therefore, research on electric power facilities inspection and maintenance is very important for ensuring a stable power supply. A lot of overhead transmission lines have been installed to distribute energy across long distances in the world. It is meaningful to prevent sudden wide-area outages caused by foreign objects suspended on uninsulated overhead transmission lines.
At present, foreign objects could be detected by foot patrol, piloted helicopter patrol, drones inspection, and transmission line robots inspection. Foot patrol is risky or unable to pass through complex areas such as highways, rivers, and mountains. Helicopter inspection is expensive and also limited by the shortage of pilots. Though unmanned drones and specialized robots are still not used in practice for various limitations such as path planning, law, and regulations. However, they are still highly considered by the electric power field for future maintenance of smart grids.
The main challenges of using drones for UAV (Unmanned Aerial Vehicles) maintenance are automatic pilot, flight time and communication bandwidth. The authors in [1] aim at solving automatic transmission line tracking problems. The authors in [2,3] face path planning and routing challenges when UAVs are flying along power transmission lines. The authors in [4,5] study wireless charging techniques for the increasing of drone’s flight time. The authors in [6] focus on UAV communication toward 5G, which supports high-speed camera data transmission.
The PTL (Power Transmission Line, PTL) maintenance robot equipped with cameras can walk through transmission line for inspection. It is possible to perform inspection and maintenance work at a low cost in the future. Recently, transmission lines have been built with bundled conductors because of the increasing power demand. However, conventional robots can only inspect a line while traveling along it [7]. Thus, most research focused on developing new robot architectures for smart navigation over bundle transmission lines [8,9,10].
With the rapid hardware development of smart drones and PTL maintenance robots, the demand of automatic data processing for transmission line inspection will increase quickly. A number of research works have been carried out to extract transmission lines, insulators, and foreign objects from aerial images automatically. The authors in [11] use Robot LiDAR data for cable inspection, [12] extracts power lines based on Markov Random Field theory, foreign objects are detected with a morphology-based approach [13] and a motion compensation based method [14], and all of them use traditional algorithms. As reviewed in [15], the potential of deep learning in power line inspection is promising. For example, the automated inspection of insulator [16], transmission towers [17], and transmission lines [18] based on deep learning have already been carried out. The detection of foreign objects on transmission lines based on Faster-RCNN and YOLO (You Only Look Once) were also studied in [19,20] respectively. However, the foreign object image used for the experiment are images with foreign objects by default, so the algorithm does not have the classification function. In addition, the amount of data they use for experiments is very small, and the number of images in our dataset is more than 10 times that of them. There are also some detection algorithms for the detection of insulators. It is more challenging to detect foreign objects without a fixed shape compared to insulators with regular shapes.
Enlightened by image classification and object detection architectures based on deep learning (i.e., VGG [21], ResNet [22], Inception [23,24], Faster RCNN [25], and SSD (Single Shot MultiBox Detector) [26]), a two-stage approach is proposed for automated image processing, which detects and marks foreign objects in the image. The model is trained, fine-tuned, and tested with images collected by electric maintenance departments. The reminder of the article is organized as follows: Section 1 reviews related work. Section 2 presents the methodology of the proposed model. Section 3 describes the preparation of data set. In Section 4, the experiment is analyzed and discussed. Finally, conclusions and contributions of this work are drawn in Section 5.

2. Methodology

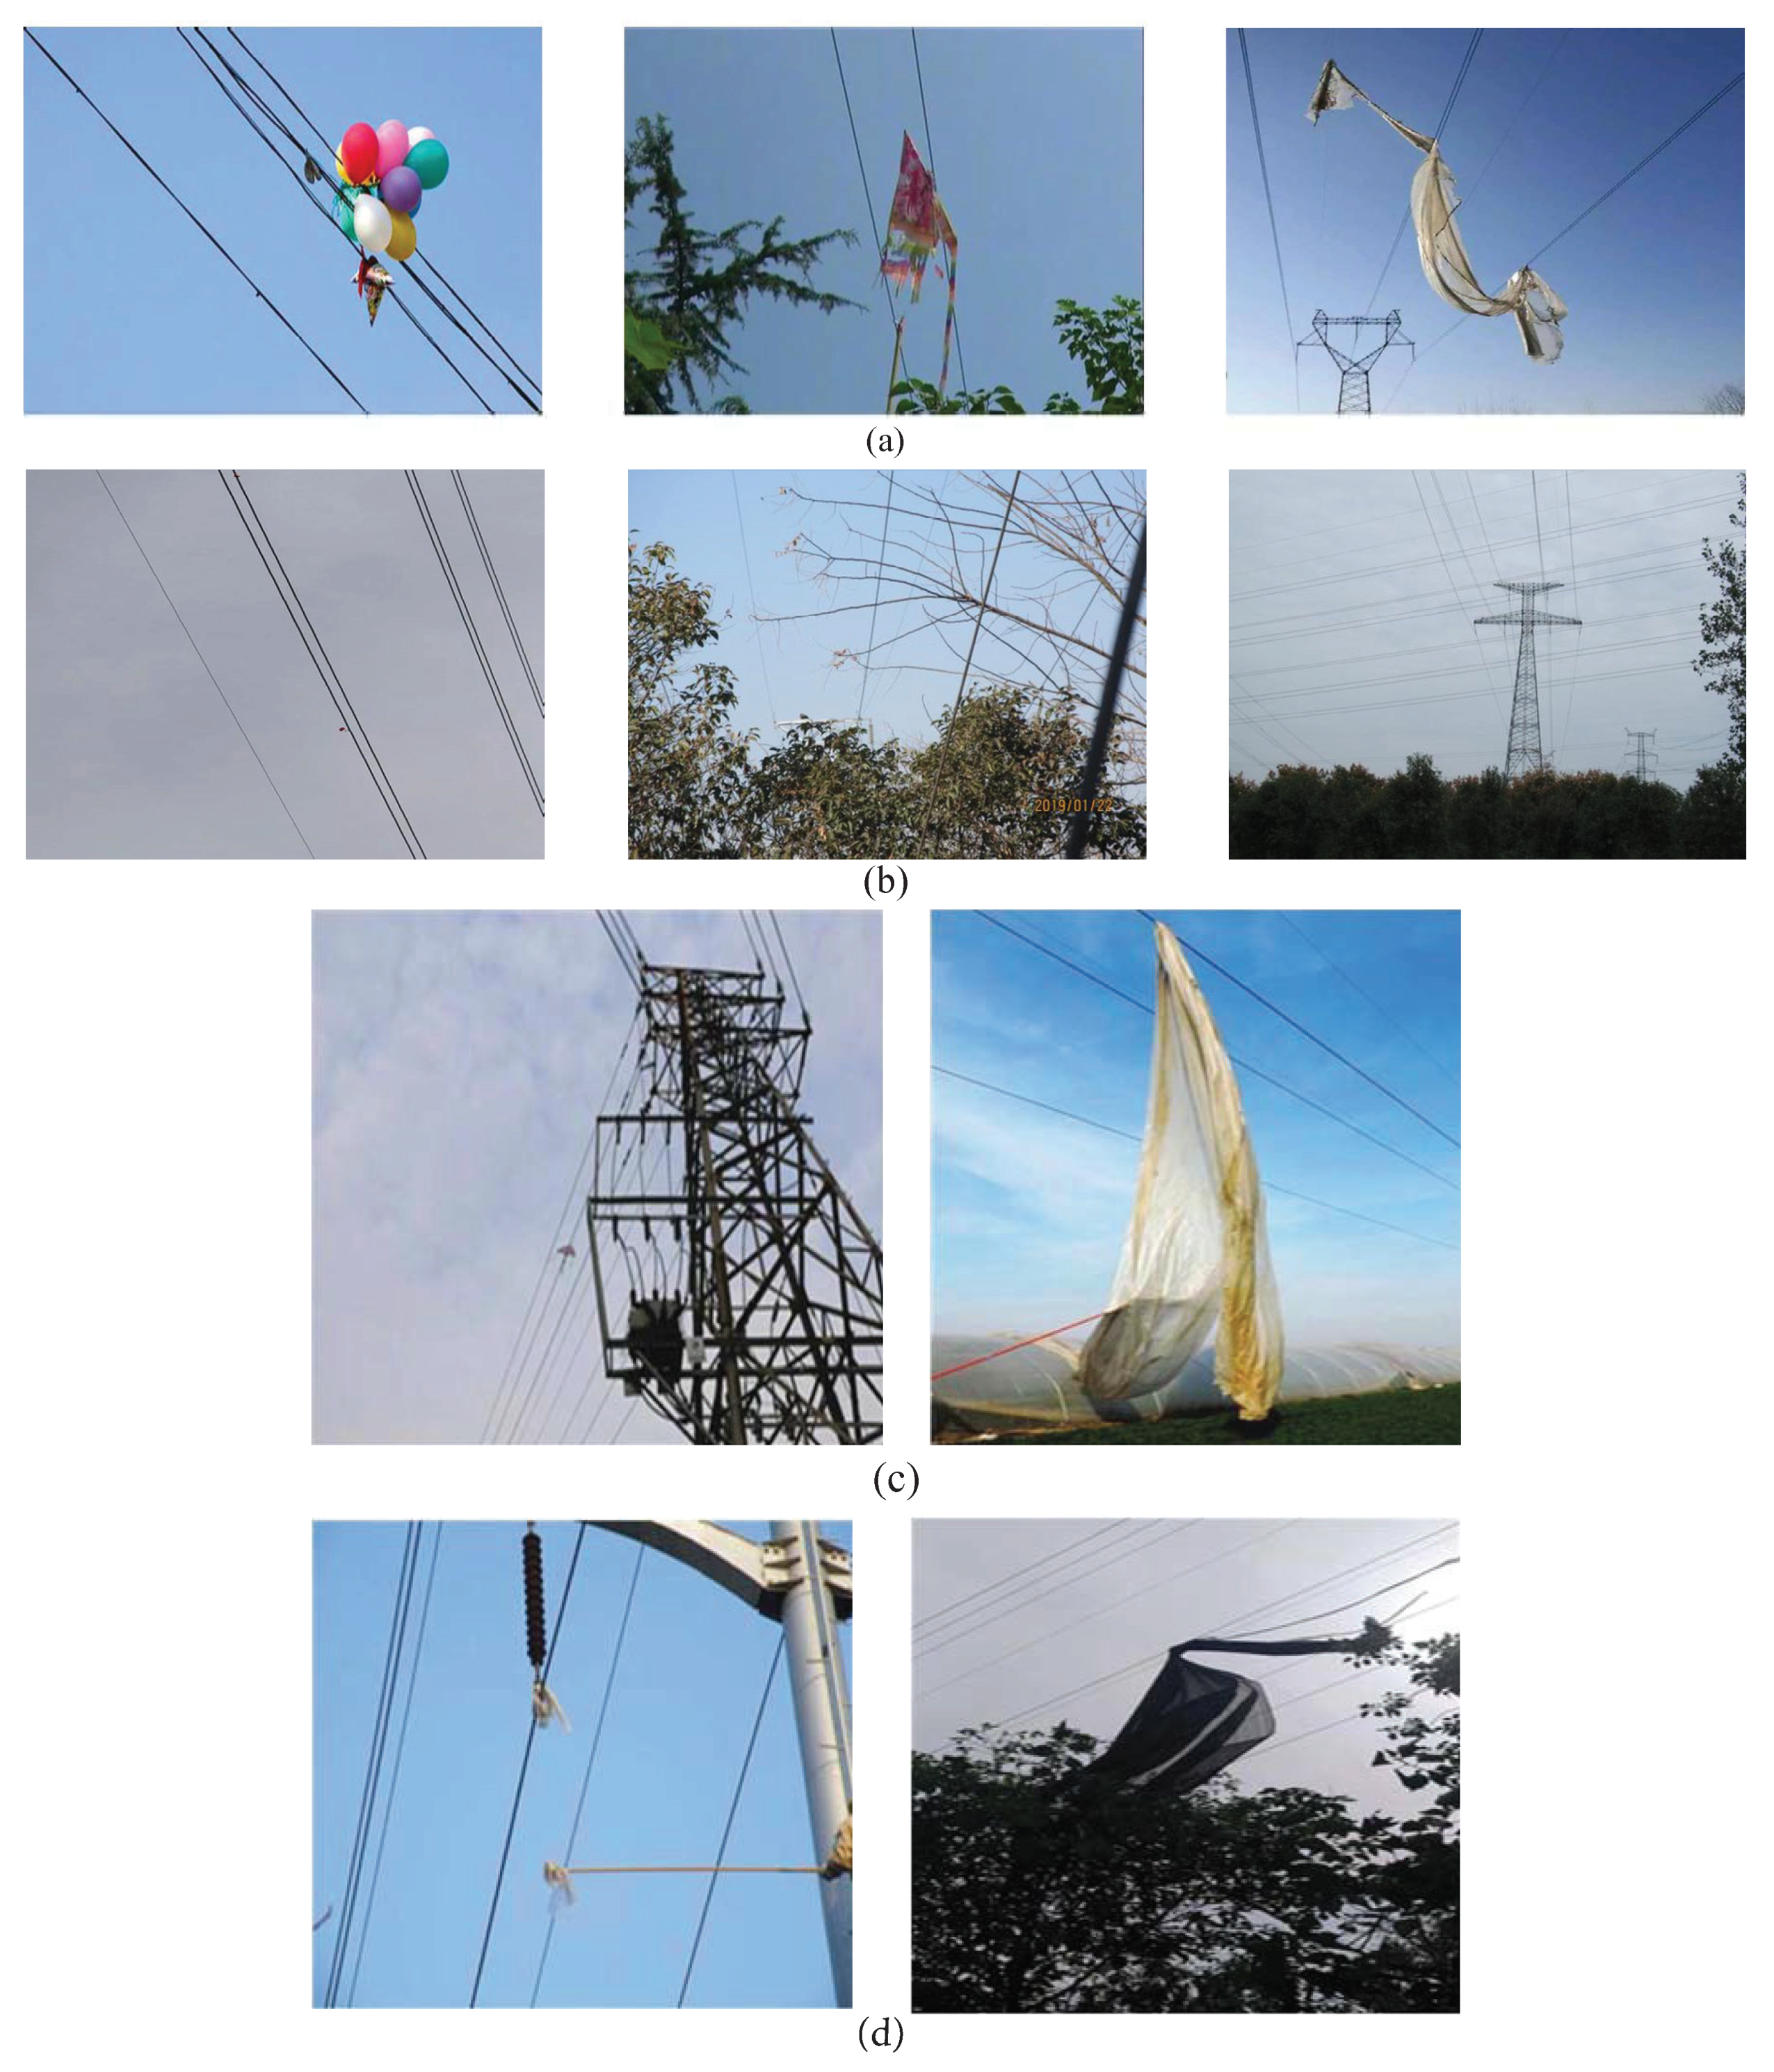
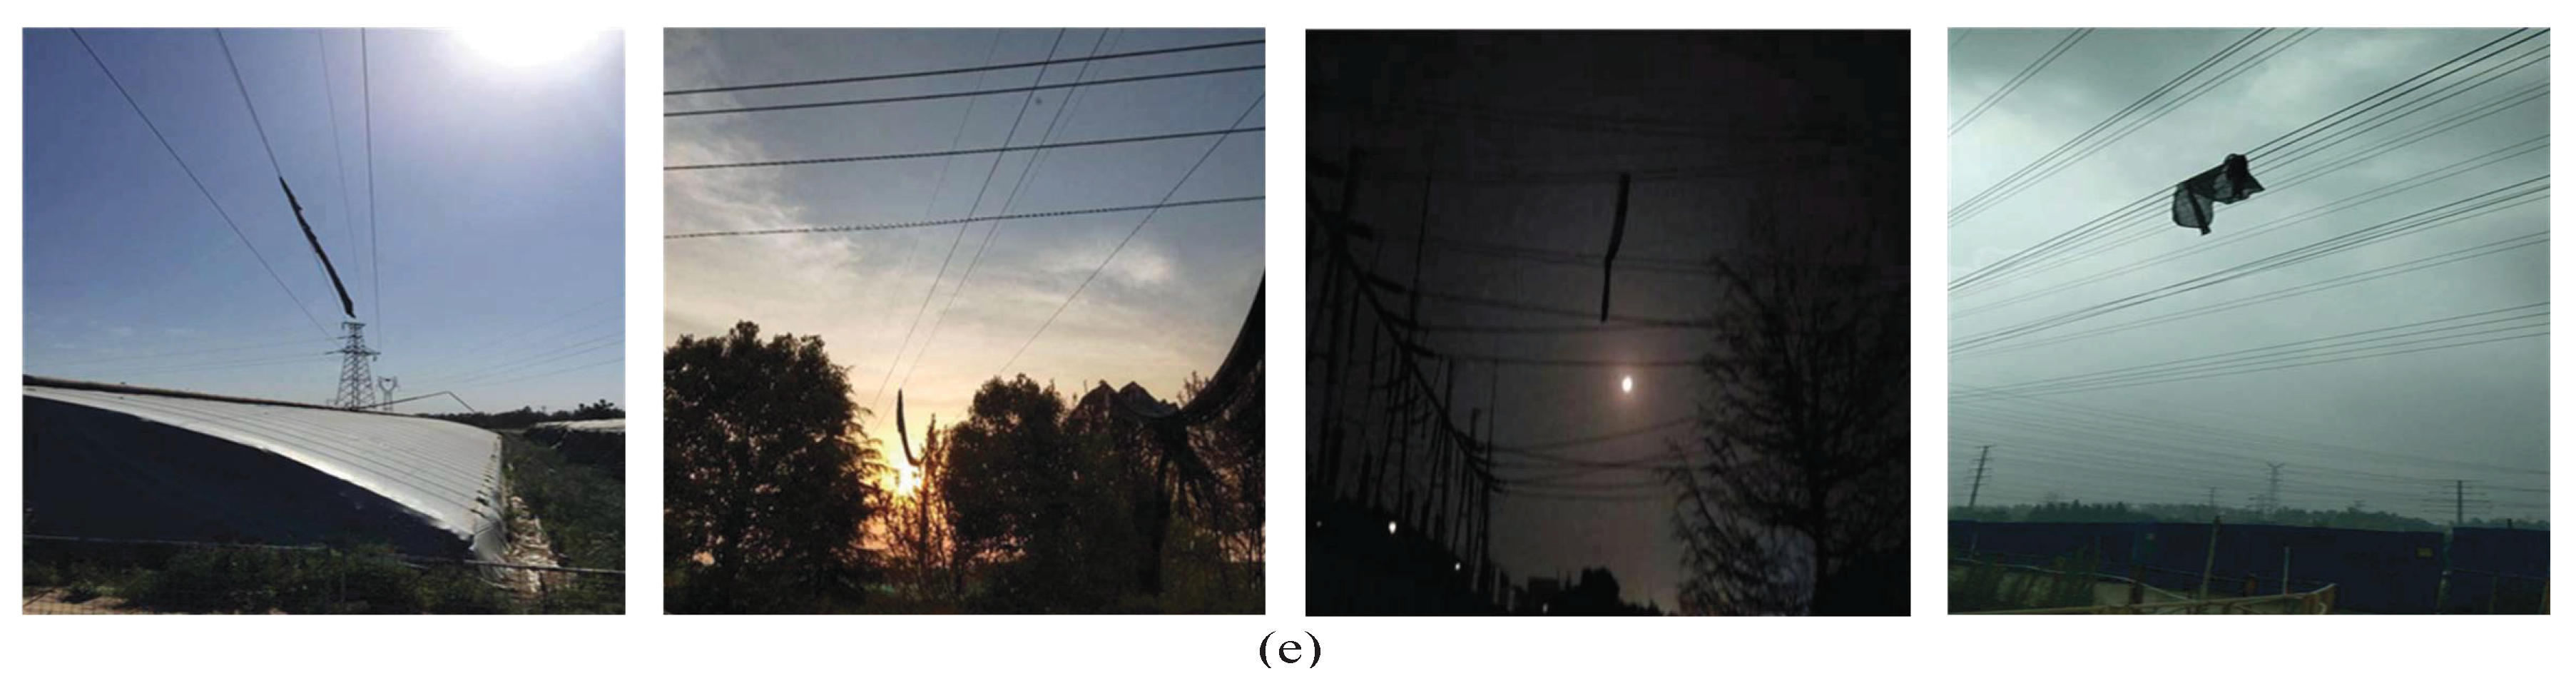
2.1. Problem Statement

Detecting foreign objects on overhead transmission lines is a very important work regarding power system maintenance. Overhead transmission lines are a primary method for transmitting high-voltage power across long distances. The high energy of transmission lines requires very thick insulation to prevent the insulating material from catching fire itself. If they are insulated, the insulation would make power distribution lines too costly and very heavy and thus unlikely to set up in air. Thus, unlike low-voltage cable, overhead transmission lines don’t have insulation, they are insulated by air. During high-wind events, foreign objects such as plastic greenhouses, kites, and balloons blew onto overhead transmission lines, thus prone to short-cuts or electrical sparks, causing power trips during humid seasons or wildfires during dry seasons.
In this study, we collected and sorted out the images that were retained during the manual cleaning of foreign objects in the transmission line, as shown in Figure 1. In addition, in the classification and marking, whether it is balloons, kites, or plastic greenhouses, we are uniformly classified as one class foreign object.

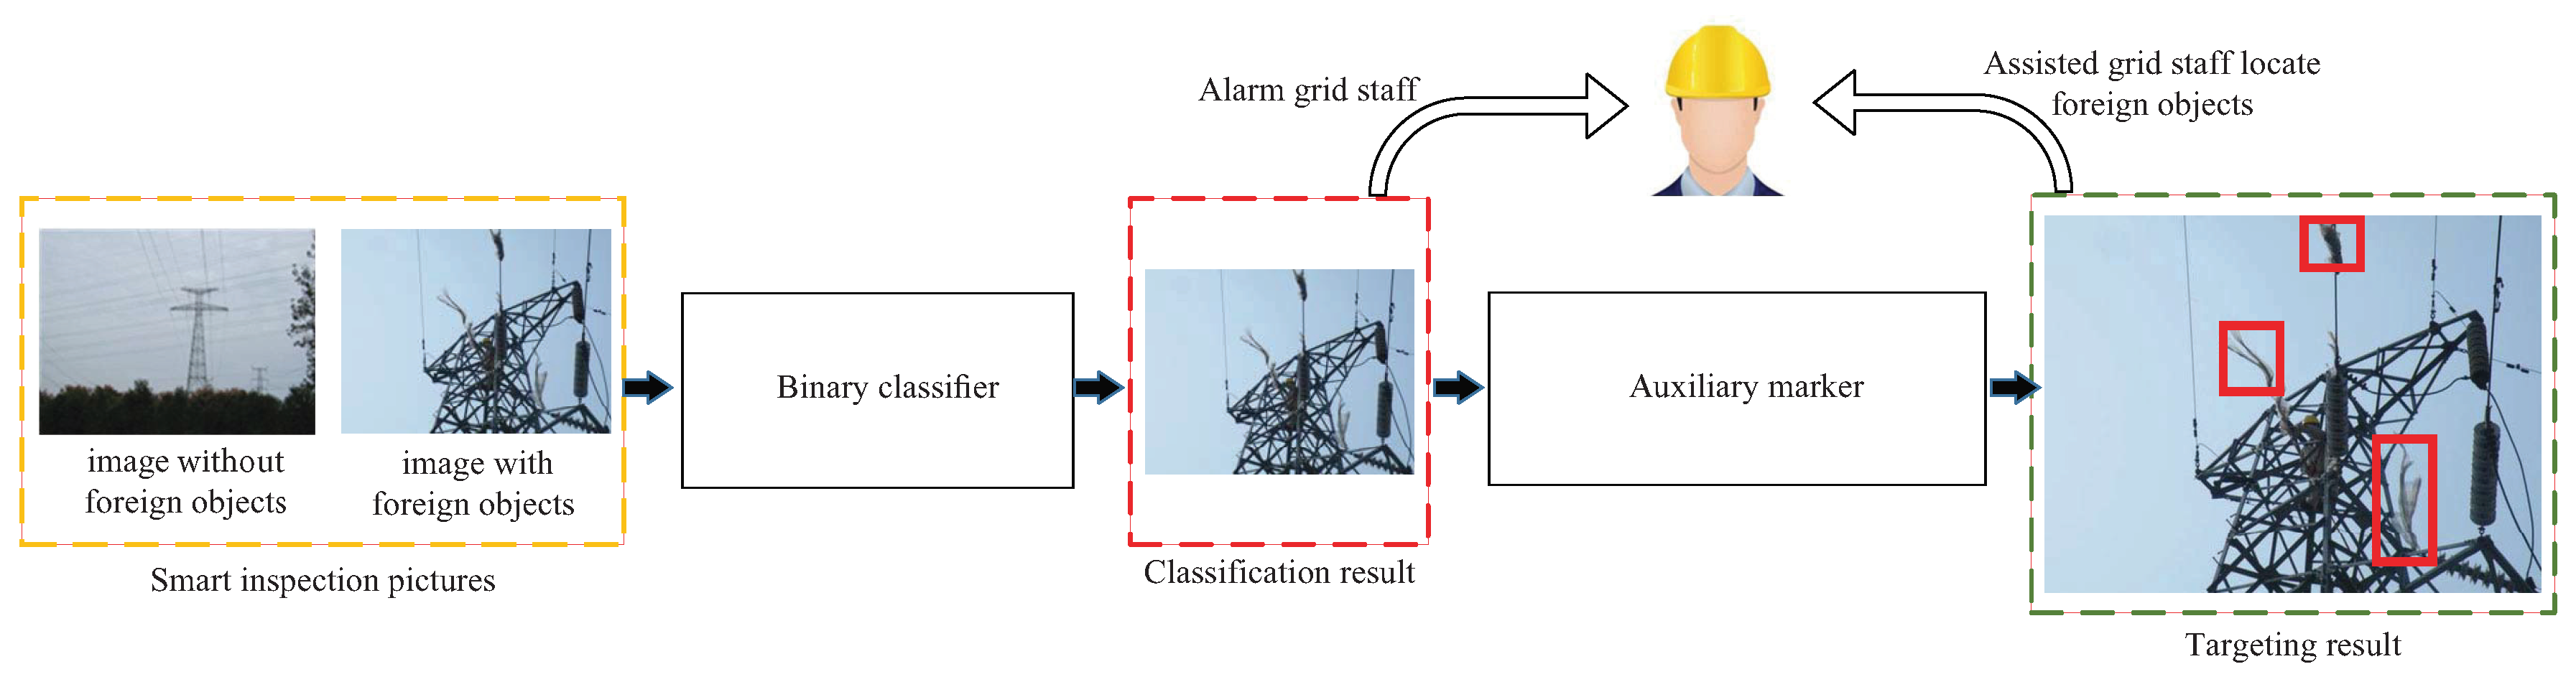
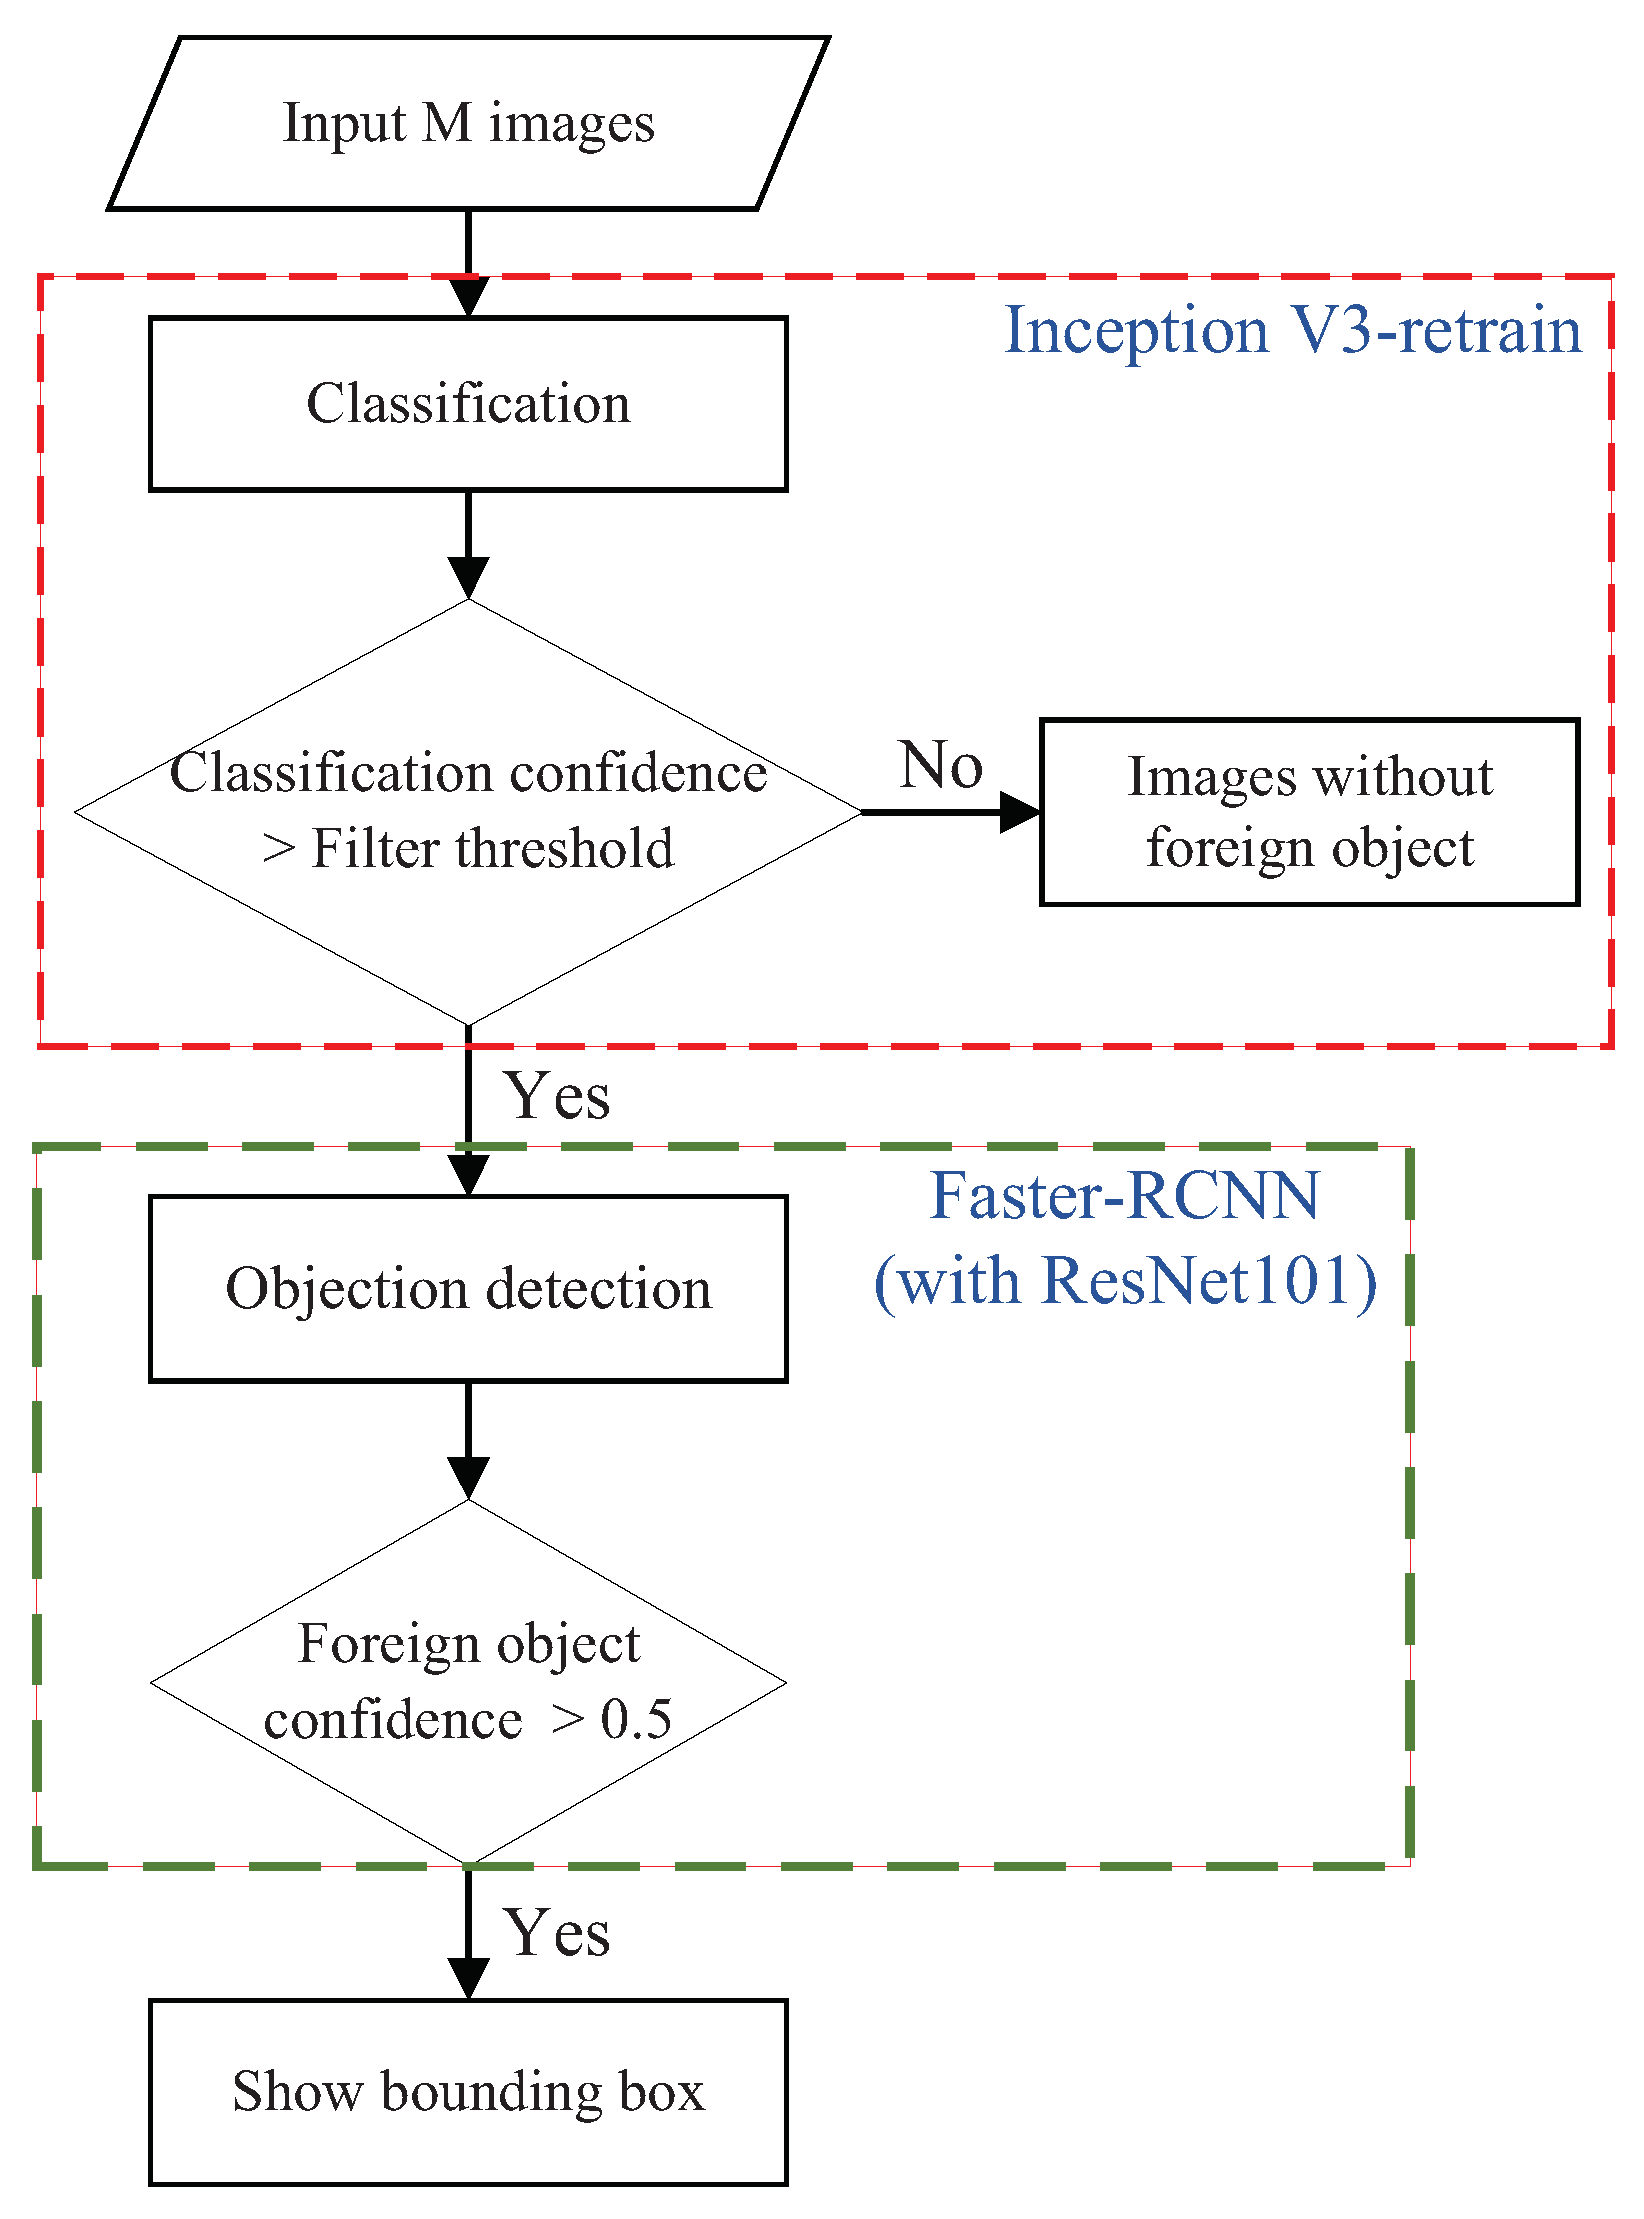
2.2. Warning–Review Strategy

In the first part, the algorithm workflow that constitutes the whole ’foreign object image classification-warning-personnel review’ is introduced. We also introduce the framework used in the image classification algorithm and the target detection algorithm. In the second part, the preparation and division process of the data used in the experiment are described.
All of the test images in references [19,20] are images with foreign objects, which is equivalent to artificially removing the interference image without foreign objects before their foreign object detection algorithm detects it.
However, the images collected by the current intelligent inspection equipment contain a large number of images without foreign objects. In order to get closer to the real inspection situation, in this paper, the images used for training and testing algorithms are composed of the image with foreign objects and the image without foreign objects. The whole process is shown in Figure 1, which is the biggest difference between the research work of this paper and the previous research. After the mixed inspection image passes the classification algorithm of the first stage, the image with a foreign object may be marked by the classification algorithm, thereby alerting the power grid staff and prompting the staff to review the image with the alarm.
In the first stage, this paper focuses on the 100% recall rate algorithm and trains and tests SVM (Support Vector Machine), InceptionV3-retrain, InceptionV3-fine-tuning, and InceptionV4-fine-tuning. In the second stage, the inspection image marked as the presence of foreign object is sent to the target detection algorithm, and the region where the foreign object exists in the image is located and marked with a rectangular frame. The significance of this step is to assist the staff to quickly determine the type of foreign object and locate the position of the suspended foreign object. This paper has trained and tested SSD, Faster-RCNN, Faster-RCNN, and Faster-RCNN in this section. All the algorithm structures are concentrated in Figure 2 and Figure 3. Please note that the rectangular block in the network structure is only indicative and does not represent the true size of a layer in the actual network.
When we test the algorithm, all of the 753 images in the testing set are first input into the classifier of the first stage, and then according to the set classification threshold, a part of the images in the testing set are marked as “images with foreign objects” by the classifier. Finally, only the image marked by the classifier is sent to the foreign object indicator of the second stage for foreign object detection. The entire algorithm flow is shown in Figure 3.

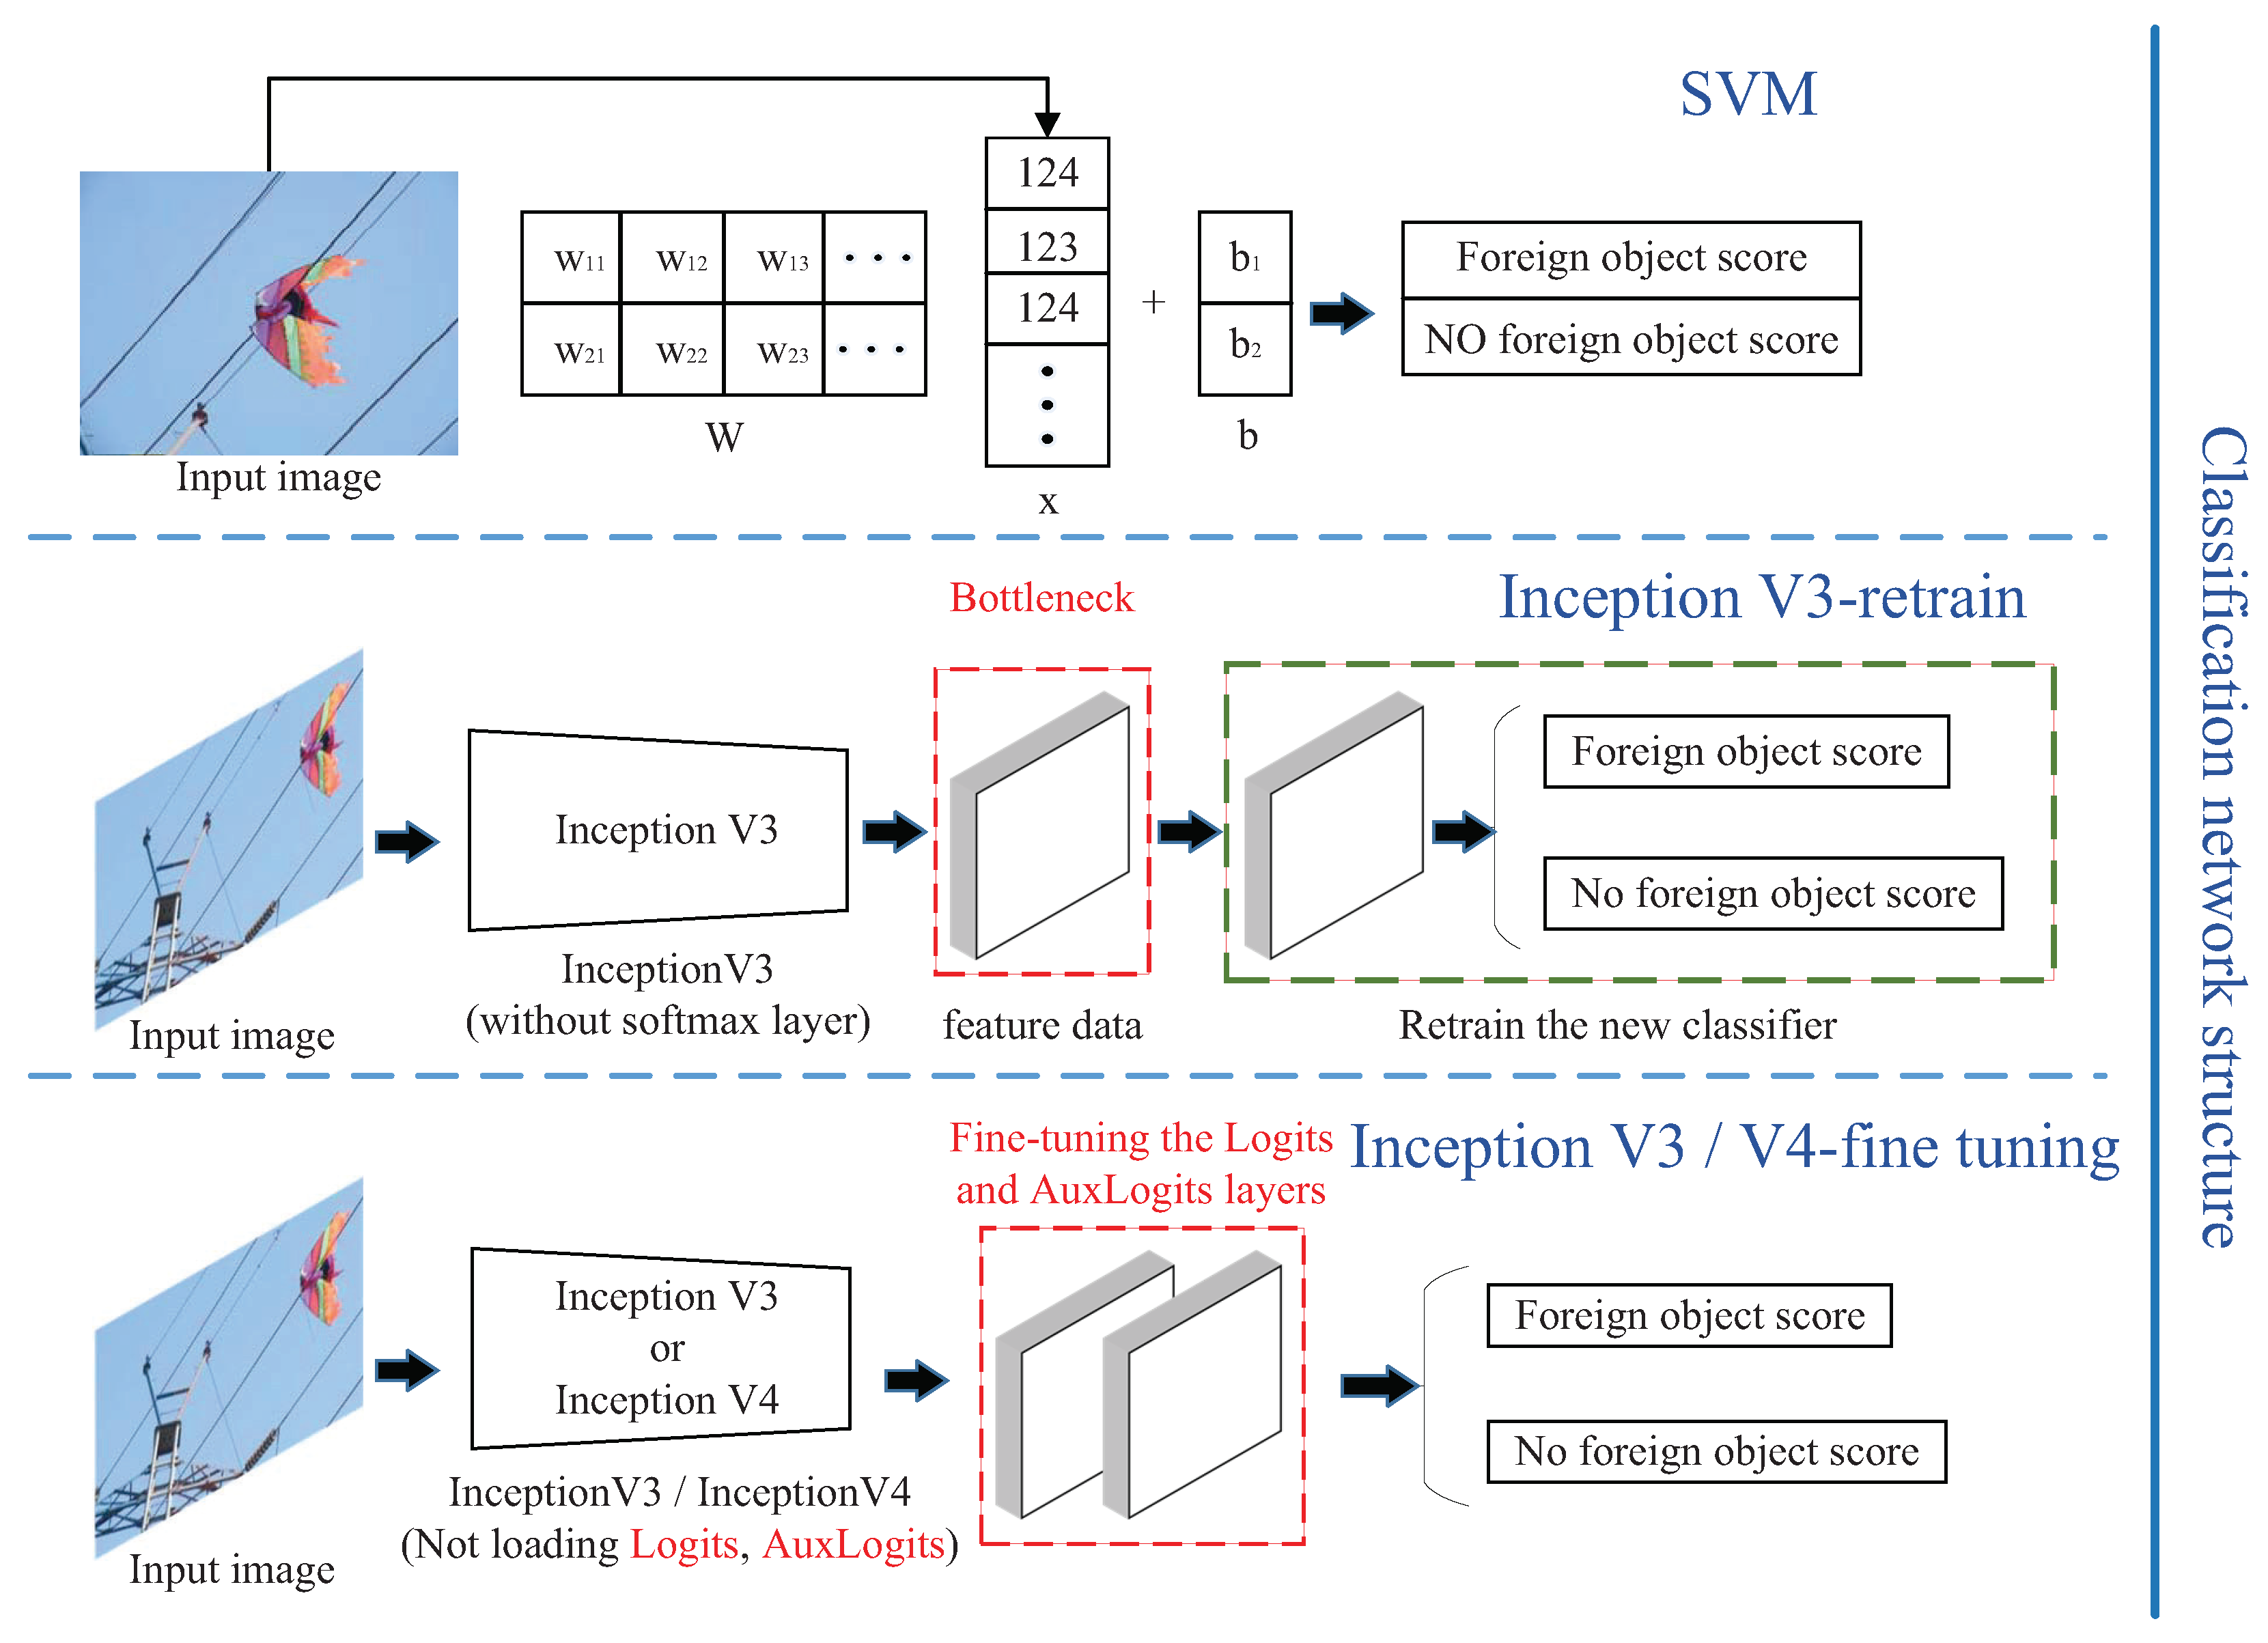
2.3. Binary Classification Module

2.3.1. SVM

The SVM algorithm flow can be represented as the first part of Figure 4. SVM is a generalized linear classifier that classifies data according to the supervised learning method. Its decision boundary is the maximum margin hyperplane for solving learning samples. The purpose of the SVM is to find a hyperplane to divide the samples into two categories with the largest interval. The ω obtained by the algorithm represents the coefficient of the hyperplane that the algorithm needs to find. In mathematical terms, it can be described as Label (1),
max 1 ω , s . t . , y i ( ω T x i + b ) 1 , i = 1 , , n ,
where y i { 1 , 1 } . The larger the score obtained by y i ( ω T x i + b ) , the greater the probability of predicting the category. Each image input into the SVM is compressed into a matrix of [ 1 × 3072 ] . There are two categories in the power line image classification. Therefore, the size of the matrix ω is [ 2 × 3072 ] , and the size of the matrix b is [ 2 × 1 ] .

2.3.2. Inception Retrain

The InceptionV3-retrain algorithm flow can be represented as the second part of Figure 4. This method using InceptionV3-retrain as a foreign object classification model for power lines mainly utilizes the PB file derived from the InceptionV3 model based on ImageNet image training. The last softmax layer of the model is changed to the foreign object image classifier, and the Bretleneck feature of the pre-training network is used as training data for the new classifier. When the new two-class network is trained by the retrain method, the parameters of all the layers in the previous part of the network are fixed. The program first loads the pre-training model of InceptionV3, and then stores the Bottleneck file generated after the training data set is input into the network. Then, use the feature data stored in the Bottleneck file to train the modified softmax layer as a classifier for the new task. Except for the last layer, the parameters of the other layers are all solidified and cannot be updated, so the training speed is faster and less time-consuming.

2.3.3. Inception Fine-Tuning

The InceptionV3/V4-fine-tuning algorithm flow can be expressed as the third part of Figure 4, and the foreign object classification model is fine-tuned under the InceptionV3 and InceptionV4 models provided by Google. The fine-tuning mode is to use a CKPT (checkpoint) file, which derived from the InceptionV3 or InceptionV4 model based on ImageNet image training. During the training process, the parameters of the entire network can be modified accordingly, not only limited to the replaced softmax layer. The fine-tuning for InceptionV3/V4 is done by loading the pre-trained model without loading the parameters of the Logits layer and AuxLogits layer, and then fixing the parameters of all layers before. The foreign object training data set only trains the newly created Logits layer and AuxLogits layer. When fine-tuning the model, restoring checkpoint weights requires attention. In particular, when a new task is fine-tuned with an output tag different from the number of ImageNet detection tasks, the final classification layer cannot be restored. Therefore, this paper uses the ‘checkpoint_exclude_scopes’ flag, which prevents certain variables from being loaded. For example, if the ImageNet trained model is fine-tuned on the foreign object classification dataset, the pre-trained logits layer has dimensions [ 2048 × 1001 ] , but the new logits layer has dimensions [ 2048 × 2 ] . Therefore, the flag indicates that the TF-Slim avoids loading these weights from the checkpoint.

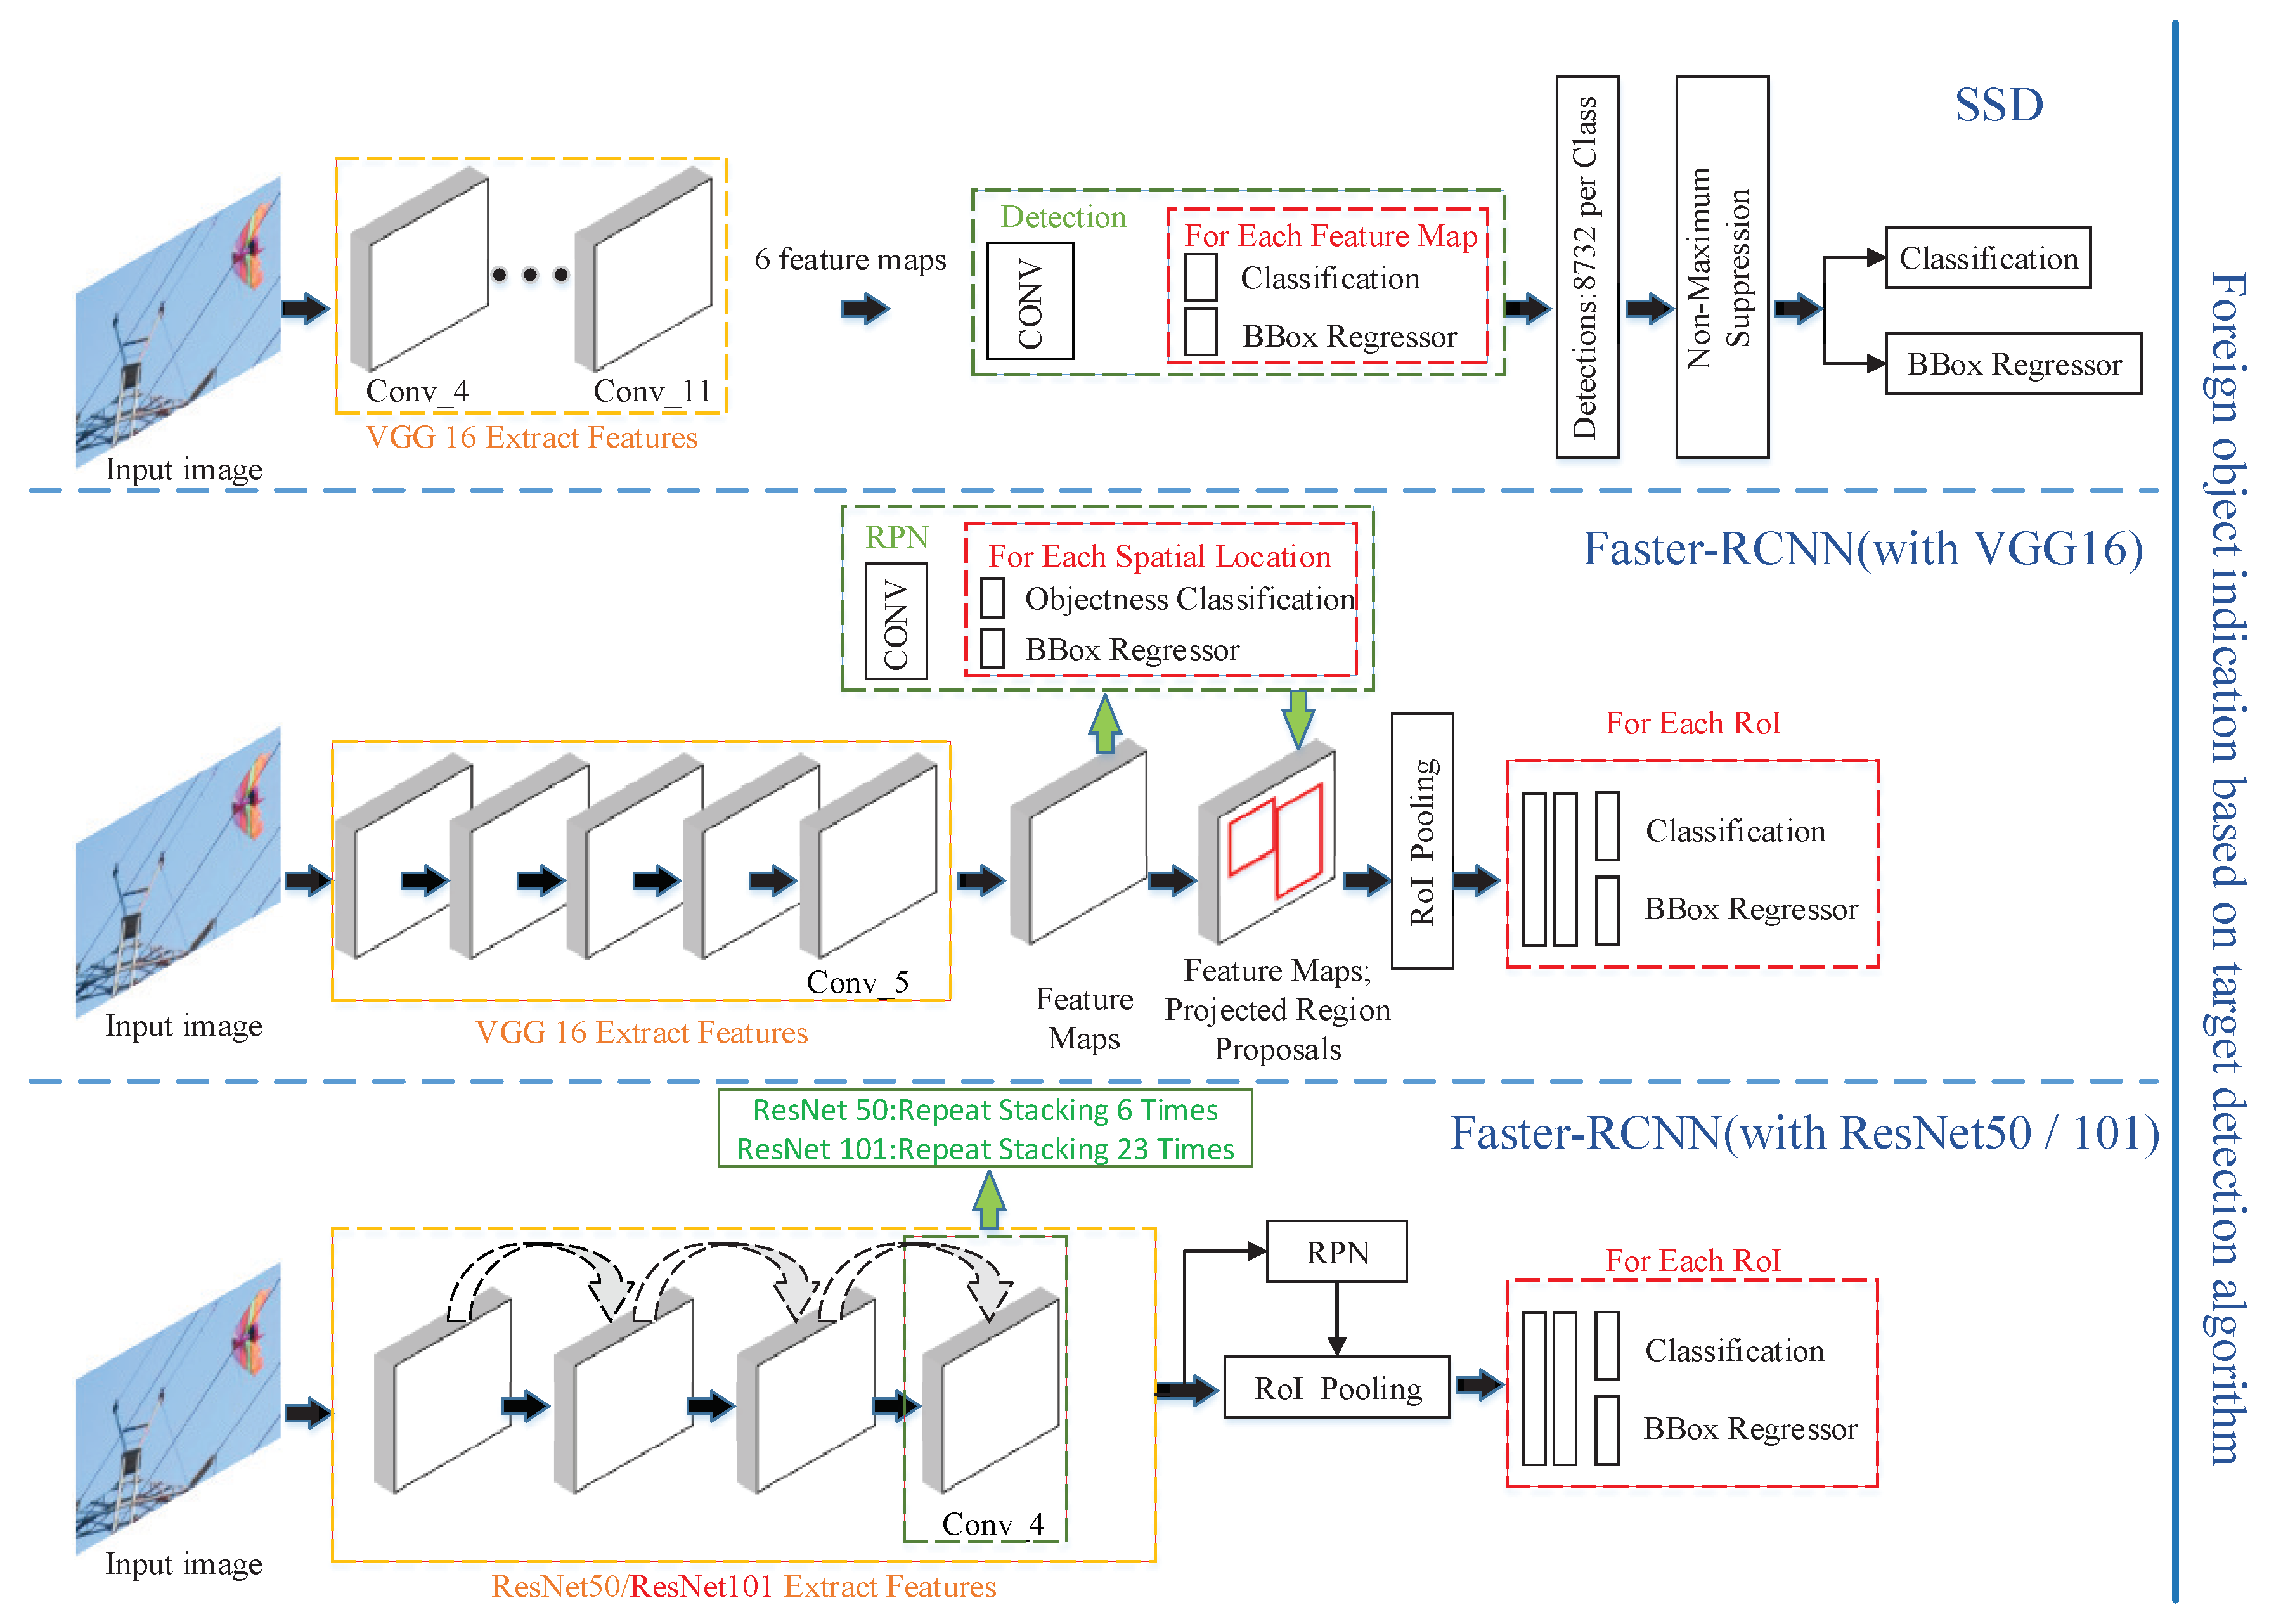
2.4. Auxiliary Marking Module

2.4.1. SSD with VGG16

The SSD (with VGG16) algorithm flow can be represented as the first part of Figure 5. When training the target detection algorithm, the training data used are manually labeled foreign object images. The VGG-16 (Visual Geometry Group Network 16) model has sixteen convolutional layers and five pooled layers and three fully connected layers connected to a softmax layer. Conv4, Conv7, Conv8, Conv9, Conv10, and Conv11 are extracted separately in SSD as the feature layer of classification and box regression. In the SVM model experiment, each image is scaled to a size of 300 × 300 , and the number of predicted classifications (ClassesNum) of the six feature layers according to Formula (2) is 2,
C l a s s e s N u m = O b j e c t N u m + 1 ,
where ObjectNum represents the number of manually labeled categories, and one represents an additional background classification.

2.4.2. Faster-RCNN with VGG16

The Faster-RCNN (with VGG16) algorithm flow can be represented as the second part of Figure 5. In the framework of the Faster-RCNN algorithm, the input image is extracted by the convolutional network of the feature extraction layer, and the feature map output by the specified convolution layer is used as the input of the RPN. The feature map obtained under different convolutional structures has different characterization capabilities for input images. In this experiment, the Faster-RCNN structure using VGG16 as the feature extraction network is first tested. This paper standardizes the image size to 1000 × 600 as input, which is consistent with the original author’s parameter settings in [18]. The feature map output by the convolution layer Conv5 is used as the input of the RPN, and nine different size anchor boxes are generated according to the regulations at each anchor point. All bounding boxes with high confidence in the anchor box are selected as a region proposal and sent to the full convolution layer through ROI (Region of Interest) Pooling to obtain the category confidence and regression box of the detected image.

2.4.3. ResNet

The Faster-RCNN (with ResNet50/ResNet101) algorithm flow can be represented as the third part of Figure 5. The overall algorithm flow of Faster-RCNN (with ResNet50/ResNet101) is basically the same as the previous one. The original VGG16 network is replaced by the ResNet network in the feature extraction layer. At the same time, considering the performance of the experimental server, the input image is adjusted. The image size of the input algorithm is 500 × 300 , which enables the experimental server to completely load a large network such as ResNet in a relatively low hardware configuration.

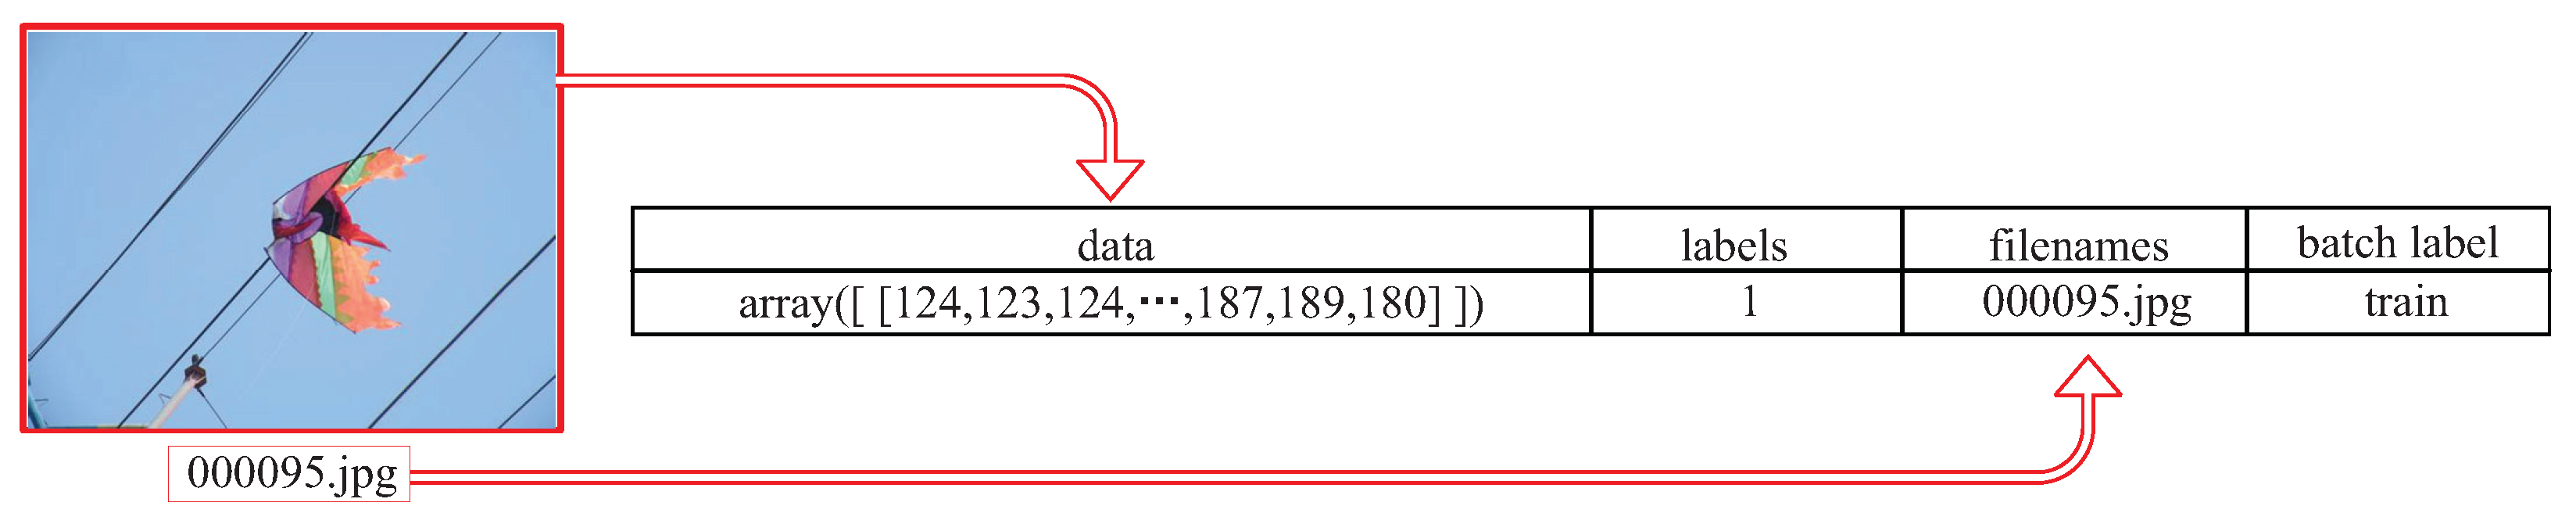
3. Data Set Preparation

When we divide the data set, the ratio of positive and negative samples in the training set is about 1:1.6. This division belongs to a balanced division mode, which helps the algorithm to learn more key features of the classification in the learning phase. However, the ratio of positive and negative samples on the test set is about 1:6, which is to simulate the real situation that the foreign object accident is a low-frequency high-risk electric accident. Most of the real inspection images are images without foreign objects.
As shown in Table 1, in the training of the classification algorithm, 305 images with foreign objects are used as positive samples, and 500 images without foreign objects are used as negative samples. Because we prepare training and testing data for SVM based on the cifar-10 data format, in this paper, only the amount of data used by SVM has been trimmed. There are 300 images with foreign objects and 500 images without foreign objects in the SVM training set; 100 images with foreign objects and 500 images without foreign objects in the SVM testing set. In this paper, the image is processed according to the rules into a dictionary format that Python can read quickly, as shown in Figure 6.
For the training of the target detection algorithm in the foreign object indicator, this paper only used 305 foreign object images, and the images were manually labeled. This is because the target detection algorithm uses anchors for training. The positive samples during training are taken up by the proposal region with the artificially labeled ground truth IOU (Intersection over Union) value being the largest or larger than the set threshold. The negative sample is assumed by the proposal region with the ground truth, whose IOU value is less than the set threshold. Therefore, there can be no negative sample input during training. The experimental environment of the above experiment is one server, and its specific parameters are as follows: The Tensorflow experimental framework is the Linux and Windows10 environment. The software environment is Python3.6, CUDA9.0, cuDNN7.0, and Tensorflow1.8; and the hardware environment is a Lenovo ZHENGJIUZHE REN7000 desktop PC produced in China, it is equipped with Intel i7-8700 Core, 8 GB memory and NVIDIA GeForce GTX 1060 GPU.

4. Results

4.1. Calculation of Various Evaluation Indicators

4.1.1. Calculation Formula for Classifier Evaluation

After the above test, the paper analyzes the classification results of the first stage, and draws the receiver operating characteristic (ROC) curves of the SVM, InceptionV3-retrain, InceptionV3-fine-tuning and InceptionV4-fine-tuning models, as shown in Figure 7. The abscissa of the ROC curve is false positive rate (FPR), the ordinate is true positive rate (TPR), and the area under curve (AUC) is defined as the area under the ROC curve. When a positive sample and a negative sample are randomly selected, the probability that the current classification algorithm ranks the positive example before the negative example based on the calculated score is the AUC value. Therefore, the larger the value of AUC, the more likely the current classification algorithm is to sort the positive samples before the negative samples, which enables better classification. The above values can be calculated using Equations (3), (4) and (5), respectively,
T P R = T P T P + F N ,
F P R = F P F P + T N ,
A U C = 0 1 T P R d F P R ,
where T P : T r u e p o s i t i v e ; T N : T r u e n e g a t i v e ; F P : F a l s e p o s i t i v e ; T N : T r u e n e g a t i v e . At the same time, the point selected according to the Youden index is plotted in Figure 7. The ROC curve is often used as an evaluation curve for medical diagnosis. When a comprehensive evaluation of the diagnosis results is required, the sensitivity and specificity can be given the same weight in the medical field. It is characterized by the same significance of the missed diagnosis rate and the misdiagnosis rate of the research object. The larger the Youden index, the better the screening ability. See (6) for the calculation method. The x-axis of the ROC curve is ( 1 s p e c i f i c i t y ) , so the final formula can be simplified to Label (7):
Y o u d e n i n d e x = m a x ( s e n s i t i v i t y + s p e c i f i c i t y 1 ) ,
Y o u d e n i n d e x = max [ s e n s i t i v i t y ( 1 s p e c i f i c i t y ) ] = max ( T P R F P R ) .

4.1.2. Calculation Formula for Evaluation of Foreign Object Indicator

The foreign object indicator performance index based on the target detection algorithm is the recall rate and accuracy rate, where T P + F N = 126 . A v e r a g e P r e c i s i o n ( A P ) is the integral of the PR-curve, which is the area under the curve (8)–(10):
P r e c i s i o n = T P T P + F P ,
R e c a l l = T P T P + F N ,
A v e r a g e P r e c i s i o n = 0 1 P r e c i s i o n ( R e c a l l ) d R e c a l l .

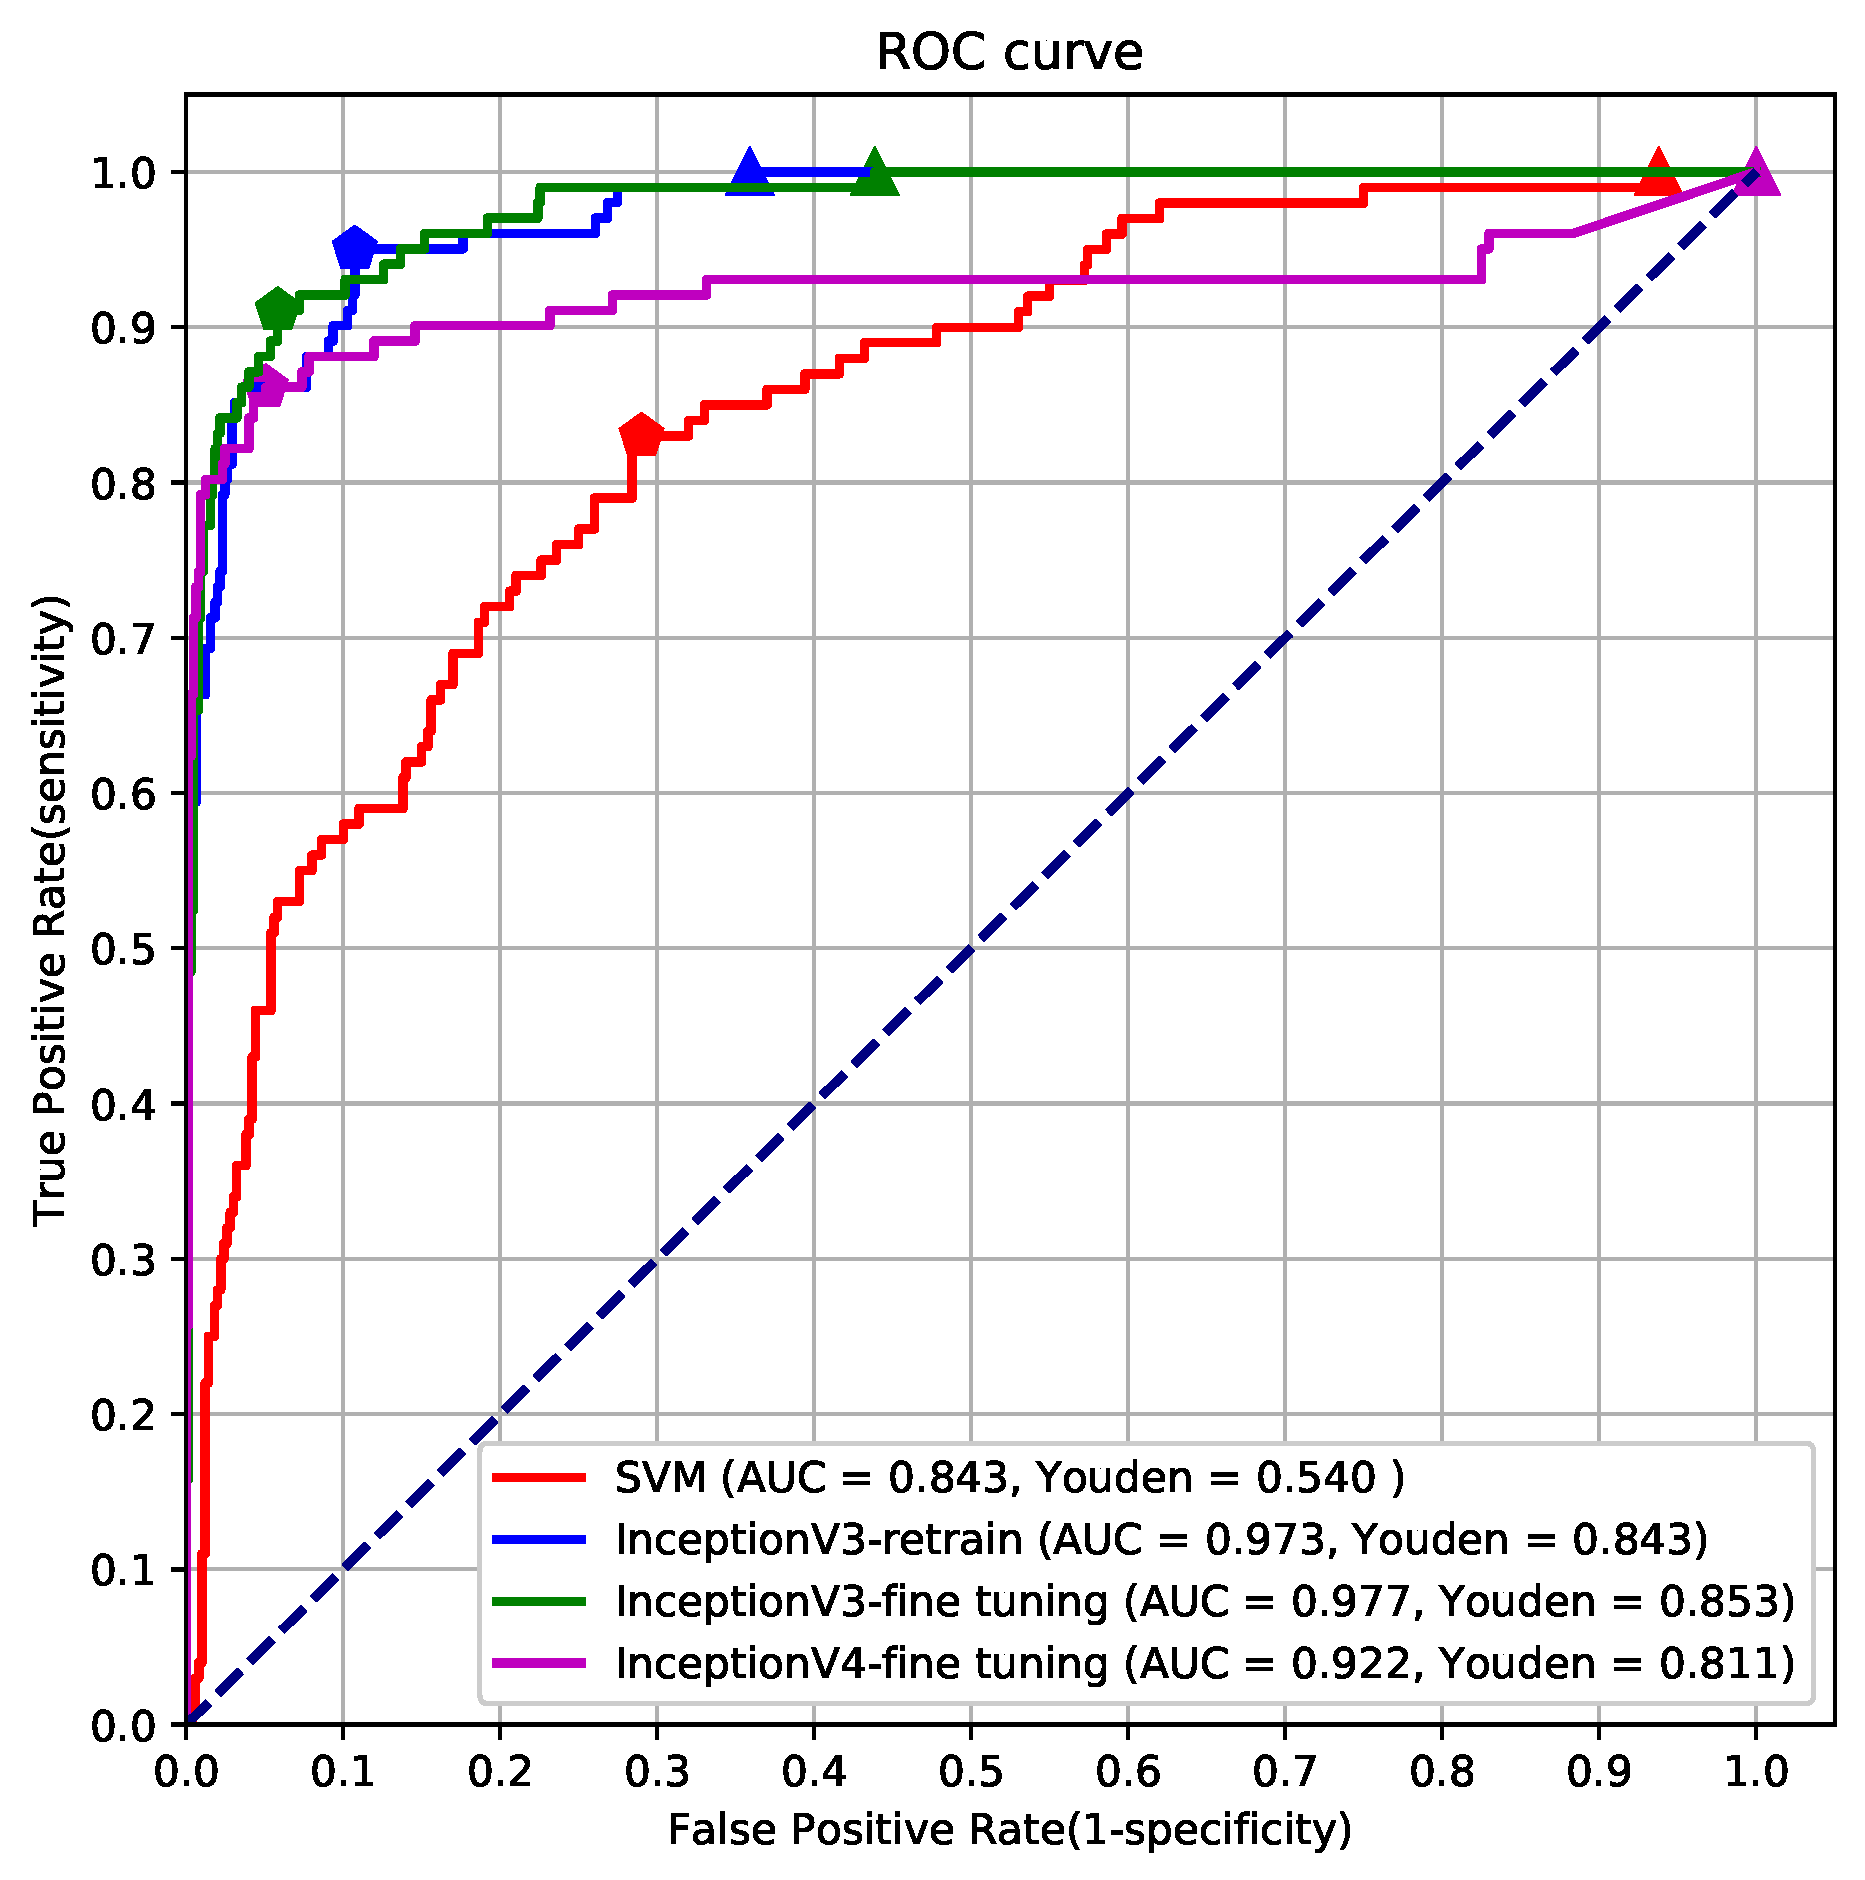
4.2. Classification Performance Evaluation

In Figure 7, the blue dashed line is referred to as the “random chance”, which means that the probability of the sample being classified as a positive or negative sample is random. In the ROC coordinate system, the classification threshold at the ( 0 , 0 ) point is the largest, and the classification threshold at the ( 1 , 1 ) point is the smallest. According to the ROC curve, it can be clearly observed that when the classification recall rate is 100% (corresponding to the ordinate value is 1), the InceptionV3-retrain model has the lowest error rate. At the same time, the InceptionV3-retrain model reduced the AUC value by 0.4% compared to the InceptionV3-fine-tuning model, but reduced the error rate by 8%.
In the foreign object image detection task, the paper should focus more on finding out all the foreign objects in the image. InceptionV3-retrain, as the first stage classifier, can maintain the lowest error rate among the four classification algorithms under the premise of 100% recall. Although the error rate of InceptionV3-retrain is reduced by 25% at the optimal threshold classification point, the algorithm cannot classify all the foreign object images, and there is a security risk in the scene of the foreign object inspection of the transmission line.

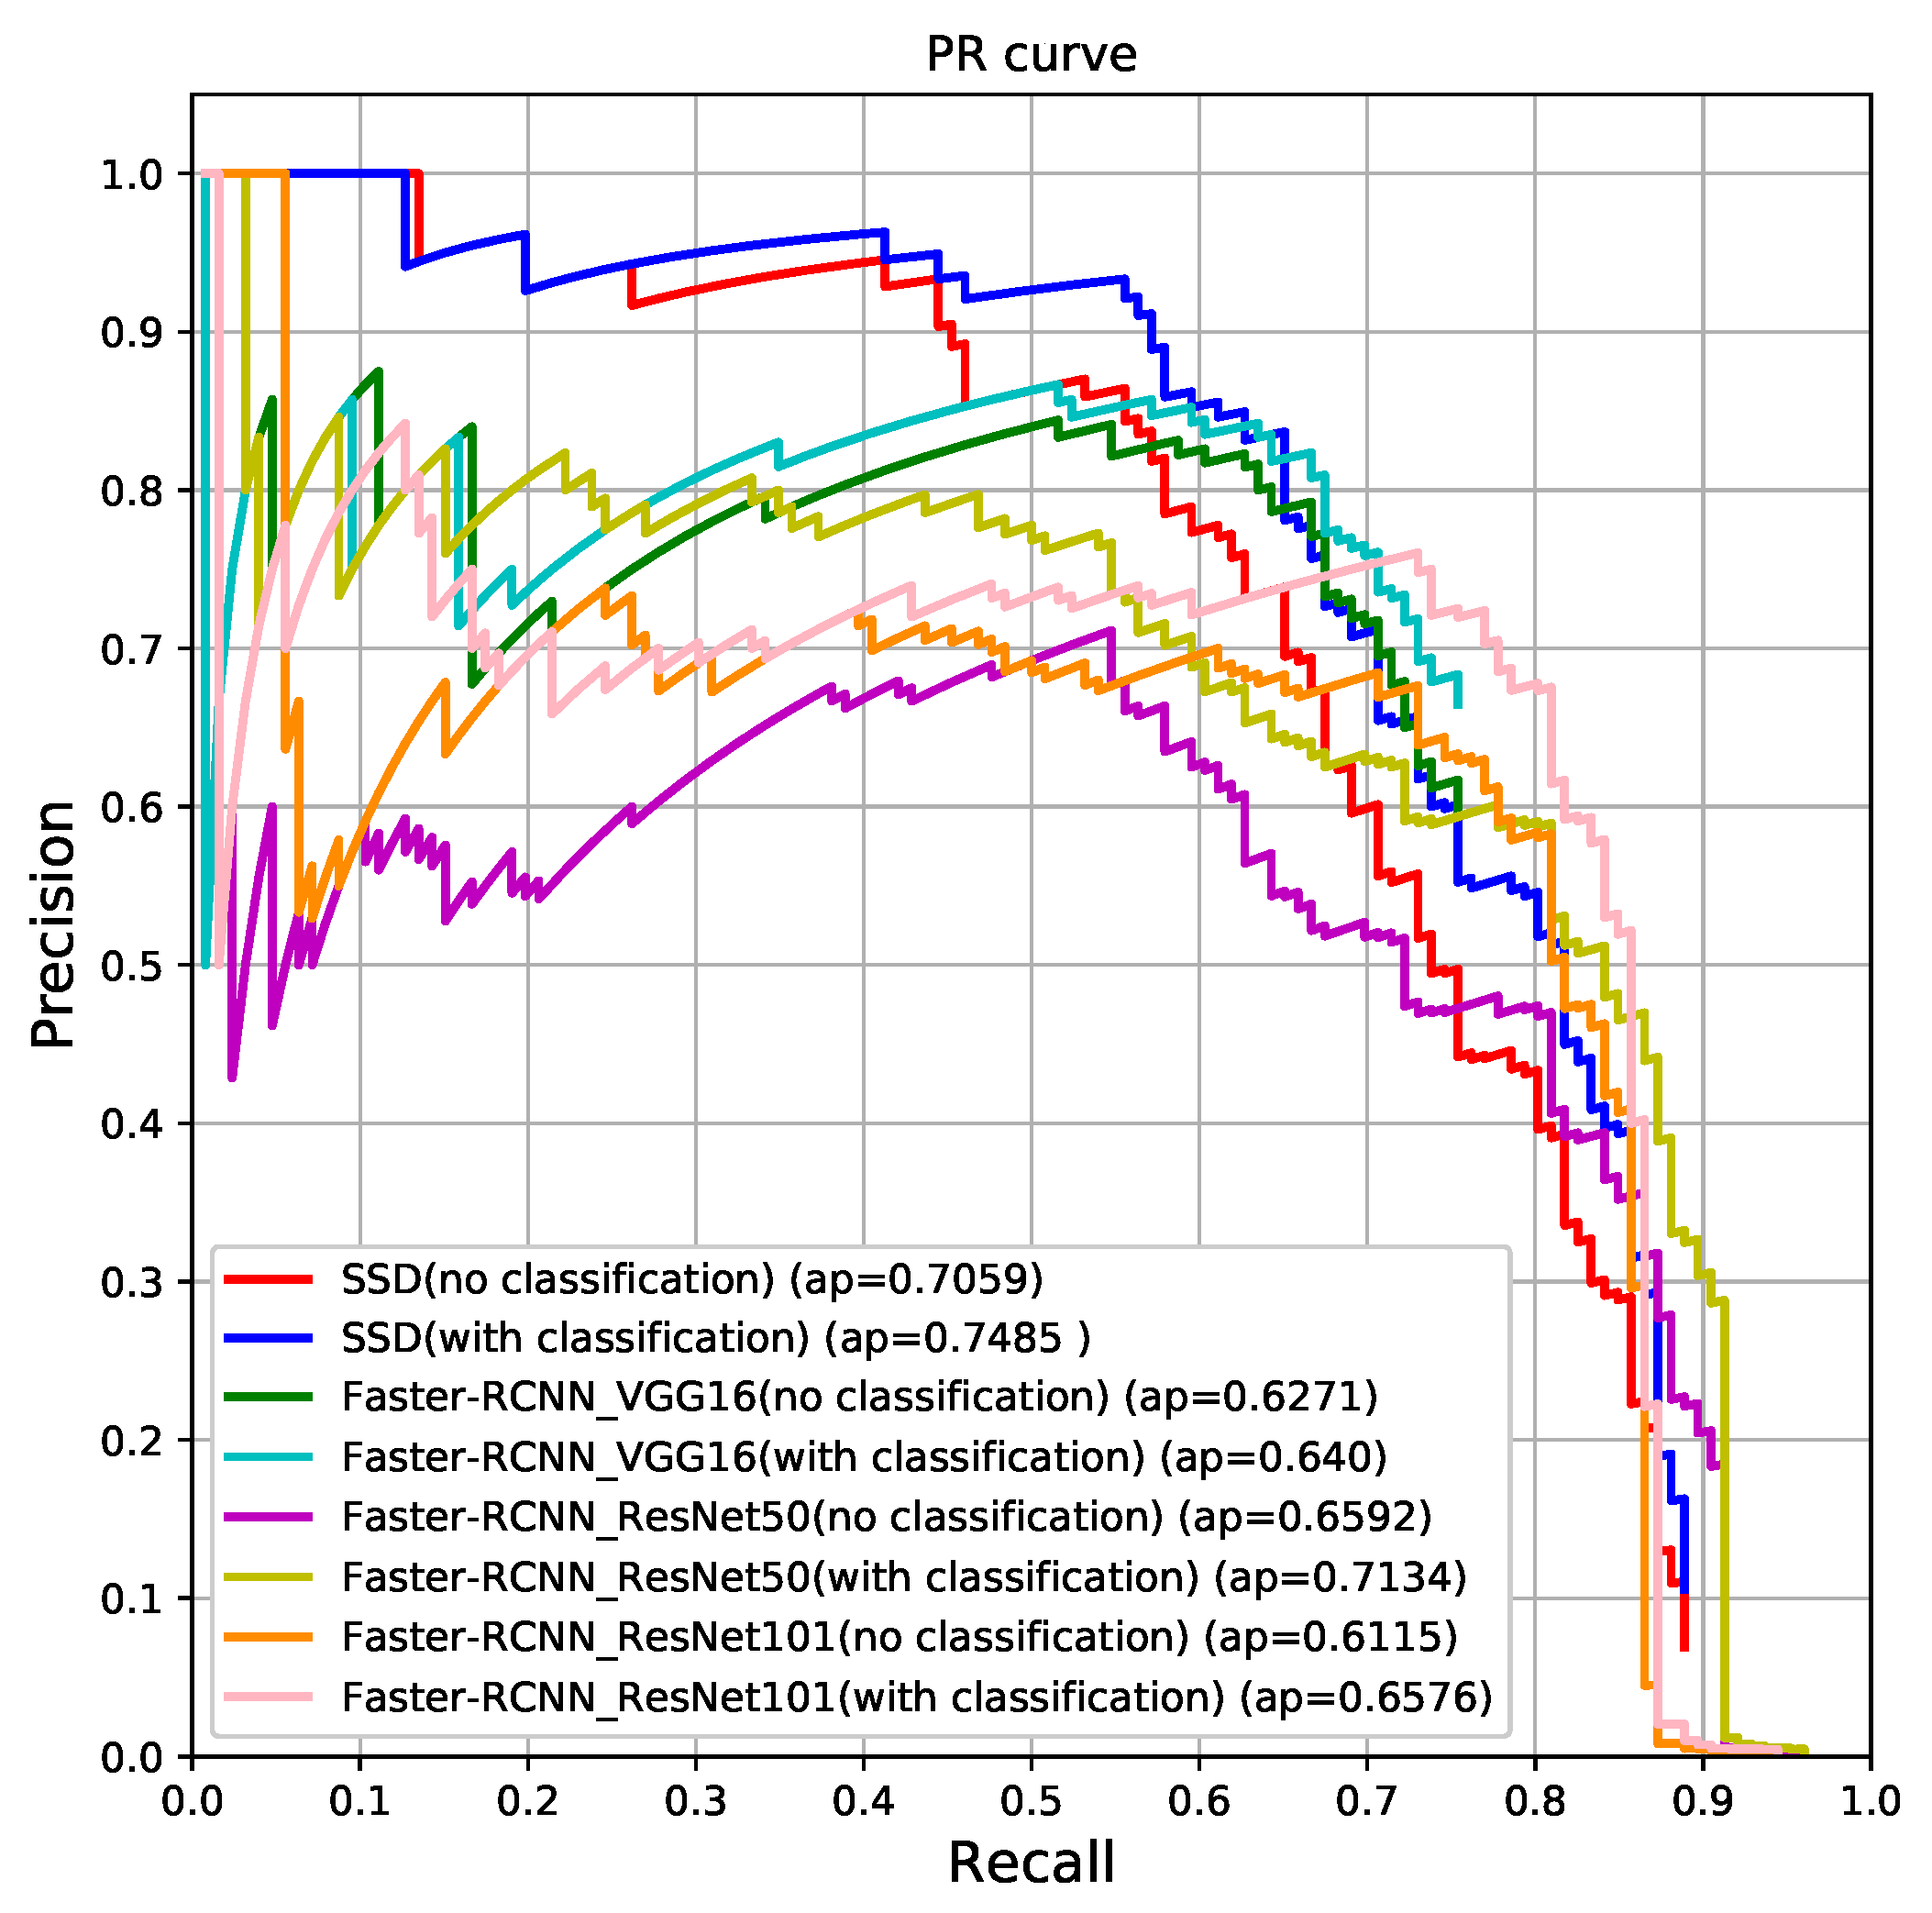
4.3. Automate Marking Performance Evaluation

In Table 2 this paper, the InceptionV3-retrain algorithm is selected as the classifier when the recall rate is 100%, and the corresponding classification threshold is 0.102. The remaining 233 sheets are all misclassified images with an error rate of 36%. In addition, 334 classified images are used as the input of the second stage target detection algorithm. The target detection algorithm PR curve is shown in Figure 8.
When 0.5 is used as the display threshold, only the bounding box whose confidence is higher than this threshold is displayed on the test picture. The specific values are shown in Table 3. The total box indicates the total number of bounding boxes that the algorithm ultimately presents to the power grid staff, and the TP number indicates the number of targets that are correctly found. The missed target indicates the number of bounding boxes that the algorithm missed. Target detection precision and Target detection recall are calculated according to Equations (8) and (9), respectively.

5. Conclusions

In this paper, we introduce an OTL-Classifier, a binary classifier with an auxiliary automate marker module. Compared to recent research, our method is much more application oriented. We have three main differences:
  • Our OTL-Classifier module can classify images with and without foreign objects. However, recent research only processes images with foreign objects; they focused on detecting the type and location of the foreign objects in the abnormal images. However, aerial images return by drones and robots inspection include much more normal images than abnormal images. Searching abnormal images manually is not only time-consuming, but also has poor precision due to attention feature of human. Therefore, it is much more important to design a module which could automatically extract abnormal images directly from original images returned by unmanned vehicles.
  • During the evaluation phase, we consider recall rate as more important than precision in our application. A sudden wide-area outage caused by even one undetected foreign object will affect people’s lives and industrial production seriously and may lead to a lot of economic loss. Therefore, we think it is very critical to have a recall rate of 100%, so no abnormal images will be missed during classification.
  • Most recent research evaluated detection speed. For example, RCNN4SPL module spends 230 ms per frame, YOLOv3 based module is 46 ms in average, Morphology based module is 95.8 ms in average, and Motion compensation-based module is 64 ms. We didn’t test execution time because it is highly dependent on the hardware. In addition, in our application, we don’t have a very high timing requirement as path planning for automatic drive.
In this article, we have evaluated the classification performance of SVM and three Inception variants, and the marking performance of SSD, Faster-RCNN with VGG, and ResNet. Experiments shows our module based on Inceptionv3-retrain, and Faster-RCNN with ResNet101 achieves best performance on the data set we collected from electric maintenance departments.
We summarize our contributions as follows:
  • We proposed an OTL-Classifier module; it can classify images with and without foreign objects. It can work in either Warning-Review mode or Normal mode.
  • In the normal mode, the OTL-Classifier works the same as most common classification tasks, the module uses optimal parameters that balances recall rate and error rate. It can achieve a recall rate of 95% and an error rate of 10.7%.
  • In the Warning-Review mode, the OTL-Classifier achieves a recall rate of 100% and an error rate of 35.9%. It has a two-stage workflow. In the first stage, the binary classifier module provides the warning. In the second stage, the automated marker module helps electric workers review the image quickly. This strategy can prevent outage caused by foreign objects and save more than half of the time on image checking. Our future work will focus on decreasing the error rate with a recall rate of 100%.

Author Contributions

Conceptualization, F.Z. and Y.F.; methodology, F.Z.; software, Y.F.; validation, Y.F., Z.H. and N.W.; formal analysis, Y.F.; investigation, F.Z.; resources, Y.F.; data curation, Y.F., T.C., W.L., Z.H. and N.W.; writing—original draft preparation, Y.F.; writing—review and editing, F.Z. and Y.F.; visualization, Y.F.; supervision, F.Z.; project administration, M.W.; funding acquisition, F.Z. and M.W.

Funding

This work was supported by the National Natural Science Foundation of China (Grant No. 11605051 and A050508), Excellent Young and Middle-aged Science and Technology Innovation Team Project in Higher Education Institutions of Hubei Province (T201805), Major Technological Innovation Projects of Hubei(No. 2018AAA028).

Acknowledgments

The authors would like to thanks to all the reviewers who helped us in the review process of our work.Moreover special thanks to the Jiangsu Electric Power staff for providing the authors with the opportunity to collect experimental image data.

Conflicts of Interest

The authors declare no conflict of interest.

References

  1. Menéndez, O.; Pérez, M.; Auat Cheein, F. Visual-Based Positioning of Aerial Maintenance Platforms on Overhead Transmission Lines. Appl. Sci. 2019, 9, 165. [Google Scholar] [CrossRef]
  2. Baik, H.; Valenzuela, J. Unmanned Aircraft System Path Planning for Visually Inspecting Electric Transmission Towers. J. Intell. Robot. Syst. 2019, 95, 1097–1111. [Google Scholar] [CrossRef]
  3. Campbell, J.F.; Corberán, Á.; Plana, I.; Sanchis, J.M. Drone arc routing problems. Networks 2018, 72, 543–559. [Google Scholar] [CrossRef] [Green Version]
  4. Lu, M.; Bagheri, M.; James, A.P.; Phung, T. Wireless Charging Techniques for UAVs: A Review, Reconceptualization, and Extension. IEEE Access 2018, 6, 29865–29884. [Google Scholar] [CrossRef]
  5. Citroni, R.; Di Paolo, F.; Livreri, P. A Novel Energy Harvester for Powering Small UAVs: Performance Analysis, Model Validation and Flight Results. PubMed 2019, 19, 1771. [Google Scholar] [CrossRef] [PubMed]
  6. Li, B.; Fei, Z.; Zhang, Y. UAV Communications for 5G and Beyond: Recent Advances and Future Trends. IEEE Internet Things J. 2019, 6, 2241–2263. [Google Scholar] [CrossRef]
  7. Richard, P.L.; Pouliot, N.; Morin, F.; Lepage, M.; Hamelin, P.; Lagac, M.; Sartor, A.; Lambert, G.; Montambault, S. LineRanger: Analysis and Field Testing of an Innovative Robot for Efficient Assessment of Bundled High-Voltage Powerlines. In Proceedings of the 2019 International Conference on Robotics and Automation (ICRA), Montreal, QC, Canada, 20–24 May 2019; pp. 9130–9136. [Google Scholar]
  8. Zhang, Y.; Li, J.; Li, C.; Tao, Q.; Xiong, X. Development of foreign matter removal robot for overhead transmission lines. In Proceedings of the 2nd International Conference on Mechanical, Electric and Industrial Engineering, Hangzhou, China, 25–27 May 2019. [Google Scholar]
  9. Disyadej, T.; Promjan, J.; Poochinapan, K.; Mouktonglang, T.; Grzybowski, S.; Muneesawang, P. High Voltage Power Line Maintenance & Inspection by Using Smart Robotics. In Proceedings of the 2019 IEEE Power and Energy Society Innovative Smart Grid Technologies Conference (ISGT), Washington, DC, USA, 18–21 February 2019. [Google Scholar] [CrossRef]
  10. Seok, K.H.; Kim, Y.S. A State of the Art of Power Transmission Line Maintenance Robots. J. Electr. Eng. Technol. 2016, 9, 1412–1422. [Google Scholar] [CrossRef]
  11. Qin, X.; Wu, G.; Lei, J.; Fan, F.; Ye, X.; Mei, Q. A Novel Method of Autonomous Inspection for Transmission Line based on Cable Inspection Robot LiDAR Data. Sensors 2018, 18, 596. [Google Scholar] [CrossRef] [PubMed]
  12. Zhao, L.; Wang, X.; Yao, H.; Tian, M.; Jian, Z. Power Line Extraction From Aerial Images Using Object-Based Markov Random Field With Anisotropic Weighted Penalty. IEEE Access 2019, 7, 125333–125356. [Google Scholar] [CrossRef]
  13. Cao, Z.; Ma, J.; Lin, P.; Peng, Z. Morphology-Based Visual Detection of Foreign Object on Overhead Line Tower. In Proceedings of the 2018 3rd IEEE International Conference on Image, Vision and Computing, ICIVC 2018, Chongqing, China, 27–29 June 2018; pp. 468–472. [Google Scholar]
  14. Jiao, S.; Wang, H. The Research of Transmission Line Foreign Body Detection Based on Motion Compensation. In Proceedings of the 2016 First, International Conference on Multimedia and Image Processing (ICMIP), Bandar Seri Begawan, Brunei, 1–3 June 2016; pp. 10–14. [Google Scholar]
  15. Nguyen, V.N.; Jenssen, R.; Roverso, D. Automatic autonomous vision-based power line inspection: A review of current status and the potential role of deep learning. Int. J. Electr. Power Energy Syst. 2018, 99, 107–120. [Google Scholar] [CrossRef] [Green Version]
  16. Miao, X.; Liu, X.; Chen, J.; Zhuang, S.; Fan, J.; Jiang, H. Insulator Detection in Aerial Images for Transmission Line Inspection Using Single Shot Multibox Detector. IEEE Access 2019, 7, 9945–9956. [Google Scholar] [CrossRef]
  17. Michalski, P.; Ruszczak, B.; Lorente, P.J.N. The Implementation of a Convolutional Neural Network for the Detection of the Transmission Towers Using Satellite Imagery. In Proceedings of the 40th Anniversary International Conference on Information Systems Architecture and Technology, Wrocław, Poland, 15–17 September 2019; pp. 287–299. [Google Scholar]
  18. Dong, J.; Chen, W.; Xu, C. Transmission line detection using deep convolutional neural network. In Proceedings of the 2019 IEEE 8th Joint International Information Technology and Artificial Intelligence Conference, Chongqing, China, 24–26 May 2019; pp. 97–980. [Google Scholar]
  19. Xia, P.; Yin, J.; He, J. Neural Detection of Foreign Objects for Transmission Lines in Power Systems. J. Phys. Conf. Ser. 2019, 1267, 012043. [Google Scholar] [CrossRef]
  20. Zhang, W.; Liu, X.; Yuan, J. RCNN-based foreign object detection for securing power transmission lines (RCNN4SPTL). In Proceedings of the International Conference on Identification, Information and Knowledge in the Internet of Things (IIKI), Beijing, China, 19–21 October 2018; pp. 331–337. [Google Scholar]
  21. Simonyan, K.; Zisserman, A. Very deep convolutional networks for large-scale image recognition. arXiv 2015, arXiv:1409.1556v6. [Google Scholar]
  22. He, K.; Zhang, X.; Ren, S.; Sun, J. Deep residual learning for image recognition. In Proceedings of the IEEE Conference on Computer Vision and Pattern Recognition (CVPR), Las Vegas, NV, USA, 26 June–1 July 2016; pp. 770–778. [Google Scholar]
  23. Szegedy, C.; Vanhoucke, V.; Ioffe, S. Rethinking the inception architecture for computer vision. In Proceedings of the IEEE Conference on Computer Vision and Pattern Recognition (CCVPR), Las Vegas, NV, USA, 26 June–1 July 2016; pp. 2818–2826. [Google Scholar]
  24. Szegedy, C.; Ioffe, S.; Vanhoucke, V. Inception-v4, Inception-Resnet and the impact of residual connections on learning. In Proceedings of the Thirty-First, AAAI Conference on Artificial Intelligence (AAAI-17), San Francisco, CA, USA, 4–9 February 2017; pp. 4278–4284. [Google Scholar]
  25. Ren, S.; He, K.; Girshick, R.; Sun, J. Faster r-cnn: Towards Real-Time Object Detection with Region Proposal Networks. In Proceedings of the Advances in Neural Information Processing Systems (NIPS), Montreal, QC, Canada, 7–12 December 2015; pp. 91–99. [Google Scholar]
  26. Liu, W.; Anguelov, D.; Erhan, D. SSD: Single Shot MultiBox Detector. In Proceedings of the European Conference on Computer Vision (ECCV), Amsterdam, The Netherlands, 8–16 October 2016; Springer: Cham, Switzerland, 2016; pp. 21–37. [Google Scholar] [Green Version]
Figure 1. Sample images in the data set. (a) Balloons, kites and agricultural plastic which are the main foreign objects hanging on overhead transmission lines. (b) Images without foreign objects which have been used as negative samples of the classification task.These negative sample images also contain high-voltage towers and transmission lines, as well as daily images collected by inspection equipment. (c) Foreign objects of different sizes. Some tiny foreign objects are not easy to detect. (d) Data we collected included not only colorful balloons and kites, but also translucent plastic and black agricultural greenhouses. (e) The contrast between the translucent plastic and the sky is not so obvious, and the black plastic shed is easily confused with the trees.
Electronics 08 01270 g001aElectronics 08 01270 g001b
Figure 2. Warning–review strategy.
Electronics 08 01270 g002
Figure 3. Two-stage foreign object detection flow chart.
Electronics 08 01270 g003
Figure 4. Classification network structure.
Electronics 08 01270 g004
Figure 5. Foreign object indication based on a target detection algorithm.
Electronics 08 01270 g005
Figure 6. Cifar-10 data storage rules. The data stored in the [ 32 × 32 × 3 ] matrix are the compressed data of the original image. Labels store image tags, image with foreign objects is 1, and image without foreign objects is 0. File names are stored in filenames. The batch label stores the image as being divided into training or test tags.
Electronics 08 01270 g006
Figure 7. ROC of the classifier. (1) in the case of a 100% recall. The threshold points of the classifier are marked with triangles, indicating that all images with foreign objects can be screened when the images are classified by the threshold corresponding to the points. The abscissa value corresponding to the threshold point is the misclassification rate, which means that the triangle mark closer to the left side corresponds to the lower classification error rate, and the performance of the algorithm is better. (2) We calculate the optimal classification threshold by using the Yoden index. The optimal threshold point of the classifier is marked by a pentagon, which means that only a part of the foreign object image can be selected when the image is classified by the threshold value of the mark point, and the classification error rate is also decreased. (3) InceptionV3-fine-tuning has AUC = 0.977 as the maximum value and SVM has AUC = 0.843 as the minimum value.
Electronics 08 01270 g007
Figure 8. Target detection algorithm PR (Precision-Recall) curve. (1) In the figure, each target detection algorithm draws two PR curves. One is a PR curve that is directly input with 753 sheets as an algorithm without going through the classification process. The other is the PR curve drawn with 334 images as the algorithm input. (2) After using the two stages framework, each algorithm has a different degree of increase in the AP value, which is since the first stage classifier filters out 60% of the negative samples. (3) The SSD has the highest 0.7485 AP value, while the Faster-RCNN (with VGG16) AP is the lowest 0.64 of all experiments.
Electronics 08 01270 g008
Table 1. Division of training and testing dataset.
Foreign ObjectNo Foreign Object
Training set305500
Testing set101652
Total4061152
Table 2. Classification algorithm data.
SVMInceptionV3-RetrainInceptionV3-Fine-TuningInceptionV4-Fine-Tuning
Recall 100%recall rate100%100%100%100%
error rate94%35.9%43.9%100%
threshold0.2640.1020.0920.0
Optimal thresholdrecall rate83%95%91%86%
error rate29%10.7%5.8%5%
Yoden index0.540.8430.8530.811
threshold0.4280.5460.5030.4
Table 3. Target detection algorithm data.
Total BoxTP NumberMissed TargetTarget Detection PrecisionTarget Detection Recall
ResNet502181062048.62%84.13%
ResNet1011831062057.92%84.13%
VGG16122903673.77%71.43%
SSD150933362.0%73.81%

