Article

Closing the Wearable Gap—Part IV: 3D Motion Capture Cameras Versus Soft Robotic Sensors Comparison of Gait Movement Assessment

1
Department of Electrical & Computer Engineering, Mississippi State University, Mississippi State, MS 39762, USA
2
Department of Industrial & Systems Engineering, Mississippi State University, Mississippi State, MS 39762, USA
3
Department of Kinesiology, Mississippi State University, Mississippi State, MS 39762, USA
4
Department of Agricultural & Biological Engineering, Mississippi State University, Mississippi State, MS 39762, USA
*
Author to whom correspondence should be addressed.
Submission received: 1 November 2019 / Accepted: 19 November 2019 / Published: 21 November 2019
(This article belongs to the Special Issue Wearable Monitoring Devices)

Abstract

:
The purpose of this study was to use 3D motion capture and stretchable soft robotic sensors (SRS) to collect foot-ankle movement on participants performing walking gait cycles on flat and sloped surfaces. The primary aim was to assess differences between 3D motion capture and a new SRS-based wearable solution. Given the complex nature of using a linear solution to accurately quantify the movement of triaxial joints during a dynamic gait movement, 20 participants performing multiple walking trials were measured. The participant gait data was then upscaled (for the SRS), time-aligned (based on right heel strikes), and smoothed using filtering methods. A multivariate linear model was developed to assess goodness-of-fit based on mean absolute error (MAE; 1.54), root mean square error (RMSE; 1.96), and absolute R2 (R2; 0.854). Two and three SRS combinations were evaluated to determine if similar fit scores could be achieved using fewer sensors. Inversion (based on MAE and RMSE) and plantar flexion (based on R2) sensor removal provided second-best fit scores. Given that the scores indicate a high level of fit, with further development, an SRS-based wearable solution has the potential to measure motion during gait- based tasks with the accuracy of a 3D motion capture system.

1. Introduction

The biomechanical analysis of movement patterns, such as walking gait, is essential to understanding how an individual can maximize movement [1]. A typical gait cycle spans two consecutive events of the same limb, usually with initial contact to an external surface [2]. Throughout one gait cycle, each lower extremity passes through two phases: (a) A stance phase and (b) a swing phase [2]. During the stance phase, five different movement stages with corresponding joint angles are executed: (a) Initial contact/heel strike (0° of ankle and knee flexion/extension, 20° flexion of hip joint), (b) foot flat (5° plantar flexion of ankle, 15° of flexion of knee and hip joints), (c) midstance (5° dorsiflexion of ankle, 5° flexion of knee, 0° of hip), (d) heel off (0° of flexion of ankle and knee, 10–20° of hyperextension of hip), and (e) toe-off (20° plantarflexion of ankle, 30° of knee flexion, 10–20° of hyperextension of hip) [2]. The second stage—the swing phase—consists of three stages: (a) Acceleration (10° plantar flexion of ankle, 30° flexion of knee, 20° of flexion of hip), (b) midswing (0° ankle flexion, 30° flexion of knee and hip), and (c) deceleration (0° of ankle and knee, 30° flexion of hip) [2]. The ability to capture these joint kinematics is made possible through 3D motion capture and wearable technology.
Biomechanical analyses of gait have become a valuable tool for practitioners to assist in clinical diagnoses, strength and conditioning (S&C) specialists to improve athletic performance, and therapists to promote rehabilitation. To monitor gait, 3D motion capture is considered the optimal system for identifying kinematics and kinetics of the gait cycle [3]. However, 3D motion capture traditionally takes place in a laboratory setting which can hinder the opportunity to analyze a real-life scenario and can be quite expensive due to the costs of required equipment [3], as well as the steep learning curve. Moreover, wearable sensor technology is another option to analyze kinematics during a real-life scenario either in a rehabilitation clinic or on a competitive playing field [4].
Various types of wearable sensor technology (WST) have increased in popularity on the market such as accelerometers, gyroscopes, micro electromechanical systems (MEMS), and inertial measurement units (IMUs) [5,6,7]. Being portable, WST allows remote monitoring in real-life environments as opposed to the simulated laboratory setting. In addition to portability, WST is inexpensive when compared to a 3D motion capture system [4]. However, there are several reoccurring problems with several types of WST such as an IMU. According to Filippeschi et al. (2017), IMUs have issues with reducing drifts, magnetic disturbances, and calibration. Due to non-homogenous magnetic fields, mainly from construction building materials and magnetic interference, distortion and drift affect a sensor’s vertical and horizontal data [5]. A sensor system that could simulate stretch and strain around the joints may offer an alternative method to gait analysis rather than using stiff, circuit board based IMUs [8]. Consistency and calibration issues regularly result from sensors on the market, a potential solution may lie in the form of a different type of sensor, such as stretchable soft robotic sensors (SRS) [8].
Due to the reoccurring issues with wearable technology, the purpose of this paper is to continue the research and development narrative for building a new SRS-based wearable solution that closes the WST gap identified by the practitioners [8]. This paper suggests alternative methods for capturing the human gait cycle in a real-life setting for more precise rehabilitation techniques and improvement of athletic performance. Luczak et al. [8] and Saucier et al. [9] recommend a more accurate technology—stretchable SRS accompanied by liquid conductive material, placed in garments, that can be directly placed on joints to analyze joint kinematics [8,9]. There are several benefits for using SRS which include (a) the capability to capture biomechanical strain without the occlusion of errors that normally occur in 3D motion capture systems and eliminate drift that can arise in IMU sensors [8]; (b) the realization of small changes in electromechanical specifications during loading and unloading; and (c) limited interference observed by the consumer. In addition, SRS inherently offer “stretchability,” which allows the sensors to cover the joints of the human body [9].

2. Materials and Methods

In Parts II and III of “closing the wearable gap” paper series [9,10], both 3D motion capture and SRS were used to assess specific foot-ankle movements. Part II analyzed the four primary foot-ankle complex angles—plantar flexion (PF), dorsiflexion (DF), inversion (INV), and eversion (EVR)—during static movement assessments where each angle was measured separately [9]. Part III captured PF and DF during dynamic slip and trip movements that were both expected and unexpected [10]. For Part IV of this series, all four foot-ankle movements will be captured simultaneously during dynamic gait trials. Therefore, due to similarities in equipment, study design, and discovery intent, much of the layout and wording of this section will originate from the previous papers [9,10] with modifications to describe (a) the new population of participants and (b) modifications in the methods to shift from single sensors capturing static movements and two sensors capturing dynamic slips and trips to four sensors per leg capturing dynamic gait movements.

2.1. Participants

A total of 20 participants (10 males: Height, 168–193 cm; mass, 61–117 kg; foot size, 10–13; and 10 females: Height, 158–168 cm; mass, 50–113 kg; foot size, 5.5–10) with no self-reported history of lower extremity musculoskeletal injuries or surgeries and neuromuscular diseases or disorders were tested. Note that participant foot sizes are indicated using US shoe size measurements. This sample was chosen to examine both genders and individuals with small/medium and large/extra-large sized feet. Since this was a gait assessment study, the sample size was set at 20 participants, which is consistent with recent gait-based literature [11,12,13,14]. The study was approved for human subjects testing under the University’s Institutional Review Board (IRB; protocol #17-725). Informed consent was obtained for all participants after fully explaining the protocol along with the risks and benefit involved.

2.2. Study Design

All participants were instructed to visit the Human Performance Laboratory (HPL) at Mississippi State University’s Center for Advanced Vehicular Systems (CAVS) research center. The study design followed a single day testing protocol with an initial familiarization session that was conducted before the experimental testing. During familiarization, all participants were briefed on the procedures and provided an opportunity to perform a few trials of the experiment that includes a self-paced, regular speed walk on both a flat surface (FS) and a tilted surface platform (TSP). The FS was comprised of four, half-inch thick rubber mats that were 0.91 by 1.52 m in size. The short edge of the mats was aligned such that a rubber walkway of 6.10 m covered the middle section of the HPL floor running south to north from the entrance side to the room to the back portion of the room. A linear walking space of 6.10 m is enough to capture at least three full gait cycles for an average person [15]. Since the FS does not induce inversion or eversion at the foot, a TSP was designed and built such that INV and EVR at the foot-ankle complex could be recorded for participants during their self-paced gait cycles. A wooden platform was built to be 1.22 m wide by 7.32 m long, creating a walkway tilted at 10 degrees. The same type of rubber mats used on the floor for the FS was placed on the TSP as not to create a confounding variable between walking on different surface types. The walkway, running parallel to the FS trial area of the HPL, weighed over 54.43 kg and therefore was not susceptible to slippage during a participant trial. The platform surface angle of 10 degrees was validated using the bubble level application (PixelProse SARL Tools) on an iPhone (Apple). The TSP designed for this study was inspired by the dimensions and slope of a walkway built for a railroad ballast surface [16] in which similar participant INV and EVR characteristics were studied. Figure 1 shows the TSP with rubber mat surface. Following the familiarization process for gait trials on both the FS and TSP, the participants performed the experimental testing.

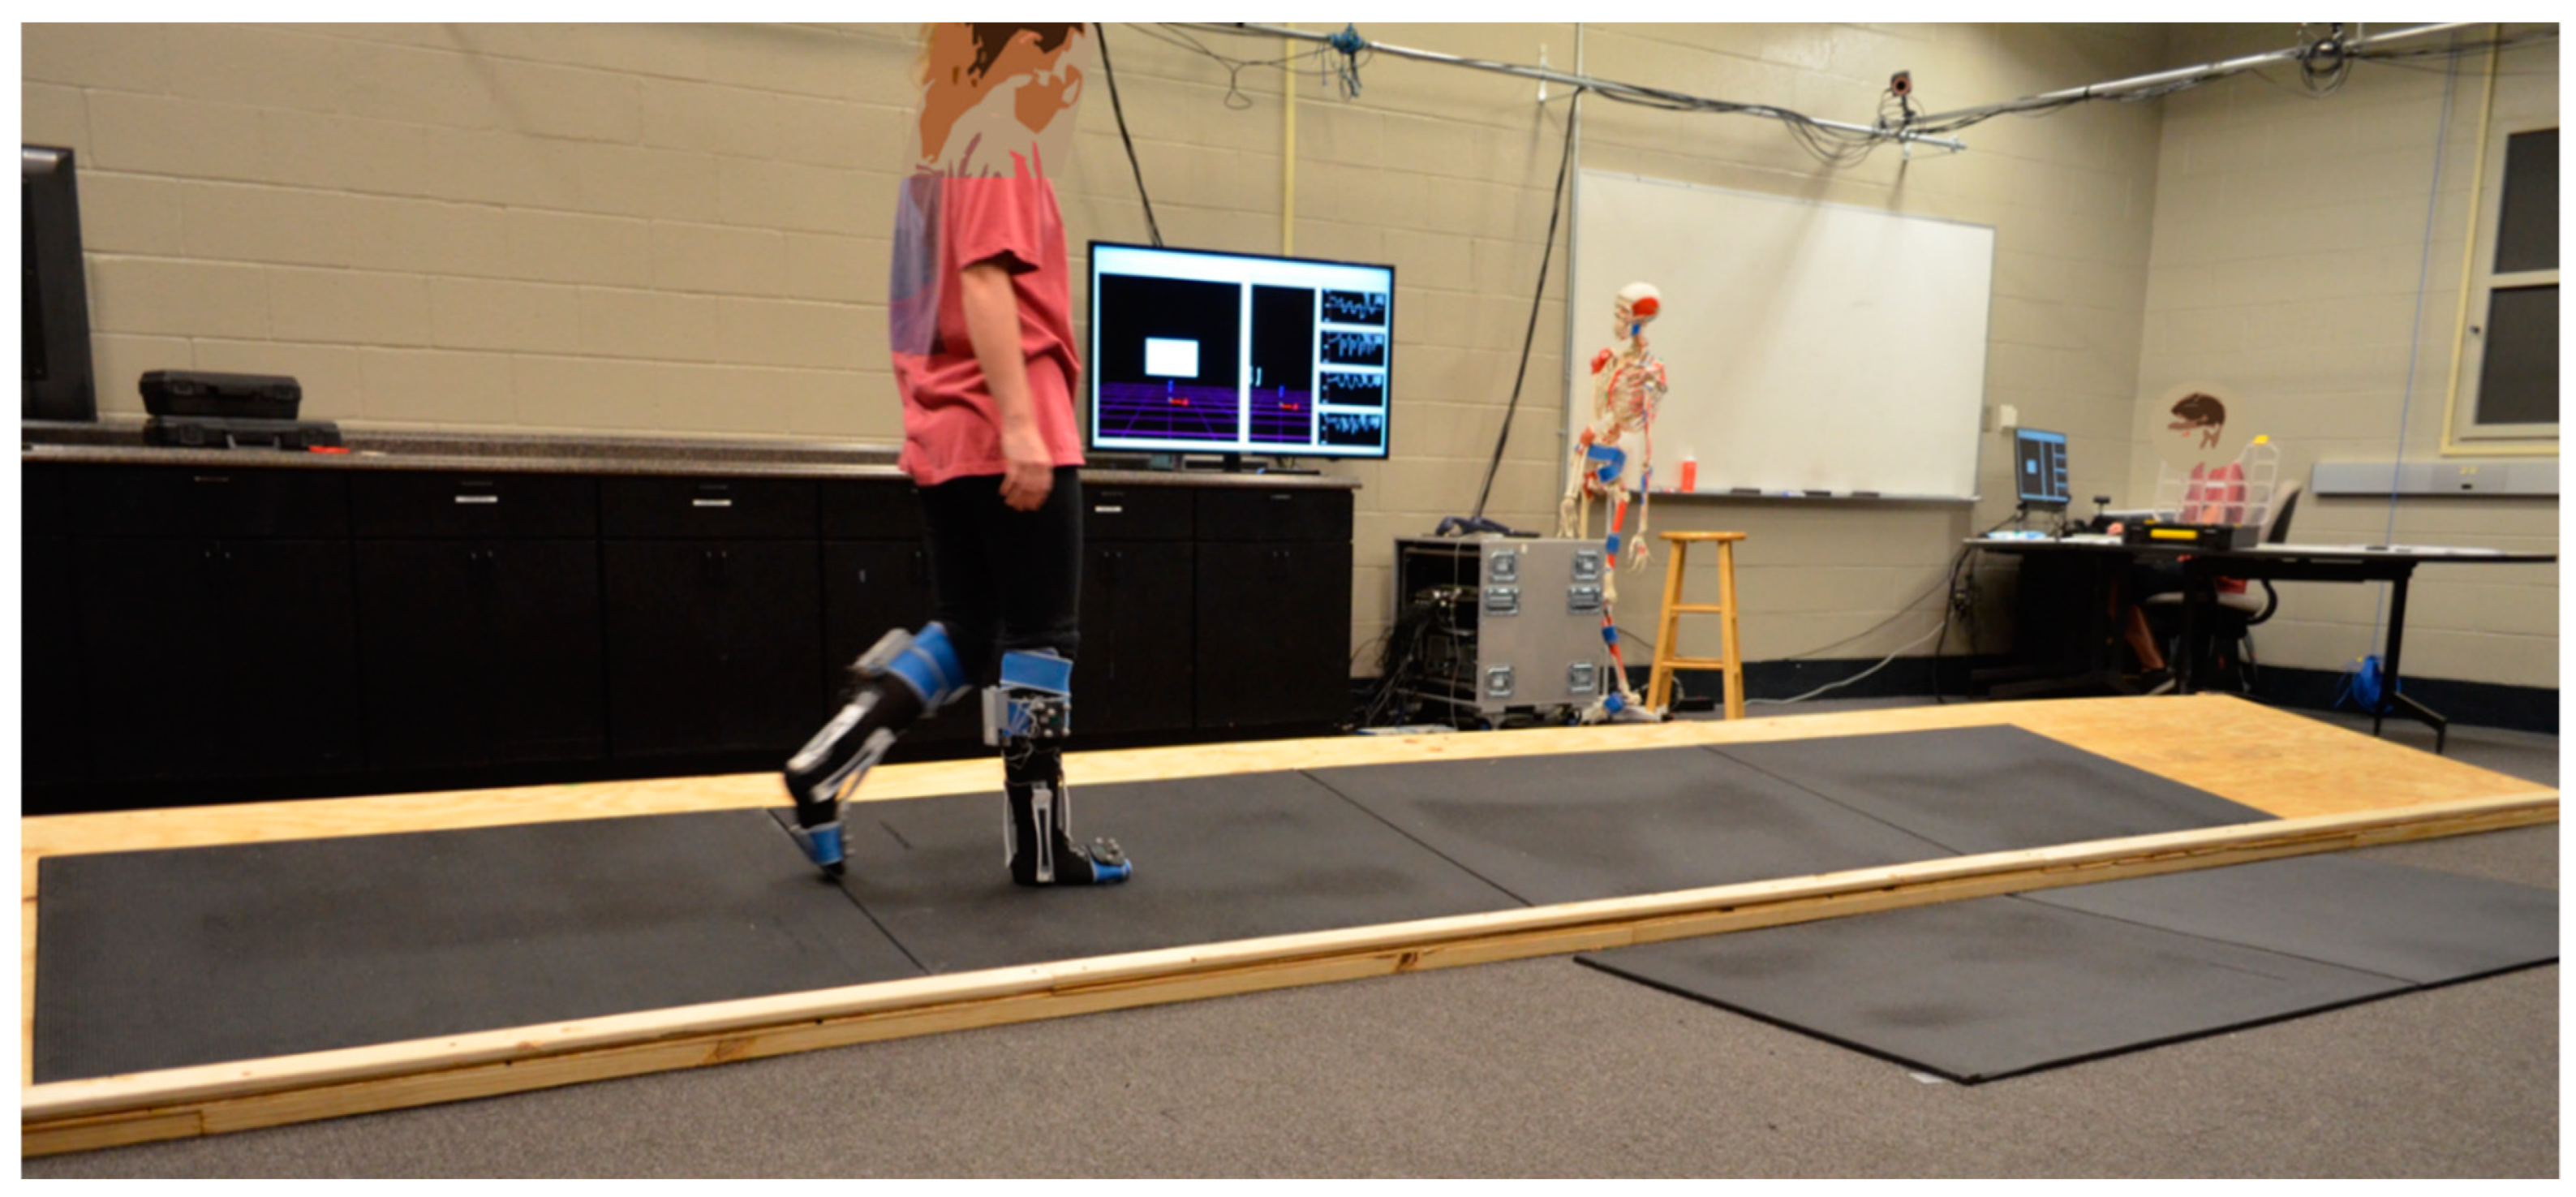
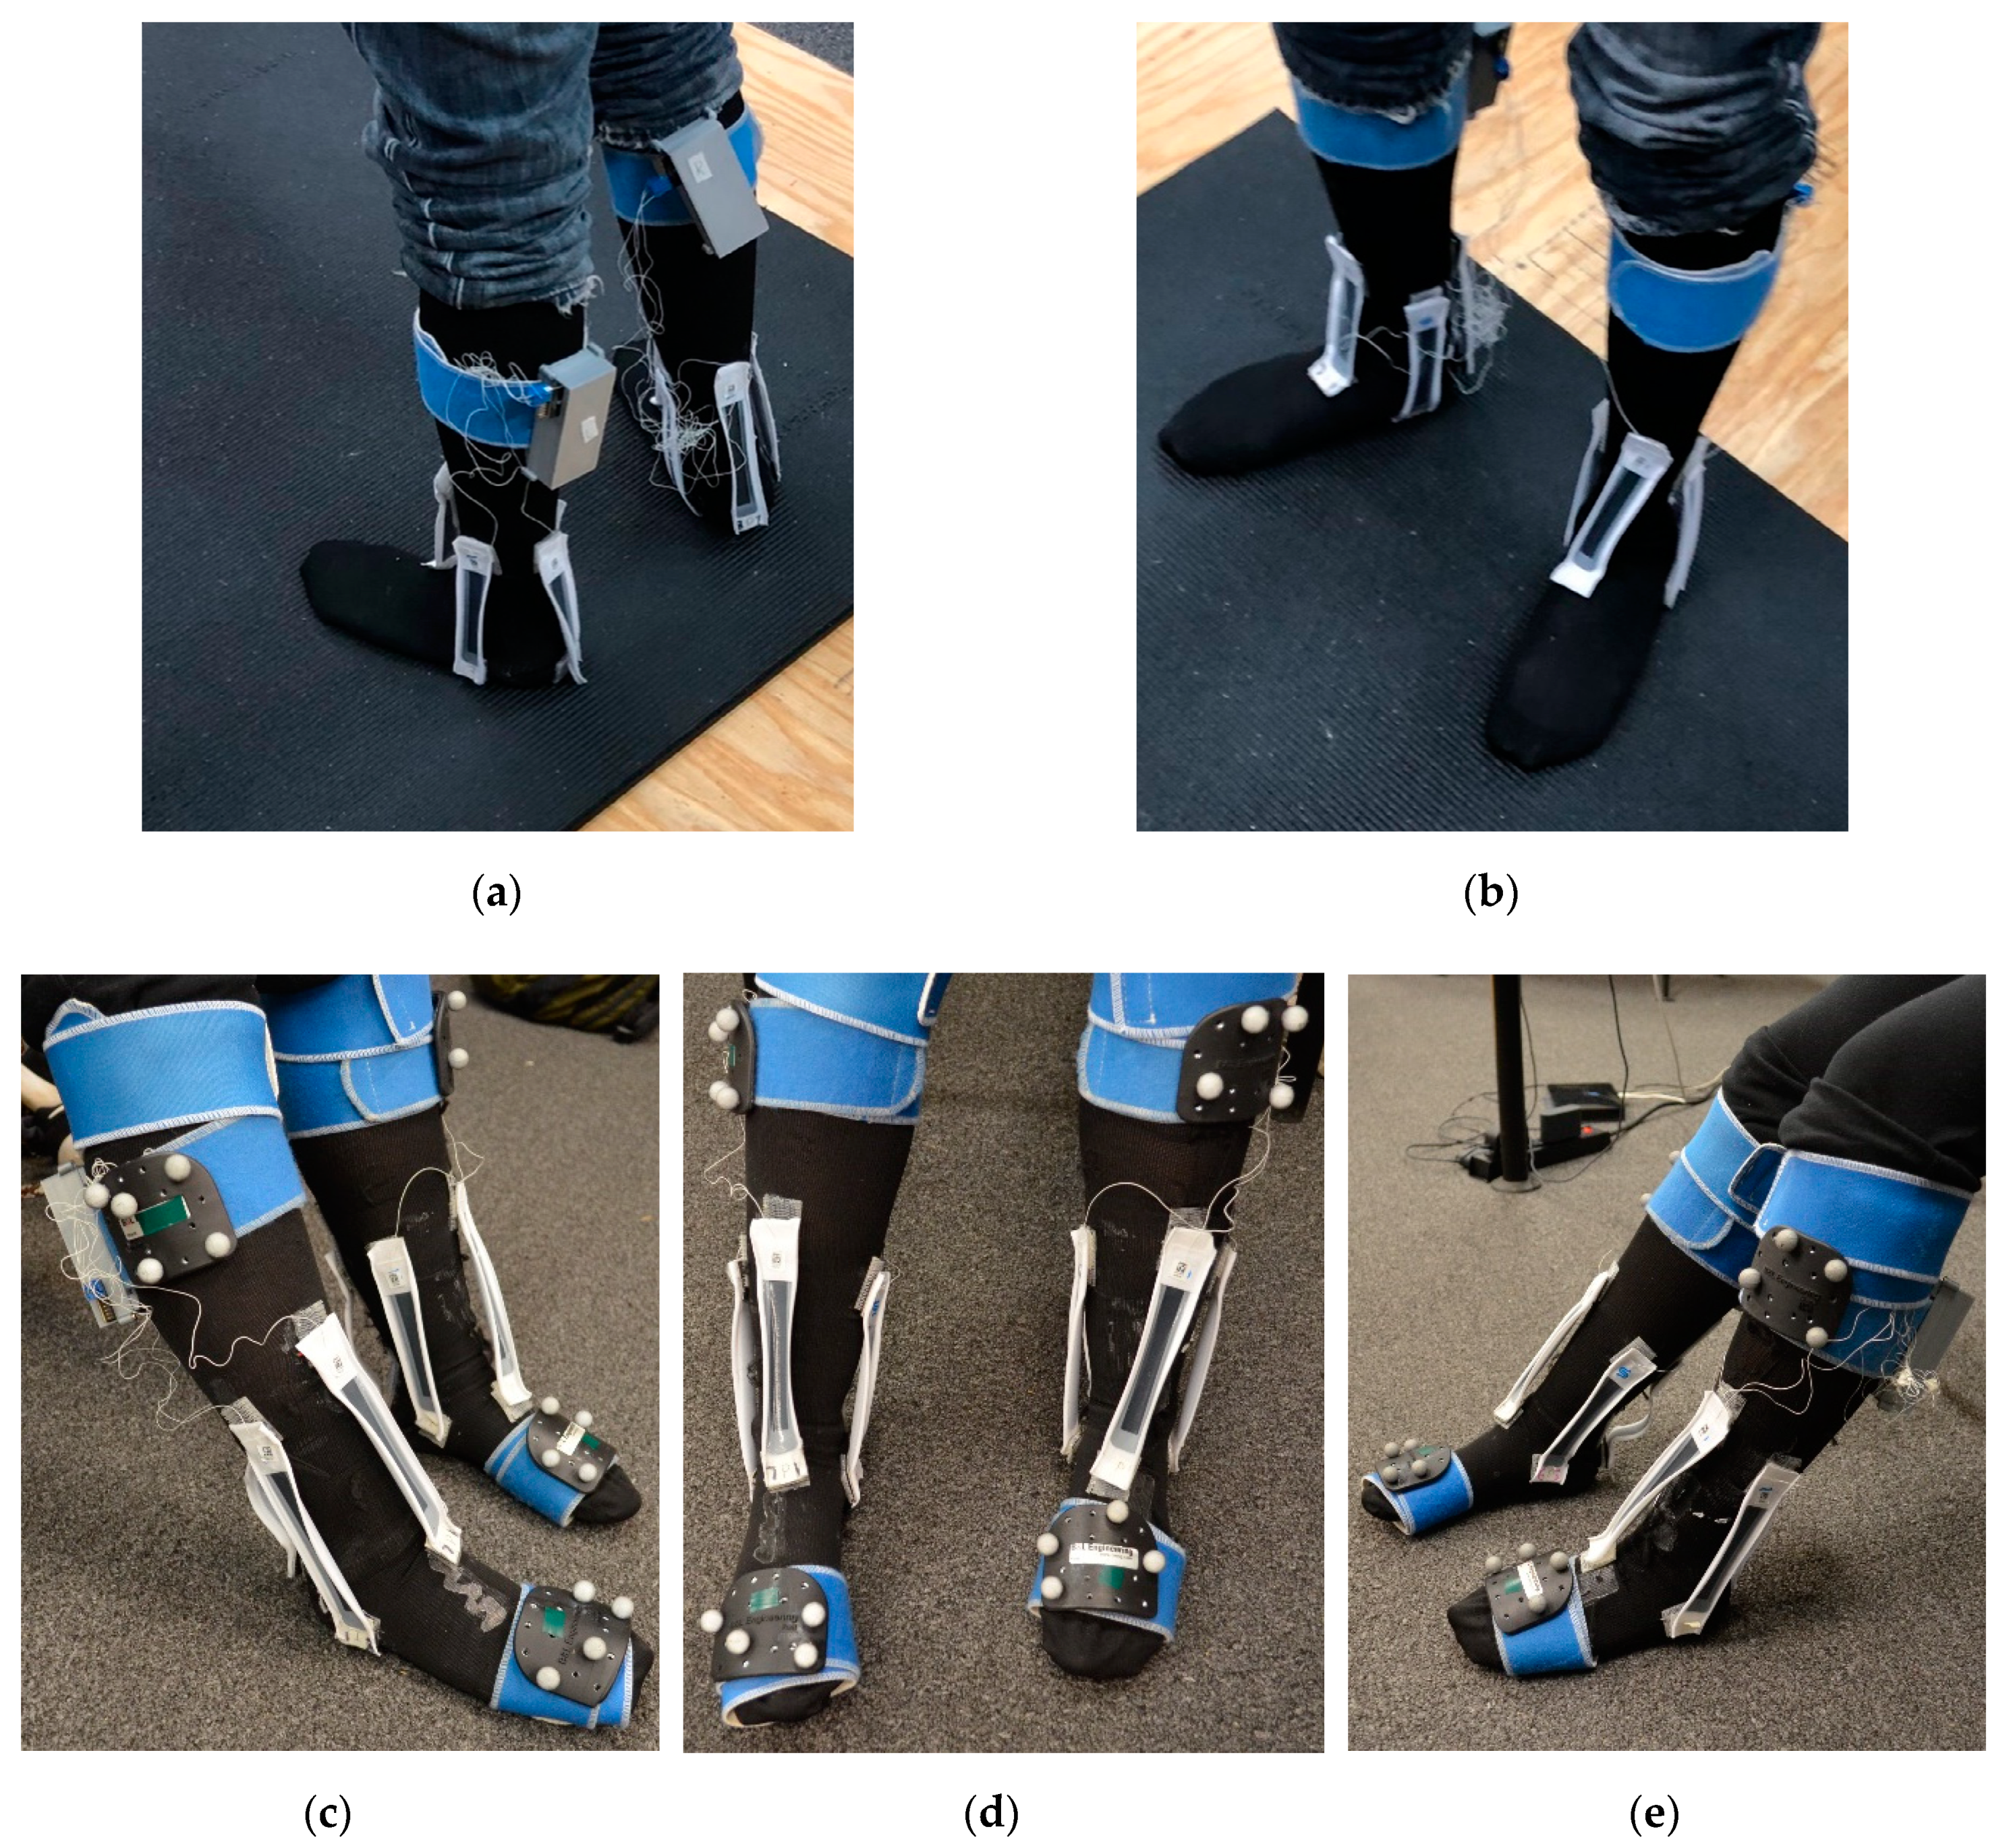
2.3. Instrumentation and Participant Preparation
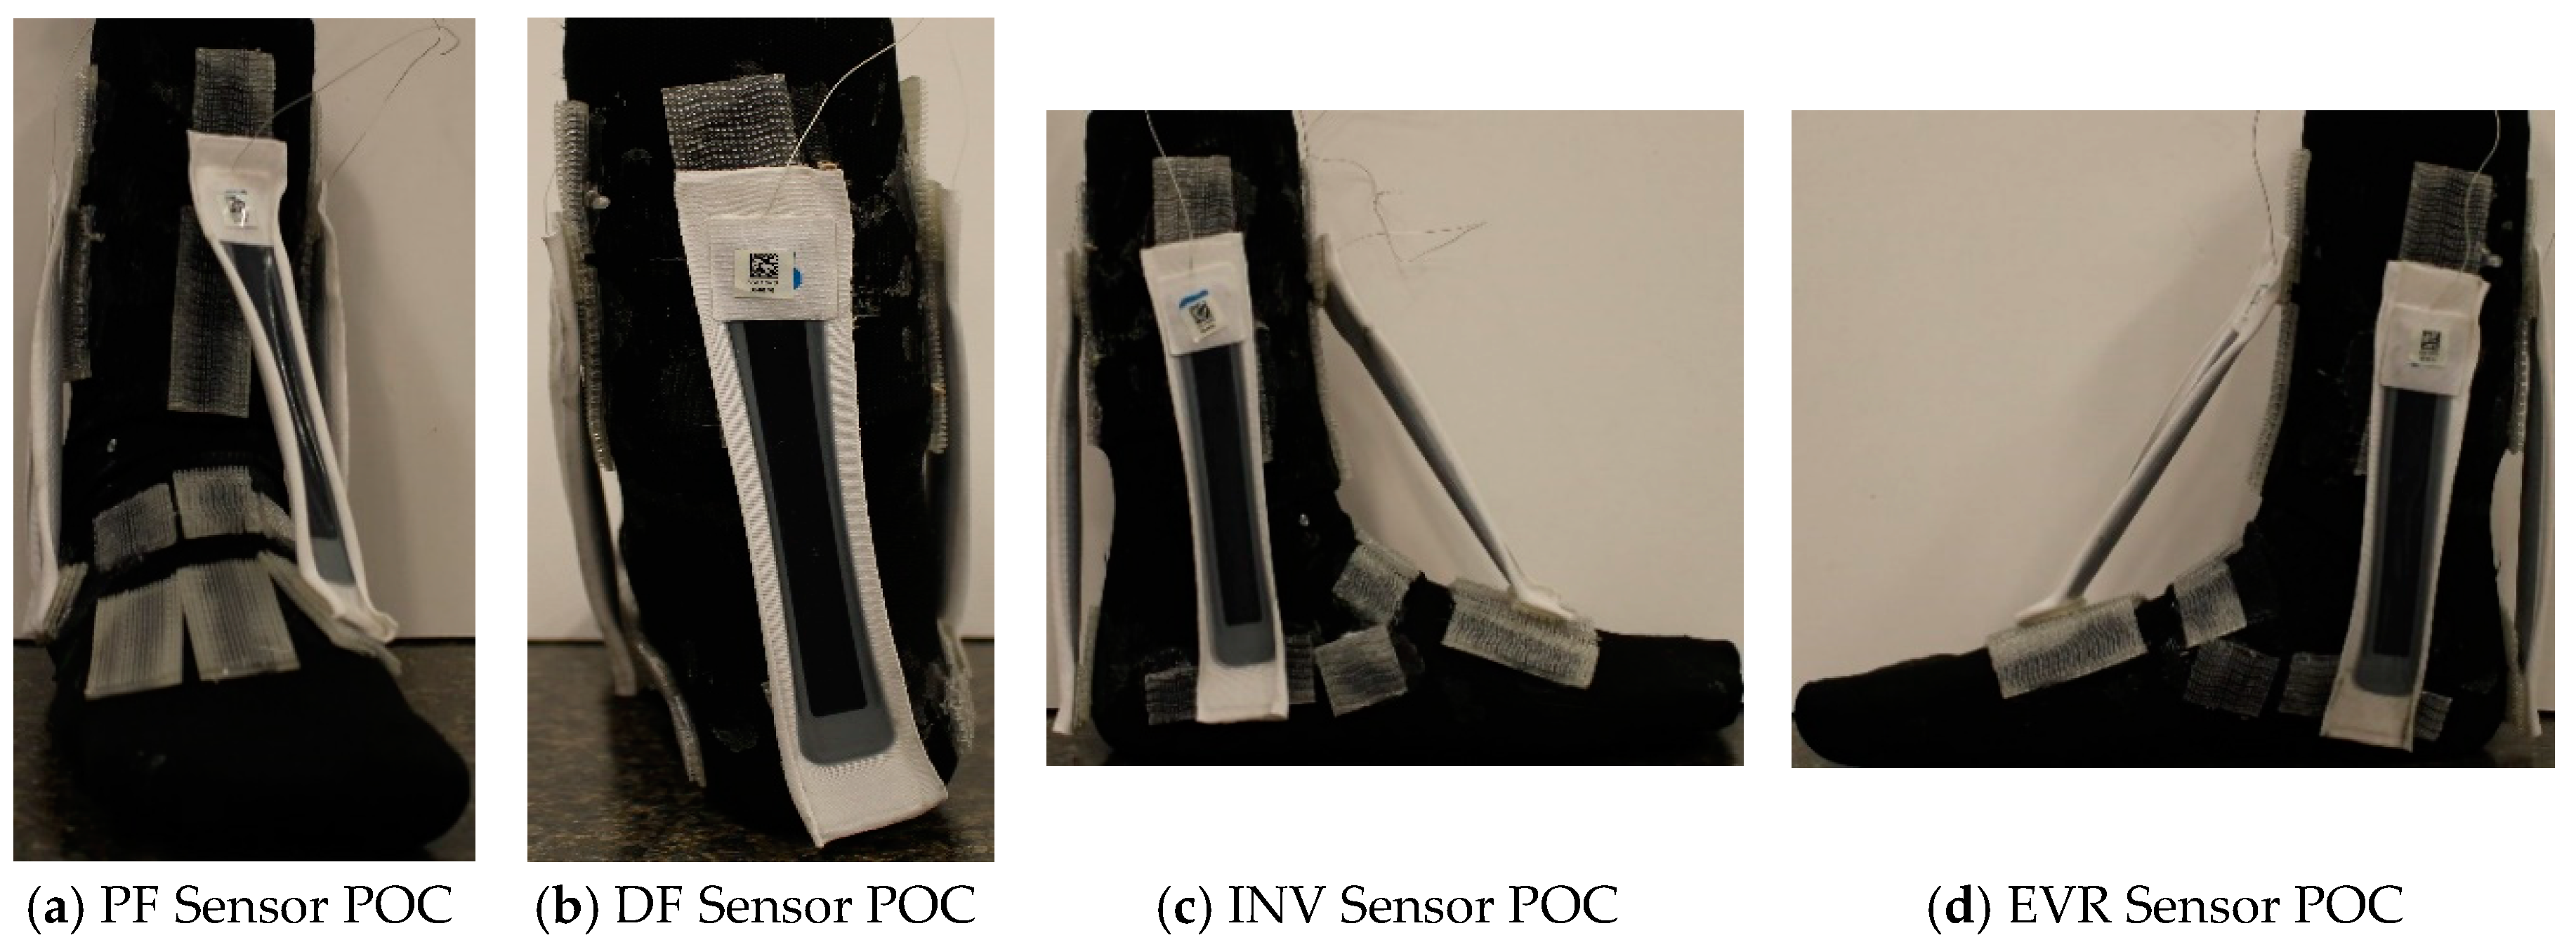
The experimental testing included measurements of ankle joint kinematics using 12 Bonita™ 10 camera 3D motion capture system (Vicon™, Oxford, UK) and eight StretchSense™ SRS (Auckland, New Zealand). The motion capture data was sampled at 200 Hz and the SRS data was sampled at 25 Hz. The MotionMonitor™ (Innovative Sports Training, Inc.™, Chicago, IL, USA) was used in conjunction with Vicon™ to capture, visualize, and assess the motion capture data. For this study, both foot-ankle complexes were measured. During testing, each participant was prepared by placing reflective motion capture marker clusters on the right lower extremity for the foot and shank (lower leg) segments. Four SRS were placed on each ankle and foot segment in a predetermined placement and orientation configuration (POC) identified in Part II of “closing the wearable gap” [9].

SRS POCs

Prior to this study, four different POCs were determined based on bony landmarks and movement patterns of the foot-ankle segment. The four POCs used herein were validated using multiple statistical methods including R-squared (R2) value and root-mean-squared error (RMSE) in order to respectively assess relative and absolute goodness of fit for the SRS placement against the gold standard of motion capture [9]. SRS POC donning at rest during the start of a TSP trial is demonstrated in Figure 2. Figure 3 illustrates the POC mounting of all four SRS for a single leg.

2.4. Experimental Procedures

Each participant was first instructed to read through a participation consent form and, upon agreement to the expectations of the study methods, sign their approval as per IRB protocol. Each participant was then asked to be seated in a chair-back seat and was given two socks each with four, pre-placed SRS sensors attached to be worn on both feet. Each sock corresponded to a specific leg; researchers ensured the appropriate sock was appropriately placed on the correct leg. Moreover, researchers ensured all participants arrived for the study with their own clean socks to be worn under the SRS donned socks for safety and hygiene purposes. Participants were given a pair of small to medium or large to extra-large socks depending on their shoe size. Following confirmation of proper sock application, the motion capture cluster sensors were mounted to both right and left foot and right and left shanks; following this, each participant assumed a neutral standing position, and the sensors were then calibrated to each participant for 3D motion capture.
A validation step was conducted, where on both the FS and TSP, each participant performed a minimum of two full gait cycles. For both surface types, the researchers confirmed that the 3D motion capture equipment and SRS donned socks were correctly capturing movement data for right and left foot-ankle joints for sensor locations. Upon completion of all validation steps, each participant was instructed to walk at a self-regulated pace across the 6.10 m of the FS rubber matting resulting in a minimum of two full gait cycles. The participant would then repeat the FS gait cycle for a total of six trials. After the first cycle where the participant began in the south side of the HPL and ended the trial in the north side, the participant was instructed to stand in place, turn around, and begin the next trial by walking from the north side of the room and back to the south. This process was repeated for each participant until all six FS trials were completed and a minimum of three gait cycles were captured per trial.
Upon completion of the six FS trials, six more trials were then captured in the same manner on the TSP across the 6.1 m of rubber matting secured to the platform. Since the TSP sat at a 10-degree incline, as the participants began their trial from the south to north, their left foot-ankle complex would be in an INV state and their right foot-ankle would be in EVR. After the first trial was complete and the participant was asked to stop, turn around, and walk the TSP from the north to south ends of the HPL, their left foot-ankle complex would then be in EVR and their right in INV. This process was completed until six trials (three trials with left leg INV and three trials with right leg INV) each with a minimum of two gait cycles were captured thereby concluding the data collection for each participant. A total of 12 trials (six on FS and six on TSP) were collected with a minimum 24 gait cycles recorded for each participant.
All participants were instructed to begin all gait trials with their right foot. A gait cycle (or stride) begins with the first heel strike of one foot, ends at the following heel strike of that same foot, and includes both the stance and swing phase for each leg [17,18]. For this study, because participants always started with the right foot, all gait cycles are calculated between right heel strikes.

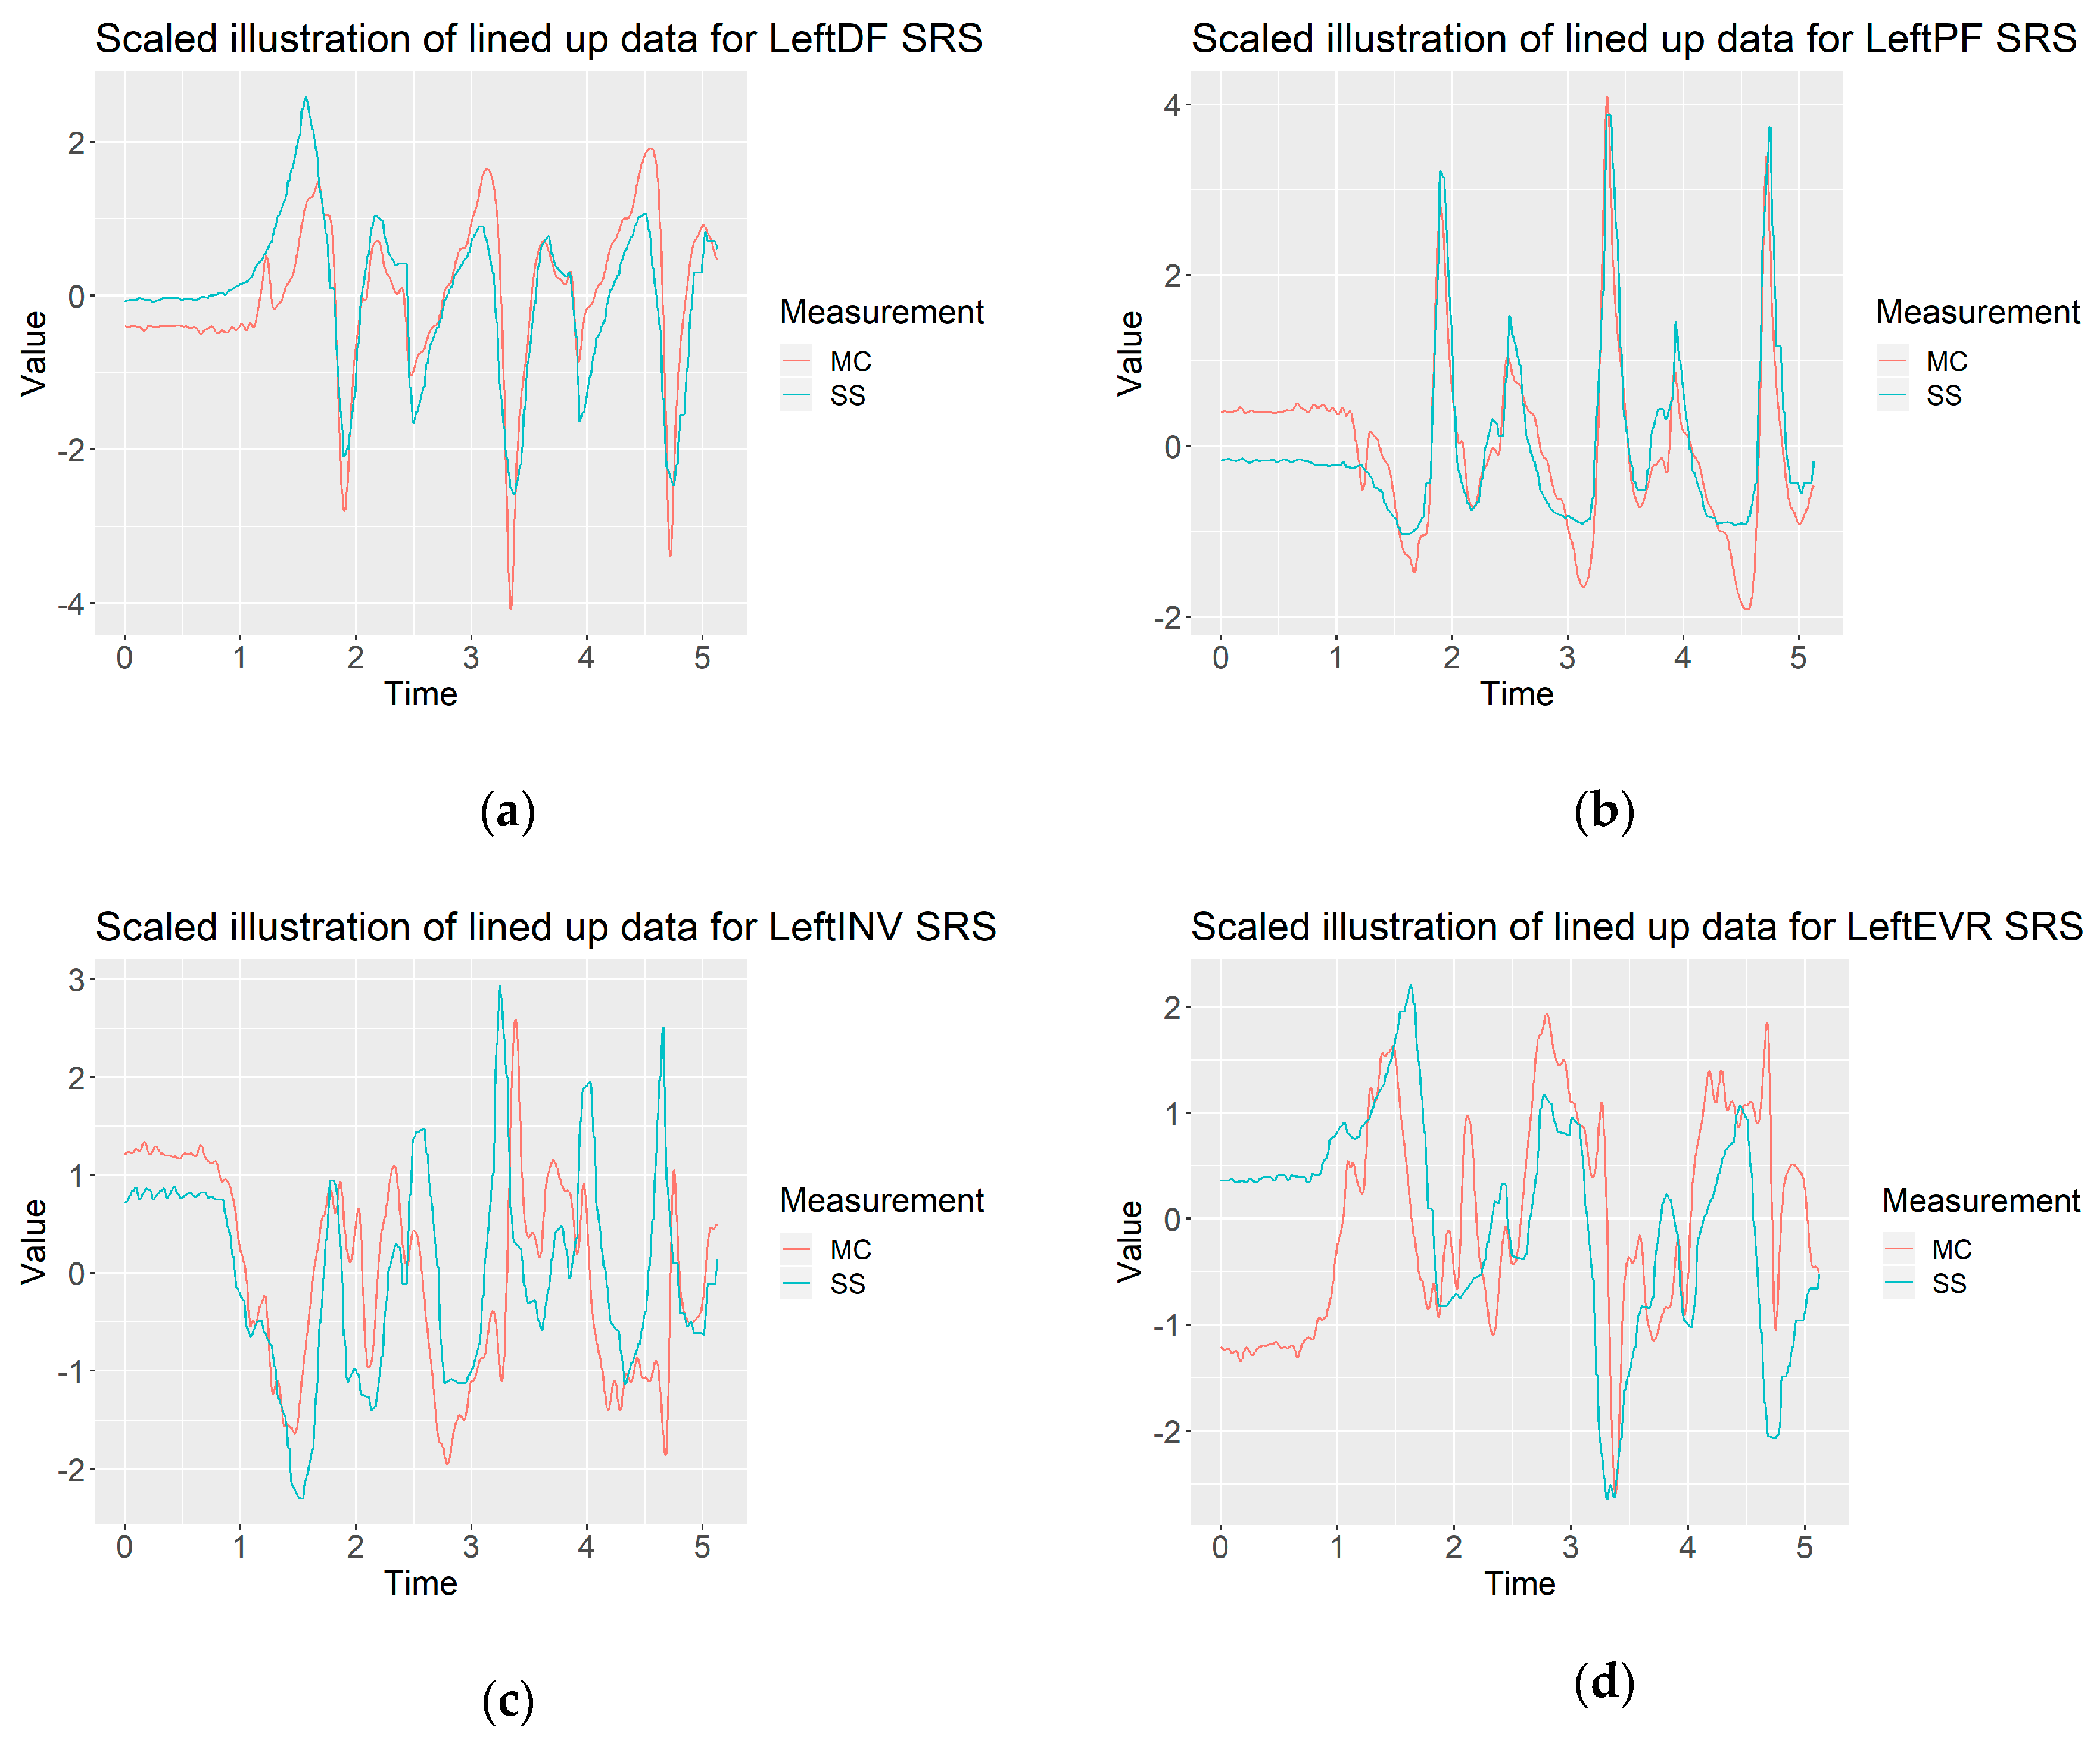
2.5. Data Preprocessing

A similar approach for preprocessing of the data was taken in [9]. Motion capture data was collected at 200 Hz and smoothed with a 30 Hz Butterworth filter. StretchSense™ data was collected at roughly 25 Hz and was approximated and upsampled to 200 Hz to match the sampling rate of the motion capture system. Following this, cross-correlation was used to align the two datasets over time. Each foot was analyzed separately for each trial to eliminate any potential delay that may occur between Bluetooth modules transmitted data from StretchSense™, and mobile devices (i.e., smartphones, laptops) received the Bluetooth data transmission. Further, only the DF and PF datasets from StretchSense™ SRS were used to determine the timing delay, as the INV and EVR data values did not present linear results with the 3D motion capture due to the potential for coupling of foot movements while some participants were walking (coupling is detailed further during the Limitations Subsection). As was done for previous studies, line plots were created for each of the preprocessed trials that were then validated by the researchers as having data aligned adequately over time. Some datasets were hand-trimmed due to errors in the recording systems where the 3D motion capture system would lose tracking of the participant, which was sometimes experienced when a participant would walk too closely to the outside of the capture space. Figure 4 provides an example of the formatted data for a participant’s left foot when walking across a flat surface. Note that for cross-correlation, the PF and DF sensor outputs were compared individually to the motion capture flexion data output, and the sensor that produced the highest autocorrelation coefficient of the two was used for adjusting the delay between the SRS data output and the data from 3D motion capture.
After the data was resampled and time-aligned, individual gait cycles were extracted from each of the trials. Due to the nature of gait cycles being unique for each participant, there was not a typical pattern to easily detect for automating separation of each gait cycle. To resolve this, each trial was reviewed in the MotionMonitor™ data playback software. This playback option provided a visual illustration of what movement was occurring in the motion capture system. The beginning of each gait cycle was marked as the beginning of the right foot heel strike. When reviewing the MotionMonitor™ playback, frame numbers were recorded for each point in the 3D motion capture data to mark the beginning and end of each gait cycle. An example of this is illustrated in Figure 5. Based on the variable stride length of the participants and the recommended walking path length for gait studies, a minimum of two gait cycles were collected for each trial. When participant stride lengths were shorter, a third gait cycle was collected as well. Three gait cycles were recorded for 80% of all the trials (190/238 trials). For the 20% of the trials where only two gait cycles were collected, participants had longer stride lengths and were not able to complete a third gait cycle within the 6.10 m walk space.
After the frame numbers were collected, they were then converted to seconds and used to trim the preprocessed data into separate files, each representing individual gait cycles. Finally, a third-order Savitzky–Golay filter was applied to the StretchSense™ data for smoothing. This filter was chosen as it is particularly effective at preserving minimum and maximum values after filtering [19]. Further, this filter application has been used in other applications for human motion analysis [20,21,22]. This filter was used to mitigate the effects of the aliasing that occurred when upsampling the StretchSense™ data to the same sampling rate as the 3D motion capture data. A filter length of 39 was used as this produced the best results when correlating the StretchSense™ data to the 3D motion capture data. An example of the improvements to the data made through this filtering is observed in Figure 6.

2.6. Statistical Analysis

Initially, the analysis was performed one-at-a-time on a single sensor basis in a similar manner as previous studies [9,10]. In this approach, linear models were generated for each individual sensor and compared to its corresponding movement (i.e., PF and DF sensors modeled to motion capture flexion; INV and EVR sensors modeled to motion capture inversion). DF and INV sensors were only compared to the positive angle values of the corresponding 3D motion capture data, while PF and EVR sensors were only compared to the negative values of the corresponding data. However, researchers discovered that this approach led to poor results for gait assessment, due to the occurrence of multiple foot-ankle movements at the same time. Due to the POC of the sensors, a coupling of movements occurred where sensor output would be affected by foot-ankle movements that they were not positioned to measure (e.g., a sensor positioned for flexion could also measure inversion movements).
Therefore, a multivariate linear model was developed to better predict the angle output of the motion capture data. For predicting both flexion and inversion data, all four sensors on each foot were used to predict the output of these two, primary foot-ankle movements. Figure 6 and Figure 7 illustrate the difference in prediction performance versus motion, surface, and foot. Various combinations of multivariate linear models were investigated as well to determine how much prediction accuracy was lost with the removal of different sensors. A model was developed where only PF and DF were used to predict flexion motion, and INV and EVR were used to predict inversion motion. Further, models were generated with each sensor removed individually. Results from all combinations of multivariate linear models are depicted in Table 1.

3. Results

Table 1 provides a summary of the key performance statistics of the experiment. In addition to using the root mean square error (RMSE) and adjusted R2 to determine measurement performance as was done for previous experiments [9,10], the mean absolute error (MAE) was added as a performance metric. MAE was found to be a desirable metric as it still provides a measure of the prediction performance of the stretchable SRS but—unlike RMSE—it does not add significant weight to large errors. Therefore, individual outliers do not drastically penalize prediction performance. Like RMSE, MAE is negatively oriented, so a lower value is better [23]. Including both metrics, in addition to adjusted R2, provides an idea of how much prediction performance was affected by significant outliers in the output of the SRS. The first column provides the mean and standard deviation MAE, RMSE, and adjusted R2 values when using all four SRS to predict inversion and flexion of the foot. Additional columns were added to show the loss in performance when certain sensors were removed from the model. The second column provides the performance results for using only the PF and DF SRS to predict flexion and using the INV and EVR SRS to predict inversion. The last four columns give the performance results when one sensor is removed when modeling both motions with the remaining three sensors.
Figure 7 presents violin plots showing a breakdown of the RMSE and MAE performance against the motion being predicted, the foot that SRS was mounted to, and the surface being walked on. These violin plots represent a kernel density distribution portrayed vertically. A greater horizontal width of a curve in the plot indicates a greater portion of participants that produced results near the value on the y-axis. More information on these types of plots and their benefits when performing these kinds of assessments can be found in Part II [9]. Violin plots of the adjusted R2 performance compared against these same factors can be seen in Figure 8. Adjusted R2 was used as an additional metric to determine goodness-of-fit of the model, while also incorporating the model’s degrees of freedom, accounting for the four sensors that are included in the model. It represents the proportion of total variance explained by the model [24].

4. Discussion

Part II of the “closing the wearable gap” paper series explored basic, static movements of the foot-ankle complex to assess optimal placement of stretchable SRS for mirroring 3D motion capture data as closely as possible. The results indicated two critical pieces of information: (a) Where stretchable SRS should be positioned around bony landmarks for optimal movement data capture and that (b) R2 and RMSE were excellent assessment methodologies for indicating robustness of SRS output compared to 3D motion capture output [9]. High R2 values indicate a successful relative measure of fit between sensor placement and data versus the gold standard of 3D motion capture data. Whereas low RMSE values indicated an absolute measure of fit between the two sets of data collected about foot-ankle complex movement. Part III of the paper series explored a similar stretchable SRS data collection method versus 3D motion capture study via fast, dynamic movements such as expected and unexpected slips and trips. Goodness-of-fit was validated again through high R2 and low RMSE for many of the study’s participants [10]. However, some of the participants did not share the same robustness as others due to a myriad of reasons mainly relating to technology (lower SRS refresh rates versus quicker movements) and methodology (the jerky and abrupt stoppage of the dynamic movements challenging the placement security of the motion tracking markers) limitations [10]. For this reason, average R2 and RMSE values suffered across the population of all participants. RMSE values suffer further due to the nature of this assessment methodology given that scores are penalized more for more significant prediction errors—errors in this instance representing the differences in movement capture data between the gold standard (3D motion capture) and the stretchable SRS. The desire to achieve goodness-of-fit while exploring all the ways to evaluate the said fit were carefully considered for this study, Part IV, where lessons learned were applied to the SRS capture of gait cycles.
The purpose of this study was to use 3D motion capture and stretchable SRS to collect foot-ankle movement on participants as they performed walking gait cycles on both a flat surface and a sloped platform with the primary goal being to assess the data output delta between the gold standard and a new wearable sensor solution. SRS POC for the primary foot-ankle movements (PF, DF, INV, and EVR) identified in Part II [9] were used, and the data assessment methodologies detailed in Parts II and III where utilized and added upon for this study [9,10]. Given the complex nature of using a linear solution to accurately quantify movement of a triaxial joint during a dynamic movement such as walking, 20 participants performing multiple walking trials were used. The participant gait trial data was then upscaled (for the SRS), time-aligned (based on the right heel strike), and smoothed using filtering methods. Due to the coupling of movements discovered in output of the SRS data, the basic linear models utilized in the previous studies [9,10] were determined to not be successful for gait assessment. A multivariate linear model combined with multiple linear models was developed to predict specific flexion better (from PF and DF) and inversion (INV and EVR) movements. With both data sets (3D motion capture and SRS) properly aligned, researchers could return to standard assessment methods of adjusted R2 and RMSE. A new assessment measure to compare the difference between two continuous variables, MAE, was added to provide additional information that contributes a complementary perspective to RMSE. Where RMSE penalizes the average more when larger errors occur, errors found in MAE are penalized less. Since there is variability within the gait cycle between all people [18]—there is value in using both methods. This is further explained in the following subsections.

4.1. Mean MAE

For mean MAE, the lower the value, the closer the fit between the 3D motion capture and stretchable SRS. A mean MAE score of 1.54 across flexion (PF and DF) and inversion (INV and EVR) of both left and right feet for all 20 participants while walking on a flat surface and a tilted platform is a positive result indicating a successful experiment. A low mean MAE was achieved despite having outliers as a result of noisy data from the left foot of two participants. Given that the right foot of these outlier participants didn’t generate the same noisy output, this would seem to indicate that the issue was not with the individuals performing the gait cycles but with the setup of either the 3D motion capture or the attachment of the SRS (this will be discussed in more detail in the Limitations Subsection). Despite the noisy data occurring on the left foot, the mean MAE was consistently higher in all situations for the right foot, indicating slightly less goodness-of-fit for the right. The right foot heel strike was the indicator for the beginning of the gait cycle and the alignment of the data, so an inference could be made that the right foot for all participants for all gait cycles was more accurately aligned than the left foot. However, until more data is captured on more participants, the reasoning behind a slightly worse fit for the right foot will require further investigation. Regardless, there is room to improve upon this low mean MAE score with continuous refinement of this study through the discovery and elimination of reasons leading to outlier participant trials.

4.2. Mean RMSE

Mean RMSE will always be higher than the mean MAE due to the nature of squaring the prediction error, as was indicated in the 1.96 score. Less accuracy between the joint angle measurements calculated by the stretchable SRS versus the gold standard will increase the overall mean RMSE score. For example, a 10-degree joint angle prediction error will impact the appropriateness-of-fit score much more than a five-degree prediction error. Whereas the mean MAE will be more forgiving of larger prediction errors treating them, not equally, but less harshly in the fit score. Since every person has a unique gait [18], the process of creating a wearable tool that accurately assesses movement at a complex, triaxle joint such as the foot-ankle may indefinitely encounter prediction difficulties simply because of wide varieties in the anthropometry and gait cycles of people. Therefore, utilizing the mean MAE for fit considers that not all errors may be preventable and should not overly penalize the fit score.
However, given that the goal of this entire project and “closing the wearable gap” paper series is to design a device that meets the needs of the practitioners by accurately capturing foot-ankle data “from the ground up” [8], then perhaps the more penalized score provided by mean RMSE is a more realistic appropriation of fit. Variance by five degrees in the calculation of a joint angle may not be viewed by a practitioner as problematic for flexion-based movements given that the foot-ankle joint can move in much wider arcs in the sagittal plane. However, perhaps a 10-degree joint angle prediction error in flexion is too high. Likewise, the inversion angle movement within the frontal plane is far more limited in range, and any degree of error may be too high given that a common ankle sprain, the plantar flexion inversion, can occur at minimal joint angles. The point is to emphasize that perhaps a more substantial penalty for larger errors warrants a worse fit score indicating that further improvement is needed for practitioners to get the technology and data they’re requesting to aid in the appropriate decision-making process for human health and safety.

4.3. Mean Adjusted R2

Whereas mean MAE and RMSE indicate fit by lower scores, goodness-of-fit is shown via the mean adjusted R2 by values closer to one. For this experiment, a score of 0.854 was found indicating a good fit between SRS and 3D motion capture, and this was despite the left and right foot outliers of participants’ gait cycles. Compared to the static movements of the individual joint angles collected in Part II [9], however, the fit for dynamic gait movements shows an increase in errors between 3D motion capture and when all four sensors are donned.

4.4. Stretch SRS Reduction Combinations

While using the capacitance values captured from all four SRS in the multivariate linear model created promising fit scores, two and three SRS combinations created higher mean MAE and RMSE values and lower mean adjusted R2 values indicating worse fit. The purpose behind this part of the study was to understand if any sensor was largely redundant considering that PF and DF are both movements that occur in the sagittal plane, and both INV and EVR movements occur in the frontal plane. Again, stressing that the purpose of this research is to create a wearable product using a unique type of sensor and noting that the stretchable SRS are the costliest components in the said product, reducing the number of sensors while retaining movement data accuracy would result in a positive economic design decision. Reviewing the two and three SRS combinations in Table 1, however, indicates that this research team is not yet ready to move away from the one-to-one ratio of sensors to primary foot-ankle movements. All two and three sensor combinations result in higher mean MAE and RSME scores and lower mean adjusted R2 scores. Surprisingly, dropping the INV sensor provides the second-best mean MAE and RMSE. Given that PF and INV provide the widest range of flexion and inversion movement types in the sagittal and frontal planes respectively, researchers had initially hypothesized that DF and ENV sensors seem to be the more likely candidates for sensor reduction options. Perhaps the better score achieved when removing INV has more to do with the noisy participant outliers than anything to do with the type of data collected at this foot-ankle movement. Likewise, based on mean adjusted R2 scores, PF is the recommended sensor to remove. PF also experienced a left foot participant outlier. While the researchers of this study will continue to assess solutions that remain accurate yet utilize fewer sensors, more work is needed first to improve fit scores further before any sensors are removed from this wearable prototype solution.

4.5. Limitations

While the extreme outliers visualized in the violin plots (Figure 7 and Figure 8) were just from the left feet of two participants and were primarily contained to the INV movement, this noisiness in the SRS data resulted in a mean lower fit across all participants and all feet walking across all surfaces. Upon careful inspection of the data from the participants, the researchers suspect that the left foot of these participants was at or approaching the edge of the motion tracking space, and therefore the resulting errors may have had more to do with noise from the 3D motion capture data rather than issues from the SRS. Given that all participants began all gait trials with their right heel strike, participants with longer gait lengths were reaching the end of the 6.1 m walkway prior to the final footfall of their left foot. Limitations of the lab space aside, this explanation may account for some of the outliers; it does not account for all noise and coupling seen within the participant gait trial data.
Considering all noise and coupling seen within the data results of the experiment, two primary issues have been recognized by the researchers as areas for improvement needed prior to the next SRS-based gait study: (a) Sensors were not pre-strained enough meaning that some minimal movements were not captured because there was potential slack in the SRS and (b) 3D motion capture errors occurred because the marker clusters were not mounted appropriately. As visualized in Figure 2b (for error demonstration) the participant’s right foot has a marker cluster that is more closely mounted over the toes instead of being mounted behind the toes as on the left foot. Mounting the cluster over the toes may increase recorded movement between the shank and the foot because, as the participant flexes his or her toes, additional movements are recorded that would not have otherwise occurred had the marker been secured to the top of the foot. This toe flexion or “toe-curling” noise artificially creates movement where it should not be and therefore increase the error between the SRS and what is supposed to be the gold standard.
Another limitation ties back to variance in participant gait patterns and stride length (there is variability within different gait cycles of the same person and between the gait cycles of different people [18]), and INV is more challenging to capture than PF. Depending on the participant, INV interpretation may also be more challenging due to coupling of the different movements due to the sensor position. As Figure 9 visualizes, coupling can occur—typically between the PF and INV SRS—but does not consistently occur on the same foot or the same participant or across all gait cycles in a trial. When coupling does occur, however, this, too, can lead to noisy data and outliers that reduce goodness-of-fit scores.

4.6. Future Work

Moving forward, there are still other approaches available to investigate to potentially improve goodness-of-fit results even more. A decoupling coefficient matrix could be implemented to potentially mitigate the influence of the coupled movements that are affecting the SRS outputs. Further, there is a need to develop a more generic model that can predict values accurately across several sessions of using the SRS rather than a per-trial basis. Deep learning techniques could also be applied to improve prediction accuracy. However, a much larger quantity of data will need to be collected for the in-depth learning approach to be feasible. Additionally, a more consistent SRS mounting method will need to be developed to ensure consistency between different data collection sessions when SRS measurements are collected so that a deep learning model would be trained effectively. The researchers are investigating a new hook and eye design to aid in consistency across SRS mounting and to eliminate all future sensor pre-strain issues, thereby ensuring SRS can only be mounted in one way to the sock fabric.

5. Conclusions

Upon completion of the participant trials, mean MAE, RMSE, and adjusted R2 were used to determine relative, absolute, and general goodness of fit for the SRS output as compared to the 3D motion capture. Robustness was determined by lower MAE and RMSE scores and higher adjusted R2 scores. Violin plots were used to visualize the impact of outlier participants while still showing a successful fit between a new wearable solution and the gold standard of movement assessment.
Additional analyses were performed to determine if a two or three SRS combination would provide similar fit scores but a reduced sensor count. Results indicate and expected worse fit for any sensor combination outside of using all four SRS. However, the second-best fit scores were a result of running assessments without INV for mean MAE and RMSE and without PF for mean Adjusted R2, which is surprising given that these are the primary movements in their respective frontal and sagittal planes. Researchers perceive this to have been largely impacted by data outliers caused by SRS sensors that were not properly pre-strained or marker clusters placed too close to the participant’s toes. Regardless of the challenges, this research team remains confident that an accurate gait assessment that rivals the accuracy of 3D motion capture systems can still be achieved using only four off-the-shelf SRS sensors. As is consistent with the Conclusions Section in Part II of the “closing the wearable gap” paper series: “the solution verified on human participants within this study essentially creates a real-time, continuous, and consistent electric goniometer that a user can wear to assess their movements accurately” [8].

Author Contributions

Conceptualization, D.S., S.D., R.F.B.V., J.E.B., B.K.S., H.C., A.K., and R.K.P.; Data curation, D.S., S.D., T.L., A.T., P.N., W.C., J.E.B., and B.K.S.; Formal analysis, D.S., S.D., P.N., W.C., R.F.B.V., J.E.B., B.K.S., H.C., A.K., and R.K.P.; Funding acquisition, R.F.B.V., J.E.B., H.C., A.K., R.K.P., and B.K.S.; Investigation, D.S. and S.D.; Methodology, T.L., D.S., R.F.B.V., J.E.B., H.C., and A.K.; Project administration, T.L., D.S., R.F.B.V., J.E.B., and H.C.; Resources, R.F.B.V., J.E.B., B.K.S., H.C., A.K., and R.K.P.; Software, D.S., S.D., P.N., W.C., and J.E.B.; Supervision, R.F.B.V., J.E.B., H.C., R.K.P., and A.K.; Validation, D.S., R.F.B.V., J.E.B., B.K.S., H.C., A.K., and R.K.P.; Visualization, D.S., S.D., R.F.B.V., J.E.B., H.C., and A.K.; Writing—original draft, D.S., S.D., A.T., R.F.B.V., J.E.B., H.C., and A.K.; Writing—review and editing, J.E.B., H.C., A.K., R.K.P., and B.K.S.

Funding

The research presented in this paper was funded by the National Science Foundation under NSF 18-511—Partnerships for Innovation award number 1827652.

Acknowledgments

We thank the anonymous reviewers for their helpful suggestions for improving the paper.

Conflicts of Interest

The authors declare no conflict of interest.

References

  1. Winter, D.A. Kinematic and kinetic patterns in human gait: Variability and compensating effects. Hum. Mov. Sci. 1984, 3, 51–76. [Google Scholar] [CrossRef]
  2. Winter, D.A.; Eng, F.F.; Isshac, M.G. A review of kinetic parameters in human walking. In Gait Analysis: Theory and Application; Mosby-Year Book: St. Louis, MO, USA, 1994; pp. 263–265. [Google Scholar]
  3. Fong, D.T.-P.; Chan, Y.-Y. The Use of Wearable Inertial Motion Sensors in Human Lower Limb Biomechanics Studies: A Systematic Review. Sensors 2010, 10, 11556–11565. [Google Scholar] [CrossRef] [PubMed]
  4. Chan, M.; Estève, D.; Fourniols, J.-Y.; Escriba, C.; Campo, E. Smart wearable systems: Current status and future challenges. Artif. Intell. Med. 2012, 56, 137–156. [Google Scholar] [CrossRef] [PubMed]
  5. Filippeschi, A.; Schmitz, N.; Miezal, M.; Bleser, G.; Ruffaldi, E.; Stricker, D. Survey of Motion Tracking Methods Based on Inertial Sensors: A Focus on Upper Limb Human Motion. Sensors 2017, 17, 1257. [Google Scholar] [CrossRef] [PubMed]
  6. Foerster, F.; Smeja, M.; Fahrenberg, A.J. Detection of posture and motion by accelerometry: A validation study in ambulatory monitoring. Comput. Hum. Beha. 1999, 15, 571–583. [Google Scholar] [CrossRef]
  7. Espinosa, H.G.; Lee, J.; James, D.A. The inertial sensor: A base platform for wider adoption in sports science applications. J. Fit. Res. 2015, 4, 13–20. [Google Scholar]
  8. Luczak, T.; Saucier, D.; Burch, V.; Ball, J.; Chander, H.; Knight, A.; Wei, P.; Iftekhar, T. Closing the Wearable Gap: Mobile Systems for Kinematic Signal Monitoring of the Foot and Ankle. Electronics 2018, 7, 117. [Google Scholar] [CrossRef]
  9. Saucier, D.; Luczak, T.; Nguyen, P.; Davarzani, S.; Peranich, P.; Ball, J.E.; Burch, V.R.F.; Smith, B.K.; Chander, H.; Knight, A.; et al. Closing the Wearable Gap—Part II: Sensor Orientation and Placement for Foot and Ankle Joint Kinematic Measurements. Sensors 2019, 19, 3509. [Google Scholar] [CrossRef] [PubMed]
  10. Chander, H.; Stewart, E.; Saucier, D.; Nguyen, P.; Luczak, T.; Ball, J.E.; Knight, A.C.; Smith, B.K.; Burch, V.R.F.; Prabhu, R.K. Closing the Wearable Gap—Part III: Use of Stretch Sensors in Detecting Ankle Joint Kinematics During Unexpected and Expected Slip and Trip Perturbations. Electronics 2019, 8, 1083. [Google Scholar] [CrossRef]
  11. Mishra, E.; Jena, S.; Bhoi, C.; Arunachalam, T.; Panda, S.K. Effect of high heel gait on hip and knee-ankle-foot rollover characteristics while walking over inclined surfaces—A pilot study. Foot 2019, 40, 8–13. [Google Scholar] [CrossRef] [PubMed]
  12. Bianchi, L.; Angelini, D.; Orani, G.P.; Lacquaniti, F. Kinematic coordination in human gait: Relation to mechanical energy cost. J. Neurophysiol. 1998, 79, 2155–2170. [Google Scholar] [CrossRef] [PubMed]
  13. Gomeñuka, N.A.; Bona, R.L.; da Rosa, R.G.; Peyré-Tartaruga, L.A. The pendular mechanism does not determine the optimal speed of loaded walking on gradients. Hum. Mov. Sci. 2016, 47, 175–185. [Google Scholar] [CrossRef] [PubMed]
  14. Blair, S.; Lake, M.J.; Ding, R.; Sterzing, T. Magnitude and variability of gait characteristics when walking on an irregular surface at different speeds. Hum. Mov. Sci. 2018, 59, 112–120. [Google Scholar] [CrossRef] [PubMed]
  15. Wrightson, J.G.; Schäfer, L.; Smeeton, N.J. Dual-task prioritization during overground and treadmill walking in healthy adults. Gait Posture 2019, 75, 109–114. [Google Scholar] [CrossRef] [PubMed]
  16. Kwon, Y.-H.; Hutcheson, L.; Casebolt, J.B.; Ryu, J.-H.; Singhal, K. The Effects of Railroad Ballast Surface and Slope on Rearfoot Motion in Walking. J. Appl. Biomech. 2012, 28, 457–465. [Google Scholar] [CrossRef] [PubMed]
  17. Backus, S.I.; Brown, A.M.; Barr, A.E. Biomechanics of Gait. In Basic Biomechanics of the Musculoskeletal System; Nordin, M., Frankel, V.H., Eds.; LWW: Philadelphia, PA, USA, 2012; pp. 426–443. [Google Scholar]
  18. Winter, D.A. Biomechanical Motor Patterns in Normal Walking. J. Mot. Behav. 1983, 15, 302–330. [Google Scholar] [CrossRef] [PubMed]
  19. Savitzky, A.; Golay, M.J. Smoothing and Differentiation of Data by Simplified Least Squares Procedures. Anal. Chem. 1964, 36, 1627–1639. [Google Scholar] [CrossRef]
  20. Davey, N.; Wixted, A.; Ohgi, Y.; James, D.A. A low cost self contained platform for human motion analysis. In The Impact of Technology on Sport II; CRC Press: Boca Raton, FL, USA, 2008; pp. 101–111. [Google Scholar]
  21. Paraschiv-Ionescu, A.; Buchser, E.E.; Rutschmann, B.; Najafi, B.; Aminian, K. Ambulatory system for the quantitative and qualitative analysis of gait and posture in chronic pain patients treated with spinal cord stimulation. Gait Posture 2004, 20, 113–125. [Google Scholar] [CrossRef] [PubMed]
  22. Awal, M.A.; Mostafa, S.S.; Ahmad, M. Performance Analysis of Savitzky-Golay Smoothing Filter Using ECG Signal. Int. J. Comput. Inf. Technol. 2011, 1, 24–29. [Google Scholar]
  23. JJ, MAE and RMSE—Which Metric Is Better? Medium. 23 March 2016. Available online: https://medium.com/human-in-a-machine-world/mae-and-rmse-which-metric-is-better-e60ac3bde13d (accessed on 28 October 2019).
  24. Grace-Martin, K. Assessing the Fit of Regression Models. The Analysis Factor. 8 December 2008. Available online: https://www.theanalysisfactor.com/assessing-the-fit-of-regression-models/ (accessed on 30 October 2019).
Figure 1. A 1.22 m wide by 7.32 m long tilted surface platform or TSP walkway with 10-degree slope for inducing inversion (INV) and eversion (EVR) foot-ankle complex movements during self-paced gait trials; includes 6.10 m of covered half-inch rubber mats; simulated participant trial during TSP right-foot INV and left-foot EVR.
Electronics 08 01382 g001
Figure 2. Soft robotic sensor placement and orientation configuration or SRS POC placement for the (a) left and (b) back for a simulated participant at rest prior to a TSP gait trial; SRS POC placement and motion capture marker set placement for the (c) left, (d) front, and (e) right for stimulated seated participant.
Electronics 08 01382 g002
Figure 3. (a) Plantar flexion (PF) SRS mounted on the dorsal surface and oriented towards the hallux (big toe) to measure the downward movement of the foot; (b) dorsiflexion (DF) SRS mounted on the heel of the foot to measure the upward movement of the foot towards the lower leg; (c) INV SRS mounted directly over the lateral malleolus (bony landmark on the lateral side of the ankle) to measure the movement of the sole (bottom of the foot) towards the midline of the body; (d) EVR SRS mounted directly over the medial malleolus (bony landmark on the medial side of the ankle) [1].
Electronics 08 01382 g003
Figure 4. (a) Scaled output of StretchSense™ DF sensor output (capacitance) compared to motion capture flexion output (degrees); (b) scaled output of StretchSense™ PF sensor output compared to the inverted motion capture flexion output; (c) scaled output of StretchSense™ INV sensor output compared to motion capture inversion output; (d) scaled output of StretchSense™ EVR sensor output compared to motion capture inversion output.
Electronics 08 01382 g004
Figure 5. Example of MotionMonitor™ playback used to record right heel strike frame numbers. Pictured on the left is the frame where the first right foot heel strike occurs. On the right are examples of the graphs depicting the output of the motion capture measurements.
Electronics 08 01382 g005
Figure 6. (a) Upsampled StretchSense™ gait cycle data for the left foot collected before filtering. (b) Upsampled StretchSense™ gait cycle data for the left foot after filtering (third-order, window length of 39).
Electronics 08 01382 g006
Figure 7. Violin plot of root mean square error (RMSE) and mean absolute error (MAE) metric showing the mean and spread of results with respect to various factors. Flexion and inversion columns represent the motion that was being predicted. Rows represent the two types of surfaces the participant walked on. Left foot and right foot sensors are represented in the graph as LF and RF, respectively.
Electronics 08 01382 g007
Figure 8. Violin plot of adjusted R2 metric showing mean and spread of results with respect to various factors. Colored points represent individual participant means. Flexion and inversion columns represent the motion that was being predicted. Rows represent the two types of surfaces the participant walked on. Left foot and right foot sensors are represented in the graph as LF and RF, respectively.
Electronics 08 01382 g008
Figure 9. Sample participant data demonstrating a coupling effect between INV and PF sensors of the right foot. PF is causing a decrease in the inversion value because tension is being taken off the INV SRS during the gait movement. Therefore, as PF increases, INV incorrectly decreases due to this coupling effect.
Electronics 08 01382 g009
Table 1. Results for various combinations of multivariate linear models to predict motion output. Best results highlighted.
Statistic (°)All Sensors for Each MotionTwo Sensors for Each MotionNo PF SensorNo DF SensorNo INV SensorNo EVR Sensor
Mean MAE1.541.961.851.881.811.89
Mean RMSE1.962.452.362.342.292.36
Mean Adjusted R20.8540.7790.8060.8020.7810.791
Standard Deviation MAE0.6120.7610.7900.8480.6830.753
Standard Deviation RMSE0.7790.9351.0301.0300.8490.920
Standard Deviation Adjusted R20.1340.1880.1600.1670.2130.179

