A Smart IoT Device for Detecting and Responding to Earthquakes


1
School of Computer Science and Engineering, Kyungpook National University, Daegu 41566, Korea
2
National Disaster Management Research Institute, Ulsan 44538, Korea
*
Author to whom correspondence should be addressed.
Electronics 2019, 8(12), 1546; https://0-doi-org.brum.beds.ac.uk/10.3390/electronics8121546
Submission received: 5 November 2019
/
Revised: 3 December 2019
/
Accepted: 9 December 2019
/
Published: 15 December 2019
(This article belongs to the Special Issue IoT Services, Applications, Platform, and Protocols)
Abstract
:The advancement of hardware and software technologies makes it possible to use smartphones or Internet of things for monitoring environments in realtime. In recent years, much effort has been made to develop a smartphone based earthquake early warning system, where low-cost acceleration sensors inside a smartphones are used for capturing earthquake signals. However, because a smartphone comes with a powerful CPU, spacious memory, and several sensors, it is waste of such resources to use it only for detecting earthquakes. Furthermore, because a smartphone is mostly in use during the daytime, the acquired data cannot be used for detecting earthquakes due to human activities. Therefore, in this article, we introduce a stand-alone device equipped with a low-cost acceleration sensor and least computing resources to detect earthquakes. To that end, we first select an appropriate acceleration sensor by assessing the performance and accuracy of four different sensors. Then, we design and develop an earthquake alert device. To detect earthquakes, we employ a simple machine learning technique which trains an earthquake detection model with daily motions, noise data recorded in buildings, and earthquakes recorded in the past. Furthermore, we evaluate the four acceleration sensors by recording two realistic earthquakes on a shake-table. In the experiments, the results show that the developed earthquake alert device can successfully detect earthquakes and send a warning message to nearby devices, thereby enabling proactive responses to earthquakes.
1. Introduction
In the past decade, the emergence of mobile devices, especially smartphones and Internet of Things (IoT) have brought significant change and development in both hardware and software. The IoT technology build powerful smart systems to analyze and monitor several real time systems [1]. It provides services in smart home, smart building, Intelligent transportation systems, smart healthcare, smart grids and smart cities [2,3]. Its greatest potential lies in monitoring systems; for example, in smart floors it will call an ambulance when it detects that an elderly person has fallen [4]. Similarly, mobile devices continuously monitor a user’s vital signs and report any illness that they detect. Mobile devices like smartphones are an integral part of IoT systems, and the most frequently used devices in IoT systems, due to their equipped sensors such as accelerometers, gyroscope, GPS, and magnetometer, etc. These sensors are widely used in IoT systems to get useful information for various purposes, such as location-aware services, games, and healthcare applications, etc. [5,6].
Every year we expect 16 major earthquakes, 15 of which might be of magnitude 7.0 range and 1 earthquake of magnitude 8.0 or greater [7], which can cause fatalities and damage in populated regions [8]. As a result, there has been a high demand for developing an early warning system that can detect earthquakes and respond to them in a very short time to avoid fatalities and damages. In recent years, some promising attempts have been made to detect earthquakes using mobile device sensors. An MEMS-based acceleration sensor has been used in the past few years in different earthquake monitoring systems [9]. In this system, an acceleration sensor continuously records shakings and then detects an earthquake using straightforward triggering algorithms or machine learning techniques.
In this article, we present an intelligent IoT device that can detect shaking caused by an earthquake and then send out appropriate warning messages according to the strength of shaking. The device can be attached to a wall or a ceiling of a structure. Because the proposed smart device is equipped with only necessary sensors which include an accelerometer, WiFi, and a microprocessor, its cost is very low compared to a smartphone. Based on the cost and performance, we carefully evaluated four different acceleration sensors to determine and select an appropriate hardware specification for our device.
The developed system operates as a standalone detector. It uses an earthquake detection algorithm which further uses a trained machine learning model to detect the earthquake signals recorded on the accelerometer. Our machine learning model uses the same features proposed in [10]. It detects the earthquakes and immediately sends an alarm (response) to nearby users. In contrast, other approaches require an internet connection to connect the sensors to the remote server or a cloud, for further processing (such as final detection and response).
As discussed above, the detection ability of the proposed device depends on the machine learning model, hence, in order to decrease the false alarm rate, the model needs to be robust against noise. In our case, the noise source may be external or internal. External sources are; construction at building site, some activity near the device, heavy traffic near the building, etc. An internal source is due to the sensor quality.
Finally, we tested our earthquake detection algorithm on the Pohang earthquake dataset (which was recorded during a shake table test) to further assess the performance of our system on the earthquakes occurring in South Korea. The machine learning model of the system can be trained with different earthquake records, recorded at different locations. Therefore, the developed system can be easily adopted by different earthquake prone countries.
The rest of the article is organized as follows. Section 2 describes the technical background and compares proposed approach with state-of-the-art technologies. The detailed discussion of our proposed approach with the evaluation of the sensors is given in Section 3. The experimental evaluation of the system is comprehensively discussed in Section 4, while Section 5 concludes this article.
2. Related Work
In this section, we introduce the background technologies used in this work and the relevant projects that are somehow related to or have influenced our work.
In the past few years, seismologists have adopted smartphones or low-cost acceleration sensors to detect earthquakes. In this regard, Myshake is one of the most recent contributions which utilizes the smartphone as an earthquake detection sensor [11,12]. The sensor captures the data from the user’s phone using MyShake application and then process that data by using artificial neural network for earthquake detection. If the algorithm detects any earthquake like signals then it sends that timestampt data to the server. MyShake application runs on volunteers’ smartphones and they are asked to install the application. It is the first world-wide earthquake alert system using smartphone sensors. However, because MyShake heavily relies on the volunteers smartphones, when the smartphones are in active mode, they cannot be used as a seismic station or earthquake detector. In addition, the earthquake detection model trained using earthquakes and human activities can be good enough to distinguish earthquakes from human activities but cannot detect earthquakes from various types of tremors generated from buildings.
Prior to MyShake, NetQuakes is another project by United States Geological Survey (USGS) to detect earthquakes using low-cost MEMS sensors [13]. These sensors were installed at small buildings around the world, mostly in California. In this project, in order to select an appropriate sensor, they classified sensors into A, B, and C classes. They selected class B sensors to their NetQuakes project whose cost was about $500. The other two classes A and C were used in traditional seismic stations and mobile devices, respectively. The earthquake monitoring developed in the NetQuakes project is relatively expensive and needs to be installed in a calm, stable basement and connected to Internet.
Similarly, Quake-Catcher Network (QCN) initiated by University of Stanford, and Community Seismic Network (CSN) carried by the California Institute of Technology are the projects which have used low-cost MEMS accelerations sensors to detect earthquakes [14,15]. These projects also installed sensors on residential buildings across the California and around the world. Other countries such as Japan, Italy and Taiwan has also developed early warning systems using MEMS sensors, like the HSN (Home Seismometer Network) developed by JMA (Japan Meteorological Agency), the MEMS sensors network by the INGV (Intituto Nazionale di Geofisica e Vulcanologia) in Italy and the Palert system developed by NTU (National University Taiwan) [16,17,18]. All these systems implemented the fixed threshold-based strategy for detecting earthquakes. Further, these systems needed additional processing units to implement the detection software. However, our earthquake detection system uses a machine-learning technique on the client-side to detect earthquakes even using a cheap MEMS acceleration sensor.
Similar to our proposed work for sensor evaluation, some research efforts have also been made to evaluate the low-cost MEMS sensors [19]. Apart from the previously discussed literature, the advancement of data mining and deep learning has attracted the attention of seismologist and researchers, and they used it in a variety of ways, such as searching for seismological signals, mining previously undetected earthquakes in the seismology databases and locating earthquakes [20,21]. However, while, due to heavy computational load, these systems can only be applied on the server-side, our system detects earthquake on the client-side.
Our work is different from the previously discussed work in the sense that we combine different characteristics of the available research discussed above and develop a dedicated machine learning IoT-based sensor which can sense the seismic signals and perform the detection algorithm simultaneously. Even though we use the same MyShake features, the model is retrained using different datasets obtained from buildings. In addition, our model does not simply rely on one earthquake detection mechanism. Instead, we use both a machine-learning technique and a traditional STA/LTA algorithm to reduce the chance of false alarms. Moreover, because we do not use smartphones, the developed system’s cost is very low compared to existing systems such as QCN and MyShake. Finally, in this work, we first assess the different sensors using the recently occurred earthquake in South Korea, and then introduce a new system which is comprised of hardware and software.
3. Approach
In this section, we discuss our earthquake alert device. To develop the earthquake alert device, we first compare several acceleration sensors and then provide benchmark results to select an appropriate sensor used for detecting earthquakes as a stand-alone sensor. Then, the implementation details of the earthquake alert device including hardware and software systems will be provided.
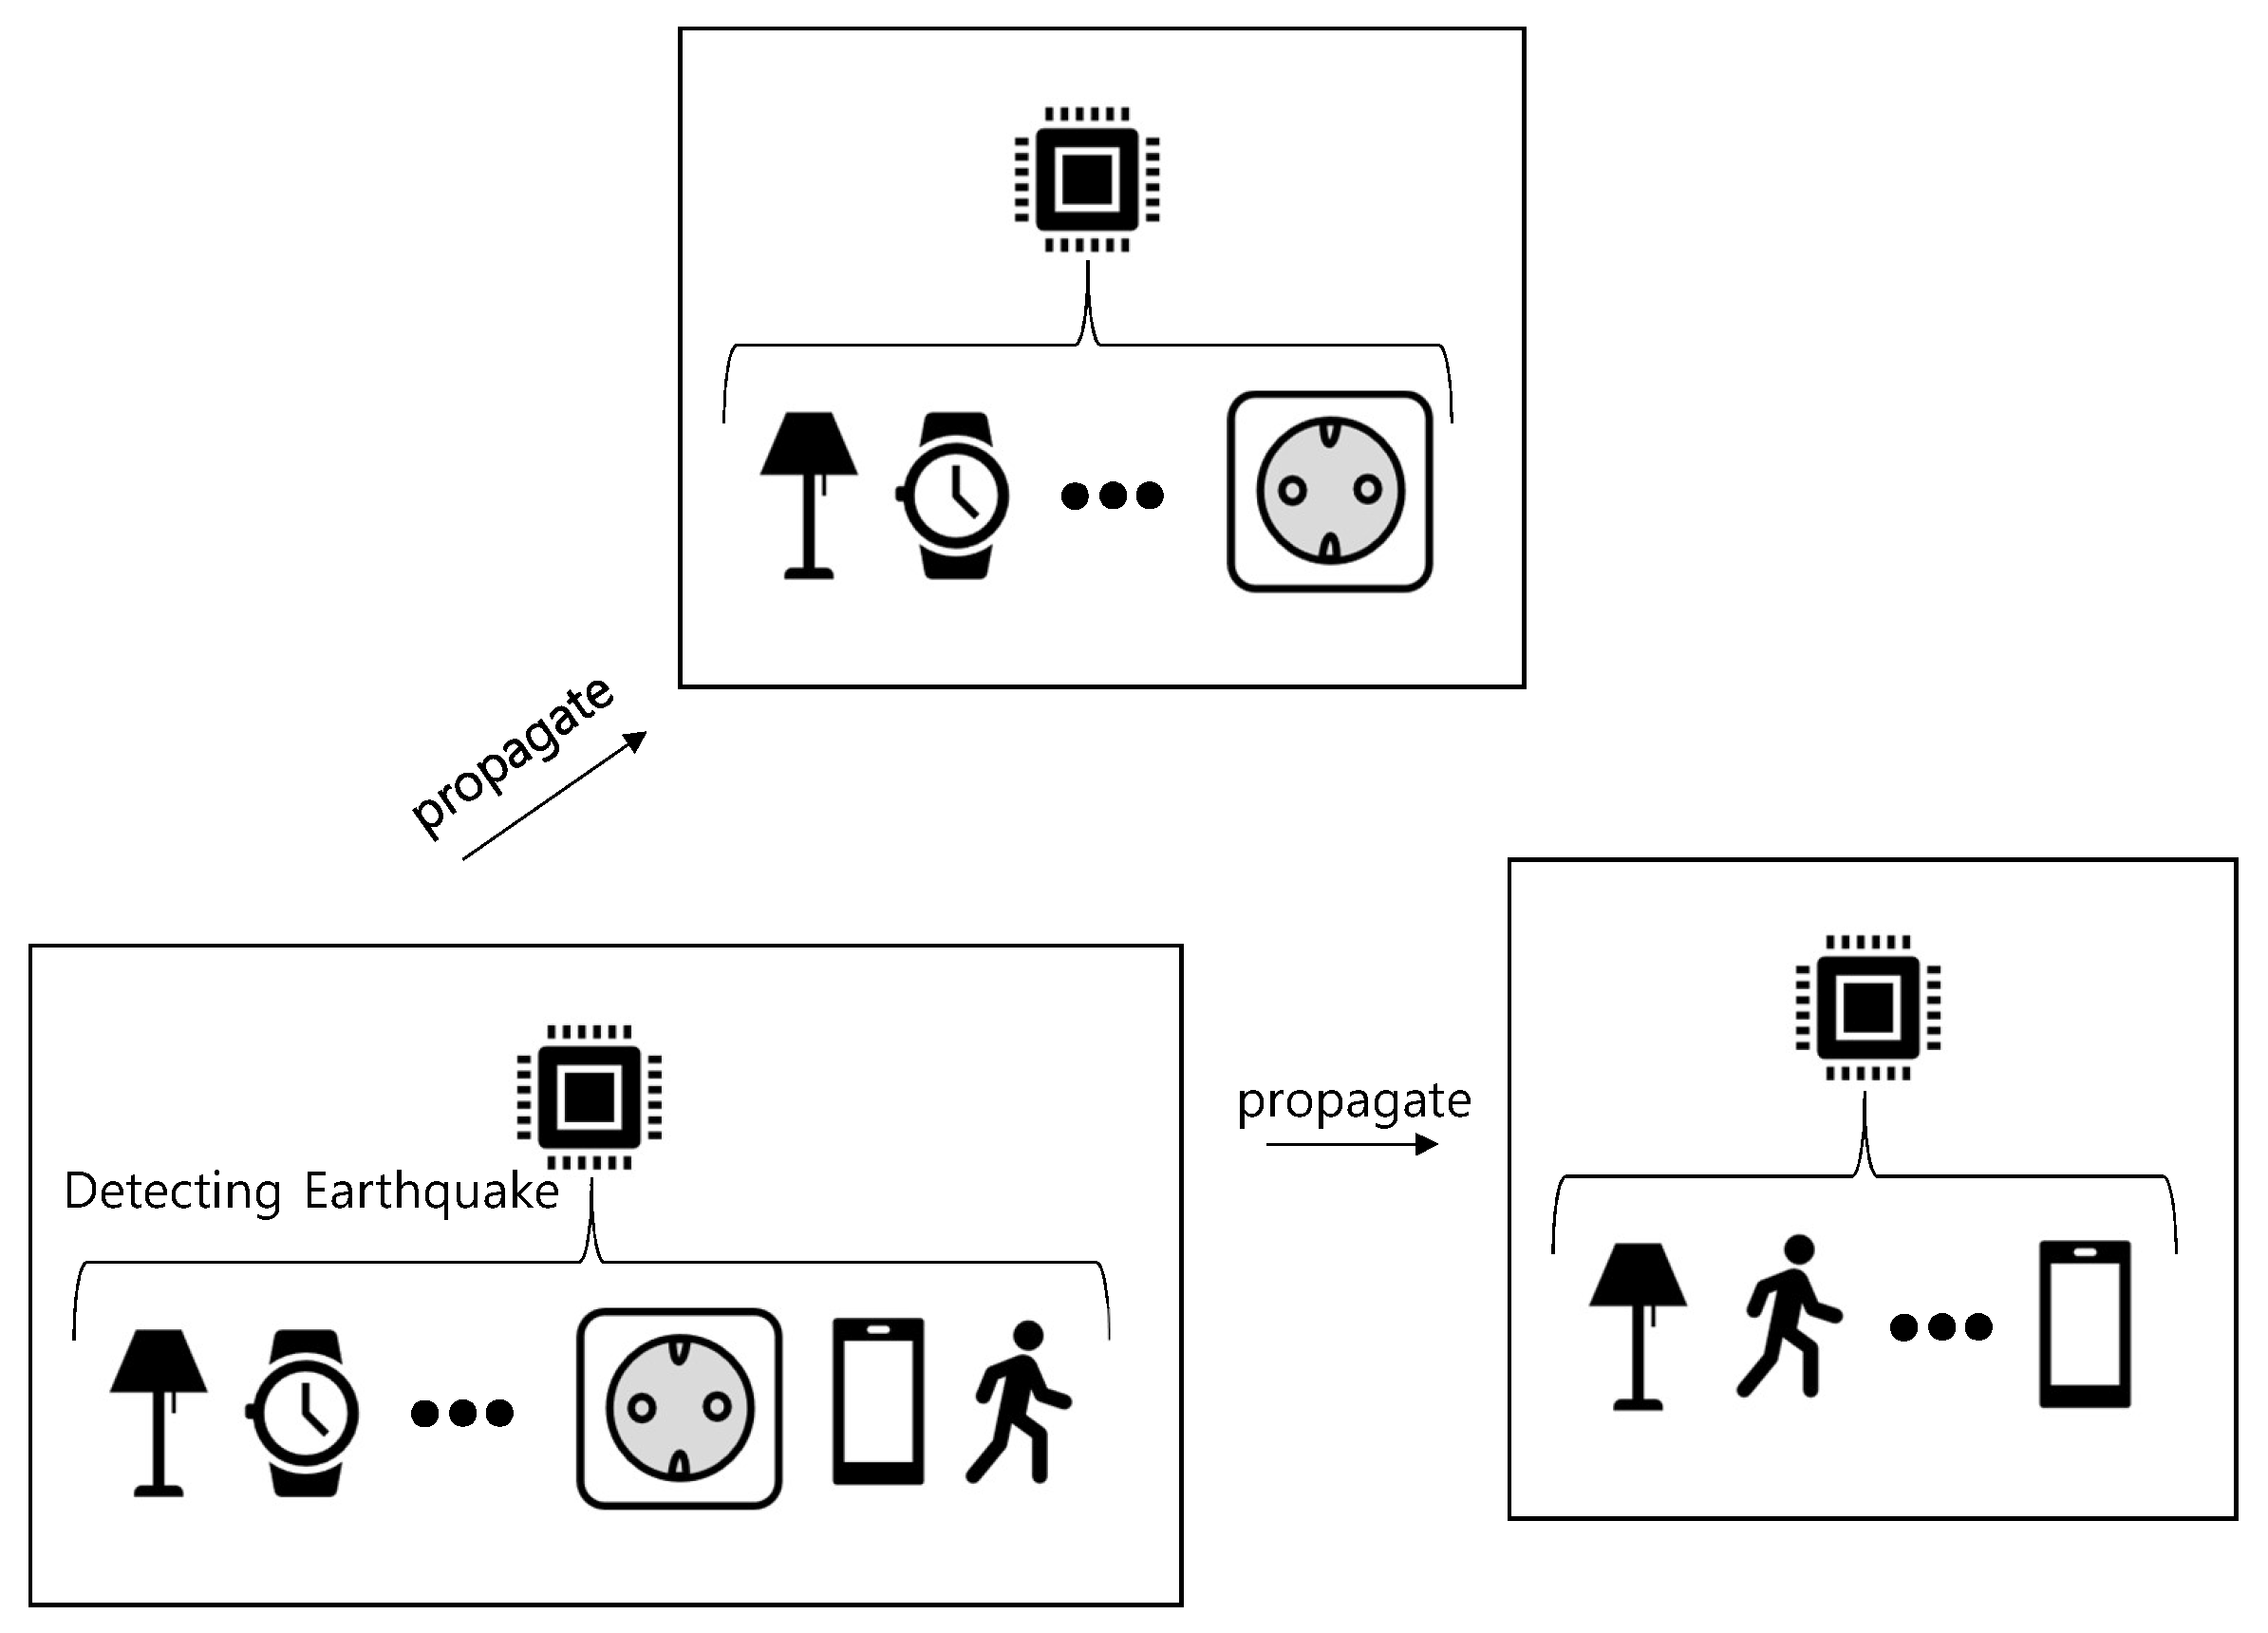
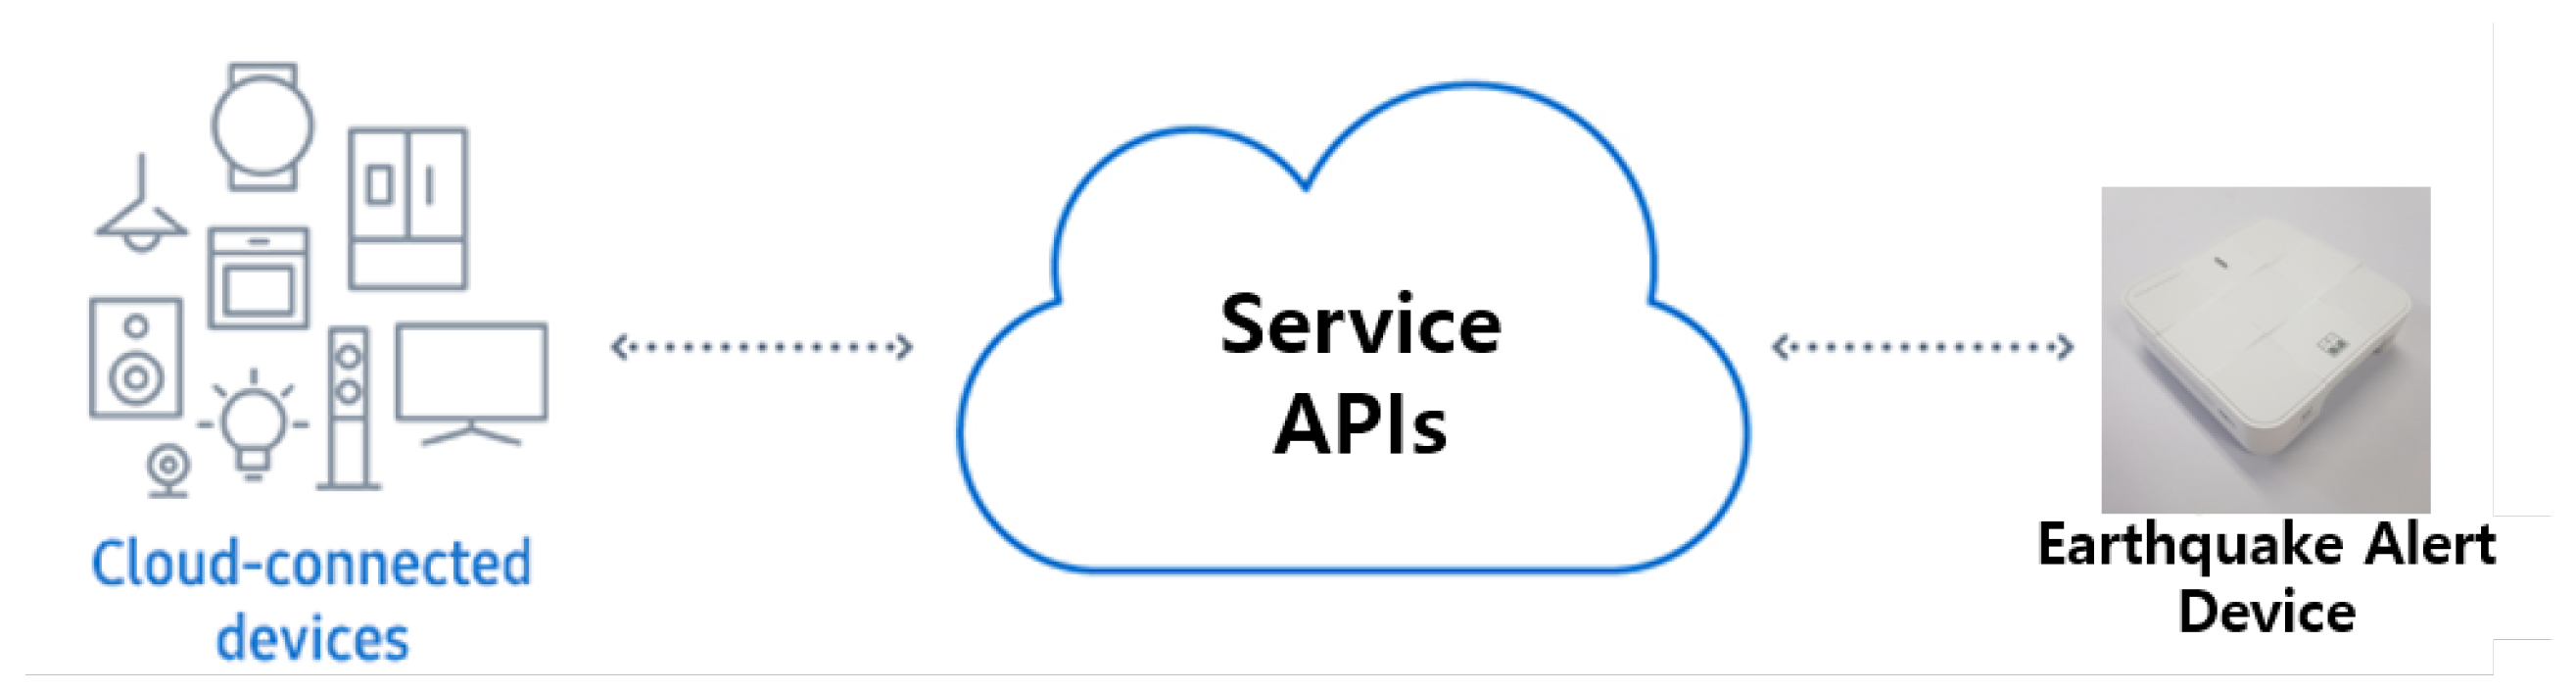
The overview of our proposed earthquake detection and response system is shown in Figure 1. Because the earthquake alert device operates as a stand-alone device, it does not collaborate with other earthquake alert devices or servers for further processing. However, we maintain a database server to preserve earthquake events.
3.1. Comparison of Acceleration Sensors
We need to select an appropriate acceleration sensor that meets the accuracy and reliability requirements. Quality sensors produce good results, because it is robust against noise. However, due to their costs, it is difficult to use it on large scale for earthquake detection. Therefore, there should be a trade-off between quality and cost. The specification of each sensor is discussed below.
An acceleration sensor captures motions more precisely when the noise level is low and the sensitivity is high. Based on this fact, we assessed four acceleration sensors ADXL355 [22], LIS3DHH [23], MPU9250 [24], and MMA8452 [25] by examining their specifications. Table 1 summarizes the test and assessment criteria (parameters) of the four sensors: Noise is the noise floor of each device; Sensitivity is the impact of least significant bit change; Data output is related to sensitivity because it is the output resolution; and Max. Output is the output data rate per second.
For the accurate detection of earthquakes using acceleration sensors, both noise and sensitivity levels are the most critical aspects. As a result, according to the specifications given in Table 1, ADXL355 is the best sensor as the noise level is low and the sensitivity level is high between all four sensors. LIS3DHH is the second best in the list. Although its sensitivity is not higher than MPU9250, the noise level is very lower than MPU9250. Both ADXL355 and LIS3DHH assessment criteria are better than other two sensors. Because our target is to develop an IoT-based earthquake detection device, we need to select an appropriate acceleration sensor that meets the accuracy and cost requirements. Therefore, based on the specifications, we select LIS3DHH as a seismic sensor, because its accuracy is higher than compared to MPU9250 and MMA8452, and the cost is relatively low (about $10/chip) compared to ADXL355 (about $50/chip). In the following discussion, we evaluate these sensors by assessing their noise levels which is the most critical aspect to detect earthquakes.
3.2. An Assessment of Acceleration Sensors
To see how each sensor can correctly detect earthquakes, we evaluate the sensors’ quality through a simple benchmark. In order to detect earthquakes using an MEMS acceleration sensor, one important ability is to reliably collect data for the given time period (e.g., one or two seconds). We first assess each sensor’s ability to maintain a steady sampling rate around 100Hz (i.e., 100 samples per second). Although the sampling rates between sensors vary, most sensors remain stable over time, yielding highly reliable sampling rate. Thus, we skip the detailed experimental results in this article. In the following discussion, we systematically evaluate the four acceleration sensors to determine which sensor is the most suitable to detect earthquakes considering earthquake detection abilities as well as their prices.
Noise Test
When detecting earthquakes using an acceleration sensor, the most important specification of an acceleration sensor for earthquake detection is noise level, which determines the minimum movement a sensor can detect. Table 1 shows the specifications provided by sensor manufacturers. By specifications, the acceleration sensors compared in this work have noise density levels between 25 g/ and 300 g/. Considering only the noise level, ADXL355 and LIS3DHH outperform the other sensors.
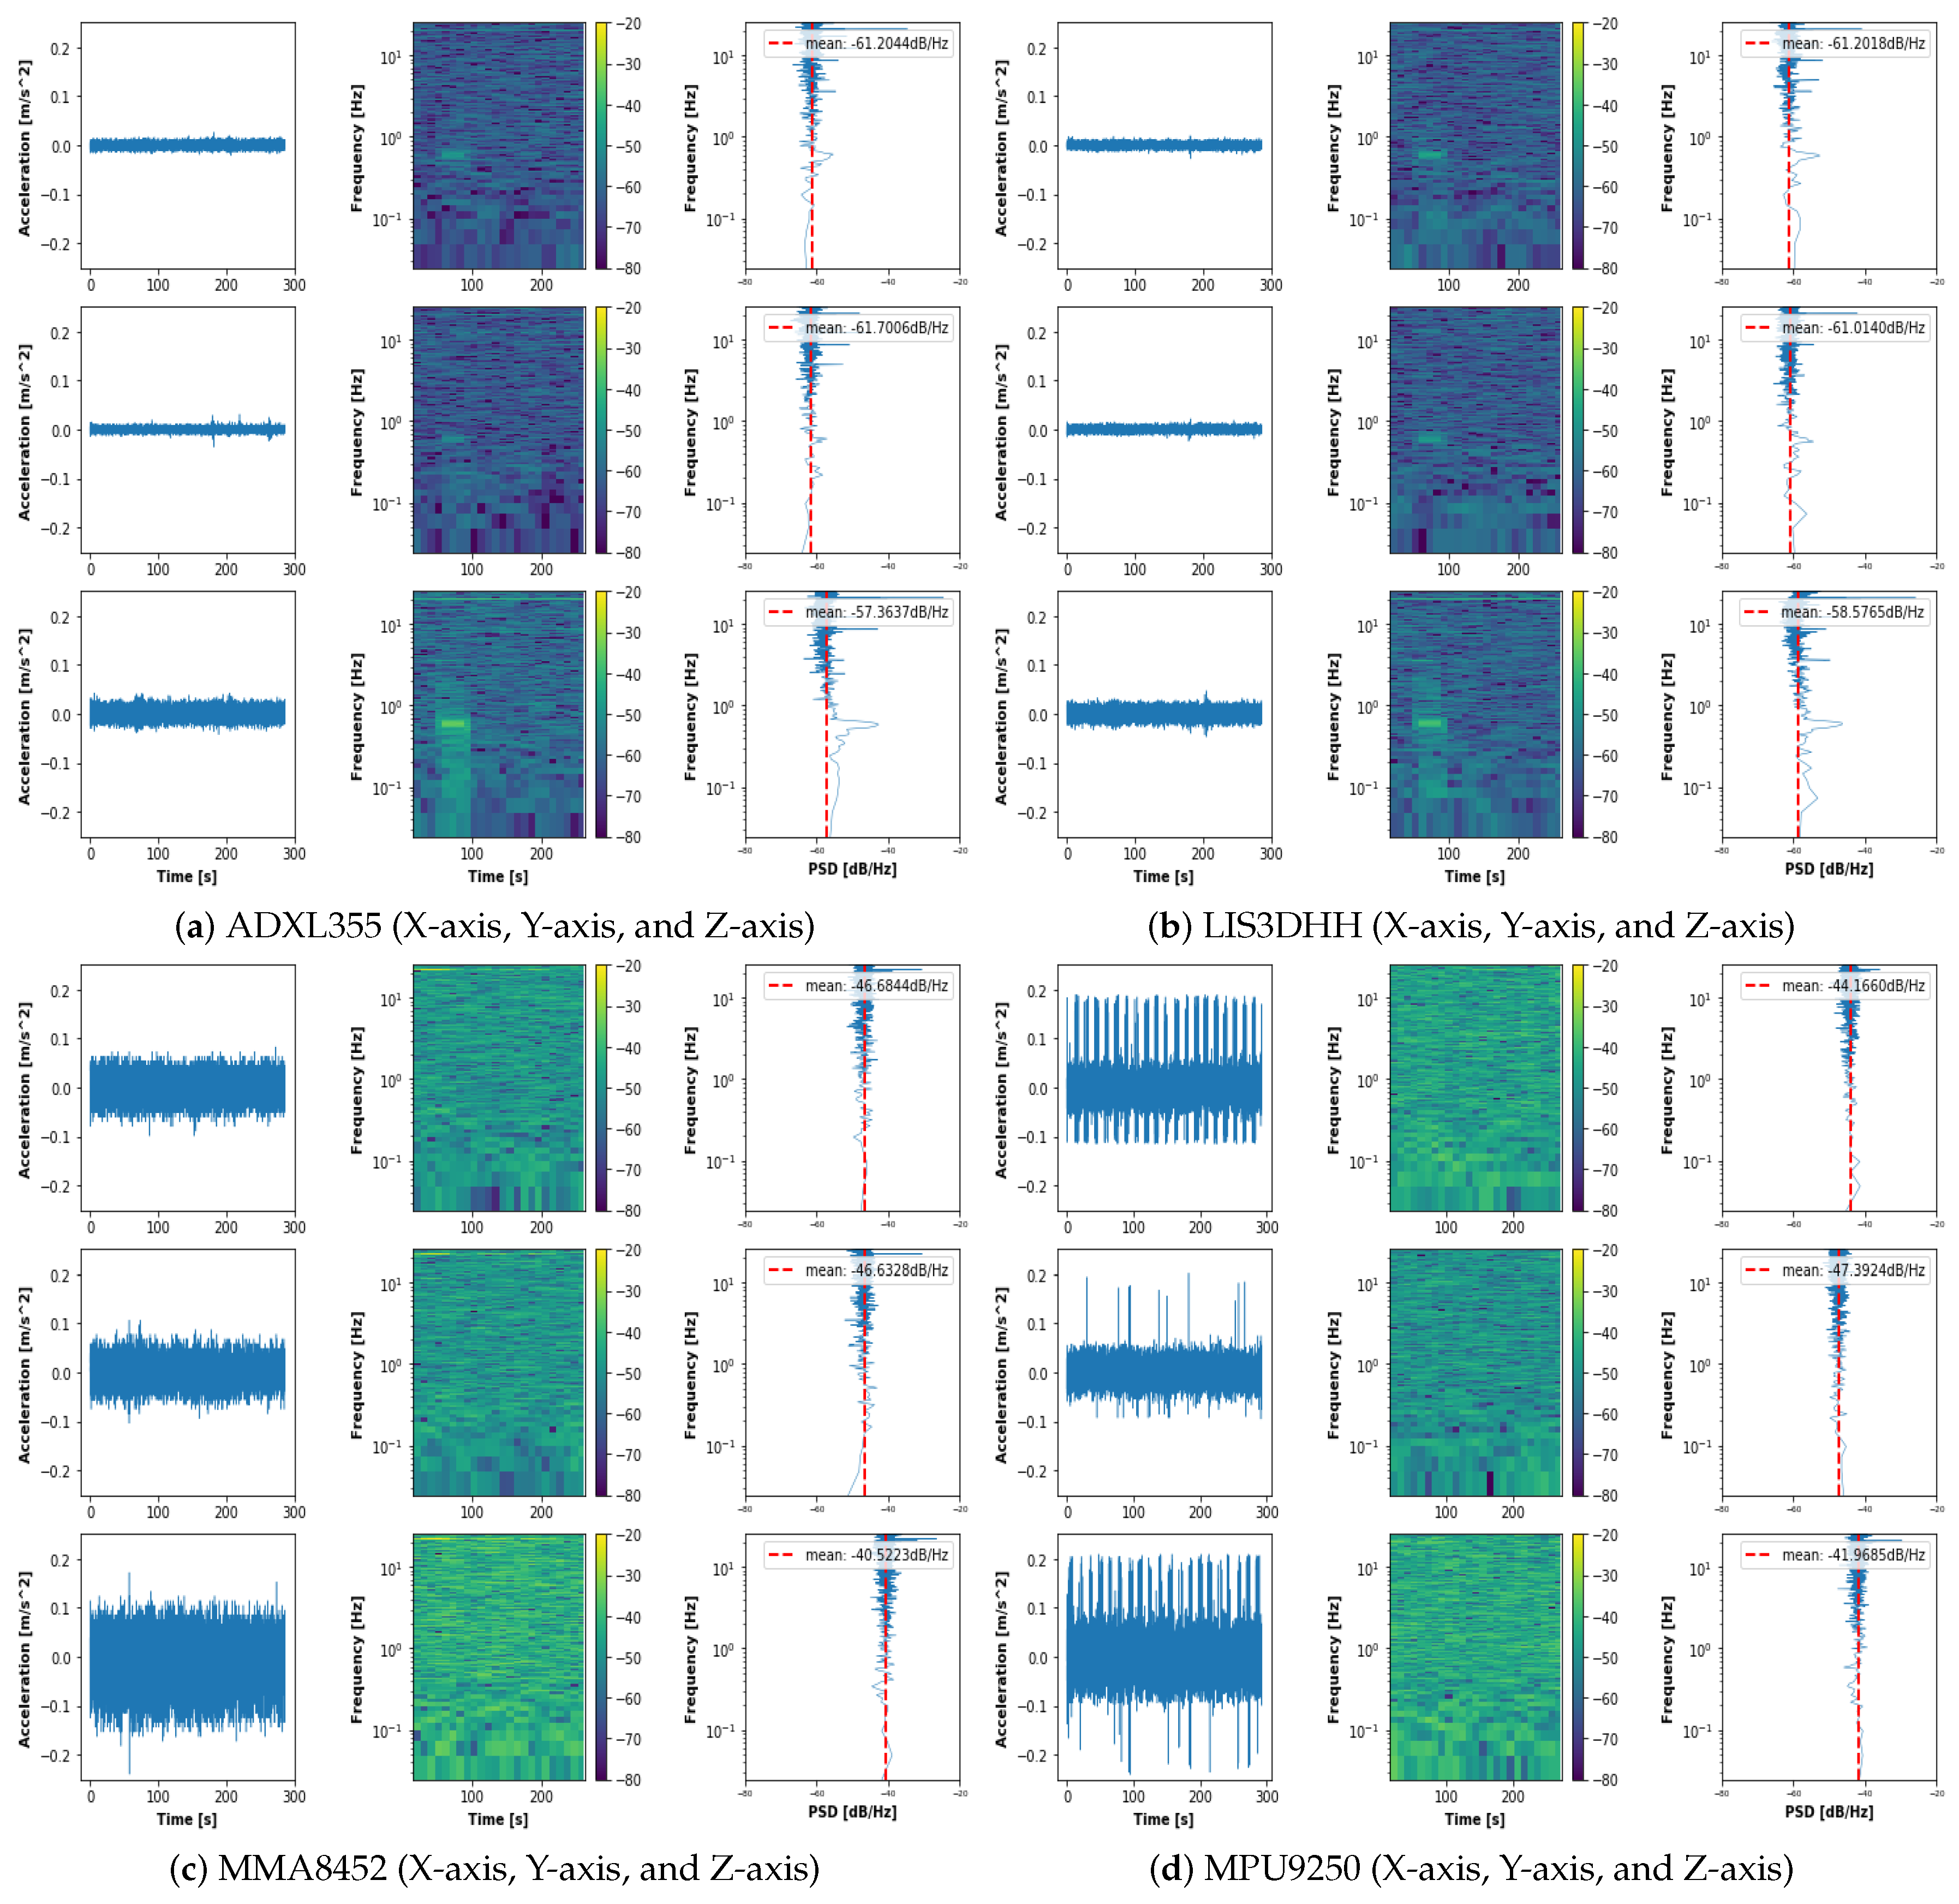
For the detailed analysis, we compare noise floor levels among four different sensors by placing them on a flat, stable floor and then recording acceleration data for 300 s. Figure 2 shows the 300 s of semi-log plot of the three components of four acceleration sensors. From left to right, we show raw acceleration, spectrogram, and PSD (i.e., Power Spectral Density) with mean value. In the spectrogram analysis, we can group ADXL355 and LIS3DHH into a high-quality sensor group and MMA8452 and MPU9250 into a low-quality sensor group according to their spectrogram patterns. In addition, MMA8452 and MPU9250 are more vulnerable to noises in all the three components as compared to ADXL355 and LIS3DHH which are less noisy by comparing their PSD values. Lastly, we observe that the Z component tends to be less accurate than X and Y components. By concluding the noise test, we can order the sensors in accordance with their noise levels (i.e., PSD) as follows: LIS3DHH, ADXL355, MPU9250, and MMA8452. As a result, when considering both accuracy and price, LIS3DHH is the most suitable for our purpose.
3.3. Development of the Earthquake Alert Device
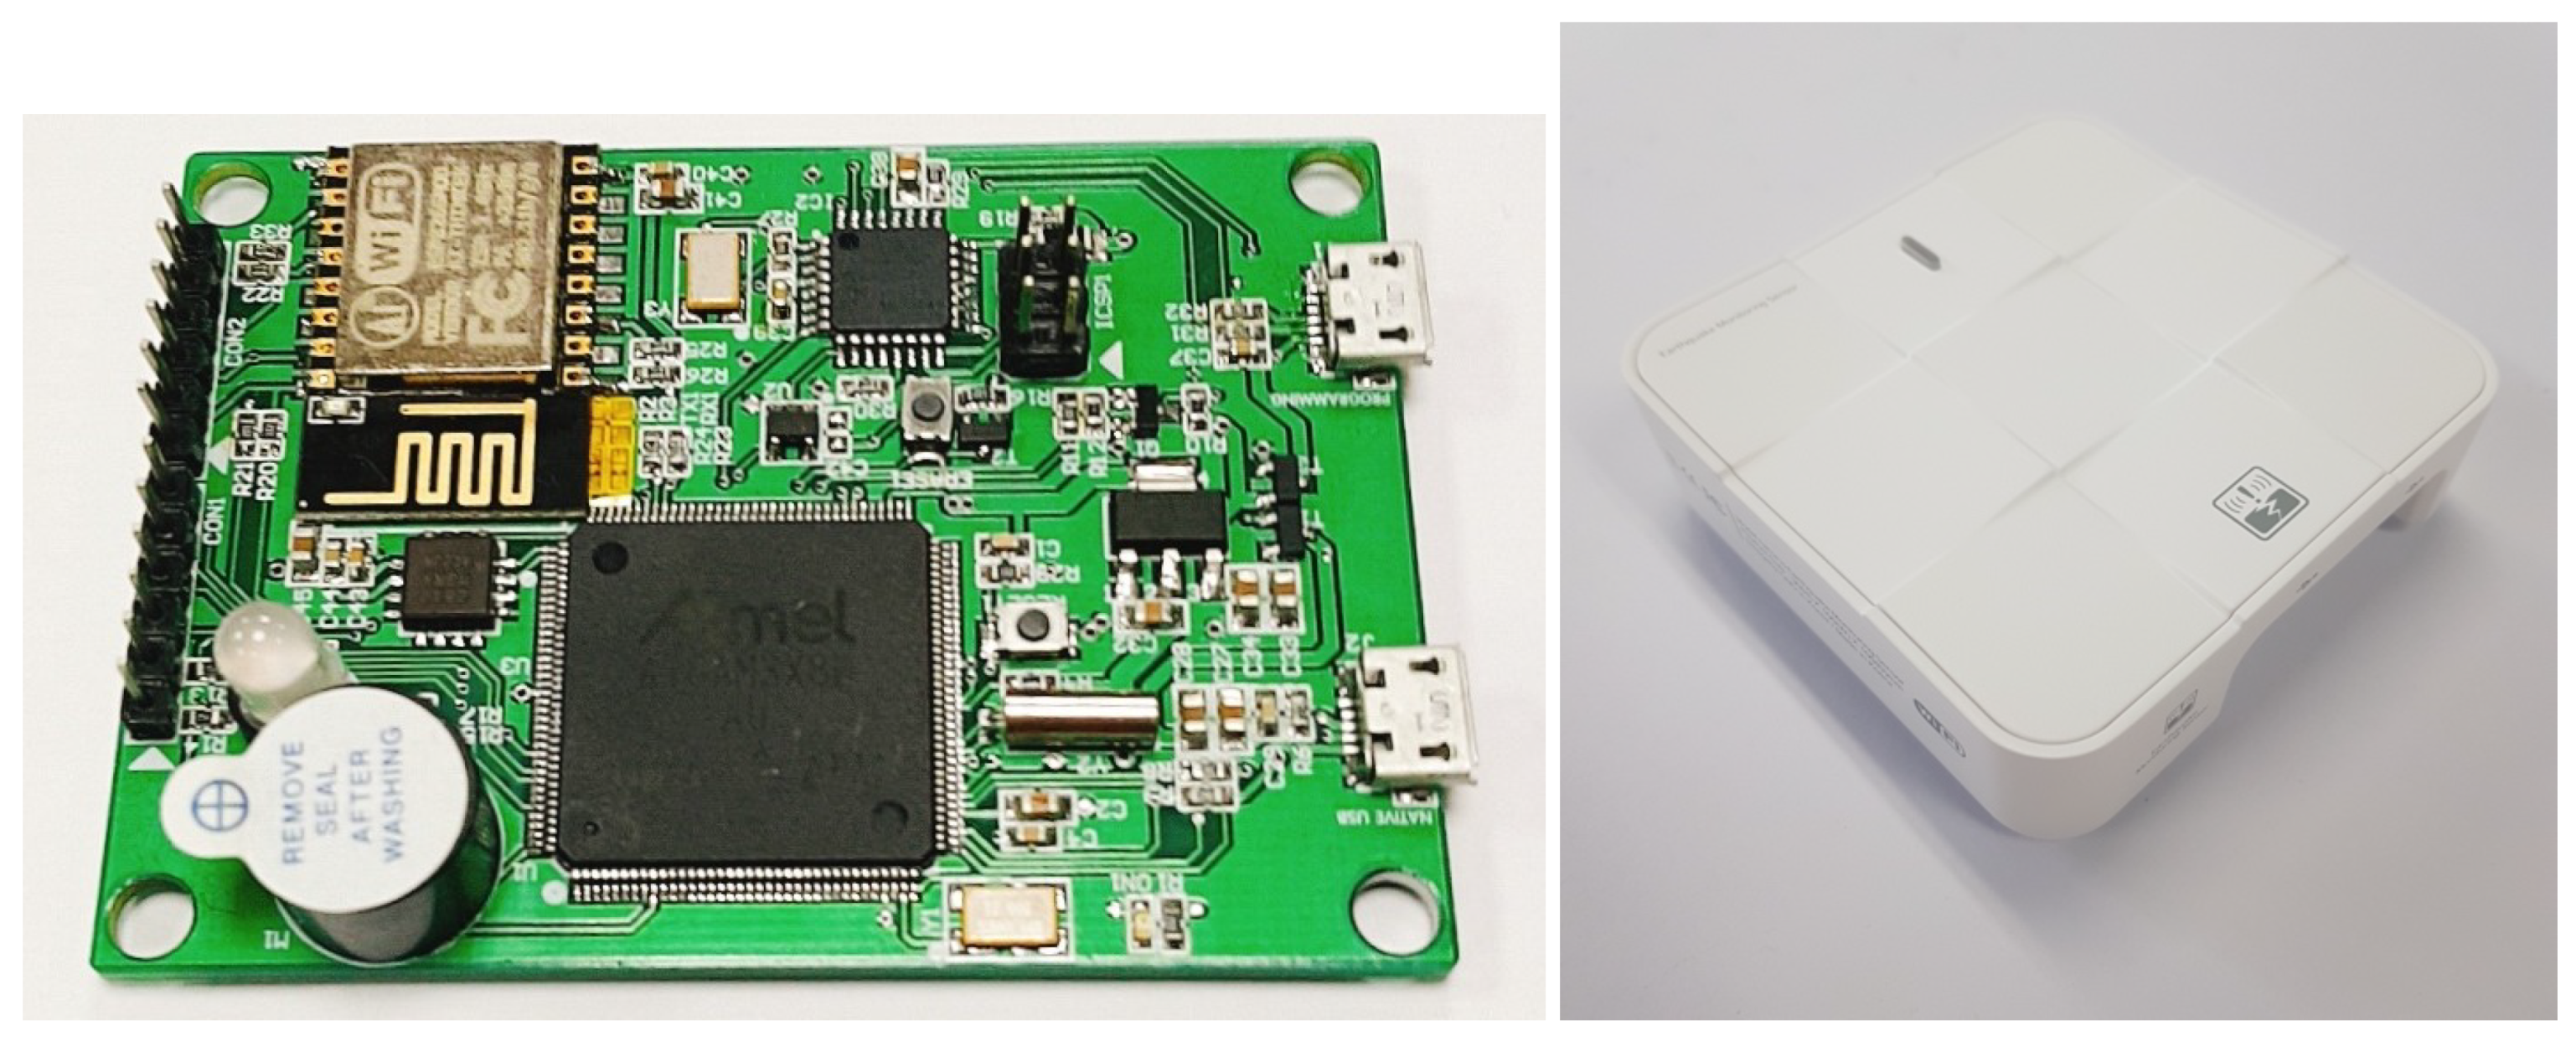
Through the noise test, we decide to use LIS3DHH to monitor movements. Next, we detail the design and development of the earthquake alert device that uses the selected acceleration sensor. The developed system consists of a 32bit processor (ARM Cortex-M3), a Wi-Fi, a bluetooth, a buzzer, a LED light, etc. Figure 3 shows the internal hardware system and the external case of the developed system.
To detect earthquakes, we use a machine-learning algorithm that requires least computational power and memory space to store acceleration data, extract features from seismic signals, and process a neural network for classifying signals into earthquakes and non-earthquakes. These computational and memory requirements are not a big consideration in the smartphone environment (i.e., MyShake), but in the resource constrained environment such as Internet of Things devices, these requirements should be dealt with carefully. To that end, in this work, as a main computational resource, we use ARM Cortex M3 whose specifications are described in Table 2. ARM Cortex M3 has been widely used in developments of various IoT devices for the last several years because of its price and development support from the manufacturer. Also, the ARM Cortex M3 is fully compatible with other hardware devices such as the acceleration sensor, bluetooth, Wi-Fi, etc.
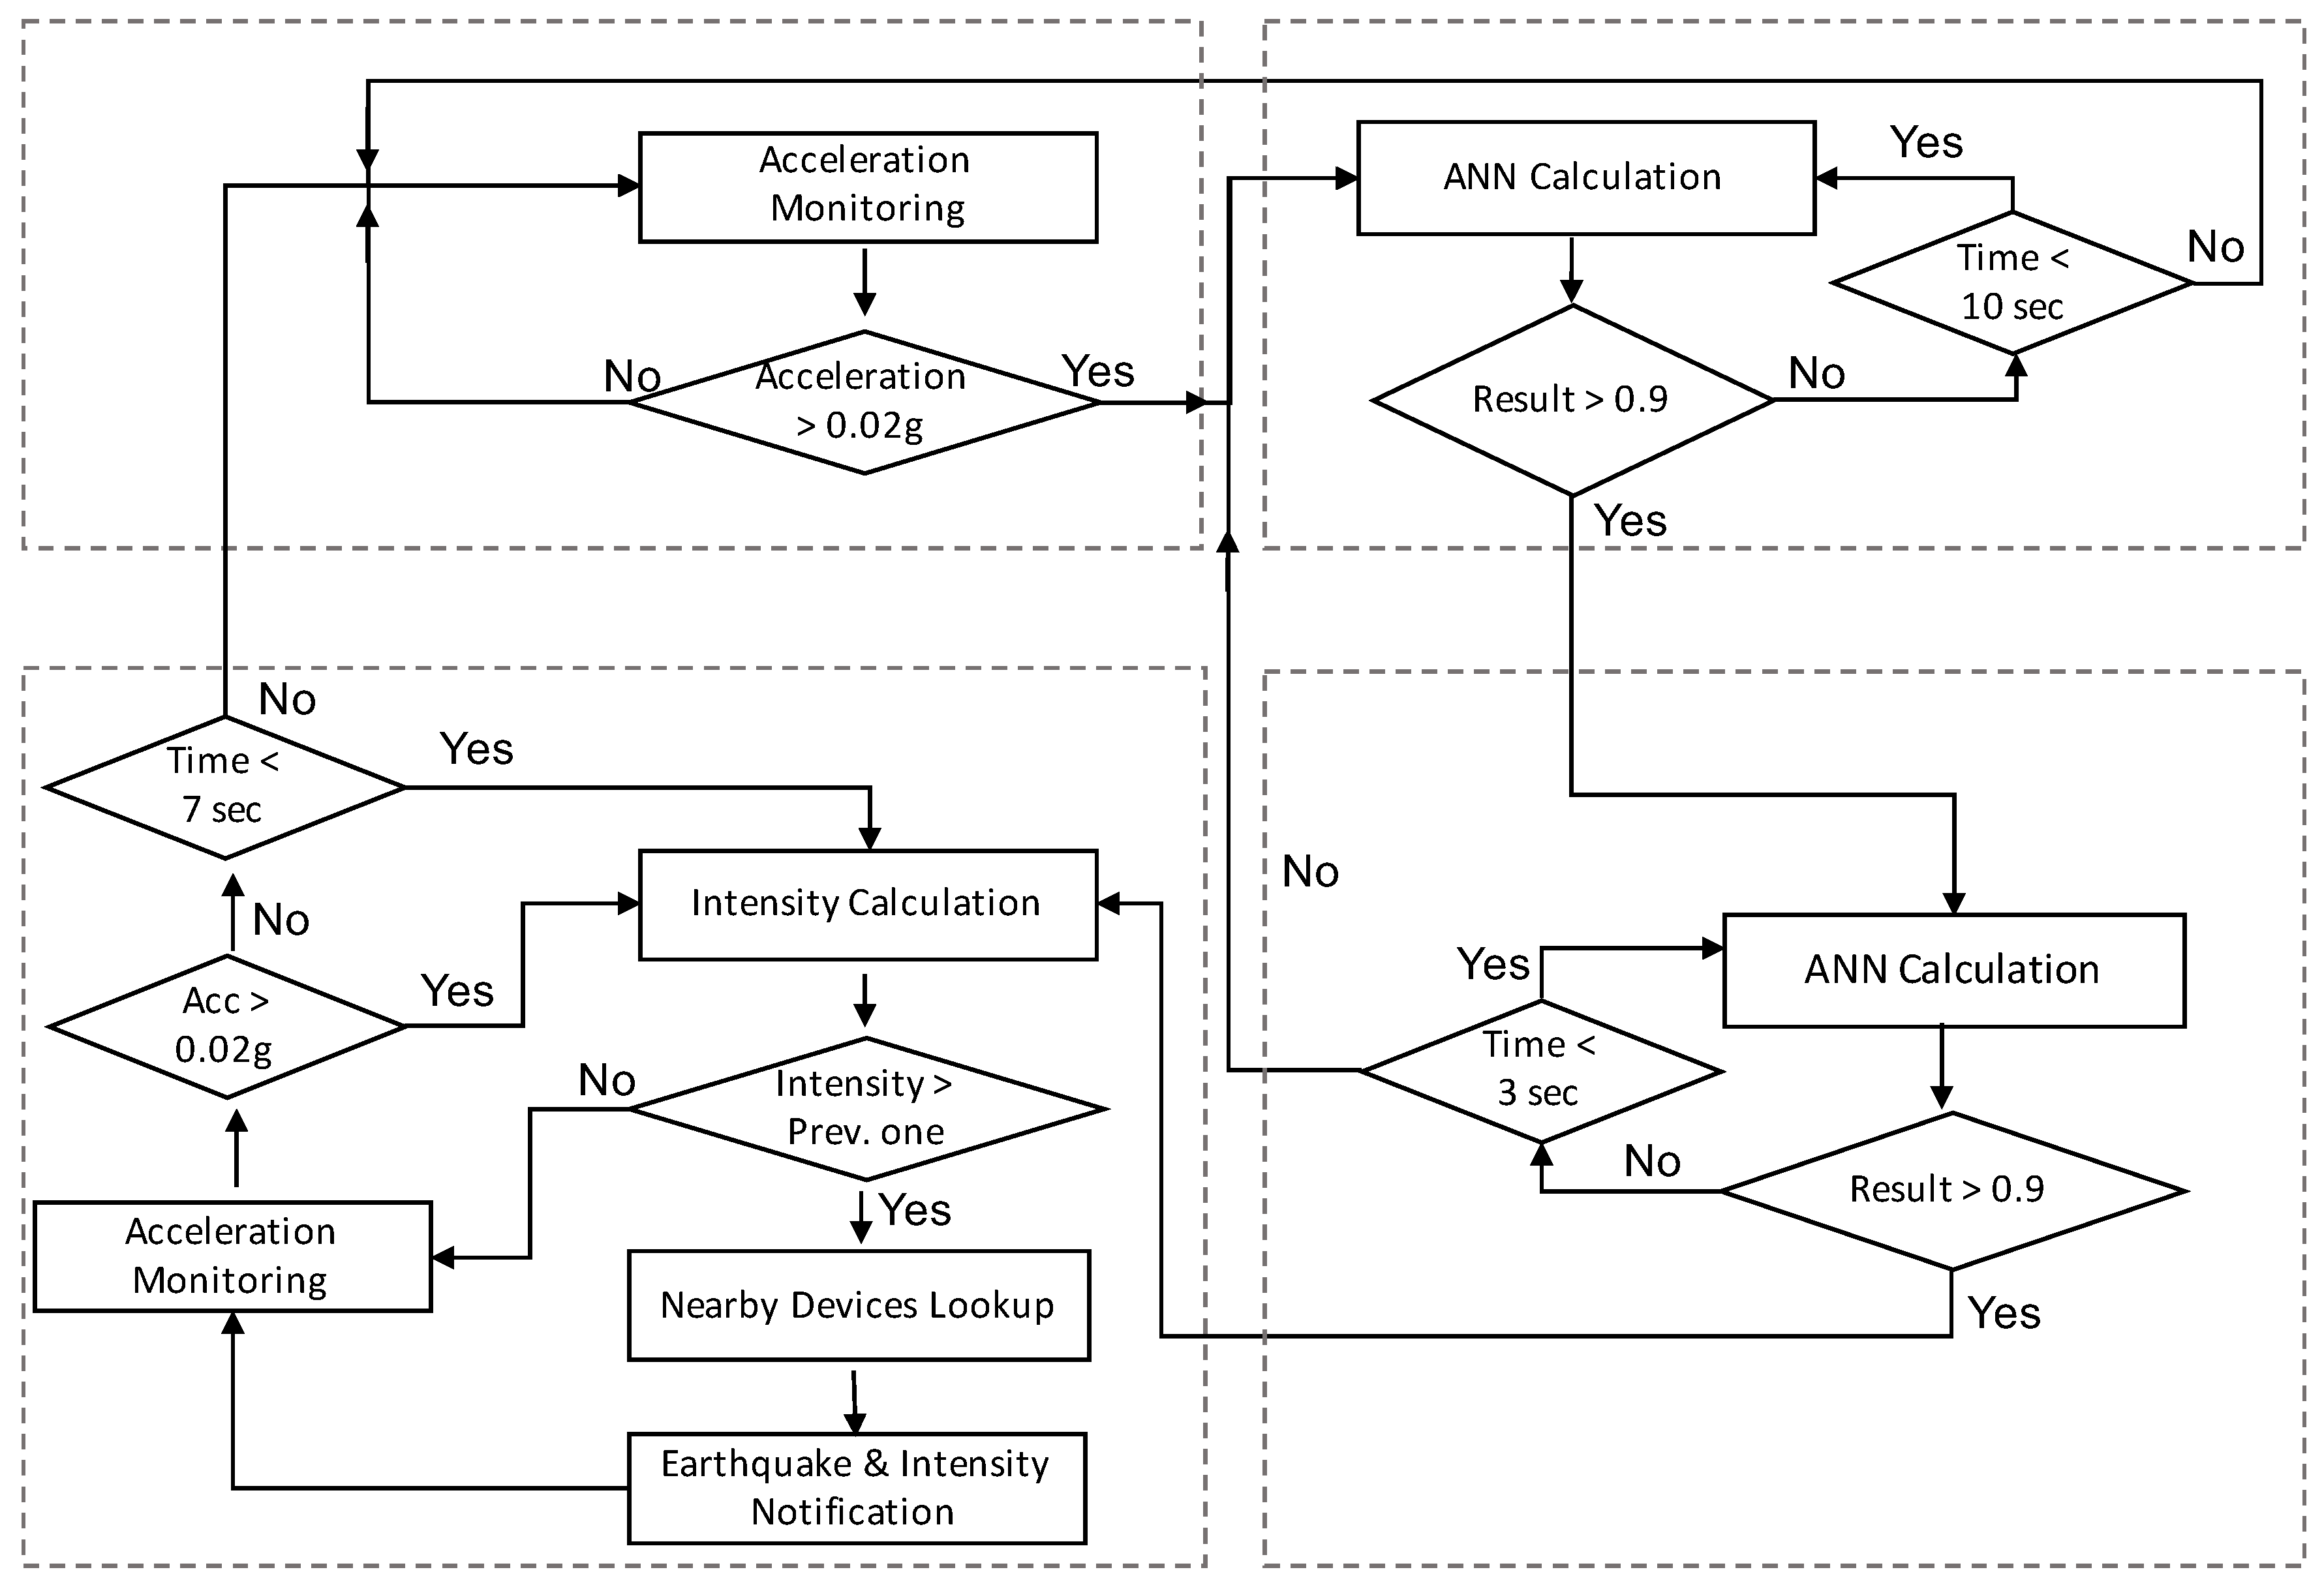
The software system of the developed earthquake detection device plays a key role in detecting earthquakes and sending an alarm message to nearby smart devices such as a smartphone, a smart watch, an AI speaker, home automation devices, etc. To that end, the system takes the acceleration data as an input and runs an earthquake detection algorithm when observing motions above a certain level of acceleration (i.e., 0.02 g). Because the detected signal might be an earthquake or a false alarm, the detection algorithm (i.e., ANN Calculation) classifies the input signal with a two-second window into an earthquake or a non-earthquake. If the result of the earthquake detection algorithm exceeds a threshold (i.e., 95% similarity score) during 10 s, the algorithm goes into the second phase of earthquake detection, where the detection algorithm examines the next three seconds of acceleration data and confirms it as an earthquake. To reduce the chance of false alarms, we employ a two-phase earthquake detection algorithm.
Then, the earthquake detection device sends out a warning message to nearby devices through Bluetooth Low Energy (BLE) with a shaking level (i.e., intensity level) by converging the measured peak ground acceleration (PGA) value into three shaking levels as described in Table 3. At the same time, the device warns nearby users using an internal buzzer and LED light. The flow chart of the earthquake detection algorithm is given in Figure 4.
Earthquake Detection Algorithm
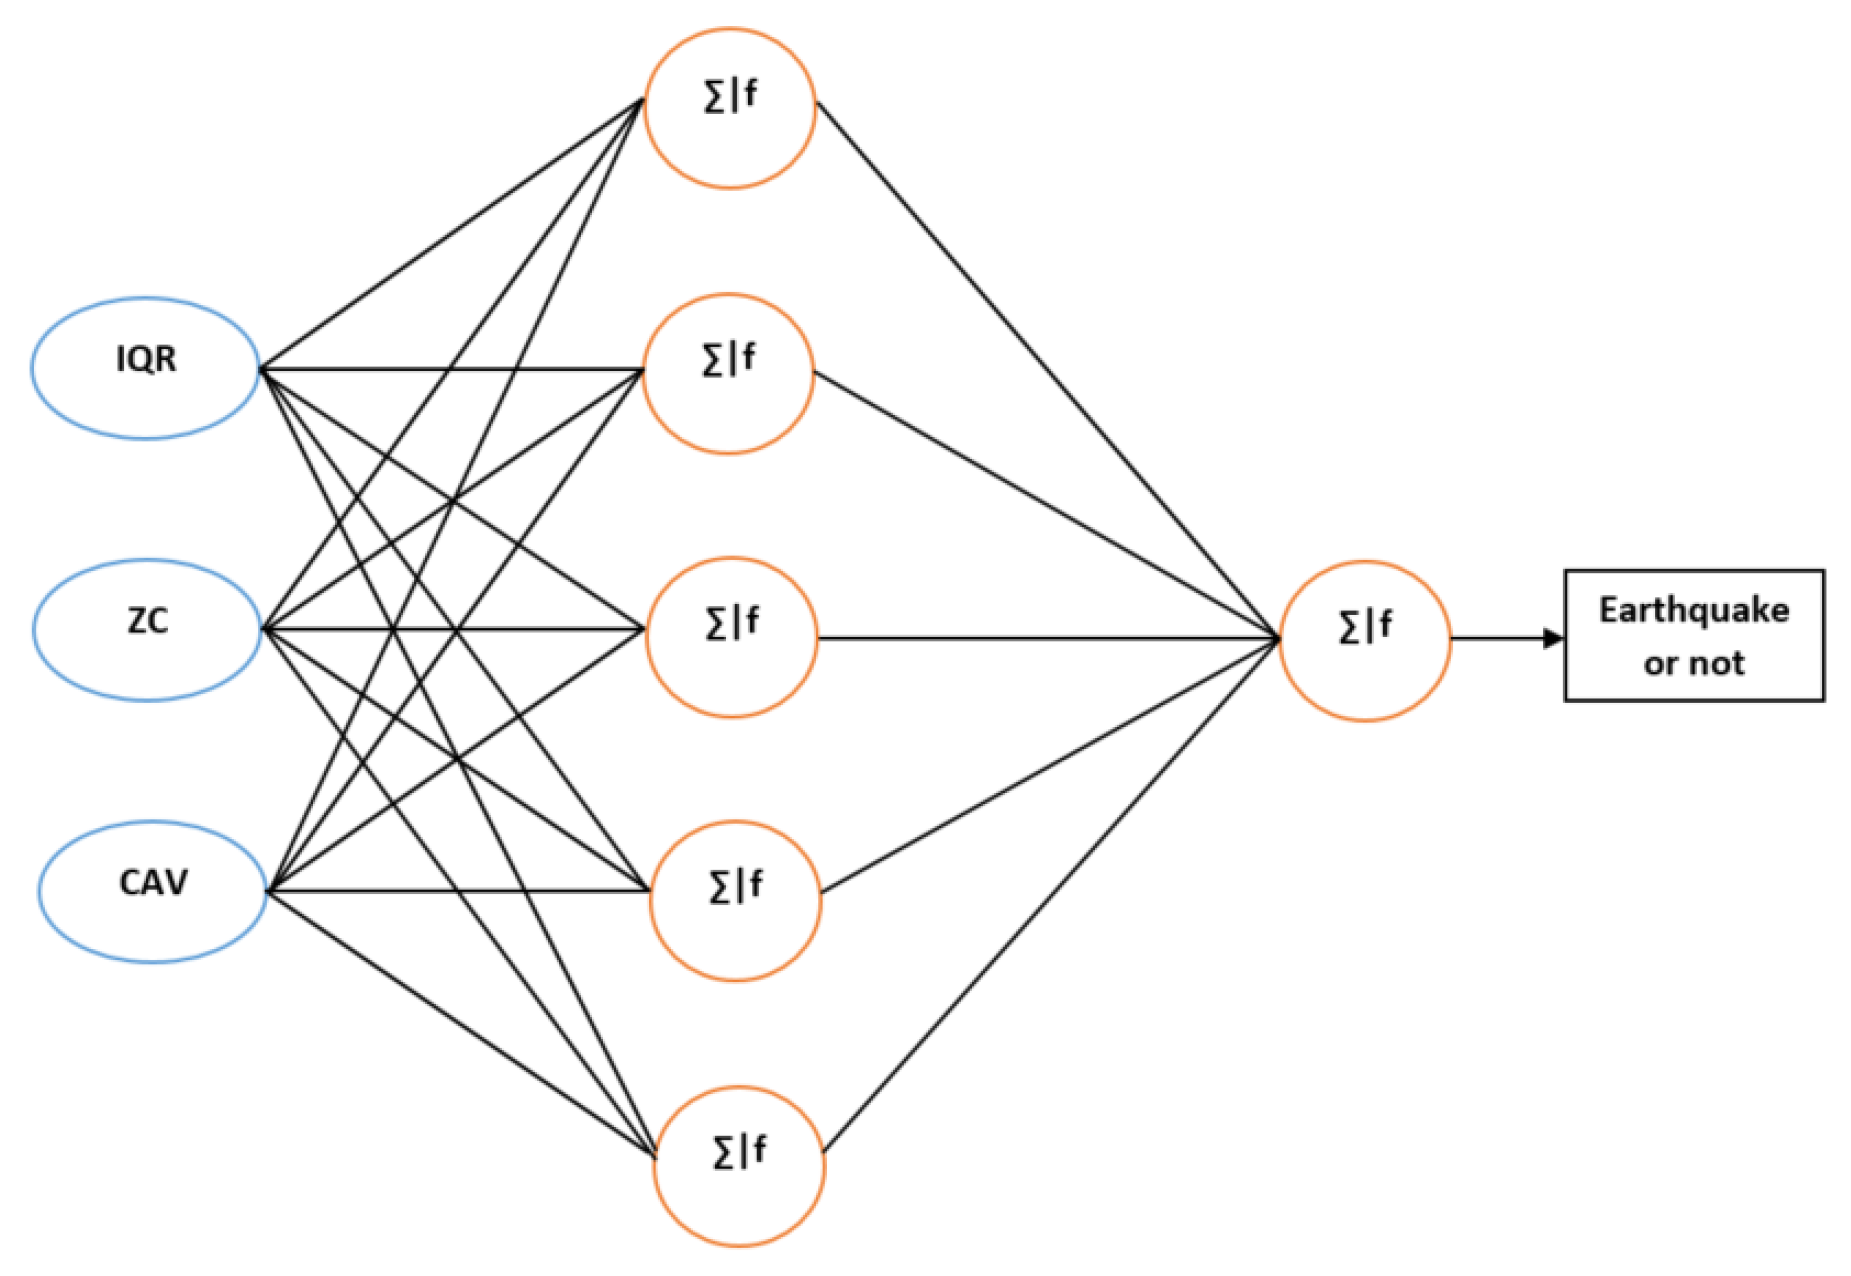
In the following discussion, we detail the earthquake detection algorithm using an artificial neural network (Artificial Neural Network) [26], a simple machine learning technique that has been widely used for the last several decades. The ANN model has three neurons in the input layer, five neurons in the hidden layer, and one neuron in the output layer, as shown in Figure 5.
The detection algorithm consists of four phases including feature extraction, pre-processing, training and testing of a machine learning model. To train the model, we use a backpropagation neural network with a stochastic gradient descent solver [27,28,29]. For the hidden layer and output layer, the inputs from the previous layer to each node are first summed and then fed into an activation function. The logistic sigmoid function is used as the activation function in the model, which is defined on input x as; .
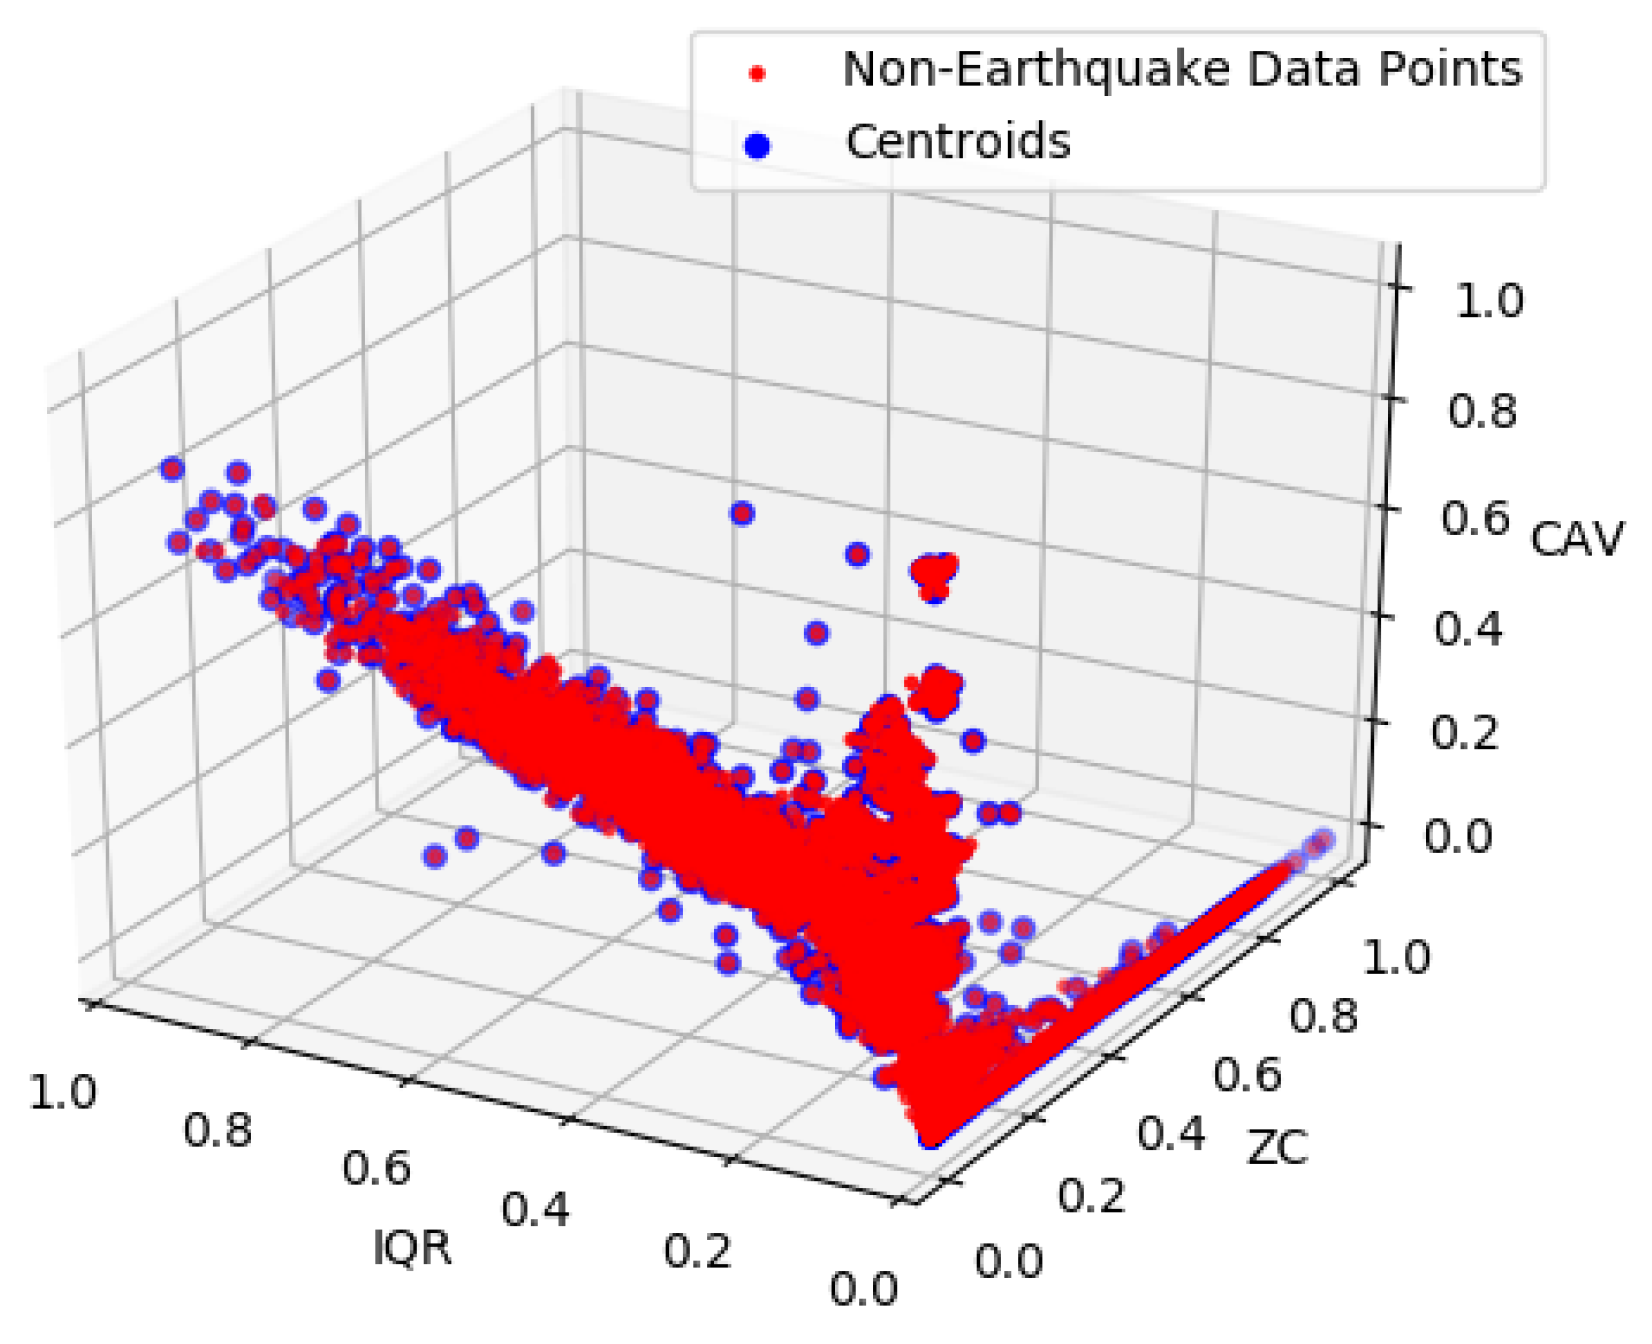
Machine learning algorithms usually require discriminating features that can be extracted from a large datasets. The extracted features represent specific characteristics of the given dataset. To detect earthquakes, we first use three features including inter-quartile range (IQR), zero crossing rate (ZC), and cumulative absolute velocity (CAV) which are used in MyShake [10]. IQR is the amplitude between 25% and 75% of the acceleration vector sum. ZC is a frequency measure, which indicates the number of time that the signal changes its sign. CAV is a cumulative measure of amplitude of the vector sum of three component acceleration. We use 2 s of a sliding window with 1 s overlap window on the acceleration data to calculate these three features.
Because the performance of the machine learning model is heavily dependent on the dataset used for training and testing, data need to be pre-processed before training the model. To that end, our pre-processing steps involve balancing and scaling the dataset. Because in the training phase, we use both earthquake data and non-earthquake data, which have different data sizes, balancing the dataset between earthquake data and non-earthquake data is required. To balance the dataset, we use the K-mean clustering algorithm [30]. When m is the total number of earthquake data samples, we group the non-earthquake data points into m clusters. The centroid of each cluster is considered as a non-earthquake sample. This leads to balanced data and reduction in the computational load in training of the model. The second pre-processing step used in the proposed work is feature scaling, to normalize the dataset and speed up the training of the model and improve its prediction performance. We scaled all features to the range from 0 to 1, where feature x is scaled as follows; where and are the minimum and maximum value of x.
3.4. Use Cases
The developed earthquake alert device can send out a warning message to nearby devices such as a smartphone, a smart watch, an AI speaker, home automation devices, using Bluetooth or Wi-Fi. To realize this scenario, we developed three use cases as follows:
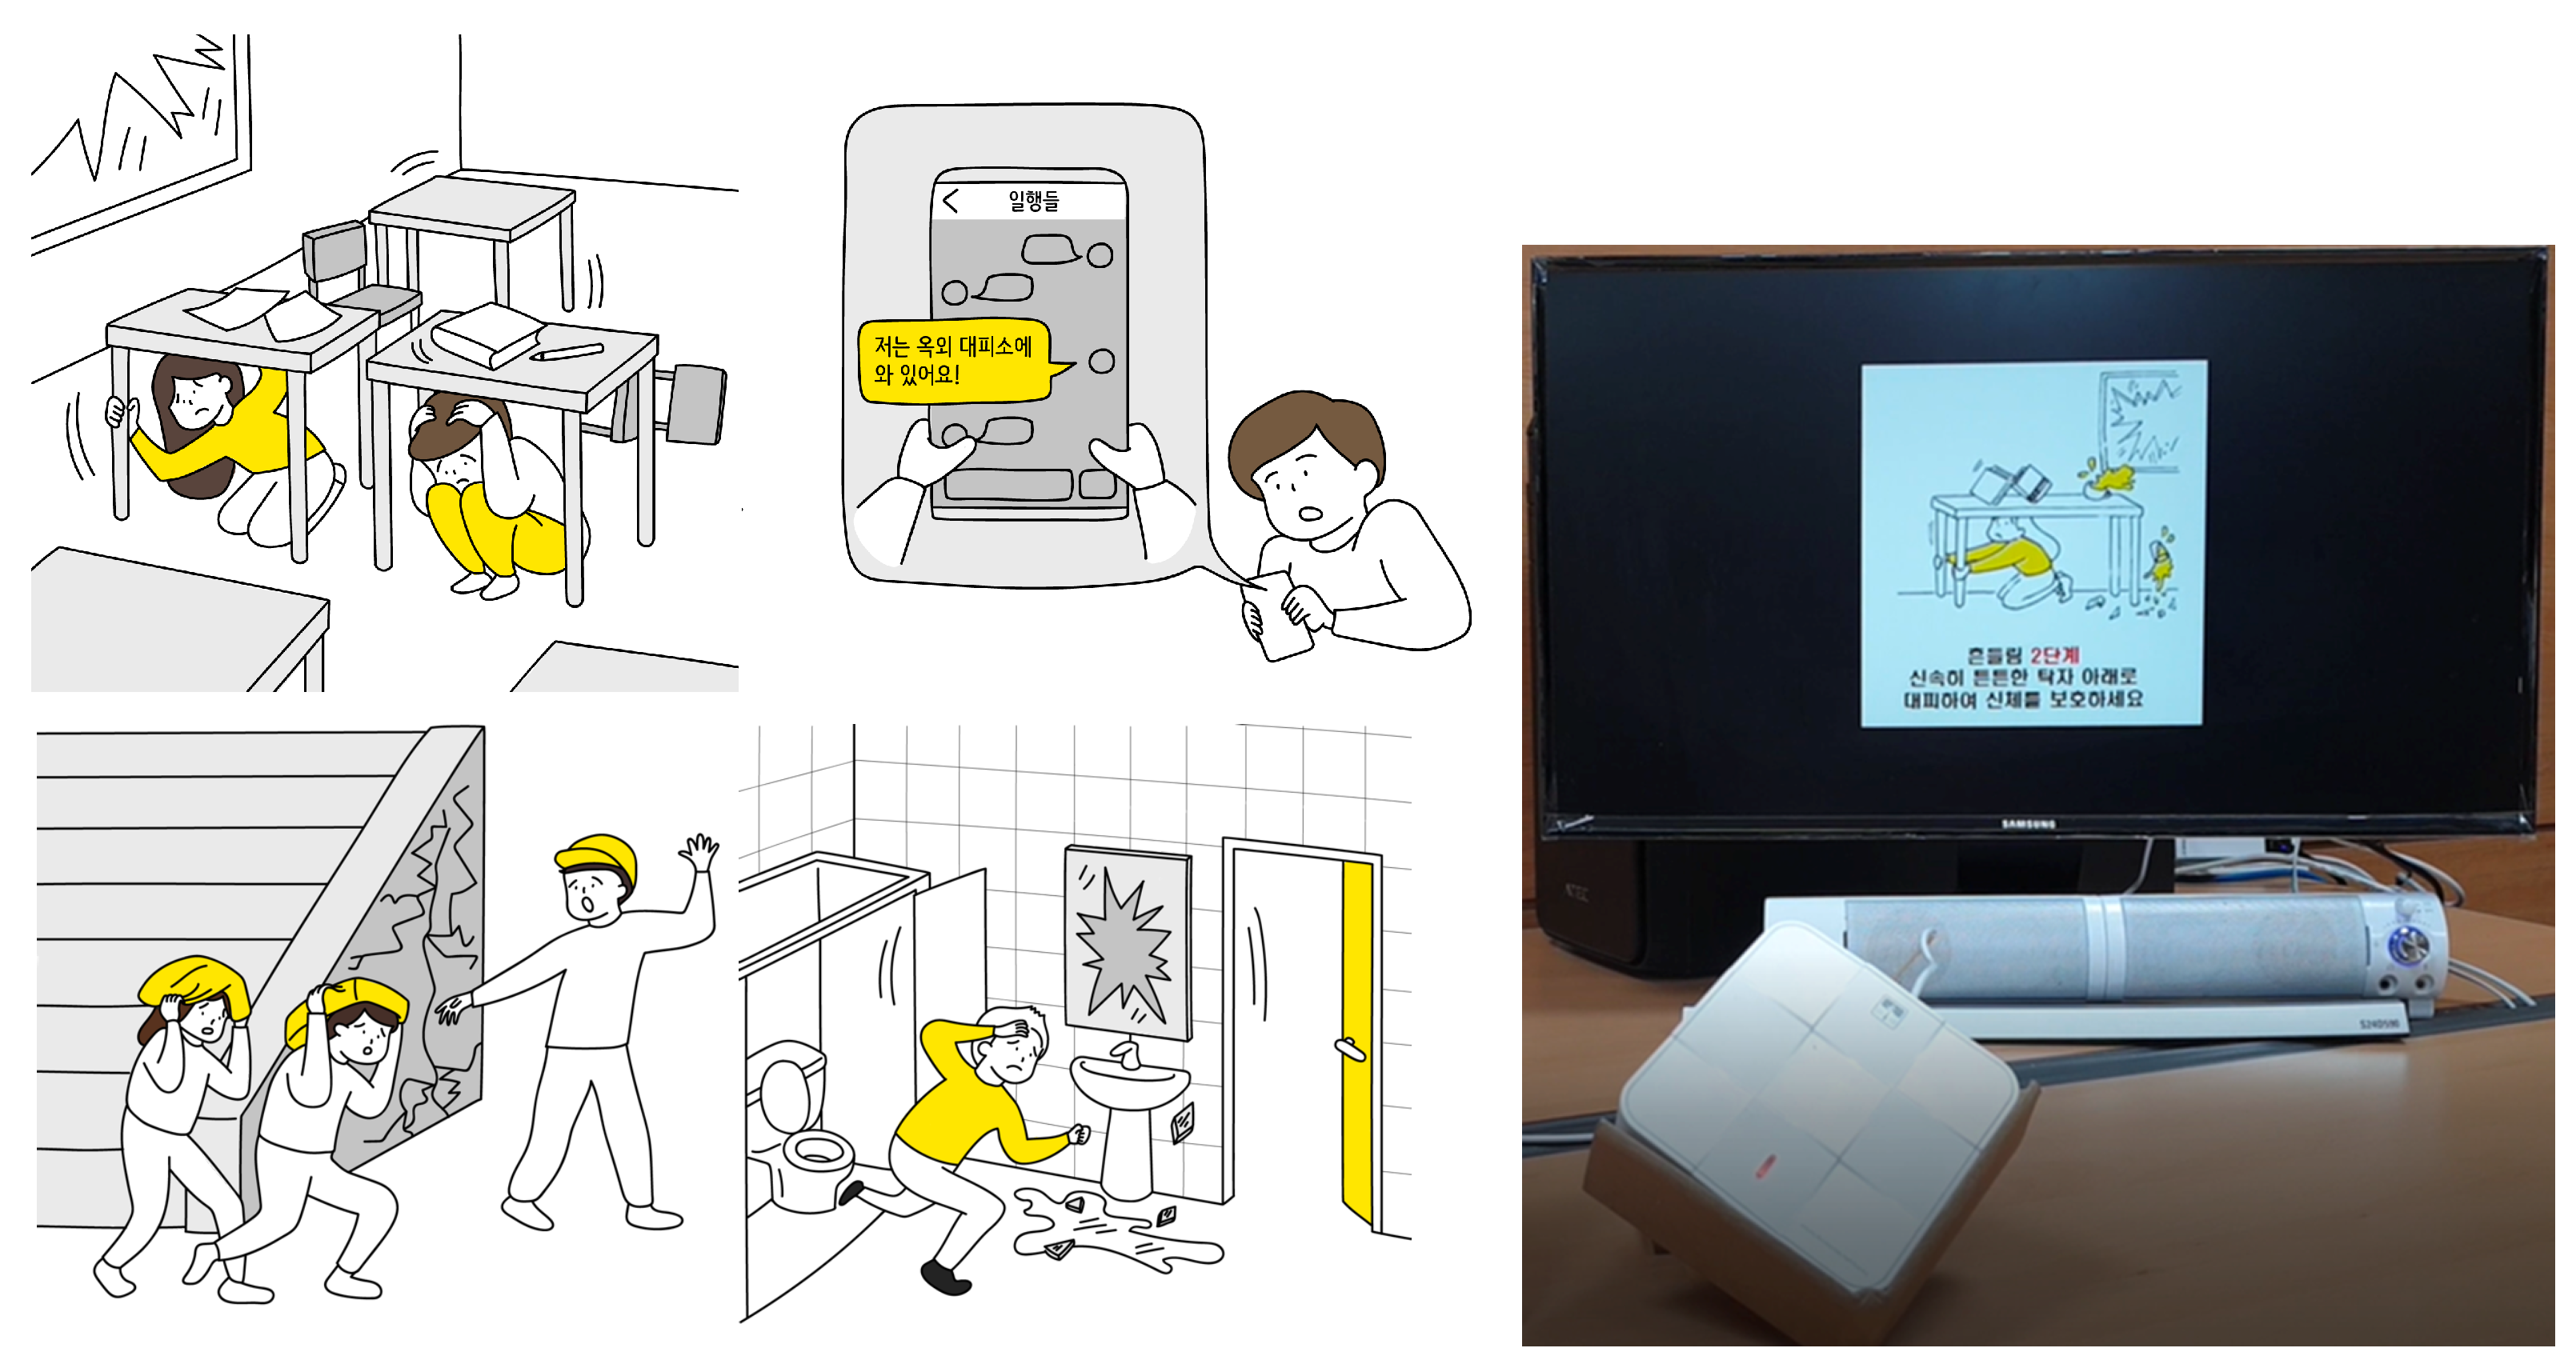
- Smart devices: In this scenario, the earthquake alert device sends a warning message to nearby devices such as a smartphone or TV that pops up appropriate emergency procedures (e.g., “protect yourself from falling objects such as signs or potted plants.”) according to the detected earthquake shaking using straightforward images. Figure 6 shows illustrations that are displayed on a smartphone or TV, and a case study that we developed using a smart TV and an AI-enabled speaker.
- Home Automation: In this scenario, according to the level of strength, the connected home-automation devices such as electricity, gas, and tap-water are automatically shut off as described in Figure 7.
4. Evaluation
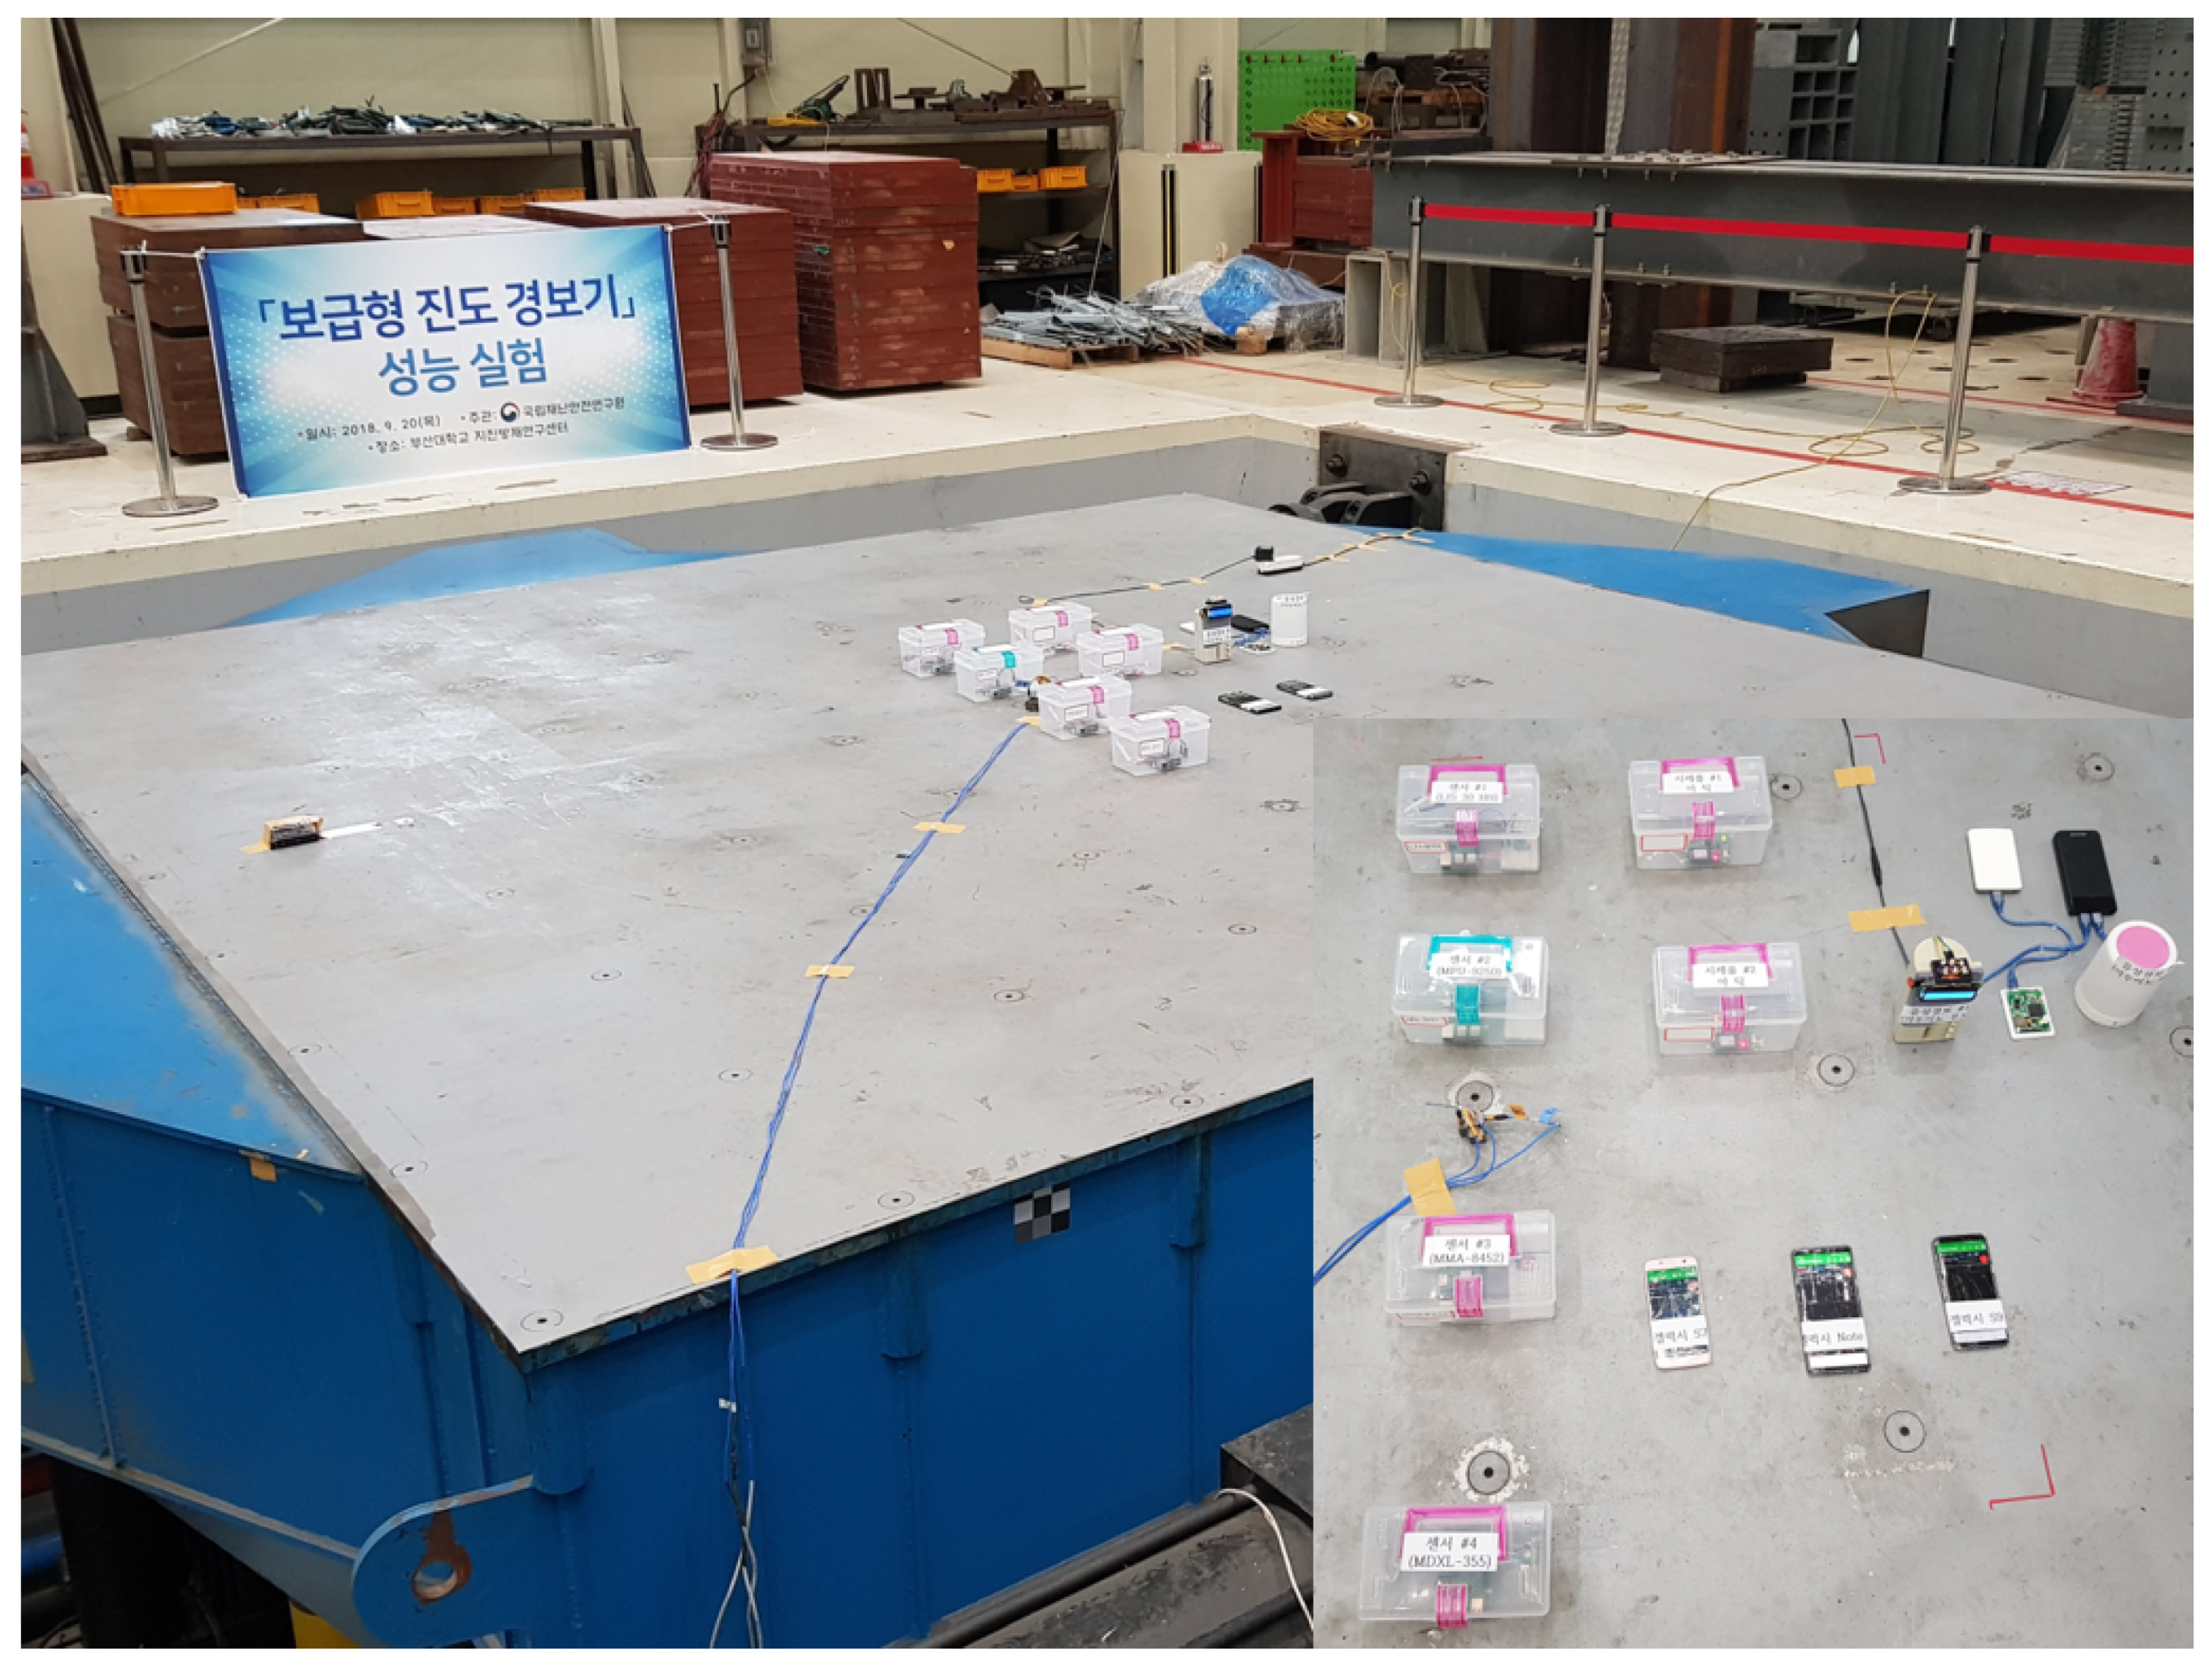
In this section, we discuss the experimental setup, datasets, performance measures, experiments and evaluation of hardware and software systems. A shake-table generates highly accurate earthquake motions for experiments. We used a shake table located in Pusan National University (PNU) to generate earthquake motions for testing. The purpose of these tests are; assessing the accuracy of the sensors and testing the low-cost sensor’s performance under large shaking, and collecting data for testing the machine learning models. The shake table at PNU generates earthquake motion in three dimensions with high accuracy in both frequency and amplitude. It enables us to measured and test low-cost acceleration sensors under realistic earthquake loads against a reference acceleration sensor. We perform shake-table experiments by simulating two real earthquakes: Pohang 2017 (The 2017 Pohang earthquake measuring magnitude 5.4, South Korea on 15 November 2017) and El Centro 1940 (The 1940 El Centro earthquake measuring magnitude 6.9, in the Imperial Valley near Southern California, USA on 18 May 1940) as shown in Figure 8. Then, we record acceleration data on each sensor and compare the recorded data with the reference data (original input data) for evaluation purposes.
4.1. Experimental Results
This section discusses the experimental results of the developed system. First, we evaluate the machine learning model and features with different datasets in the fixed sensor environment. Then, we compare their performances which have been discussed earlier.
ANN Model Evaluation
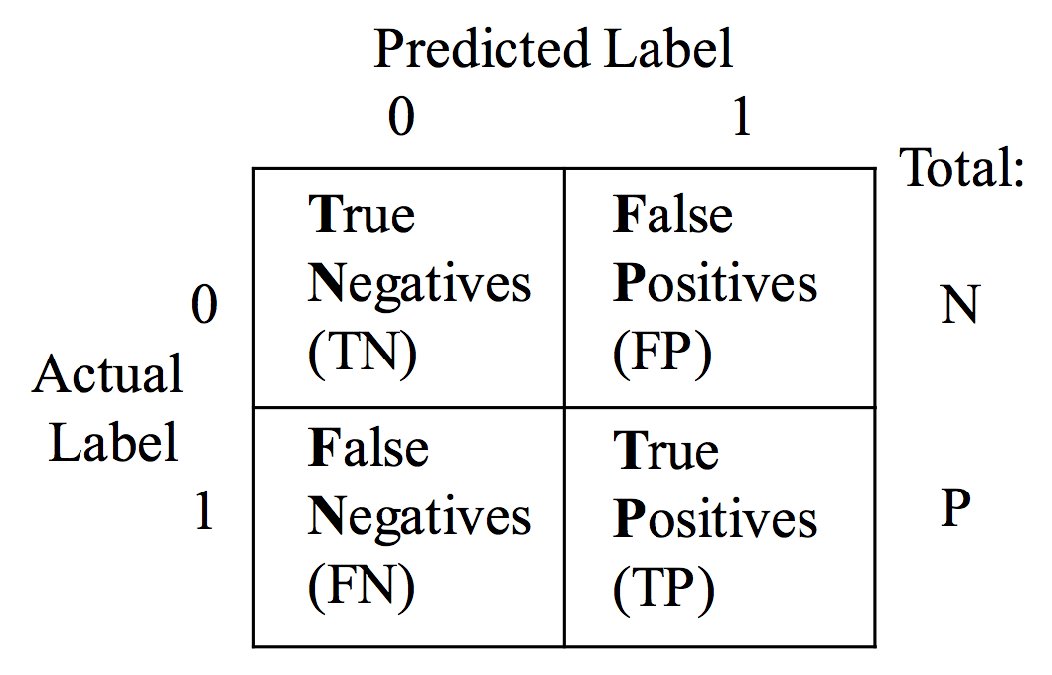
The performance measure of machine learning models are evaluated with different statistics. The common performance matrix can be computed from the confusion matrix [31]. This is a table that indicates the TP (True Positive), TN (True Negative), FP (False Positive), and FN (False Negative) as shown in Figure 9.
Accuracy is the common performance measure which is a fraction of correct prediction over total predictions. Accuracy is computed as;
Recall is computed as;
Precision is computed as;
Finally, F1 score is the harmonic mean of precision and recall. It is a useful measure, because it considers both precision and recall.
Receiver operating characteristics (ROC) curves are widely used in machine learning and data mining, which can visualize a model’s performance by showing the relative trade offs between false positive rate and true positive rate [32].
Dataset
The dataset that we use for the experiments to train, test and evaluate the ANN model contains two types of labeled data. The first type is a typical earthquake dataset downloaded from the National Research Institute of Earth Science and Disaster Prevention (NIED) [33] and United states Geological Survey (USGS) database [34]. We use 892 earthquake events with magnitude 4 and above that occurred between April 2009 and May 2019 from the NIED database. It contains 555 events between magnitude 4 and 5, 215 events between magnitude 5 and 6, 105 events between magnitude 6 and 7, and 16 events between magnitude 7 and 8 or above. Moreover, multiple stations’ datasets from two earthquakes i.e., Tottori (2000) (magnitude 6.61) and Niigata (2004) (magnitude 6.63) are downloaded from the USGS database. The dataset is pre-processed and converted into unit (g). The sampling rate of all the earthquake data is 100Hz and it is in three components (i.e., EW, NS, and UD arrangement, where EW (East-West) and NS(North-South) are horizontal components, and UP (Up-Down) is vertical component).
The second type of data is non-earthquake data recorded on mobile phones by ourselves. In these experiments, we use two types of non-earthquake data—human activities (e.g., walk, stay or wait, riding bicycle, riding car, riding bus, jump rope, run, stairs, drop mobile, and shake desk) and noise data (e.g., floor noise on different degree of elevations, outdoor noise, server computer noise, and vibrations of a smartphone). To better evaluate the model performance on unseen data (particularly on Korean earthquake data), we also use the Pohang earthquake data (For the rest of the article, we refer to this data as Pohang test) generated during the shake table test. It contains 70 to 80 s earthquake data recorded on the four acceleration sensors. The given model is tested on the entire data of each sensor, with a two-second sliding window on raw acceleration and one-second of overlap window. It extracts three features from each window and classifies the signal as an earthquake or not an earthquake. Through this experiment, we also evaluate how accurately the four low cost acceleration sensors can detect the earthquakes using the proposed algorithm. Hence, this data is used for evaluating the performance of model and sensors.
In the experimental evaluation, we evaluate the earthquake detection model using different datasets. We first extract three features (i.e., IQR, ZC and CAV) from the earthquake and non-earthquake datasets. To balance two different datasets, we use the centroids of non-earthquake data. As shown in Figure 10, the computed centriods represent non-earthquake data precisely.
Evaluation
In the experimental evaluation, we use different test cases to find a good model which can detect the earthquake in real-time environment with fixed sensor system setup.
In the first experiment (Exp #1), we train the model with earthquake data (NIED and Tottori from USGS) and non-earthquake data (human activity and noise). For the earthquake data, we use a two-second strongest earthquake portion with one second before and one second after the maximum vector sum sample. We get 967 earthquake data points and 967 centroids from the non-earthquake data. We split the data into 70% and 30% for training and testing the model. The model shows good results on the test data, but when it is tested on the 100% scale and 50% scale of Pohang data, the results become poor. Figure 11 shows the results of the detection algorithm (top) raw acceleration of X, Y, and Z components along with the normalized vector sum of three axis (bottom) for Pohang earthquake of 100% scare. Here, we only show 100% scale results because the detection results on 50% scale are almost the same.
Next, we change the earthquake window size for the second experiment (i.e, Exp #2) and use a ten-second strongest earthquake portion with one second before and nine seconds after from the maximum vector sum sample. In this experiment, we only select the NIED earthquake data. We get the same number of earthquake data points and centroids of non-earthquake. Similar to Exp #1, the model shows good results on the test data but again fails to show results on the Pohang data. Therefore, we investigate the problem with various test cases by changing the parameters such as window size, model parameters and dataset sizes. We generated the following key facts after the exhaustive experimental processes:
- Three seconds of the strongest earthquake portion, with 1.5 s before and 1.5 s after the maximum vector sum is the optimal window size.
- Because IQR and CAV are based on the amplitude information of an earthquake, the dataset needs to be balanced in terms of a magnitude level. In other words, intra-class instances must be balanced. If the model is trained with higher magnitude earthquakes, it may not detect the moderate earthquakes in real-time. Similarly, if the model is trained with low earthquakes, it may confuse between the noise data and the earthquake data, thereby increasing false alarm rates.
- The model shows the same results on the Pohang data, whether including or excluding human activities. As earthquake detection devices are fixed and will not be affected by the human activities, it is unnecessary to include human activities such as car, bus, bicycle jump rope, and stairs, etc. Therefore, the detection ability of the model is most likely to depend on the earthquake class.
- The ZC feature is a critical feature and can affect the model performance.
Thus, considering the above points, we keep the strongest portion of the earthquake window at 3-s for further experiments. Moreover, for the non-earthquake class we use noise data and some human activities such as walk and wait. Then, in the third experiment (i.e, Exp #3), the trained model shows good results on the 30% test, which are better than the Exp #1 and Exp #2 on Pohang test data, as shown in Figure 12. It detected the earthquake in original data, and with some false detection due to noise in LIS3DHH and MPU9250. The ADXL355 and MMA8452 results were again poor because of the continuous noise on their components. In the fourth experiment (Exp #4), we included all the human activities to see the effect of the human activities on the model. The 30% test results of Exp #3 and Exp #4 were different, as given in Table 4, but when exp4 was tested on the Pohang data it produced identical results, as produced by Exp #3 which demonstrated our argument.
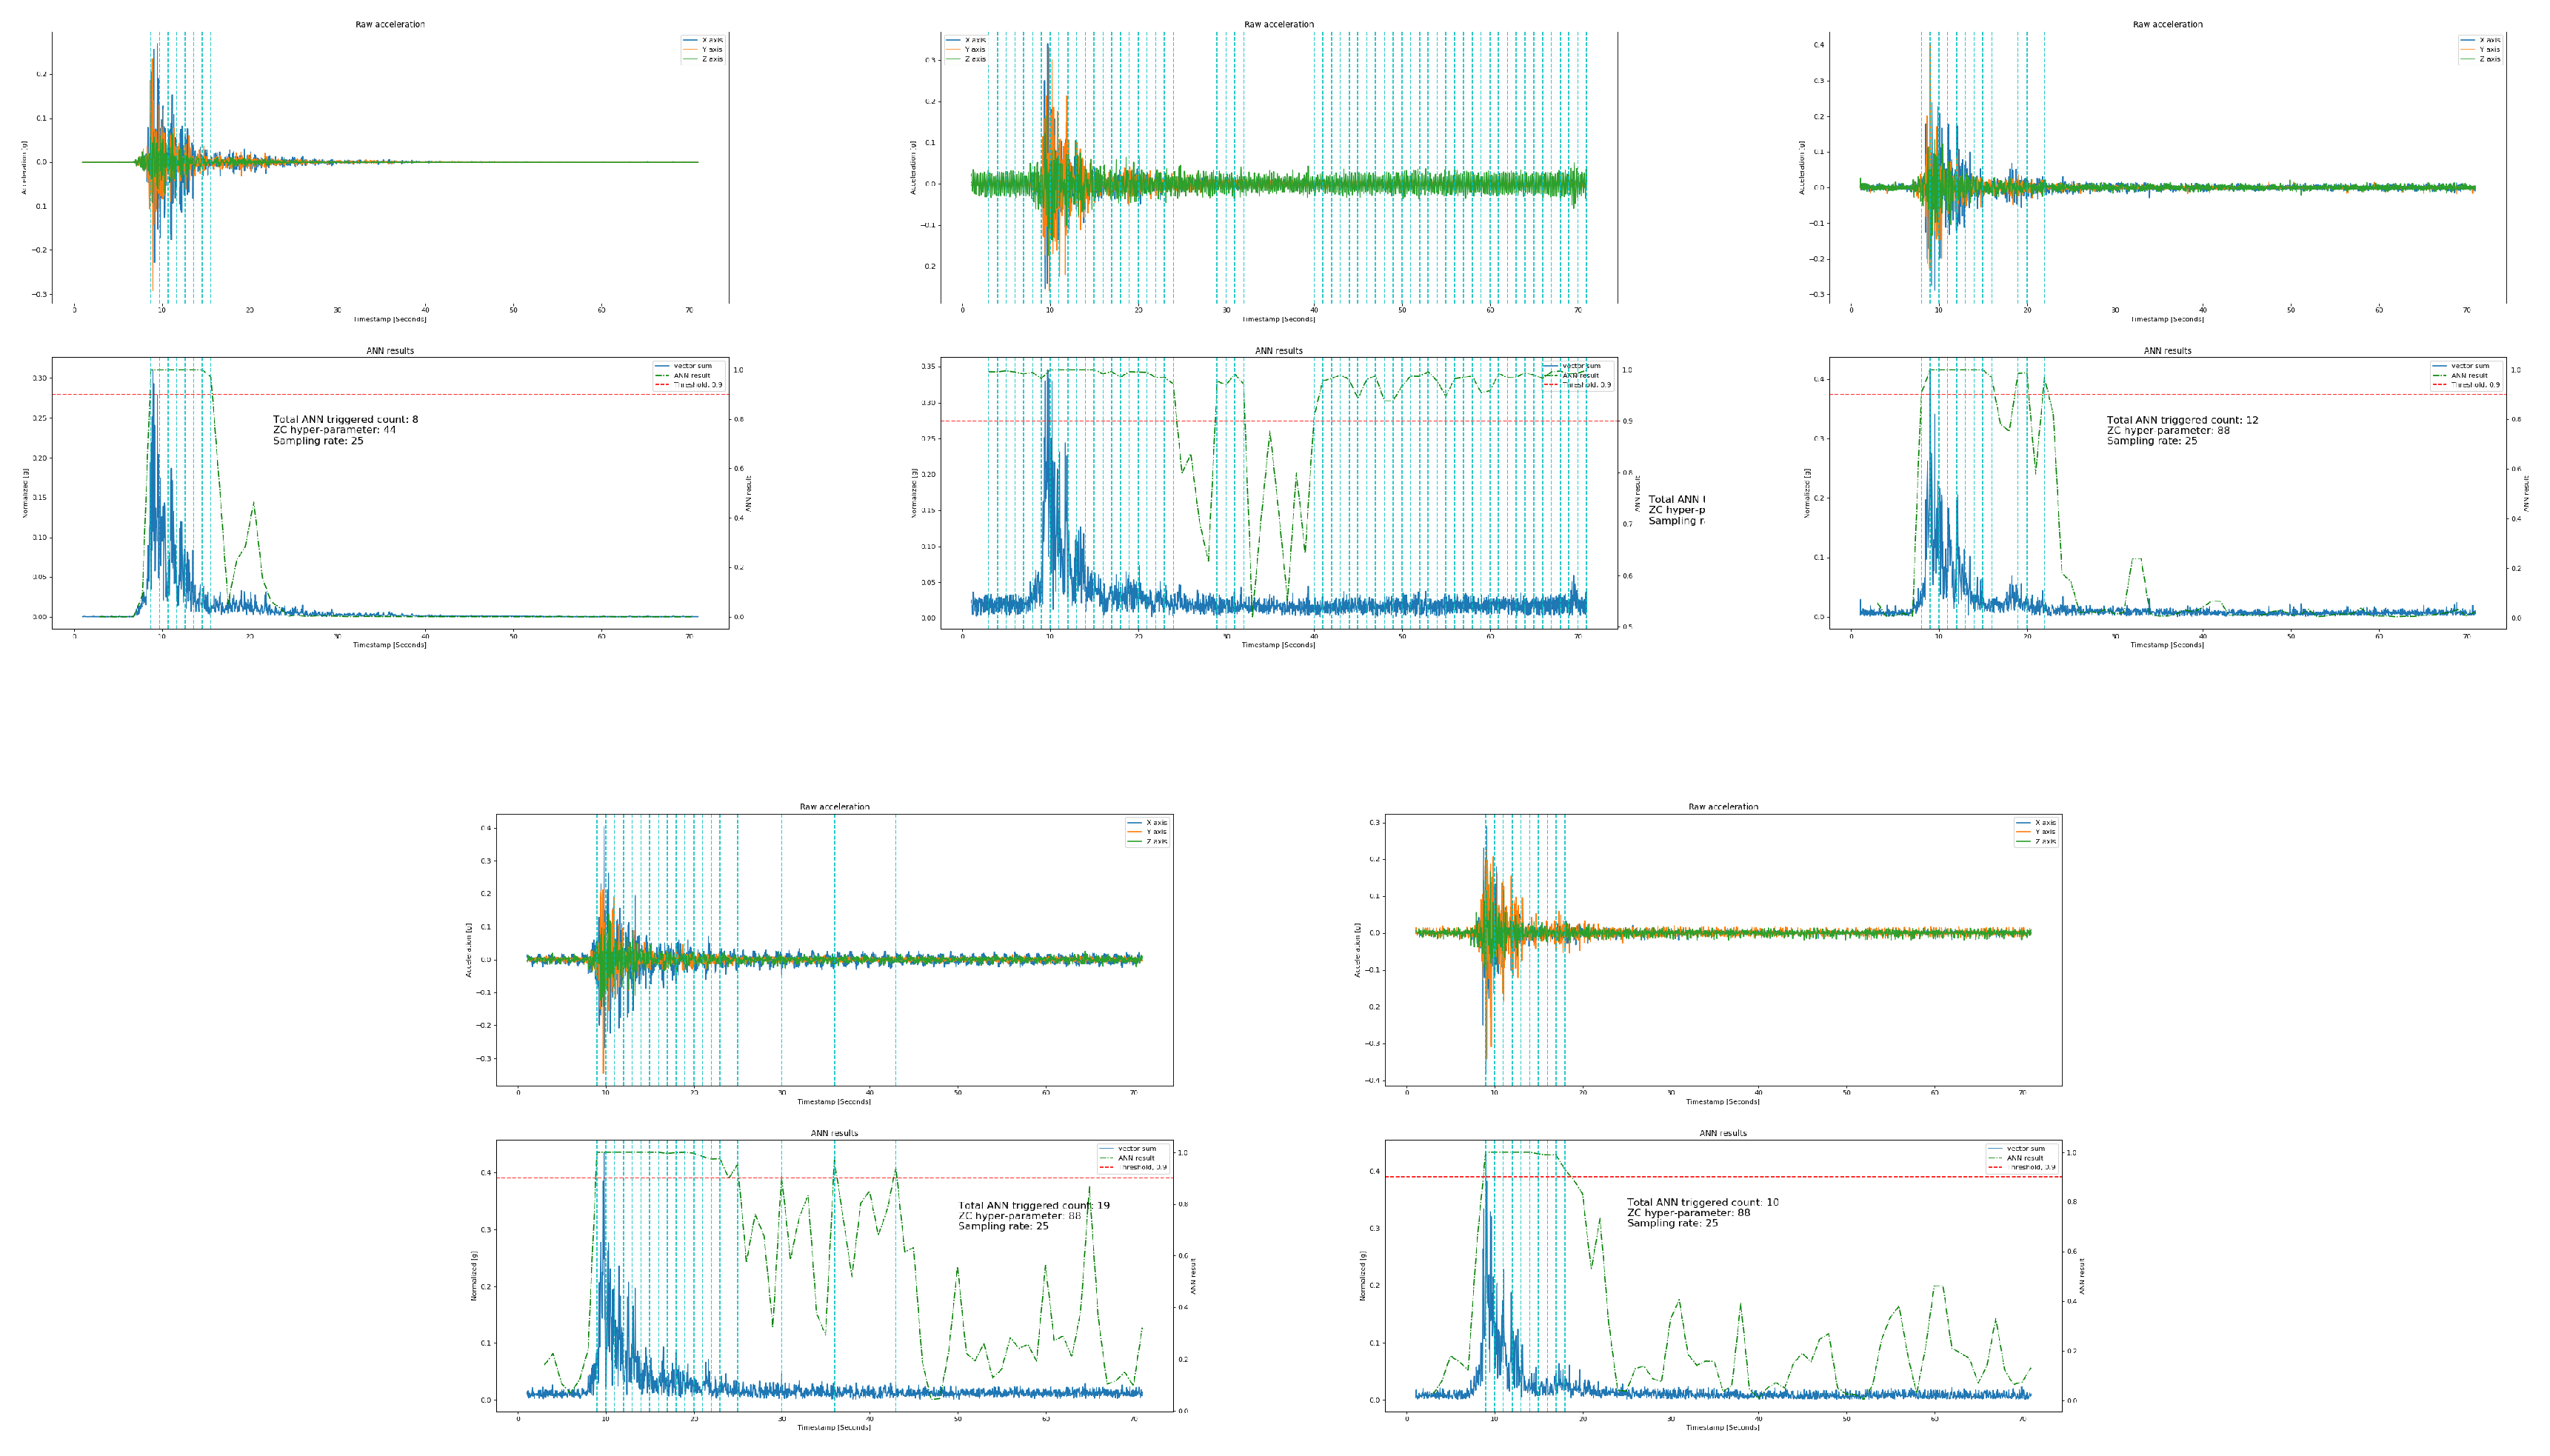
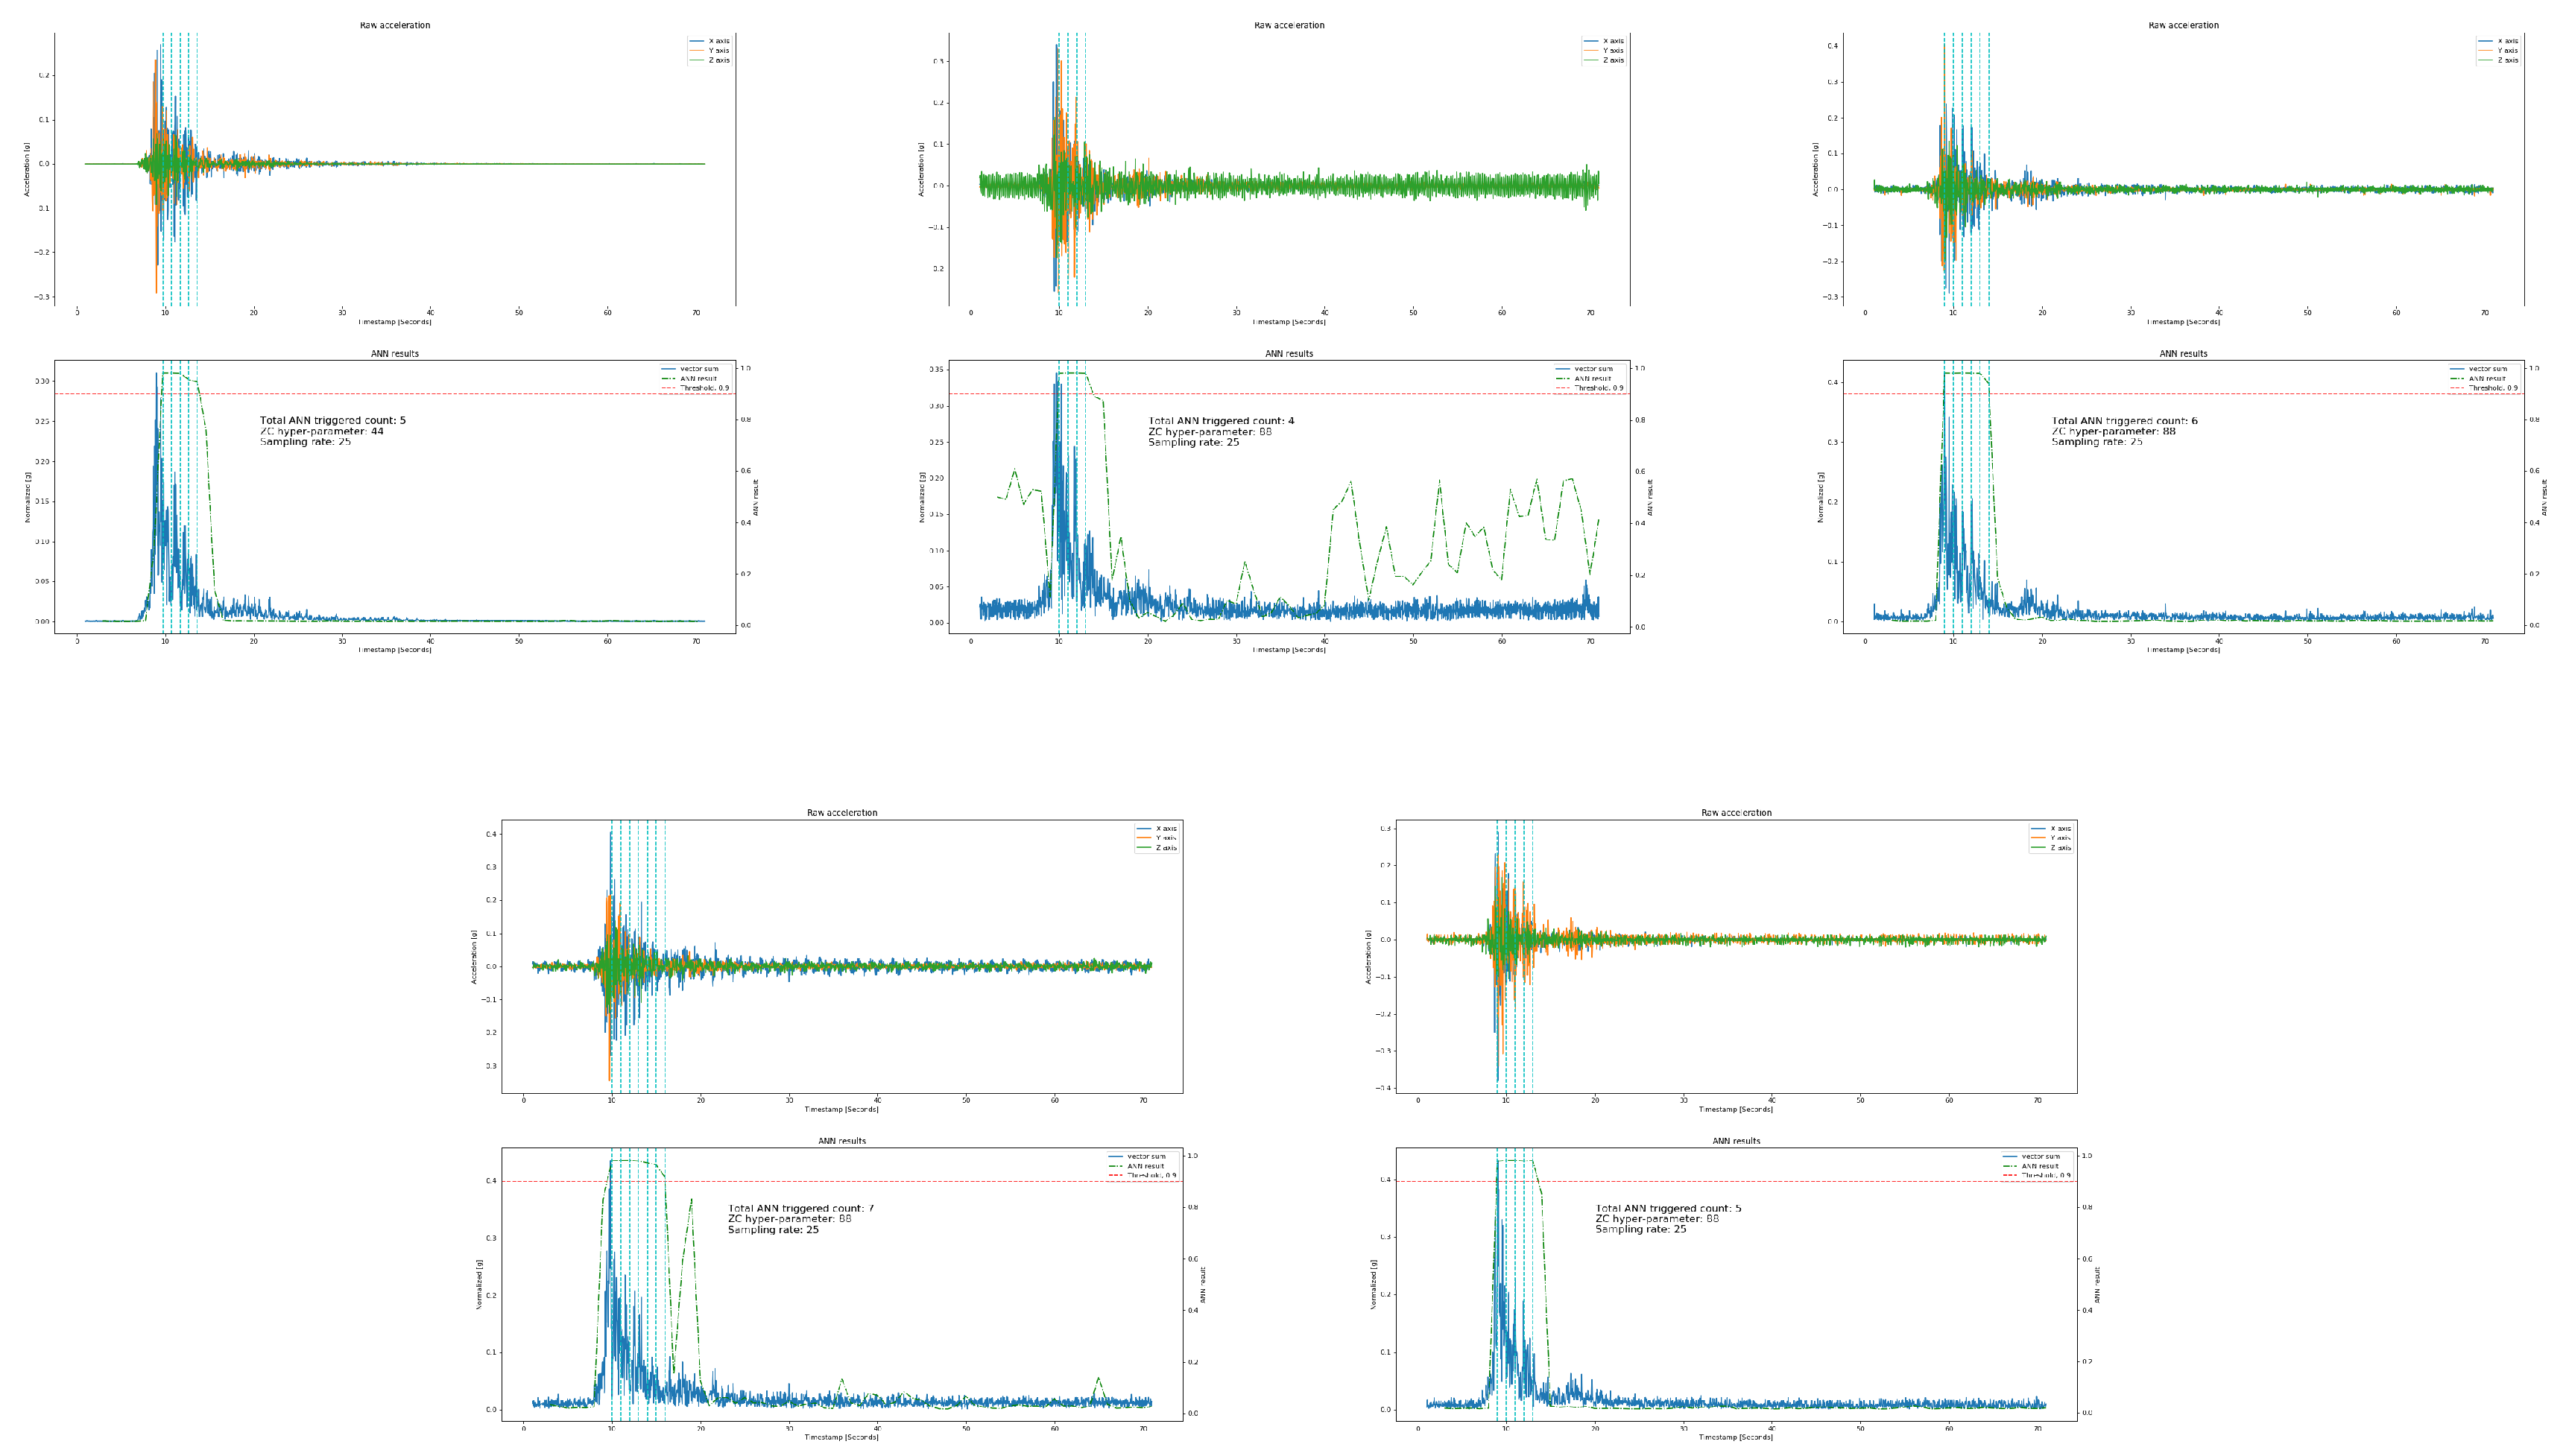
Finally, in the last experiment Exp #5 we also balanced the earthquake dataset in terms of the magnitude and use equivalent quantity of each magnitude. Because the high number of 4–5 magnitude earthquakes tends to confusion in the model as in the case of exp4 when the sensors are noisy, the results were particularly poor on the ADXL355 and MMA8452 sensors data. For the non-earthquake data, we included only walk and wait from the human activity and noise data. After an experimental search we found a very good model which shows better performance not only on the 30% test data as given in Table 4, but also shows excellent results on the unseen data of the Pohang test as shown in Figure 13. The model detected the exact earthquake duration in all the sensors data.
Table 4 summarizes the performance of all the experiments done for finding an optimal model which is able to detect the real-time earthquakes with low false alarm rate. The accuracy of the final model is less than the other models in 30% testing where the non-earthquake data contains human activities. However, in our case, the sensors are fixed and the only non-earthquake data could be the noise data, most of which might be caused by the sensors themselves. Therefore, we need a model which can detect the unseen earthquake in real-time precisely, and to that end, exp5 model is the optimal one.
4.2. Evaluation of Acceleration Sensors
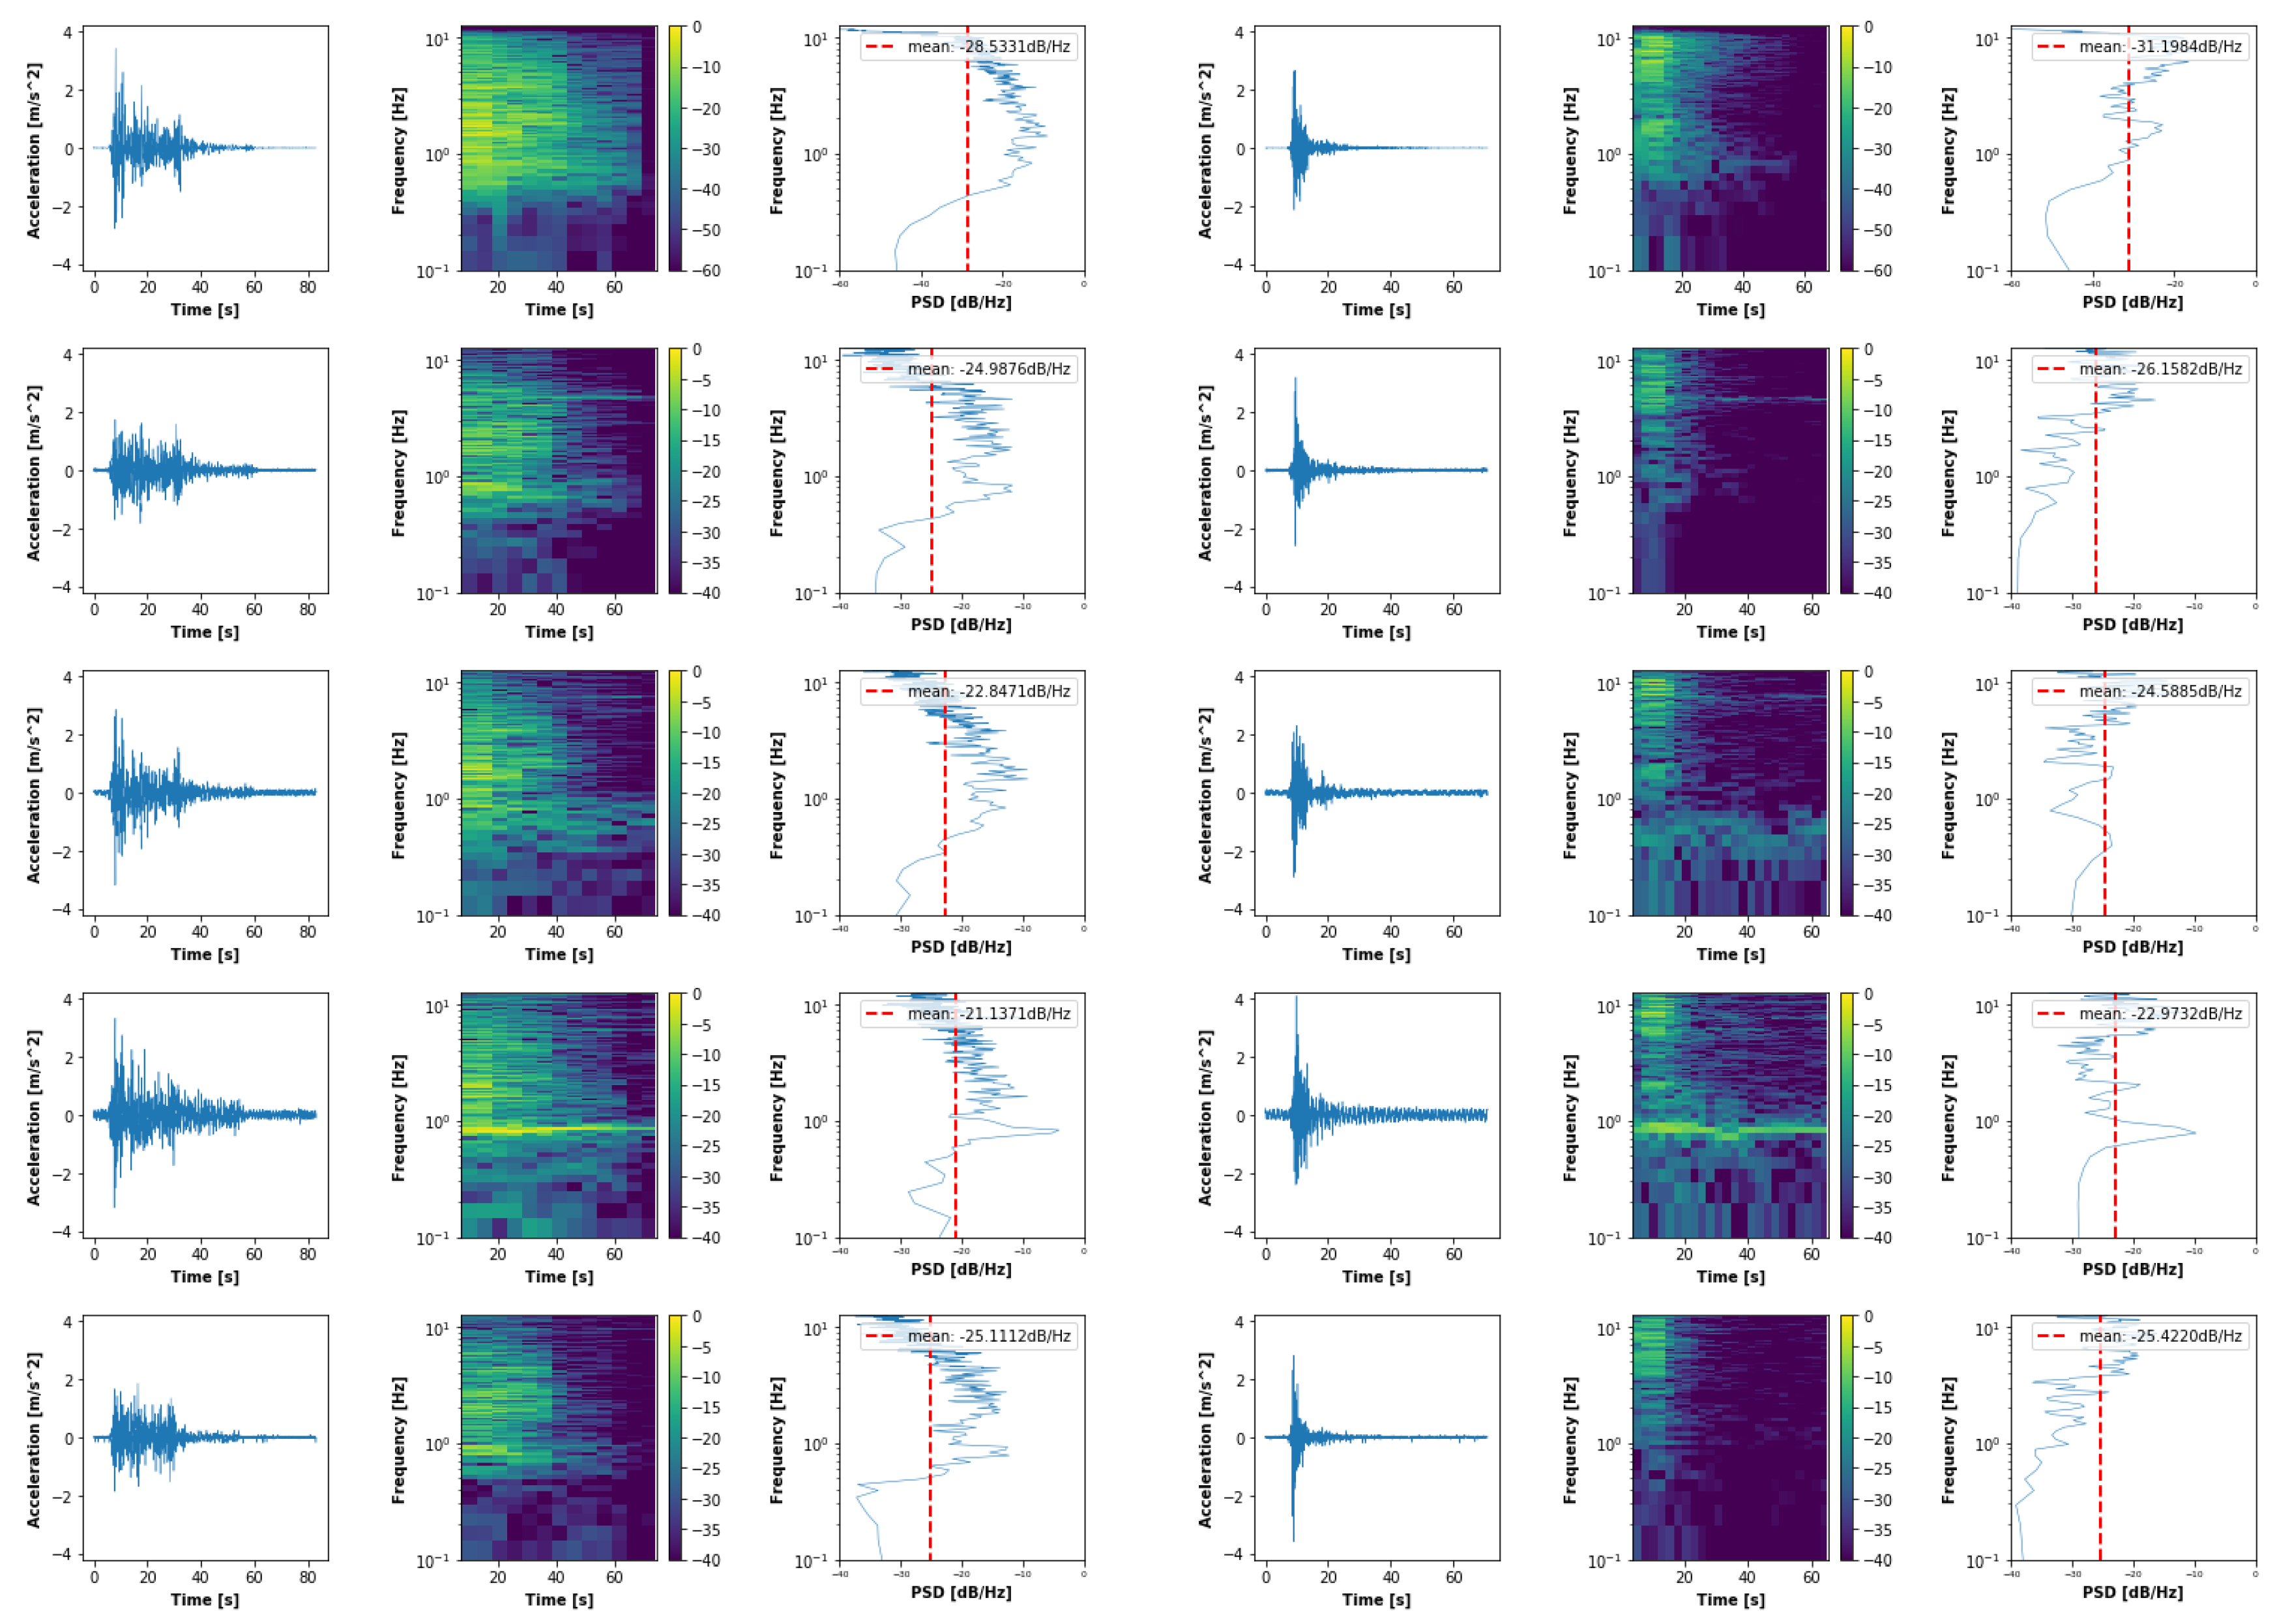
Then, we evaluate the accuracy of the selected four sensors for recording seismic data. Figure 14 shows three types of graphs: from left to right, raw signals in the time domain, spectrograms obtained by Short Term Fourier Transform (STFT) with 2 s window, and PSD (Power Spectral Density) in the frequency domain, respectively. From the top to bottom of the figure, the graphs of two earthquake signals of the original (the reference data), ADXL355, LIS3DHH, MMA8452, and MPU9250 are given, respectively. PSD is a useful measure to characterize random signals, and the spectrogram gives a visualization of the STFT of a signal. We use these two measures to evaluate the selected sensors with the reference signal. As we can see in the figure, the ADXL355 and LIS3DHH show similar results to the reference sensor, while the other two sensors’ signals contain noise in the form of disperse power in the spectrogram. Specifically, the MMA8452 has a uniform noise power at frequency for all three components in both earthquakes. Such frequency noise affects the performance of a classifier when detecting an earthquake, when we use frequency as a feature e.g., zero crossing. The vertical component of ADXL355 is more noisy than the LIS3DHH. We can see a noisy line in the 6 to 7 frequency range for Y and Z components in both earthquakes. However the mean PSD value of ADXL355 for X components is similar to original one in both earthquakes. MMA8452 shows the worst results among all four sensors in-terms of mean PSD for X components with the mean difference of approximately 4 and 5 for El_centro and Pohang, respectively. The mean PSD of MPU sensor is close to the ADXL355 sensor for all the three components in Pohang earthquake. However, the the noise level of ADXL355 is lower than MPU9250, in all the three components, for spectrograms of both earthquakes.
4.3. Evaluation of the Earthquake Detection Algorithm
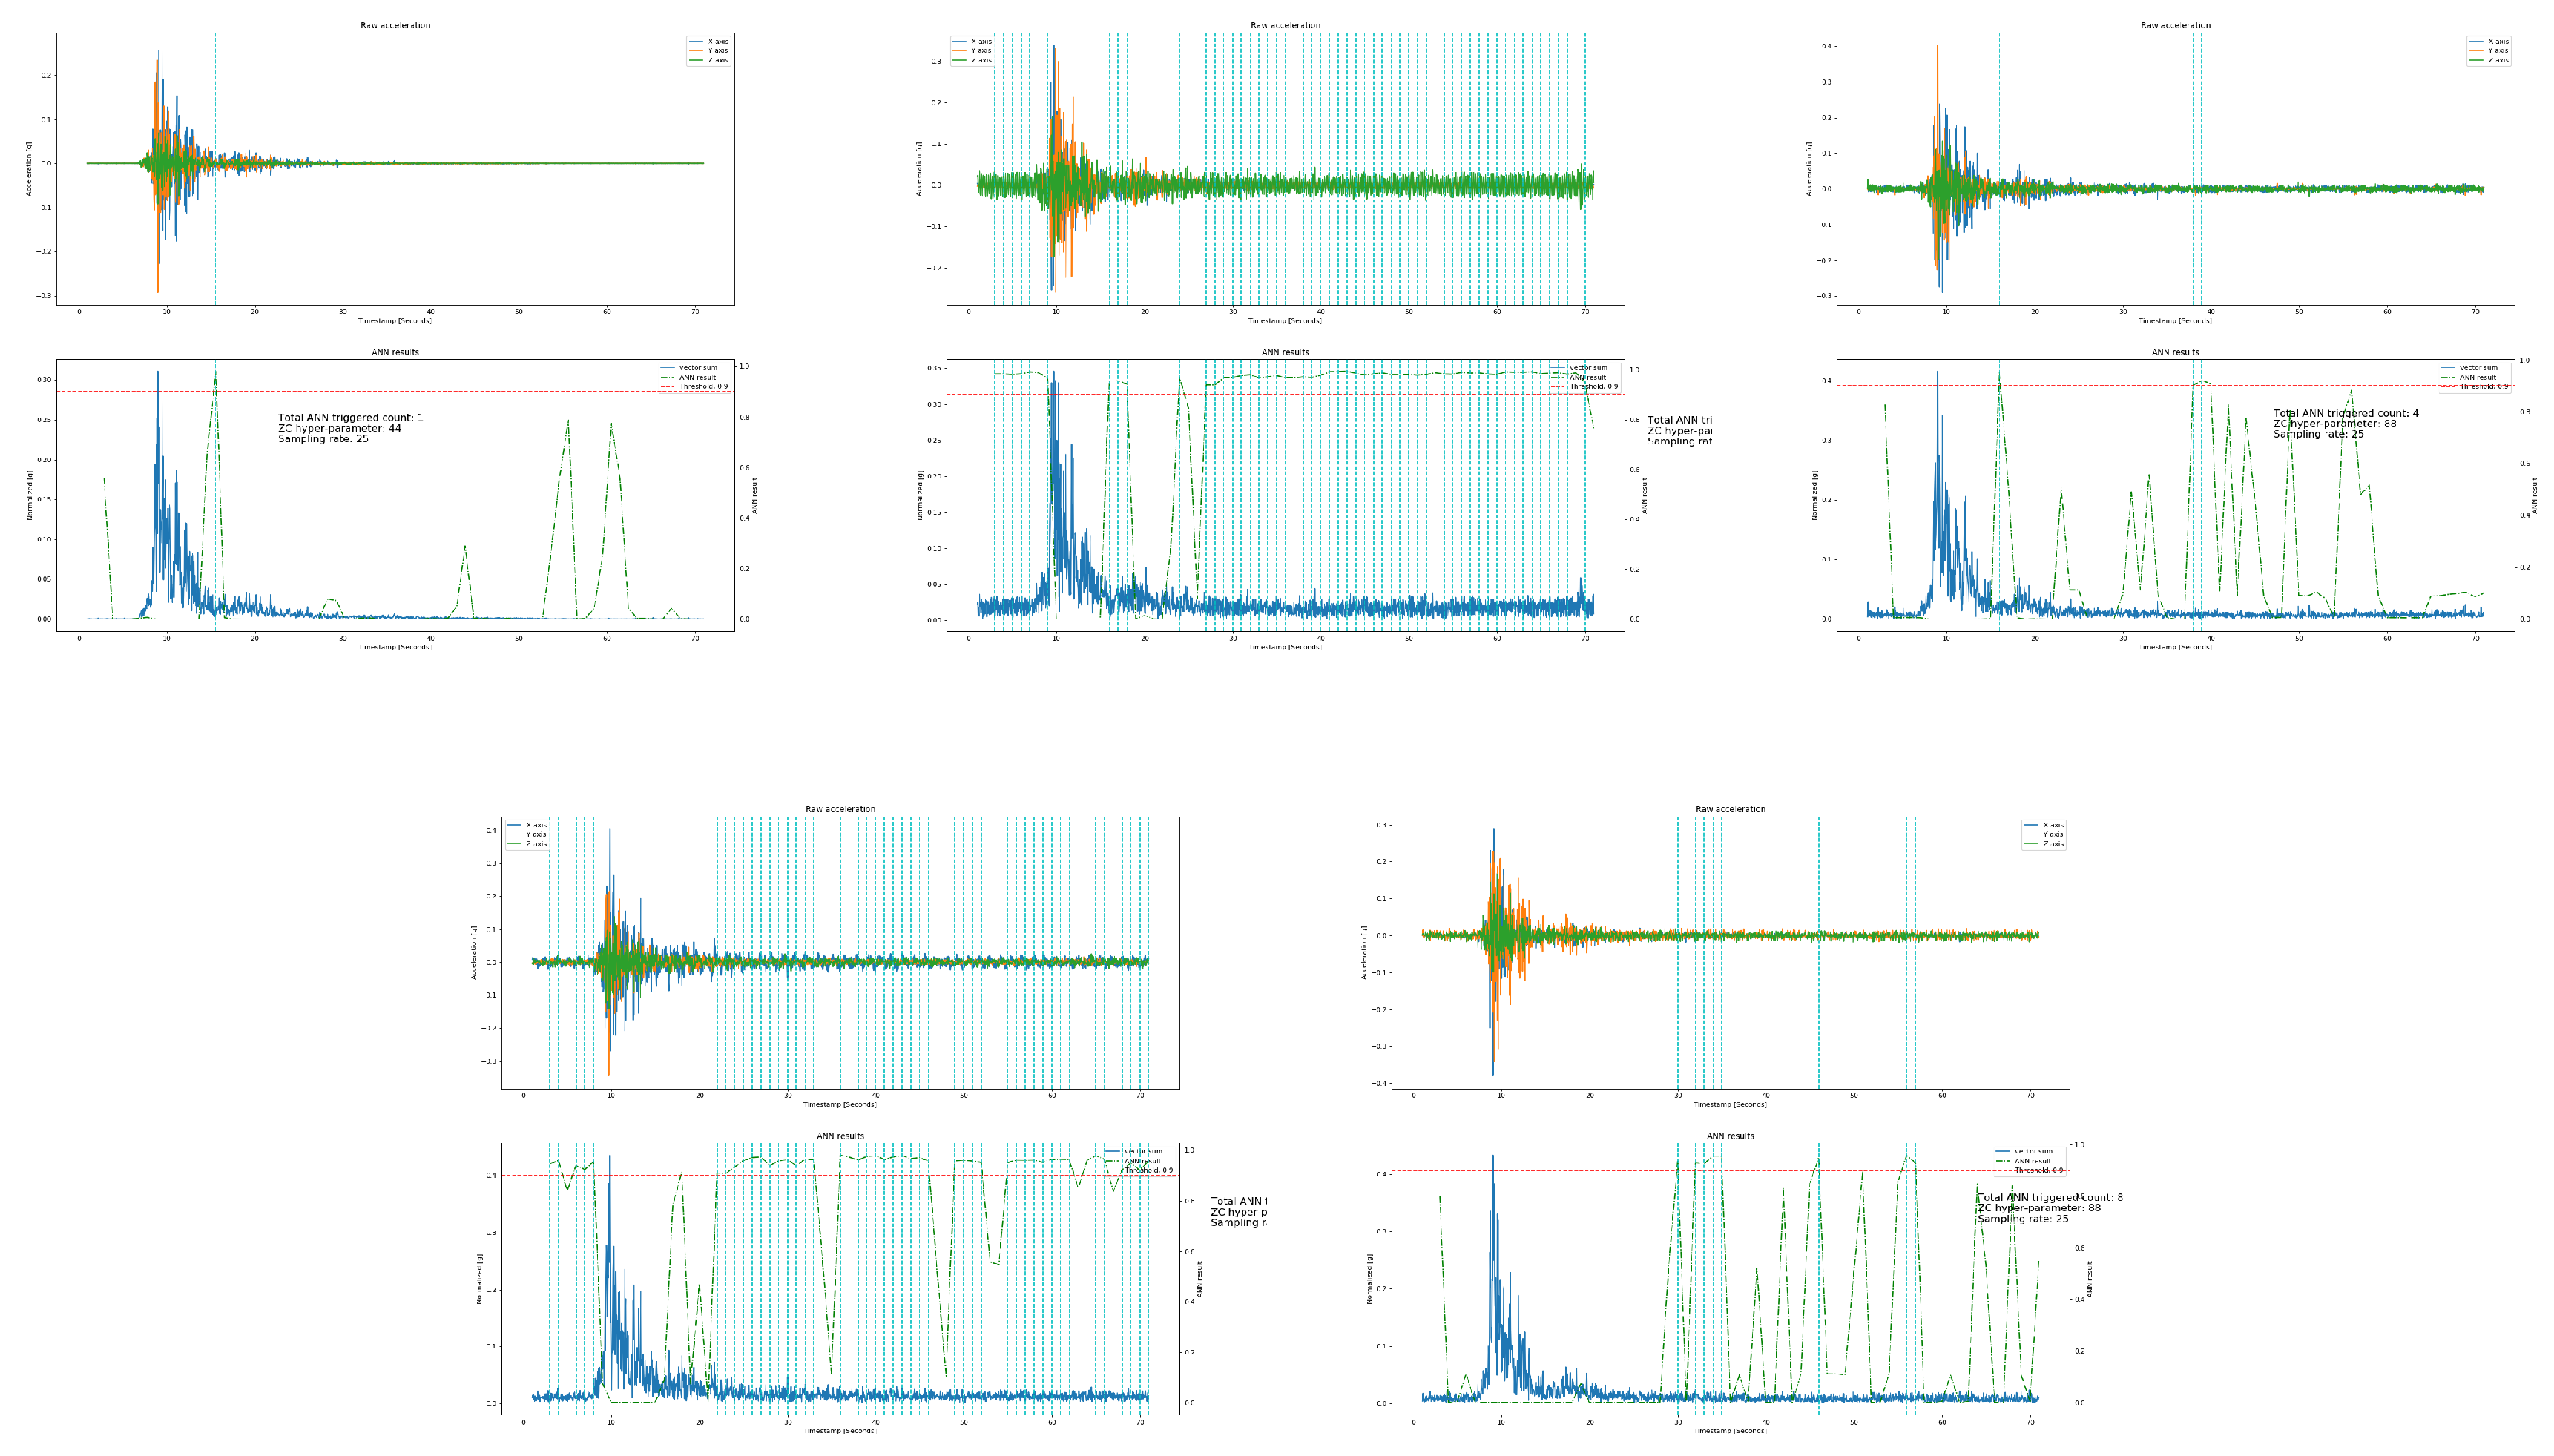
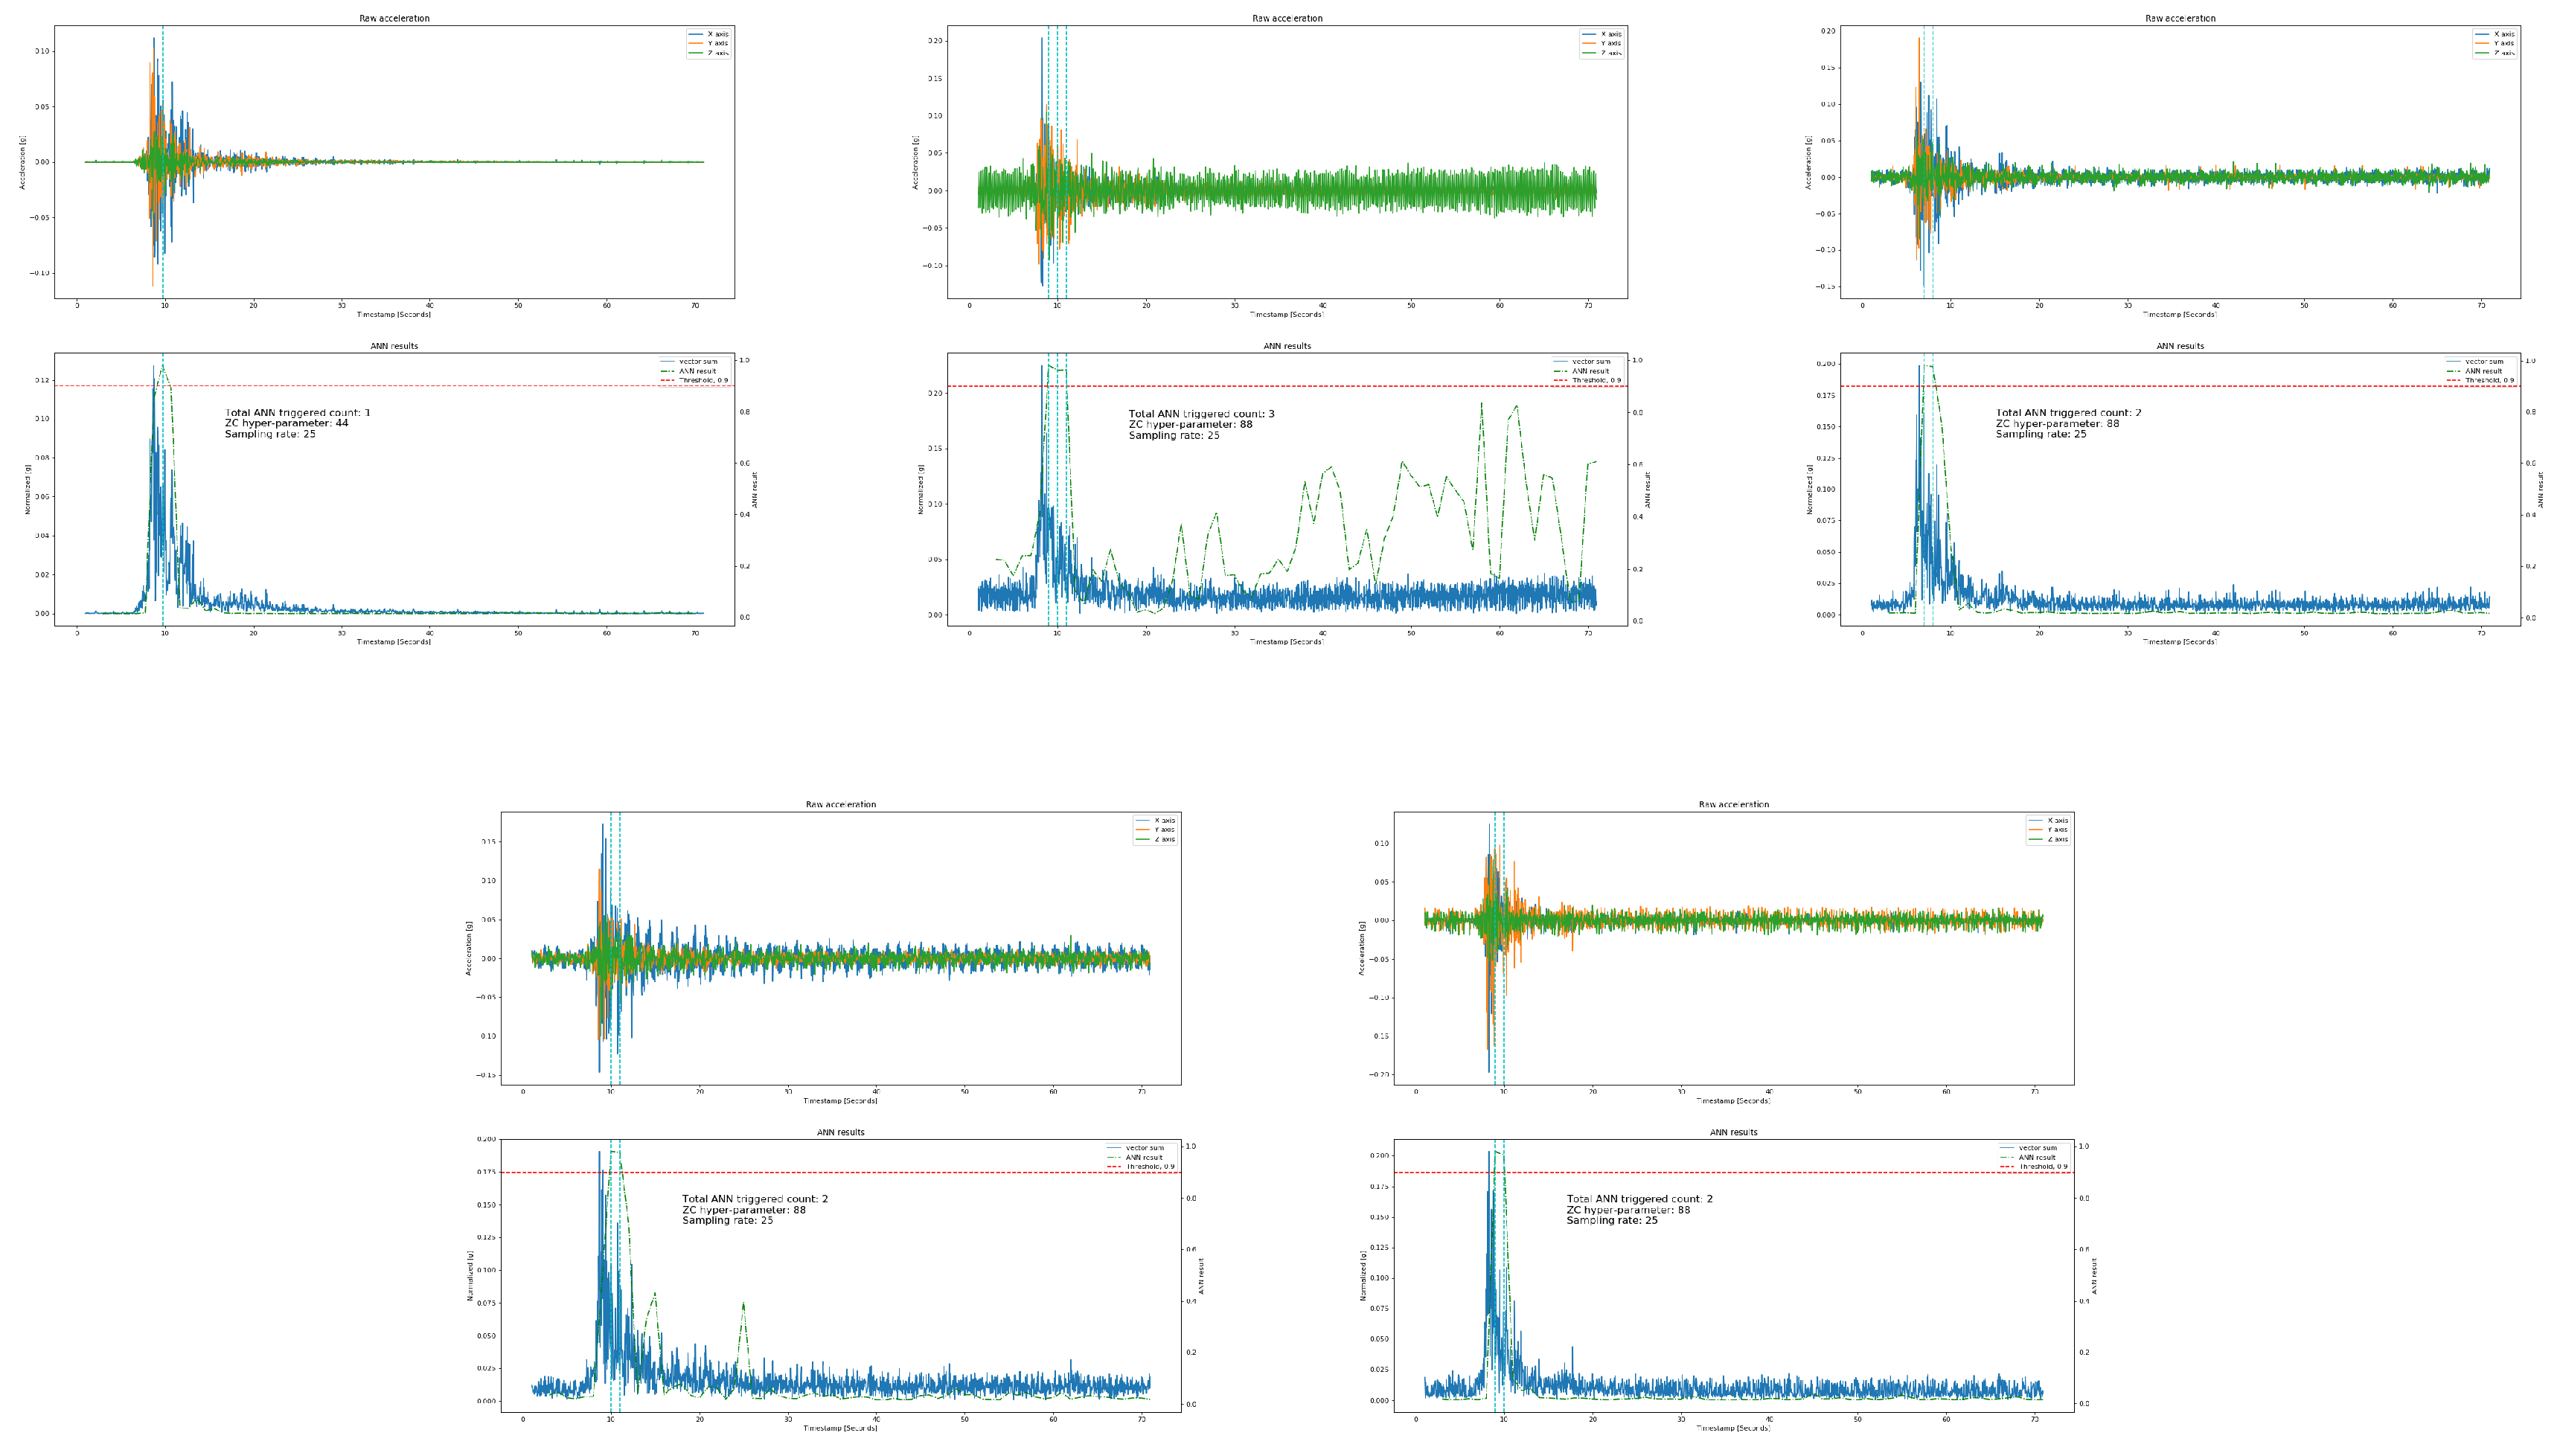
In this section, we evaluate how accurately the four low-cost acceleration sensors can detect earthquakes using the proposed algorithm. For this purpose, we use the Pohang earthquake data that we used in the previous experiment. The earthquake data recorded on the four sensors are the inputs to proposed algorithm which have implemented the trained ANN models. We test the detection algorithm with the trained model (i.e., Exp #5) on the moderate and low amplitude data to evaluate its applicability in the real time environment. Pohang 50% scale data is selected for this experiment. The parameters and experimental settings remain the same used for 100% scale data. In this experiment, the model obtained through Exp #5 can detect the earthquake in the reference data accurately as shown in Figure 15. For the ADXL355 sensor data, the model shows high probabilities in the form of high peaks on non-earthquake, similar to 100% scale results shown in Figure 13, due to prominent continuous random noise on a Z component.
Furthermore, we make some changes in the parameters of the earthquake detection algorithm to improve detection accuracy and performance as well as reducing false alarms. Instead of using two seconds windows with one second overlap time, we use two seconds of the window with 1.5 s of overlap time. Hence, the overlap time is increased from 1 to 1.5 s. We also change the threshold value for the ANN model from 0.9 to 0.95 to reduce the false alarm rate. With these changes, the algorithm can successfully detect earthquakes with a low false alarm rate.
To detect earthquakes using low-cost acceleration sensors, it must be assured that the sensors are able to measure changes in the acceleration caused by various degrees of earthquakes ranging from 0.02 g to 0.8 g. Therefore, we have to check whether acceleration sensors can respond to such strong or weak motions. For this purpose, we used the scaled data of the 2017 Pohang earthquake from , , , , 1, to 2 (i.e., 0.02 g to 0.8 g).
5. Future Work and Conclusions
In this article, we introduced an earthquake detector using low-cost acceleration sensor and its applications. The system introduced a smart device which can detect earthquakes using low-cost MEMS sensors. We provided specification, assessment, and comparison of different low-cost sensors and concluded that LIS3DHH is a suitable sensor to use as a sensor for the stand alone earthquake detector device. The detection algorithm has been discussed in detail with the machine learning approach and it was observed that, with small changes, we can improve the performance of the system. Finally, the experimental results shows that the system detected the earthquakes with a lower false alarm rate. Therefore, it is feasible to implement this system with low-cost sensors in the countries where the earthquakes occurred frequently.
As future work, we will focus on some of the directions we observed in our work. First, we will train the ANN model with different and diverse earthquake datasets. This might include different territory and different scale earthquakes. Similarly, for the system to work also in a dynamic environment and to cope with the variety of human activities, the machine learning model must include different categories of human activities. Second, to increase the accuracy of the model we can search for new features. As the existing features are not robust in dynamic environment and need a triggering algorithm to filter the signals. Likewise, we can try some other machine learning models. Finally, from the device point of view, we look for an improvement to extend the system to utilize more smart home devices. Hence, our goal is to develop an accurate and robust system which can respond efficiently in case of an earthquake event to achieve a reliable method to keep people safe.
Author Contributions
Conceptualization, Y.-W.K. and S.C.; methodology, J.L. and Y.-W.K.; software, J.L.; validation, J.L. and I.K.; writing—original draft preparation, J.L.; writing—review and editing, I.K. and Y.-W.K.; supervision, Y.-W.K.; project administration, S.C. and Y.-W.K.; funding acquisition, Y.W.K.
Funding
This work was supported by National Disaster Management Research Institute (2019-09-02) and by by Basic Science Research Program through the National Research Foundation of Korea (NRF) grant funded by the Ministry of Education (NRF-2017R1C1B5075658).
Conflicts of Interest
The authors declare no conflict of interest.
References
- Gubbi, J.; Buyya, R.; Marusic, S.; Palaniswami, M. Internet of Things (IoT): A vision, architectural elements, and future directions. Future Gener. Comput. Syst. 2013, 29, 1645–1660. [Google Scholar] [CrossRef] [Green Version]
- Al-Fuqaha, A.; Guizani, M.; Mohammadi, M.; Aledhari, M.; Ayyash, M. Internet of things: A survey on enabling technologies, protocols, and applications. IEEE Commun. Surv. Tutor. 2015, 17, 2347–2376. [Google Scholar] [CrossRef]
- Komninos, N.; Philippou, E.; Pitsillides, A. Survey in smart grid and smart home security: Issues, challenges and countermeasures. IEEE Commun. Surv. Tutor. 2014, 16, 1933–1954. [Google Scholar] [CrossRef]
- Feng, G.; Mai, J.; Ban, Z.; Guo, X.; Wang, G. Floor pressure imaging for fall detection with fiber-optic sensors. IEEE Pervasive Comput. 2016, 15, 40–47. [Google Scholar] [CrossRef]
- Batista, M.A.; Gaglani, S.M. The future of smartphones in health care. AMA J. Ethics 2013, 15, 947–950. [Google Scholar]
- Schmitz Weiss, A. Exploring news apps and location-based services on the smartphone. J. Mass Commun. Q. 2013, 90, 435–456. [Google Scholar] [CrossRef]
- Available online: https://www.usgs.gov/faqs/why-are-we-having-so-many-earthquakes-has-naturally-occurring-earthquake-activity-been (accessed on 5 November 2019).
- Holzer, T.L.; Savage, J.C. Global earthquake fatalities and population. Earthq. Spectra 2013, 29, 155–175. [Google Scholar] [CrossRef]
- D’Alessandro, A.; Vitale, G.; Scudero, S.; D’Anna, R.; Costanza, A.; Fagiolini, A.; Greco, L. Characterization of MEMS accelerometer self-noise by means of PSD and Allan Variance analysis. In Proceedings of the 2017 7th IEEE International Workshop on Advances in Sensors and Interfaces (IWASI), Vieste, Italy, 15–16 June 2017; pp. 159–164. [Google Scholar]
- Kong, Q.; Allen, R.M.; Schreier, L.; Kwon, Y.W. MyShake: A smartphone seismic network for earthquake early warning and beyond. Sci. Adv. 2016, 2, e1501055. [Google Scholar] [CrossRef] [PubMed] [Green Version]
- Kong, Q.; Kwony, Y.W.; Schreierz, L.; Allen, S.; Allen, R.; Strauss, J. Smartphone-based networks for earthquake detection. In Proceedings of the 2015 15th International Conference on Innovations for Community Services (I4CS), Nuremberg, Germany, 8–10 July 2015; pp. 1–8. [Google Scholar]
- Kong, Q.; Lv, Q.; Allen, R.M. Earthquake Early Warning and Beyond: Systems Challenges in Smartphone-based Seismic Network. In Proceedings of the 20th International Workshop on Mobile Computing Systems and Applications, Santa Cruz, CA, USA, 27–28 February 2019; ACM: New York, NY, USA, 2019; pp. 57–62. [Google Scholar]
- Luetgert, J.; Oppenheimer, D.; Hamilton, J. The NetQuakes Project-Research-quality Seismic Data Transmitted via the Internet from Citizen-Hosted Instruments; AGU Fall Meeting Abstracts; AGU: Washington, DC, USA, 2010. [Google Scholar]
- Cochran, E.; Lawrence, J.; Christensen, C.; Chung, A. A novel strong-motion seismic network for community participation in earthquake monitoring. IEEE Instrum. Meas. Mag. 2009, 12, 8–15. [Google Scholar] [CrossRef]
- Clayton, R.W.; Heaton, T.; Chandy, M.; Krause, A.; Kohler, M.; Bunn, J.; Guy, R.; Olson, M.; Faulkner, M.; Cheng, M.; et al. Community seismic network. Ann. Geophys. 2012, 54. [Google Scholar] [CrossRef]
- Horiuchi, S.; Horiuchi, Y.; Yamamoto, S.; Nakamura, H.; Wu, C.; Rydelek, P.A.; Kachi, M. Home seismometer for earthquake early warning. Geophys. Res. Lett. 2009, 36. [Google Scholar] [CrossRef] [Green Version]
- D’Alessandro, A. Tiny accelerometers create Europe’s first urban seismic network. Eos 2016, 97. [Google Scholar] [CrossRef]
- Wu, Y.M. Progress on development of an earthquake early warning system using low-cost sensors. Pure Appl. Geophys. 2015, 172, 2343–2351. [Google Scholar] [CrossRef]
- Evans, J.; Allen, R.M.; Chung, A.; Cochran, E.; Guy, R.; Hellweg, M.; Lawrence, J. Performance of several low-cost accelerometers. Seismol. Res. Lett. 2014, 85, 147–158. [Google Scholar] [CrossRef]
- Rong, K.; Yoon, C.E.; Bergen, K.J.; Elezabi, H.; Bailis, P.; Levis, P.; Beroza, G.C. Locality-sensitive hashing for earthquake detection: A case study of scaling data-driven science. Proc. VLDB Endow. 2018, 11, 1674–1687. [Google Scholar] [CrossRef]
- Perol, T.; Gharbi, M.; Denolle, M. Convolutional neural network for earthquake detection and location. Sci. Adv. 2018, 4, e1700578. [Google Scholar] [CrossRef] [PubMed] [Green Version]
- Available online: https://www.analog.com/media/en/technical-documentation/data-sheets/adxl354_355.pdf (accessed on 5 November 2019).
- Available online: https://www.st.com/resource/en/datasheet/lis3dhh.pdf (accessed on 5 November 2019).
- Available online: https://www.invensense.com/wp-content/uploads/2015/02/PS-MPU-9250A-01-v1.1.pdf (accessed on 5 November 2019).
- Available online: https://www.nxp.com/docs/en/data-sheet/MMA8452Q.pdf (accessed on 5 November 2019).
- Bishop, C. Neural Networks for Pattern Recognition; Oxford University Press: New York, NY, USA, 1996. [Google Scholar]
- Hecht-Nielsen, R. Theory of the backpropagation neural network. In Neural Networks for Perception; Elsevier: Amsterdam, The Netherlands, 1992; pp. 65–93. [Google Scholar]
- Haykin, S.; Network, N. A comprehensive foundation. Neural Netw. 2004, 2, 41. [Google Scholar]
- Bottou, L. Large-scale machine learning with stochastic gradient descent. In Proceedings of COMPSTAT’2010; Springer: Berlin/Heidelberg, Germany, 2010; pp. 177–186. [Google Scholar]
- Hartigan, J.A.; Wong, M.A. Algorithm AS 136: A k-means clustering algorithm. J. R. Stat. Society. Ser. C Appl. Stat. 1979, 28, 100–108. [Google Scholar] [CrossRef]
- Powers, D.M. Evaluation: From Precision, Recall and F-Measure to ROC, Informedness, Markedness and Correlation; Flinders University: Adelaide, Australia, 2011. [Google Scholar]
- Fawcett, T. An introduction to ROC analysis. Pattern Recognit. Lett. 2006, 27, 861–874. [Google Scholar] [CrossRef]
- National Research Institute for Earth Science and Disaster Prevention. Available online: http://www.kyoshin.bosai.go.jp (accessed on 5 November 2019).
- Peer Ground Motion Database, Pacific Earthquake Engineering Research Center. Available online: https://ngawest2.berkeley.edu/ (accessed on 5 November 2019).
Figure 1.
The system overview.

Figure 2.
Noise test results of the four acceleration sensors.

Figure 3.
The developed earthquake alert device. (Left: Board, Right: Case).

Figure 4.
A flow chart to detect an earthquake.

Figure 5.
The Artificial Neural Network (ANN) model with three inputs with one hidden layer.

Figure 6.
Emergency procedures for earthquakes and applications using smart devices.

Figure 7.
Home automation scenario using the earthquake detector.

Figure 8.
The shake table experiment.

Figure 9.
Confusion matrix.

Figure 10.
Centroids of non-earthquake data.

Figure 11.
Earthquake detection results of Exp#1, 2017 Pohang earthquake (100% scale); From lefto to right; original data, ADXL355, LIS3DHH, MMA8452, MPU9250.
Figure 11.
Earthquake detection results of Exp#1, 2017 Pohang earthquake (100% scale); From lefto to right; original data, ADXL355, LIS3DHH, MMA8452, MPU9250.

Figure 12.
Earthquake detection results of Exp#3, 2017 Pohang earthquake (100% scale); From top left; original data, ADXL355, LIS3DHH, MMA8452, MPU9250.
Figure 12.
Earthquake detection results of Exp#3, 2017 Pohang earthquake (100% scale); From top left; original data, ADXL355, LIS3DHH, MMA8452, MPU9250.

Figure 13.
Earthquake detection results of Exp#5, 2017 Pohang earthquake (100% scale); From top left; original data, ADXL355, LIS3DHH, MMA8452, MPU9250.
Figure 13.
Earthquake detection results of Exp#5, 2017 Pohang earthquake (100% scale); From top left; original data, ADXL355, LIS3DHH, MMA8452, MPU9250.

Figure 14.
Original (reference) signals of Elcentro and Pohang, and corresponding sensors’ signals.

Figure 15.
Earthquake detection results, 2017 Pohang earthquake (50% scale); From top left; original data, ADXL355, LIS3DHH, MMA8452, MPU9250.
Figure 15.
Earthquake detection results, 2017 Pohang earthquake (50% scale); From top left; original data, ADXL355, LIS3DHH, MMA8452, MPU9250.


Table 1.
Specifications of the selected acceleration sensors.
| Feature | ADXL355 | LIS3DHH | MMA8452 | MPU9250 |
|---|---|---|---|---|
| Noise (g/) | 25 | 45 | 126 | 300 |
| Sensitivity (mg/digit) | 0.0039 | 0.076 | 9.76 | 0.061 |
| Data output (bit) | 20 | 16 | 12 | 16 |
| Scale (g) | 2.048 | 2.5 | 2 | 2 |
| Max. output (Hz) | 1000 | 1100 | 800 | 4000 |
| Price ($) | 50 | 10 | 3 | 3 |
Table 2.
Specifications of the selected MCU.
| HW Component | Specification |
|---|---|
| MCU | ARM Cortex M3 |
| Clock (MHz) | 84 |
| Memory (KB) | 96 |
| Network | Wi-Fi |
Table 3.
Intensity classification.
| Shaking Level | PGA |
|---|---|
| 1 | 0.02 g–0.16 g |
| 2 | 0.16 g–0.33 g |
| 3 | over 0.33 g |
Table 4.
Summary of the model 30% test performance with different window sizes and datasets.
| Exp. # | TP | TN | FP | FN | Accu: | Pre: | Rec: | F1 |
|---|---|---|---|---|---|---|---|---|
| Exp #1 | 282 | 258 | 12 | 18 | 92.94 | 91.86 | 94.63 | 93.22 |
| Exp #2 | 2353 | 2230 | 152 | 71 | 95.36 | 93.93 | 97.07 | 95.46 |
| Exp #3 | 534 | 551 | 40 | 17 | 95.01 | 93.03 | 96.91 | 94.93 |
| Exp #4 | 572 | 491 | 60 | 19 | 93.08 | 90.51 | 96.78 | 93.54 |
| Exp #5 | 289 | 265 | 25 | 32 | 90.67 | 92.04 | 90.03 | 91.02 |
© 2019 by the authors. Licensee MDPI, Basel, Switzerland. This article is an open access article distributed under the terms and conditions of the Creative Commons Attribution (CC BY) license (http://creativecommons.org/licenses/by/4.0/).
Share and Cite
MDPI and ACS Style
Lee, J.; Khan, I.; Choi, S.; Kwon, Y.-W. A Smart IoT Device for Detecting and Responding to Earthquakes. Electronics 2019, 8, 1546. https://0-doi-org.brum.beds.ac.uk/10.3390/electronics8121546
AMA Style
Lee J, Khan I, Choi S, Kwon Y-W. A Smart IoT Device for Detecting and Responding to Earthquakes. Electronics. 2019; 8(12):1546. https://0-doi-org.brum.beds.ac.uk/10.3390/electronics8121546
Chicago/Turabian StyleLee, Jangsoo, Irshad Khan, Seonhwa Choi, and Young-Woo Kwon. 2019. "A Smart IoT Device for Detecting and Responding to Earthquakes" Electronics 8, no. 12: 1546. https://0-doi-org.brum.beds.ac.uk/10.3390/electronics8121546
Note that from the first issue of 2016, this journal uses article numbers instead of page numbers. See further details here.