Machine Learning-Based Driving Style Identification of Truck Drivers in Open-Pit Mines

1
School of Energy and Mining Engineering, China University of Mining and Technology (Beijing), Beijing 100083, China
2
North China Institute of Science and Technology, Langfang 065201, China
*
Author to whom correspondence should be addressed.
Electronics 2020, 9(1), 19; https://0-doi-org.brum.beds.ac.uk/10.3390/electronics9010019
Submission received: 26 November 2019
/
Revised: 19 December 2019
/
Accepted: 22 December 2019
/
Published: 24 December 2019
(This article belongs to the Special Issue Intelligent Transportation Systems (ITS))
Abstract
:The significance in constructing a driving style identification model for open-pit mine truck drivers is to reduce diesel consumption and improve training. First, we developed a driving behavior and mining truck condition monitoring system for an open-pit mine. Under heavy-load and no-load conditions of a mining truck, based on the same experimental truck and haulage road, the data of driving behavior and truck status of different drivers were collected. The driving style characteristic parameters of mining trucks under heavy-load and no-load conditions were constructed through Pearson correlation analysis. Using a k-means clustering algorithm, driving style can be divided into three types: normal type, soft type, and aggressive type, and we verified the validity of this driving style classification with a box plot. On this basis, the parameters of random forest, k-nearest neighbor, support vector machine, and neural network models were optimized and the accuracy was compared through a cross-validation grid search, and then a driving style identification model based on the random forest method was finally proposed. Driving style parameter weight values were obtained based on the Gini coefficient. Last, the fuel consumption characteristics of different driving styles were calculated. The results show that the driving style identification models based on random forest can effectively identify different driving styles when the mining truck is operating under heavy load and no load, and the overall accuracy of the model is 95.39% and 90.74% respectively. The fuel consumption of the aggressive driving style was the largest and was 10% higher than the average fuel consumption. The research results provide data support and new ideas for operation training and fuel-saving driving of mining trucks in open-pit mines.
1. Introduction
With the advantages of high mobility, strong climbing ability, and a short construction period, mining trucks have been widely used in open-pit mines all over the world. At the same time, there are also problems of high fuel consumption and transportation costs. We take the open-pit mine of Inner Mongolia Xilingol Baiyinhua Coal Power Co., Ltd. (hereinafter referred to as Baiyinhua No. 2 mine) as an example. From 2016 to 2018, the annual diesel consumption of 24 mining trucks was 9734 t, 8322 t, and 8589 t respectively, with an average annual diesel consumption of 370 t per mining truck. Driving style refers to the relatively stable and habitual internal driving behavior tendencies formed by a driver in the long-term driving process, which can be generally divided into aggressive type, normal type, and soft type [1,2]. Research showed that the difference of energy consumption between soft drivers and radical drivers was about 30% under the same route and vehicle type. Even under the condition of low requirements for driver operation, the difference of energy consumption was as high as 17% [3,4].
Similarly, researchers have shown that the driving style of mining truck drivers in open-pit mines has a direct impact on fuel consumption, when considering the influence factors of mining truck fuel consumption, driving style cannot be ignored as an important indicator [5,6]. John et al. [7] constructed a virtual 24/7 driving style model of open-pit mining trucks, dividing the style of driver into aggressive, normal, and soft types, and simulated the fuel consumption under different driving styles. The results showed that the fuel consumption of aggressive, normal, and soft driving styles were 330 L/h, 300 L/h, and 295 L/h respectively under heavy-load conditions. Under no-load conditions of mining trucks, the fuel consumptions of aggressive, normal, and soft driving styles were 210 L/h, 186 L/h, and 170 L/h respectively. In addition, among a series of fuel-saving technologies, in which drivers can make decisions, the best fuel-saving effects can be as high as 25%, by changing the driving style [8]. Driving skill training could bring about 2–5% fuel-saving effects [9,10,11], and summarized references about the influence of driving style on fuel consumption (as shown in Table 1).
Marina Martinez et al. [12] pointed out that driving style played an important role in energy management and safe driving, and that using machine learning to identify driving styles and applying this to vehicle intelligent control has become the future development trend. Therefore, it is of great significance for driver training and fuel-saving driving to establish a high precision driving style identification model for open-pit mining truck drivers. At present, the research methods of driving style include questionnaire surveys and objective driving data analysis. Shinar et al. [13] showed that the identification effect of the questionnaire survey method was limited due to its strong subjectivity and lack of objective data support. Objective driving data analysis can be carried out on the basis of real vehicle roads or simulation test platforms, which use sensors to collect driving behavior data such as vehicle speed, throttle opening, and longitudinal acceleration [14,15]. This method is widely used due to the high data reliability and real reflection of driving style. With the development of data technology and modern communication technology, increasing amounts of driving behavior data can be collected, therefore, machine learning can be used to extract knowledge from the data.
Machine learning is divided into unsupervised learning and supervised learning, according to whether the data sample has labeled attributes [16]. Research based on machine learning applied to driving style classification can be roughly divided into the following three categories.
(1) Unsupervised machine learning algorithms: Researchers used the statistical values of speed and longitudinal acceleration as the driving style characteristic parameters, and extracted driving style characteristic parameters based on principal component analysis (PCA), and K-means, density-based spatial clustering of applications with noise (DBSCAN), and spectral cluster algorithms were used to cluster driving styles [14,15,17,18]. Han et al. [19] took speed and throttle opening as driving style characteristic parameters, and driving styles were classified by full Bayesian theory and kernel density estimation, compared with the traditional fuzzy logic (FL) method, and driving style identification accuracy was improved. Zhu et al. [20] proposed an unsupervised clustering method of driving style based on Kullback–Leibler (KL) divergence, where Gaussian mixture model (GMM) was used to represent the statistical distribution of the drivers’ real driving data, and driving style clustering was realized based on the similarity between different distributions.
(2) Supervised machine learning algorithms: Karginnova et al. [21] compared k-nearest neighbor (KNN), neural networks (NN), and random forests (RF) in terms of recognition performance, and found that random forest was suitable for short term real-time classification application scenarios. Bejani et al. [22] integrated KNN, support vector machines (SVM), multi-layer perceptron (MLP), and selected precision, recall, accuracy, f-scores as model evaluation indexes, and they were all greater than 92%. The overall effect was better than any classifier.
(3) Combined unsupervised and supervised algorithms: The authors in previous studies [23,24] adopted PCA to achieve a few comprehensive indicators through dimensionality reduction of driving behavior characteristic parameters, and then applied k-means or fuzzy c-means (FCM) to calibrate driving style data samples, and introduced supervised learning SVM algorithms to establish driver driving style identification models. The model identification accuracies were above 90%.
At present, research on driving behavior in open-pit mines focuses more on safety aspects such as truck collision prevention [25] and driver fatigue prevention [26]. Daily management of fuel consumption related to driving behavior and driving style is mainly restricted by administrative orders [27]. Supervise whether the driver carries out the operation or not is difficult, at the same time, the management basis is not sufficient, and the management effect is not obvious. We adopted objective driving data analysis, based on the same experimental truck and haulage road, sensors were used to collect the data of driving behavior and mining truck status, such as throttle opening, speed, longitudinal acceleration, position, etc., and we adopted k-means to classify the driving style for different drivers. On this basis, the parameters of random forest, k-nearest neighbor, support vector machine, and neural network models were optimized and the accuracy was compared through a cross-validation grid search, and the model with the best accuracy was selected and the driving style identification model was constructed for mining truck under the conditions of heavy load and no load. Finally, the fuel consumption characteristics under different driving styles were calculated.
2. Experimental Design and Data Preprocessing
The Baiyinhua No. 2 open-pit mine is in Baiyinhua energy and chemical park, Xilingol, Inner Mongolia. The approved production capacity is 17 million t/a, the rock stripping mainly adopts the shovel-truck discontinuous mining system, with four sets of excavators which are mainly used to extract rock from the blasting pile and load it into the mining truck. Meanwhile, there are 24 mining trucks, which are mainly used to transport the stripped rock.
2.1. Experimental Scene Design
To achieve the most realistic and reflective driving style data of mining truck drivers, it is necessary to plan the experimental truck, experimental time, experimental haulage road and other factors in advance, and try to reduce the interference of other factors on the driver’s driving behavior.
2.1.1. Selection of Experimental Time
The driving behavior data of different drivers were collected during normal operation times with good weather and sight distances, from 15 June 2019 to 3 July 2019. The normal operation time was from 09:00 to 16:00.
2.1.2. Experimental Scene Design
To avoid the influence of different haulage roads and driving conditions on driving behavior, an experimental truck is selected, and its haulage road is fixed in the experiment. Under the condition of heavy load, the mining truck transports stripped rock from the loading point to the unloading point of the dump site. Instead, under the condition of no load, the mining truck returns to the original loading point from the unloading point of the dump site, completing the operation cycle of loading-point loading–heavy-load driving—dumping-site unloading–returning to the original loading point. Through the same haulage road, under the condition of no load, different drivers are replaced every day to carry out normal transportation operations. In the process, the data of driving behavior and mining truck status is collected. Additionally, the driver’s salary is related to the number of mining truck operation cycles, under the premise of not exceeding the safe driving speed, drivers rely on their own experience and driving habits to carry out transportation operations at the maximum running speed.
2.1.3. Selection of Experimental Road
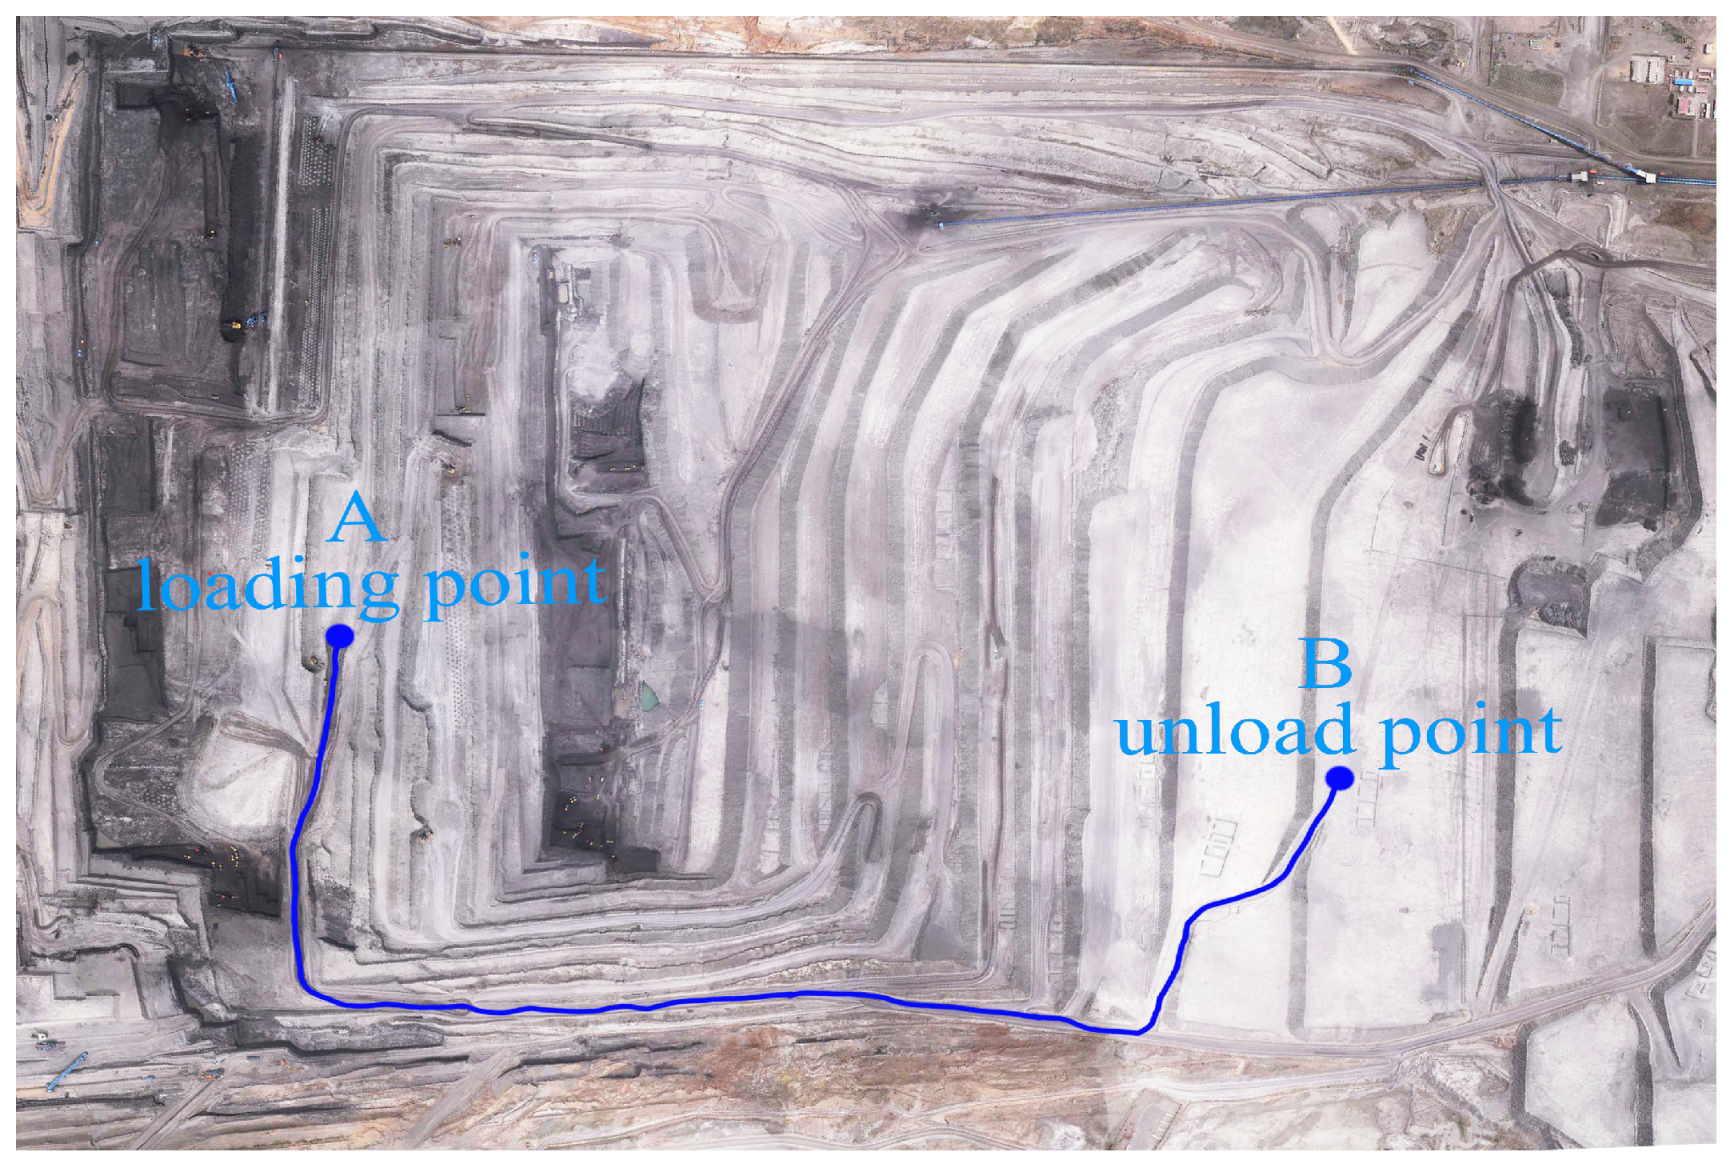
The Baiyinhua No. 2 open-pit mine has one inner dump haulage road and outer dump haulage road, respectively. Both are in the state of free-flow traffic, low speed, and low traffic flow. Compared with the inner dump haulage road, the outer dump haulage road has a longer transportation distance and higher lifting height, included more curved roads, straight roads, uphill roads, downhill roads, and so on. Therefore, the outer dump haulage road (as shown in Figure 1) was selected in this experiment, the transportation distance of the experimental haulage road was about 2.9 km, and the lifting height was about 105 m.
2.2. Design and Installation of Mining Truck Driving Behavior and Vehicle Condition Monitoring System
2.2.1. Selection of Experimental Truck
According to the maintenance history of mining trucks, the experiment selected a low failure rate mining truck, which was named No. 7, as the experimental truck. The main equipment parameters of this type of mining truck are shown in Table 2.
2.2.2. Driving Behavior and Mining Truck Condition Monitoring System Design
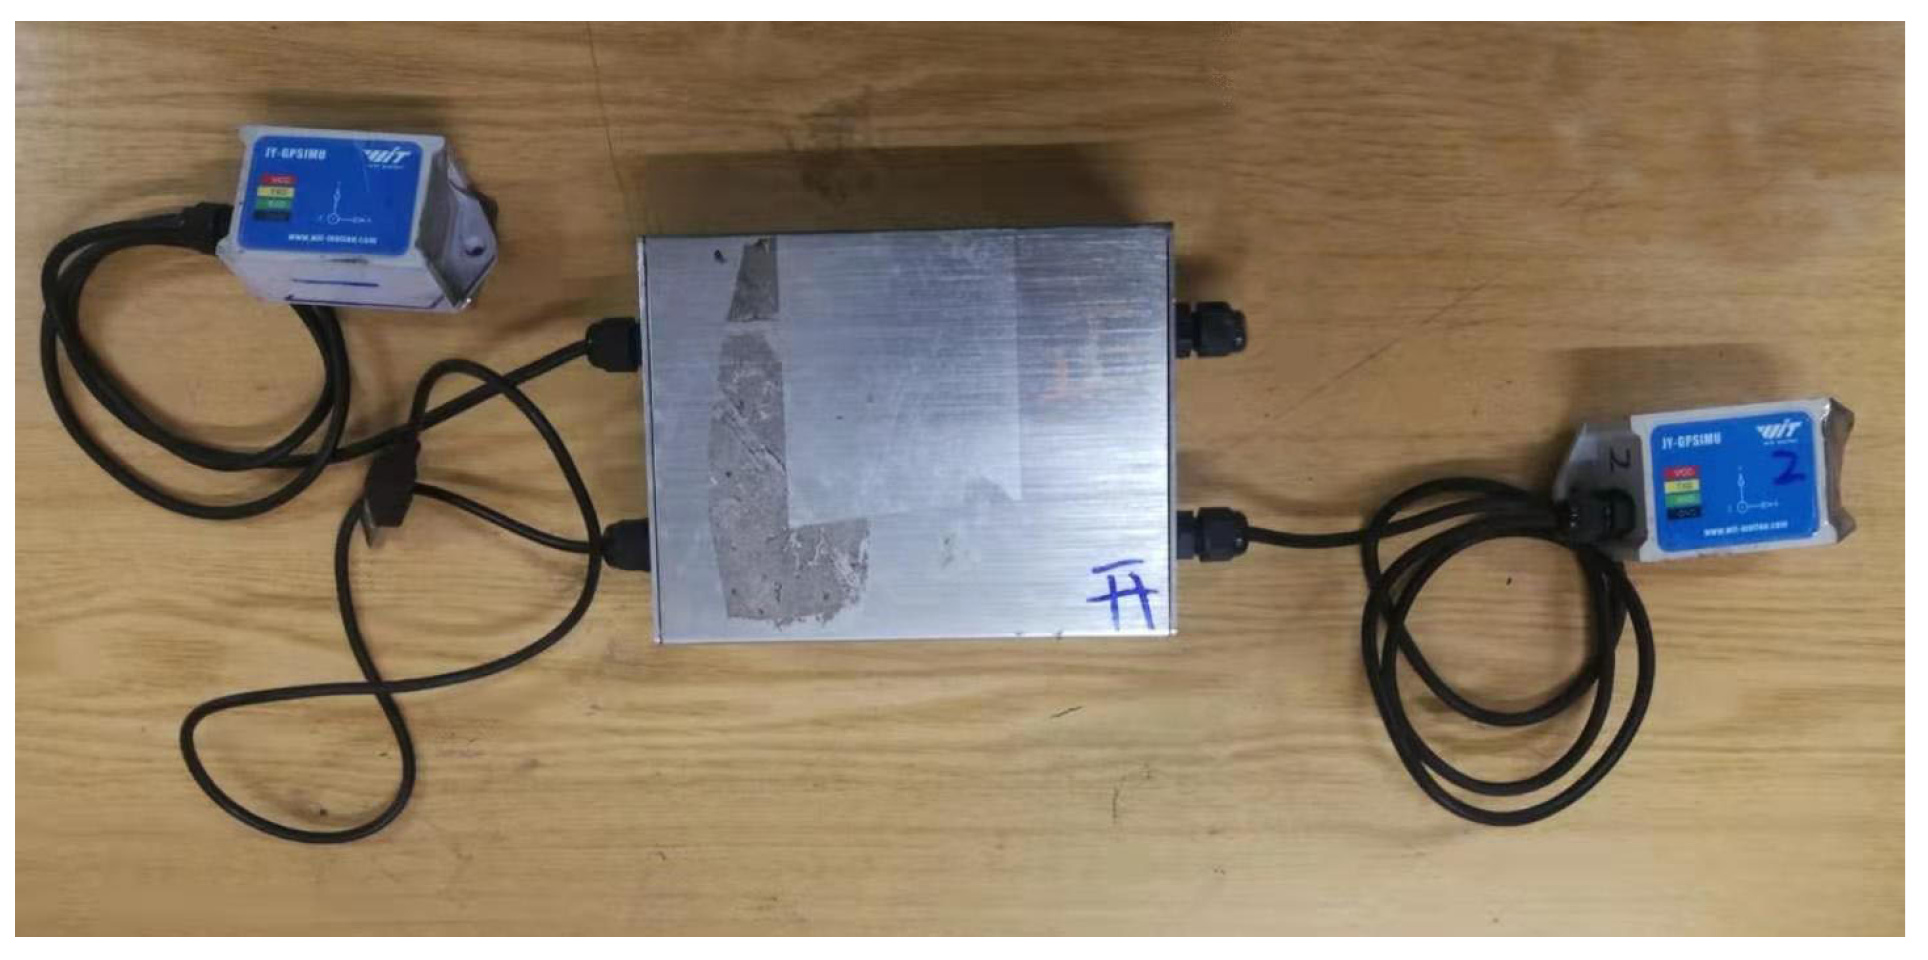
To collect the real-time data of the driver’s driving behavior and vehicle status of the mining truck under heavy-load and no-load conditions, a system of driving behavior and vehicle status monitoring, which was based on an inertial navigation sensor and Advanced RISC Machine (ARM) micro-controller (Figure 2), was designed. Due to the sampling distance, time needed for the maximum pedal opening and heavy load, the data acquisition frequency was set as 2 Hz in the inertial navigation sensor uniformly, the driving behavior sensor collected data such as throttle opening and throttle pedal angular velocity, while the vehicle status sensor collected data such as speed, longitudinal acceleration, slope gradient, and position. The ARM micro-controller was applied to receive the data collected by the sensors and store it in the SD card, realizing the perception and storage of driving behavior and vehicle state of the mining truck in the open-pit mine. In addition, the sensor time was calibrated in real time through navigation satellite timing.
The system hardware mainly includes one ARM micro-controller (STM32f103), two ten-axis inertial navigation sensors (WTGAHRS2), one SD memory card, one protective shell, and the vehicle DC power supply. The ten-axis inertial navigation sensor integrates a high precision gyroscope, accelerometer, GPS, and other modules to form an integrated navigation unit named GPS-IMU. This unit has the advantages of high precision, low cost, low power consumption, small size, and so on. It can measure acceleration, angular velocity, angle, velocity, and other parameters accurately. The specific performance parameters of the ten-axis inertial navigation sensor are shown in Table 3.
2.2.3. Driving Behavior and Vehicle Condition Monitoring System Installation
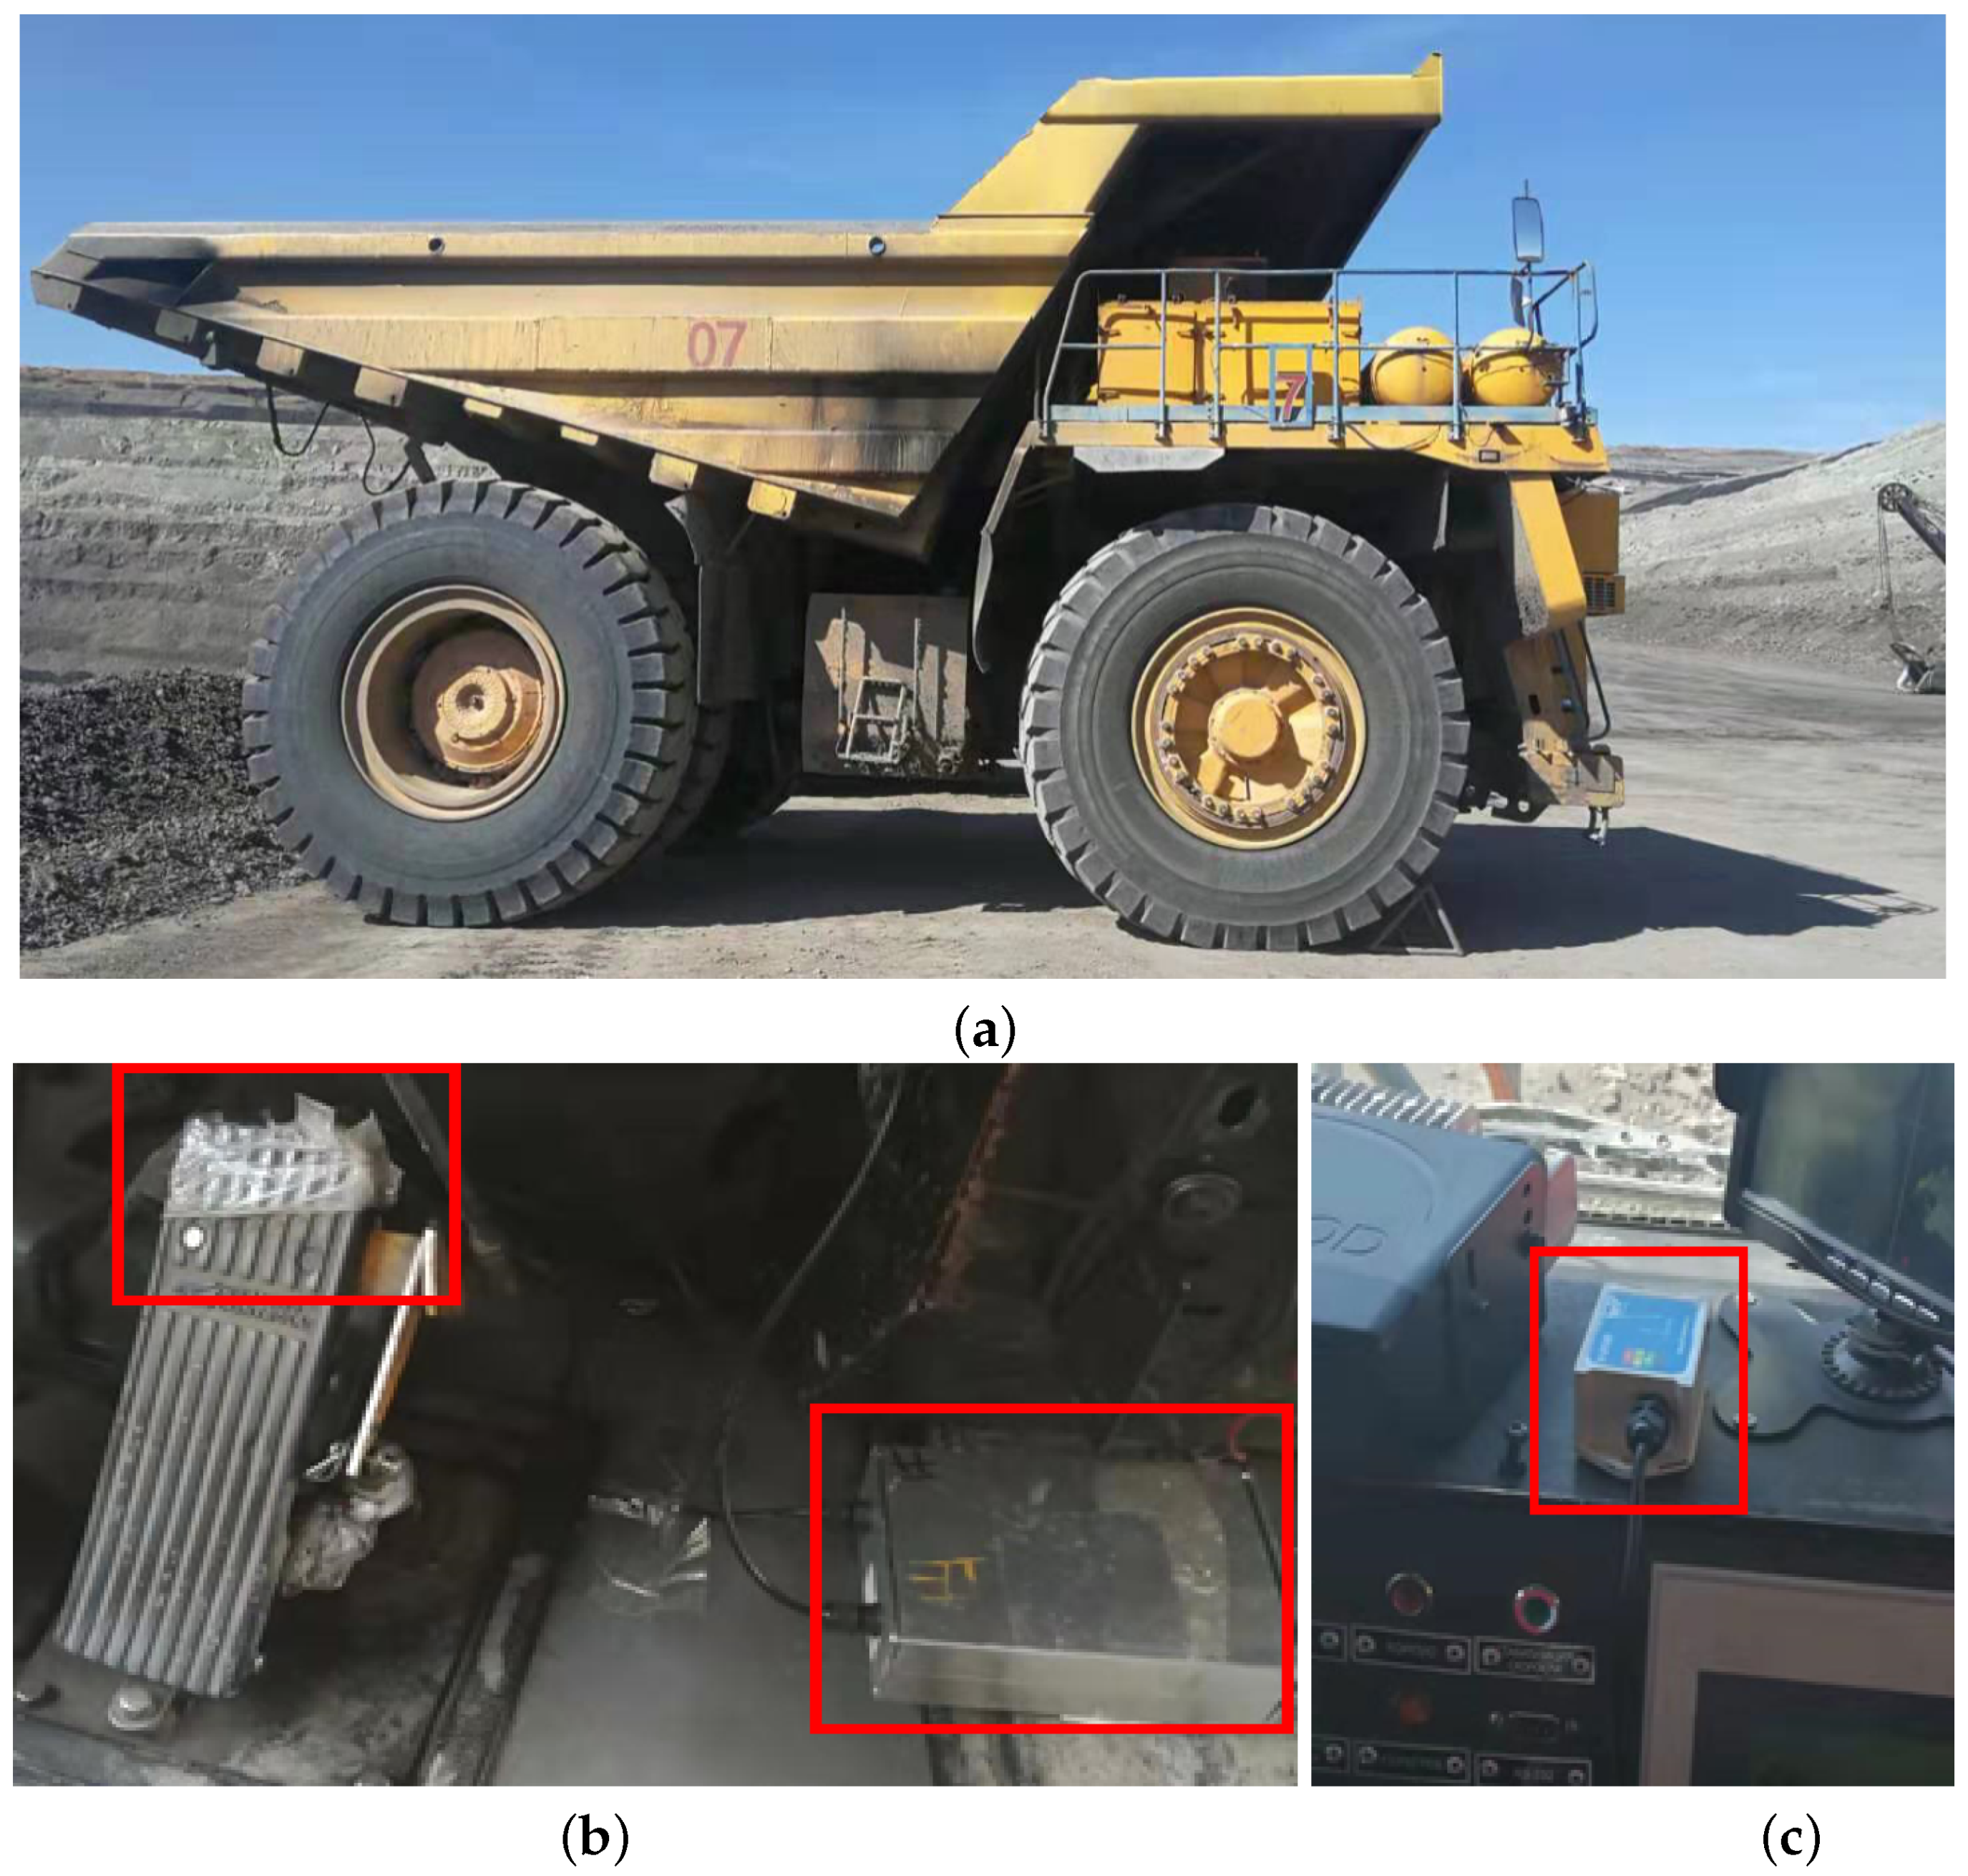
It was necessary to build a monitoring system of driving behavior and vehicle status in the cab of the mining truck before the experiment. The main work included the installation of the ten-axis inertial navigation sensor, the fixation of the protective shell and the external power supply, etc. During the installation, the No. 1 sensor was installed on the back of the throttle pedal along the X axis, while the No. 2 sensor was installed near the horizontal position in the cab along the Y axis. The installation diagram is shown in Figure 3. The installation of hardware did not cause safety hazards to the mining truck transportation operation, and the driver checked before each shift to ensure safe operation. Drivers were not informed about the purpose of the installed monitoring equipment, and all data collected was anonymous and was not linked back to any individual operators.
2.3. Tested Drivers Information
The Baiyinhua No. 2 open-pit mine considers the factor of safe operation of mining truck transportation, and so drivers need 1–3 years of professional driving skills training before they can work skillfully, therefore, all drivers can skillfully drive the mining truck for transportation. According to the sequence of daily driver scheduling, 11 male drivers’ natural driving data were collected in this experiment, the mental and physical state of the 11 drivers were normal. The essential information is shown in Table 4: the age range of drivers was between 30 to 50 years old, the average age was 38.2 years old, the driving experience range was between 3 to 10 years, the average driving experience was 8.6 years, and the education level was senior high school.
2.4. Data Processing of Driving Behavior
2.4.1. Raw Data of Driving Behavior
Based on the same experimental truck and haulage road, 11 drivers covered about 650 km in actual transportation operation. The parameters of driving behavior and vehicle status are shown in Table 5.
2.4.2. Driving Behavior Data Cleaning
Due to factors such as GPS signal occlusion and other electromagnetic interference, the sensor can output wrong and invalid driving behavior data, while data noise has a bad impact on the learning result of the machine learning algorithm. Therefore, driving behavior data should be processed before cluster analysis. The main processing contents include data extraction and data deletion, etc.
- Data extractionThe data collected by the No. 1 and No. 2 sensors was stored in the SD card separately, with the sensor number ID and time as the mark. The sensor data fusion program was developed using the Python programming language, which realized the splicing of data collected by two sensors at the same time, and provided complete driving behavior data for the subsequent data preprocessing.
- Data deletionThe data records with the speed of zero were eliminated, a speed of zero indicated that the mining truck was in a static state, while driving style recognition analysis was based on the dynamic transportation process. Records with a speed greater than 45 km/h were eliminated, the speed of mining truck has a set threshold, and the error caused by road bumps was considered. If the speed exceeded 45 km/h, this was considered to be abnormal data. Records with an acceleration greater than 0.55 m/s2 were deleted, the total weight and load of mining truck was about 230 t. Due to the heavy weight and load of mining truck, the longitudinal acceleration of the mining truck was limited to 0.55 m/s2.
2.4.3. Data Division of Driving Behavior Under Heavy-Load and No-Load Conditions
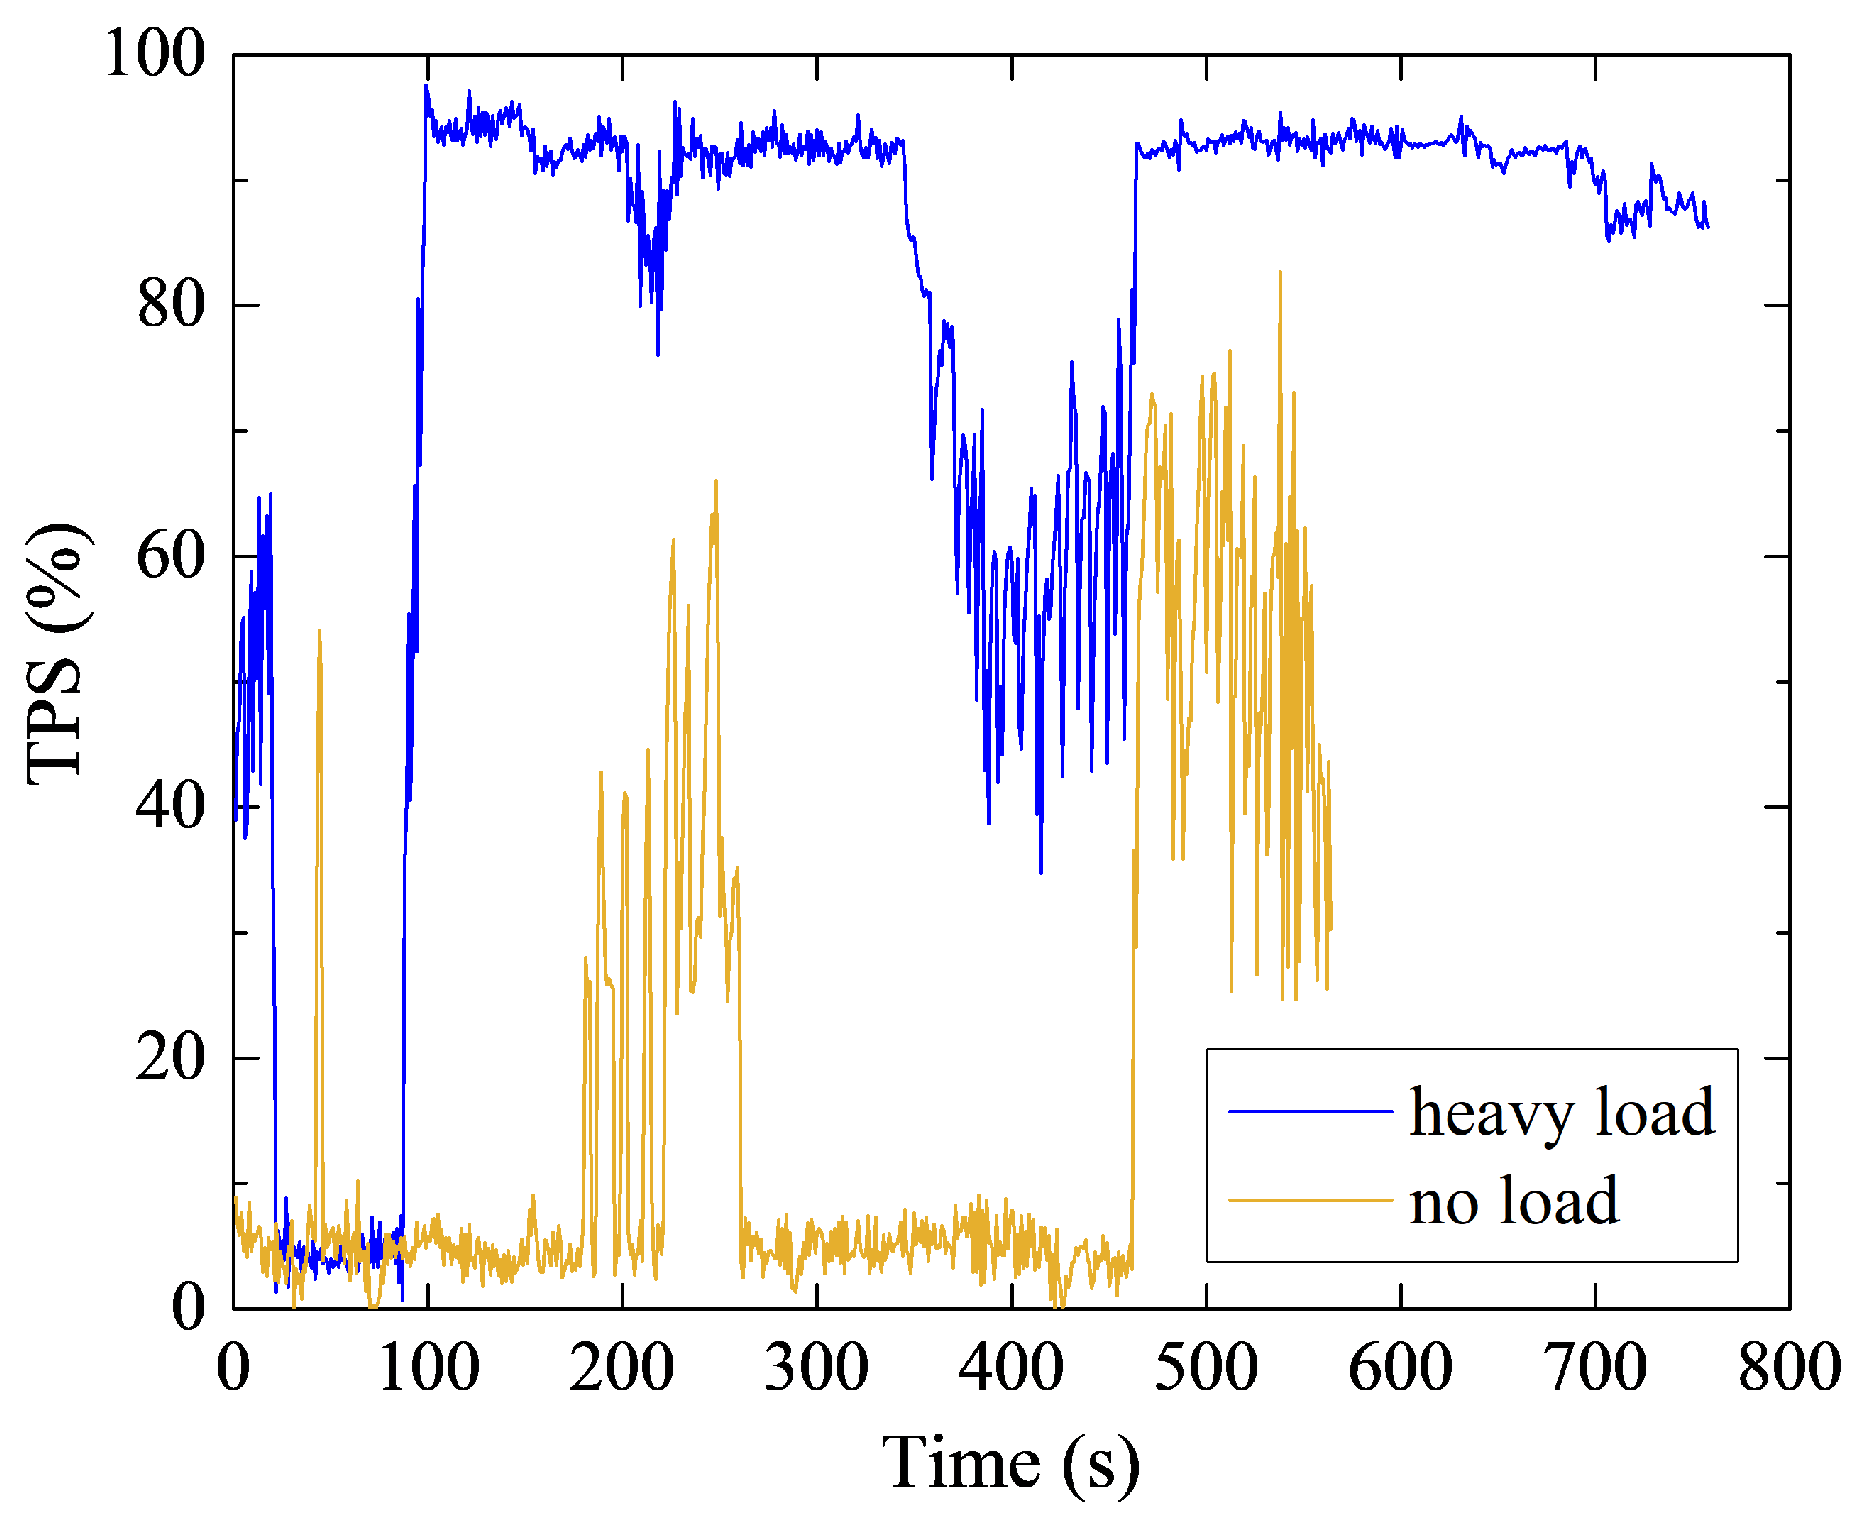
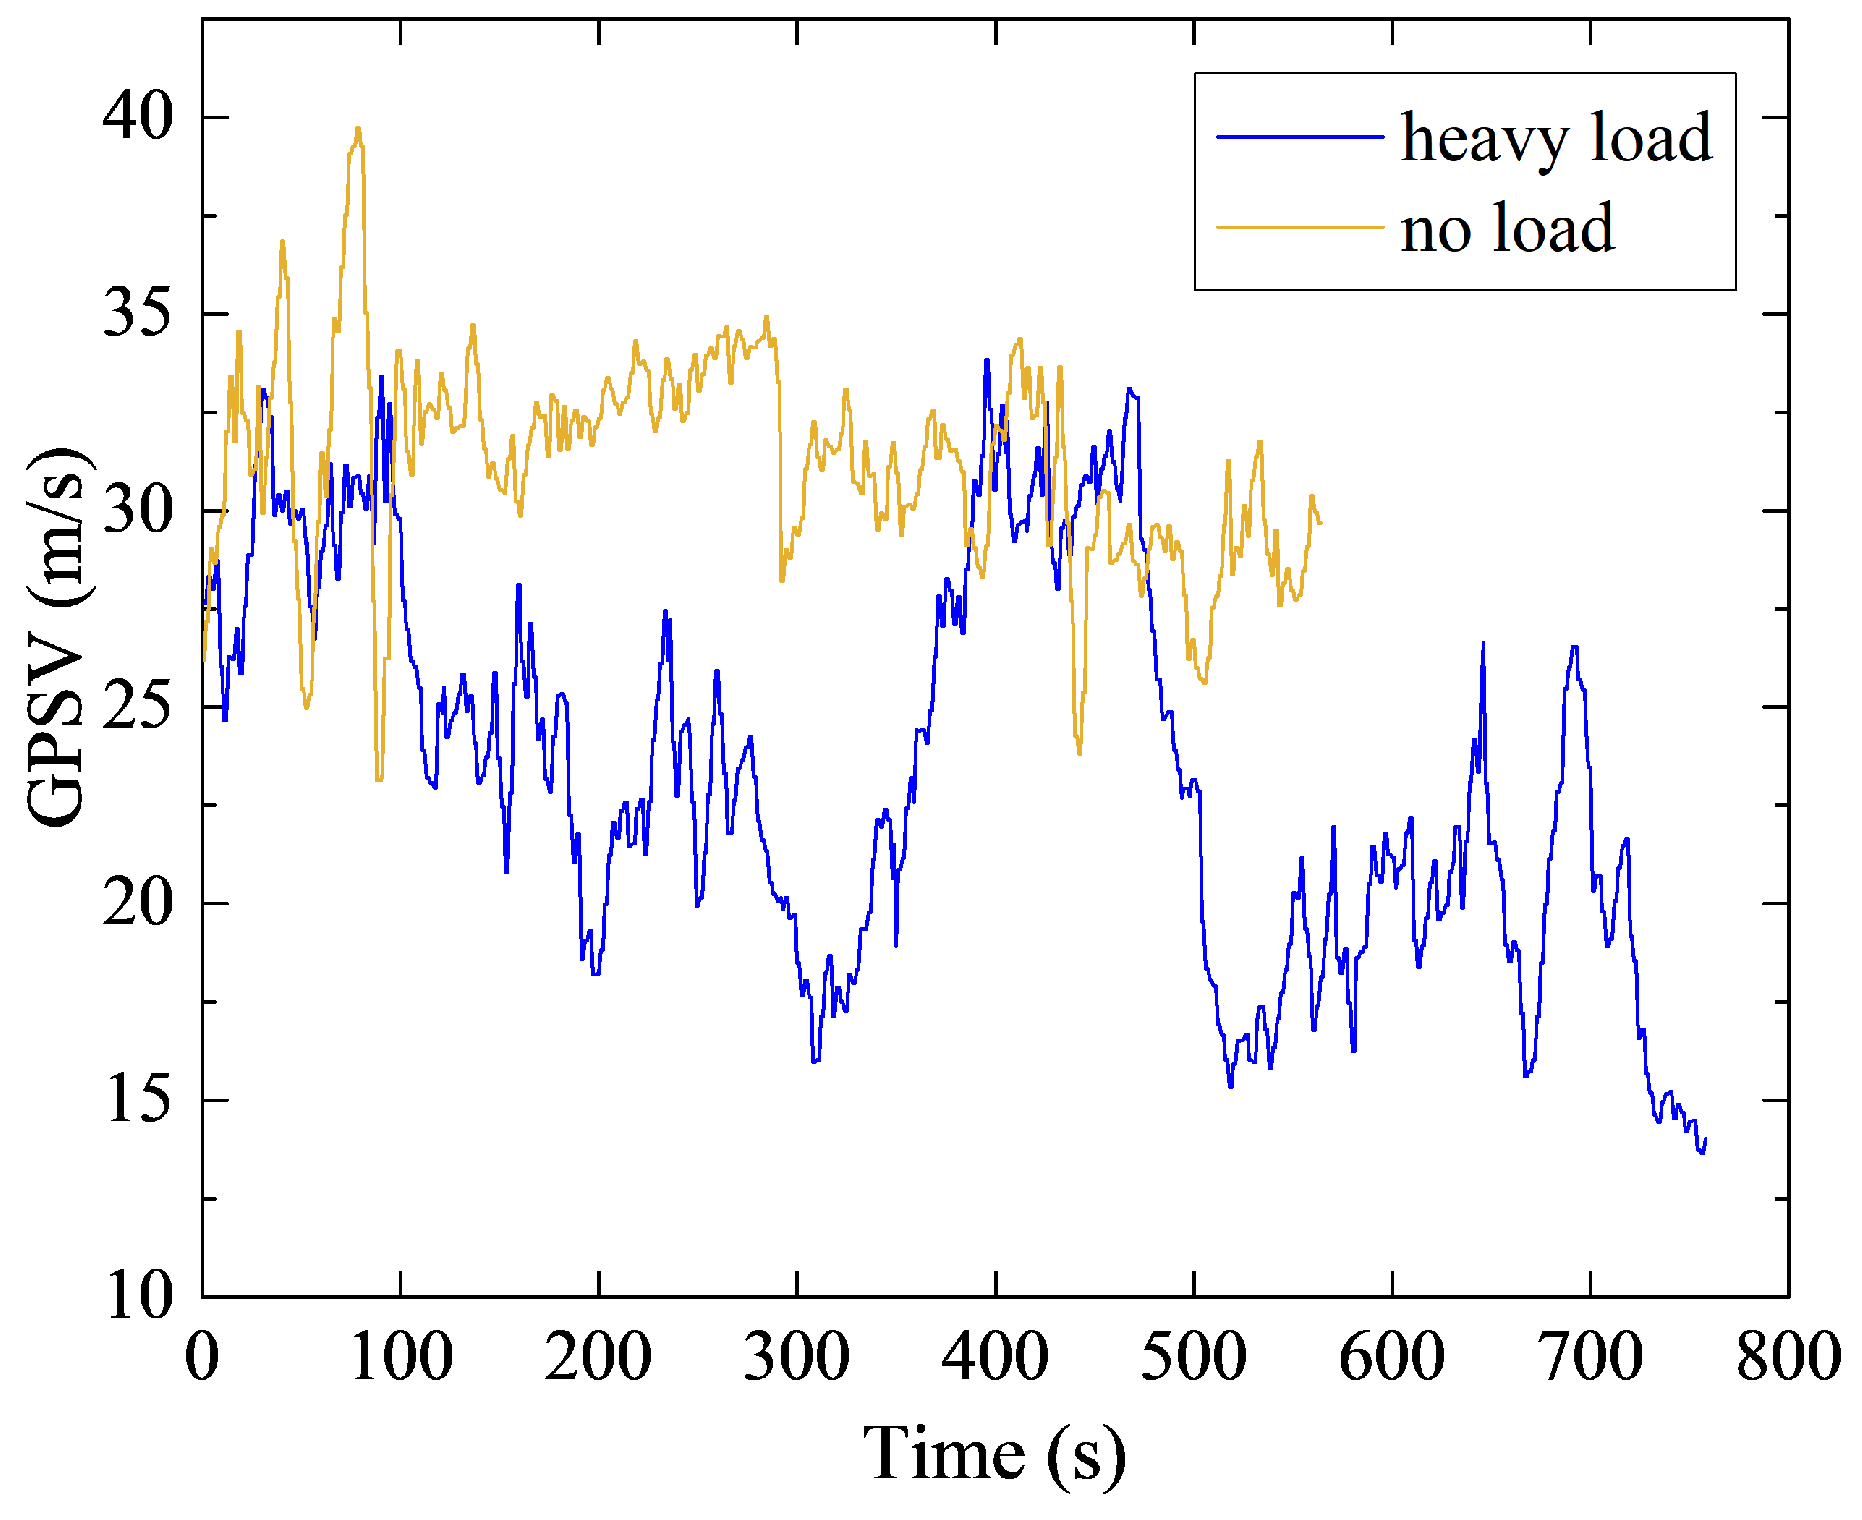
Under the conditions of heavy load and no load, there were great differences between throttle opening and vehicle speed (Figure 4 and Figure 5). TPS means throttle pedal opening. Therefore, the data collected in the process of transporting stripped rock from each loading point to the unloading point of the dump site were taken as the heavy-load sample unit. On the contrary, the data collected in the process of returning to the original loading point through the same haulage road from the unloading point were regarded as the no-load sample unit. This paper divided the 11 drivers’ natural driving behavior data into 111 heavy-load data samples and 108 no-load data samples.
3. Driving Style Classification and Recognition Based on Machine Learning
3.1. Selection of Driving Style Characteristic Parameters
3.1.1. Selection of Driving Style Characteristic Parameters for Mining Truck Drivers
To classify and identify the driving style of mining truck drivers in the open-pit mine, the characteristic parameters which can represent the driving style were determined first. Shi et al. [28] proposed that there was almost no difference in the size and range of brake pedal opening between soft and normal driving styles, while the size and range of throttle opening were significantly different in different driving styles, so the throttle opening was more suitable as a driving style characteristic parameter. Ma [29] summarized the driving style characteristic parameters that affect fuel consumption from the mechanism, mainly including speed, throttle opening, throttle opening change rate, etc. Some researchers took the statistical values (maximum, average, and standard deviation) of vehicle speed, throttle opening, and acceleration as characteristic parameters to classify driving styles [30,31].
In this research, the statistical values (maximum value, average value, and standard deviation) of throttle opening, throttle pedal angular velocity, speed, and longitudinal acceleration were selected to build driving style characteristic parameters. The main characteristic parameters are shown in Table 6:
3.1.2. Correlation Analysis of Driving Style Characteristic Parameters
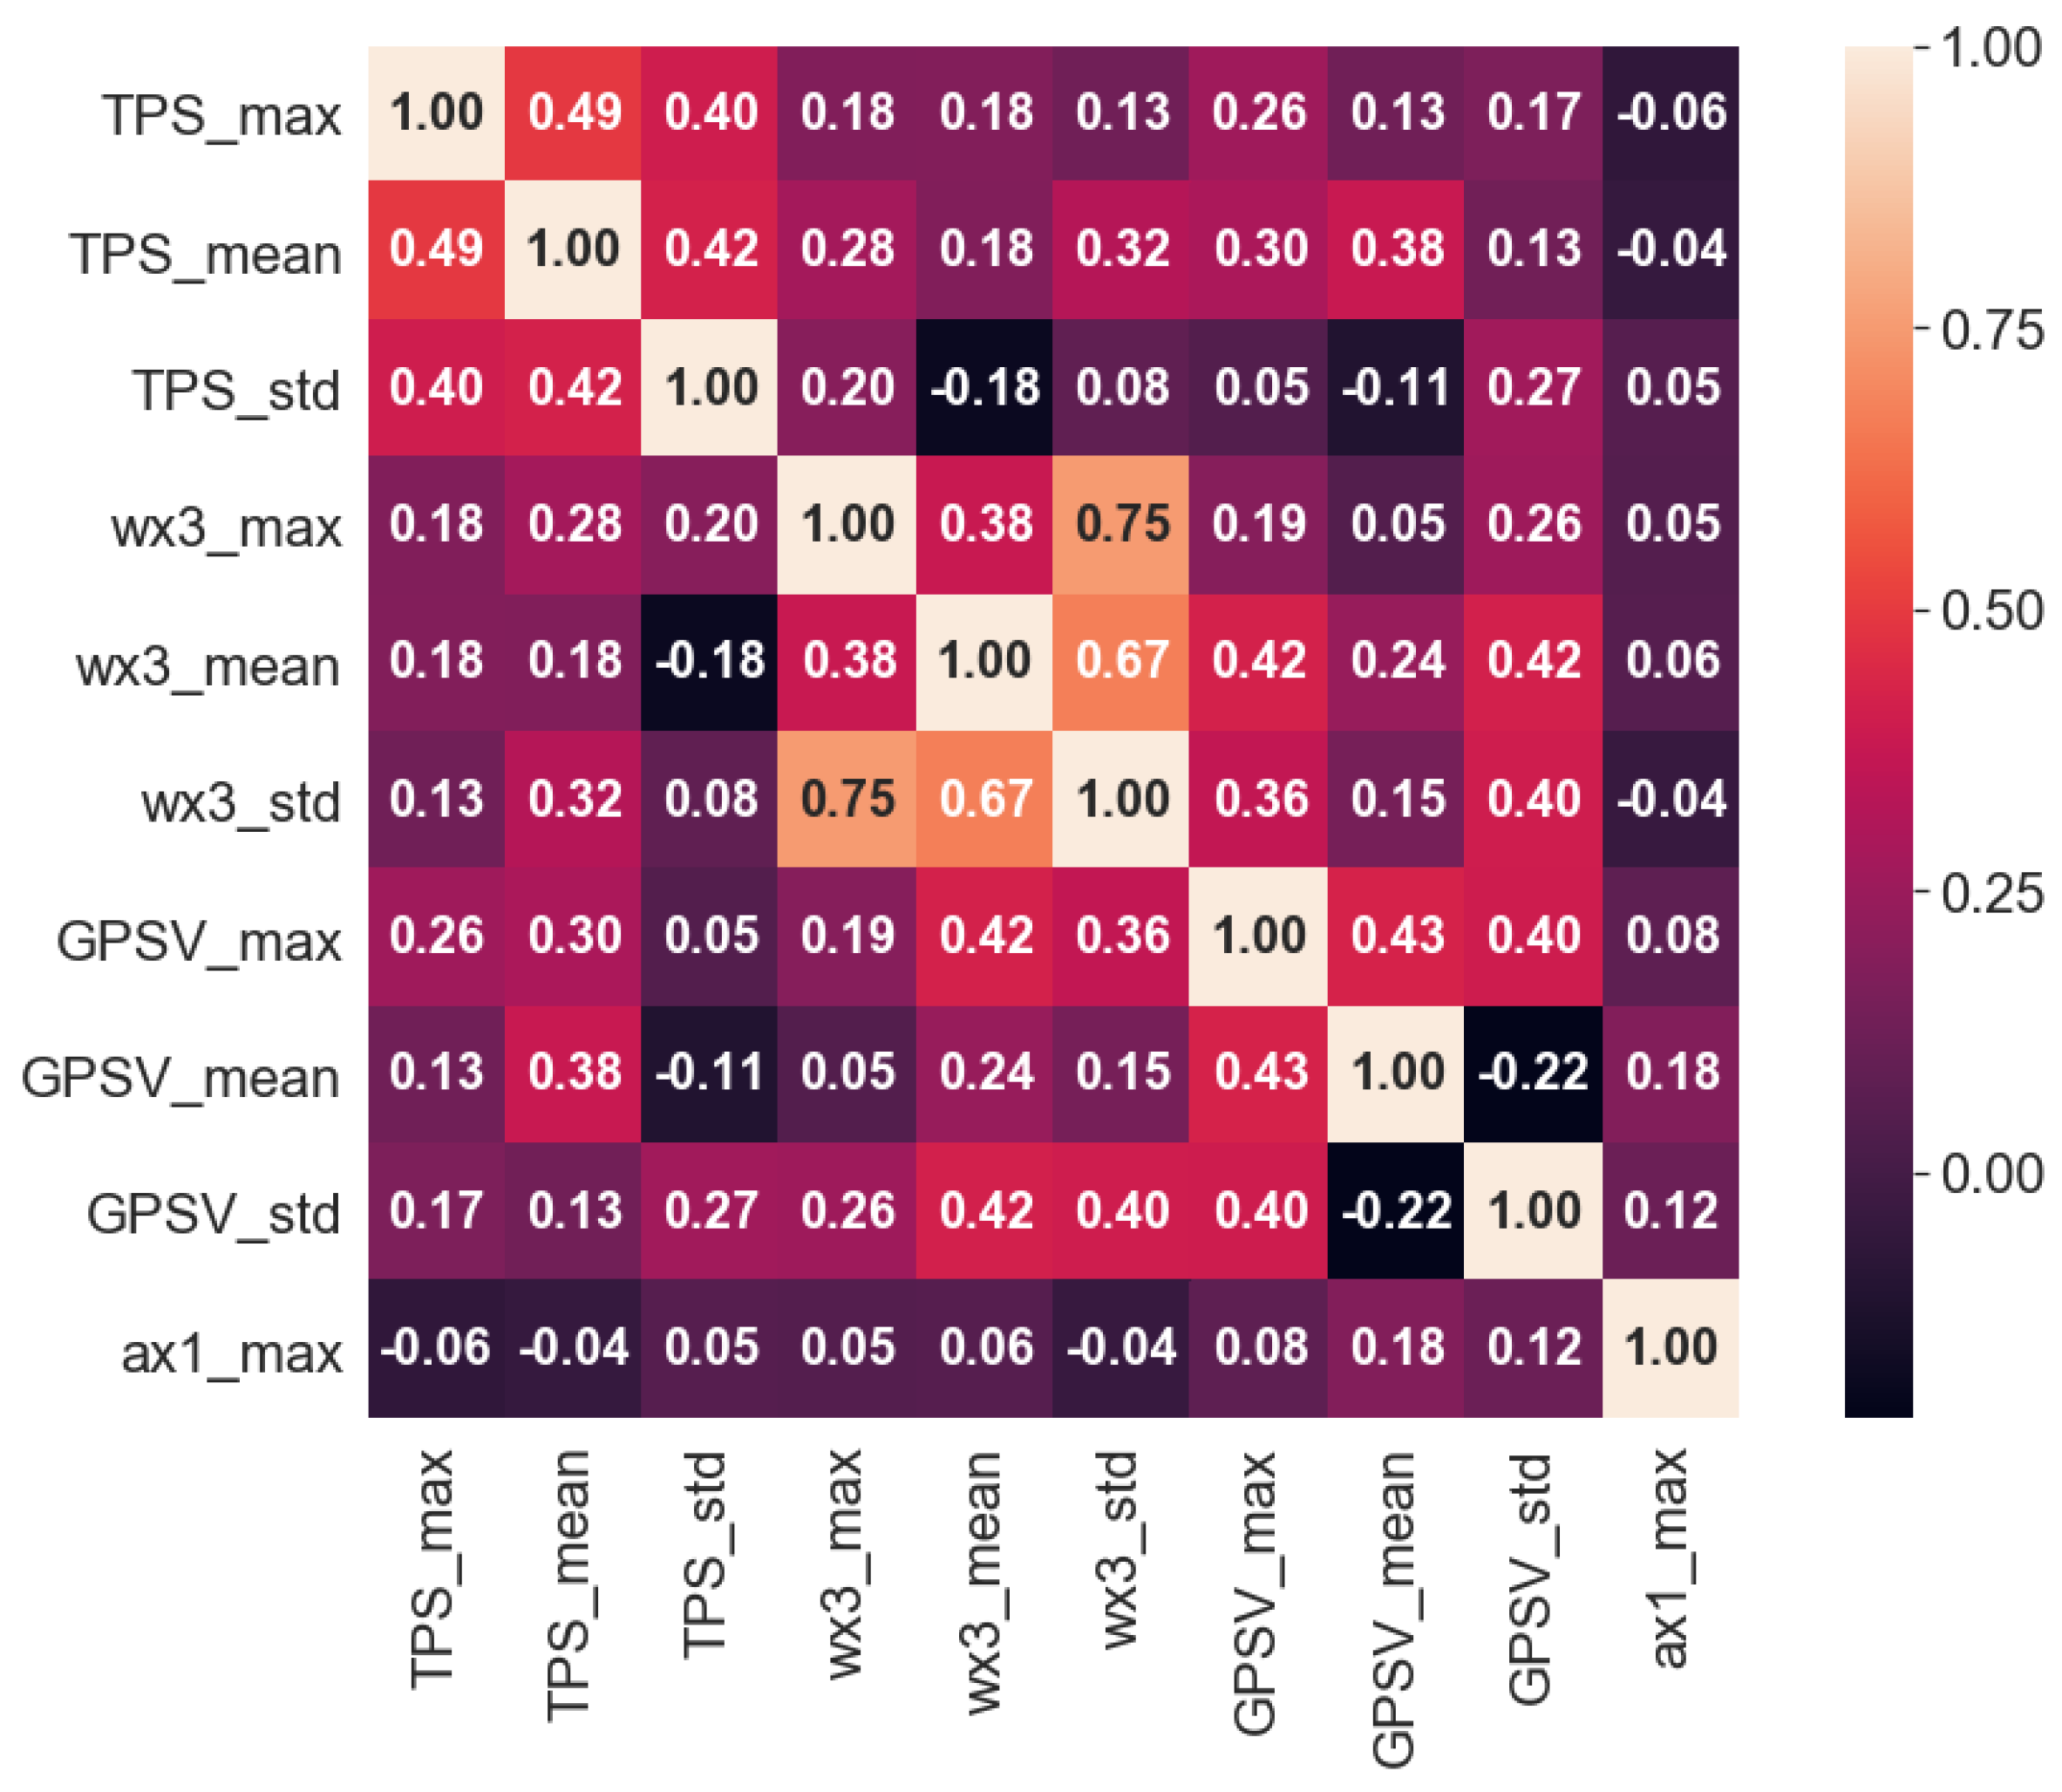
When there is multicollinearity between driving style feature parameters, the weight of relevant feature parameters in the Euclidean distance calculation is higher, which affects the accuracy of clustering. The Pearson correlation coefficient is used to measure the linear correlation between two variables, X and Y. Its definition is shown in Formula (1). The redundant characteristic parameters can be eliminated using the Pearson correlation coefficient [32]. The Pearson correlation coefficient ranges from −1 to 1, the larger the absolute value is, the stronger the correlation will be; if the absolute value is close to 0, the weaker the correlation will be. Generally, a correlation coefficient between 0.6–0.8 is strongly correlated, and between 0.8–1.0 is an extremely strong correlation. Therefore, when the correlation coefficient is greater than 0.8, redundant feature parameters can be removed to improve the accuracy of clustering results.
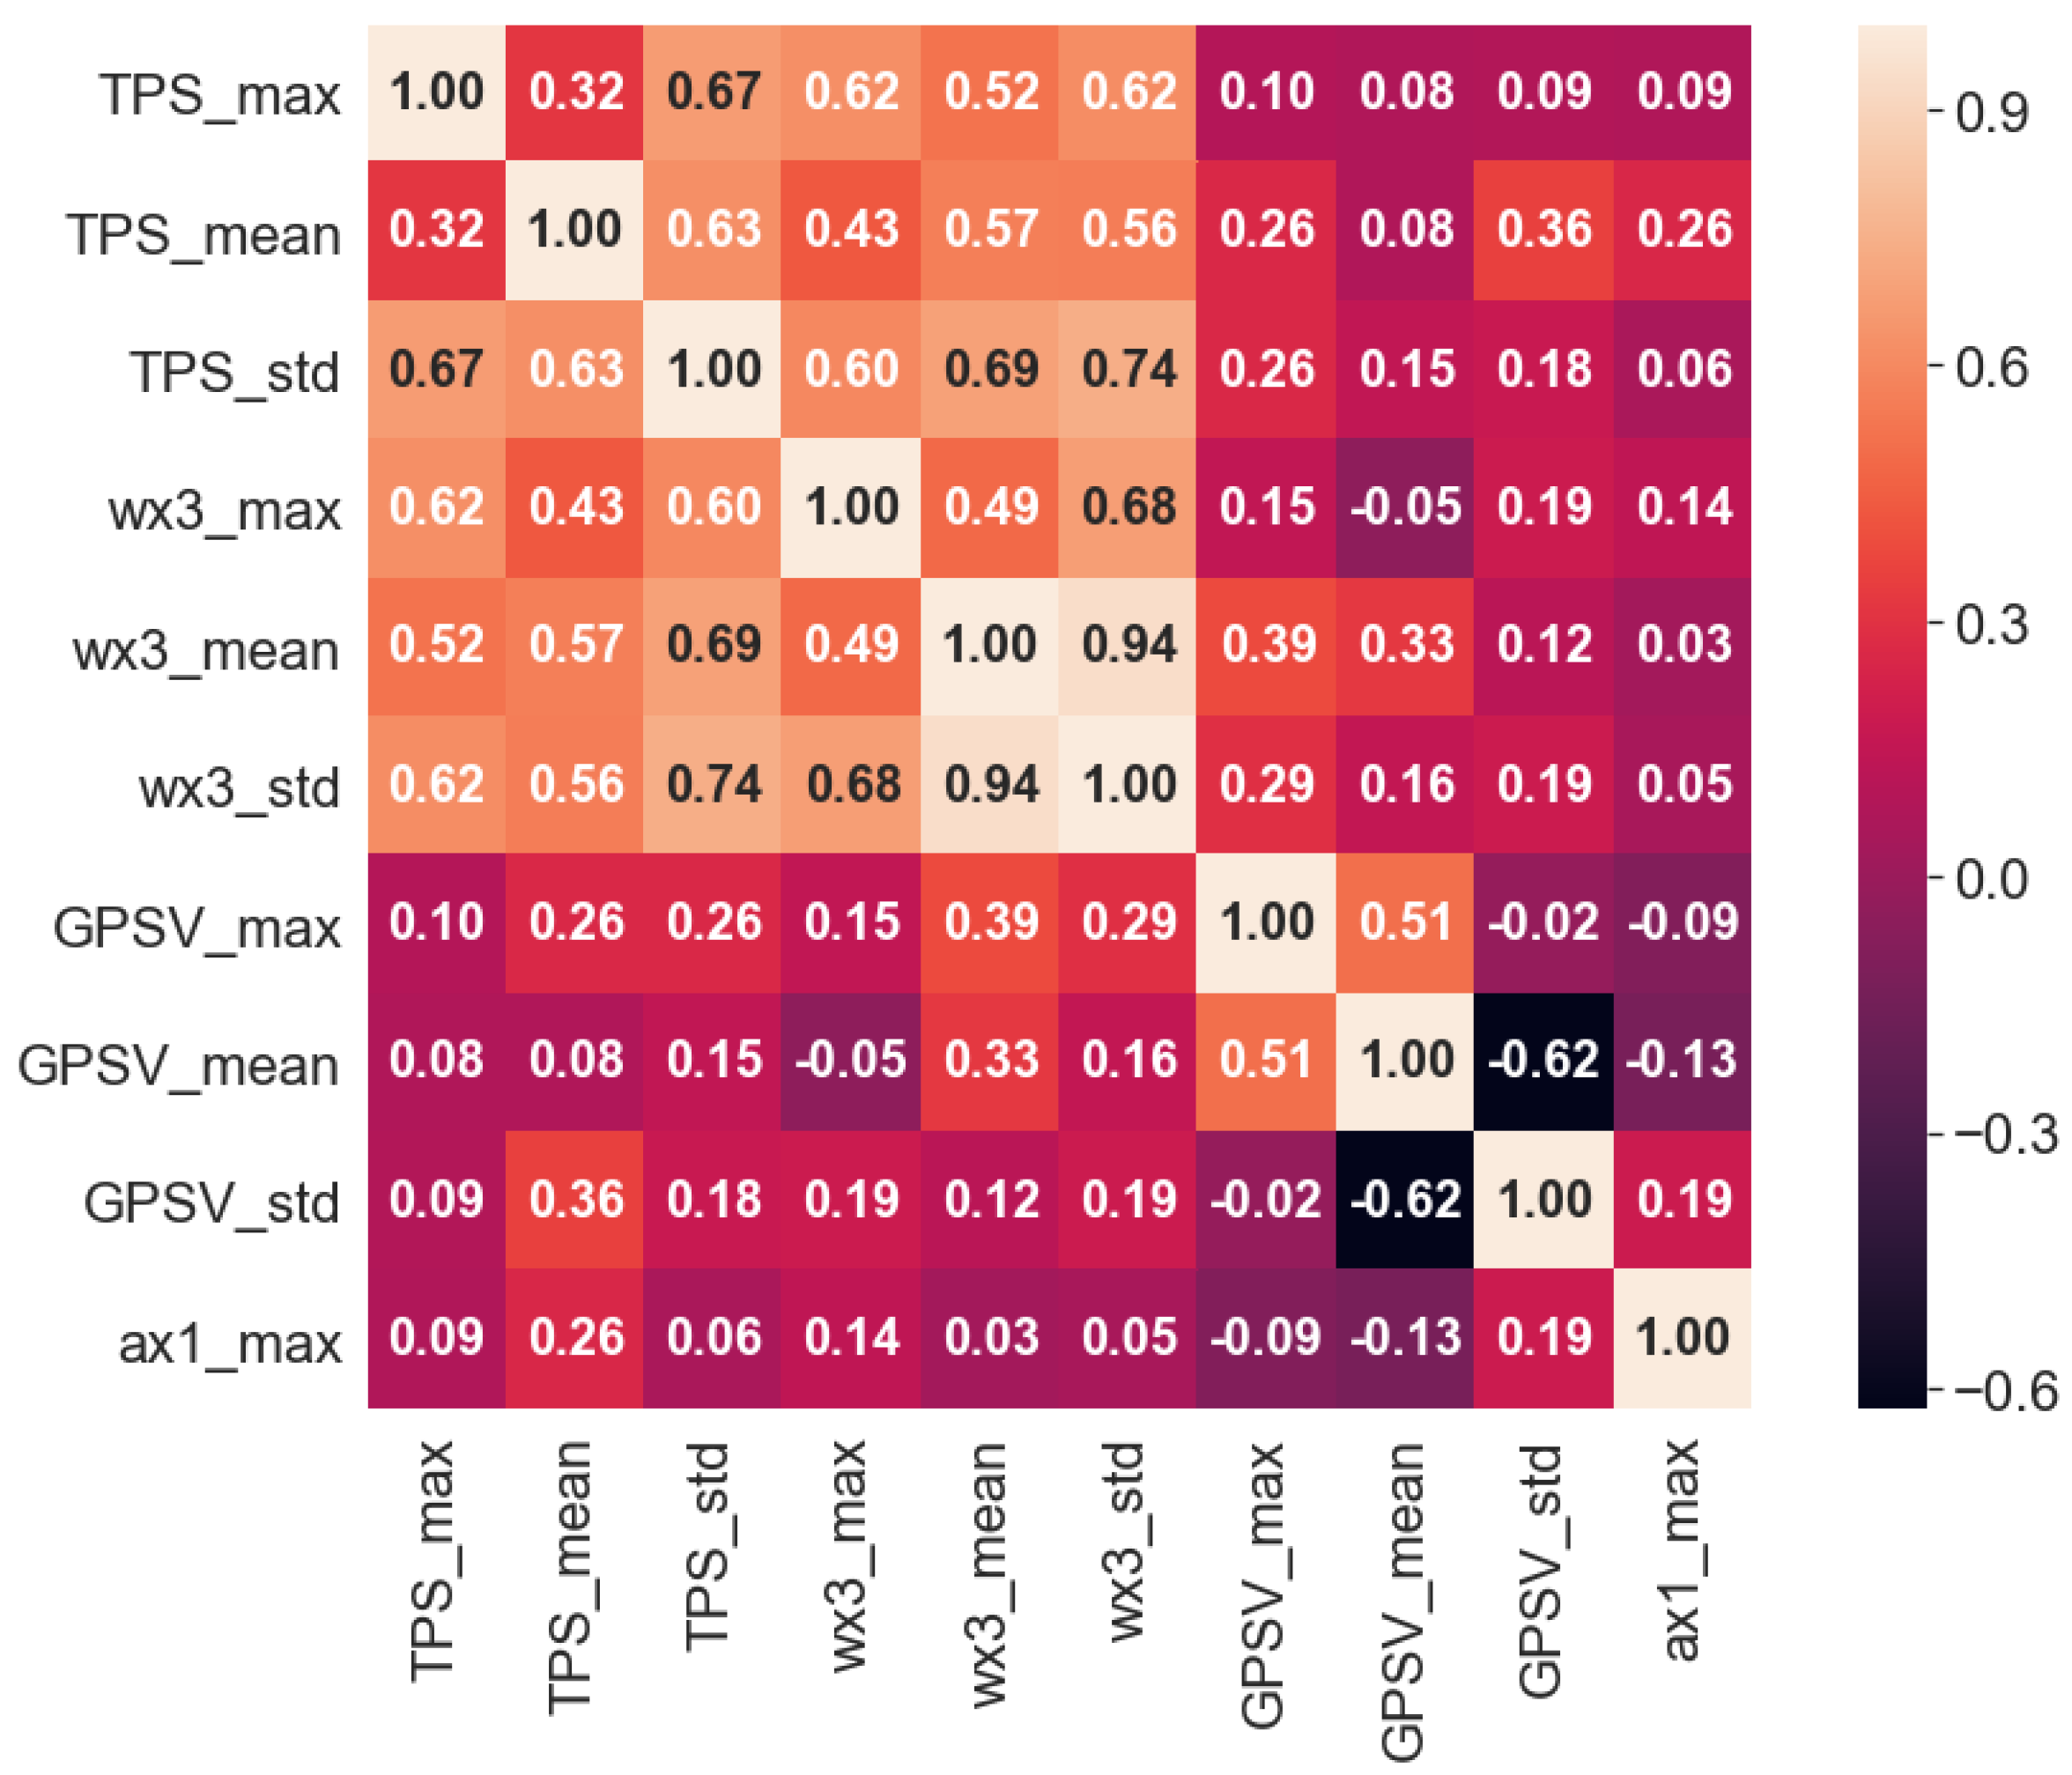
The Pearson correlation analysis was used to calculate the correlation heat map between driving style characteristic parameters. The correlation of each characteristic parameter under heavy-load condition was less than 0.8 (Figure 6), which indicated that each driving behavior characteristic parameter has strong independence. Under the condition of no-load, the correlation between the average value of angular velocity (wx3_mean) and standard deviation of angular velocity (wx3_std) was 0.94 (Figure 7), which indicated that there was a strong positive correlation between the two variables, the redundant variable wx3_mean could be eliminated and wx3_std could be retained. Therefore, under the condition of heavy load and no load, the numbers of characteristic parameters of driving style for mining truck drivers were ten and nine, respectively. The specific characteristic parameters are shown in Table 7.
3.2. Driving Style Classification
Unsupervised clustering analysis can classify data into different clusters without pre-defined categories, so that the similarity of samples in each cluster is greater than that in other clusters. The clustering results can be transferred to regression or classification and other supervised machine learning models for further data analysis. The driver’s driving style was unknown in actual transportation operations, and the clustering algorithm could be selected to classify the driving style.
This paper used the elbow rule to determine the number of driving style clustering centers, then the K-means clustering algorithm was applied to scientifically classify the driving style. A box plot was used to show the statistical distribution of different driving style characteristic parameters to verify the validity of the clustering results.
3.2.1. Clustering Algorithm
The commonly used clustering algorithms mainly include K-means, hierarchical clustering, fuzzy clustering, and DBSCN. K-means is superior to other algorithms in terms of operating efficiency and accuracy [33]. Therefore, this paper used K-means to classify driving styles.
The algorithm usually takes the sum of squares of errors in the cluster as the objective function for clustering, for the sample data of the same driving style, the error sum of squares within the cluster is small, which is highly similar and allocated to the same cluster. The sum of squares of errors in the clusters of different driving styles is large, and its similarity is low and allocated to different clusters. Samples in the driving behavior data set T can be represented by , which takes m driving behavior samples grouped into k categories, and the clustering centers are . The calculation Formulas (2) and (3) of the clustering center and error criterion function are as follows [16].
3.2.2. Selection of Driving Style Classification Number
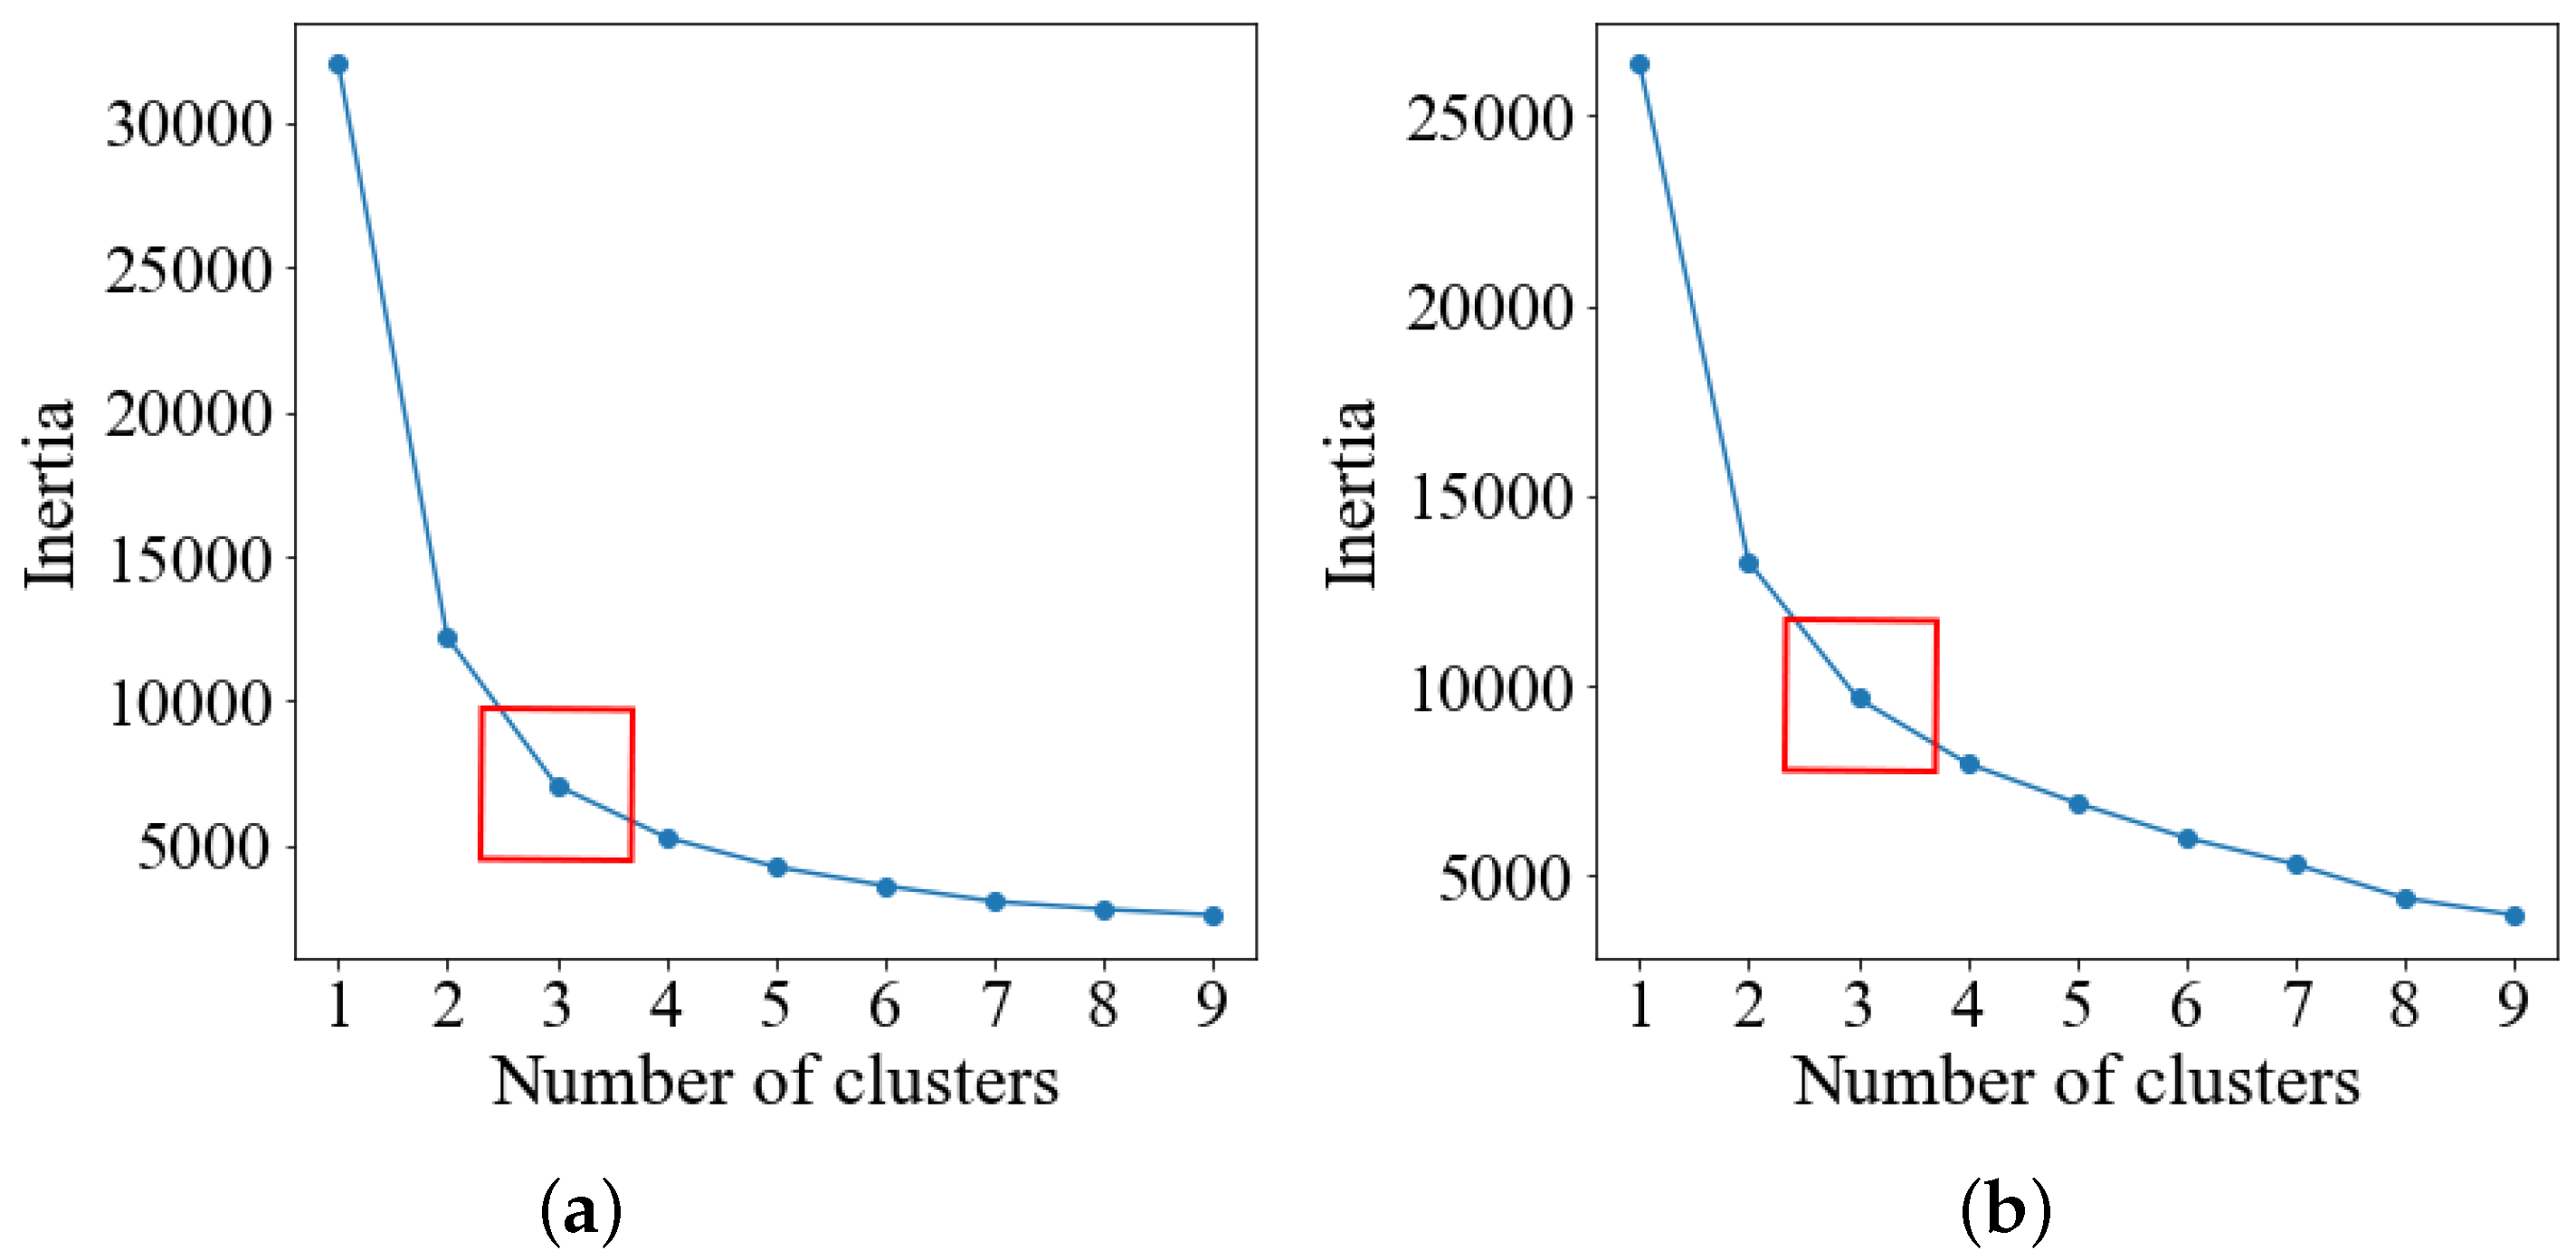
In this research, the elbow rule was used to determine the number of driving styles. Under the condition of heavy load and no load, the sum of squares of errors in the cluster decreased significantly and then slowly when the numbers of clustering centers were three (Figure 8). Therefore, both the number of clustering centers of driving styles were three under the conditions of heavy load and no load.
3.2.3. Analysis of Driving Style Clustering Results
Based on the K-means algorithm provided by Scikit-learn, the driving behavior data sets under heavy load and no load were fitted to realize the cluster analysis of driving styles, parameters such as the number of clustering centers three and maximum number of iterations 100 were set for unsupervised clustering analysis. The clustering results are shown in Table 10 and Table 11.
Chen et al. [34] showed that the aggressive driving style has a larger throttle opening, throttle pedal change rate, and speed; the normal driving style has a moderate throttle opening, throttle pedal change rate, and speed; while the soft driving style has a smaller throttle opening, throttle pedal change rate, and speed. Under no-load conditions of the mining truck, the clustering centers of characteristic parameters related to throttle pedal opening, throttle pedal angular velocity, and speed in cluster2 were the largest, and the clustering centers of characteristic parameters related to throttle opening, throttle pedal angular velocity, and speed in cluster1 were the smallest. In this research, the characteristic parameters of different driving styles have similar distribution rules (as shown in Table 10). Therefore, under no-load conditions of the mining truck, driving style could be divided into three categories: normal (cluster0), soft (cluster1), and aggressive (cluster2). Similarly, under heavy-load conditions of the mining truck, the distribution rules of characteristic parameters related to throttle pedal angular velocity and speed were relatively obvious. According to the distribution rules of characteristic parameters related to throttle pedal angular velocity and speed (as shown in Table 11), driving style could also be divided into three categories: normal (cluster2), soft (cluster0), and aggressive (cluster1).
3.2.4. Verification of Driving Style Clustering Results
Liu et al. [23] identified the driving style of drivers based on the method of subjective evaluation by experts, and showed the statistical distribution rules of characteristic parameters of different driving styles using a box plot. For example, the median and upper quartile of throttle opening for the aggressive driving style were larger than those of normal and soft driving styles, while the throttle opening of the soft driving style was more distributed in the lower position. Therefore, a box plot can be used to show the statistical distribution of characteristic parameters of normal, soft, and aggressive driving styles, to verify the correctness of clustering results.
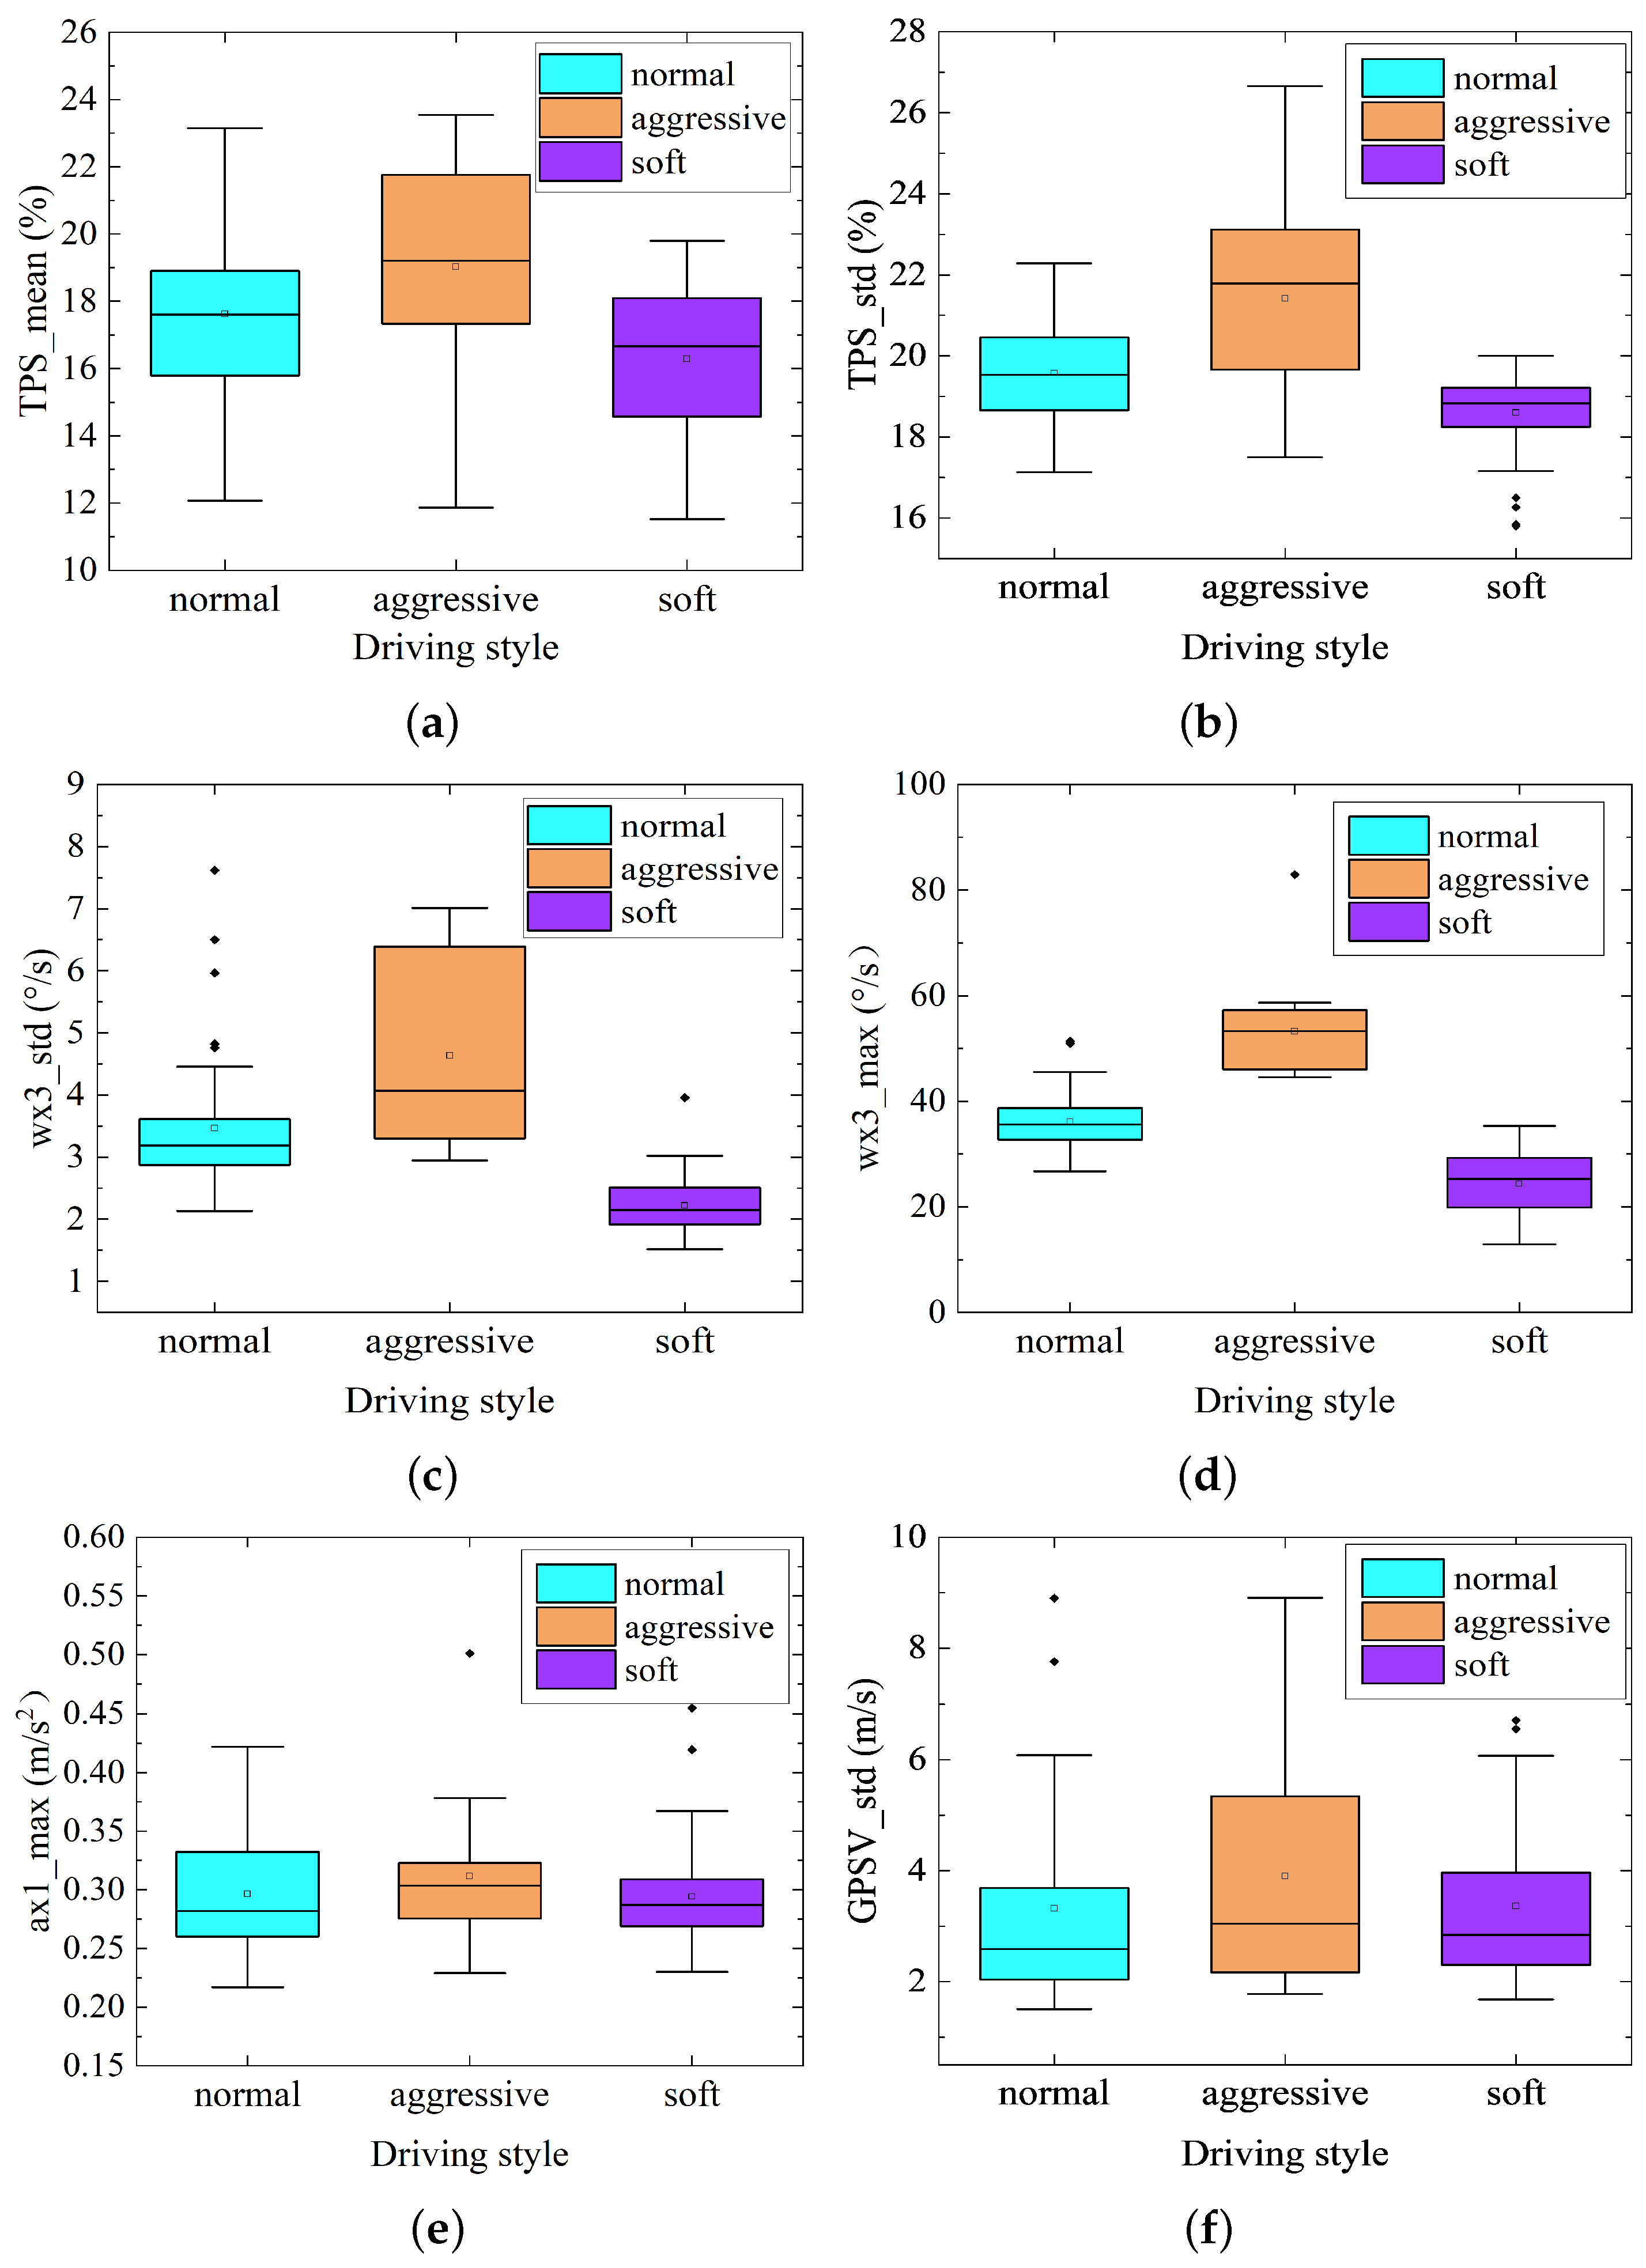
According to the box plot of driving style characteristic parameters under no-load conditions (Figure 9), it can be known that the median and upper quartile of characteristic parameters of throttle pedal opening and angular velocity of the aggressive driving style were greater than the other two driving styles, while the median and upper quartile of characteristic parameters of throttle pedal opening and angular velocity of the soft driving style were smaller than the other two driving styles. Meanwhile, the standard deviation of velocity and maximum longitudinal acceleration also have similar distribution rules.
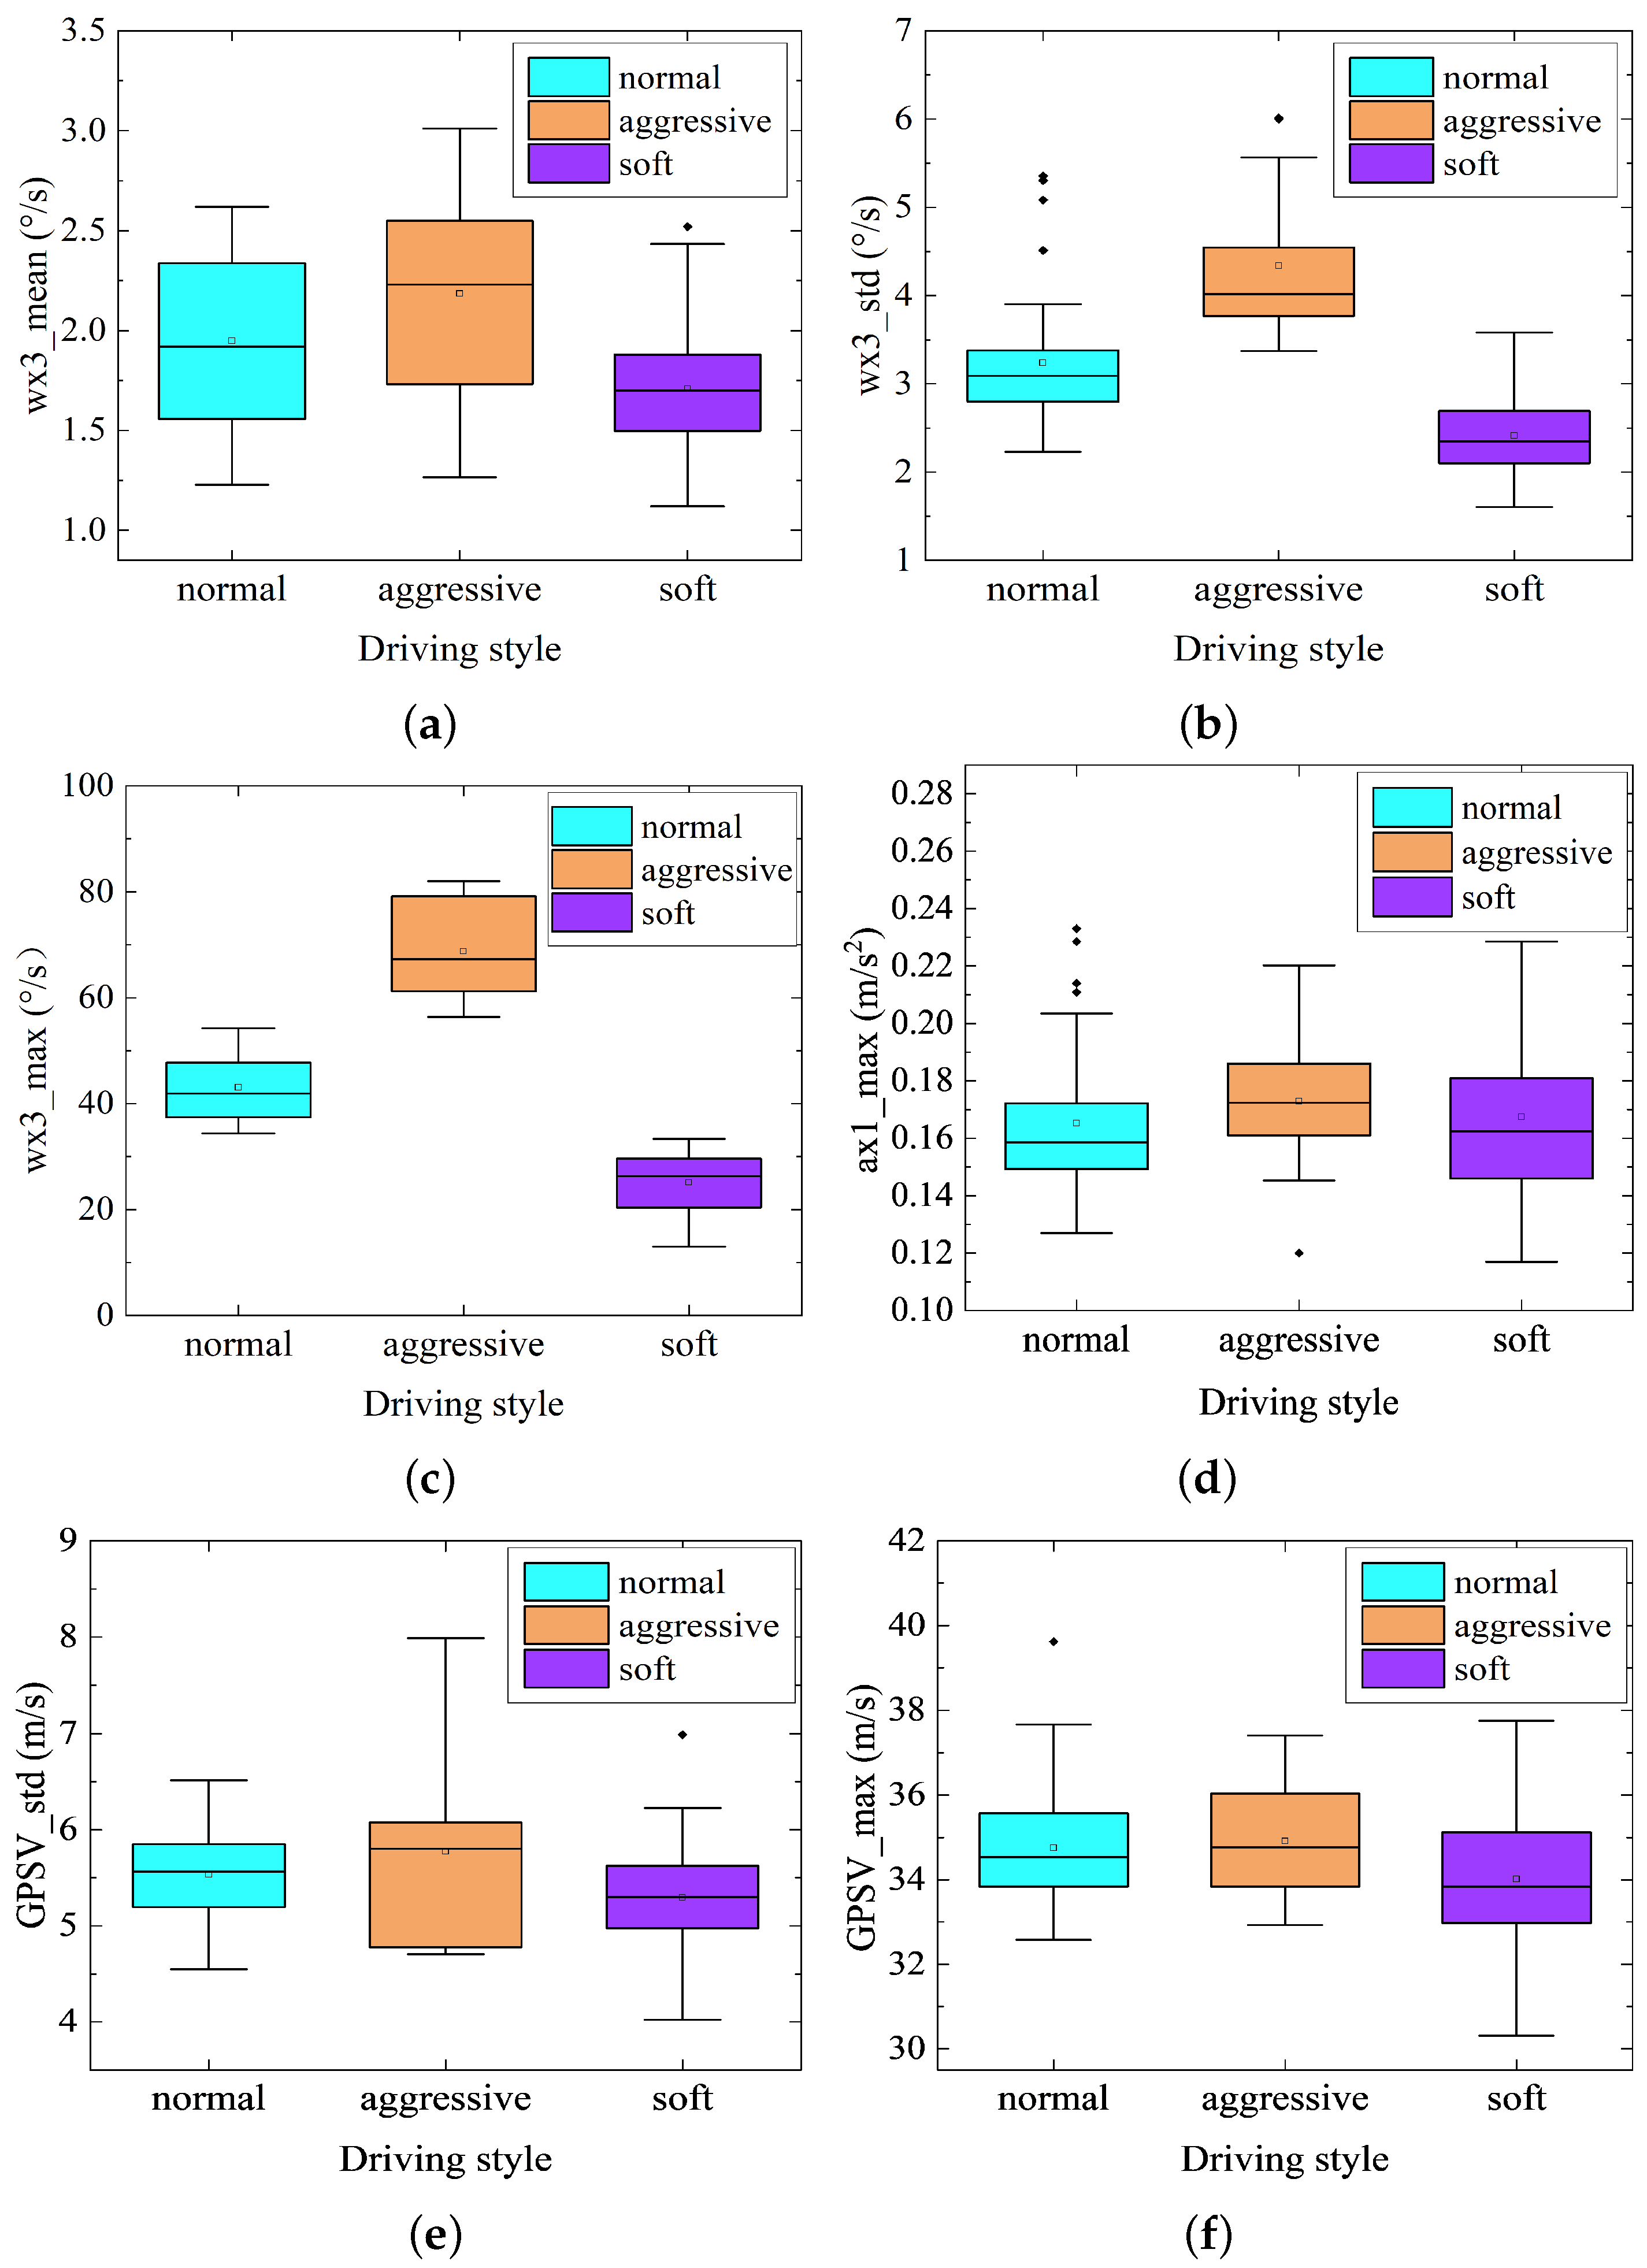
Similarly, from Figure 10, the median and upper quartile of characteristic parameters of throttle pedal angular velocity of the aggressive driving style were larger than the other two driving styles, and the median and upper quartile of characteristic parameters of throttle pedal angular velocity of the soft driving style were smaller than the other two driving styles. Meanwhile, the standard deviation of speed, maximum velocity, and maximum longitudinal acceleration also have similar distribution rules.
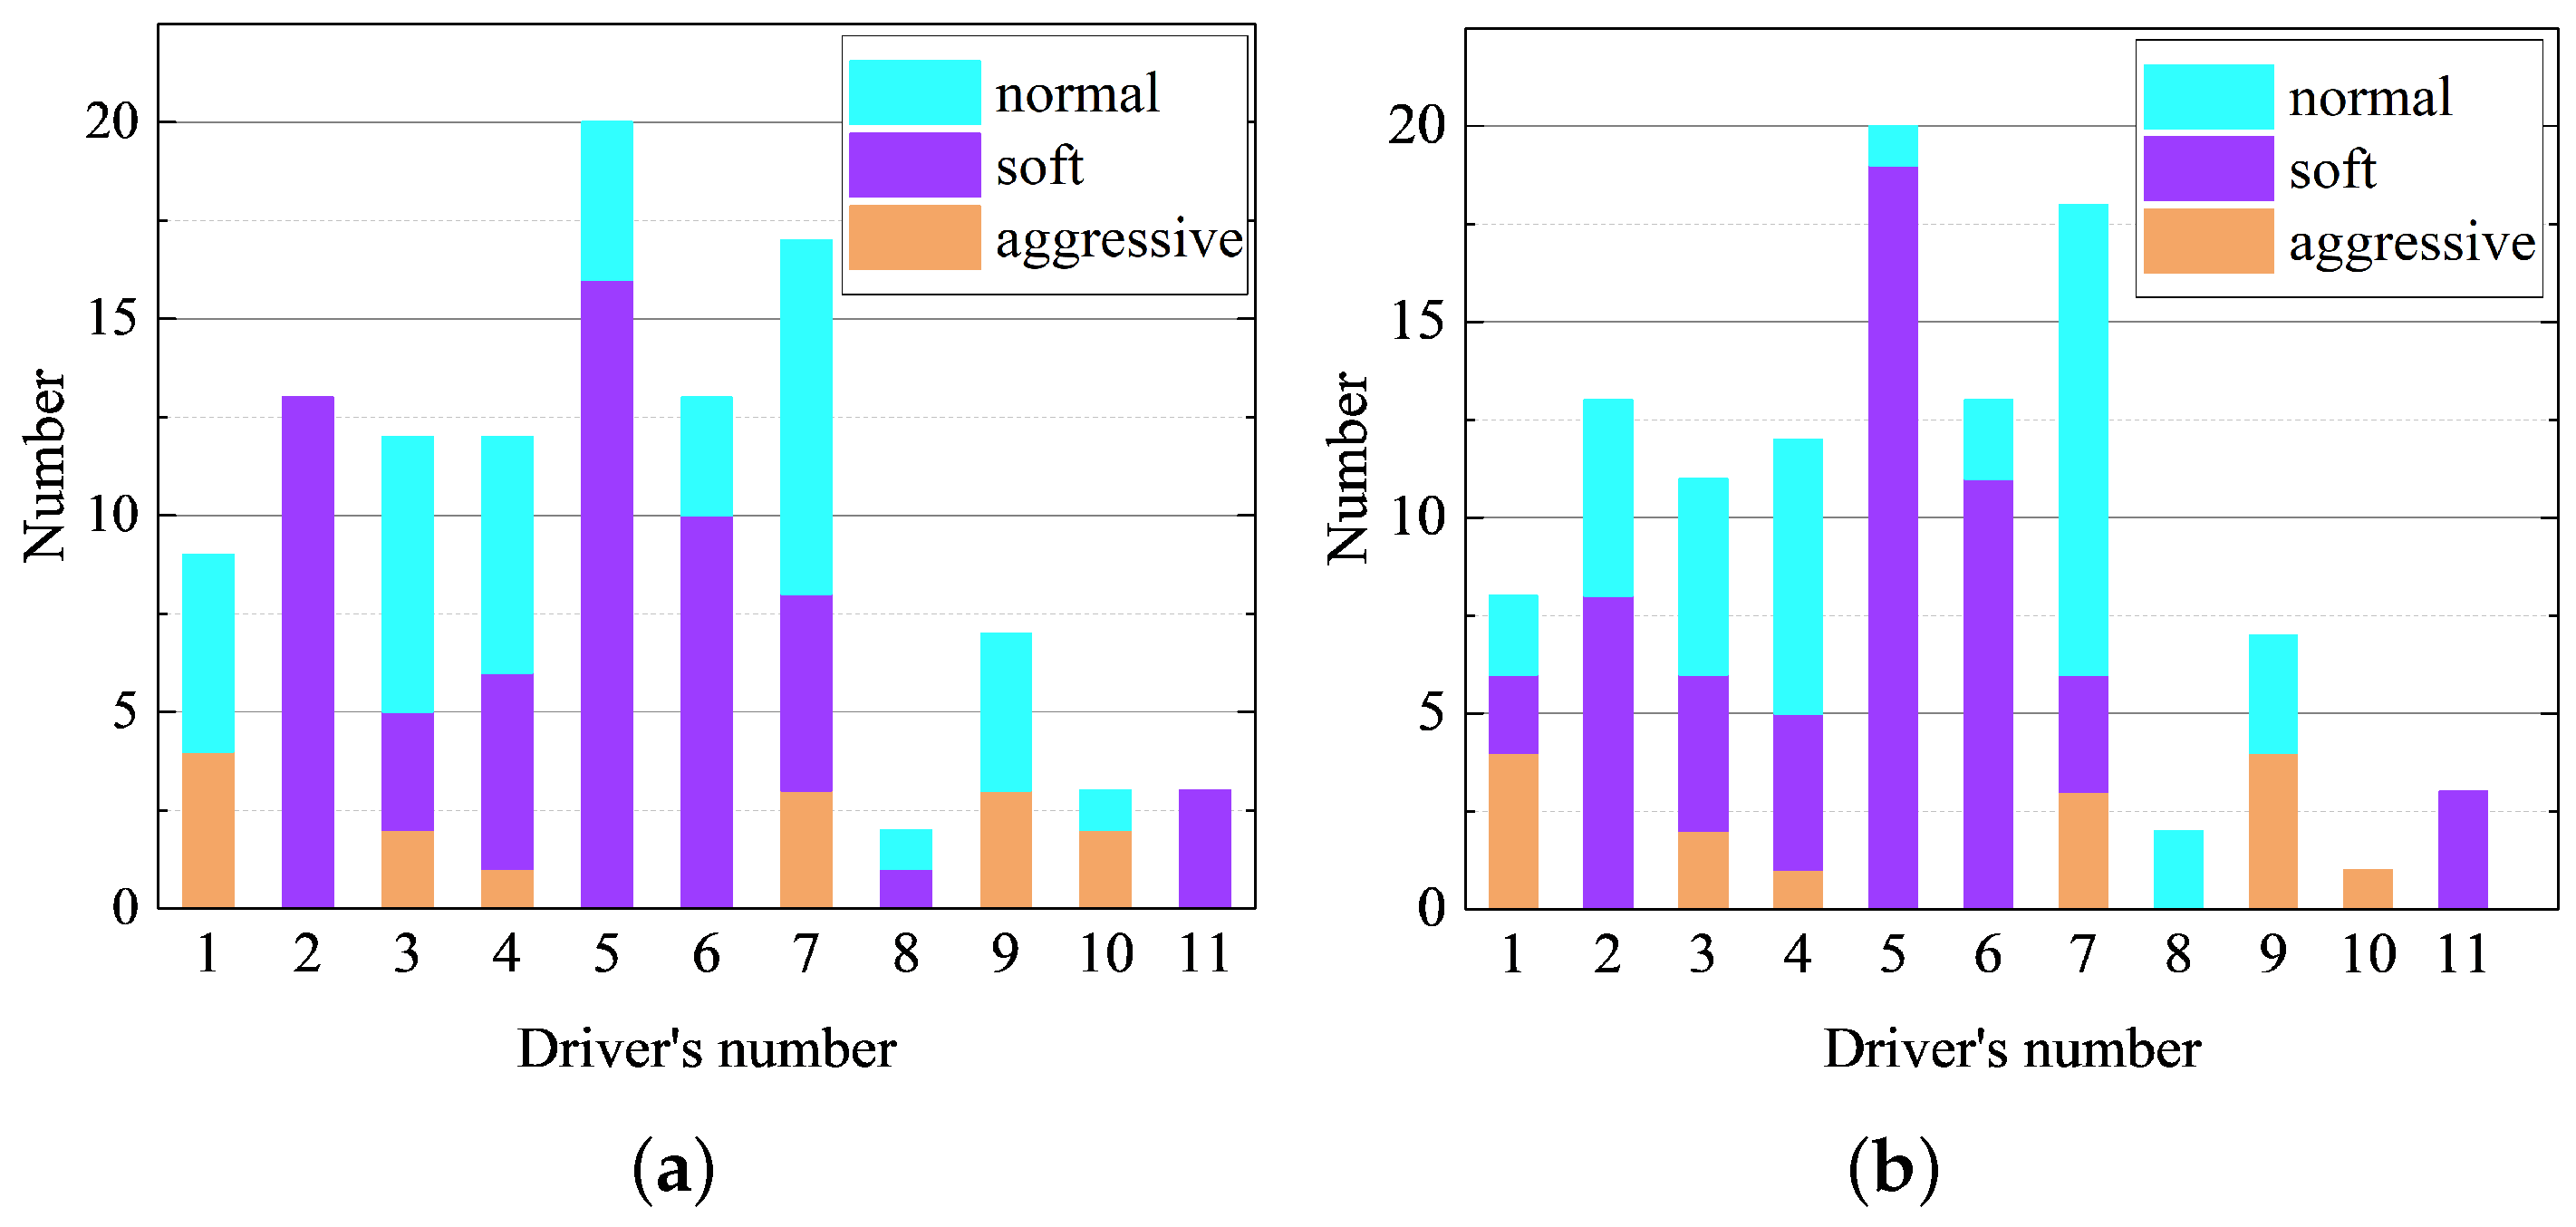
In addition, taking the mining truck driver as a statistical unit, the number of normal, soft, and aggressive driving styles of 11 drivers were counted respectively, (number means the number of different driving styles) (as shown in Figure 11): drivers have different driving styles in the same working day. Also, under the conditions of heavy load and no load, taking the third, fourth, fifth, sixth, and seventh drivers as example, the proportion of different driving styles of the same driver tended to be the same, which could also verify the effectiveness of the clustering results.
Under the conditions of heavy-load and low-speed operation of the mining truck, the distribution rules of characteristic parameters of different driving styles were in line with the research results of Liu et al. [23] and Chen et al. [34], which verified the validity of the clustering results. Moreover, under the no-load state, the distribution rules of characteristic parameters related to throttle pedal opening and angular velocity of different driving styles were evident. Also, under the condition of heavy load, the distribution rules of characteristic parameters of throttle pedal angular velocity of different driving styles were obvious.
3.3. Driving Style Identification Based on Random Forest
Based on clustering analysis of driving style of mining truck drivers, the random forest algorithm was introduced. The algorithm integrates multiple decision tree models to build a more effective driving style identification model, and the integrated model has a stronger generalization ability. It is suitable for processing unbalanced data sets and does not easily produce over-fitting. Simultaneously, the weights [35,36] of driving style parameters can also be obtained according to the Gini coefficient. In this research, the distribution of three driving styles was uneven under the conditions of heavy load and no load, which belongs to the imbalanced data set, it was suitable to use the random forest algorithm to build the driving style identification model and calculate characteristic parameter weights.
3.3.1. Random Forest Algorithm
Compared with a single decision tree, random forest is more tolerant to data noise and does not have to worry about the selection of hyper-parameters, only to focus on the number of decision trees needed to build a random forest. The progress of the implementation is as follows [16]:
- Using the bootstrap sampling method, r samples are randomly selected from the training set, which are put back to train a decision tree. This can ensure that all trees in the random forest method are different.
- According to the decision tree constructed in the first step, when the nodes are split, p features are randomly selected from the driving style feature parameters, and the Gini coefficient of all possible split methods for each feature are calculated respectively. Taking the minimum Gini coefficient as the objective function, the nodes are divided using the feature with the minimum Gini coefficient.where n is the number of driving style categories, t is the sample set, and is the sample subset of driving style category n.
- Repeat step 1 and step 2 to get z decision trees, based on the majority vote. A random forest model for driving style identification of mining truck drivers is constructed.
In addition, the k-nearest neighbor (KNN), support vector machine (SVM), and neural network (NN) methods were applied to the classification of driving style, and the classification results were compared with the performance of the random forest algorithm. To obtain the optimal accuracy and generalization ability of driving style identification model, a ten-fold cross-validation grid search was used to obtain the optimal parameter combination of the above algorithm model. Thus, under the heavy-load and no-load conditions of the mining truck, the driving behavior data set was divided into a test set and training set respectively, with the proportion of 3:7. The parameters and accuracy of each driving style identification model are shown in Table 12, Table 13, Table 14 and Table 15 as follows: under the heavy-load and no-load conditions, the performance of the random forest identification model was optimal and higher than that of the other algorithms, and the accuracy of the k-nearest neighbor identification model was the lowest.
The KNN algorithm mainly depends on the limited adjacent samples, which is simple and does not need many parameters to get good performance. However, due to the imbalance of the number of different driving styles, the accuracy of the KNN algorithm was the lowest. A kernel support vector machine (SVM) was used in this paper and can map data into higher dimensions to solve nonlinear separable problems. This algorithm performs well in various data sets and allows complex decision boundaries; however, it is difficult to understand and interpret the predicted results. Neural networks can acquire effective information from many data and build complex models, which requires a long training time and complex parameter adjustment.
The random forest model integrates multiple decision trees, which cannot only reduce over-fitting but also maintain the prediction ability of decision trees; this can also make up for the disadvantage of the poor generalization ability of decision trees. The model is easy to visualize and is not affected by data scaling. However, for sparse data with high dimensions, the performance of random forest is often poor.
In summary, considering the performance, advantages, and disadvantages of each algorithm, we adopted the random forest algorithm to construct the driving style identification model for mining truck drivers in the open-pit mine.
3.3.2. Overall Evaluation of Driving Style Identification Model
This paper chooses the index of generalization ability and overall precision to evaluate the performance of the driving style identification model. The generalization ability of the identification model adopted the method of ten-fold cross-validation, which divided the data set into ten parts. In the process of ten iterations, nine sets of data were used for training in each iteration, and the remaining set was used as the test set. The average classification accuracy was calculated according to the results of each iteration. The overall accuracy could be calculated by a confusion matrix, which can show prediction results and actual results of the random forest classifier. The definition of the confusion matrix is shown in Table 16.
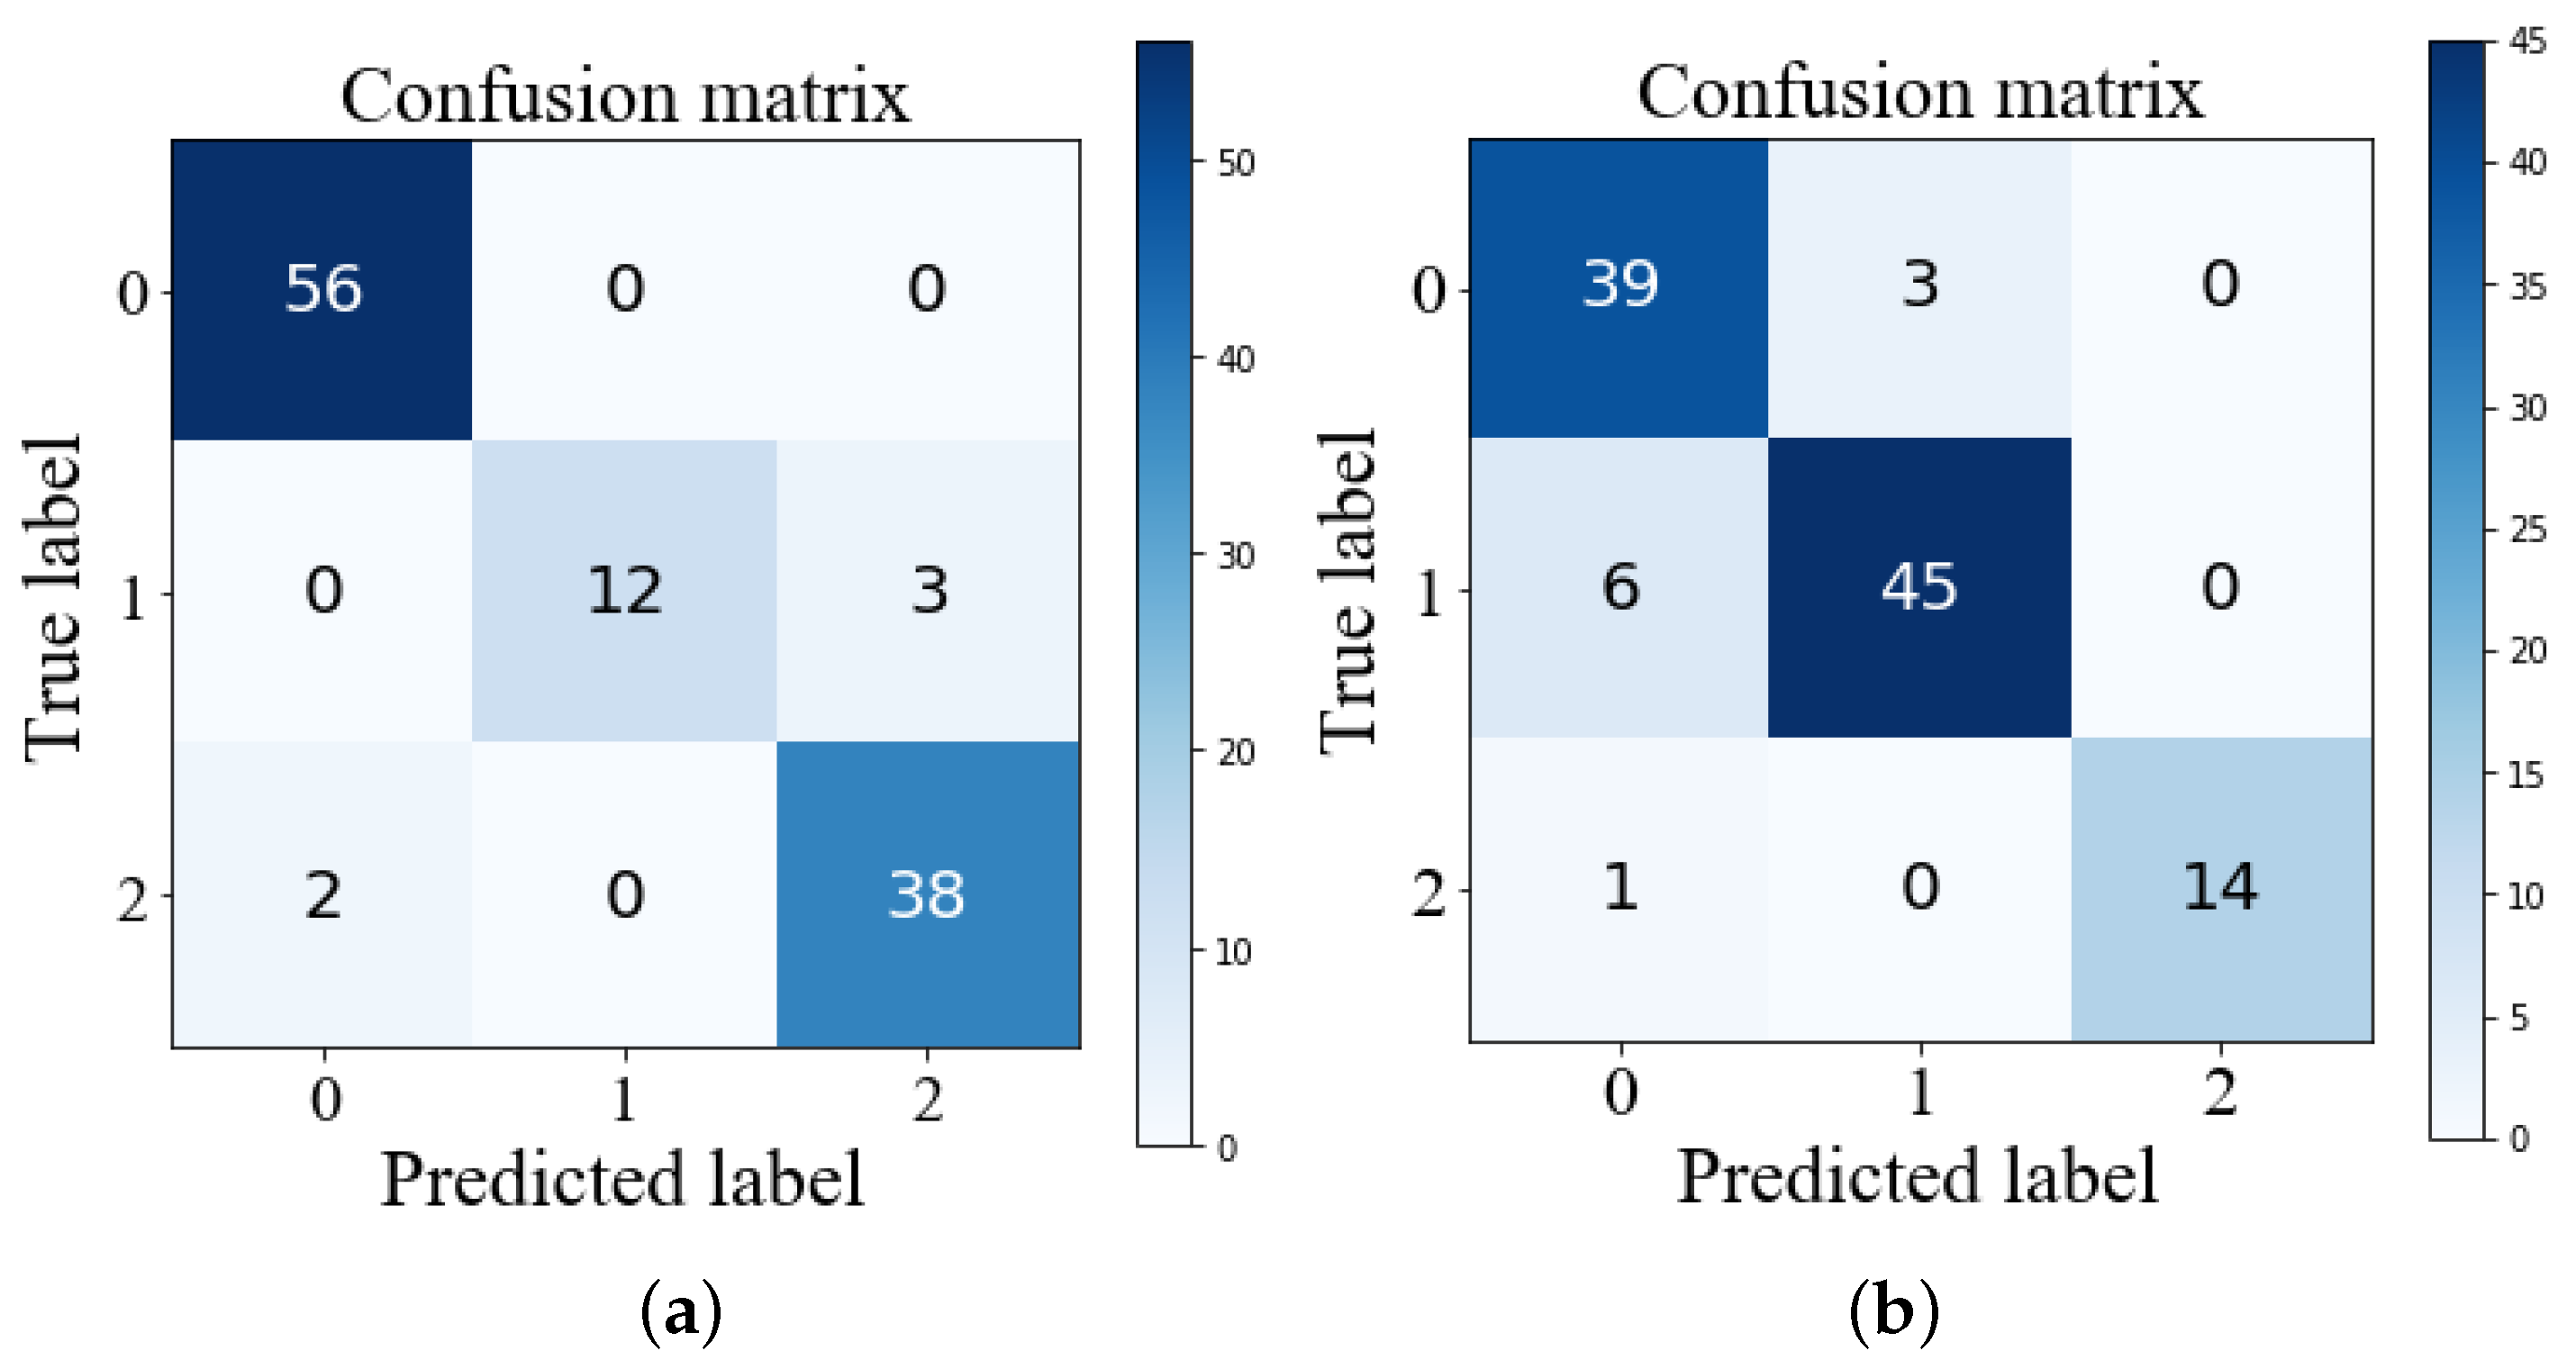
Based on the Scikit-learn machine learning platform, using grid search optimal parameters combination as identification model parameters, we built driving style identification models for the mining truck under heavy-duty and no-load conditions. From Figure 12, under heavy-load conditions of the mining truck, the average cross-validation score of a driving style identification model was 97% and the overall accuracy was 95.49%; under no-load conditions of the mining truck, the average cross-validation score of a driving style identification model was 89% and the overall accuracy was 90.74%. As a result, the generalization ability and overall accuracy of driving style identification models based on random forest were excellent. It can effectively identify the mining truck driver’s driving styles.
3.3.3. Evaluation of the Single Driving Style Identification Model
For the unbalanced data set, the performance of a single driving style recognition model can use indicators such as accuracy, precision, recall, and f-score for evaluation. According to the definition, the f-score considers both precision and recall, so the f-score as a model evaluation metric is better than precision. The Formulas (5)–(7) of each index are as follows:
The evaluation indicators of the single driving style identification model are shown in Table 17 and Table 18. Under heavy-load conditions of the mining truck, the f-scores of different driving styles were greater than 0.9, thus the performance of the identification model was excellent. Similarly, under no-load operation of mining trucks, the accuracies of single driving styles were greater than 88%, thus the performance of the identification model was also excellent. Finally, under conditions of heavy load and no load, according to f-score, the ability of single driving style model identification could conclude that the soft driving style was the best, the normal driving style was the second best, and the aggressive driving style was the weakest.
3.3.4. Importance Analysis of Driving Style Characteristic Parameters
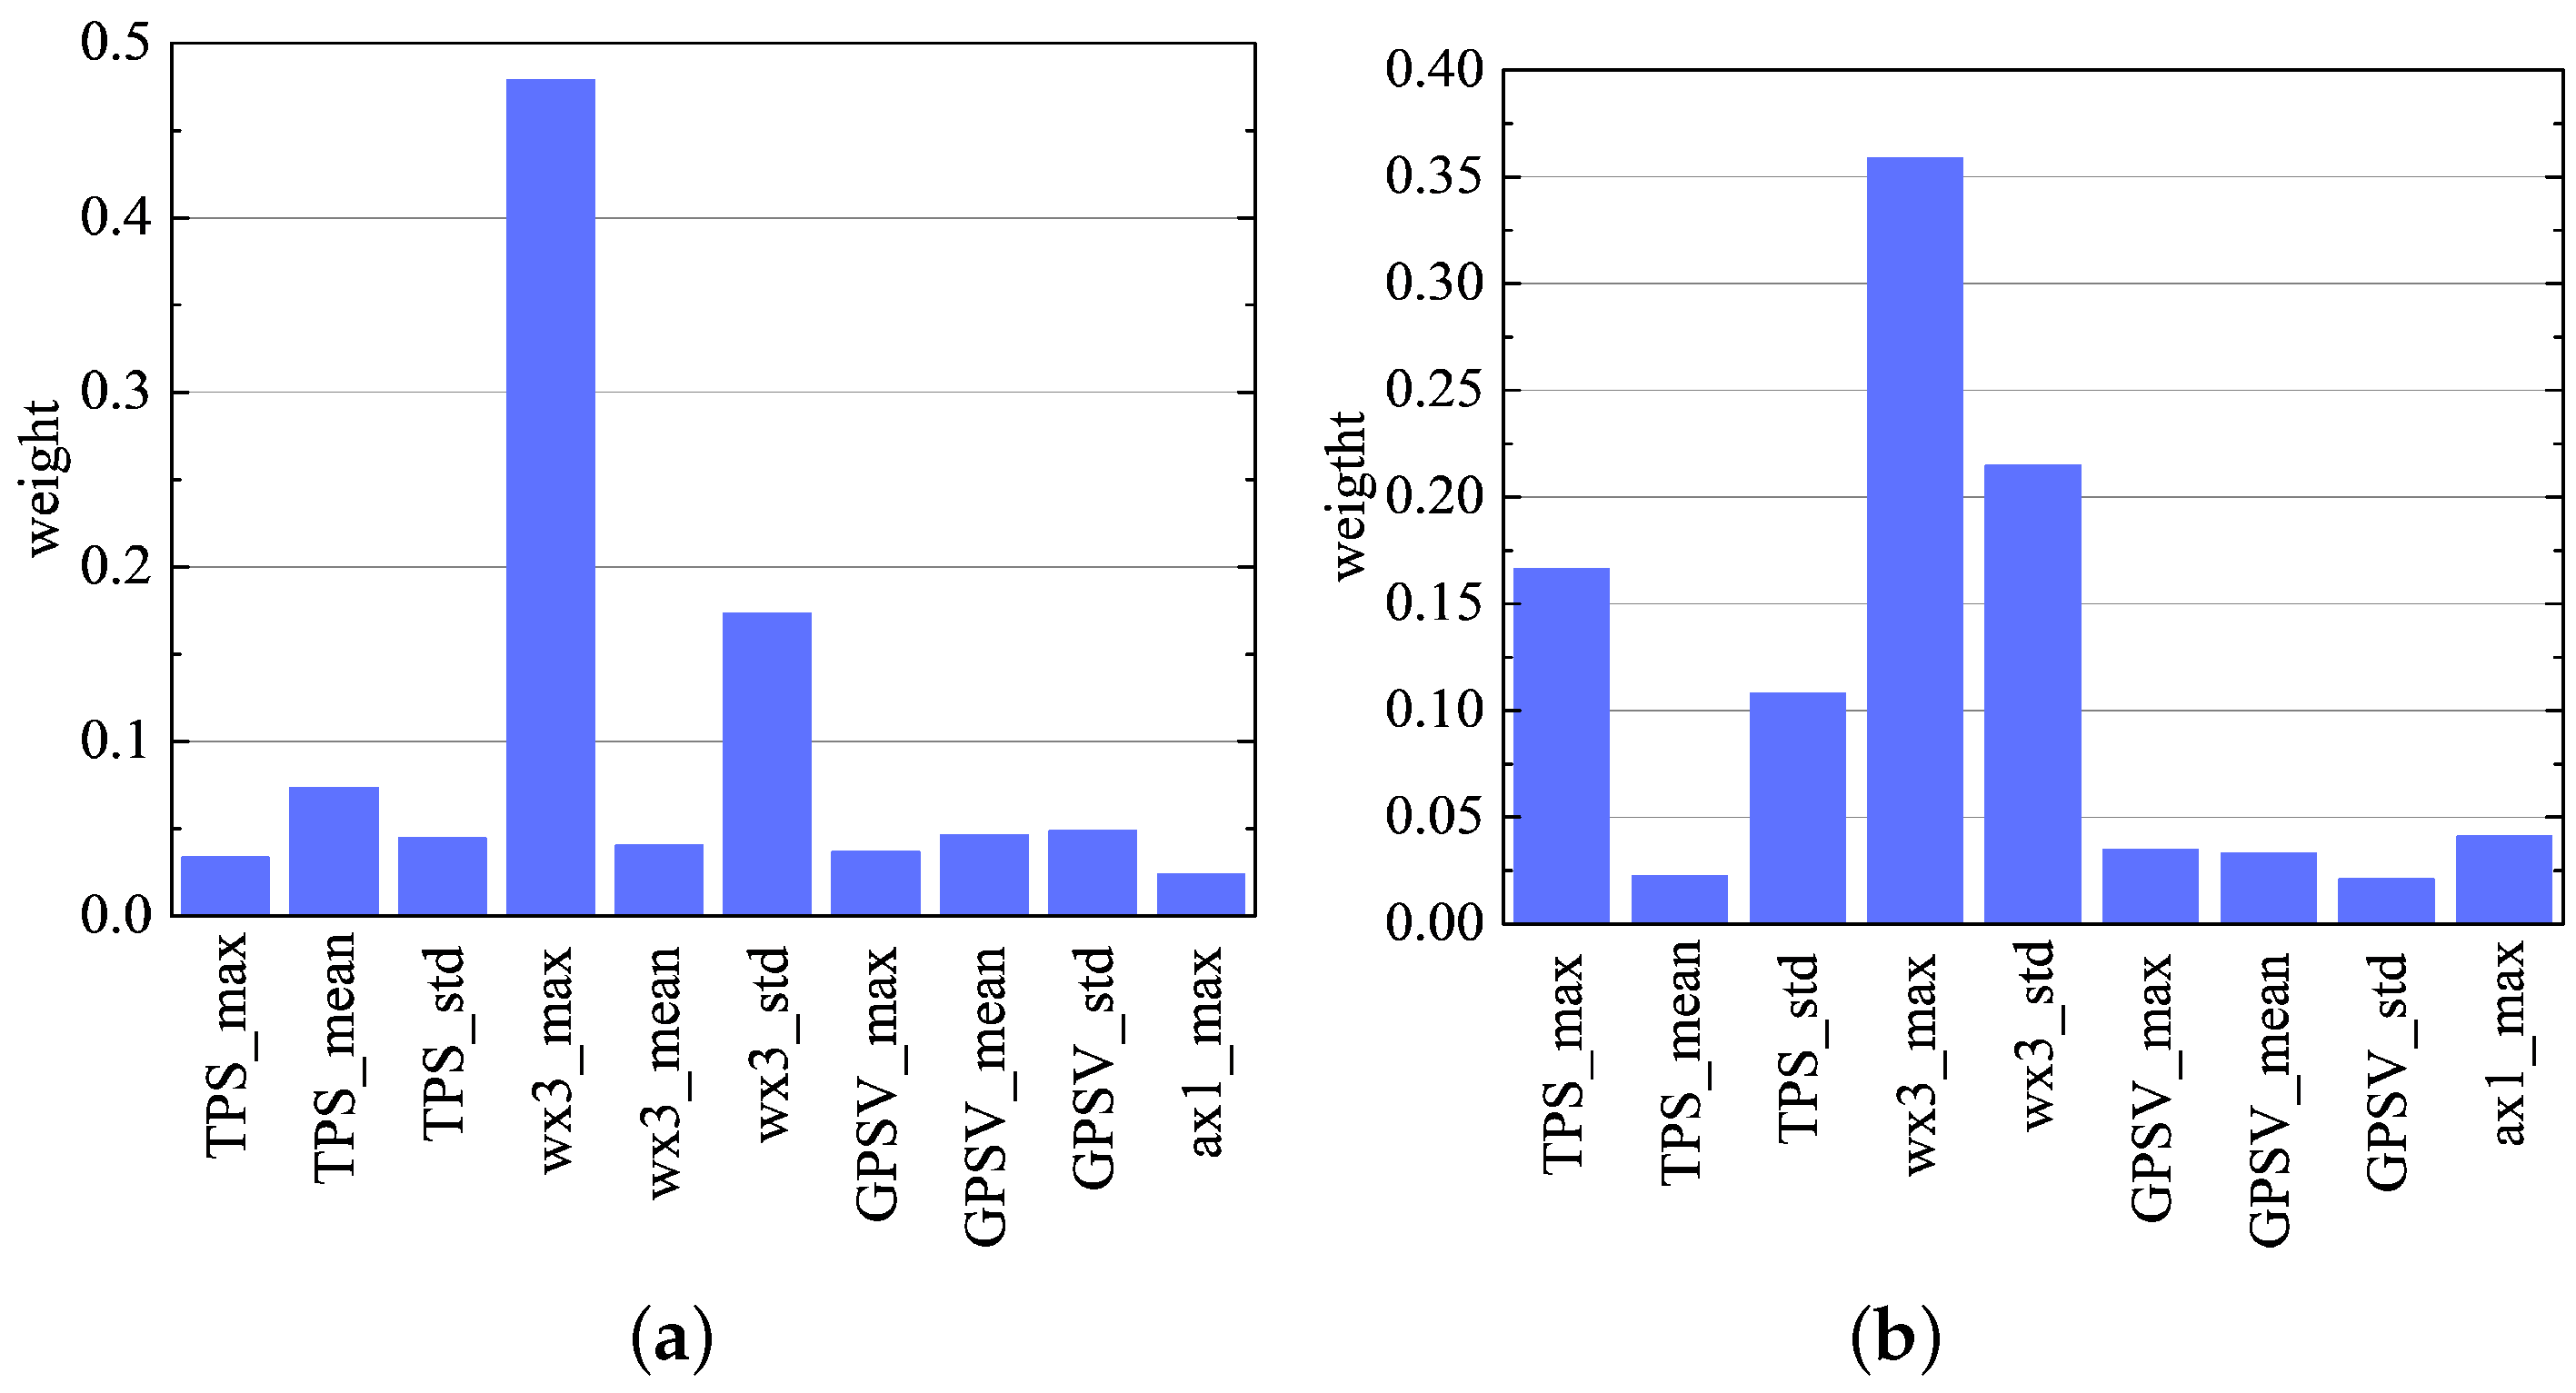
Feature importance was measured by the average impurity (Gini coefficient) attenuation of all decision trees in the random forest method [16], and through the Gini coefficient, the weight values of driving style characteristic parameters of the mining truck under heavy-load and no-load conditions could be calculated. From the analysis of Figure 13, we can see that the weight of throttle pedal angular velocity maximum (wx3_max) and standard deviation (wx3_std) were much larger than other characteristic parameters under heavy-load conditions. Therefore, the driving style characteristic parameters under heavy-load operation conditions were mainly characterized by the parameters of throttle pedal angular velocity, and the relevant characteristic parameters of throttle pedal angular velocity of different driving styles have significant distribution rules (Figure 11a,b). Under no-load conditions of the mining truck, the weight of throttle pedal opening maximum (TPS_max) and standard deviation (TPS_std), and throttle pedal angular velocity maximum (wx3_max) and standard deviation (wx3_std) were far greater than other characteristic parameters. Therefore, the driving styles under no-load conditions were mainly characterized by the characteristic parameters of throttle pedal opening and angular velocity, and the relevant characteristic parameters of throttle pedal opening and angular velocity have significant distribution rules Figure 10a–d).
3.3.5. The Relationship between Different Driving Styles and Fuel Consumption
In the Baiyinhua No. 2 mine, diesel oil was generally injected, and the oil tank was filled before day shift and night shift operation, and the fuel consumption is regarded as the daily key assessment index with high reliability. Therefore, the fuel consumption of day shift mining truck operation could be calculated based on the diesel filling before night shift operation, and then the average fuel consumption of a single operation cycle could be calculated based on the number of day shift operation cycles. Based on the identified driving style preference of each driver, the fuel consumption relationship of different driving styles could be roughly calculated.
The fuel consumption of open-pit mine trucks is related to such factors as transportation distance, lifting height, driving style, rolling resistance, and loading. The control variable method was used to compare and analyze the fuel consumption of drivers with the same transportation distance and lifting height in the same haulage road, and minimized the impact of transportation distance, lifting height, rolling resistance, and loading on fuel consumption, and then to calculate the influence of different driving styles on fuel consumption. The drivers with many samples were selected and supplemented with fuel consumption data. Driver No. 3 did not refuel before the night shift operation, and could not estimate the fuel consumption of the day shift and remove it. The fuel consumption statistics of each driver are shown in Table 19. Drivers with numbers of 1, 2, and 4 operated mining trucks to transport rocks to the dumping point with elevation of 1055 through the same haulage road; drivers with numbers of 5 and 6 operated mining trucks to transport rocks to the dumping point with elevation of 1035 through the same haulage road. Among them, the 1055 dumping point and 1035 dumping point were located in adjacent steps, with a height difference of 20 m and a flat plate width of 40 m.
Driver No. 1 has an aggressive driving style with a fuel consumption of up to 79.1 L; Driver No. 2 has a soft driving style, with fuel consumption of 69.4 L, and Driver No. 3 has a normal driving style, with fuel consumption of 64.6 L. Therefore, the fuel consumption of the aggressive driving style was higher than that of the normal driving style and the moderate driving style, and the fuel consumption of the aggressive driving style was about 10% higher than the average fuel consumption. The difference in fuel consumption between the normal and soft driving styles was not large. Therefore, it is necessary to focus on the operation training of the aggressive driving style driver to achieve the purpose of reducing fuel consumption.
4. Conclusions
(1) Based on the same experimental truck and haulage road, the data of driving behavior of different mining truck drivers was collected by sensors. According to Pearson correlation analysis, redundant feature parameters were removed and driving style feature parameters were constructed for the mining truck under conditions of heavy load and no load, then K-means was used to classify driving styles. On this basis, the random forest algorithm was used to identify driving style. Finally, the weight values of driving style features were obtained based on the Gini coefficient. The results show that the accuracy rates of driving style recognition are all more than 90% for the mining truck under conditions of heavy load and no load, which provides a new method for driving style identification of mining truck drivers in open pits.
(2) The characteristic parameters related to throttle pedal angular velocity can characterize the driving style of mining trucks under heavy-load condition; the characteristic parameters related to throttle pedal opening and angular velocity can characterize the driving style of mining trucks under no-load conditions; the driving styles of mining truck drivers in an open-pit mine are not unique, and consist of different driving styles.
(3) The fuel consumption of the aggressive driving style was the largest and 10% higher than the average fuel consumption, while the fuel consumption of the soft driving style was not very different compared to the normal driving style. Therefore, it is necessary to focus on operational training for drivers with an aggressive driving style. These results can be directly applied to the daily fuel consumption management and driving operation training of truck drivers in open-pit mines to achieve the goal of fuel-saving driving.
This experiment required the same experimental truck and haulage road, which conflicted with the on-site mining truck scheduling, therefore, only 11 drivers’ driving behavior data were collected in this experiment. The next step is to extract more samples from driving behavior data to further improve the accuracy of the driving style recognition model. The slopes of the outer dump haulage road of the Baiyinhua No. 2 open-pit mine are mostly in the range of 3–8% and road slope has a great influence on drivers’ behavior, therefore, the influence of road slope on driving behavior should be considered and incorporated into driving style characteristic parameters.
Author Contributions
Conceptualization, Q.W., R.Z. and Y.W.; methodology, Q.W. and Y.W.; software, Q.W. and Y.W.; validation, Q.W. and Y.W.; formal analysis, Q.W., R.Z., Y.W. and S.L.; investigation, Q.W. and R.Z.; resources, Q.W. and R.Z.; data curation, Q.W. and Y.W.; writing—original draft preparation, Q.W., Y.W. and S.L.; writing—review and editing, Q.W., R.Z., Y.W. and S.L.; visualization, Q.W. and Y.W.; supervision, R.Z., Y.W.; project administration, R.Z., Y.W.; funding acquisition, R.Z. All authors have read and agreed to the published version of the manuscript.
Funding
This research was funded by the National Key Research and Development Program of China grant number 2018YFC0808306.
Acknowledgments
The authors would like to thank the financial support from the National Key Research and Development Program of China (Grant No. 2018YFC0808306).
Conflicts of Interest
The authors declare that there is no conflict of interest related to this paper.
References
- Akena, R.; Schmid, F.; Burrow, M. Driving style for better fuel economy. Proc. Inst. Civ. Eng. Transp. 2017, 170, 131–139. [Google Scholar] [CrossRef] [Green Version]
- Wang, R.; Lukic, S.M. Review of driving conditions prediction and driving style recognition based control algorithms for hybrid electric vehicles. In Proceedings of the VPCC 2011 Vehicle Power and Propulsion Conference, Chicago, IL, USA, 6–9 September 2011; pp. 1–7. [Google Scholar]
- Bingham, C.; Walsh, C.; Carroll, S. Impact of driving characteristics on electric vehicle energy consumption and range. IET Intell. Transp. Syst. 2012, 6, 29. [Google Scholar] [CrossRef]
- Gonder, J.; Earleywine, M.; Sparks, W. Analyzing vehicle fuel saving opportunities through intelligent driver feedback. SAE Int. J. Passeng. Cars Electron. Electr. Syst. 2012, 5, 450–461. [Google Scholar] [CrossRef] [Green Version]
- Kubler, K.A.C. Optimisation of Off-Highway Truck Fuel Consumption through Mine Haul Road Design. Ph.D. Dissertation, University of Southern Queensland, Queensland, Australia, 2015. [Google Scholar]
- Dindarloo, S.R.; Siami-Irdemoosa, E. Determinants of fuel consumption in mining trucks. Energy 2016, 112, 232–240. [Google Scholar] [CrossRef]
- John, M.; Juliana, P. An interactive simulation model of human drivers to study autonomous haulage trucks. Procedia Comput. Sci. 2011, 6, 118–123. [Google Scholar]
- Michael, S.; Brandon, S. Eco-driving: Strategic, tactical, and operational decisions of the driver that influence vehicle fuel economy. Transp. Policy 2012, 22, 96–99. [Google Scholar]
- Af Wahlberg, A.E. Long-term effects of training in economical driving: Fuel consumption, accidents, driver acceleration behavior and technical feedback. Int. J. Ind. Ergon. 2007, 37, 333–343. [Google Scholar] [CrossRef]
- Zarkadoula, M.; Zoidis, G.; Tritopoul, E. Training urban bus drivers to promote smart driving: A note on a Greek eco-driving pilot program. Transp. Res. Part D Transp. Environ. 2007, 12, 449–451. [Google Scholar] [CrossRef]
- Beusen, B.; Broekx, S.; Denys, T.; Beckx, C.; Degraeuwe, B.; Gijsbers, M.; Scheepersa, K.; Govaertsa, L.; Torfsa, R.; IntPanis, L. Using on-board logging devices to study the longer-term impact of an eco-driving course. Transp. Res. Part D Transp. Environ. 2009, 14, 514–520. [Google Scholar] [CrossRef]
- Marina Martinez, C.; Heucke, M.; Wang, F.; Gao, B.; Cao, D. Driving style recognition for intelligent vehicle control and advanced driver assistance: A Survey. IEEE Trans. Intell. Transp. Syst. 2018, 19, 666–676. [Google Scholar] [CrossRef] [Green Version]
- Shinar, D. Aggressive driving: The contribution of the drivers and the situation. Transp. Res. Part F Traffic Psychol. Behav. 1998, 1, 137–160. [Google Scholar] [CrossRef]
- Xie, H.; Tian, G.; Chen, H.; Wang, J.; Huang, Y. A distribution density-based methodology for driving data cluster analysis: A case study for an extended-range electric city bus. Pattern Recognit. 2018, 73, 131–143. [Google Scholar] [CrossRef]
- Si, L.; Hirz, M.; Brunner, H. Big data-based driving pattern clustering and evaluation in combination with driving circumstances. In Proceedings of the 2018 SAE World Congress Experience, Detroit, MI, USA, 10–12 April 2018. [Google Scholar]
- Raschka, S. Python Machine Learning; Packt Publishing Ltd.: Birmingham, UK, 2015; ISBN 978-1-78355-513-0. [Google Scholar]
- Chen, K.; Chen, H.W. Driving style clustering using naturalistic driving data. Transp. Res. Rec. 2019, 2673, 176–188. [Google Scholar] [CrossRef]
- Sun, C.; Wu, C.Z.; Chu, D.F. Driving speed behavior clustering for commercial vehicle based on connected vehicle data mining. J. Transp. Syst. Eng. Inf. Technol. 2015, 15, 82–87. [Google Scholar]
- Han, W.; Wang, W.; Li, X.; Xi, J. Statistical-based approach for driving style recognition using Bayesian probability with kernel density estimation. IET Intell. Transp. Syst. 2019, 13, 22–30. [Google Scholar] [CrossRef] [Green Version]
- Zhu, B.; Jiang, Y.D.; Dend, W.W.; Yang, S.; He, R. Unsupervised clustering of driving styles based on KL divergence. Automot. Eng. 2018, 40, 1317–1323. [Google Scholar]
- Karginova, N.; Byttner, S.; Svensson, M. Data-driven methods for classification of driving styles in buses. In Proceedings of the SAE 2012 World Congress and Exhibition, Detroit, MI, USA, 24–26 April 2012. [Google Scholar]
- Bejani, M.M.; Ghatee, M. A context aware system for driving style evaluation by an ensemble learning on smartphone sensors data. Transp. Res. Part C 2018, 89, 303–320. [Google Scholar] [CrossRef]
- Liu, Y.; Wang, J.; Zhao, P.; Qin, D.; Chen, Z. Research on classification and recognition of driving styles based on feature engineering. IEEE Access 2019, 7, 89245–89255. [Google Scholar] [CrossRef]
- Hao, J.X.; Yu, Z.P.; Zhao, Z.G.; Zhan, X.W.; Shen, P.H. A study on the driving style recognition of hybrid electric vehicle. Automot. Eng. 2017, 39, 1444–1450. [Google Scholar]
- Zhang, B.W.; Liu, X.J.; Fu, J.G.; Wang, J.L.; Su, J.H. Application of multi-function anti-collision warning system in heidaigou open-pit coal mine. Saf. Coal Mines 2015, 46, 51–54. [Google Scholar]
- Sun, E.J.; Zhang, X.K.; Li, Z.X.; Wang, Y. Driver fatigue monitoring at surface mine based on machine vision. J. Liaoning Tech. Univ. (Natl. Sci.) 2012, 31, 21–25. [Google Scholar]
- Wang, H.L.; Lu, S.S. Operation and fuel economy analysis of heavy truck in east open pit mine. China Coal Ind. 2017, 8, 58–60. [Google Scholar]
- Shi, B.; Xu, L.; Hu, J.; Tang, Y.; Jiang, H.; Meng, W.; Liu, H. Evaluating driving styles by normalizing driving behavior based on personalized driver modeling. IEEE Trans. Syst. Man Cybern. Syst. 2015, 45, 1502–1508. [Google Scholar] [CrossRef]
- Ma, H.J. Research on Online Trajectory Optimizing Strategy of Bus Engine Operating Condition with the Driving Style Improving. Ph.D. Dissertation, Tianjin University, Tianjin, China, 2018. [Google Scholar]
- Chu, D.; Deng, Z.; He, Y.; Wu, C.; Sun, C.; Lu, Z. Curve speed model for driver assistance based on driving style classification. IET Intell. Transp. Syst. 2017, 11, 501–510. [Google Scholar] [CrossRef]
- Augustynowicz, A. Preliminary classification of driving style with objectiverankmethod. Int. J. Automot. Technol. 2009, 10, 607–610. [Google Scholar] [CrossRef]
- Montazeri-gh, M.; Fotouhi, A.; Naderpour, A. Driving patterns clustering based on driving feature analysis. Proc. Inst. Mech. Eng. 2011, 225, 1301–1317. [Google Scholar] [CrossRef]
- Wu, Z.H. Analysis of Driving Behavior and Traffic Congestion Based on Data Mining; University of Science and Technology of China: Hefei, China, 2018. [Google Scholar]
- Chen, J.R.; Wu, Y.F.; Wu, B. Driver behavior spectrum analyzing method based on vehicle driving data. J. Comput. Appl. 2018, 38, 1916–1922. [Google Scholar]
- Gregorutti, B.; Michel, B.; Saint-pierre, P. Correlation and variable importance in random forests. Stat. Comput. 2017, 27, 659–678. [Google Scholar] [CrossRef] [Green Version]
- Pang, B.; Yue, J.; Zhao, G.; Xu, Z. Statistical downscaling of temperature with the random forest model. Adv. Meteorol. 2017, 2017, 7265178. [Google Scholar] [CrossRef] [Green Version]
Figure 1.
Sketch map of aerial photography of the experimental haulage road.

Figure 2.
Photograph of the data acquisition system.

Figure 3.
Mining truck driving behavior and vehicle condition monitoring system installation. (a) Experimental truck. (b) Installation of sensor No. 1. (c) Installation of sensor No. 2.
Figure 3.
Mining truck driving behavior and vehicle condition monitoring system installation. (a) Experimental truck. (b) Installation of sensor No. 1. (c) Installation of sensor No. 2.

Figure 4.
Throttle opening under heavy-load and no-load conditions.

Figure 5.
Running speed under heavy-load and no-load conditions.

Figure 6.
Heavy-load characteristic parameters correlation coefficient heat map.

Figure 7.
No-load characteristic parameters correlation coefficient heat map.

Figure 8.
The elbow rule under the condition of heavy load and no load. (a) The elbow rule under heavy-load state. (b) The elbow rule under no-load state.
Figure 8.
The elbow rule under the condition of heavy load and no load. (a) The elbow rule under heavy-load state. (b) The elbow rule under no-load state.

Figure 9.
Box plot drawing of driving style characteristic parameters of mining truck under no-load state. (a) Average throttle opening. (b) Standard deviation of throttle opening. (c) Standard deviation of throttle pedal angular velocity. (d) Maximum throttle pedal angular velocity. (e) Maximum longitudinal acceleration. (f) Standard deviation of speed.

Figure 10.
Box plot drawing of driving style characteristic parameters of mining truck under heavy-load state. (a) Average throttle pedal angular velocity. (b) Standard deviation of throttle pedal angular velocity. (c) Maximum throttle pedal angular velocity. (d) Maximum longitudinal acceleration. (e) Standard deviation of speed. (f) Maximum speed.

Figure 11.
Clustering statistical results of mining truck under heavy-load and no-load conditions. (a) Statistics of clustering results of mining truck under heavy-load conditions. (b) Statistics of clustering results of mining truck under no-load conditions.
Figure 11.
Clustering statistical results of mining truck under heavy-load and no-load conditions. (a) Statistics of clustering results of mining truck under heavy-load conditions. (b) Statistics of clustering results of mining truck under no-load conditions.

Figure 12.
Confusion matrix of the mining truck under the conditions of heavy load and no load. (a) Confusion matrix of the mining truck under heavy-load conditions. (b) Confusion matrix of the mining truck under no-load conditions.
Figure 12.
Confusion matrix of the mining truck under the conditions of heavy load and no load. (a) Confusion matrix of the mining truck under heavy-load conditions. (b) Confusion matrix of the mining truck under no-load conditions.

Figure 13.
Driving style characteristic parameter weights for mining truck under heavy-load and no-load conditions. (a) Weight of driving style characteristic parameters of the mining truck under heavy-load conditions. (b) Weight of driving style characteristic parameters of the mining truck under no-load conditions.


Table 1.
The influence of driving style on fuel consumption.
| Number | Driving Style | Fuel Consumption |
|---|---|---|
| 1 | Comparison of fuel consumption between soft and aggressive driving styles [3,4] | 30% less |
| 2 | Fuel consumption of aggressive type, normal type and soft type under the condition of heavy load of mining truck in open-pit mine [7] | Aggressive: 330 L/h Normal: 300 L/h Soft: 295 L/h |
| 3 | Fuel consumption of aggressive type, normal type and soft type under the condition of heavy no load of mining truck in open-pit mine [7] | Aggressive: 210 L/h Normal: 186 L/h Soft: 170 L/h |
| 4 | Optimizing driving style [8] | 25% reduction |
| 5 | Driver skill training [9,11] | 2–5% reduction |
Table 2.
Main equipment parameters of the experimental truck.
| Parameter Name | Parameter Value |
|---|---|
| Truck Type | BELAZ 75313 |
| Truck Weight | 107 t |
| Truck Load Rating | 130 t |
| Boundary Dimension | 11.5 m × 6.9 m × 5.7 m |
| Safe Driving Speed | Maximum speed of flat road: 30 km/h |
| Maximum speed of no-load downhill: 35 km/h | |
| Rated Capacity of Dump truck Bucket | 70 m3 |
| Engine Power Rating | 1194 kw |
| Traction Generator Power | 1000 kw |
| Gears | Continuously variable speed |
Table 3.
Performance parameters of ten-axis inertial navigation sensor.
| Parameter Name | Parameter Value |
|---|---|
| Volume | 61.2 mm × 45.2 mm × 27.8 mm |
| Angular velocity precision | Static: 0.05°, Dynamic: 0.1° |
| Acceleration precision | 0.01 g |
| Speed precision | 0.05 m/s |
| GPS precision | ±5 m |
Table 4.
Basic information of tested drivers.
| Index | Range | Driver Number |
|---|---|---|
| Driver Age Distribution | 30–40 years old | 7 |
| 40–50 years old | 4 | |
| Driving Experience Distribution | 3–5 years | 3 |
| 5–10 years | 8 | |
| Education Level | Senior high school | 11 |
Table 5.
Sensor acquisition parameters.
| No. | Name of Characteristic Parameter | Meaning of Characteristic Parameter | Unit |
|---|---|---|---|
| 1 | sensorID | Sensor number | - |
| 2 | time | Time | ms |
| 3 | rx3 | Angle of throttle pedal to the horizontal | ° |
| 4 | ry1 | Angle of truck to the horizontal | ° |
| 5 | wx3 | Throttle pedal angular velocity | °/s |
| 6 | gpsv | Running velocity of truck | km/h |
| 7 | ax1 | Longitudinal acceleration of truck | g |
| 8 | lon | Longitude | ° |
| 9 | lat | Latitude | ° |
Table 6.
Driving behavior characteristic parameters.
| No. | Name of Characteristic Parameter | Meaning of Characteristic Parameter | Unit |
|---|---|---|---|
| 1 | TPS_max | Maximum throttle pedal opening | % |
| 2 | TPS_mean | Average throttle pedal opening | % |
| 3 | TPS_std | Standard deviation of throttle pedal opening | % |
| 4 | wx3_max | Maximum angular velocity of throttle pedal | °/s |
| 5 | wx3_mean | Average angular velocity of throttle pedal | °/s |
| 6 | wx3_std | Standard deviation of angular velocity of throttle pedal | °/s |
| 7 | GPSV_max | Maximum speed | km/h |
| 8 | GPSV_mean | Average speed | km/h |
| 9 | GPSV_std | Standard deviation of speed | km/h |
| 10 | ax1_max | Longitudinal acceleration | m/s2 |
Table 7.
Characteristic parameters under heavy and no-load conditions.
| Operation State | Characteristic Parameter |
|---|---|
| Heavy-load feature parameters | TPS_max, TPS_mean, TPS_std, wx3_max, wx3_mean, wx3_std, GPSV_max, GPSV_mean, GPSV_std, ax1_max |
| No-load feature parameters | TPS_max, TPS_mean, TPS_std, wx3_max, wx3_std, GPSV_max, GPSV_mean, GPSV_std, ax1_max |
Table 8.
Driving style data sample under heavy-load conditions.
| No. | TPS_max | TPS_mean | TPS_std | wx3_max | … | wx3_std | GPSV_max | GPSV_std | ax1_max |
|---|---|---|---|---|---|---|---|---|---|
| 1 | 97.08 | 74.05 | 24.93 | 61.22 | … | 3.77 | 33.21 | 4.71 | 0.18 |
| 2 | 100.00 | 73.53 | 25.34 | 37.72 | … | 2.85 | 35.15 | 4.73 | 0.16 |
| 3 | 96.23 | 71.50 | 23.38 | 59.02 | … | 3.37 | 32.93 | 4.77 | 0.16 |
| 4 | 97.16 | 72.70 | 26.70 | 50.05 | … | 2.98 | 34.15 | 4.96 | 0.15 |
| 5 | 96.88 | 72.31 | 25.20 | 44.98 | … | 2.87 | 33.22 | 5.16 | 0.13 |
| 6 | 95.70 | 71.47 | 23.23 | 50.66 | … | 3.14 | 35.60 | 4.55 | 0.17 |
| 7 | 100.00 | 77.05 | 28.37 | 68.42 | … | 3.50 | 32.98 | 5.92 | 0.12 |
| 8 | 100.00 | 75.12 | 27.30 | 67.26 | … | 3.80 | 34.77 | 5.48 | 0.17 |
| 9 | 98.20 | 70.13 | 28.31 | 54.26 | … | 3.90 | 32.58 | 5.65 | 0.16 |
| 10 | 89.96 | 70.91 | 20.20 | 28.57 | … | 2.64 | 32.78 | 5.02 | 0.13 |
| 11 | 98.75 | 73.29 | 20.29 | 33.33 | … | 2.43 | 35.02 | 5.37 | 0.16 |
| 12 | 94.02 | 72.19 | 20.39 | 29.54 | … | 2.78 | 33.21 | 5.17 | 0.15 |
| … | … | … | … | … | … | … | … | … | … |
| 99 | 96.57 | 77.45 | 23.84 | 41.38 | … | 5.08 | 35.58 | 6.09 | 0.15 |
| 100 | 99.84 | 75.12 | 25.60 | 37.17 | … | 4.51 | 39.61 | 6.51 | 0.17 |
| 101 | 97.16 | 77.70 | 22.77 | 61.65 | … | 5.57 | 36.04 | 6.10 | 0.15 |
| 102 | 97.49 | 76.69 | 22.20 | 46.81 | … | 5.30 | 35.78 | 5.89 | 0.20 |
| 103 | 97.49 | 78.38 | 21.82 | 56.64 | … | 6.00 | 36.43 | 6.08 | 0.17 |
| 104 | 92.02 | 75.21 | 22.68 | 48.71 | … | 5.35 | 35.89 | 5.95 | 0.14 |
| 105 | 99.10 | 79.25 | 24.83 | 81.57 | … | 6.01 | 34.19 | 5.79 | 0.15 |
| 106 | 97.90 | 74.76 | 22.55 | 36.01 | … | 3.27 | 34.52 | 6.43 | 0.18 |
| 107 | 95.08 | 70.18 | 22.58 | 81.97 | … | 4.25 | 36.61 | 7.60 | 0.19 |
| 108 | 100.00 | 72.51 | 19.81 | 75.99 | … | 4.55 | 37.41 | 5.99 | 0.18 |
| 109 | 99.78 | 69.70 | 24.61 | 32.35 | … | 2.59 | 33.45 | 5.75 | 0.17 |
| 110 | 97.47 | 68.06 | 23.95 | 28.81 | … | 2.42 | 31.56 | 5.96 | 0.17 |
| 111 | 97.72 | 68.30 | 23.22 | 33.26 | … | 2.32 | 33.08 | 6.07 | 0.17 |
Table 9.
Driving style data sample under no-load conditions.
| No. | TPS_max | TPS_mean | TPS_std | wx3_max | wx3_std | GPSV_max | GPSV_mean | GPSV_std | ax1_max |
|---|---|---|---|---|---|---|---|---|---|
| 1 | 93.35 | 14.71 | 19.66 | 47.55 | 3.15 | 34.34 | 27.83 | 4.23 | 0.30 |
| 2 | 72.08 | 14.43 | 18.50 | 30.88 | 2.87 | 34.85 | 29.39 | 2.01 | 0.23 |
| 3 | 98.45 | 17.33 | 21.87 | 54.93 | 3.37 | 35.63 | 28.46 | 5.08 | 0.50 |
| 4 | 88.52 | 18.72 | 22.64 | 50.05 | 4.43 | 35.65 | 28.74 | 5.34 | 0.30 |
| 5 | 81.13 | 16.67 | 19.66 | 16.97 | 1.97 | 33.70 | 29.80 | 2.00 | 0.29 |
| 6 | 75.20 | 15.70 | 19.19 | 21.85 | 2.17 | 34.24 | 28.45 | 2.69 | 0.26 |
| 7 | 79.20 | 15.56 | 19.47 | 34.88 | 3.06 | 33.97 | 29.25 | 1.92 | 0.28 |
| 8 | 82.95 | 15.18 | 19.03 | 53.96 | 3.30 | 33.15 | 28.44 | 2.26 | 0.32 |
| 9 | 72.54 | 17.97 | 18.17 | 28.63 | 2.16 | 33.24 | 28.53 | 2.88 | 0.29 |
| 10 | 70.14 | 18.76 | 19.49 | 29.18 | 3.02 | 34.56 | 28.72 | 6.55 | 0.29 |
| 11 | 70.24 | 17.86 | 19.91 | 23.74 | 2.84 | 34.28 | 30.55 | 1.98 | 0.28 |
| 12 | 69.42 | 16.66 | 18.26 | 21.36 | 2.28 | 34.67 | 27.13 | 4.35 | 0.25 |
| … | … | … | … | … | … | … | … | ||
| 96 | 66.96 | 20.97 | 20.62 | 38.70 | 3.83 | 33.58 | 28.72 | 2.44 | 0.26 |
| 97 | 72.02 | 23.01 | 20.16 | 34.00 | 2.95 | 34.84 | 23.22 | 5.89 | 0.30 |
| 98 | 82.78 | 22.10 | 23.34 | 46.05 | 6.85 | 36.52 | 28.77 | 5.93 | 0.28 |
| 99 | 82.72 | 20.08 | 21.53 | 38.45 | 6.50 | 36.50 | 28.69 | 7.76 | 0.27 |
| 100 | 84.40 | 21.31 | 22.06 | 57.25 | 6.39 | 38.95 | 32.14 | 2.00 | 0.31 |
| 101 | 84.93 | 22.28 | 23.12 | 44.62 | 6.91 | 37.73 | 29.16 | 8.91 | 0.31 |
| 102 | 76.64 | 21.76 | 21.79 | 58.65 | 7.01 | 40.37 | 32.00 | 2.06 | 0.30 |
| 103 | 82.41 | 21.84 | 21.87 | 41.14 | 5.97 | 37.06 | 30.46. | 5.49 | 0.38 |
| 104 | 80.91 | 23.15 | 22.28 | 40.47 | 7.62 | 38.32 | 32.16 | 3.24 | 0.29 |
| 105 | 95.59 | 20.36 | 23.35 | 58.41 | 5.71 | 39.58 | 31.57 | 2.24 | 0.38 |
| 106 | 78.34 | 22.36 | 21.80 | 38.88 | 3.19 | 33.78 | 24.65 | 8.90 | 0.41 |
| 107 | 68.77 | 17.39 | 19.42 | 34.12 | 2.43 | 33.58 | 28.91 | 1.84 | 0.41 |
| 108 | 63.84 | 15.35 | 19.51 | 40.41 | 2.47 | 37.84 | 27.45 | 2.74 | 0.30 |
Table 10.
Clustering results under no-load conditions.
| Parameter | Implication | Cluster0 (Normal) | Cluster1 (Soft) | Cluster2 (Aggressive) |
|---|---|---|---|---|
| TPS_max | Maximum throttle opening | 73.81 | 65.00 | 87.03 |
| TPS_mean | Average throttle opening | 17.62 | 16.29 | 19.02 |
| TPS_std | Standard deviation of throttle opening | 19.58 | 18.60 | 21.41 |
| wx3_max | Maximum angular velocity of throttle pedal | 36.15 | 24.33 | 53.25 |
| wx3_std | Standard deviation of angular velocity | 3.46 | 2.22 | 4.64 |
| GPSV_max | Maximum speed | 36.26 | 36.06 | 36.98 |
| GPSV_mean | Average speed | 30.06 | 29.81 | 29.92 |
| GPSV_std | Standard deviation of speed | 3.32 | 3.36 | 3.90 |
| ax1_max | Maximum longitudinal acceleration | 0.30 | 0.29 | 0.31 |
| z | Classification number | 42 | 51 | 15 |
Table 11.
Clustering results under heavy-load conditions.
| Parameter | Implication | Cluster2 (Normal) | Cluster0 (Soft) | Cluster1 (Aggressive) |
|---|---|---|---|---|
| TPS_max | Maximum throttle opening | 98.23 | 97.13 | 97.96 |
| TPS_mean | Average throttle opening | 75.8 | 72.66 | 74.98 |
| TPS_std | Standard deviation of throttle opening | 24.87 | 23.46 | 24.52 |
| wx3_max | Maximum angular velocity of throttle pedal | 43.05 | 25.09 | 68.76 |
| wx3_mean | Average angular velocity of throttle pedal | 1.95 | 1.71 | 2.18 |
| wx3_std | Standard deviation of angular velocity | 3.24 | 2.41 | 4.34 |
| GPSV_max | Maximum speed | 34.75 | 34.01 | 34.91 |
| GPSV_mean | Average speed | 23.29 | 22.93 | 22.98 |
| GPSV_std | Standard deviation of speed | 5.53 | 5.3 | 5.77 |
| ax1_max | Maximum longitudinal acceleration | 0.17 | 0.17 | 0.17 |
| z | Classification number | 40 | 56 | 15 |
Table 12.
Random forest (RF) grid search parameter optimization.
| Type | N-estimator | Max_depth | Accuracy |
|---|---|---|---|
| Load | 20 | 7 | 95.49 % |
| No load | 60 | 6 | 90.74% |
Table 13.
K-nearest neighbor (KNN) grid search parameter optimization.
| Type | N_neighbors | Weights | Accuracy |
|---|---|---|---|
| Load | 16 | uniform | 77.48% |
| No load | 4 | uniform | 73.15% |
Table 14.
Support vector machine (SVM) grid search parameter optimization.
| Type | Kernel | C | Gamma | Accuracy |
|---|---|---|---|---|
| Load | rbf | 100 | 0.01 | 82.88% |
| No load | rbf | 10 | 0.01 | 87.96% |
Table 15.
Neural network (NN) grid search parameter optimization.
| Type | Number of Layers | Number of Nodes | Max_iter | Alpha | Accuracy |
|---|---|---|---|---|---|
| Load | 2 | 100 | 1500 | 1 | 82.89% |
| No load | 2 | 100 | 1500 | 0.5 | 82.41% |
Table 16.
Confusion matrix.
| Actual Results | Prediction Results | Prediction Results |
|---|---|---|
| Positive Samples | Negative Samples | |
| Positive Samples | TP | FN |
| Negative Samples | FP | TN |
Table 17.
Evaluation index of the single driving style identification model under heavy-load conditions.
Table 17.
Evaluation index of the single driving style identification model under heavy-load conditions.
| Driving Style | Sample Size | Precision | Recall | F-Score | Identification Accuracy |
|---|---|---|---|---|---|
| Soft | 56 | 1.00 | 1.00 | 1.00 | 100% |
| Aggressive | 15 | 0.93 | 0.87 | 0.90 | 80% |
| Normal | 40 | 0.95 | 0.97 | 0.96 | 95% |
Table 18.
Evaluation index of the single driving style identification model under no-load conditions.
Table 18.
Evaluation index of the single driving style identification model under no-load conditions.
| Driving Style | Sample Size | Precision | Recall | F-Score | Identification Accuracy |
|---|---|---|---|---|---|
| Soft | 51 | 0.94 | 1.00 | 0.97 | 88.23% |
| Aggressive | 15 | 1.00 | 0.60 | 0.75 | 93.33% |
| Normal | 42 | 0.87 | 0.93 | 0.90 | 92.85% |
Table 19.
Statistics on fuel consumption of different drivers.
| Driver Number | Total Fuel Consumption (L) | Cycle Number | Unit Consumption(L) | Dump Site Elevation (m) |
|---|---|---|---|---|
| 1 | 712 | 9 | 79.1 | 1055 |
| 2 | 903 | 13 | 69.4 | 1055 |
| 4 | 776 | 12 | 64.6 | 1055 |
| 5 | 1031 | 20 | 51.5 | 1035 |
| 6 | 741 | 13 | 57 | 1035 |
© 2019 by the authors. Licensee MDPI, Basel, Switzerland. This article is an open access article distributed under the terms and conditions of the Creative Commons Attribution (CC BY) license (http://creativecommons.org/licenses/by/4.0/).
Share and Cite
MDPI and ACS Style
Wang, Q.; Zhang, R.; Wang, Y.; Lv, S. Machine Learning-Based Driving Style Identification of Truck Drivers in Open-Pit Mines. Electronics 2020, 9, 19. https://0-doi-org.brum.beds.ac.uk/10.3390/electronics9010019
AMA Style
Wang Q, Zhang R, Wang Y, Lv S. Machine Learning-Based Driving Style Identification of Truck Drivers in Open-Pit Mines. Electronics. 2020; 9(1):19. https://0-doi-org.brum.beds.ac.uk/10.3390/electronics9010019
Chicago/Turabian StyleWang, Qun, Ruixin Zhang, Yangting Wang, and Shuaikang Lv. 2020. "Machine Learning-Based Driving Style Identification of Truck Drivers in Open-Pit Mines" Electronics 9, no. 1: 19. https://0-doi-org.brum.beds.ac.uk/10.3390/electronics9010019
Note that from the first issue of 2016, this journal uses article numbers instead of page numbers. See further details here.