Article

An Efficient Hybrid Fuzzy-Clustering Driven 3D-Modeling of Magnetic Resonance Imagery for Enhanced Brain Tumor Diagnosis

by
Suresh Kanniappan
1,
Duraimurugan Samiayya
1,
Durai Raj Vincent P M
2,
Kathiravan Srinivasan
2,
Dushantha Nalin K. Jayakody
3,4,*,
Daniel Gutiérrez Reina
5 and
Atsushi Inoue
6
1
Department of Information Technology, St. Joseph’s College of Engineering, Chennai, Tamil Nadu 600119, India
2
School of Information Technology and Engineering, Vellore Institute of Technology (VIT), Vellore, Tamil Nadu 632014, India
3
School of Computer Science and Robotics, National Research Tomsk Polytechnic University, 634050 Tomsk, Russia
4
Centre for Telecommunication Research, Faculty of Engineering, Sri Lanka Technological Campus, Padukka 10500, Sri Lanka
5
Department of Electronic Engineering, University of Seville, 41092 Sevilla, Spain
6
Information Systems and Business Analytics Department, Eastern Washington University, Spokane, WA 99202, USA
*
Author to whom correspondence should be addressed.
Submission received: 4 January 2020 / Revised: 4 February 2020 / Accepted: 5 February 2020 / Published: 12 March 2020
(This article belongs to the Special Issue Biomedical Image Processing and Classification)

Abstract

:
Brain tumor detection and its analysis are essential in medical diagnosis. The proposed work focuses on segmenting abnormality of axial brain MR DICOM slices, as this format holds the advantage of conserving extensive metadata. The axial slices presume the left and right part of the brain is symmetric by a Line of Symmetry (LOS). A semi-automated system is designed to mine normal and abnormal structures from each brain MR slice in a DICOM study. In this work, Fuzzy clustering (FC) is applied to the DICOM slices to extract various clusters for different k. Then, the best-segmented image that has high inter-class rigidity is obtained using the silhouette fitness function. The clustered boundaries of the tissue classes further enhanced by morphological operations. The FC technique is hybridized with the standard image post-processing techniques such as marker controlled watershed segmentation (MCW), region growing (RG), and distance regularized level sets (DRLS). This procedure is implemented on renowned BRATS challenge dataset of different modalities and a clinical dataset containing axial T2 weighted MR images of a patient. The sequential analysis of the slices is performed using the metadata information present in the DICOM header. The validation of the segmentation procedures against the ground truth images authorizes that the segmented objects of DRLS through FC enhanced brain images attain maximum scores of Jaccard and Dice similarity coefficients. The average Jaccard and dice scores for segmenting tumor part for ten patient studies of the BRATS dataset are 0.79 and 0.88, also for the clinical study 0.78 and 0.86, respectively. Finally, 3D visualization and tumor volume estimation are done using accessible DICOM information.

1. Introduction

Brain tumor detection is crucial in medical diagnosis as it provides adequate information about anomalies present in the tissues. This information is necessary to understand the prognosis of the disease and also for treatment planning [1]. Magnetic Resonance Imaging (MRI) procedures help to sense the irregularities of human bodies in three dimensions, non-invasively. In particular, various segmentation techniques are applied to MR brain images by radiographers to identify the extent of abnormality present [2,3]. Recently, many Computer-Aided Detection (CAD) methods are employed for brain tumor detection [4,5,6]. Subsequently, radiologists anticipate that usage of CAD schemes over brain MR images can advance the diagnostic capabilities with their collaborative effects [7,8].
The Digital Imaging and Communications in Medicine (DICOM) standard image format delivers increased diagnostic relevance. DICOM-compliant MR imaging devices adhere to a specific protocol for archiving and communication of digital medical images. DICOM (.dcm) files afford metadata information such as patient study, equipment settings, and image characteristics-modality, size, bit depth, and dimensions. The DICOM header object is organized as a standard series of tags. These tags are categorized as groups such as image pixel, the image plane, MR/CT Image, and patient information [9,10].
The size of this header differs depending on data elements in each group. For, eg: the image plane module contains various vital parameters, which include image position, slice location, and pixel spacing. From these parameters, the spatial relationship between the slices is computed. DICOM facilitates to create private tags that define data elements accessed within the application created. Various imaging modalities stores digital images in DICOM format, which provides better volume of metadata compared to other formats. DICOM provides harmonization through which the patient under study is wholly analyzed and it also compatible with many commercial toolkits.
The patient dataset is inherently acquired by DICOM-compliant devices. Many methods had been proposed by researchers to segment desired features from the digital images. Intensity-based segmentation methods rely on fixing thresholds and are easier to implement [11]. However, due to high-intensity variations of MR images, the methods yield poor performance and lacks in piecewise continuity. Clustering techniques are standard iterative algorithms that is based on the minimization of an objective function. It considers the pixel intensity values for precisely classifying the image pixels. The extraction of cells or tissues based on morphology, clustering algorithms are used extensively. Many algorithms existing in the literature have the objective to yield better segmentation. With the K-means clustering algorithm [12], a large set of structures is distributed into disjoint and homogeneous clusters. Dhanachandra has attempted image segmentation using a hybrid combination of K-means clustering and the Subtractive Clustering Algorithm [13]. Abdel-Maksoud attempted a combined approach of K-means and Fuzzy C-means clustering technique for brain tumor detection [14]. Kim proposed quantization of full/partial (thickness) tear of rotator cuff tendon using Fuzzy C-Means based classification [15]. Dehariya proposed the segmentation of images using Fuzzy K-means clustering [16]. Gasch implemented Fuzzy k-means clustering as an analytical tool for mining biological perceptions from yeast gene-expression data [17]. Even clustering techniques perform faster computation, a wrong choice of k may produce inaccurate results.
Markov random fields (MRFs) benefit more straightforward implementation by encoding spatial data which expresses a set of parameters for specifying tumor voxels [18,19]. This method is very robust for MR images and their performance entirely depends on spatial constraints and hence not suitable for heterogeneous tissue classes. Statistical pattern recognition based methods also known as atlas-based segmentation methods, are effective only for bi-level segmentation. These approaches require healthier brain atlas that is modified significantly to accommodate the tumor part which may lead to poor results. Hybrid methods utilize the advantage of many models which is used in numerous applications by integrating different models within a system to enhance segmentation accuracy. Fuzzy clustering exhibits excellent performance on images containing homogeneous and heterogeneous tissue classes [20]. However, fuzzy clustering produces better results by choosing the proper selection of the number of clusters ‘k’.
In the literature, to assess the number of clusters, a metric-based method called silhouette score is used. It evaluates the number of clusters based on their proximity. The silhouette score is interpreted as excellent, moderate, weak and bad splits based on cluster selection. Lleti had attempted to optimize the silhouettes using a genetic algorithm in choosing variables for the K-means cluster examination [21]. Muca determined the optimal number of clusters based on the silhouette index for the K-means algorithm [22]. Robust segmentation based on the finest silhouette scores is performed on a set of DICOM slice sequences that assists in the segregation of abnormal portions from the brain tissue.
Numerous approaches have been proposed for the detection of various objects of interest after segmentation is performed. Zeng proposed K-means with a hybrid active contour model to generate an initial segmentation for segmenting thick-vessels in liver images [23]. Koulountzios developed a simple pipeline for segmenting the whole thoracic aorta into contours such as arch, descending, and ascending aorta from MR DICOM files containing thoracic region [24]. Nekooeimehr proposed a method for tracking and segmenting organ contours using k-means clustering with prior information [25]. Wang has attempted contour refinement using an active contour model to segregate candidate cavernoma sections from brain MR slices [26]. An improved performance utilizing local and global image information for contour detection into a hierarchical region tree [27]. Essadike suggested Van der Lugt correlator-based initial contour to assist an active contour model in extracting tumor boundaries [28].
Morphology is a broad set of non-linear operations that process images that rely on shape and texture classification [29,30]. Ali attempted the K-Means Clustering technique for accounting pixel intensities and locations [31]. The author had applied to dilate and erode morphological operations to abstract the tumor part from the brain tumors, which also aided to eliminate small isolated points. Deng employed morphological operators to enhance the extracted ulcer area from ocular staining images [32].
A comparative investigation between the mined region of interest (ROI) and master segmented (Ground Truth) images is carried out with the well-known image similarity measures [33,34]. The Jaccard and Dice coefficients are calculated to validate the segmentation performed on each slice against their corresponding ground truth object. Modeling 3D view of a patient study requires resampling and image interpolation methods [35] to align the abnormal intensities in the spatial domain geometrically.
The key contributions of this work are summarized as follows:
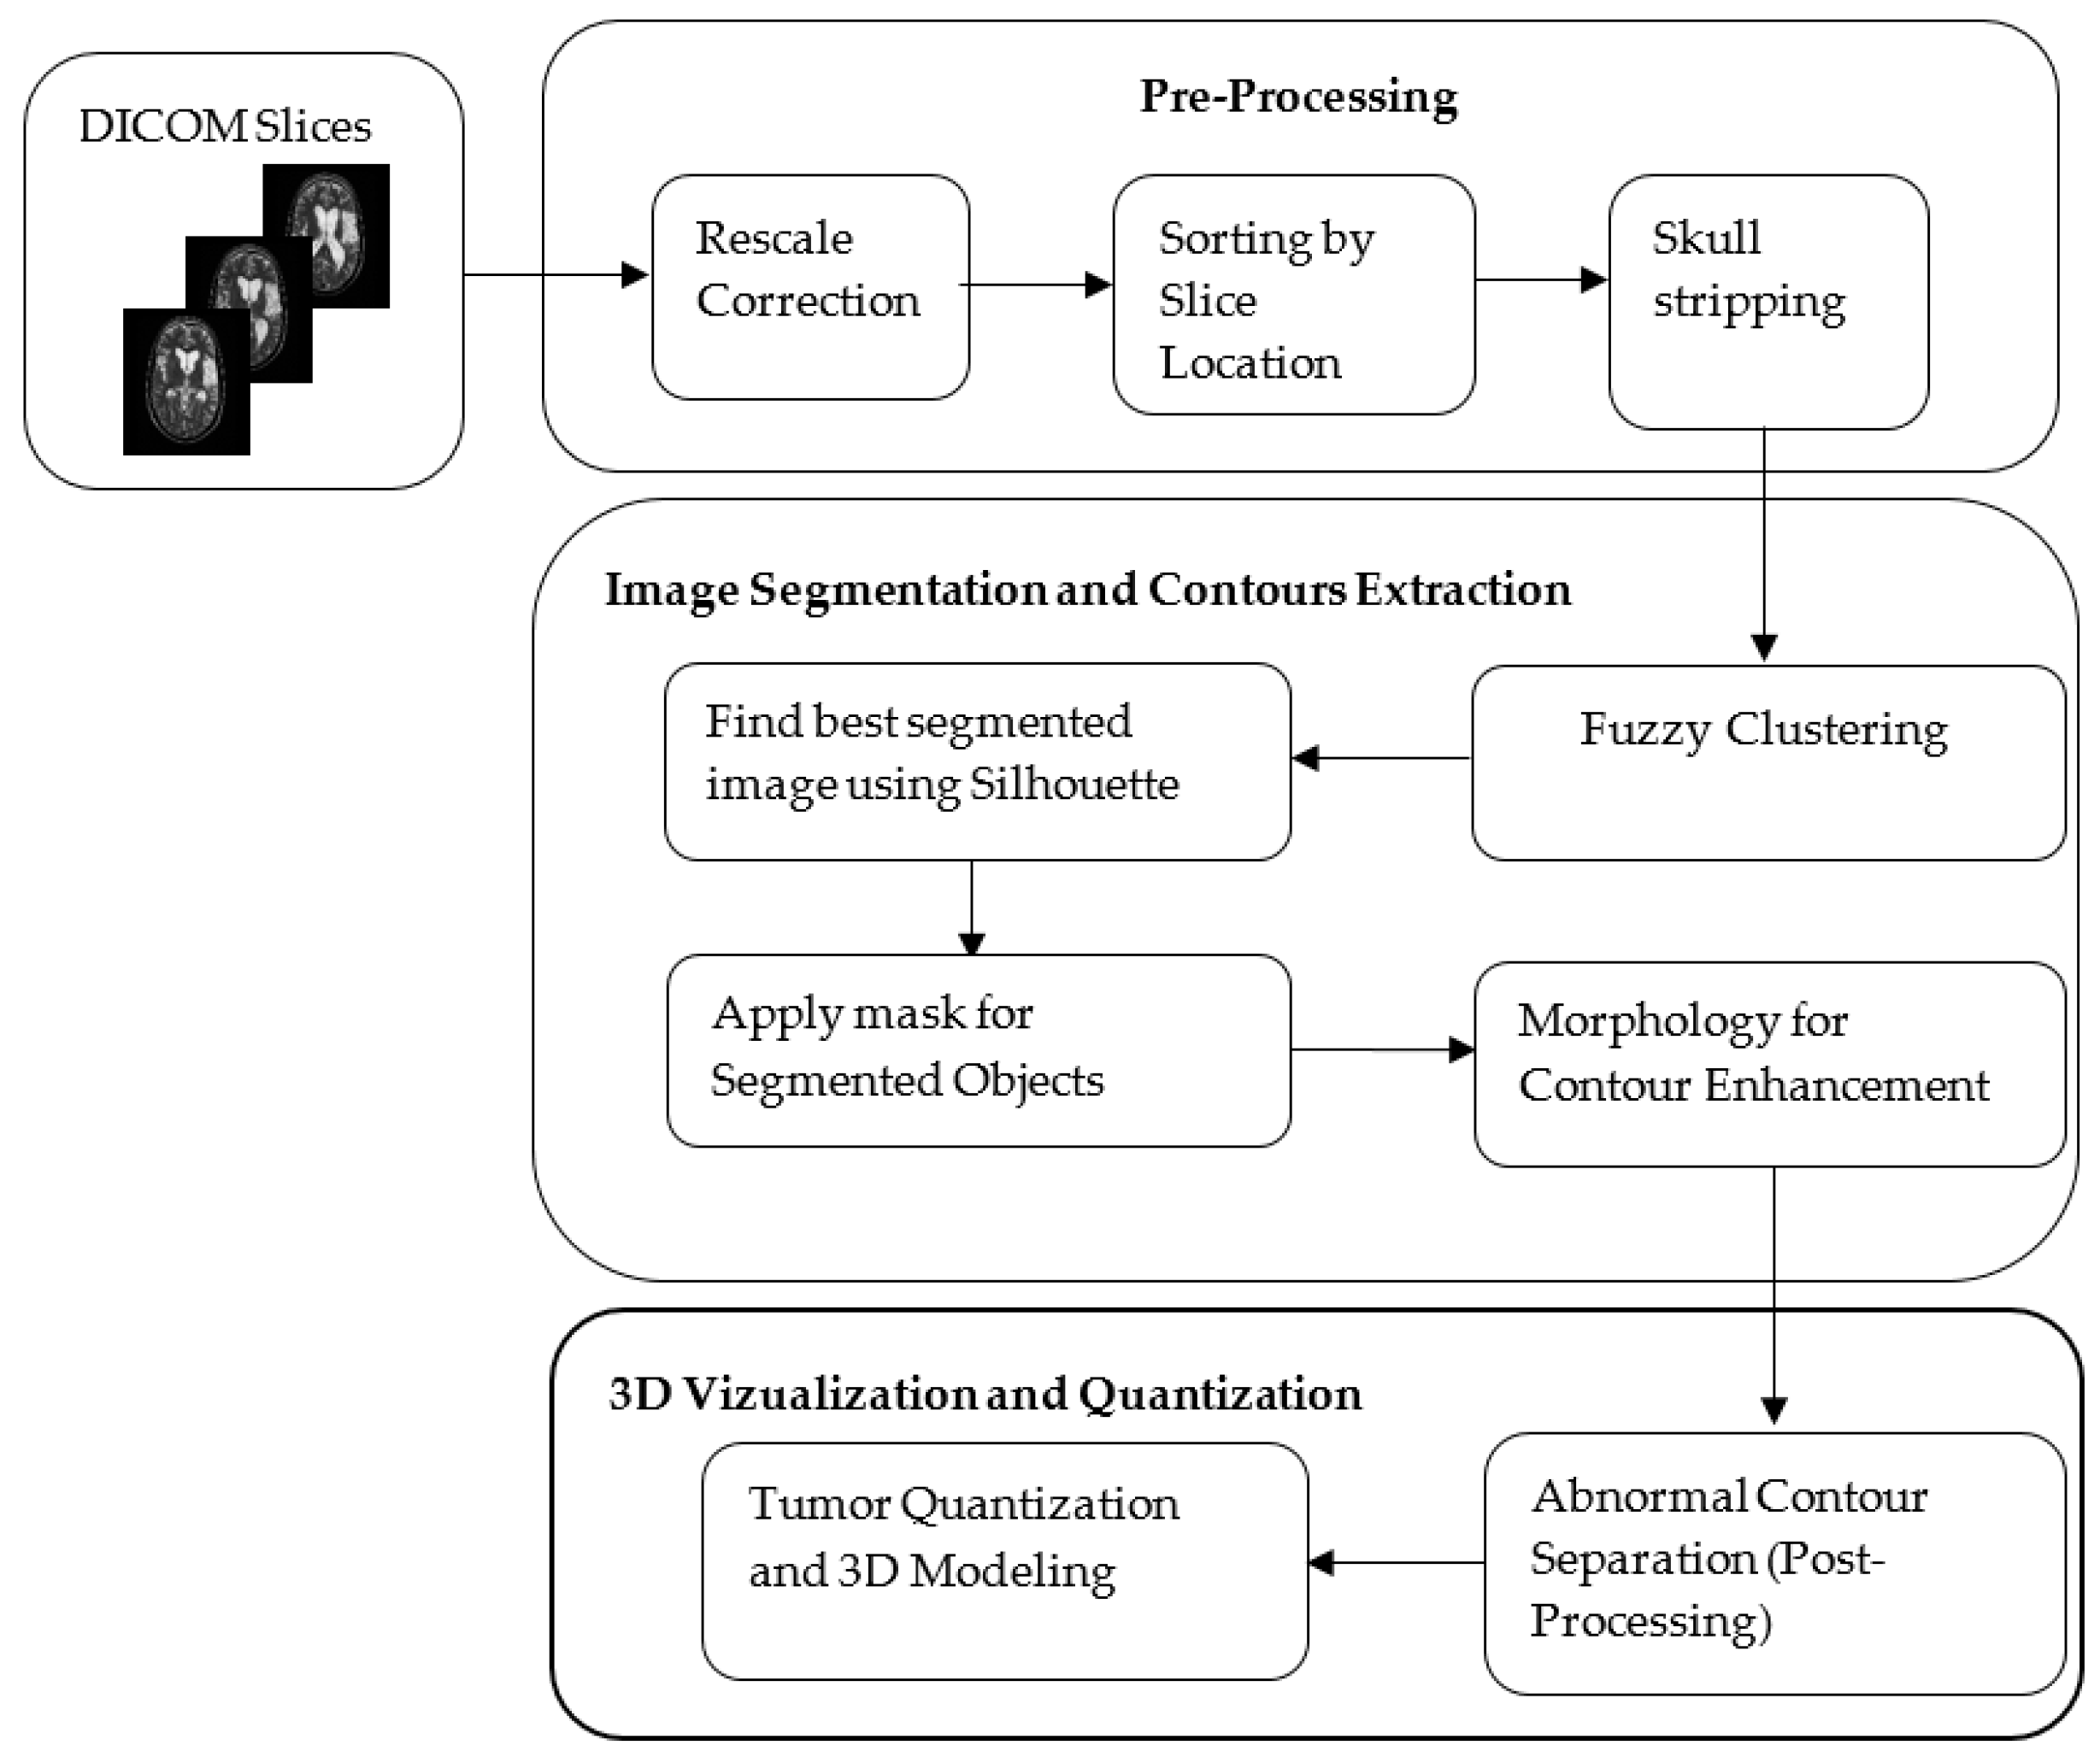
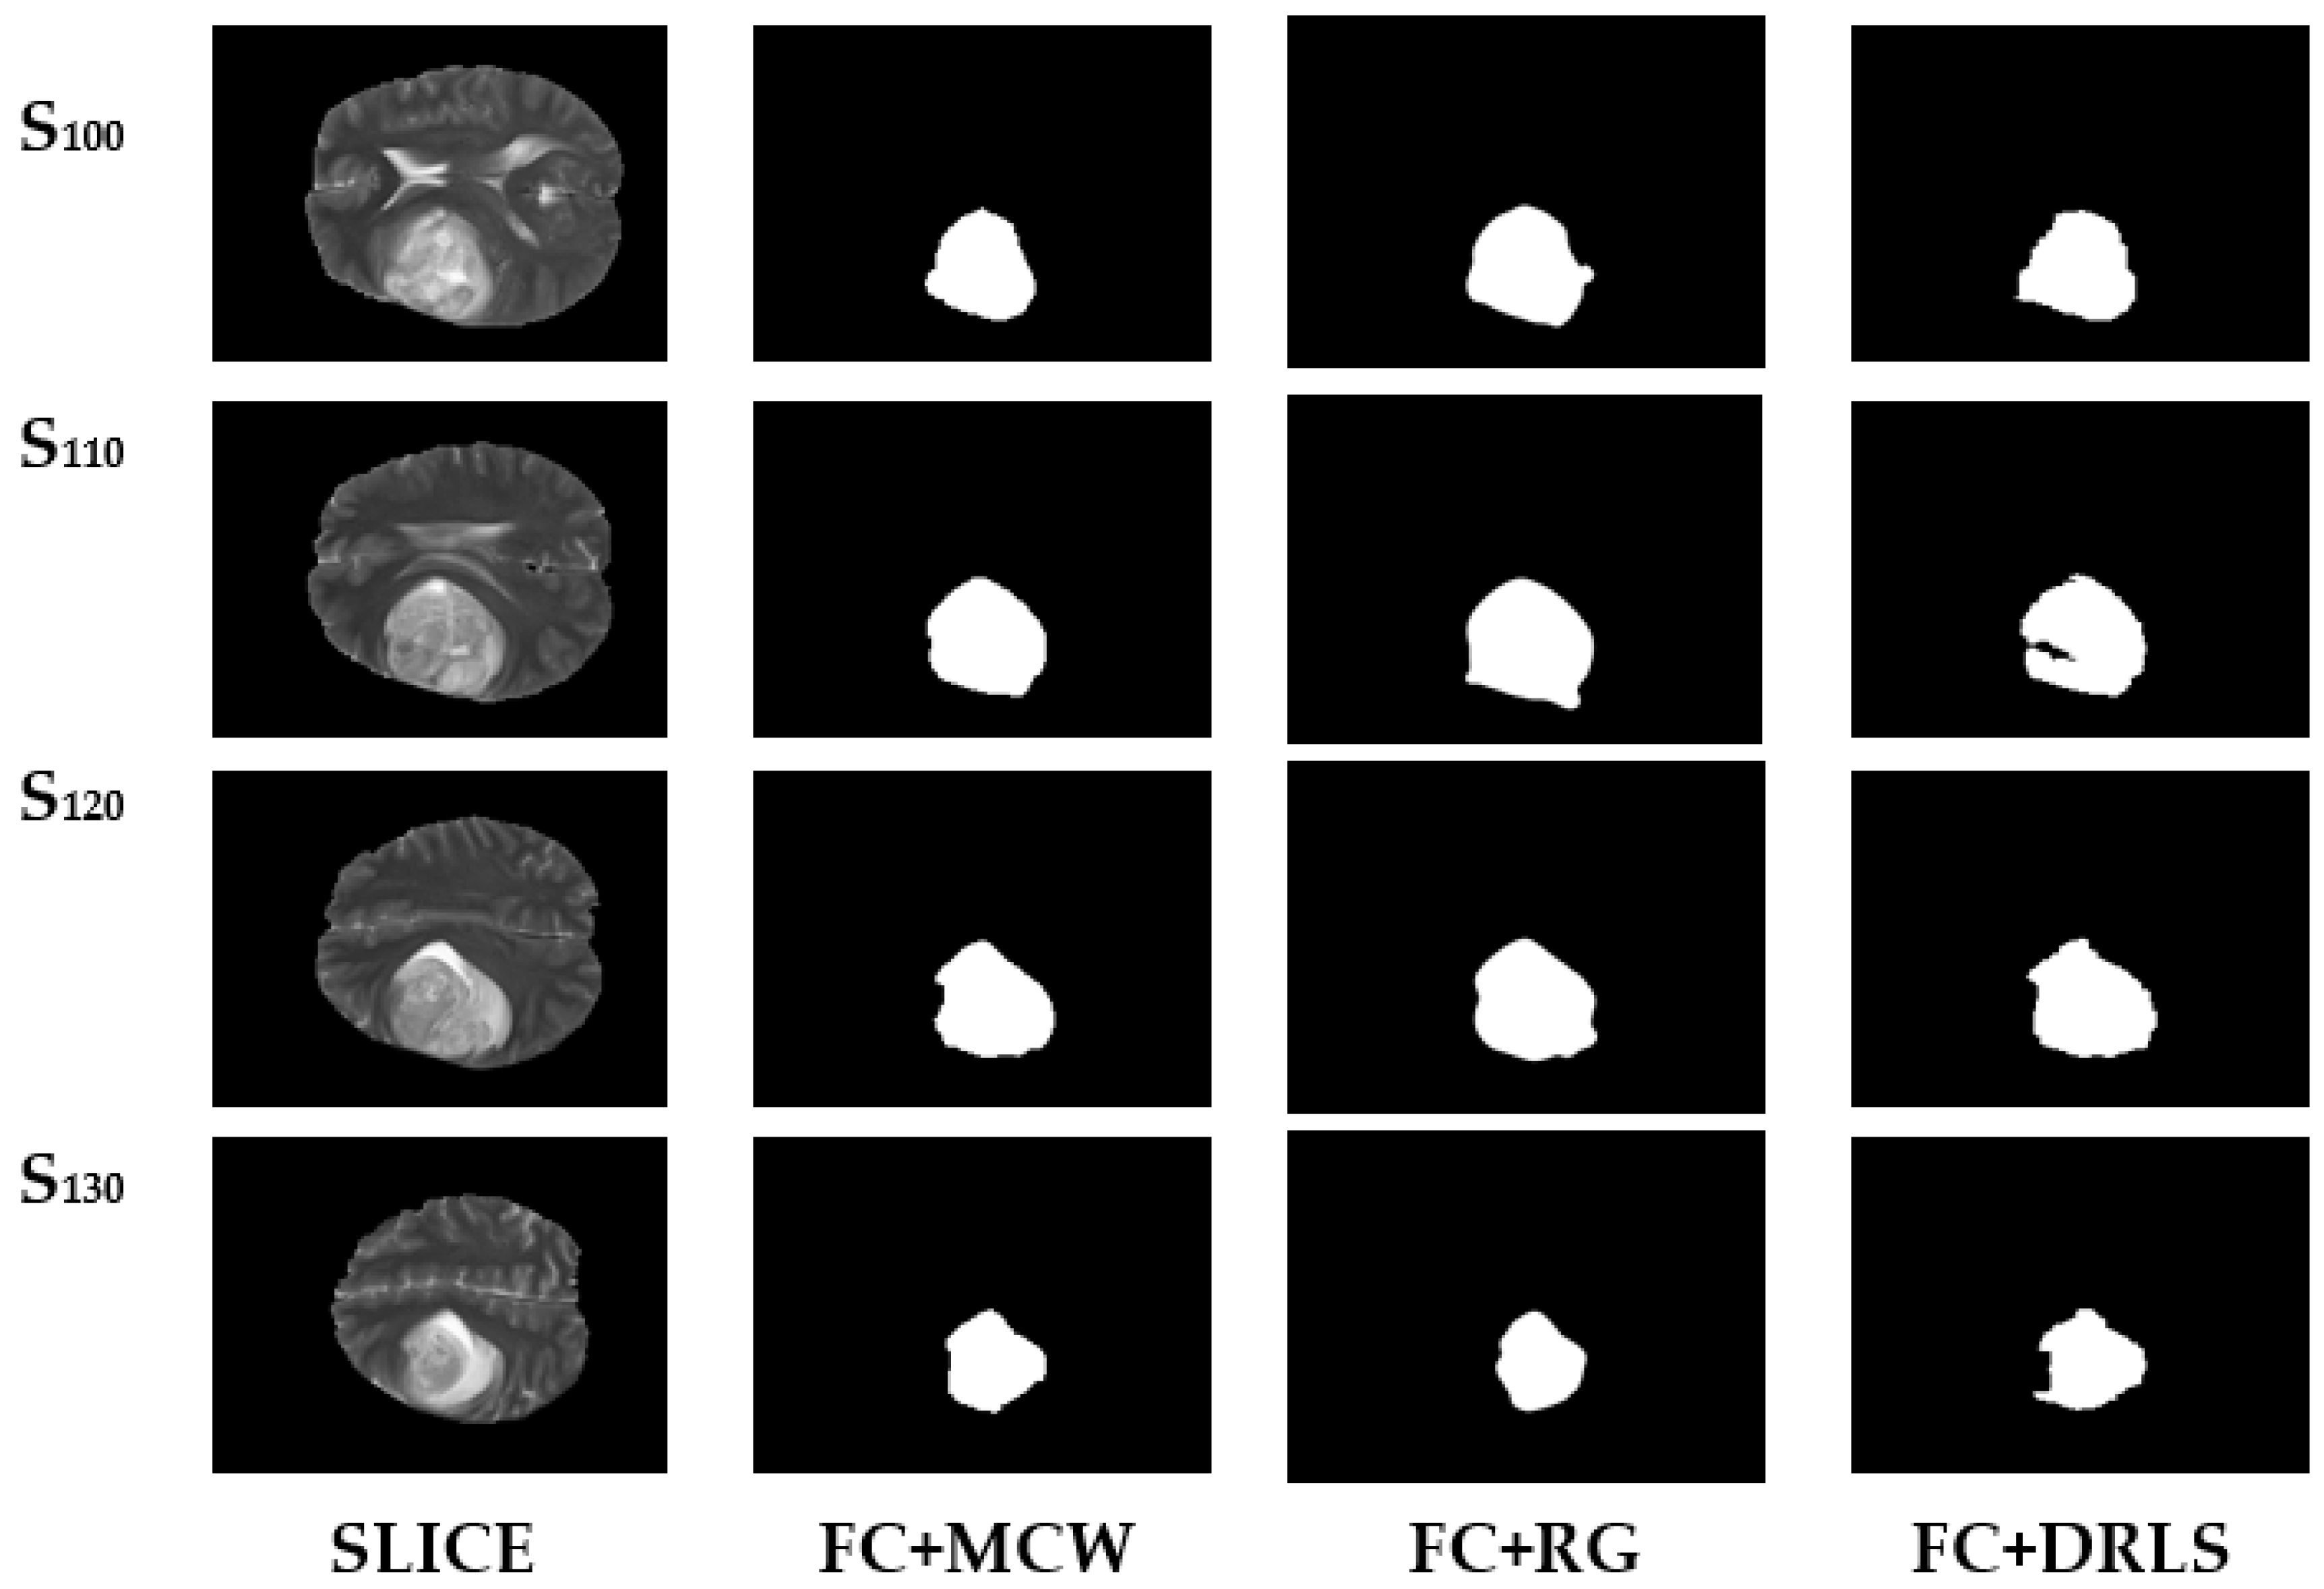
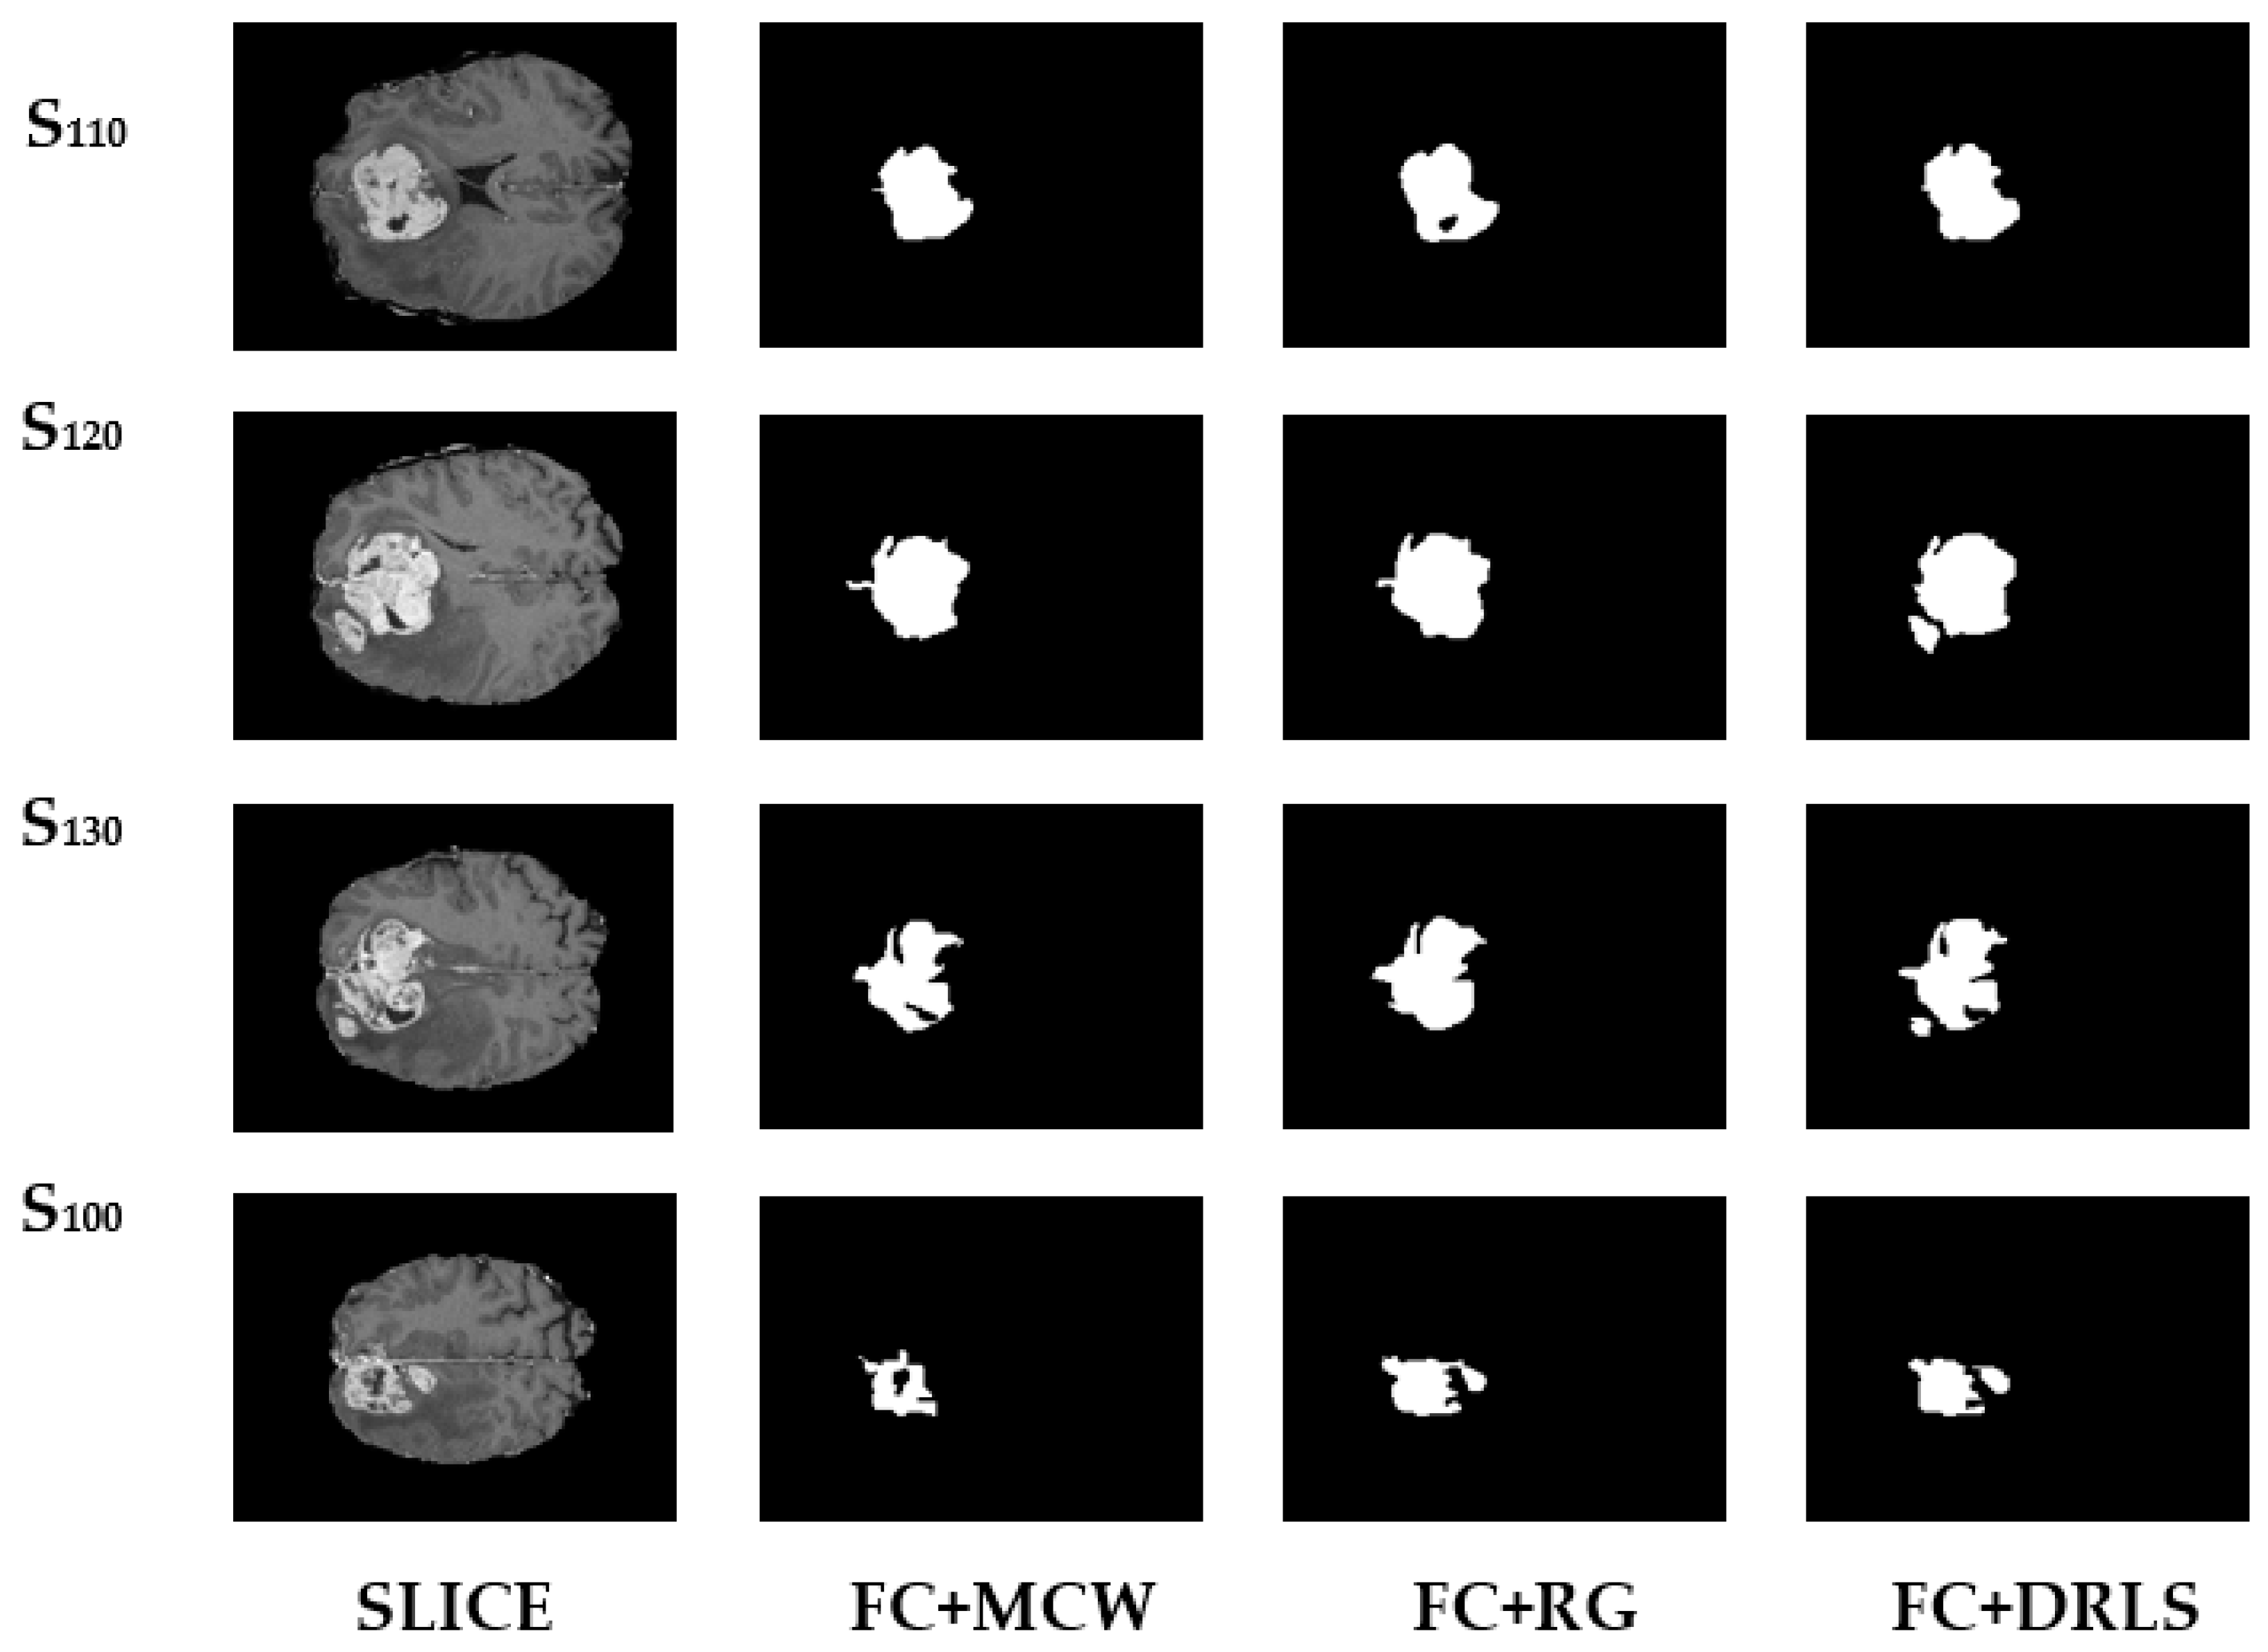
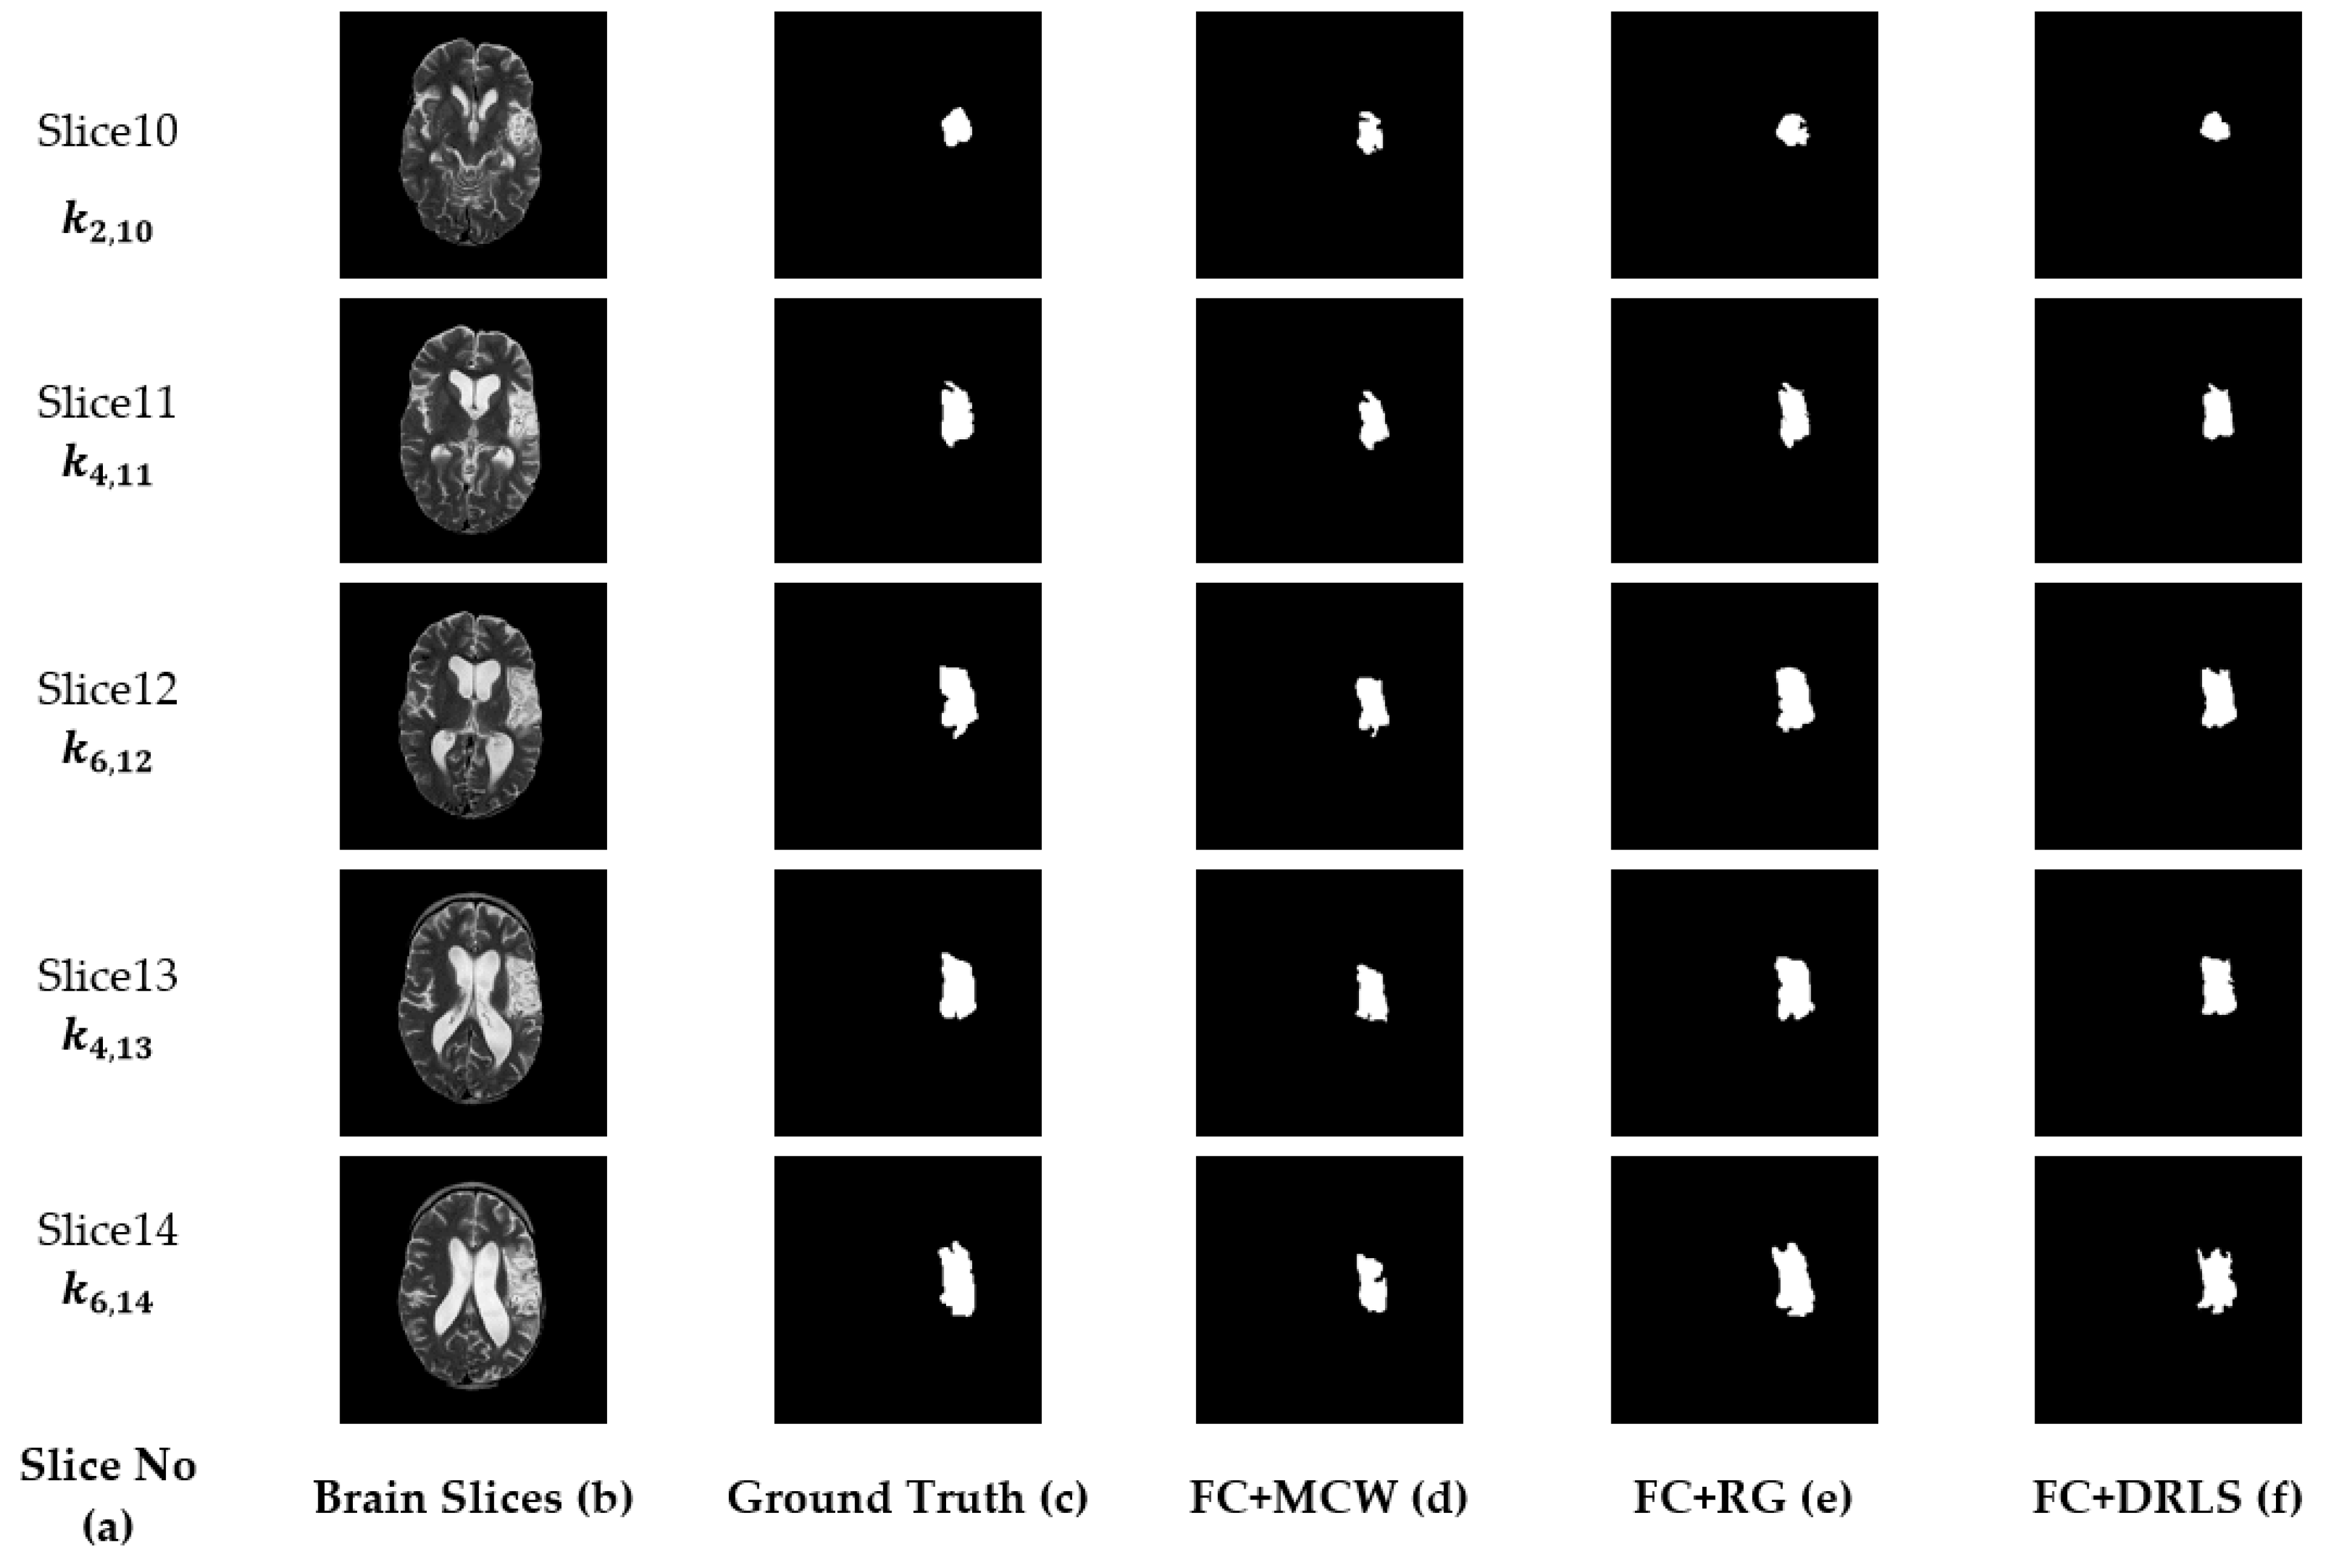
  • This research study uses the advantage of fuzzy clustering (for image enhancement) hybridized with Distance Regularized Level Set technique to effectively mine the region of interest form the brain slices.
  • In this work, for each brain slice we have utilized the attributes of DICOM standards such as Image position patient, Pixel spacing and Image orientation patient, which is essential for generating the 3D model of brain structures and volumetric analysis.
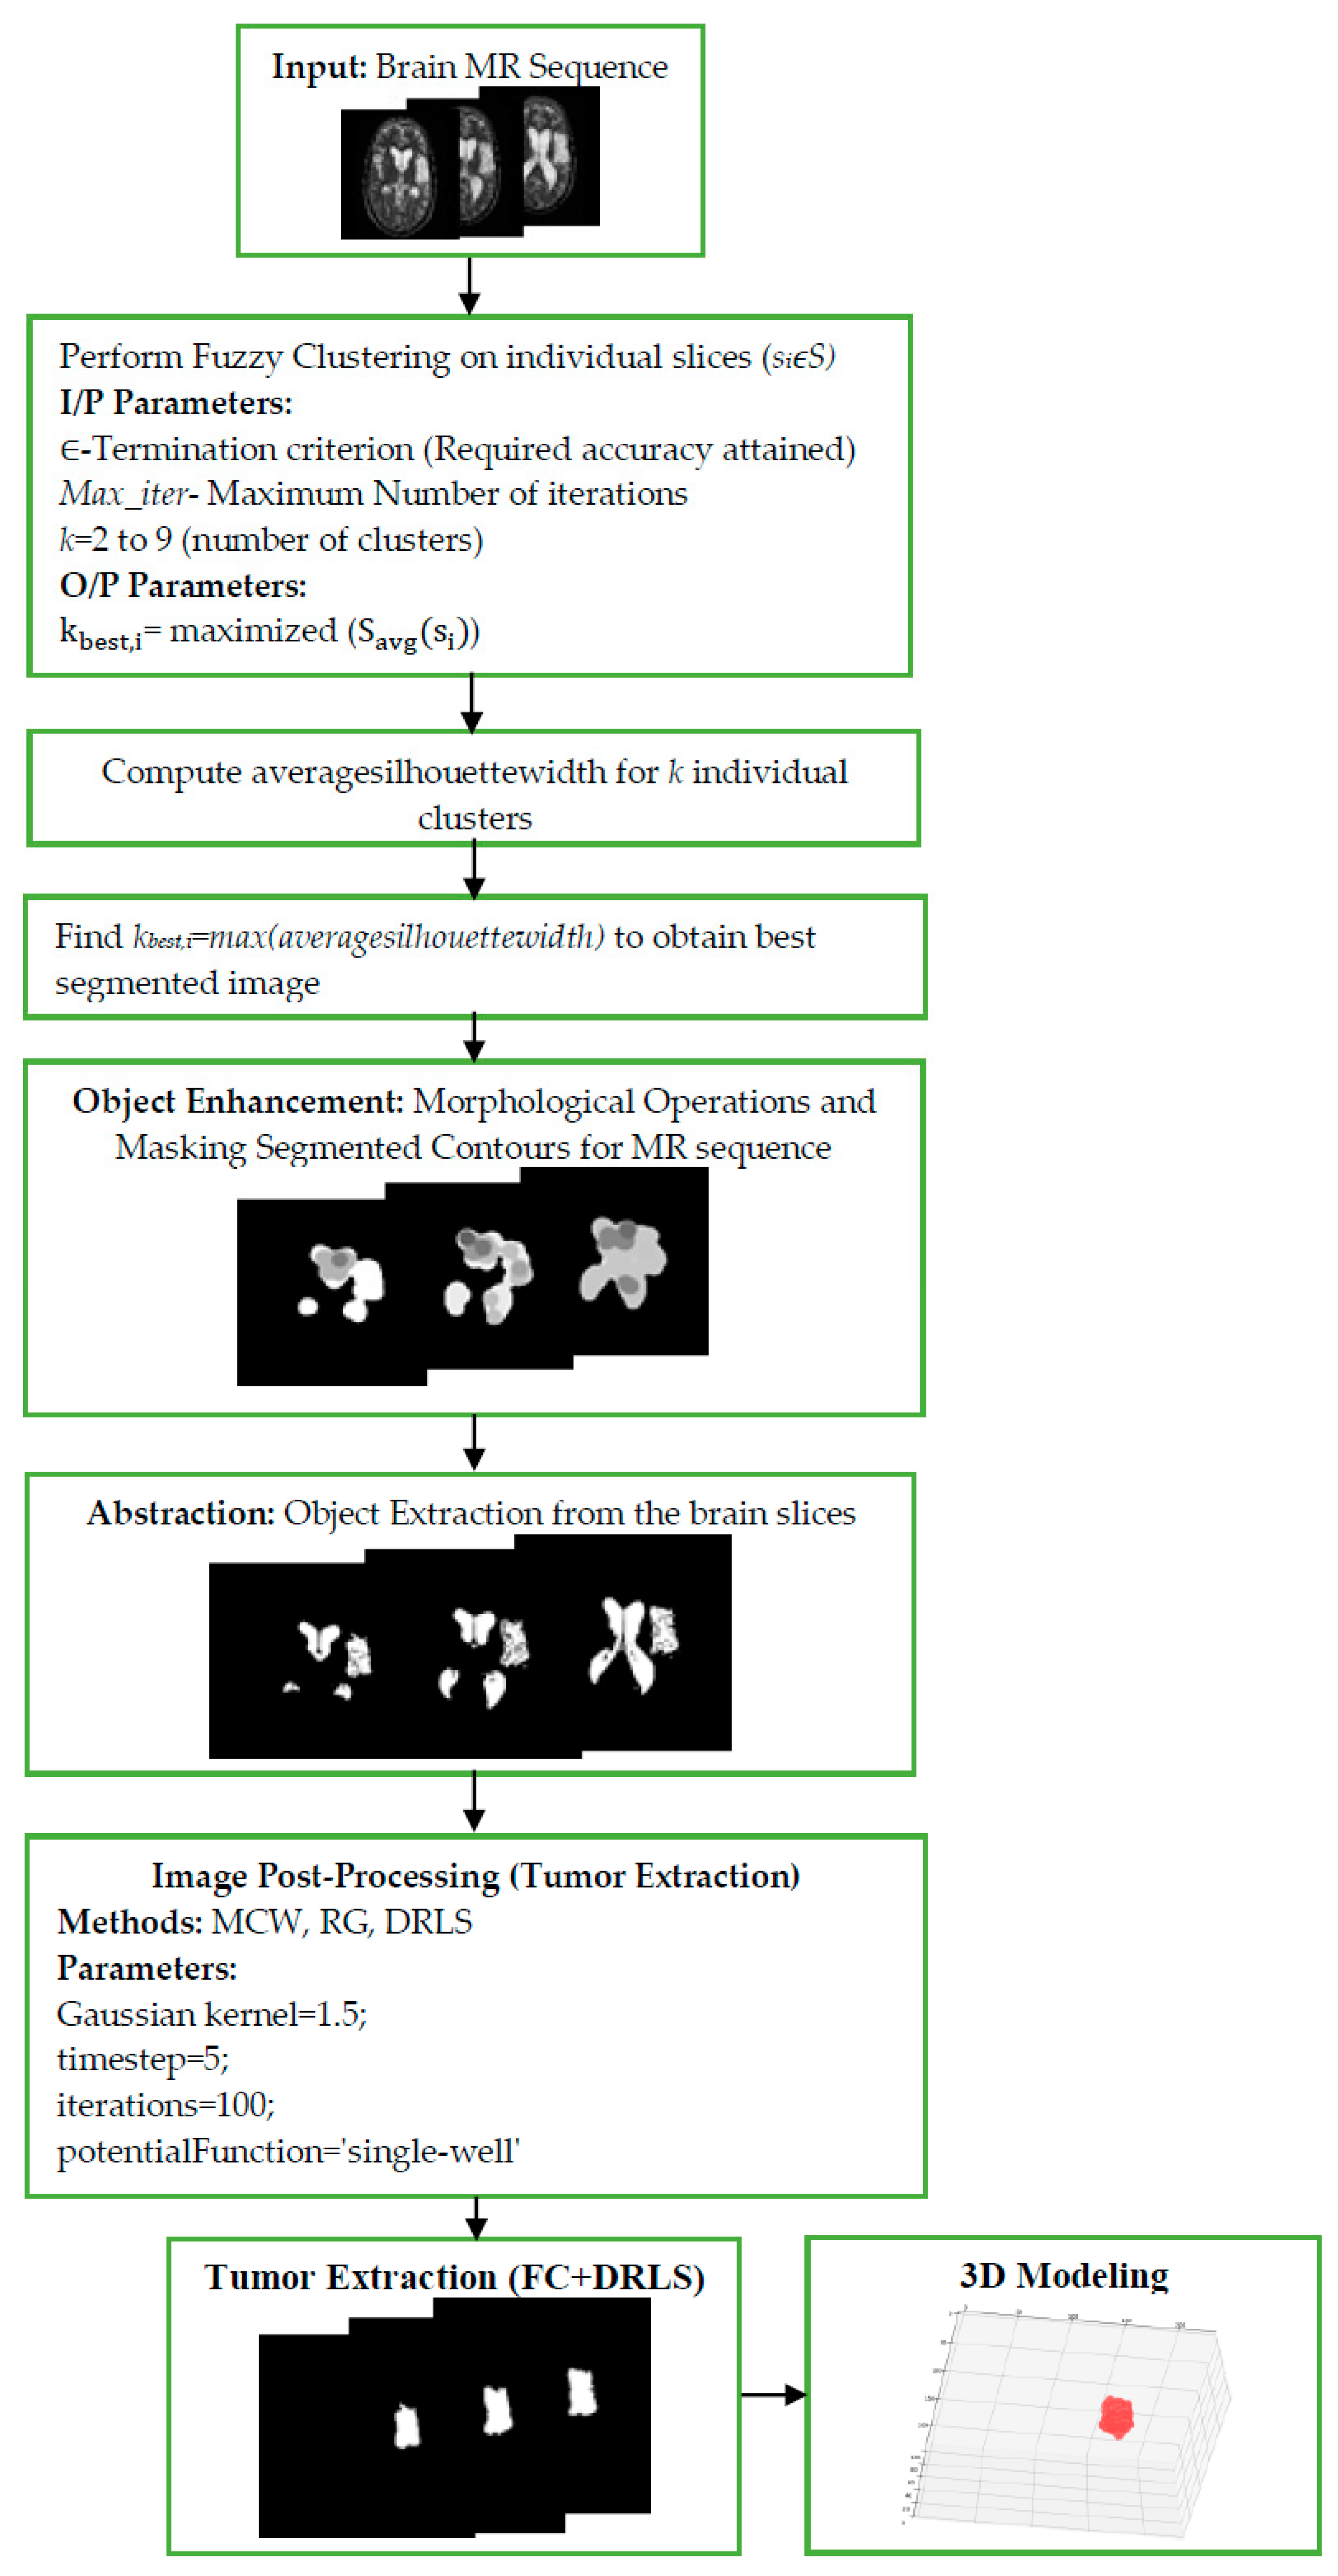
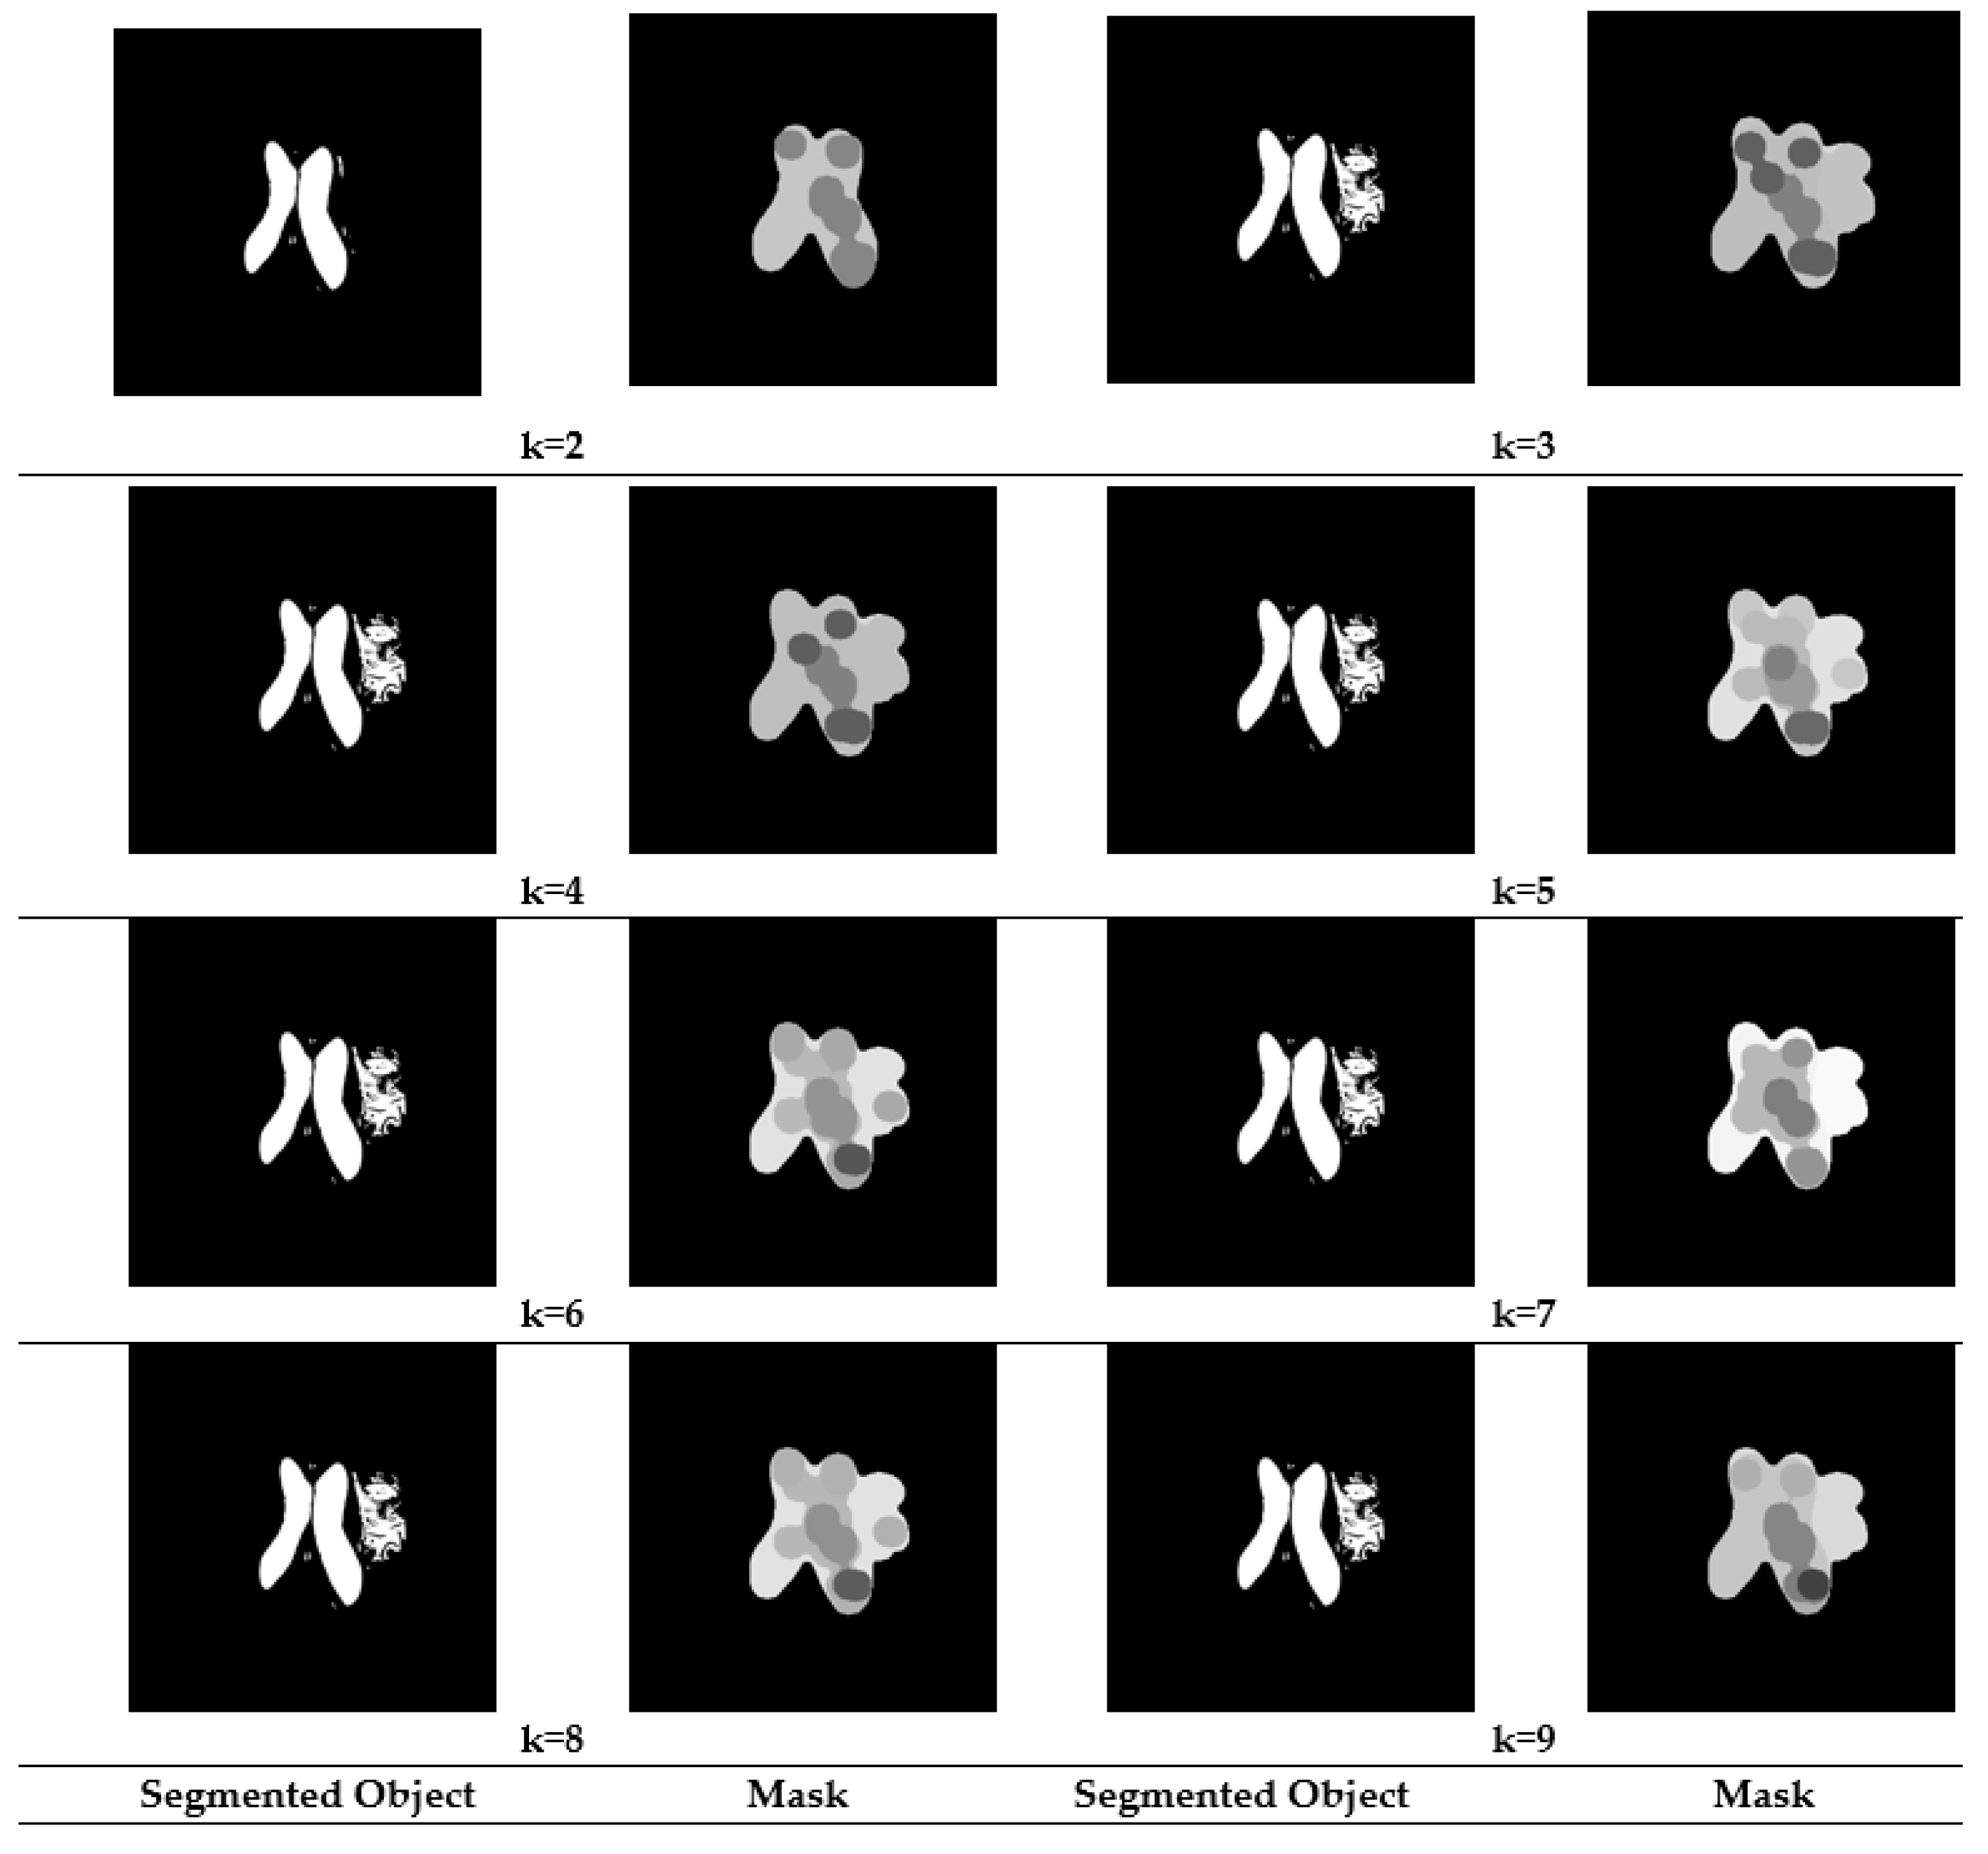
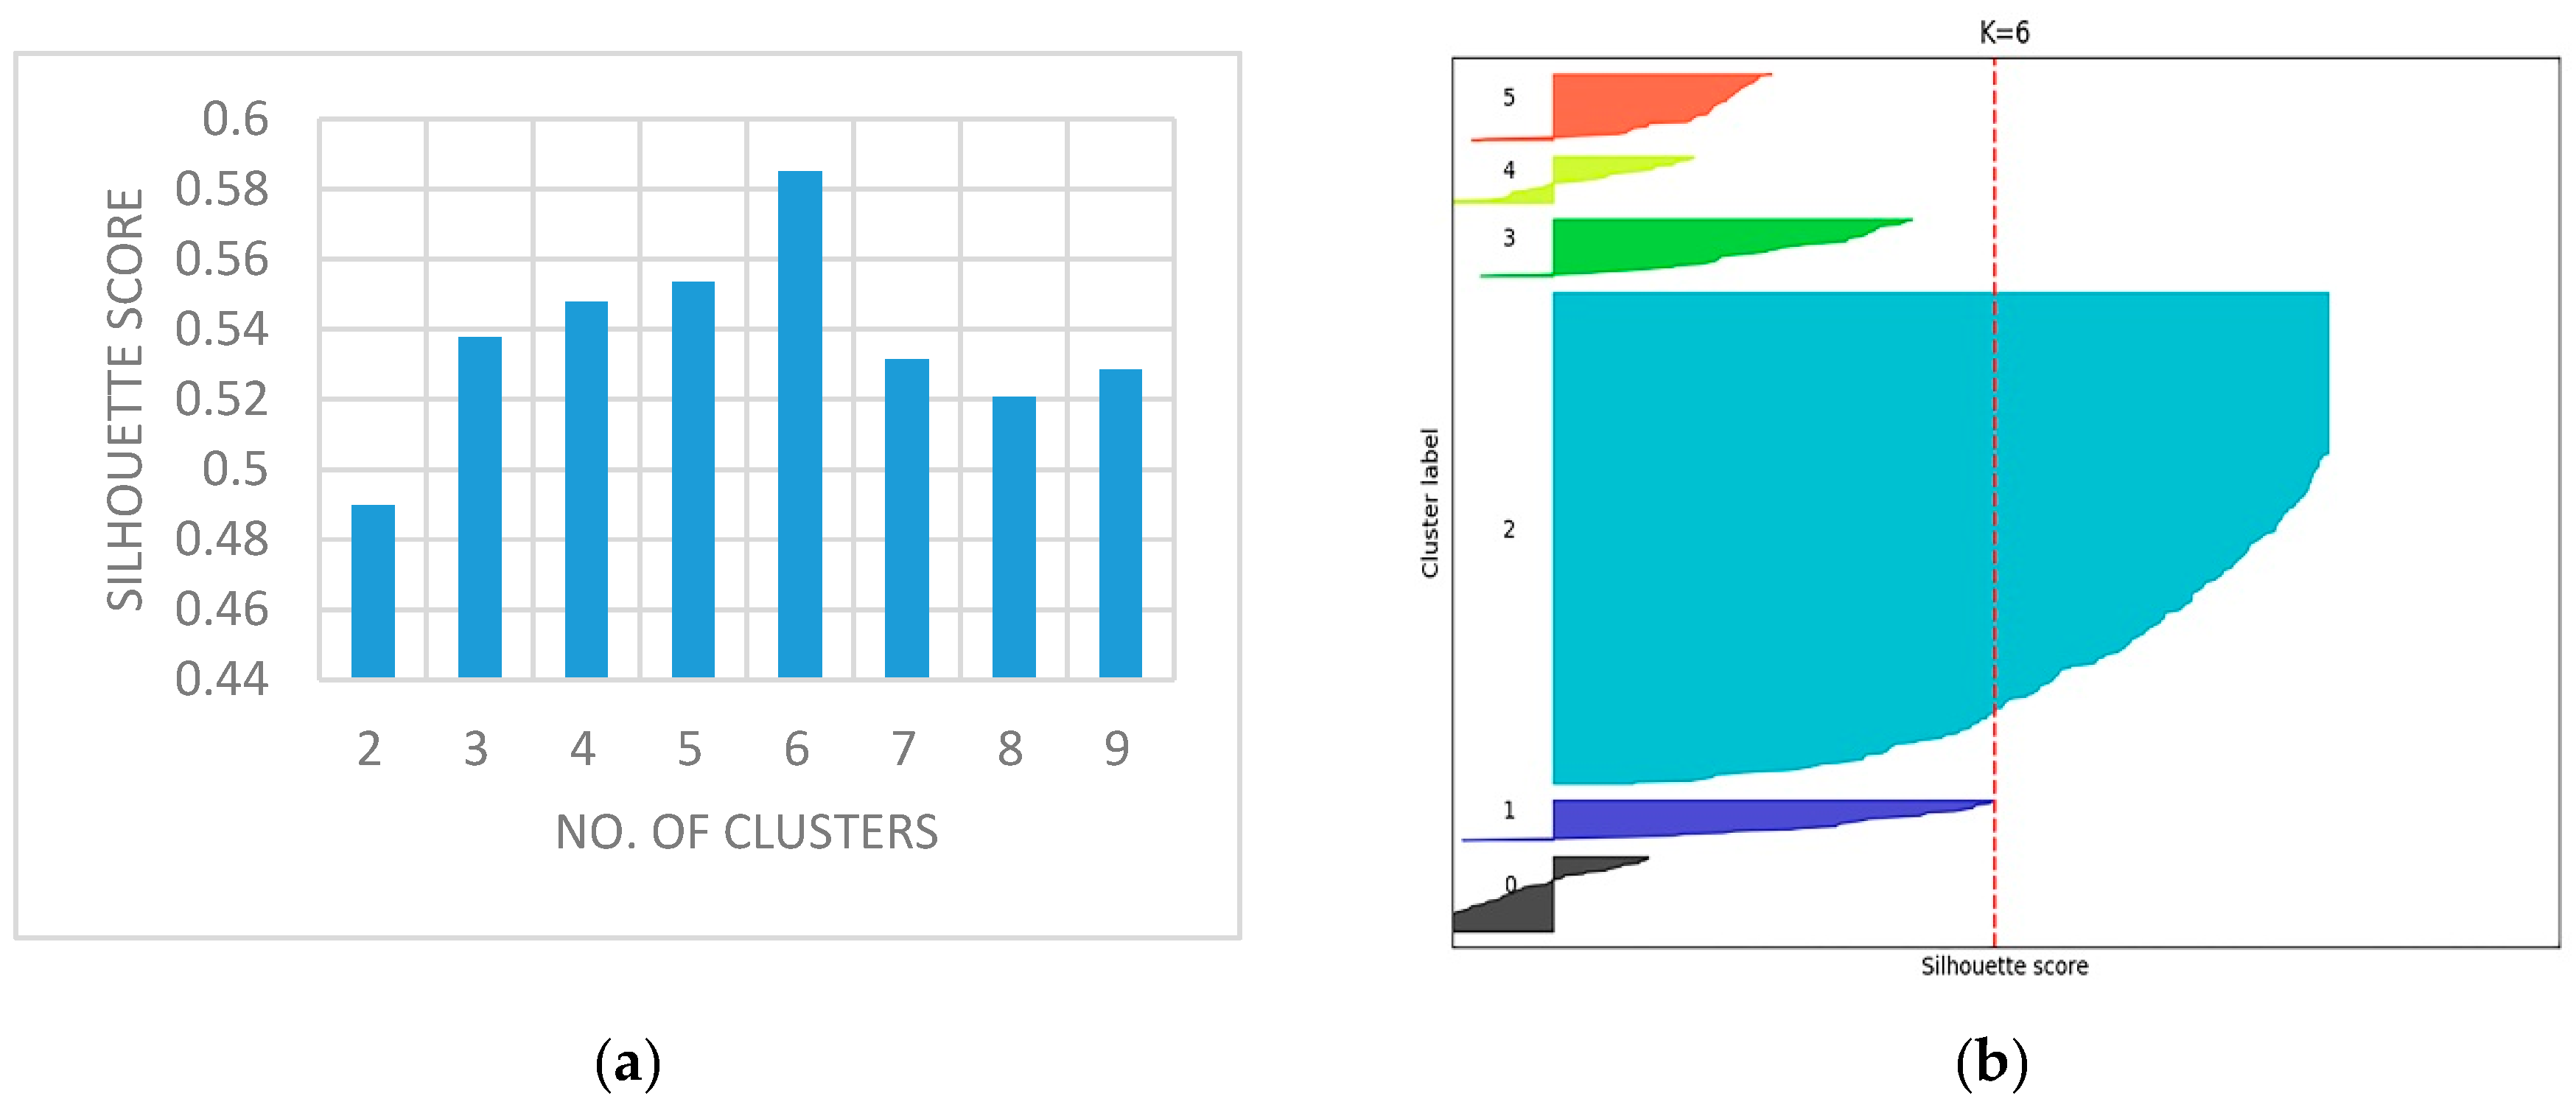
  • For image enhancement in identifying the objects of interest, fuzzy clustering is employed through proper selection of the number of clusters ‘k’ validated using the silhouette metric. The appropriate k is chosen based on the silhouette metric among the number of clusters (k) ranging from 2 to 9.
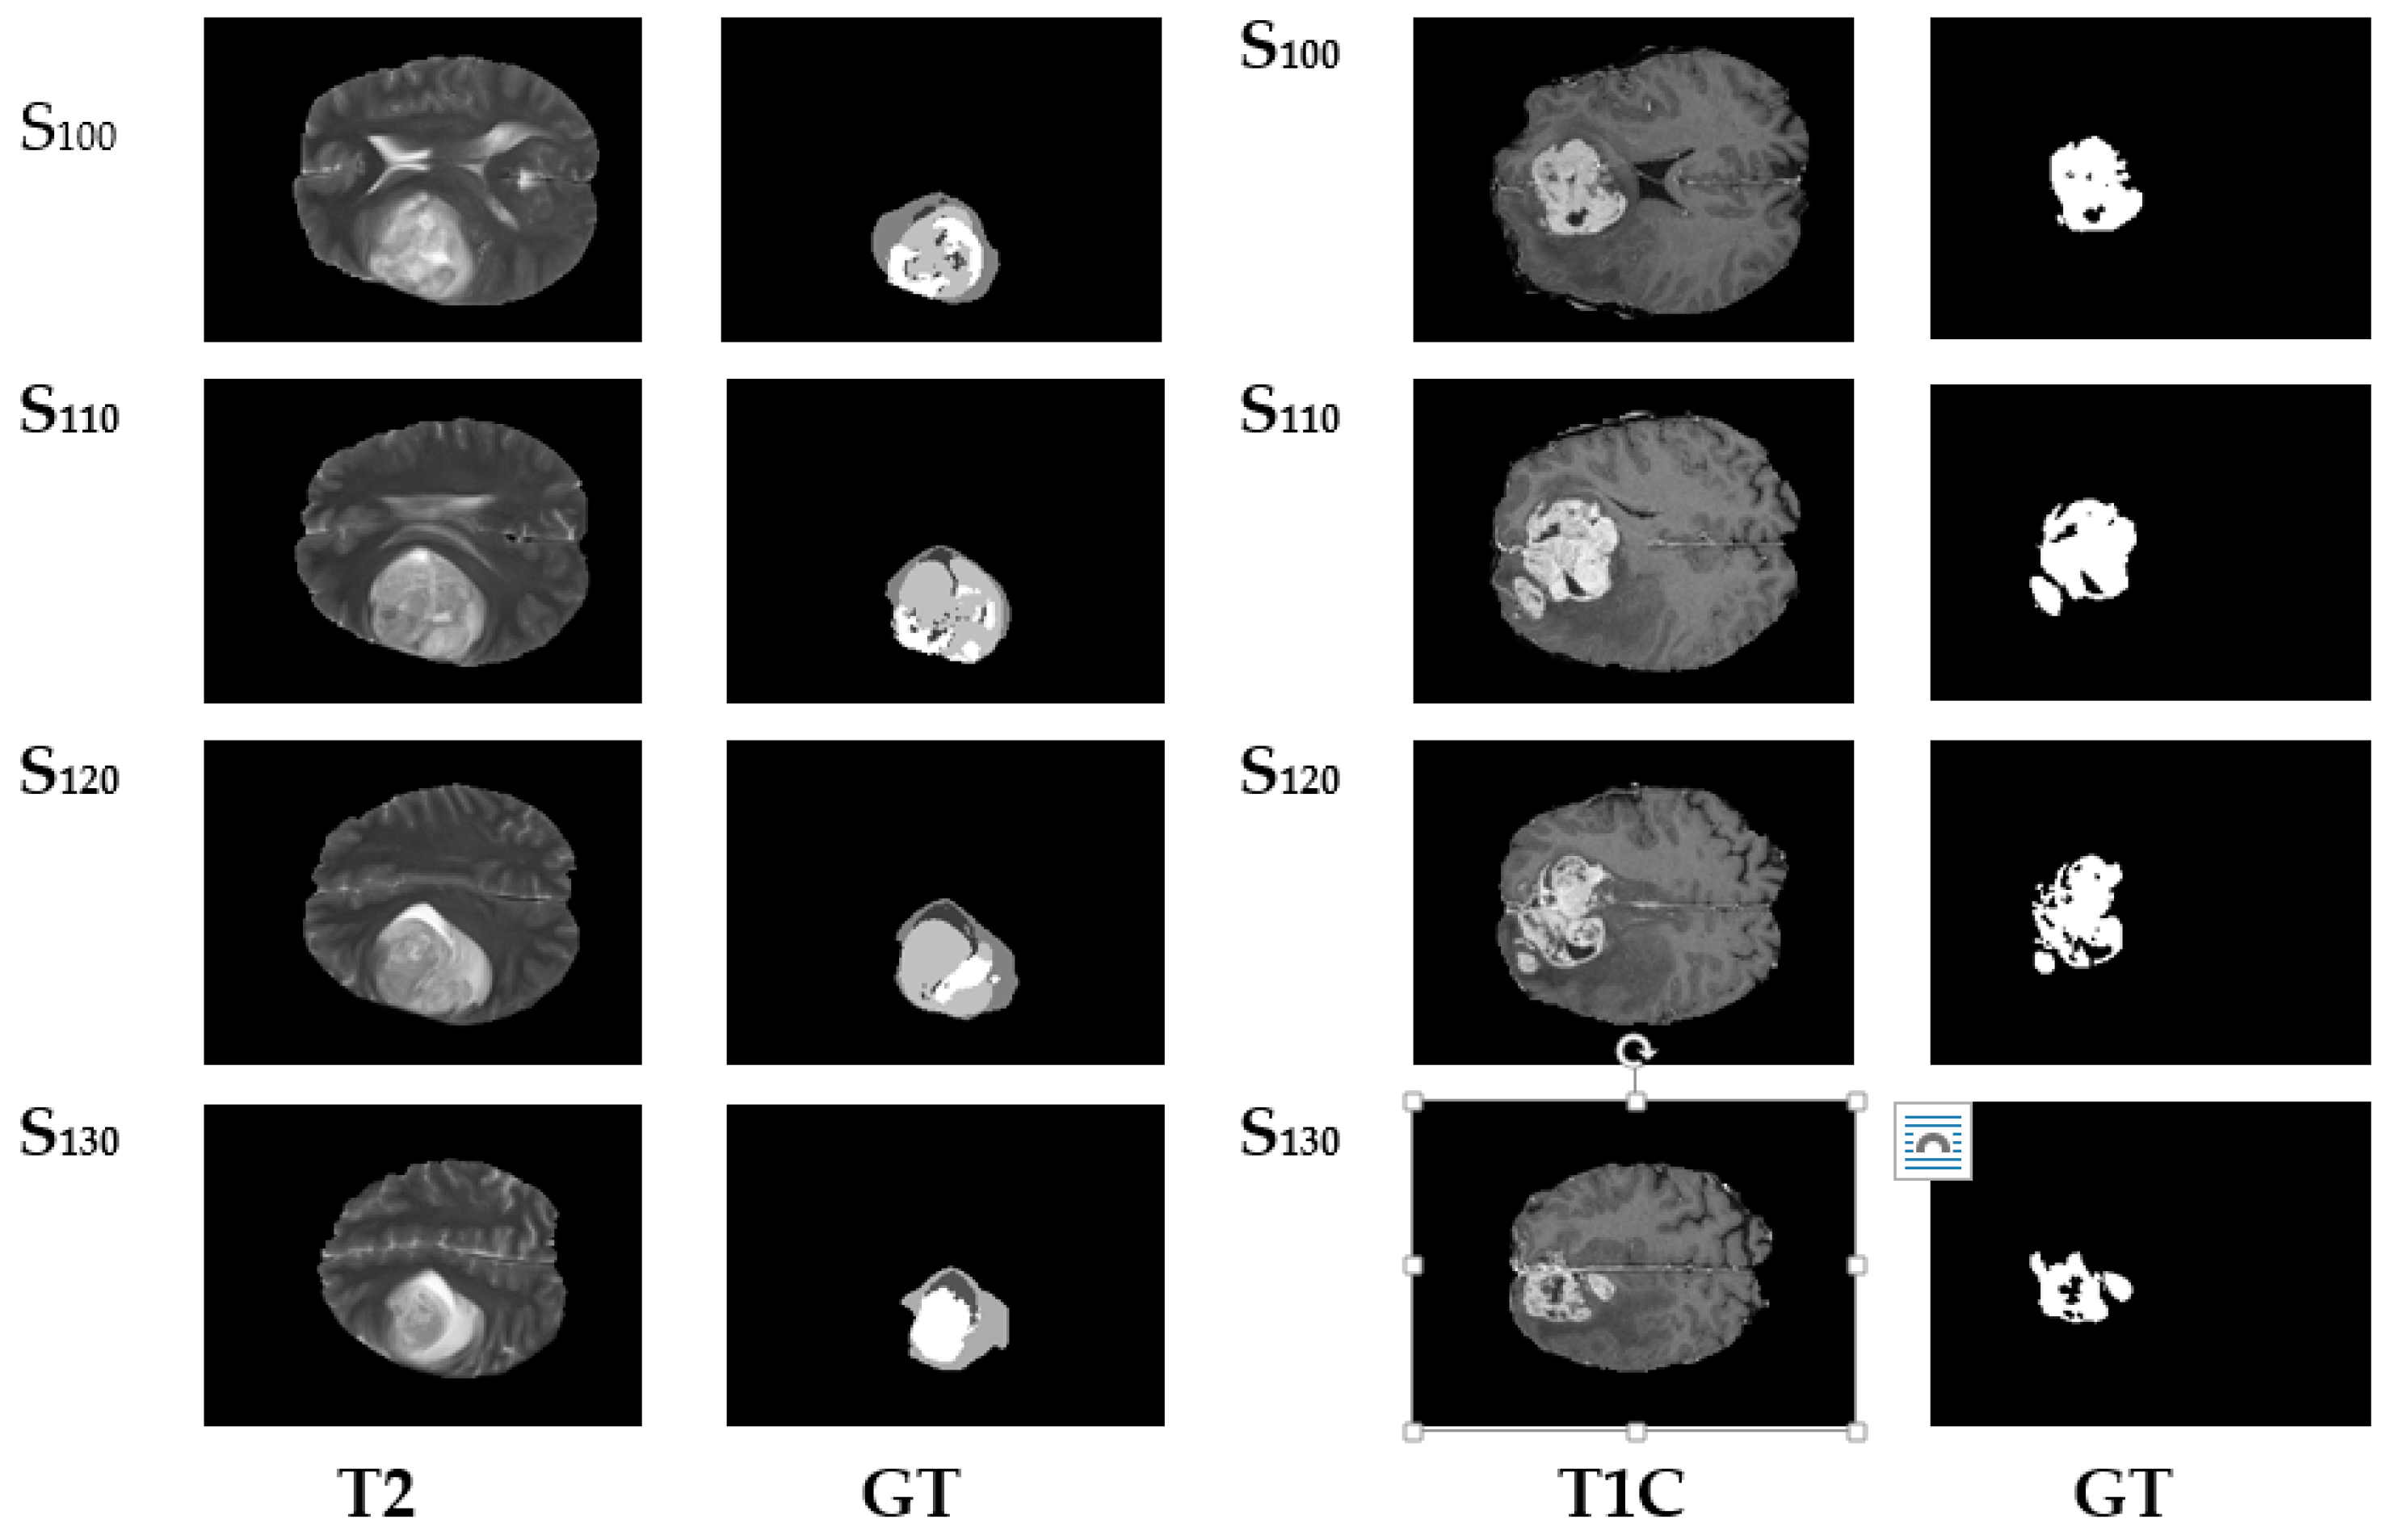
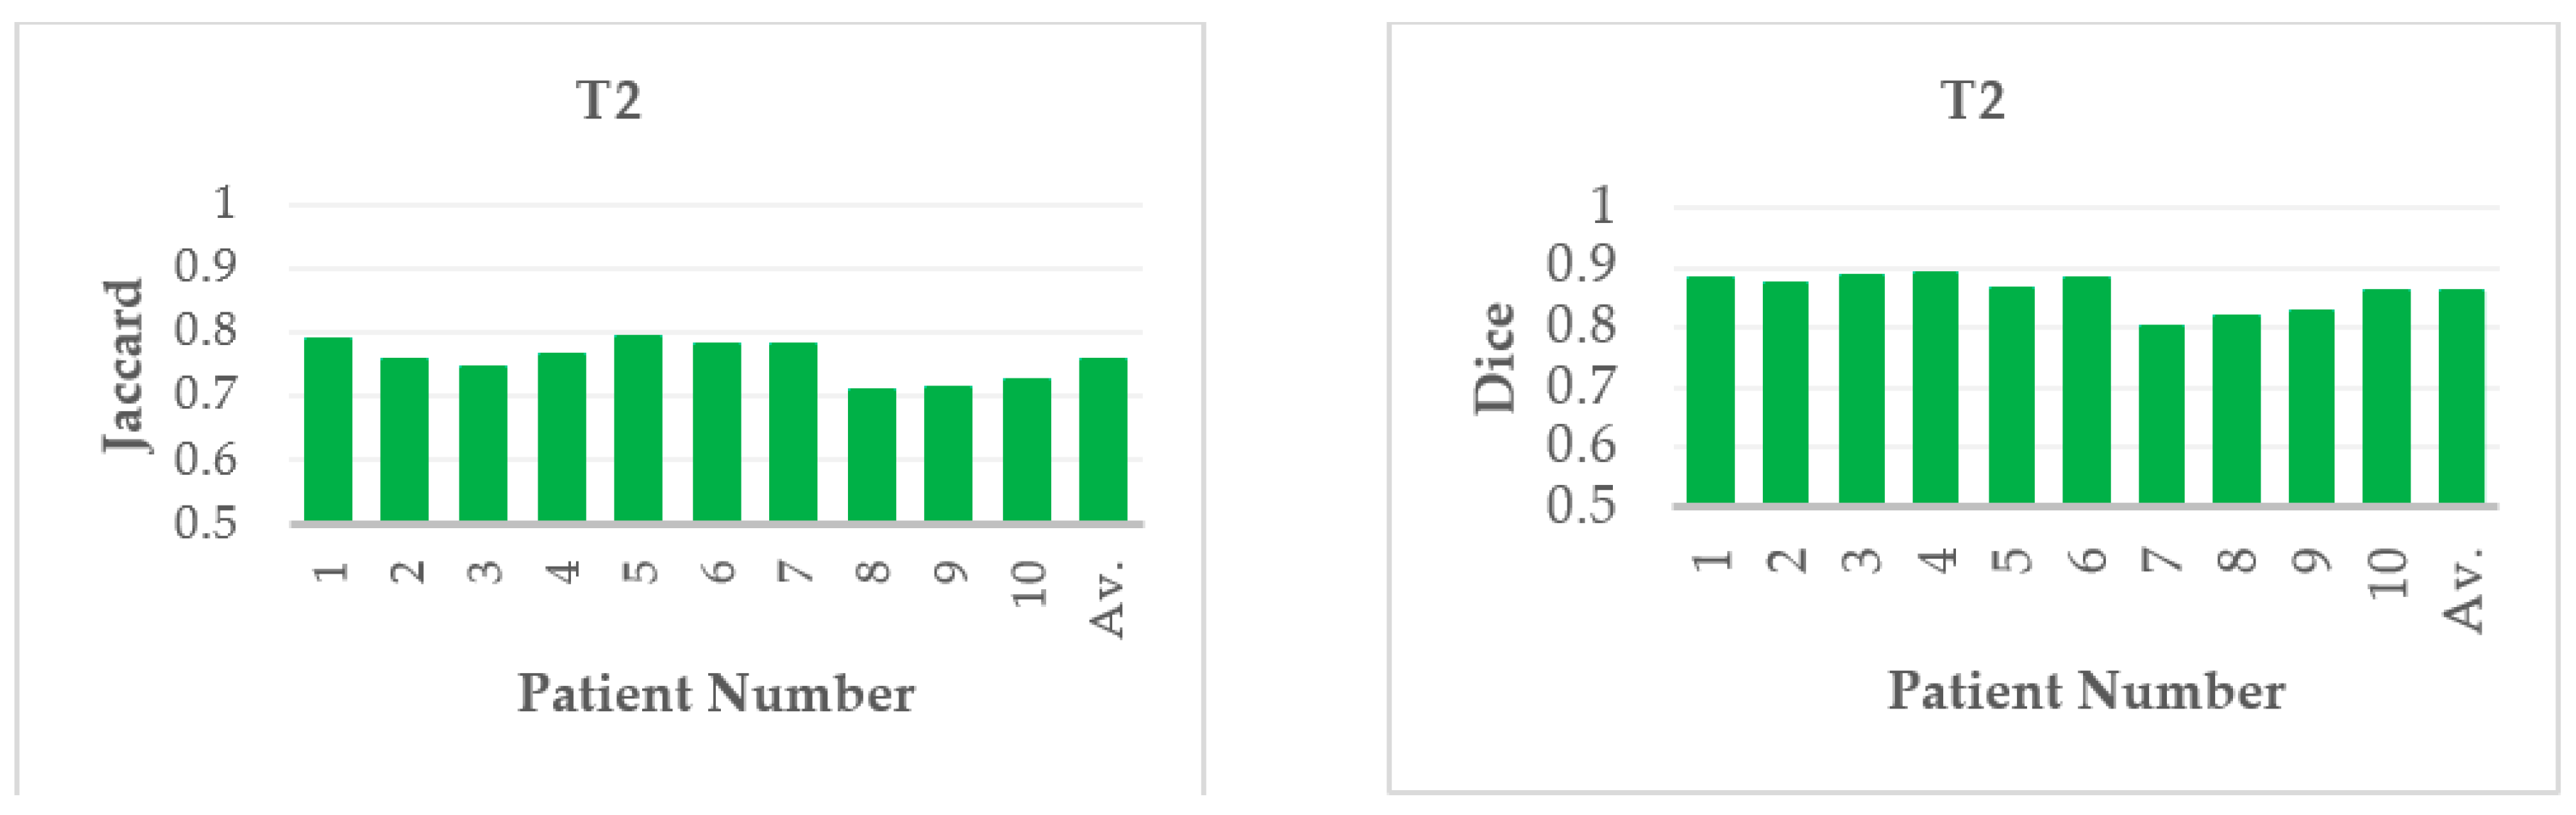
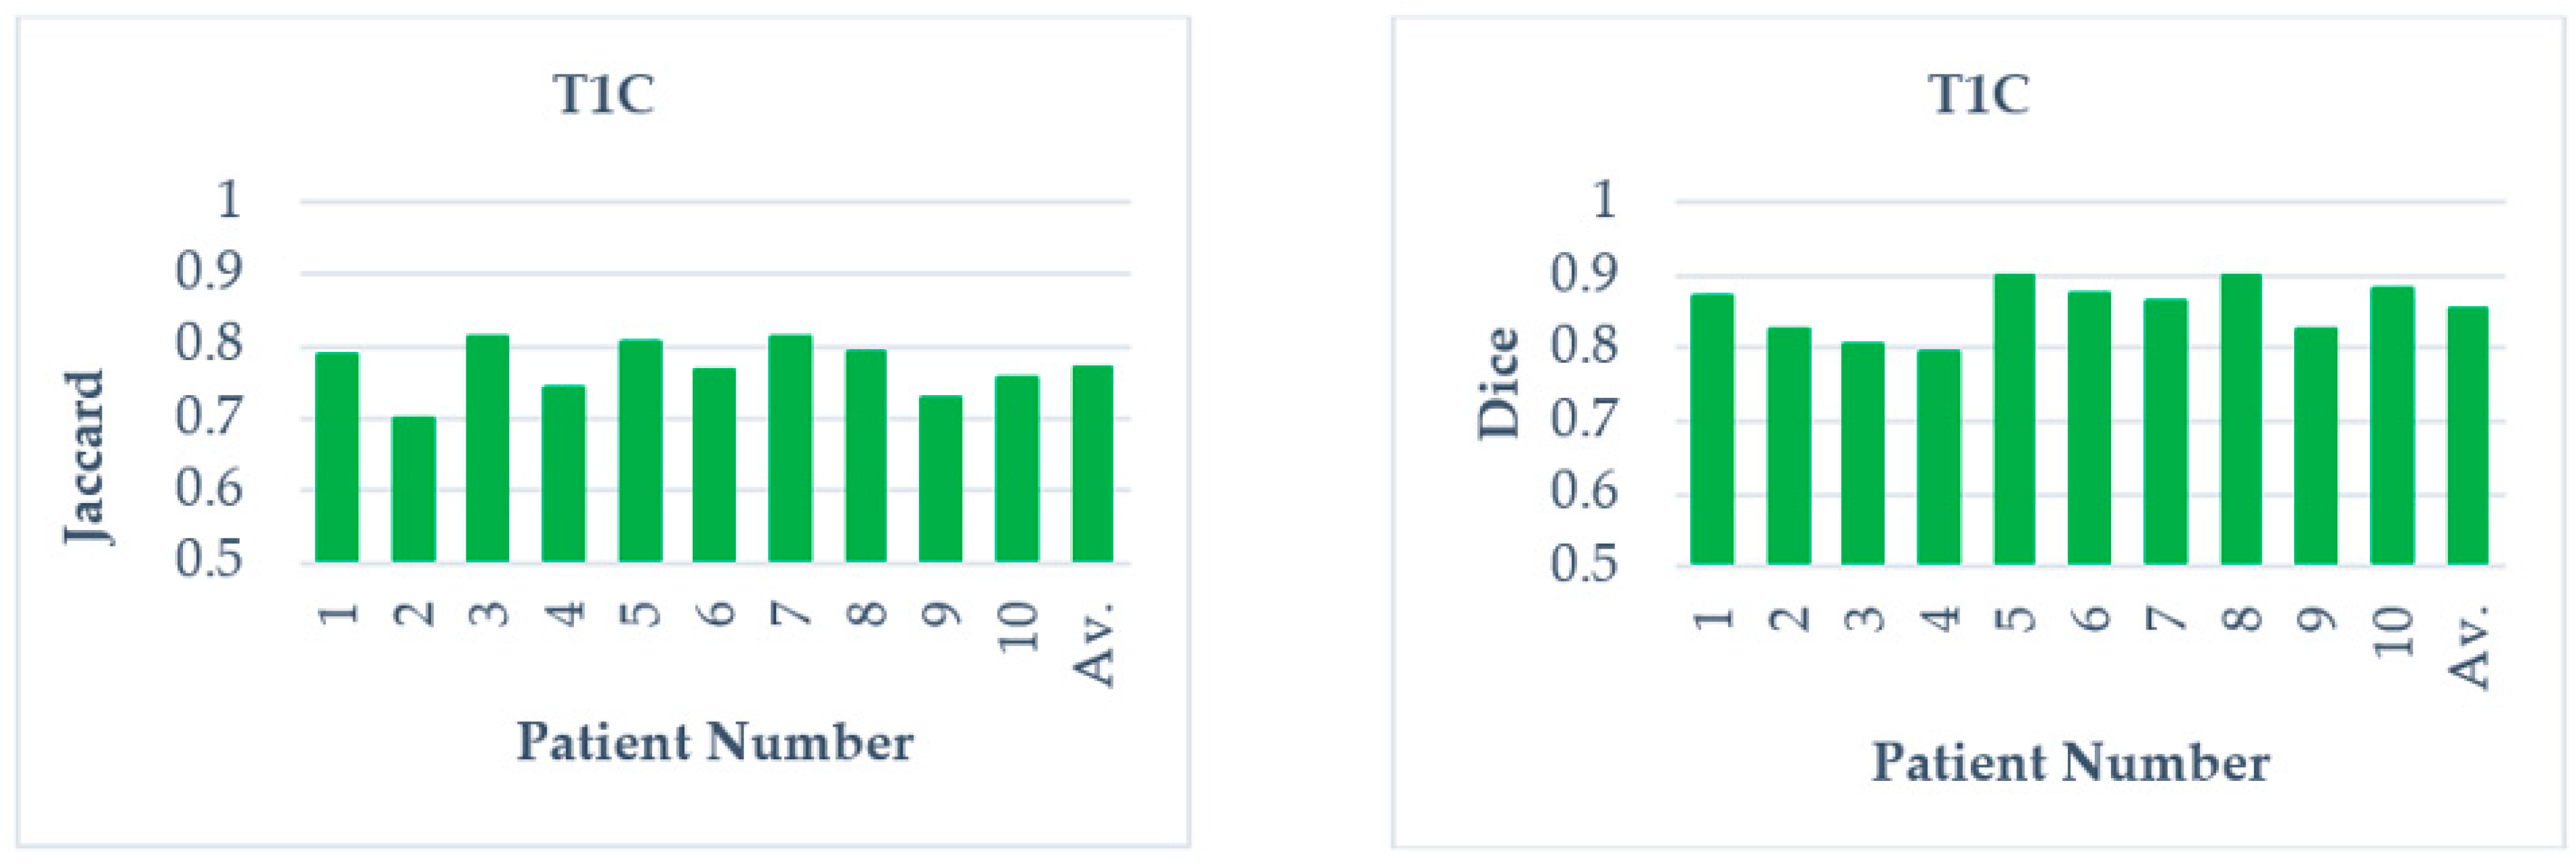
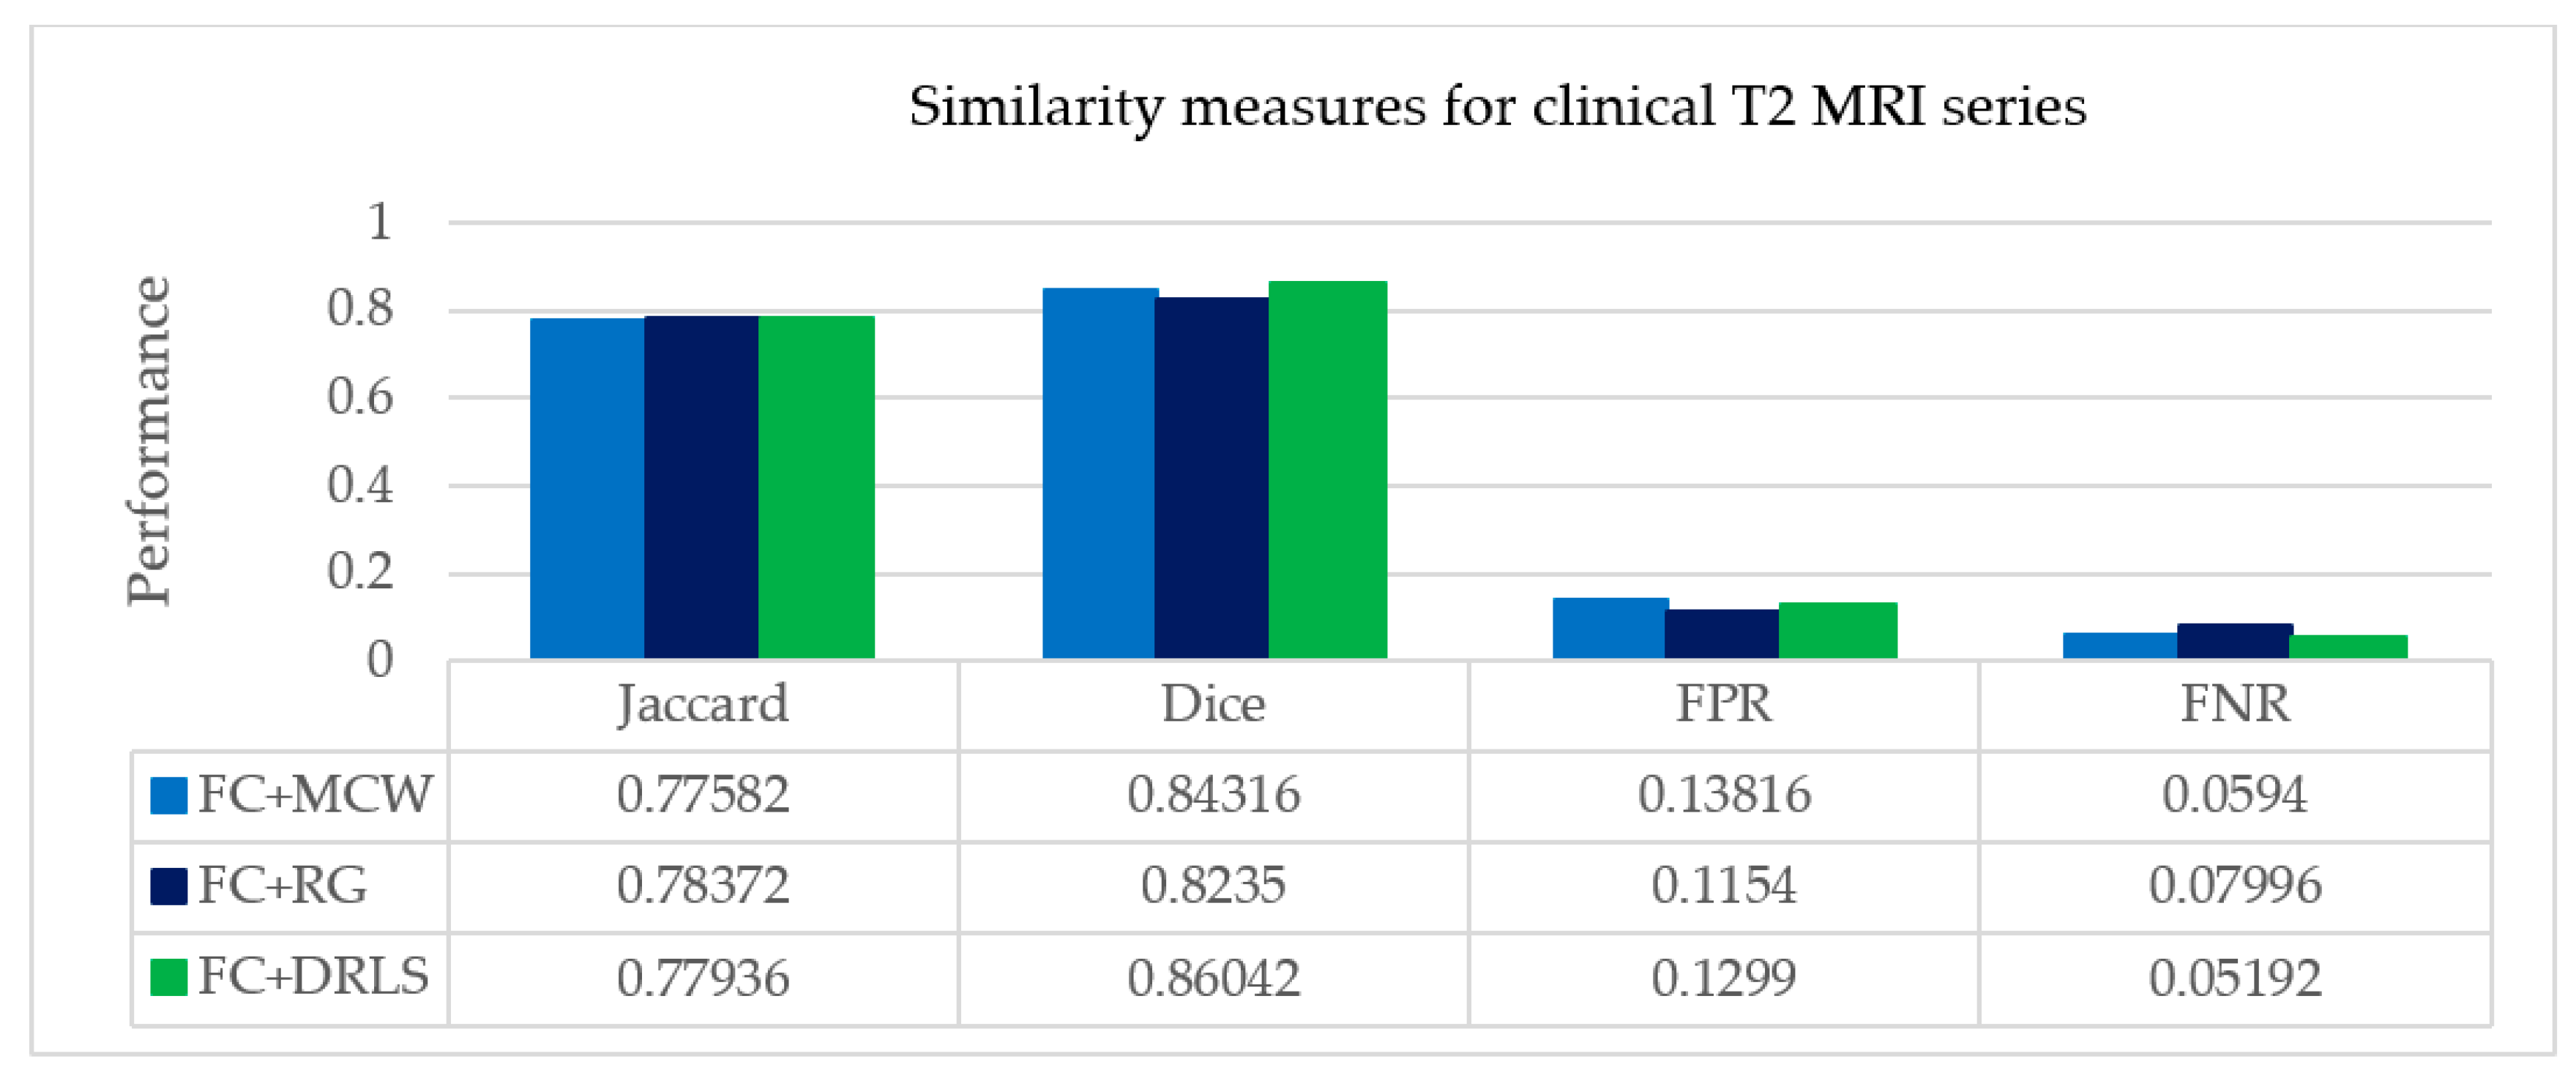
  • The proposed work is initially tested on the brain MR series of BRATS dataset for anomaly extraction; its segmentation quality is assessed with image quality, similarity and statistical measures. The average dice scores over ten patient studies for tumor segmentation has given promising results. Further, the procedure is also tested on the clinical MR brain series and validated against expert ground truth.
In this work, the proposed tool is implemented using python open-source language. The proposed methodology is described in Section 2. The obtained results and their relevant findings are demonstrated in Section 3. The conclusions and future scope are discussed in Section 4. A brief video describing the proposed method, its key contributions’ and results, is provided in the Supplementary Materials.

2. Materials and Methods
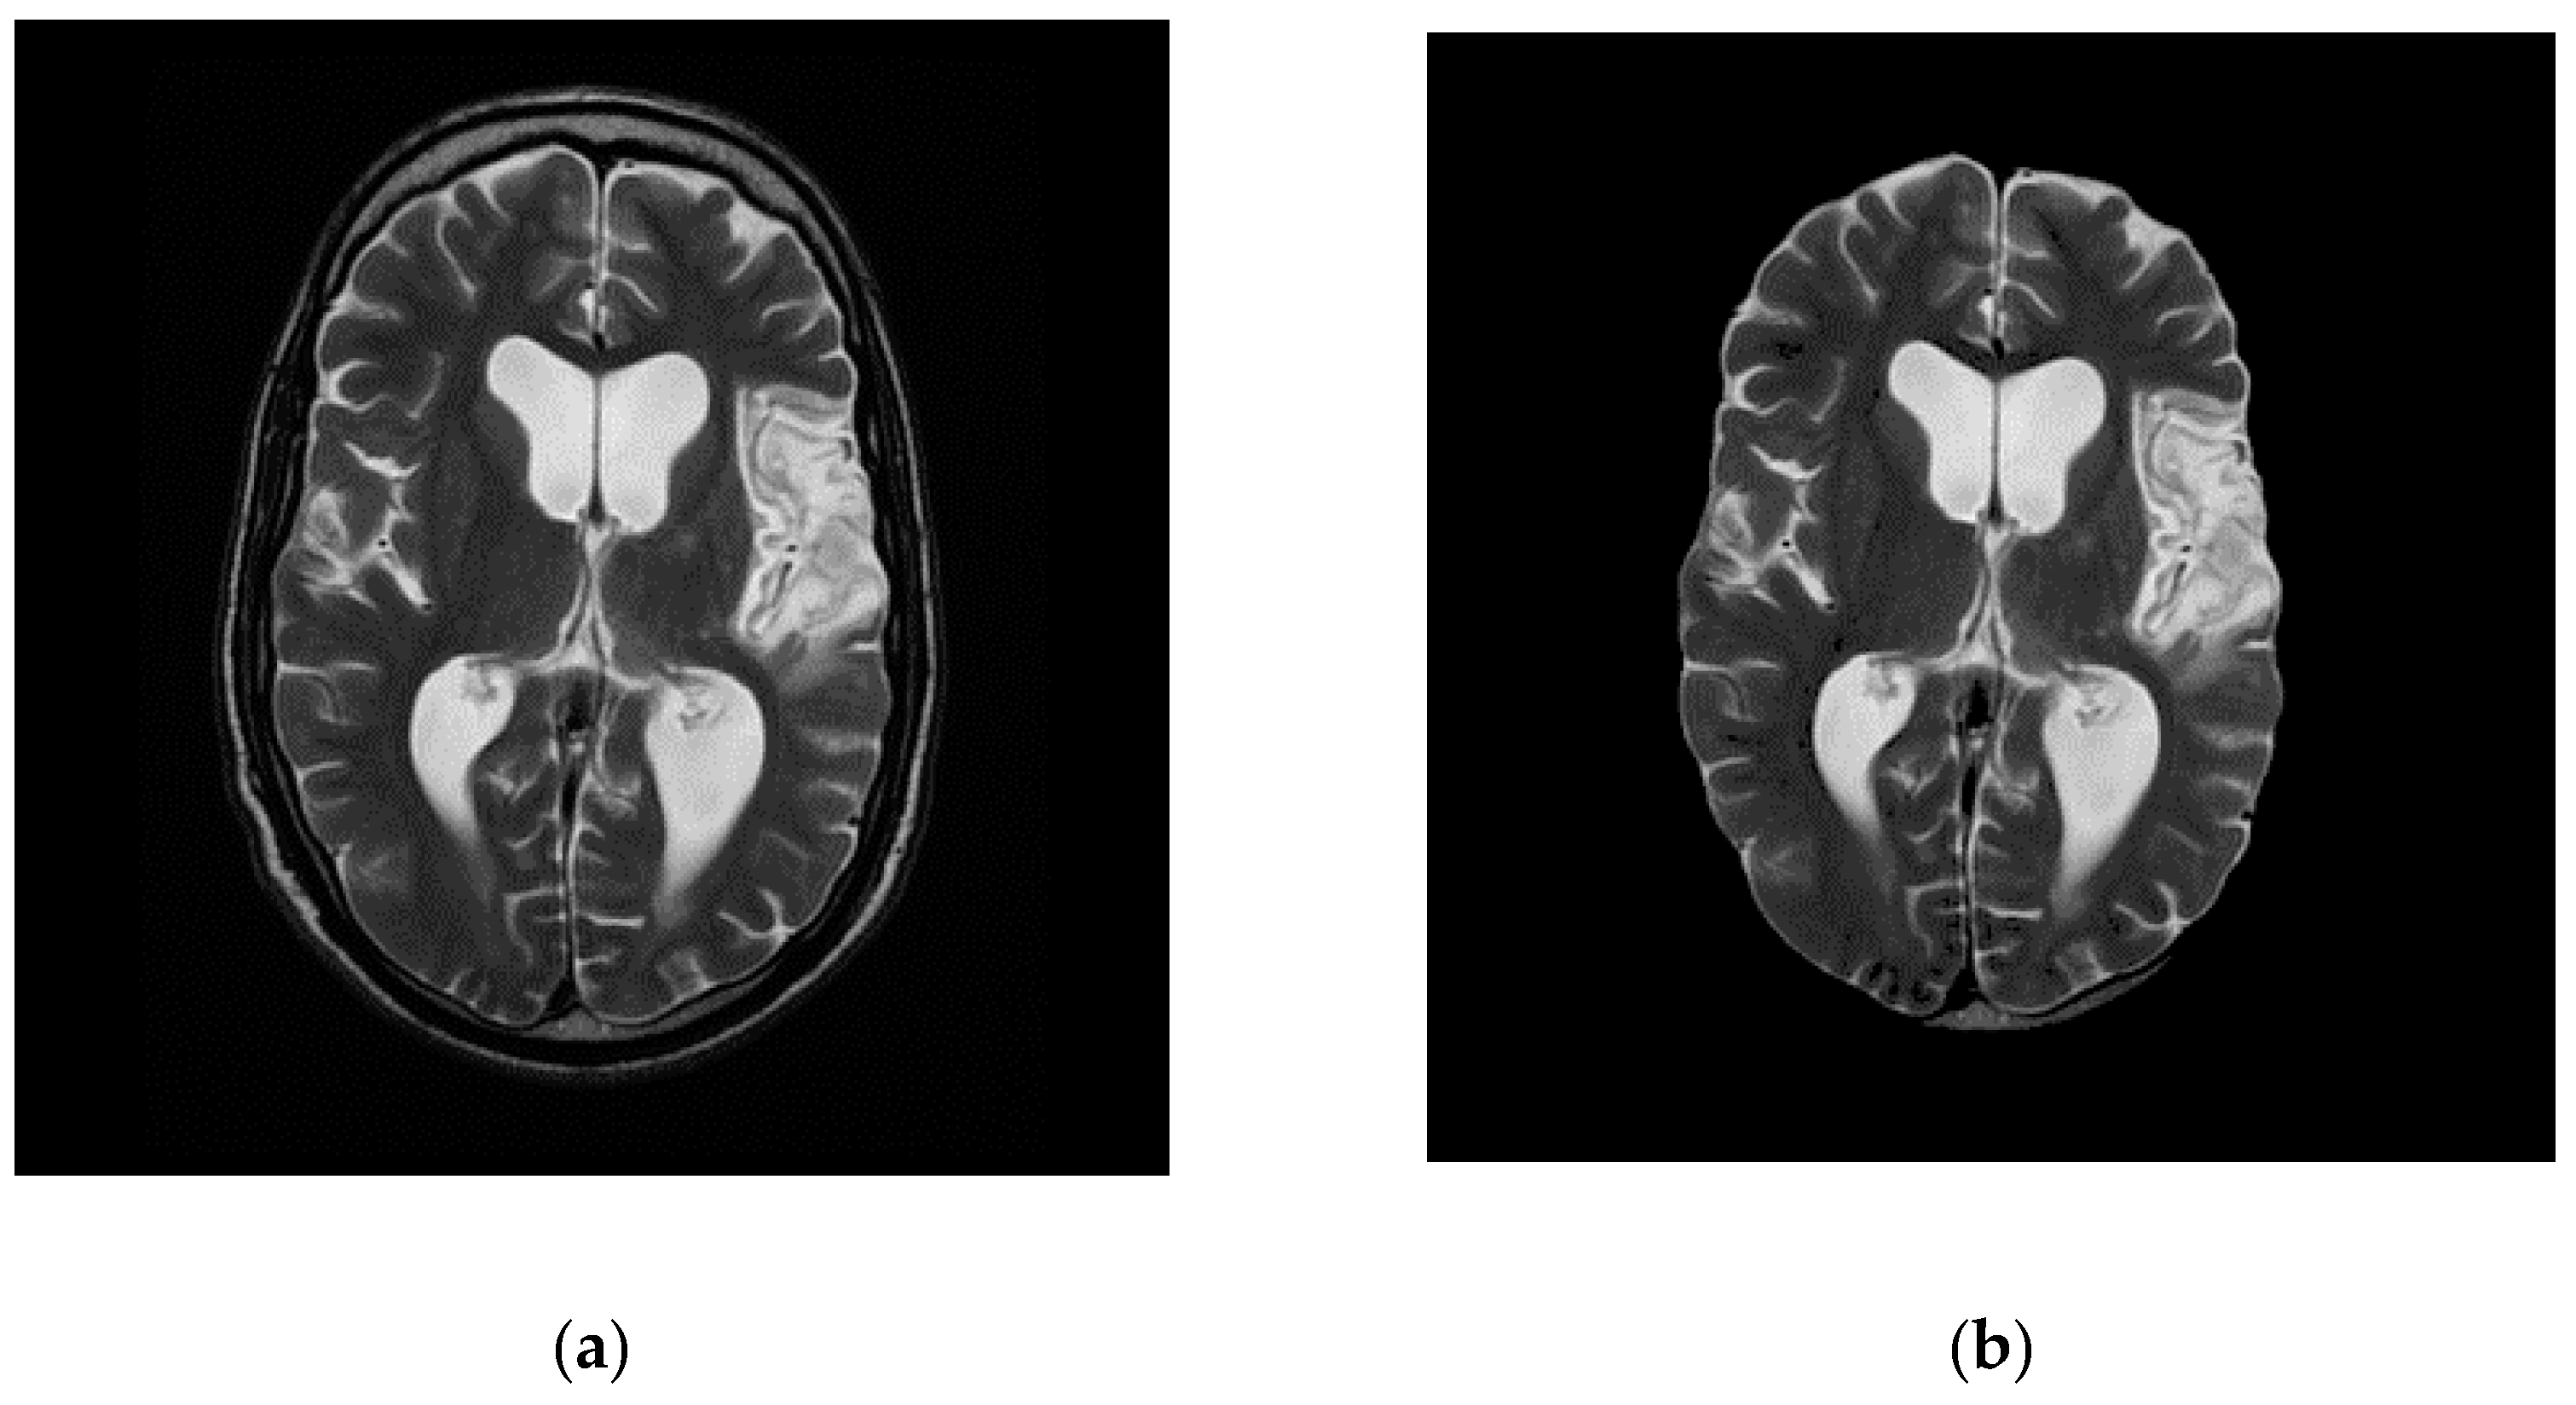
Two different brain slice datasets were used in this work. Firstly, the real-world clinical dataset, which comprises 22 brain slices (axial T2 MR DICOM slices), obtained from the Proscans Diagnostics Centre (Chennai, India). Secondly, the benchmark BRATS dataset was used for evaluating the performance of the proposed model. Further, in this work, the BRATS dataset comprised of ten patients and around 200 brain slices were acquired from each patient. This section specifies that the proposed approach was deployed to segment and analyze the axial MR DICOM slices. Initially, the DICOM slices are subjected to pre-processing. The segmentation of preprocessed DICOM slices is subjected to fuzzy clustering for image enhancement. In order to select the best clusters, the silhouette metric is employed. The enhancement of extracted structures is carried out using morphological operations. Finally the ROI is extracted using image post-processing procedures such as MCW, RG, and DRLS, and the extracted tumor is validated using similarity measures. The complete architecture is shown in Figure 1. Also volumetric quantification of tumor and 3D visualization is generated from the slices involved in the real-time clinical study. The decision making capability of the proposed approach is tested and validated using 2D slices of the considered image dataset.

2.1. Pre-Processing

The considered slices are presented to the system as (.dcm) files. Rescale correction is performed on all the slices which provide a 512*512 pixel array for each image. The DICOM tags Rescale Intercept (RI) and Rescale Slope (RS) postulates the linear transformation of pixels to their memory representation. The Rescale Correction [36] of the slices is given by:
RC = I*RS + RI
where RC is the rescaled units, I is the intensity value. In MR DICOM metadata, the attributes rescale slope and rescale intercept are not available as tags. For the computational purpose, the tag values are engaged as one and 1024, respectively. The available slice location header attribute in MR allows brain slices to be added for processing sequentially.
Abnormality identification in the brain requires removal of the skull or non-brain tissues such as dura, arachnoid, pia mater for effective extraction of ROI. The skull portions possess a low solidity area. Solidity is the proportion of the contour area to its convex hull area. Regions having the least solidity are removed, leaving only the region occupied by the actual brain tissue. The slices which have high solidity objects were retained after rescaling correction, thereby eliminating the non-brain matter.

2.2. Fuzzy Clustering Based Object Extraction from DICOM Slices

The fuzzy clustering (FC) technique is performed to extract the best segmentation in a feature space containing varying cluster intensities and shapes. Fuzzy clustering classifies a set of data points p 1 , p 2 , p 3 , , p m of a DICOM slice into k (≤m) clusters, which minimizes the total distortion. Each data point in the feature space has a degree of membership (aij) to its own cluster. The points closest to cluster centroids has a higher degree compared to the points in the cluster edge. For a data point i assigned to cluster j, gives a i j coefficient value for being in the jth cluster. The sum of a i j coefficient is always 1. The fuzzy assisted clustering algorithm based on minimization of the following objective function ( F w ) concerning A (fuzzy k partition) and B (k set of clusters) and it is given by:
F w ( A , B ) = j = 1 m i = 1 k ( a i j ) w d 2 ( P j , B i ) ;   k m
where, w(>1), is the weighting exponent acts as a control parameter for the fuzziness in a i j , P j is the jth point in the feature vector of N-dimensional space, B i being the centroid for cluster i, a i j is the degree of membership of the pixel P j in cluster i, d 2 ( P j , B i ) is the distance measure between P j and B i , m and k represent the number of data points and the number of clusters, respectively.
The degree of membership of all feature vectors is associated with the inverse of the distance to the cluster center:
a i j = [ 1 d 2 ( P j , B i ) ] 1 w 1 i = 1 k [ 1 d 2 ( P j , B i ) ] 1 w 1
The Euclidean distance measure is used to compute the degree of membership (aij) is given as:
d 2 ( P j , B i ) = ( P j B i ) T I ( P j B i )
where I denotes the identity matrix. The new centroid positions are computed based on the mean of all the points, weighted by its corresponding degree of membership (aij) to the cluster:
B i ^ = j = 1 n ( a i j ) w P j j = 1 n ( a i j ) w
Based on new centroid positions the updated degree of membership ( a i j ^ ) , is computed according to a i j shown in Equation (3). This process is repeated until the sum of distances of each point in the slice to the centroid of the cluster is minimum, i.e., a termination criterion ‘ ’ is reached, which ensures maximum accuracy. Other stopping criteria include no further improvement in the variance over some iterations. The structures of the brain are segmented from the set of DICOM slices for a set of ‘k’ values ranging from 2 to 9.

2.3. Selection of the Best (k) Using Silhouette Index

Fuzzy clustering renders the clustered image for the preferred number of clusters (k). However, optimal ‘k’ should be chosen in order to place cluster labels within the centroid. In literature, a well-balanced coefficient named silhouette score, presented by Rousseeuw [37], has shown higher performance in finding optimal clusters. The silhouette score pertains to the deviation between the within-class tightness and separation. Specifically, the silhouette value for a pixel in the slice pixel array is given by,
s i l ( j ) = b ( j ) a ( j ) m a x ( a ( j ) , b ( j ) )
where, a ( j ) = 1 / | V i | 1 y V i d ( x , y ) , be the mean distance of pixel point ‘x’ with other pixels (y) within the cluster V i and b ( j ) = m i n   { 1 / V i y V i d ( x , y ) } , be the average dissimilarity of a point ‘x’ to about any cluster V i of which chosen point ‘y’ is not associated with it.
The maximum value of s(j) reflects the optimal number of clusters. Correspondingly, the minimum of b(j) is taken for computing s(j). If b(j) is larger, then the point is very far from its next neighboring cluster. The squared Euclidean distance provides the distance metric d ( x , y ) between clusters for computing the silhouettes.
K-means clustering with silhouette analysis is executed to find out the optimal ‘k’ ranging from 2 to 9.
Silhouette always lies between −1 to 1, and it is defined as:
s i l ( j ) = { 1 a ( j ) / b ( j ) ,   i f   a ( j ) < b ( j ) 0   ,   i f   a ( j ) = b ( j ) b ( j ) / a ( j ) 1 ,   i f   a ( j ) > b ( j )
If the silhouette values are approaching either +1 or −1, the pixel points are well clustered or misclassified, respectively. If zero, the points could be assigned to another cluster also.
Further, to validate the segmented slices, the entire pixel array of each slice is considered, and the average silhouette width is computed. The average silhouette width for every slice is calculated from mean of all the distinct cluster silhouettes is given by:
S a v g ( s i ) = i n s i l ( j ) k
where, n denotes the number of clusters segmented. The S a v g is used to find the best k for a slice s i . The silhouette coefficient ( k b e s t , i ) is defined as the maximum average silhouette width which is given by,
k b e s t , i = m a x { S a v g ( s i ) }
The algorithmic steps of incorporating fuzzy clustering and silhouette metric to the set of DICOM slices are illustrated in Algorithm 1.
Algorithm 1 Silhouette-enabled Fuzzy Clustering
1:
Let   S = { s 1 , s 2 , s 3 , , s m }             (Set of Dicom Slices)
2:
P = { p 1 , p 2 , p 3 , , p m }                (Set of data points to be clustered)
3:
K r , r ∈ cluster_range [2:10]
4:
k b e s t = Best K value of the clustered image
5:
B = { b 1 , b 2 , b 3 , , b k }          (Set of cluster Centroids)
6:
for each s i S
  for each k in K r
    for each p i P
        Compute fuzzy Clustering by iteratively updating the degree of membership ( a i j ^ ) and cluster
        centroids B i ^
    end
7:
for every k in S i
8:
Compute averagesilhouettewidth from individual cluster silhouettes (finding best k from r.)
9:
end
10:
Compute k b e s t , i = max(averagesilhouettewidth) (Calculate k b e s t for Slice i)
11:
End

2.4. Morphological Operations for Objects Enhancement

Image masking is used to specify the foreground, background, or probable background /foreground. Contour masking separates the objects from the original images, and it is essential for further analysis. It is eliminating the outliers such as air, from the actual brain slices. The fuzzy clustering process discovers the best-segmented clusters. These clusters form a binary mask that overlaid on the actual slices to acquire the respective contour intensities. Mutual information (I) is computed between the contour mask with the corresponding slice for ensuring similarity [38,39]. The weighted contribution (Wi) of the contour mask (CMi) to the original slice (Si) is calculated as:
W i = 1 C M i e I i I m i n I m a x I m i n
where I i represents the mutual information between C M i and S i . I m a x , I m i n are the maximum and minimum mutual information for the overall C M i . After the extraction of structures from the fuzzy clustering process, the obtained binary mask of the chosen slices may be distorted due to noise and texture. Mathematical morphology, a kind of contrast enhancement technique, assists selective enhancement of the small diagnostic contour features that are overlaid on a composite background. Hence, the binary mask representing the extracted structures is further practiced with non-linear operations such as morphological erode and morphological dilate for removing the inadequacies in order to retain the form and structure of the extracted objects. Erosion is a reverse process to dilation-erosion strips pixel layer over the edges, contradictorily dilation augments pixel layer over the edges.
Dilation adds pixels to the contour boundaries in the slices. The number of supplementary pixels integrated into the mask image is subject to the shape and size of the structuring element. Dilation process is done by:
C M S E = { z | ( S E ^ ) z   C M φ }
where CM is the set of pixels representing the binary mask, SE be the structuring element initially reflected as S E ^ then the reflected element is translated by z. This process enlarges the binary mask in all directions not to miss any pixels, particularly at contour edges. Similarly, erosion is performed by:
C M S E = { { z | ( S E ) z C M } }
Stating that z confined in CM shifts the SE. Erosion removes pixels, thus sharpening the object boundary. The number of pixels stripped is subject to the size of the SE. Erosion strips the connected normal and abnormal contours, which aid in the effective extraction of ROI in the post-processing stages.

2.5. Tumor Quantization and Validation

The extracted objects possess high solidity ventricles and the tumor region. In order to extract the ROI from the brain structures, image post-processing approaches are utilized to mine the ROI from the extracted objects. After determining the abnormal regions, the size of the tumor is quantified based on its area and perimeter.
The validation metrics are used to evaluate the spatial intersection of ground truth (GT) of the clinical slices with the extracted ROI [40]. The performance of the segmentation procedure is validated using similarity measures such as Dice, Jaccard, false positive (FPR), and false negative (FNR) rates.
These measures are mathematically conveyed as:
J a c c a r d ( I g t , I R O I ) = ( I g t   I R O I ) / ( I g t   I R O I )
D i c e ( I g t , I R O I ) = 2 ( I g t   I R O I ) / ( I g t   I R O I )
F P R ( I g t , I R O I ) = ( I g t / I R O I ) / ( I g t   I R O I )
F N R ( I g t , I R O I ) = ( I R O I / I g t ) / ( I g t   I R O I )
where, I g t expresses to the ground truth (GT) and I R O I points for the segmented image with the proposed strategy. Other related works implemented on brain MRI can be found in [41,42,43,44,45,46,47,48,49].

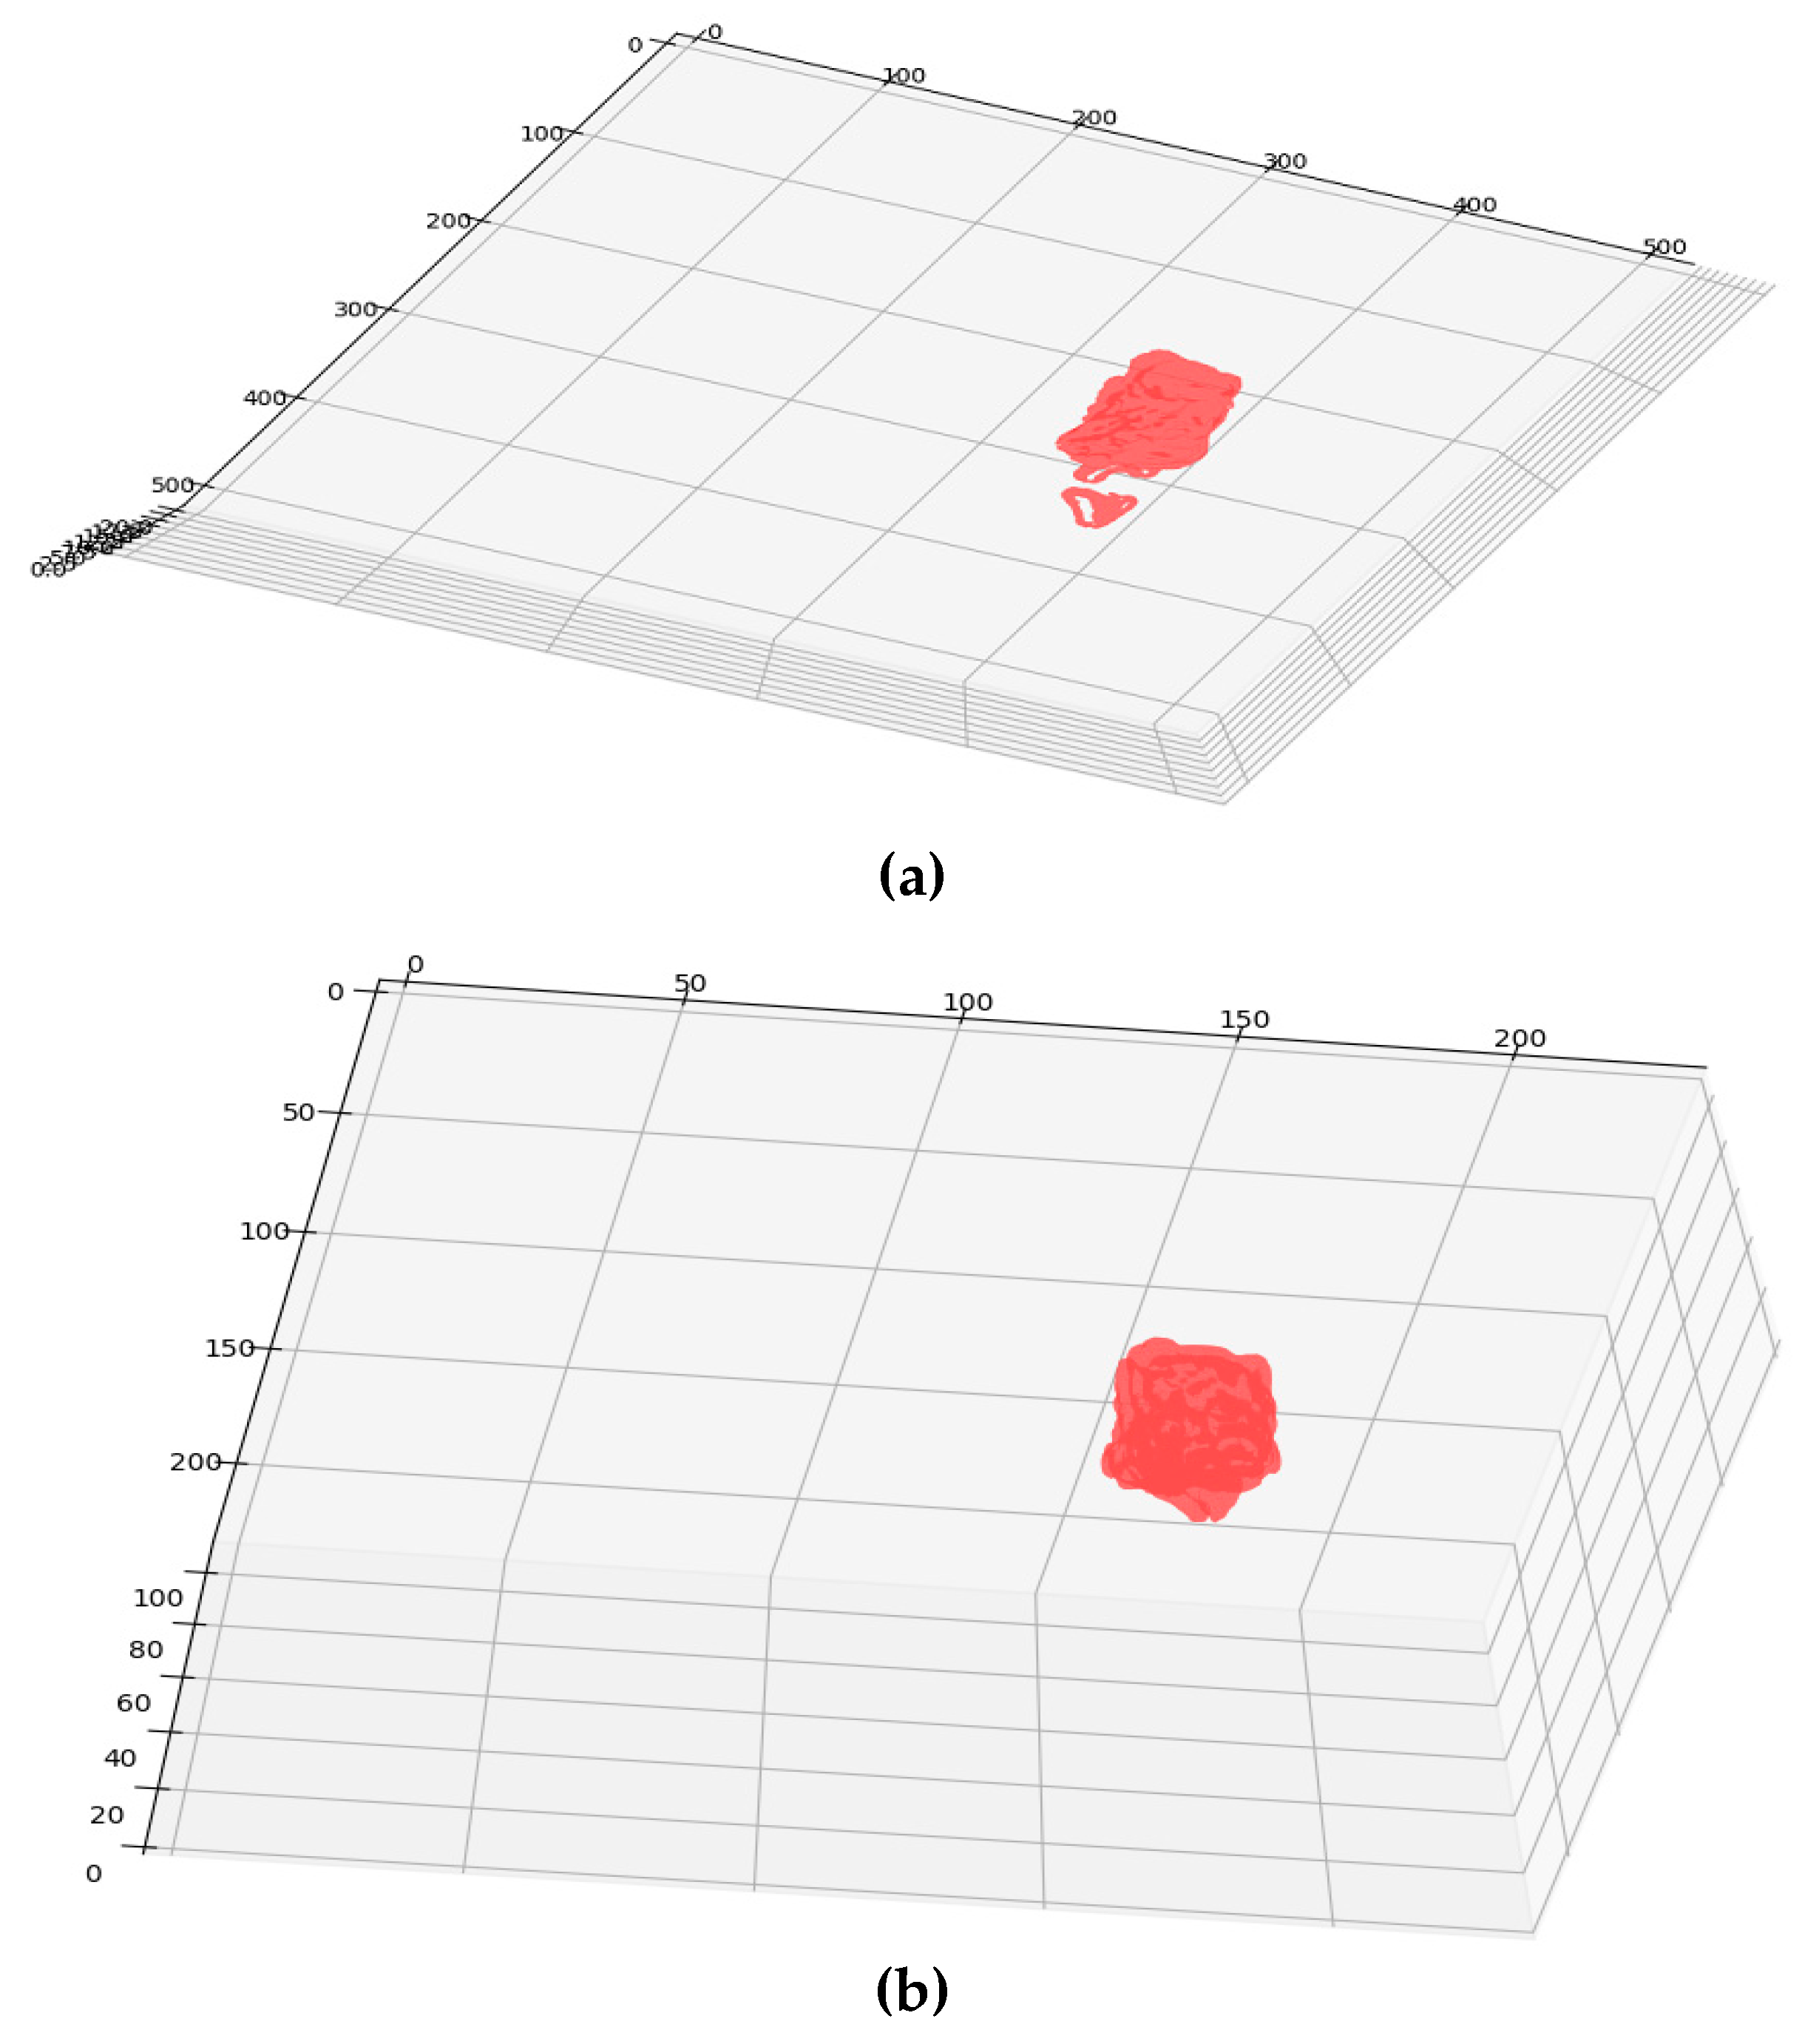
2.6. Volume Assessment and 3D Modeling

The clinical slices considered in this work have the cubical stack format [SC × W × H], SC signifies the number of slices (22), W, and H indicates the width and height of a slice [512 × 512] in pixels, respectively. The slices are processed in DICOM format, which holds adequate slice information. In DICOM metadata, it is identified that ‘slice thickness (ST)’ is 5 mm, ‘pixel spacing (PSx/PSy)’ is (0.4492 mm/0.4492 mm) and ‘spacing between slices (SS)’ is 6.5 mm. The original stack [22 × 512 × 512] migrated to a resampled stack [110 × 230 × 230] based on the spacing information presented in the DICOM header. Resampling is achieved by cubic spline interpolation function. The tumor volume is estimated as:
V o l u m e =   T u m o r   V o x e l s V o x e l   s i z e
where tumor voxels are the number of voxels that contributes to tumor and voxel size is measured based on pixel spacing and slice thickness.
Visualization of tumor voxels in the complete study is achieved by merging the tumor containing slices to form a voxel mesh in all three anatomical planes. Further, this exemplifies an interconnected set of triangular faces of tumor voxels [50].

3. Results and Discussions

This section illustrates the results achieved with the proposed procedure. Figure 2 demonstrates a brief overview of the proposed procedure for brain MR examination. Initially, the DICOM slices of the patient study are pre-processed with rescaling correction. Moreover, this creates the intensity of the similar tissues in the study to confirm across the image slices. Then the non-brain tissues are stripped from the brain matter, leaving the brain pixels, which contain the brain tissues. Figure 3 shows the representative image of slice 12 before extraction (a) of brain tissue after removing (b) the non-brain portions. This procedure avoids non-brain tissues to add unnecessary information, thereby enhancing the efficacy of extracting the ROI. The combination of Fuzzy clustering with validated silhouette index (as the criterion for choosing best k) discovers the precise number of clusters from the slices. Figure 4 shows the extracted objects of Slice-14 and its corresponding mask image for ‘k’ clusters (k ranges from 2 to 9).
Table 1 shows the silhouette scores S a v g for the considered slices for the chosen k values. A more substantial silhouette value gives a high split over the data points. For slice10 in Table 1, the optimal k is elected as two, since S a v g ( s i ) holds the maximum value 0.45571. Similarly, the optimal kbest,i is selected from the range of slices (Slice11-Slice14) based on the average silhouette width.
In slice14 the maximum S a v g ( s 14 ) = 0.58523 when k is six, but a minimum value resulted when k is two, ( S a v g ( s 14 ) = 0.48988). Further, this shows the loss of tumor information in Figure 4 when k is two, and an optimal segmentation is obtained when k is six.
Figure 5a shows the graph with silhouette scores versus the number of clusters ‘k’ for a representative sample image ‘slice14.dcm’. The average silhouette width for the slices, which are more than 0.48, confirms a good split for all k clusters. As shown in the graph, a reasonable peak is obtained when k = 6 and also possess a maximum value ( S a v g ( s 12 ) = 0.58523).
Figure 5b depicts the silhouette plot for slice14. The selection of an optimal k provides better separation in feature space with more similar thickness and sizes. This increase in S a v g ( s 14 ) is due to the distinct separation from their neighboring clusters except for the background. The well-diversified information is obtained from the slices since the proper selection silhouette index was made. From the achieved outcomes, it is clear that silhouette analysis plays a significant role in the identification of best-clustered objects. After FC, the pixels representing abnormalities are spatially identified and segmented. The mask image is produced from the objects extracted from each slice, in order to distinguish from outliers/ background. The mask image holds the pixel intensity values of abnormal and normal pixel intensities. The mask is applied to the corresponding slice for the extraction of clustered intensities from the actual slices. The objects are further enhanced by morphological processes by performing morphological open, dilate, erode and close operations in a sequential order to obtain a smoother object boundary without speckles. The experimental results of Figure 3 confirms a superior image enhancement step; as a result, it shows the best separation of objects obtained from composite backgrounds.
Each slice in the MR sequence is distinctly examined using the eminent state-of-art segmentation methods such as watershed [51], Chan-Vese [52], and fuzzy clustering (FC). The image quality measures obtained from these methods are portrayed in Table 2. From the segmented results of FC, it is perceived that FC based segmentation offers distinct separation of objects and aids a better confidant for the image post-processing stages.
Further, for measuring the supremacy of the segmentation approaches, the well-known image quality measures [53] such as peak signal to noise ratio (PSNR), normalized cross-correlation (NCC), normalized absolute error (NAE) and structural similarity index (SSIM) are calculated and are presented in Table 3. From the table values, it is perceived that the FC method discovers the vital prominent structures and thus preserves the segmentation quality. Also, the average image quality measures attained through FC is superior compared to the other state-of-art approaches reflected in this work.
The proposed approach had been tested for its performance by validating it against the grand challenge benchmark image dataset called the BRATS (size: 236 × 216 pixels). In this dataset, ten patient studies of T2 and T1C modalities had been taken up for analysis, which contains axial brain MR image series. The sample image series of patient studies and their corresponding GT that are obtained are shown in Figure 6. The BRATs dataset that had been considered in the proposed research has a number of advantages, few of those are–The desirable amount of 2D slices of a patient study can be easily extracted from its skull stripped 3D brain MRI, modalities like Flair, T1, T1C, and T2 are easily supported, contains ground truth images for all modalities offered by an expert member. Due to these reasons that most researchers had adopted the BRATS images for testing their disease examination tool.
For a comparative analysis in the post-processing stage, the ROI mining technique, marker controlled watershed segmentation (MCW), Seed region growing (RG) and distance regularized level sets (DRLS) are adopted and implemented to extract the anomalous section from the segmented objects (shown in Figure 4). MCW is a well-known segmentation technique associated with marker controlled morphological function and Sobel’s edge detection. This procedure detects ROI with the assistance of priori provided whole alike image intensities [54].
In contrast to MCW, the level sets the implicit active contour models, uses gradient information of the image, and thus naturally handles topological deviations by merging or splitting the contours [55]. The parameters for DRLS is assigned as follows; number of iterations = 100, scale parameter = 1.5, potential function = single-well and timestamp = 5.
RG is an operator instigated semi-automated method, extensively used to extract the desired (abnormal) structures from medical images [56]. RG requires a seed point (pixel position) to be initialized somewhere within a contour or ROI. From the seed point, the RG procedure will start mining the similar intensities of possible connected neighboring pixels accessible in the ROI.
The images chosen are initially subjected to FC for objects enhancement before applying the post-processing. The image quality gets enhanced through the validated FC technique and provides an ideal platform for the post-processing that is performed using MCW, RG, and DRLS. Figure 7 depicts the brain abnormality segmentation results extracted from the 2D slices of T2 modality images through FC assisted MCW, RG, and DRLS techniques. Correspondingly, results of segmented ROI from 2D slices of T1C modality are shown in Figure 8.
The segmentation methods (MCW, RG, and DRLS) that had been implemented were assessed for their performance by carrying out a comparative analysis that was executed between the ROI and GT. The extracted ROI and GT were initially compared on T2 modality images, followed by T1C modality images. The results obtained from these comparisons were recorded in Table 4 and Table 5. The recordings were made based on image similarity measures like Jaccard, Dice, FPR, and FNR. Figure 9 shows the comparative analysis of assessed similarity measures of T2 and T1C weighted images. The corresponding average scores of Table 4 and Table 5 are depicted in the graph.
From the recorded values for the considered slices presented in Table 4 and Table 5, it could be inferred that the outcome produced through FC based DRLS technique is far more superior to FC+MCW and FC+RG techniques. Also, the metrics Jaccard and Dice are computed for ten patient studies of BRATS individually. Figure 10 and Figure 11 depicts the average scores for ten patient studies of the BRATS dataset, and ‘Av.’ represents the overall average score of all the patient studies from T2 and T1C weighted images, respectively.
Furthermore, the suggested procedure is attempted on clinical MRI brain study of a patient [57]. The patient study considered contains axial T2 MR DICOM slices. The DICOM slices between the ranges Slice-10 to Slice-14 are considered in this approach for tumor analysis, as they hold enough tumor information. Slice15 and above are excluded from the examination as it does not contain any tumor region. Initially, the considered series are enhanced using FC, then at the post-processing stage, the mining techniques MCW, RG, and DRLS are adopted. Figure 12a,b embody the slice number with an optimal k and the original (actual) middle slices. Figure 12c represents the ground truth provided by an expert member. Figure 12d–f signify the ROI extracted from the validated fuzzy clustering-assisted MCW, RG, and DRLS procedures.
The validation of the FC-aided mining procedures against GT images is performed using well-known image similarity measures such as Dice, Jaccard, false-negative, and false-positive rates. These parameters stay as an aid to assess the efficacy of the segmentation procedure.
From Table 6, it is observed that maximum similarity is attained between ROI and GT by the suggested FC+DRLS procedure shown on the Jaccard and Dice metric scores. FPR values indicate that typical pixels of the brain are misclassified as tumor pixels. Similarly FNR values depict pixels which contribute as tumor are misclassified as normal pixels of the brain.
The minimum values of FPR and FNR guarantee the efficiency of the FC+DRLS segmentation method against MCW and RG in the set of DICOM slices. Figure 13 shows the comparative analysis of assessed similarity measures using the average scores of the slices depicted in Table 6. Therefore it is evident that in the proposed approach, the FC+DRLS based segmentation technique produces superior results for the clinical study as well.
Further, the ROI (tumor) is extracted to acquire the geometrical properties such as area and perimeter. The captured tumor information is clearly visible from slice10 to slice14. In Table 7, the parameters, area, and perimeter are calculated based on the tumor information extracted from the ROI. The parameters gradually increase up to slice13, which holds the maximum tumor part and then decreases. The overall study of a patient is determined from the entire DICOM slices.
The slices are reconstructed to a cubical stack based on in-stack position attribute of DICOM. The extracted objects of the clinical study undergo volumetric estimates and 3D reconstruction. Table 8 shows the volume of tumor calculated for DICOM and resampled stack.
Tumor volume is calculated for the DICOM grid using the physical spacing metadata available in the DICOM header. The inter-slice resolution of the considered patient study is coarse, as the slice thickness is 5 mm, which is considerably higher than the in-plane pixel size, i.e., 0.4492 mm. This anisotropic characteristic results in appalling issues for modeling 3D and image analysis. Thus resampling is often considered as a vital step to transform DICOM stack to an isotropic stack. In the resampled stack, the accuracy of integrating the contours of individual slices not degraded; also, it interpolates the z dimension with lower resolution and in-plane dimensions with higher resolution.
Figure 14 shows the 3D models of DICOM and resampled grid for the patient study. The three anatomical planes are used, and their dimensions are set in mm. For the DICOM grid in Figure 14a, it is observed that the dimensions [X × Y × Z] are set as [512 × 512 × 22]. Similarly, the resampled grid in Figure 14b the dimensions are viewed as [230 × 230 × 110]. The model permits to visualize the object interactively in all the three directions specified.
From Figure 14a,b, it is clear that the resampled grid offers a smoother surface than the DICOM grid. Resampled grid offers a smoother iso-surface and better 3D visualization.
The proposed work had been validated against various modalities of the BRATS dataset and clinical slices. The performance progression is carried out at each stage of the suggested segmentation procedure. The fuzzy clustering technique had given prominent results in the enhancement phase that aids in effective extraction in post-processing stages. The proposed work had considered two to nine classes (k) that were applied on each slice of the patient under study for ascertaining the most prominent k that could yield the best segmentation. The silhouette score is taken as validation metric results in the optimal enhancement of slices since it considers the k b e s t , i measure for making up the number of required classes. This validated clustering process helps in minimizing the loss of tumor intensities over the patient study. Also, a comparative segmentation analysis had been carried out against Chan-Vese and watershed algorithms for ensuring the segmentation quality of FC. To overcome the computational complexity, the proposed work had considered k = 9 as the upper limit for the number of clusters. For DRLS post-processing, imparting single well potential function and Gaussian kernel value as 1.5 had yielded better extraction of tumor part than RG and MCW techniques. In the future, the proposed procedure can be pondered on brain slices containing diffused boundaries and other image modalities in addition to magnetic resonance angiograms (MRA).

4. Conclusions

In this work, a hybrid procedure is implemented, which uses fuzzy clustering with silhouette analysis followed by MCW, RG, and DRLS procedures. Moreover, this proposed method applied to the entire slices of abnormal patient studies obtained from the BRATS challenge and the Proscans Diagnostics Centre. This investigation delivered better segmentation of the regions where the concentration of tumor was high. The best-segmented objects are obtained using clustering techniques which are further evaluated by silhouette metrics. The tumor objects from the enhanced slices are segmented based on MCW/RG/DRLS techniques. The quantification results of the mined anomalies ensure the progression of counterpart tumors at different treatment stages. The clinical significance of the proposed hybrid approach gives a better prognosis identification against the ground truth. The use of python open source technologies in implementing the work can visualize, analyze and interact with the slice data claim to be cost-effective. Hence, the proposed framework on MR DICOM slices requires less user intervention in extracting tumor heterogeneity from typical brain structures. Quantification and 3D modeling procedure help in finding a spatial identity and tumor concentration. By knowing the size, shape and spatial location of the tumor, the process of treating the tumor might be improved. The future work could include the implementation of advanced artificial intelligence methodologies for early, efficient, and real-time diagnosis of malignant brain tumors [58,59,60,61,62,63,64,65].

Supplementary Materials

The video abstract can be found at the following link: https://drive.google.com/file/d/1ddr0DxPNP1cX7aMC-dvSx12sQJ4fuH59/view?ts=5e452180. Video: An Efficient Hybrid Fuzzy-Clustering Driven 3D-Modeling.

Author Contributions

Conceptualization, S.K., D.S.; methodology, S.K., D.S., D.R.V.P.M.; software, S.K.; validation, K.S. D.N.K.J., D.G.R.; formal analysis, S.K., D.S., D.R.V.P.M.; investigation, S.K., D.S., D.R.V.P.M.; resources, K.S.; data curation, S.K., K.S.; writing—original draft preparation, S.K.; writing—review and editing, D.S., D.R.V.P.M., K.S., D.N.K.J., D.G.R., A.I.; visualization, D.N.K.J., D.G.R.; supervision, K.S., D.N.K.J., and project administration, K.S., D.N.K.J.; funding acquisition, D.N.K.J. All authors have read and agreed to the published version of the manuscript.

Funding

This work was funded, in part, by the Scheme for Promotion of Academic and Research Collaboration (SPARC), Ministry of Human Resource Development, India under the SPARC/2018-2019/P145/SL, in part, by the framework of Competitiveness Enhancement Program of the National Research Tomsk Polytechnic University, Russia in part, and, in part, by the International cooperation project of Sri Lanka Technological Campus, Sri Lanka and Tomsk Polytechnic University, Russia, No. RRSG/19/5008.

Acknowledgments

The authors would like to acknowledge the support granted by Proscans Diagnostics Centre, the leading and reputed Pathology Lab network in Chennai, Tamilnadu, India, for providing real clinical images of the brain MRI.

Conflicts of Interest

The authors declare that they have no conflict of interest.

Ethical Approval

This article follows the ethical standards of 1964 Helsinki declaration with its future amendments.

References

  1. Karaa, W.B. Biomedical Image Analysis and Mining Techniques for Improved Health Outcomes; IGI Global: Hershey, USA, 2015. [Google Scholar] [CrossRef]
  2. El-Dahshan, E.S.; Mohsen, H.M.; Revett, K.; Salem, A.B.M. Computer-aideddiagnosis of human brain tumor through MRI: A survey and a new algorithm. Expert Syst. Appl. 2014, 41, 5526–5545. [Google Scholar] [CrossRef]
  3. Chyzhyk, D.; Savio, A.; Graña, M. Evolutionary ELM wrapper feature selection for Alzheimer’s disease CAD on anatomical brain MRI. Neurocomputing 2014, 128, 73–80. [Google Scholar] [CrossRef]
  4. Virmani, J.; Dey, N.; Kumar, V. PCA-PNN, and PCA-SVM based CAD systems for breast density classification. In Applications of Intelligent Optimization in Biology and Medicine; Springer: Berlin/Heidelberg, Germany, 2016; pp. 159–180. [Google Scholar]
  5. Bahadure, N.B.; Ray, A.K.; Thethi, H.P. Image analysis for MRI based brain tumor detection and feature extraction using biologically inspired BWT and SVM. Int. J. Biomed. Imag. 2017, 2017. [Google Scholar] [CrossRef] [Green Version]
  6. Fujita, H.; Uchiyama, Y.; Nakagawa, T.; Fukuokab, D.; Hatanakac, Y.; Hara, T.; Lee, G.N.; Hayashi, Y.; Ikedoa, Y.; Gaoa, X.; et al. Computer-aided diagnosis: The emerging of three CAD systems induced by Japanese health care needs. Comput. Methods Progr. Biomed. 2008, 92, 238–248. [Google Scholar] [CrossRef]
  7. Marshkole, N.; Singh, B.K.; Thoke, A.S. Texture and shape-based classification of brain tumors using linear vector quantization. Int. J. Comput. Appl. 2011, 30, 21–23. [Google Scholar]
  8. Arimura, H.; Tokunaga, C.; Yamashita, Y.; Kuwazuru, J. Magnetic resonance image analysis for brain CAD systems with machine learning. In Machine Learning in Computer-Aided Diagnosis: Medical Imaging Intelligence and Analysis; IGI Global: Hershey, USA, 2012; pp. 258–296. [Google Scholar] [CrossRef]
  9. Bidgood Jr, W.D.; Horii, S.C.; Prior, F.W.; Van Syckle, D.E. Understanding and using DICOM, the data interchange standard for biomedical imaging. J. Am. Med. Inf. Assoc. 1997, 4, 199–212. [Google Scholar] [CrossRef] [Green Version]
  10. Herrmann, M.D.; Clunie, D.A.; Fedorov, A.; Doyle, S.W.; Pieper, S.; Klepeis, V.; Le, L.P.; Mutter, G.L.; Milstone, D.S.; Schultz, T.J.; et al. Implementing the DICOM standard for digital pathology. J. Pathol. Inform. 2018, 9, 1–18. [Google Scholar] [CrossRef]
  11. Suresh, K.; Sakthi, U. Robust multi-thresholding in noisy grayscale images using Otsu’s function and harmony search optimization algorithm. In Advances in Electronics, Communication and Computing; Springer: Singapore, 2018. [Google Scholar] [CrossRef]
  12. Hartigan, J.A.; Wong, M.A. Algorithm AS 136: A k-means clustering algorithm. J. R. Stat. Soc. Ser. C 1979, 28, 100–108. [Google Scholar] [CrossRef]
  13. Dhanachandra, N.; Manglem, K.; Chanu, Y.J. Image segmentation using K-means clustering algorithm and subtractive clustering algorithm. Proc. Comput. Sci. 2015, 54, 764–771. [Google Scholar] [CrossRef] [Green Version]
  14. Abdel-Maksoud, E.; Elmogy, M.; Al-Awadi, R. Brain tumor segmentation based on a hybrid clustering technique. Egypt. Inf. J. 2015, 16, 71–81. [Google Scholar] [CrossRef]
  15. Kim, K.B.; Song, Y.S.; Park, H.J.; Song, D.H.; Choi, B.K. A fuzzy C-means quantization based automatic extraction of rotator cuff tendon tears from ultrasound images. J. Intell. Fuzzy Syst. 2018, 35, 149–158. [Google Scholar] [CrossRef]
  16. Dehariya, V.K.; Shrivastava, S.K.; Jain, R.C. Clustering of image data set using k-means and fuzzy k-means algorithms. In Proceedings of the 2010 International Conference on Computational Intelligence and Communication Networks, Bhopal, India, 26–28 November 2010; pp. 386–391. [Google Scholar] [CrossRef]
  17. Gasch, A.P.; Eisen, M.B. Exploring the conditional coregulation of yeast gene expression through fuzzy k-means clustering. Genome Biol. 2002, 3, research0059-1. [Google Scholar] [CrossRef] [PubMed] [Green Version]
  18. Rajinikanth, V.; Raja, N.S.M.; Kamalanand, K. Firefly algorithm assisted segmentation of tumor from brain MRI using Tsallis function and Markov random field. J. Control Eng. Appl. Inf. 2017, 19, 97–106. [Google Scholar]
  19. Raja, N.S.M.; Lakshmi, P.R.V.; Gunasekaran, K.P. Firefly algorithm-assisted segmentation of brain regions using tsallis entropy and Markov random field. In Innovations in Electronics and Communication Engineering; Springer: Singapore, 2018; pp. 229–237. [Google Scholar]
  20. Gath, I.; Geva, A.B. Unsupervised optimal fuzzy clustering. IEEE Trans. Pattern Anal. Mach. Intell. 1989, 515, 87–100. [Google Scholar] [CrossRef]
  21. Lletı, R.; Ortiz, M.C.; Sarabia, L.A.; Sánchez, M.S. Selecting variables for k-means cluster analysis by using a genetic algorithm that optimises the silhouettes. Anal. Chim. Acta 2004, 515, 87–100. [Google Scholar] [CrossRef]
  22. Muca, M.; Kutrolli, G.; Kutrolli, M. A proposed algorithm for determining the optimal number of clusters. Eur. Sci. J. 2015, 11, 36. [Google Scholar]
  23. Zeng, Y.Z.; Liao, S.H.; Tang, P.; Zhao, Y.Q.; Liao, M.; Chen, Y.; Liang, Y.X. Automatic liver vessel segmentation using 3D region growing and hybrid active contour model. Comput. Biol. Med. 2018, 97, 63–73. [Google Scholar] [CrossRef] [Green Version]
  24. Koulountzios, P.I.; Zervakis, M.E.; Karakitsios, P.L.; Stavroulakis, G.E. A semi-automatic algorithm for reconstruction and NURBS surface generation of thoracic aorta. In Proceedings of the 2017 IEEE International Conference on Imaging Systems and Techniques (IST), Beijing, China, 20 October 2017; pp. 1–6. [Google Scholar] [CrossRef]
  25. Nekooeimehr, I.; Lai-Yuen, S.; Bao, P.; Weitzenfeld, A.; Hart, S. Automated contour tracking and trajectory classification of pelvic organs on dynamic MRI. J. Med. Image. 2018, 5, 014008. [Google Scholar] [CrossRef]
  26. Wang, H.; Ahmed, S.N.; Mandal, M. Computer-aided diagnosis of cavernous malformations in brain MR images. Comput. Med. Image Gr. 2018, 66, 115–123. [Google Scholar] [CrossRef]
  27. Arbelaez, P.; Maire, M.; Fowlkes, C.; Malik, J. Contour detection and hierarchical image segmentation. IEEE Trans. Pattern Anal. Mach. Intell. 2010, 33, 898–916. [Google Scholar] [CrossRef] [Green Version]
  28. Essadike, A.; Ouabida, E.; Bouzid, A. Brain tumor segmentation with Vander Lugtcorrelator based active contour. Comput. Meth. Prog. Biomed. 2018, 160, 103–117. [Google Scholar] [CrossRef] [PubMed]
  29. Hemalatha, S.; Anouncia, S.M. A computational model for texture analysis in images with fractional differential filter for texture detection. Int. J. Ambient Comput. Intell. 2016, 7, 93–113. [Google Scholar] [CrossRef]
  30. Hu, S.; Wang, X.; Zhu, M.; Hao, G.; Yao, C.; Hu, C.-H. Differentiation of High-grade Gliomas from Brain Metastases Using Tissue Similarity Maps (TSMs) Based Relative Cerebral Blood Volume Values. Curr. Med. Image Rev. 2018, 14, 594–598. [Google Scholar] [CrossRef]
  31. Ali, S.M.; Abood, L.K.; Abdoon, R.S. Brain tumor extraction in MRI images using clustering and morphological operations techniques. Int. J. Geogr. Inf. Syst. Appl. Remote Sens. 2013, 4, 12–25. [Google Scholar]
  32. Deng, L.; Huang, H.; Yuan, J.; Tang, X. Automatic segmentation of corneal ulcer area based on ocular staining images. In Proceedings of the Medical Imaging 2018: Biomedical Applications in Molecular, Structural, and Functional Imaging; International Society for Optics and Photonics: Houston, TX, USA, 2018. [Google Scholar] [CrossRef]
  33. Dey, N.; Rajinikanth, V.; Ashour, A.S.; Tavares, J.M.R. Social group optimization supported segmentation and evaluation of skin melanoma images. Symmetry. Int. J. Geogr. Inf. Syst. Appl. Remote Sens. 2013, 4, 12–25. [Google Scholar]
  34. Chang, C.-Y.; Srinivasan, K.; Chen, M.-C.; Chen, S.-J. SVM-Enabled Intelligent Genetic Algorithmic Model for Realizing Efficient Universal Feature Selection in Breast Cyst Image Acquired via Ultrasound Sensing Systems. Sensors 2020, 20, 432. [Google Scholar] [CrossRef] [Green Version]
  35. Baghaie, A.; Yu, Z. An optimization method for slice interpolation of medical images. arXiv 2014, arXiv:1402.0936. [Google Scholar]
  36. Chenevert, T.L.; Malyarenko, D.I.; Newitt, D.; Li, X.; Jayatilake, M.; Tudorica, A.; Fedorov, A.; Kikinis, R.; Liu, T.T.; Muzi, M.; et al. Errors in quantitative image analysis due to platform-dependent image scaling. Trans. Oncol. 2014, 7, 65–71. [Google Scholar] [CrossRef] [Green Version]
  37. Rousseeuw, P.J.J. A graphical aid to the interpretation and validation of cluster analysis. J. Comput. Appl. Math. 1987, 20, 53–65. [Google Scholar] [CrossRef] [Green Version]
  38. Del Re, E.C.; Gao, Y.; Eckbo, R.; Petryshen, T.L.; Blokland, G.A.M.; Seidman, L.J.; Konishi, J.; Goldstein, J.M.; McCarley, R.W.; Shenton, M.E.; et al. A New MRI Masking Technique Based on Multi-Atlas Brain Segmentation in Controls and Schizophrenia: A Rapid and Viable Alternative to Manual Masking. J. Neuroimaging 2016, 26, 28–36. [Google Scholar] [CrossRef] [Green Version]
  39. Russakoff, D.B.; Tomasi, C.; Rohlfing, T.; Maurer, C.R. Image similarity using mutual information of regions. In Proceedings of the European Conference on Computer Vision, Prague, Czech Republic, 11 May 2004; pp. 596–607. [Google Scholar] [CrossRef]
  40. Chaddad, A.; Tanougast, C. Quantitative evaluation of robust skull stripping and tumor detection applied to axial MR images. Brain Inf. 2016, 3, 53–61. [Google Scholar] [CrossRef] [PubMed] [Green Version]
  41. Rajinikanth, V.; Satapathy, S.C.; Fernandes, S.L.; Nachiappan, S. Entropy-based segmentation of tumor from brain MR images–A study with teaching learning-based optimization. Pattern Recognit. Lett. 2016, 94, 87–94. [Google Scholar] [CrossRef]
  42. Thanaraj, P.; Parvathavarthini, B. Multichannel interictal spike activity detection using time–frequency entropy measure. Australas. Phys. Eng. Sci. Med. 2017, 40, 413–425. [Google Scholar] [CrossRef] [PubMed]
  43. Rajinikanth, V.; Dey, N.; Satapathy, S.C.; Ashour, A.S. An approach to examine magnetic resonance angiography based on Tsallis entropy and deformable snake model. Future Gener. Future Comput. Syst. 2018, 85, 160–172. [Google Scholar] [CrossRef]
  44. Roopini, I.T.; Vasanthi, M.; Rajinikanth, V.; Rekha, M.; Sangeetha, M. Segmentation of tumour from brain MRI using fuzzy entropy and distance regularised level set. In Proceedings of the Computational Signal Processing and Analysis, Singapore, 3 April 2018; pp. 297–304. [Google Scholar]
  45. Rajinikanth, V.; Satapathy, S.C.; Dey, N.; Vijayarajan, R. DWT-PCA Image fusion technique to improve segmentation accuracy in brain tumour analysis. In Microelectronics, Electromagnetics and Telecommunications; Springer: Singapore, 2018; pp. 453–462. Available online: https://0-link-springer-com.brum.beds.ac.uk/chapter/10.1007/978-981-10-7329-8_46 (accessed on 5 February 2020). [CrossRef]
  46. Krishnan, P.T.; Balasubramanian, P.; Krishnan, C. Segmentation of brain regions by integrating meta heuristic multilevel threshold with markov random field. Curr. Med. Imaging 2016, 12, 4–12. [Google Scholar] [CrossRef]
  47. Chen, Y.H.; Chang, C.C.; Lin, C.C.; Hsu, C.Y. Content-based color image retrieval using block truncation coding based on binary ant colony optimization. Symmetry 2019, 11, 21. [Google Scholar] [CrossRef] [Green Version]
  48. Kalaiselvi, T.; Selvi, S.K. Investigation of Image Processing Techniques in MRI Based Medical Image Analysis Methods and Validation Metrics for Brain Tumor. Curr. Med. Image Rev. 2018, 14, 489–505. [Google Scholar] [CrossRef]
  49. Rajinikanth, V.; Thanaraj, K.P.; Satapathy, S.C.; Fernandes, S.L.; Dey, N. Shannon’s entropy and watershed algorithm based technique to inspect ischemic stroke wound. In Smart Intelligent Computing and Applications; Springer: Singapore, 2019; pp. 23–31. [Google Scholar]
  50. Suresh, K.; Sakthi, U. Object Tracking based 3d Modelling and Quantification of Abnormal Contours in Brain MRI DICOM Study. J. Eng. Sci. Technol. 2019, 14, 2098–2115. [Google Scholar]
  51. Shanthakumar, P.; Ganesh Kumar, P. Computer aided brain tumor detection system using watershed segmentation techniques. Int. J. Image Syst. Technol. 2015, 25, 297–301. [Google Scholar] [CrossRef]
  52. Chan, T.F.; Vese, L.A. Active contours without edges. IEEE Trans. Image Proc. 2001, 10, 266–277. [Google Scholar] [CrossRef] [Green Version]
  53. Memon, F.; Unar, M.A.; Memon, S. Image quality assessment for performance evaluation of focus measure operators. arXiv 2016, arXiv:1604.00546. [Google Scholar]
  54. Moga, A.N.; Gabbouj, M. Parallel marker-based image segmentation with watershed transformation. J. Parallel Distrib. Comput. 1998, 51, 27–45. [Google Scholar] [CrossRef] [Green Version]
  55. Suresh, K.; Sakthi, U. A soft-computing based hybrid tool to extract the tumour section from brain MRI. Multimed. Tools Appl. 2019, 1–5. [Google Scholar] [CrossRef]
  56. Raja, N.S.; Fernandes, S.L.; Dey, N.; Satapathy, S.C.; Rajinikanth, V. Contrast enhanced medical MRI evaluation using Tsallis entropy and region growing segmentation. J. Ambient Intel. Hum. Comput. 2018, 1–12. [Google Scholar] [CrossRef]
  57. Chang, C.Y.; Srinivasan, K.; Hu, H.Y.; Tsai, Y.S.; Sharma, V.; Agarwal, P. SFFS–SVM based prostate carcinoma diagnosis in DCE-MRI via ACM segmentation. Multidim. Syst. Sign. Process. 2019, 1–22. [Google Scholar] [CrossRef]
  58. Kathiravan, S.; Kanakaraj, J. A Review of Magnetic Resonance Imaging Techniques. Smart Comput. Rev. 2013, 3, 358–366. [Google Scholar] [CrossRef]
  59. Hua, K.; Dai, B.; Srinivasan, K.; Hsu, Y.H.; Sharma, V. A hybrid NSCT domain image watermarking scheme. J. Image Video Proc. 2017, 2017, 10. [Google Scholar] [CrossRef] [Green Version]
  60. Srinivasan, K.; Sharma, V.; Jayakody, D.N.K.; Vincent, D.R. D-ConvNet: Deep learning model for enhancement of brain MR images. In Proceedings of the Basic & Clinical Pharmacology & Toxicology, Hoboken, NJ, USA, 23–24 December 2018; Volume 124, pp. 3–4. [Google Scholar] [CrossRef] [Green Version]
  61. Srinivasan, K.; Ankur, A.; Sharma, A. Super-resolution of Magnetic Resonance Images using deep Convolutional Neural Networks. In Proceedings of the 2017 IEEE International Conference on Consumer Electronics—Taiwan (ICCE-TW), Taipei, China, 12–14 June 2017; pp. 41–42. [Google Scholar] [CrossRef]
  62. Kathiravan, S.; Kanakaraj, J. A Review on Potential Issues and Challenges in MR Imaging. Sci. World J. 2013, 2013, 10. [Google Scholar] [CrossRef] [Green Version]
  63. Srinivasan, K.; Kanakaraj, J. A Study on Super-Resolution Image Reconstruction Techniques. Comput. Eng. Intell. Syst. 2011, 2, 222–227. [Google Scholar]
  64. Srinivasan, K.; Kanakaraj, J. An Overview of SR Techniques Applied to Images, Videos and Magnetic Resonance Images. Smart Comput. Rev. 2014, 4, 181–201. [Google Scholar] [CrossRef]
  65. Hua, K.-L.; Trang, H.T.; Srinivasan, K.; Chen, Y.-Y.; Chen, C.-H.; Sharma, V.; Zomaya, A.Y. Reduction of Artefacts in JPEG-XR Compressed Images. Sensors 2019, 19, 1214. [Google Scholar] [CrossRef] [PubMed] [Green Version]
Figure 1. The Architecture of the Proposed Hybrid Model.
Electronics 09 00475 g001
Figure 2. Flowchart of the proposed brain MRI examination of a patient study.
Electronics 09 00475 g002
Figure 3. Slice (12) Before (a) and after (b) skull stripping.
Electronics 09 00475 g003
Figure 4. Segmented results and Masked Objects for Slice 14.
Electronics 09 00475 g004
Figure 5. (a) No. of Clusters vs. Silhouette Scores; (b) Silhouette plot for Slice-14.
Electronics 09 00475 g005
Figure 6. BRATS Dataset image series with Expert’s Ground Truth.
Electronics 09 00475 g006
Figure 7. Segmentation results of BRATS T2 series.
Electronics 09 00475 g007
Figure 8. Segmentation results of BRATS T1C series.
Electronics 09 00475 g008
Figure 9. Average picture similarity measures of a patient study against expert’s ground truth.
Electronics 09 00475 g009
Figure 10. Average Jaccard and Dice score of individual patient studies for T2 modality. ‘Av.’ specifies the average score of all the patient studies.
Electronics 09 00475 g010
Figure 11. Average Jaccard and Dice score of individual patient studies for T1C modality. ‘Av.’ Specifies the average score of all the patient studies.
Electronics 09 00475 g011
Figure 12. Segmented results of the clinical dataset (middle slices only).
Electronics 09 00475 g012
Figure 13. Average picture similarity measures of clinical study with expert’s ground Truth.
Electronics 09 00475 g013
Figure 14. (a) DICOM Grid; (b) Resampled Grid.
Electronics 09 00475 g014
Table 1. Silhouette scores for Slices (10–14).
Slicesk = 2k = 3k = 4k = 5k = 6k = 7k = 8k = 9
Slice 100.455710.378470.39740.400630.404320.405680.4110.35408
Slice 110.428420.414510.441410.434350.438780.42620.436440.43349
Slice 120.441090.452730.44980.460010.471580.46160.460320.46397
Slice 130.471070.504790.519330.504450.510690.508430.500410.43237
Slice 140.489880.537670.547960.553550.585230.531460.520660.52847
The maximum silhouette score ( k b e s t , i ) obtained for the cluster range are highlighted in bold.
Table 2. Segmented results for state-of-art segmentation methods.
Slice 10Slice 11Slice 12Slice 13Slice 14
Watershed Electronics 09 00475 i001 Electronics 09 00475 i002 Electronics 09 00475 i003 Electronics 09 00475 i004 Electronics 09 00475 i005
Chan-Vese Electronics 09 00475 i006 Electronics 09 00475 i007 Electronics 09 00475 i008 Electronics 09 00475 i009 Electronics 09 00475 i010
Fuzzy Clustering Electronics 09 00475 i011 Electronics 09 00475 i012 Electronics 09 00475 i013 Electronics 09 00475 i014 Electronics 09 00475 i015
Table 3. Image quality measures for segmentation methods.
SegmentationSlicePSNRNCCNAESSIM
WatershedSlice 1021.31730.49230.68520.7955
Slice 1119.86050.38460.75710.7095
Slice 1222.69530.47420.70210.6992
Slice 1320.80650.41920.71210.7148
Slice 1421.76310.40310.72310.7219
Average21.288540.434680.715920.72818
Chan-veseSlice 1024.01870.51020.67120.7083
Slice 1123.08230.58020.63280.7153
Slice 1222.01760.49790.66930.6983
Slice 1325.21310.53740.65010.7213
Slice 1423.01290.52780.67120.6859
Average23.468920.53070.658920.70582
Fuzzy ClusteringSlice 1020.92340.48650.70910.6995
Slice 1128.67640.76810.40650.8204
Slice 1230.52890.75480.37730.8143
Slice 1332.34110.79170.39610.8968
Slice 1431.54010.78420.38430.8412
Average28.801980.717060.454660.81444
Table 4. Image similarity measures for BRATS T2 MRI series.
SliceJaccardDiceFPRFNR
FC+MCWS1000.86250.92010.006170.0487
S1100.76230.85870.001260.1327
S1200.71620.8280.004270.1117
S1300.74280.70480.0020440.2123
FC+RGS1000.89140.94210.007960.0742
S1100.77850.86910.001270.1566
S1200.71890.82990.001440.1951
S1300.74780.78680.009230.3995
FC+DRLSS1000.89580.93340.002880.083
S1100.79390.90910.001190.179
S1200.74270.85250.001760.1925
S1300.75920.79510.001590.2636
Table 5. Image similarity measures for BRATS T1C MRI series.
SliceJaccardDiceFPRFNR
FC+MCWS1000.66450.82840.00470.1904
S1100.51540.90670.00640.1868
S1200.69230.86430.00690.1628
S1300.71870.83220.00610.1954
FC+RGS1000.70710.91230.00510.1962
S1100.82930.80450.00580.1895
S1200.7610.89990.00520.1552
S1300.71270.90340.00430.2001
FC+DRLSS1000.76280.86550.00540.2467
S1100.83760.91160.00570.0994
S1200.81870.90030.00590.1567
S1300.73570.84770.00540.1886
Table 6. Image similarity measures for clinical T2 MRI series.
SliceJaccardDiceFPRFNR
FC+MCWS100.69320.78320.10270.0612
S110.82230.88280.10750.0311
S120.81850.85690.15790.0424
S130.81370.87610.16830.0422
S140.73140.81680.15440.1201
FC+RGS100.72090.77670.11230.0723
S110.81490.89340.10990.0793
S120.79530.84910.11840.0683
S130.80540.79620.11630.0923
S140.78210.80210.12010.0876
FC+DRLSS100.68740.79490.13360.0642
S110.81040.89720.12530.032
S120.82560.86250.13680.0296
S130.81790.88790.13740.038
S140.75550.85960.11640.0958
Table 7. Quantization features Area and Perimeter for best ‘K’.
SlicesFC EnhancementROI by DRLSAreaPerimeter
Slice 10
(k = 2)
Electronics 09 00475 i016 Electronics 09 00475 i0172268192.5097
Slice 11
(k = 4)
Electronics 09 00475 i018 Electronics 09 00475 i0194842324.60
Slice 12
(k = 6)
Electronics 09 00475 i020 Electronics 09 00475 i0216090366.74
Slice 13
(k = 4)
Electronics 09 00475 i022 Electronics 09 00475 i0236091375.90
Slice 14
(k = 6)
Electronics 09 00475 i024 Electronics 09 00475 i0256008320.1680
(a)(b)(c)(d)(e)
Table 8. Volume calculation of DICOM and Resampled stack.
StackNo. of VoxelsVoxel SizeVolume (mm3)
DICOM216231.008903221,815.5
Resampled269110.999826,905.6

