Article

External Breaking Vibration Identification Method of Transmission Line Tower Based on Solar-Powered RFID Sensor and CNN

1
School of Electrical and Automation Engineering, East China Jiaotong University, Nanchang 330013, China
2
School of Electrical Engineering and Automation, Hefei University of Technology, Hefei 230009, China
*
Authors to whom correspondence should be addressed.
Submission received: 9 February 2020 / Revised: 19 March 2020 / Accepted: 19 March 2020 / Published: 21 March 2020
(This article belongs to the Section Microwave and Wireless Communications)

Abstract

:
This paper proposes an external breaking vibration identification method of transmission line tower based on a radio frequency identification (RFID) sensor and deep learning. The RFID sensor is designed to obtain the vibration signal of the transmission line tower. In order to achieve long-time monitoring and longer working distance, the proposed RFID sensor tag employs a photovoltaic cell combined with a super capacitor as the power management module. convolution neural network (CNN) is adopted to extract the characteristics of vibration signals and relevance vector machine (RVM) is then employed to achieve vibration pattern identification. Furthermore, the Softmax classifier and gradient descent method are used to adjust the weights and thresholds of CNN, so as to obtain a high-precision identification structure. The experiment results show that the minimum sensitivity of the proposed solar-powered RFID sensor tag is −29 dBm and the discharge duration of the super capacitor is 63.35 h when the query frequencies are 5/min. The optimum batch size of CNN is 5, and the optimum number of convolution cores in the first layer and the second layer are 2 and 4, respectively. The maximum number of iterations is 10 times. The vibration identification accuracy of the proposed method is over 99% under three different conditions.

1. Introduction

Towers bear the actions of the transmission line and ground line, and keeps a certain safe distance between conductors, earth and tower. Its stability and reliability is the guarantee for operational safety of the whole transmission line system. The vibration caused by external breaking conditions such as engineering construction, stolen sawing and stealing demolition will result in bending deformation of the towers, shorten the service life of the towers, and even lead to major disasters such as collapse of the towers [1,2].
Thanks to convenience and the economy, various wireless sensor network technologies, such as ZigBee [3,4], Lora [5,6] and NB-IoT [7,8], have been widely used in the field of industrial environmental monitoring. However, these monitoring sensor network nodes based on the above technologies exhibit the disadvantages of complex circuit structure and high power consumption, which has to be powered by extra batteries, and is not suitable for long-term online monitoring. In recent years, the design of radio frequency identification (RFID) sensor tags has aroused widespread interest. Due to the working mechanism of backscattering, RFID sensor tags show the characteristics of simple circuit structure, low cost and low power consumption [9], which is especially suitable for long-term monitoring. Moreover, because each RFID sensor tag has unique ID information, it is suitable for rapid fault location.
There are various design methods of the RFID sensor system. The works [10,11] present the designs of chipless RFID sensors, which make use of sensor signals to directly modulate the backscattering performances of the antenna. These chipless RFID sensors show the advantages of ultra-low cost; however, they are single function and are not able to compose the sensor network due to the lack of digital blocks. Most chip-based RFID sensors work on ultra-high frequency for high communication speed and no-contact operation. The works [12,13] present the designs of passive RFID sensor tags which harvest wireless energy from the RFID reader. These passive RFID sensors show the advantages of low-cost and long time monitoring. However, the working distance of a passive RFID sensor tag is relatively short and generally no more than 10 m. In order to extend the working distance, the active RFID sensor tags [14,15] employ auxiliary batteries as the power supply. However, the limited working life of batteries makes active RFID sensors not suitable for long-term monitoring. Therefore, the research of energy supply is the key to the design of RFID sensor tags. Self-powered RFID sensor tags combine the advantages of passive and active RFID tags [16]. It is not only suitable for long-term monitoring, but also can achieve a longer working distance similar to active RFID sensors. Solar energy shows the advantages of high energy density, green environmental protection and mature development, which is especially suitable for a wireless sensor power supply [17].
The vibration identification of transmission line towers can be summarized as the problem of pattern identification. Firstly, the vibration signals of transmission line towers are pre-processed by signal amplification and filtering. Then, the characteristic parameters such as vibration frequency and vibration damping ratio are extracted as the input parameters of the neural network, and the neural network model is trained to realize the automatic identification of vibration patterns of towers. With the development of artificial intelligence technology, the artificial neural network algorithm has been widely used in bearing fault diagnosis [18], equipment condition monitoring [19], bridge damage identification [20] and etc. However, as a shallow structure, the artificial neural network exhibits low learning ability and generalization ability, which is easily lead to over-fitting, difficult convergence and local optimum problems [21,22,23]. Moreover, the current feature extraction methods, such as Fourier transform and wavelet transform, use fewer parameters and cannot fully reflect the mode information of vibration signals [24,25].
This paper proposes an external breaking vibration identification method of transmission line tower based on the radio frequency identification (RFID) sensor and deep learning. The RFID sensor is designed to acquire the vibration signal of the transmission line tower under different conditions. The photovoltaic cell combined with the super capacitor is used as a power management module to realize long-time monitoring and longer communication distance. For achieving high precision and high efficiency, the convolution neural network (CNN) is adopted to extract the features of vibration signals and then the relevance vector machine (RVM) is employed to achieve vibration pattern identification.
The rest of the paper is organized as follows. In Section 2, we design a solar-powered RFID sensor to obtain the vibration signal of the transmission line tower. In Section 3 we establish a vibration identification model based on CNN and RVM. The experiment and simulation results are shown and discussed in detail in Section 4. The conclusion is then made in Section 5.

2. Design of Solar-Powered RFID Sensor

Figure 1 shows the structure of the proposed solar-powered RFID sensor tag, which is composed of a communication module, power management module and digital module. The communication module is composed of a communication antenna and RFID communication chip, which is responsible for transmitting, receiving, modulating and demodulating the sensor tag signal. The power management module is composed of a photovoltaic cell, super capacitor management module and voltage regulator, which is responsible for converting the solar energy into a stable power supply for the tag. The digital module is composed of a micro-controller unit (MCU) and sensors, which are responsible for controlling the whole sensor tag and sensor signal conversion.
The energy management module is key for the design of the sensor tag. The proposed energy management scheme of the RFID sensor tag is shown in Figure 2. When the light is sufficient, the fast charging module first stores the energy of the super capacitor, and then supplies power to the tag through the voltage regulator. When the light is weak, the charging module stops working, and the super capacitor starts discharging to keep its normal operation. When the RFID sensor tag works in sleep mode, its current consumption is only in the size of μA, so the tag can extend the discharge time of the super capacitor through reducing the communication frequency. The upper computer can intelligently adjust the reading frequency of the reader by analyzing the ambient light intensity to extend the monitoring life of the tag.
The schematic of the proposed power management module is shown in Figure 3. The photovoltaic cell collects and converts the light energy into electric energy, which is then filtered and output to the DC-DC charge pump LTC3225. This charge pump with low threshold voltage can quickly store the electric energy in two 5 F/5 V super capacitor C1 and C2 in series. When the super capacitor is fully charged, the charge pump continuously outputs the electric energy of 5.3 V voltage and 150 mA current to the low dropout regulator (LDO) TPS780. This LDO can output a stable voltage of 3 V to supply the RFID sensor. When the light is insufficient, the super capacitor starts to output electric energy to ensure that the RFID sensor continues to work normally, with a long discharge time and a large voltage range of 5 V to 3.2 V. The designed energy management circuit not only can make the most of the energy when the sun is full, but also can provide a stable energy when the light is weak.
The discharge time of the super capacitor is important for the RFID sensor system, which determines the maximum working time of the tag without energy harvesting. As an energy storage device, the complete discharge time of the super capacitor can be described as:
T d i s = C o u t ( Δ V I L o a d R E S R )
where Cout represents the total output capacitance of the tag, ΔV is the voltage drop of Cout, and RESR represents the equivalent resistance of Cout. The current consumption ILoad of the tag in this design is only in the size of μA. When the super capacitor starts discharging from 5 V to 3.2 V, its continuous discharge time can last for dozens of hours.

3. Deep Learning Model

Deep learning is a kind of machine learning technology, which has a deep hierarchical structure of automatic feature extraction and can be used for pattern analysis and classification. The convolution neural network imitates the mammalian visual neural network and adopts the information processing mode of hierarchical feature extraction. It first extracts the low-level features of the input information, which is then combined into the high-level feature information at the high-level. After the multi-level feature transferring, it can obtain enough high-level feature information, and then calculates the final output.

3.1. Identification Process

Figure 4 shows the flow chart of the vibration signal identification used in this paper. Firstly, one-dimensional samples of vibration signals are pre-processed and transformed into a corresponding two-dimensional matrix form. Then, the training samples are output to the deep learning model and fine-tuned with Softmax algorithm [26], so as to obtain a high-performance deep feature extraction model. After obtaining the feature vectors with high discrimination, they are trained in the correlation vector machine to obtain the vibration identification model and realize the automatic identification of the tower vibration pattern.

3.2. Data Preprocessing

Deep learning algorithms such as CNN and denoising autoencoder (DAE) are mainly used to recognize two-dimensional signals [27], so when they are applied to one-dimensional signals such as vibration signals and speech signals, it is necessary to pre-process these signals and transfer them into two-dimensional forms. In this paper, the delay embedding technique is introduced to achieve this transformation. The vibration signal is a one-dimensional sequence {xi, i = 1, 2, …, N}, where N is the number of sampling points. The vector Xi can be obtained by combining the original signal sequence xi after delay:
X i = ( x i , x ( i + τ ) , x ( i + 2 τ ) ,   , x [ i + ( m 1 ) τ ] ) T
where τ is the delay time, m is the embedding dimension. If i = 1, 2, …, N-m, the N-m vector sequences Xi with embedding dimension m can be obtained by delay combination, and then the vector space X can be described as:
X = { x 1 x 2 x 3 x [ N + ( m 1 ) τ ] x ( 1 + τ ) x ( 2 + τ ) x ( 3 + τ ) x [ N + ( m 2 ) τ ] x ( 1 + 2 τ ) x ( 2 + 2 τ ) x ( 3 + 2 τ ) x [ N + ( m 3 ) τ ] x [ 1 + ( m 1 ) τ ] x [ 2 + ( m 1 ) τ ] x [ 3 + ( m 1 ) τ ] x N }
where each column represents a vector, which can be regarded as a phase point Xi in the phase space. In Equation (3), the parameters τ and m can be obtained by the Cross Correlation (C-C) algorithm [28].

3.3. Convolutional Neural Network

CNN is a kind of deep learning neural network developed in recent years. The algorithm learns data features layer by layer through the arrangement of several serial convolution layers and pooling layers, avoiding the drawbacks of traditional machine learning algorithms that need to extract data features manually [29]. As shown in Figure 5, the hidden layer is mainly composed of an alternately repeated convolution layer and pooling layer. Each characteristic matrix can be regarded as a plane. Different planes correspond to different convolution kernels, which makes feature extraction more sufficient. In the learning process of CNN, back propagation (BP) algorithm is used to adjust the weight matrix by reducing the mean square error between ideal output and actual output. Finally, the invariant features of translation, rotation and scaling in input data can be obtained.

3.4. Relevant Vector Machine

RVM is a sparse probability model similar to SVM. It has the same function as SVM and can achieve the same identification accuracy as SVM [30]. The main principle of RVM is to obtain the relevant vectors and weights by maximizing the marginal likelihood. RVM model expressions can be summarized as follows:
p ( t i | t , α , σ 2 ) = N ( t i | y i , σ i 2 )
y i = Φ ( x i ) μ
σ i 2 = σ M P 2 + Φ ( x i ) T Φ ( x i )
It can be seen that the purpose of prediction is to get y(xi; μ) directly. In addition, the prediction expectation is the sum result of each basis function after weighting, and the prediction difference is the result of the combination of error and prediction. As for any new input variable, the predicted value of the output variable can be obtained by using the expression of yi.

4. Simulation and Experiment Results and Discussion

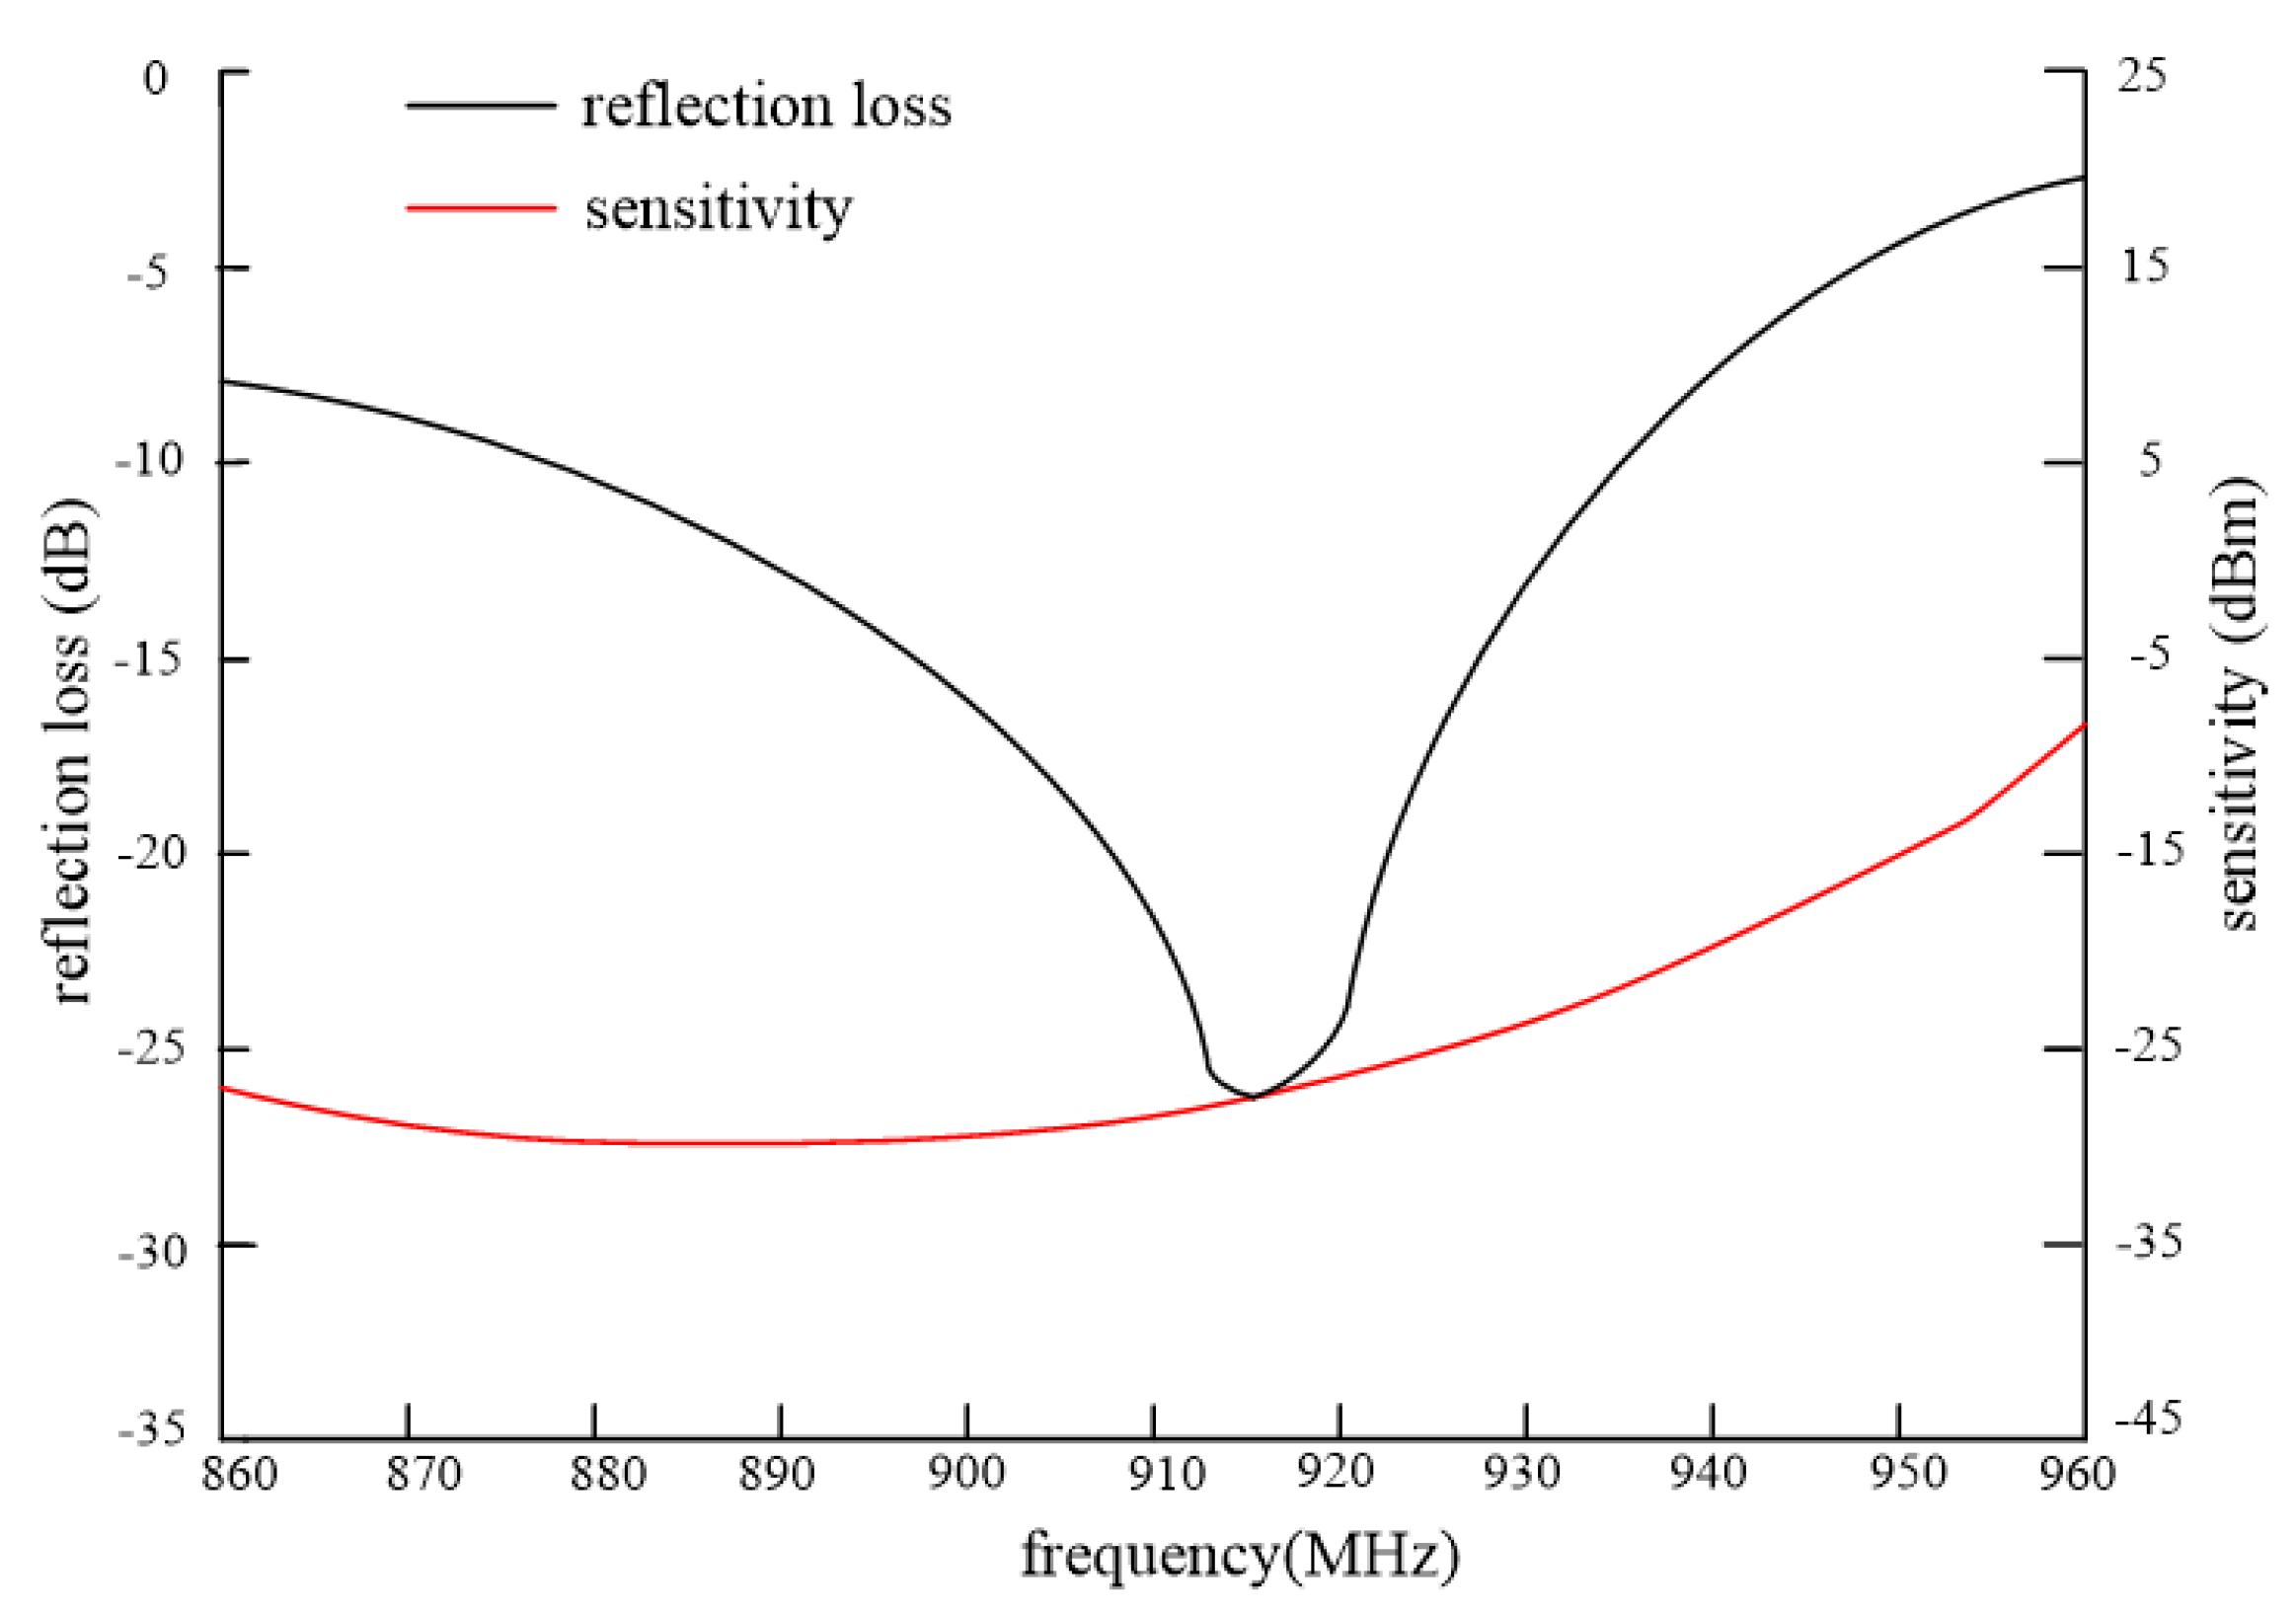
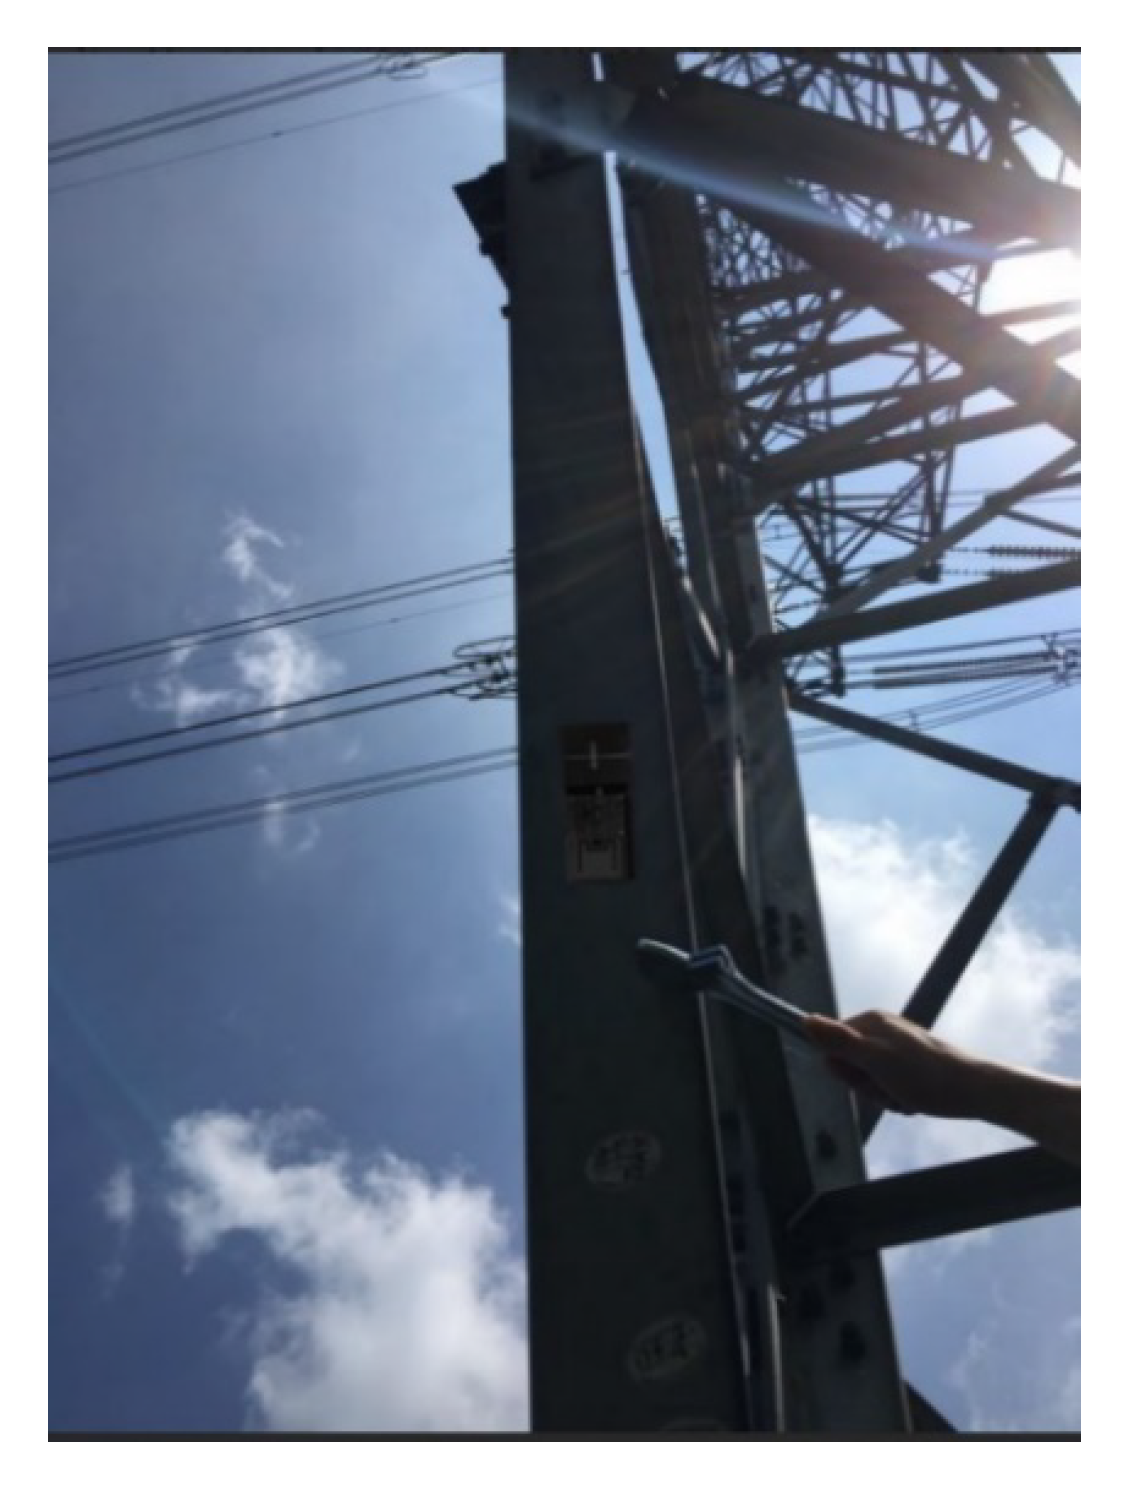
4.1. Solar-Powered RFID Sensor Tag Test

Figure 6 shows the prototype of the proposed solar-powered RFID sensor tag, which components are listed in Table 1. The photovoltaic cell covers 8 × 8 cm2, and its maximum output voltage is 5 V, the maximum output current is 160 mA, and the maximum output power is 0.8 W. The DC-DC Charge Pump adopts LTC3225 which opening voltage is 2.8 V. The RF chip adopts Monza X-8K which impedance is 19−172 JΩ at 915 MHz. The MCU module employs MSP430FR6964 which was set as the energy-saving mode with a working frequency of 1 MHz to achieve the function of I2C read-write and ADC sampling. The sensor module adopts the three-axis acceleration sensor ADXL372, which supports I2C bus output and can reach the acceleration measurement range of 200 g. In order to improve the metal resistance, the proposed RFID antenna employs microstrip antenna with U-slot architecture to reduce the antenna size. The printed circuit board (PCB) adopts FR4 board with dielectric constant of 4.5 and thickness of 2 mm.
Figure 7a shows the test environment in the lab. The communication performances of the designed RFID sensor tag were firstly tested in the lab by a specialized RFID tester JX-R1200 produced by JX Instrumentation, China. The distance between the RFID sensor and the RFID reader is set to be 2 m, and the transmitting power of the reader is 4 W. Figure 7b shows the measured communication flow. The reader first sends Select command to the RFID sensor tag. After that, the Query command is sent to the sensor, which then responds to the reader with RN16. The reader then issues ACK command to obtain ID information of the sensor including the measurement data. Finally, the reader sends Re1_RN command to get the Handle response. From Figure 7 we know that the measured communication flow is according to the RFID protocol of ISO18000-6C. Furthermore, we can also distinguish the unique ID from the received ID information, which proves the rapid positioning ability of the proposed RFID sensor tag.
In order to test the maximum working distance in the lab, a 3 V battery was used to replace the photovoltaic cell. As shown in Figure 8, the measured center frequency of the antenna is 915 MHz, and the corresponding return loss S11 is −26 dB, which conforms to ISO18000-6C protocol that the value of S11 at the center frequency should be lower than −10 dB. Tag sensitivity is defined as the minimum received signal power that can activate the tag. In order to test the tag sensitivity, the antenna of the RFID sensor tag was placed vertically with the RIFD reader for the maximum received power of the tag. As can be seen from Figure 8, the minimum sensitivity of the tag is about −29 dBm, which corresponds to a maximum working distance of 21 m under the RFID reader power of 3.2 W.
Table 2 shows the discharge duration of the super capacitor under different query frequencies of the RFID reader. When the query frequencies are 20/min, 10/min and 5/min respectively, the measured discharge duration is 27.3 h, 46.5 h and 63.35 h, respectively. The measured results show that the proposed RFID sensor tag can continue to work normally when there is no sun exposure, and when the reader query frequency is smaller, its discharge time is longer, which meets the needs of long-time monitoring design.
Table 3 summarizes the power supply and the maximum operating distance of various UHF RFID sensor tag designs. The passive RFID sensor tags [12,13] harvest the wireless energy from the RFID reader and these sensors are suitable for long-time monitoring. The active RFID sensor tags [14,15] can achieve longer operating distance with auxiliary battery, however their working lives are usually 1–2 years due to limited battery energy. The self-powered RFID sensor combines the advantages of passive tags and active tags and can achieve similar operating distances as active tags. Compared to the vibration-powered RFID sensor [16], the proposed RFID sensor adopts solar energy as the power supply which is more convenient and lower cost.

4.2. Identification Scheme Results

The server configuration for our test is shown in Table 4. In this paper, Python is used as the programming language, and Tensorflow2.0 is used to build the model framework.

4.2.1. Training Sample Acquisition
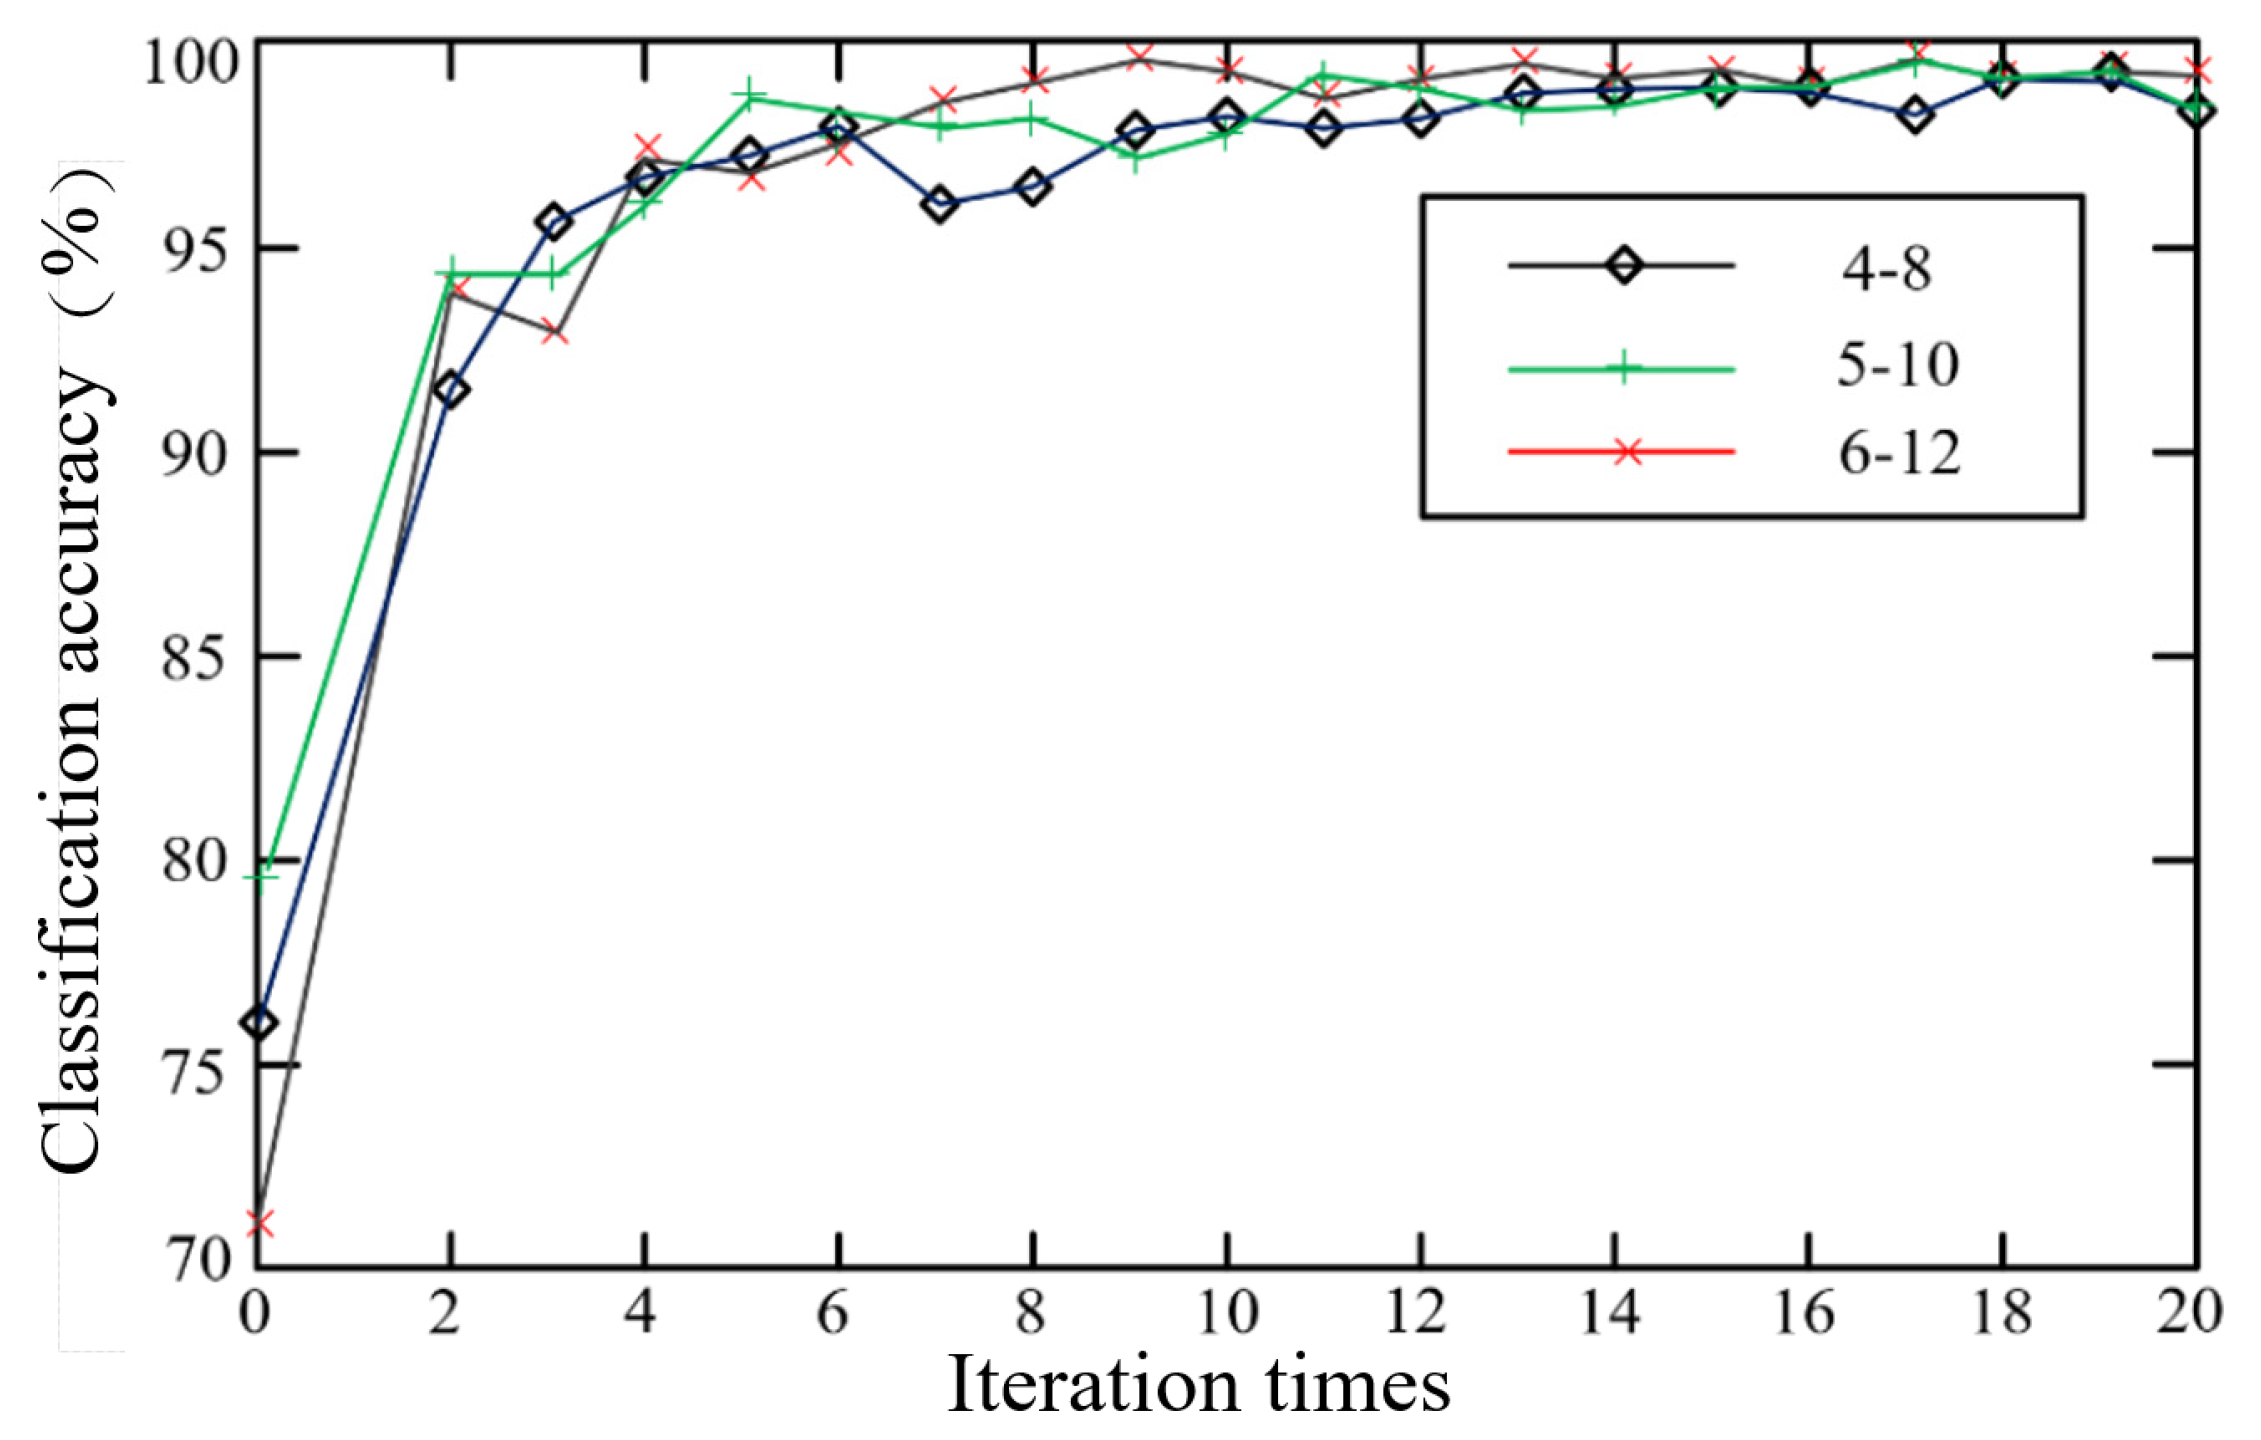
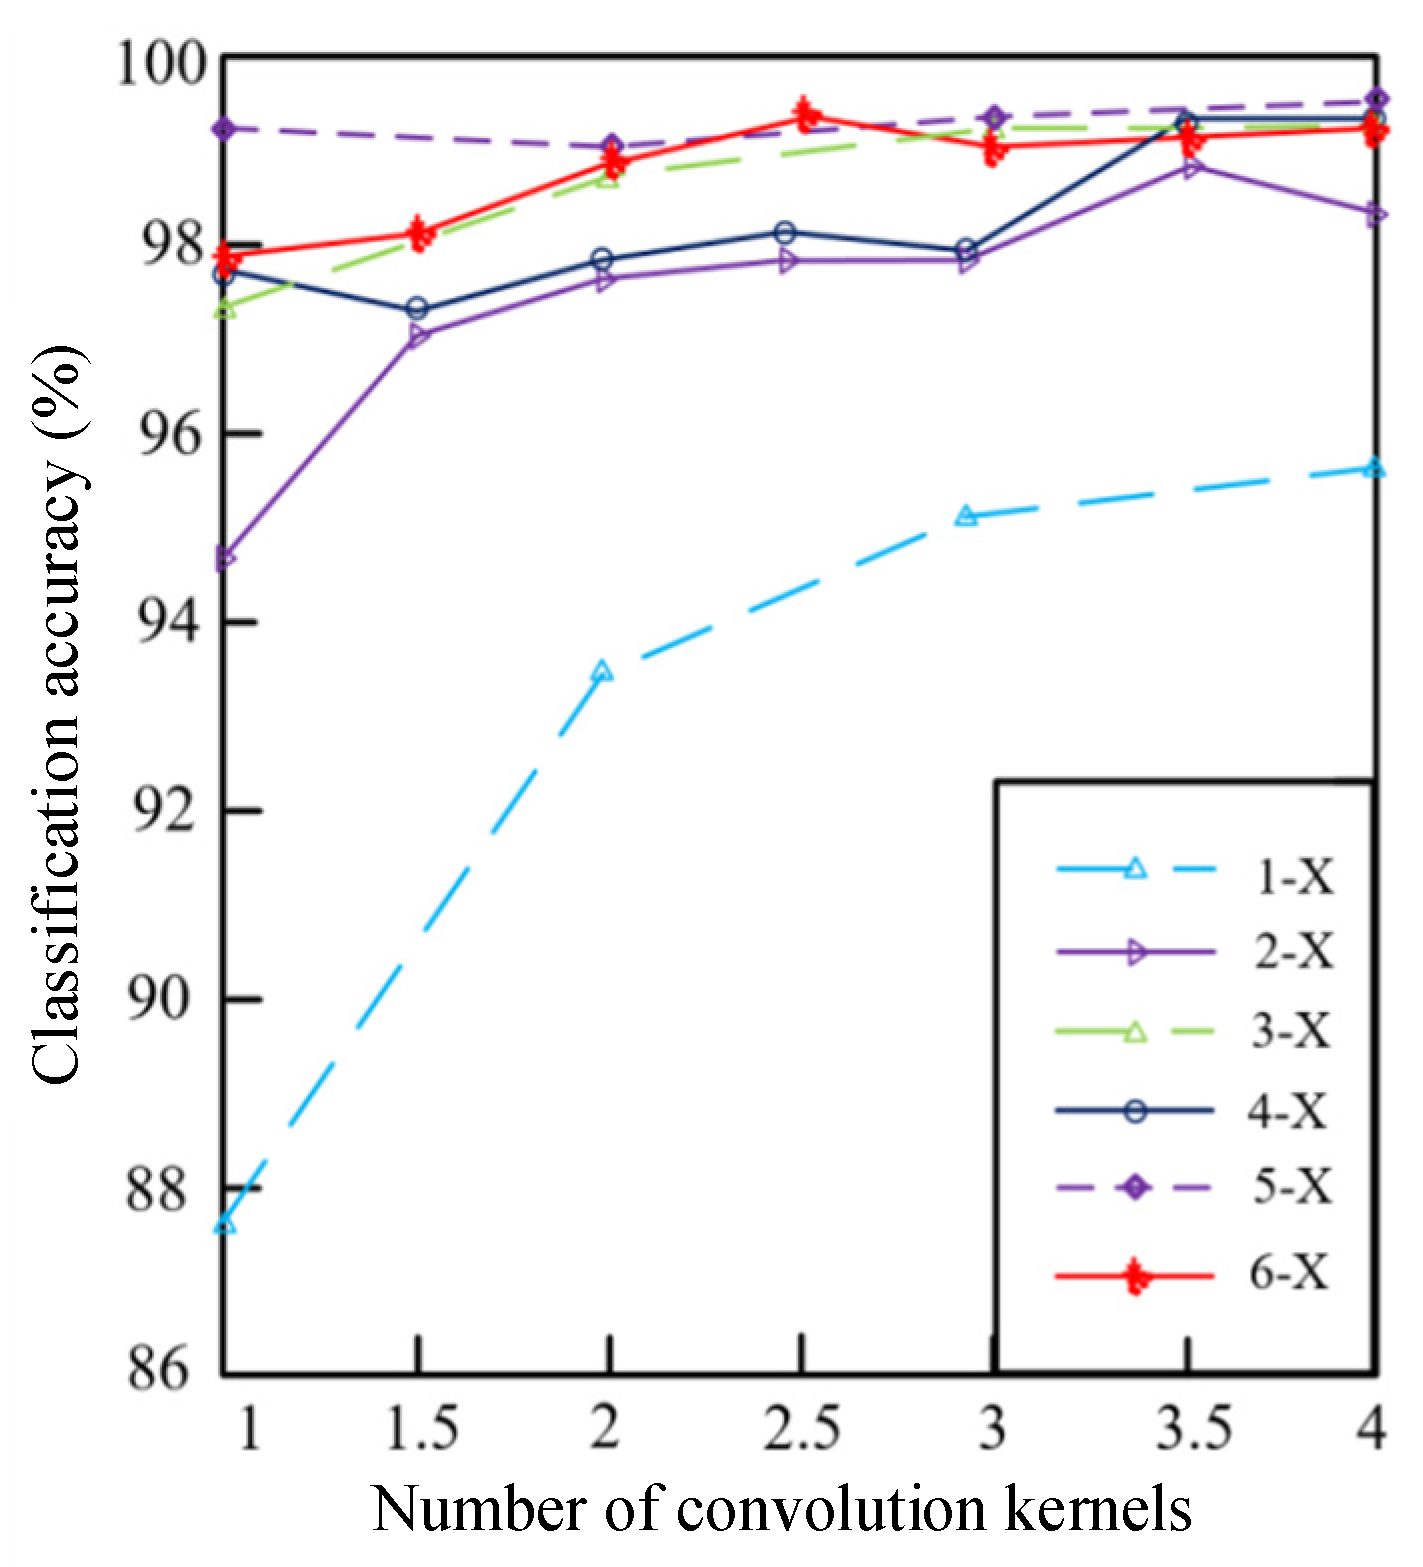
As shown in the Figure 9, a 500 kV transmission line tower (SDJ1) was selected for our experiment. The RFID sensor tag was installed in the middle of the fixed support bar of the tower. The antenna of the RFID sensor tag was placed vertically with the RIFD reader to achieve the optimal communication performances. In order to simulate the behavior of artificial external breaking vibration of the tower, this paper employed metal tools of three different materials to obtain 1000 groups of vibration experimental data of the tower respectively. We also collected the vibration signals of the tower under two different environments of ice-free wind excitation and ice-covered wind excitation. Table 5 shows the sample data set under nine different conditions. The sampling frequency and the sampling time of each group were set to be 500 Hz and 100 ms respectively, which means there were 50 sample points in each group.

4.2.2. CNN Training

The pre-processed samples were fed into the CNN algorithm, and convolution and pooling operations were carried out according to the method shown in Section 3. Then the output vectors were fed into Softmax classifier and the CNN was fine-tuned by the gradient descent method. The parameters of the CNN model are shown in Table 6. According to our experience, the learning rate, the weight attenuation and the dropout were set to be 0.001, 0.005 and 0.75, respectively.
When extracting vibration signal features, the selection of structural parameters has a great influence on the extraction results. Therefore, in order to reflect the ability of CNN to extract deep features of tower vibration signals, it is necessary to select appropriate parameters. The number of iterations, the size of convolution kernels and the number of convolution kernels have great influences on the identification parameters. In order to select the best network parameters, the following three parameters will be further analyzed.
  • Number of iterations
Iteration is essentially a process of approaching the desired goal. The fewer iterations, the less satisfactory the fitting effect is. But the number of iterations is not infinite. When the number of iterations increases to a certain extent, the error will not be reduced. At the same time, the problem of time cost should also be considered. Therefore, the appropriate number of iterations must satisfy the specific identification rate, but also have a relatively low time cost.
As shown in Table 5, this experiment collected 9000 groups vibration samples under nine different conditions. Fifty percent of the total samples were sent to CNN network for training. After 10 repetitions, the average classification accuracy of Softmax classifier was taken as the evaluation criterion, and the correlation between iteration times and classification accuracy was obtained. As shown in Figure 10, different curves in the graph represent different convolution kernels. It can be seen that when the number of iterations is more than 5, the identification accuracy is more than 90%. When the number of iterations is more than 8, the identification accuracy is more than 99%. But when the number of iterations further increases, the identification accuracy tends to be stable. Therefore, this paper chose 8 as the number of iterations, which can satisfy the higher classification accuracy and the lower time cost at the same time.
2.
Mini-batch
A complete iteration process can be decomposed into a random batch size sample for batch training, and then adjust the weights once, until all training samples are input. The batch size is the same as the number of iterations. It is necessary to select a larger batch size value while considering the time cost.
The number of iterations is selected as 8 according to the conclusion of the previous experiment. The principle of batch size selection must first satisfy the need to divide the number of training samples, so the size of batch size should be 2, 4, 5, 8, 10, 20, 25, 40 and 50, respectively. The relationship between classification accuracy and batch size is shown in Figure 11.
It can be seen that, when the batch size is less than 8, the change of batch size has little effect on the classification accuracy. When the batch size is larger than 8, the classification accuracy decreases obviously with the increase of batch size. When the total number of samples is determined, a relatively small batch size should be selected under the condition that the number of training samples can be divided. Considering the time cost factor, the batch size of this paper was set to be 5.
3.
Number of convolution kernels
How many features can be extracted from a set of data means how many convolution kernels it has. In the process of convolution calculation, the number of convolution kernels and extraction features are one-to-one correspondence, but the number of convolution kernels is proportional to the time. It is not only that the more convolution kernels, the better the extracted features; the longer the operation time will also affect the identification effect. Therefore, it should choose the appropriate number of convolution kernels based on the complexity of image and classification.
In order to simplify the experiment, the average accuracy of 10 identifications was also used as the evaluation marker. Only when the number of convolution kernels in the second layer was multiplied by the number of convolution kernels in the first layer is considered. Figure 12 shows the change curve of the number of convolution kernels and identification accuracy. The abscissa is the number of convolution kernels in the first layer and the ordinate is the identification accuracy. The different curves represent the different proportion of the convolution kernels in the second layer and the convolution kernels in the first layer.
It can be found from Figure 12 that the number of convolution kernels in the first layer is greater than 1, and the number of convolution kernels in the second layer is 2–4 times of the number of convolution kernels in the first layer, which can not only make the identification effect good, but also make the training time lower than the time required for higher multiples.

4.2.3. RVM Identification

Softmax classifier is a generalization of regression classifier, which belongs to a weak classifier in essence, so its identification ability is not enough to meet the requirements of pattern identification of tower vibration signals in complex environment. In this paper, Softmax is only a means to supervise CNN fine-tuning, which will be removed after global fine-tuning. The next step is to complete pattern identification by a better performance classifier after fault feature extraction.
It can be seen from Section 3 that RVM is based on Bayesian learning principle and has both identification accuracy and training efficiency. Therefore, this paper chooses RVM algorithm as the final identification algorithm, and inputs the characteristic vector of CNN output into RVM for training, so as to obtain RVM identification model. In this step, 9000 groups of samples were re-sampled, 50% of each class of samples were taken as training samples, and another 50% were taken as test samples. Among them, the simulated external breaking vibration samples are positive samples, while the ice-covered wind and non-ice-wind excitation vibration samples are negative samples.

4.2.4. Model Classification Results

In this paper, 4500 groups of test samples were used to test the identification ability of CNN-RVM identification algorithm. The test results are shown in Table 7. It can be seen that, for three different types of vibration signals, the algorithm has better identification accuracy and meets the actual needs of tower vibration identification.
In order to further verify the performances of the identification model proposed in this paper, several common vibration signal identification algorithms were used to train and test the same set of sample data. The results are shown in Table 8.
From the above results, we can see that the traditional feature extraction method based on fast Fourier transform (FFT) has low identification accuracy because of its limited feature extraction ability. The identification accuracy of the two models constructed by CNN is both over 90%, which indicates the superior performance of CNN in extracting the inner deep features of signals. In addition, it also can be found that RVM algorithm has higher identification accuracy than SVM.

5. Conclusions

In this paper, we aimed to develop an external breaking vibration identification method of transmission line tower based on RFID sensor and deep learning. The key technique innovation in this paper includes: (1) Design a solar-powered RFID sensor to obtain the vibration signal of transmission line tower under different conditions. (2) Propose a vibration identification mode of transmission line tower based on CNN-RVM. Experiment results show that the proposed solar-powered RFID sensor tag can achieve the minimum sensitivity of –29 dBm and the discharge duration of super capacitor is 63.35 h when the query frequencies are 5/min. In order to verify the validity and stability of the proposed vibration identification model, the tower vibration signals are input into different methods for comparison. The results show that under three different conditions, the proposed vibration identification model has the highest accuracy over 99%. Therefore, the proposed scheme can realize long-term and effective monitoring of transmission line tower.

Author Contributions

All authors have read and agree to the published version of the manuscript. Project administration F.D.; Conceptualization, F.D.; funding acquisition F.D.; supervision F.D. and J.T.; formal analysis K.W. and Z.X.; software K.W. and H.L.; validation, K.W., Z.X. and H.L.; writing, K.W. and J.T.

Funding

This research was funded by Natural Science Foundation of China, grant number 51767006”, Key Research and Development Plan of Jiangxi Province, grant number 20181BBE50019”, 20181BBE50009”, and Science and Technology Project of Education Department of Jiangxi Province, grant number GJJ170378”.

Conflicts of Interest

The authors declare no conflict of interest.

References

  1. Xiong, X.; Weng, S.; Wang, J. An online early-warning method for wind swing discharge of the conductor toward the tangent tower and jumper toward the strain tower. IEEE Trans. Power Deliv. 2014, 30, 114–121. [Google Scholar] [CrossRef]
  2. Tang, Y.; Xu, X.; Chen, B.; Yi, T. Early warning method of transmission tower considering plastic fatigue damage under typhoon weather. IEEE Access 2019, 7, 63983–63991. [Google Scholar] [CrossRef]
  3. Moghe, R.; Iyer, A.R.; Lambert, F.C.; Divan, D.M. A low-cost wireless voltage sensor for monitoring MV/HV utility assets. IEEE Trans. Smart Grid 2014, 5, 2002–2009. [Google Scholar] [CrossRef]
  4. Gao, M.; Wang, P.; Wang, Y.; Yao, L. Self-powered ZigBee wireless sensor nodes for railway condition monitoring. IEEE Trans. Intell. Transp. Syst. 2017, 19, 900–909. [Google Scholar] [CrossRef]
  5. Lee, H.C.; Ke, K.H. Monitoring of large-area IoT sensors using a LoRa wireless mesh network system: Design and evaluation. IEEE Trans. Instrum. Meas. 2018, 67, 2177–2187. [Google Scholar] [CrossRef]
  6. Shi, L.; He, Y.; Li, B.; Cheng, T.; Huang, Y.; Sui, Y. Transmission tower tilt angle on-line prognosis by using solar-powered LoRa sensor node and sliding XGBoost predictor. IEEE Access 2019, 7, 86168–86176. [Google Scholar] [CrossRef]
  7. Oh, S.M.; Shin, J. An efficient small data transmission scheme in the 3GPP NB-IoT system. IEEE Commun. Lett. 2016, 21, 660–663. [Google Scholar] [CrossRef]
  8. Chen, X.; Li, Z.; Chen, Y.; Wang, X. Performance analysis and uplink scheduling for QoS-aware NB-IoT networks in mobile computing. IEEE Access 2019, 7, 44404–44415. [Google Scholar] [CrossRef]
  9. Deng, F.; Zuo, P.; Wen, K.; Wu, X.; He, Y. Low delay technology research of transmission line tower monitoring network integrating WSN and RFID. IEEE Access 2019, 7, 111065–111073. [Google Scholar] [CrossRef]
  10. Deng, F.; He, Y.; Li, B.; Song, Y.; Wu, X. Design of a slotted chipless RFID humidity Sensor tag. Sens. Actuators B Chem. 2018, 264, 255–262. [Google Scholar] [CrossRef]
  11. Feng, Y.; Xie, L.; Chen, Q.; Zheng, L.-R. Low-cost printed chipless RFID humidity sensor tag for intelligent packaging. IEEE Sens. J. 2015, 15, 3201–3208. [Google Scholar] [CrossRef]
  12. De Donno, D.; Catarinucci, L.; Tarricone, L. RAMSES: RFID augmented module for smart environmental sensing. IEEE Trans. Instrum. Meas. 2014, 63, 1701–1708. [Google Scholar] [CrossRef]
  13. Deng, F.; Zuo, P.; Wen, K.; Wu, X. Novel soil environment monitoring system based on RFID sensor and LoRa. Comput. Electron. Agric. 2020, 169, 105169. [Google Scholar] [CrossRef]
  14. De Donno, D.; Catarinucci, L.; Tarricone, L. A battery-assisted sensor-enhanced RFID tag enabling heterogeneous wireless sensor networks. IEEE Sens. J. 2014, 14, 1048–1055. [Google Scholar] [CrossRef]
  15. Duong, V.-H.; Hieu, N.X.; Lee, H.-S.; Lee, J.-W. A battery-assisted passive EPC Gen-2 RFID sensor tag IC with efficient battery power management and RF energy harvesting. IEEE Trans. Ind. Electron. 2016, 63, 7112–7123. [Google Scholar] [CrossRef]
  16. Wang, T.; He, Y.; Shi, T.; Tong, J.; Li, B. Transformer health management based on self-powered RFID sensor and multiple kernel RVM. IEEE Trans. Instrum. Meas. 2018, 68, 818–828. [Google Scholar] [CrossRef]
  17. Niyato, D.; Hossain, E.; Fallahi, A. Sleep and wakeup strategies in solar-powered wireless sensor/mesh networks: Performance analysis and optimization. IEEE Trans. Mobile Comput. 2006, 6, 221–236. [Google Scholar] [CrossRef]
  18. Li, W.; Monti, A.; Ponci, F. Fault detection and classification in medium voltage DC shipboard power systems with wavelets and artificial neural networks. IEEE Trans. Instrum. Meas. 2014, 63, 2651–2665. [Google Scholar] [CrossRef]
  19. Bouthiba, T. Fault detection and classification technique in EHV transmission lines based on artificial neural networks. Eur. Trans. Electr. Power 2005, 15, 443–454. [Google Scholar] [CrossRef]
  20. Khosravi, A.; Nahavandi, S.; Creighton, D.; Atiya, A.F. Comprehensive review of neural network-based prediction intervals and new advances. IEEE Trans. Neural Netw. 2011, 22, 1341–1356. [Google Scholar] [CrossRef]
  21. Krizhevsky, A.; Sutskever, I.; Hinton, G.E. Imagenet classification with deep convolutional neural networks. In Proceedings of the Neural Information Processing Systems 2012, Lake Tahoe, NV, USA, 3–6 December 2012; pp. 1097–1105. [Google Scholar]
  22. Casella, I.R.S.; Pereira, A.L. A bioinspired propagation model for Brazilian digital TV system based on MLP and RBF networks. IEEE Lat. Am. Trans. 2016, 14, 3941–3948. [Google Scholar] [CrossRef]
  23. Tipping, M.E. Sparse Bayesian learning and the relevance vector machine. J. Mach. Learn. Res. 2001, 1, 211–244. [Google Scholar]
  24. Hu, J.; Luo, Y.; Zhang, Q.; Liu, X.; Qu, X. Micro-motion feature extraction of space targets based on sinusoidal frequency modulation Fourier transform. J. Eng. 2019, 2019, 8076–8079. [Google Scholar] [CrossRef]
  25. Guo, X.; Huang, X.; Zhang, L. Three-dimensional wavelet texture feature extraction and classification for multi/hyperspectral imagery. IEEE Geosci. Remote Sens. Lett. 2014, 11, 2183–2187. [Google Scholar]
  26. Iwata, K. Extending the peak bandwidth of parameters for softmax selection in reinforcement learning. IEEE Trans. Neural Netw. Learn. Syst. 2016, 28, 1865–1877. [Google Scholar] [CrossRef] [PubMed]
  27. Cheong, J.Y.; Park, I.K. Deep CNN-based super-resolution using external and internal examples. IEEE Signal Process. Lett. 2017, 24, 1252–1256. [Google Scholar] [CrossRef]
  28. Li, Y.; Song, Y.; Li, C. Selection of parameters for phase space reconstruction of chaotic time series. In Proceedings of the 2010 IEEE Fifth International Conference on Bio-Inspired Computing: Theories and Applications (BIC-TA), IEEE, Changsha, China, 23–26 September 2010; pp. 30–33. [Google Scholar]
  29. Zhang, D.; Wang, X.; Song, X.; Zhao, D. A novel approach to mapped correlation of ID for RFID anti-collision. IEEE Trans. Serv. Comput. 2014, 7, 741–748. [Google Scholar] [CrossRef]
  30. Ma, Q.; Zhou, F. The differential approximation method to determine a scale parameter interval for a multi-scale Gaussian kernel RVM regression. In Proceedings of the 2013 International Conference on Mechatronic Sciences, Electric Engineering and Computer (MEC), Shenyang, China, 20–22 December 2013. [Google Scholar]
Figure 1. Architecture of the solar-powered radio frequency identification (RFID) sensor tag.
Electronics 09 00519 g001
Figure 2. Proposed energy management scheme.
Electronics 09 00519 g002
Figure 3. Proposed schematic of the power management module.
Electronics 09 00519 g003
Figure 4. Identification flow of the tower vibration signal.
Electronics 09 00519 g004
Figure 5. The basic structure of the convolution neural network (CNN).
Electronics 09 00519 g005
Figure 6. Photo of the proposed solar-powered RFID sensor tag.
Electronics 09 00519 g006
Figure 7. Communication test in the lab: (a) test environment; (b) measured communication flow.
Electronics 09 00519 g007
Figure 8. Measured reflection coefficient and sensitivity.
Electronics 09 00519 g008
Figure 9. Tower vibration signal acquisition site.
Electronics 09 00519 g009
Figure 10. The relationship between iterations and classification accuracy.
Electronics 09 00519 g010
Figure 11. Relation curve between classification correctness and number of convolution kernels.
Electronics 09 00519 g011
Figure 12. Relation curve between classification correctness and number of convolution kernels.
Electronics 09 00519 g012
Table 1. Components list of the proposed RFID sensor.
ComponentsType
MCUMSP430FR6964
RIFD ChipMonza X-8K
Acceleration SensorADXL372
DC-DC Charge PumpLTC3225
LDOTPS780
Photovoltaic Cell8 × 8 cm2
Communication AntennaMicrostrip, 915MHz
Table 2. Discharge time of the super capacitor at different queries frequency.
Query Frequency (/min)Initial Voltage (V)Final Voltage (V)Initial TimeFinal Time
205.313.213:05
(1st day)
16:25
(2nd day)
105.283.1914:35
(1st day)
13:05
(2nd day)
55.323.2208:10
(1st day)
23:31
(2nd day)
Table 3. Comparison between various designs of RFID sensors.
DesignPower SupplyMaximum Distance/Reader Power (m/W)
[12]RFID reader10/2
[13]RFID reader9.8/2
[14]Battery22/3.2
[15]Battery17.4/2
[16]Vibration energy18.2/3.2
This workSolar energy21/3.2
Table 4. Server configuration.
ComponentsParameter
Operating SystemUbuntu16.04
Memory8G
CPUIntel Core i7-8700
GPUNVIDIA GTX1070ti
RAM8G
Table 5. Sample data set.
Vibration TypeWind Speed (m/s)Sample Size (group)
Simulated external breaking (Iron bar)0.31000
Simulated external breaking (Rubber bar)0.11000
Simulated external breaking (Stick)0.51000
Wind excitation under no ice-covered condition1.81000
Wind excitation under no ice-covered condition7.91000
Wind excitation under no ice-covered condition11.21000
Wind excitation under ice-covered condition3.91000
Wind excitation under ice-covered condition10.51000
Wind excitation under ice-covered condition12.71000
Table 6. CNN model parameters.
Network LayerParameter NameParameter QuantityStepOutput
Input///1 × 1024
Conv-1Convolution kernel32@1 × 321 × 132@1 × 1024
Pooling-1Pooling area1 × 21 × 232@1 × 512
Conv-2Convolution kernel64@1 × 161 × 164@1 × 512
Pooling-2Pooling area1 × 21 × 264@1 × 256
Conv-3Convolution kernel64@1 × 81 × 164@1 × 256
Pooling-3Pooling area1 × 21 × 264@1 × 128
Fully connected-1Linking weight1024 × 500/500
Fully connected-2Linking weight500 × 10/10
Table 7. Test results of CNN-relevance vector machine (RVM) model.
Vibration TypeAccuracy
Simulated vibration99.27%
No ice wind excitation99.67%
Ice wind excitation99.33%
Table 8. Performances comparison between various identification algorithms.
Vibration TypeSimulated VibrationNo ice Wind ExcitationIce Wind Excitation
FFT-BP69.66%60.33%68.43%
FFT-SVM82.15%85.62%81.88%
FFT-RVM84.26%88.33%85.22%
CNN-SVM95.11%97.72%93.44%
CNN-RVM99.27%99.67%99.33%

