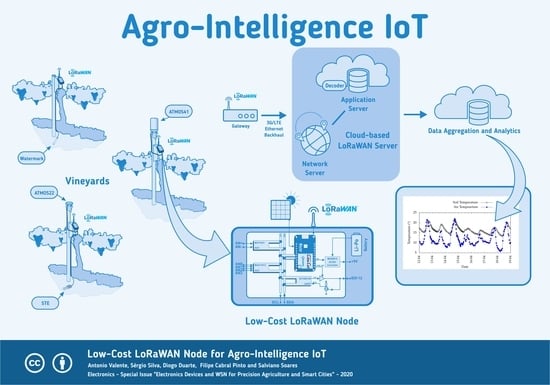
Low-Cost LoRaWAN Node for Agro-Intelligence IoT
by
 , , , and
Antonio Valente
1,2,* ,
,
Sérgio Silva
1,3 ,
,
Diogo Duarte
1,4,
Filipe Cabral Pinto
5 and
Salviano Soares
1,4 1
Engineering Department, School of Science and Technology, Quinta de Prados, University of Trás-os-Montes and Alto Douro, 5000-911 Vila Real, Portugal
2
INESC TEC—INESC Technology and Science, 4200-465 Porto, Portugal
3
Globaltronic, Parque Empresarial do Casarão, 3750-860 Borralha, Portugal
4
IEETA—Institute of Electronics and Informatics Engineering of Aveiro, Campus Universitário de Santiago, 3810-193 Aveiro, Portugal
5
Altice Labs, 3810-106 Aveiro, Portugal
*
Author to whom correspondence should be addressed.
Electronics 2020, 9(6), 987; https://0-doi-org.brum.beds.ac.uk/10.3390/electronics9060987
Submission received: 30 April 2020
/
Revised: 2 June 2020
/
Accepted: 4 June 2020
/
Published: 12 June 2020
(This article belongs to the Special Issue Electronics Devices and WSN for Precision Agriculture and Smart Cities)
Abstract
:Intelligent agriculture in general, but especially when agricultural fields are very heterogeneous, requires a large number of sensors in order to obtain an effective control and thus increase productivity. This need becomes more evident in vineyards on the farms of the demarcated Douro region due to the specificities of the territory and the vineyards themselves. Thus, it is necessary to have low cost sensors which are, essentially, easy to install and maintain. In the present work, a node with these characteristics was developed, which, in addition, is low consumption and communicates wirelessly through a Long Rang Wide Area Network (LoRaWAN) network. To obtain an easy installation, a library of clusters was created for the LoRaWAN network and dedicated to sensors used in agriculture, especially those using an asynchronous serial protocol for intelligent sensors. Three nodes were developed and tested with sensors used in agriculture to measure several environmental parameters (soil and air temperature; wind speed, gust and direction; soil water content, water tension and electrical conductivity; solar radiation; precipitation; atmospheric and vapor pressure; relative humidity; and lightning strikes count). The three nodes send data to a server through an existing gateway on the farm. The data are decoded and sent to an Internet-of-Things analytics platform where it is aggregated, viewed and analyzed. Samples of the data collected are presented. The developed nodes are of small dimensions (), thus making them easy to handle and install. Energy consumption depends on the distance to the gateway, and the number and type of sensors connected to each node. In the implemented cases, the maximum consumption was ≈. The development of a cluster based library makes the node plug-and-play. The developed nodes will be a great step forward for the use of wireless sensors in smart agriculture in Douro vineyards.
1. Introduction
Due to the recent advances in the Internet of Things (IoT), especially in the open field, precision agriculture can improve its management and, thus, its productivity. These recent advances include the proliferation of Low-Power Wide-Area Networks (LPWAN) where the Long Rang Wide Area Network (LoRaWAN) has stood out [1]. LoRaWAN technology is currently one of the most promising specifications of Low-Power Wide-Area Networks (LPWAN) for battery powered wireless nodes. The LoRaWAN protocol, which uses a staggered topology, is based on its physical layer the LoRa which is based on the chirp spread spectrum modulation, used mainly in military and radar systems, in order to allow long range and great noise immunity. This network is relatively easy to implement, has a ready-to-use security layer and a guarantee of wide coverage with minimal maintenance and low energy consumption, which is ideal for large-scale use [2,3]. All of this makes LoRaWAN a good option for the IoT, in particular where there is no cellular coverage, such as Narrowband Internet of Things (NB-IoT) or Long Term Evolution for Machine (LTE-M), and especially in agriculture, where the fields normally span a large area, allowing a wide distribution of the sensors [4,5,6].
These assumptions lead to the ideal use of the IoT concept—a single sensor node. This concept can be used in all IoT systems, from buildings, factories and even in smart cities. The nodes, in this case, have few sensors (e.g., temperature, humidity, atmospheric pressure) and/or these read rarely more than two parameters (e.g., humidity and temperature—the exceptional case is that of the BME680 from Bosch [7] which, in addition to humidity and temperature, also reads the atmospheric pressure and Volatile Organic Compounds). However, in the case of agriculture there is a need to measure a greater number of parameters. There is a need to monitor the environment (e.g., air temperature, humidity, wind speed and direction, light, rainfall, among many others), the soil (e.g., soil moisture, salinity, soil temperature, to name a few) and the plant (e.g., flow sap, water potential, leaf temperature, leaf moisture, plant or fruit size, among others). Although there are still many analog sensors that measure one or two parameters, a wide range of sensors used in agriculture are digital. This group includes those who use the Serial-Digital Interface at 1200 baud (SDI-12) protocol [8], which is a protocol used by the main suppliers of sensors for agriculture (e.g., Decagon, now part of the Meter Group, and Apogee). SDI-12 is a half-duplex, master-slave serial protocol with only three wires (two for power and one for serial communication), making it possible to have several ‘smart’ sensors on a common data line. The low data rate of the protocol is not a disadvantage for agriculture where processes are slow, however, if a sensor fails or is damaged, this SDI-12 line may be compromised. For this reason, analog sensors and digital sensors (SDI-12, I2C and digital pulses) must coexist in a single node.
There are already some companies developing LoRaWAN nodes with some of these characteristics, such as DecentLab [9], Seeed Studio [10], AMIT Wireless [11], AgroSense [12], ICT International [13], TekBox [14] and Vinduino [15]. The latter is not really a commercial product, but the commercialization of an open hardware solution. Of the solutions presented, only DecentLab, TekBox and ICT International have nodes with SDI-12. AMIT Wireless is equipped with RS-485 and the user can take advantage of its Arduino IDE development interface in order to easily develop code for the SDI-12. The same applies to the Vinduino node as it is also Arduino compatible. In the case of DecentLab and Seeed Studio (no information about the use of SDI-12), the solutions are already packaged, i.e., a node is already dedicated to a certain sensor (e.g., 5TE soil sensor from Meter Group) which removes the possibility of changing the existing sensor at that node. ICT International and TekBox separates the node from the sensors to be used, but require an initial configuration of the device. Therefore, in this work we resolve these shortcomings.
In particular, we make the following contributions:
- Easy to use low-cost LoRaWAN node with SDI-12 digital port for SDI-12 sensors.
- Development of a cluster library for LoRaWAN in agriculture (like Zigbee Cluster Library [16] but with clusters for Agriculture).
The rest of this paper is organized as follows. Section 2 describes all the related works and commercial devices. The system architecture is described in Section 3 and the developed node in Section 4. Results are presented and discussed in Section 5 and the conclusions and future work are address in Section 6.
2. Related Work
Agriculture deals with several factors and their interconnection that condition productivity: environment, soil and plant. Precision agriculture, or Smart Farming, that is composed of a set of technologies that combines sensors (not only for the environment, but also for the soil and the plant) [17], information systems, improved machinery (including robots [18]) and informed management to optimize production, accounting for the variability and uncertainties in agricultural systems [19].
In this way, a Smart Farming system requires sensors (or sensor systems) not only for the environment, but also for the soil and the plant. In these sensor systems we can include machine vision for fruit-picking robotics applications [20], find seedling points [21] and with the the appearance of multi-spectral cameras for estimating rice growing [22]. Additionally in sensors, the paradigm changed. The use of wired sensors connected to a data-logger, with a reduced number of sensors and around the data-logger, was switched to wireless sensors where the number and dispersion could be more elevated. This new concept has evolved with the emergence of better solutions for wireless communications. Navulur et al. [23] developed a solar powered remote management and automation system for agricultural activities through wireless sensors and IoT, comprising a hardware platform based on a Raspberry Pi, configured to connect with a user device and accessed through the internet network. The system uses Wi-Fi as the wireless network and digital sensors connected through I2C or SPI (mostly soil related parameters). The same direction was followed by Hartung et al. [24] in the use, in a first phase, of a mesh network using Wi-Fi and LTE for a potato field. In a second phase, an IEEE 802.15.4 network was added to the mesh network. Protocols based on IEEE 802.15.4 (e.g., 802.14.4 itself, ZigBee, WirelessHART, MiWi, DigiMesh, among others) have been widely used in wireless sensor networks for agriculture and are most suitable for short-range applications [25,26,27,28]. Riquelme et al. [29] uses one of this mesh networks using for types of nodes (Soil, Environmental, Water and Gateway Node) on a crop of ecological cabbage and Morais et al. [30] developed a node called MPWiNodeZ to be used in precision viticulture.
When coverage is a concern, there is a need for long-range technologies. Among the long-distance technologies for agricultural use IoT, it is worth mentioning two of the most emerging ones which are IEEE 802.11ah and LoRa/LoRaWAN. The IEEE 802.11ah protocol, (or WiFi-HaLow), published in 2017, which is a new version of WiFi technology in the sub-gigahertz band, has not had much application in agriculture [31]. LoRaWAN technology has already demonstrated, in the most important mobile trade fair in the world (Mobile World Congress), its application in smart agriculture through proofs of concept and demonstrators [32]. As examples of using LoRaWAN we have Davcev et al. [33] that developed a system and installed a prototype of that system on a vineyard field to collect air temperature and humidity, as well as leaf wetness and soil moisture readings. Details of the sensors are not given but mostly environment parameters are measured. Tresca et al. [34] developed a LoRa-complaint solution for environmental monitoring in a urban scenario, but can be applied to agriculture (also mostly environment parameters). In addition, NB-IoT or LTE-M may be a possibility to guarantee communications. However, it requires the existence of cellular coverage, making it difficult in certain scenarios to implement solutions in remote locations.
There are also LPWAN with their own protocols such as the case of Ibayashi et al. [35] that proposed a wireless control system for hydroponic tomato cultivation using the 400 MHz wireless band and the IEEE 802.15.6 standard. The system is not LoRaWAN based and uses analog channels and I2C sensors. An extensive survey on Smart Farming with some focus on IoT is performed by Bacco et al. [32].
The latest advances also allow the use of cameras with machine learning (ML) algorithms on the sensor itself, allowing the detection of pests [36], and wireless sensors with innovative energy harvesting systems such as Kostantopoulos et al. [37] using the battery plant and Sartori and Brunelli [38] using a microbial fuel cell.
Generally, academic papers that focus specifically on outdoor, LoRaWAN-enabled agri-tech applications are mostly proof-of-concept small-scale testbeds for future research, or investigations on the feasibility and performance of the protocol for different use cases [4]. As already mentioned, a Smart Agriculture system requires sensors for the environment, the soil and plants. The vast majority of cases are based on the use of sensors for the environment and, in rare cases, for the soil (soil temperature and humidity). There are also rare cases where sensors with the SDI-12 protocol are used. The work developed by Silva et al. [5] is one of those rare cases. SDI-12 protocol is based on a two-way communication making it a widely used protocol in smart sensors for agriculture. Most digital sensors for agriculture have a version with the SDI-12 protocol. In this way, the development of a wireless node for the use of sensors in smart agriculture will have to have, almost obligatorily, at least one port with an SDI-12 interface and enable the use of environmental sensors, sensors for the soil and sensors for plants.
At the commercial level, several systems based on LoRaWAN are already available. However, there are still few that allow the use of sensors with the SDI-12 protocol. Some systems like Vinduino [15], are open-hardware based on Arduino and can be configured to use SDI-12 sensors. Another similar solution with the data-logger concept is that of AMIT Wireless [11]. It does not have an SDI-12 interface, but it has an RS-485 port and is also based on Arduino, being expected to be possible to connect to SDI-12 sensors.
Seeed Studio [10] has developed a concept based on a ’capsule’, named SenseCap, where only one sensor should be connected (it will be able to read more than one variable—e.g., temperature and humidity). SenseCap can connected to SDI-12 sensors like the 5TE soil moisture sensor. Decentlab [9] has developed an identical concept and can also be connected to SDI-12 sensors.
Libelium presents two LoRaWAN solutions for agriculture: the Smart Agriculture PRO, only for the soil; and Smart Agriculture XTREME, which already includes soil, environment and plant. However, both solutions are limited in the use of the sensors. TekBox [14] and ICT International [13] already have different concepts. Both have three solutions that allow the connection of different types of sensors and adaptation to different Smart Agriculture projects. TekBox presents TB12B and TBSL1/RFB-LoRa with battery power and TBS12S with rechargeable battery and solar panel. The TBSL1/RFB-LoRa, in addition to sensors with SDI-12, also has inputs for analog and pulsed digital sensors. ICT International has also the AD-NODE for high resolution analog and digital sensors (rechargeable battery powered). The S-NODE only supports SDI-12 sensors and has an external power supply (it can be a solar panel—11W or 22W). The MFR-NODE is similar to the S-NODE, with the addition of two 32-bit dry-contact counting digital inputs, and four single ended, or two differentials analog channels (24-bit).
Table 1 summarizes these commercial solutions. In the table, the ‘Arduino Like’ parameter refers to all devices that can be programmed using the Arduino IDE platform and are, therefore, customizable. The ‘SDI-12’ parameter deals with devices that can communicate with SDI-12 sensors. The devices with ‘possible’ are devices that is possible to change the firmware to implement the SDI-12 protocol. The ones with ‘fixed’ means that the device can communicate only with fixed types of SDI-12 sensors (is not possible to change the sensor with another, e.g., change the 5TE sensor with ATMOS22). This is reflected also in the ‘Change Sensors’ parameter although here the scope is greater—when it is necessary to change the firmware to exchange sensors it is considered that there is no exchange of sensors. ‘Agriculture Use’ is self explained. The last parameter is a qualitative assessment of the authors’ responsibility for the overall ease of installation of the device (easy—☺☺☺, complicated—☺).
It is important to note that there is no optimum solution, the simplest ones to install have predetermined sensors, and those that are more flexible in using the sensors have a more complex installation process. Thus, there is a need for a system that is low cost, small in size (many agricultural sites are now also tourist sites—e.g., farms in the Douro Demarcated Region where Port Wine is produced) and, essentially, has minimal maintenance. This last requirement is substantiated with an energetically self-sufficient system and the possibility of being plug-and-play.
3. System Architecture
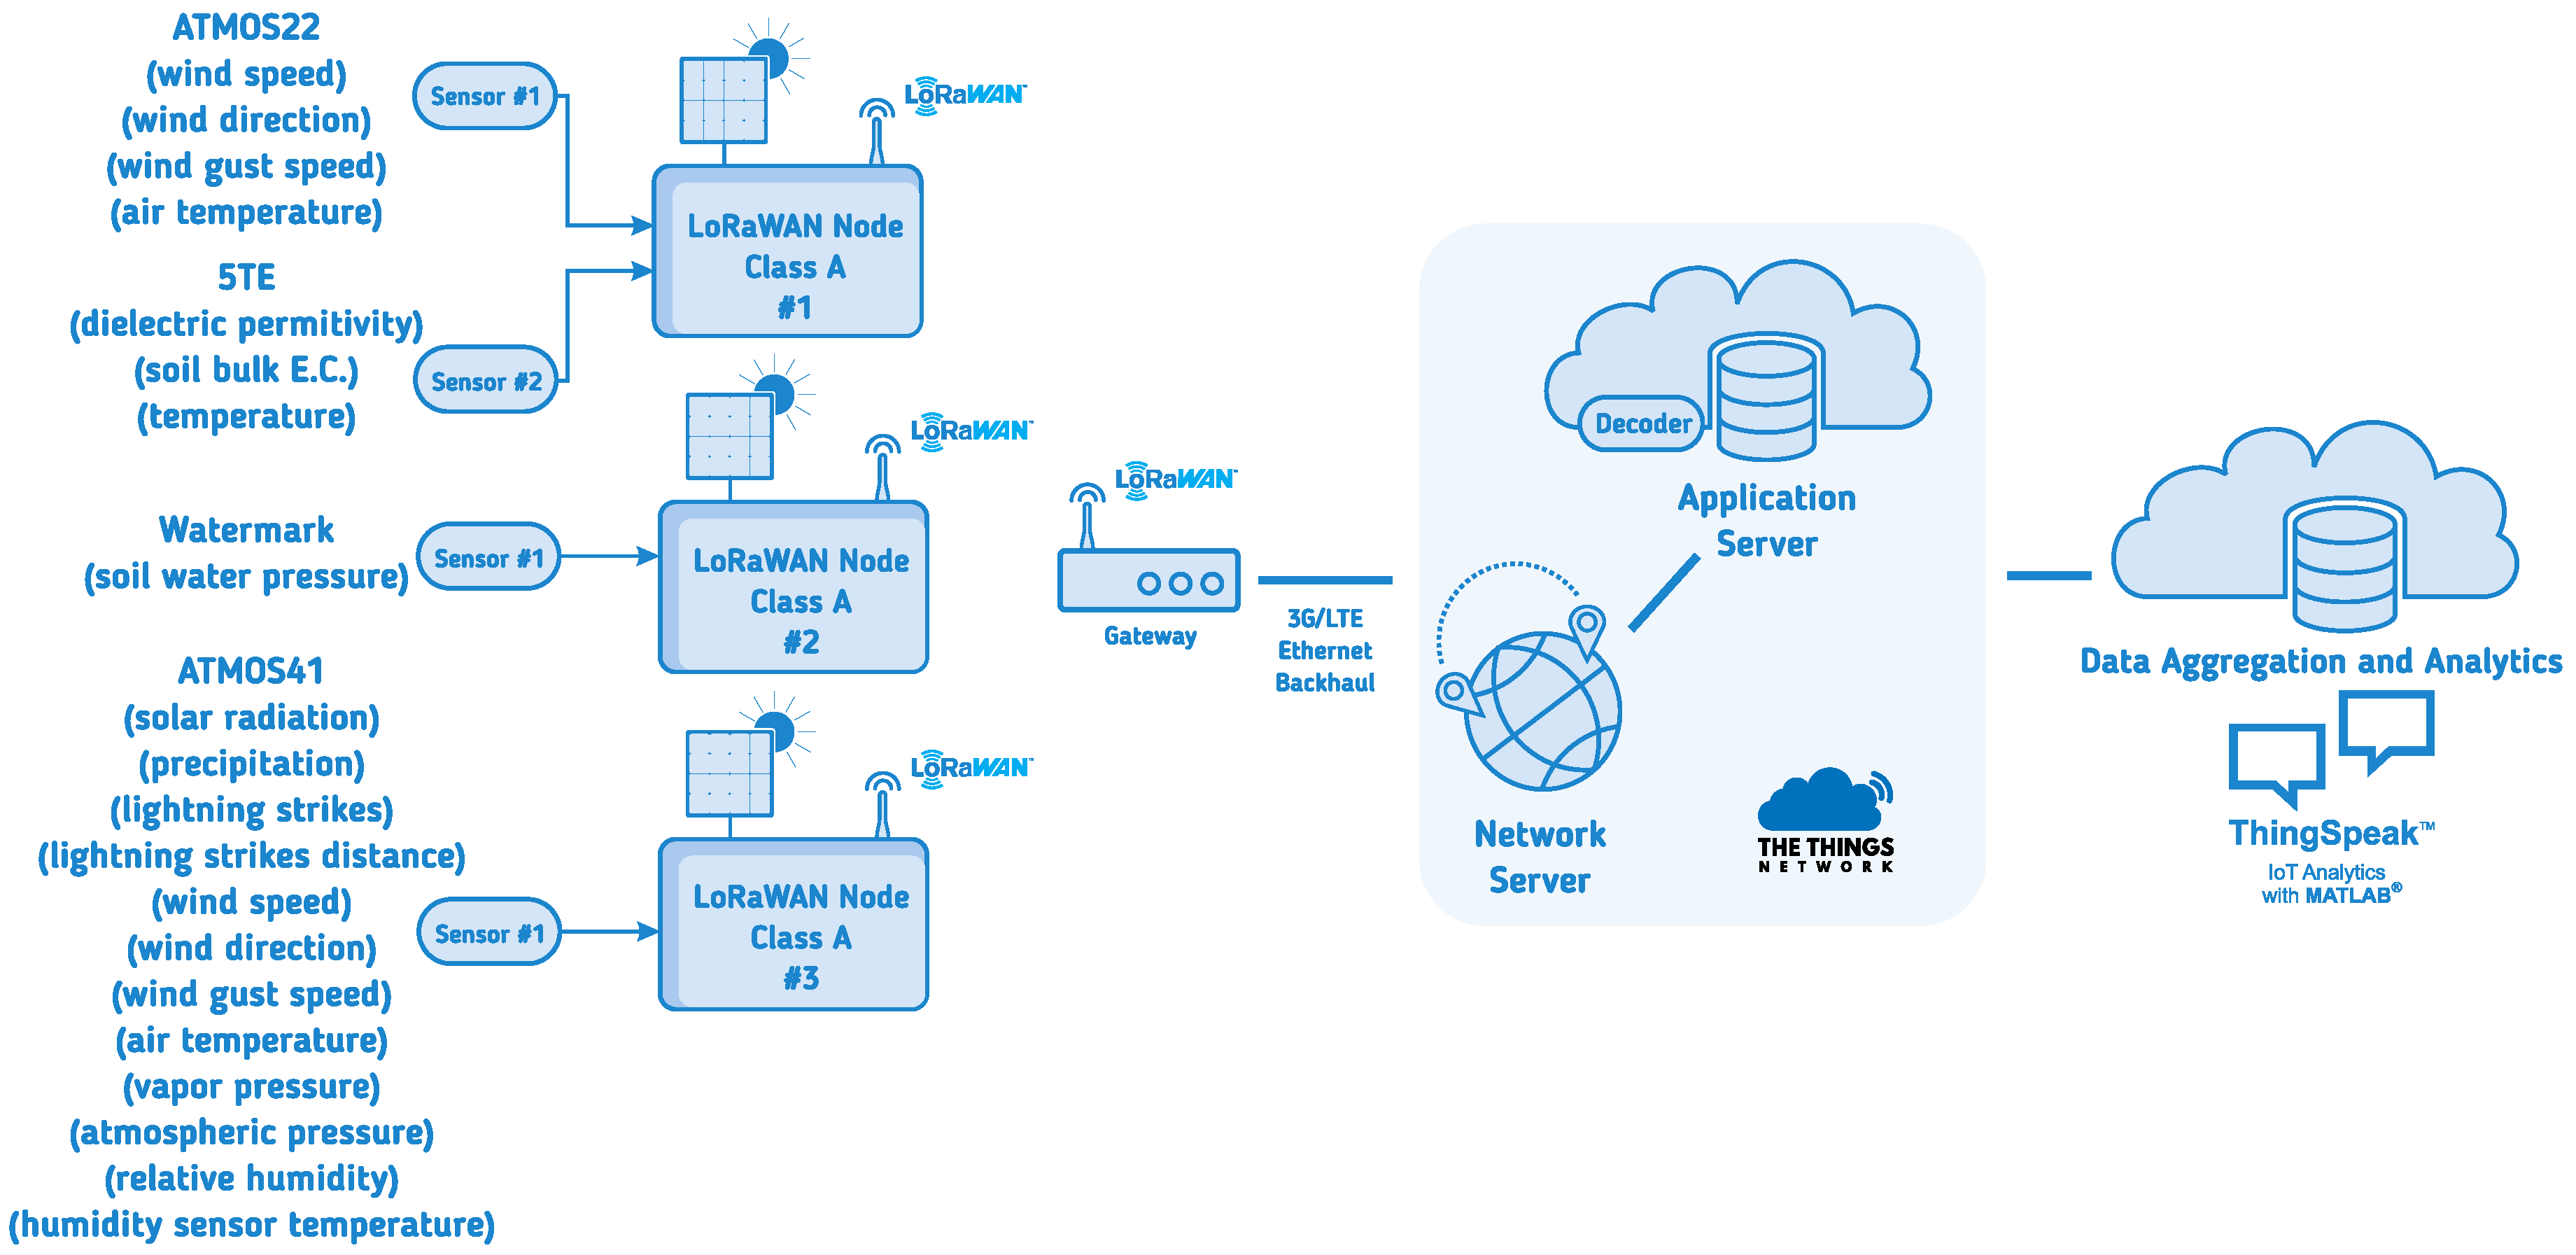
The developed nodes, described in the next section, are part of a wireless sensor network belonging to the agro-intelligence IoT system that was applied to a vineyard in the Douro Demarcated Region. A view of the entire system is shown in Figure 1. The implemented nodes (node #1, node #2 and node #3) have several sensors connected to them. The node #1 is connected to ATMOS22 (digital SDI-12 ultrasonic anemometer) and 5TE (digital SDI-12 soil sensor) sensors from Meter Group. Node #2 only is connected to a Watermark sensor, from Irrometer (change in resistance related to soil tension) and node #3 is connected to the ATMOS41, from Meter Group (a complete all-in-one digital weather station with SDI-12 output). All the nodes have a wireless link and will send the data over the network (LoRaWAN) to a gateway (Lorix One, from Wifx) that is connected over Ethernet (can also have Wi-Fi or LTE connections) to a server (The Things Network—TTN). In the TTN server a decoder is implemented that is related to the developed cluster library. After decoding the data are sent to a platform for visualization and possible analysis and aggregation (ThingSpeak). Currently, data are only being collected and some alarms are being used, via Twiter, through simple if-then-else functions. In the near future, data mining processes should be implemented as the system architecture will allow it.
4. Developed LoRaWAN Node
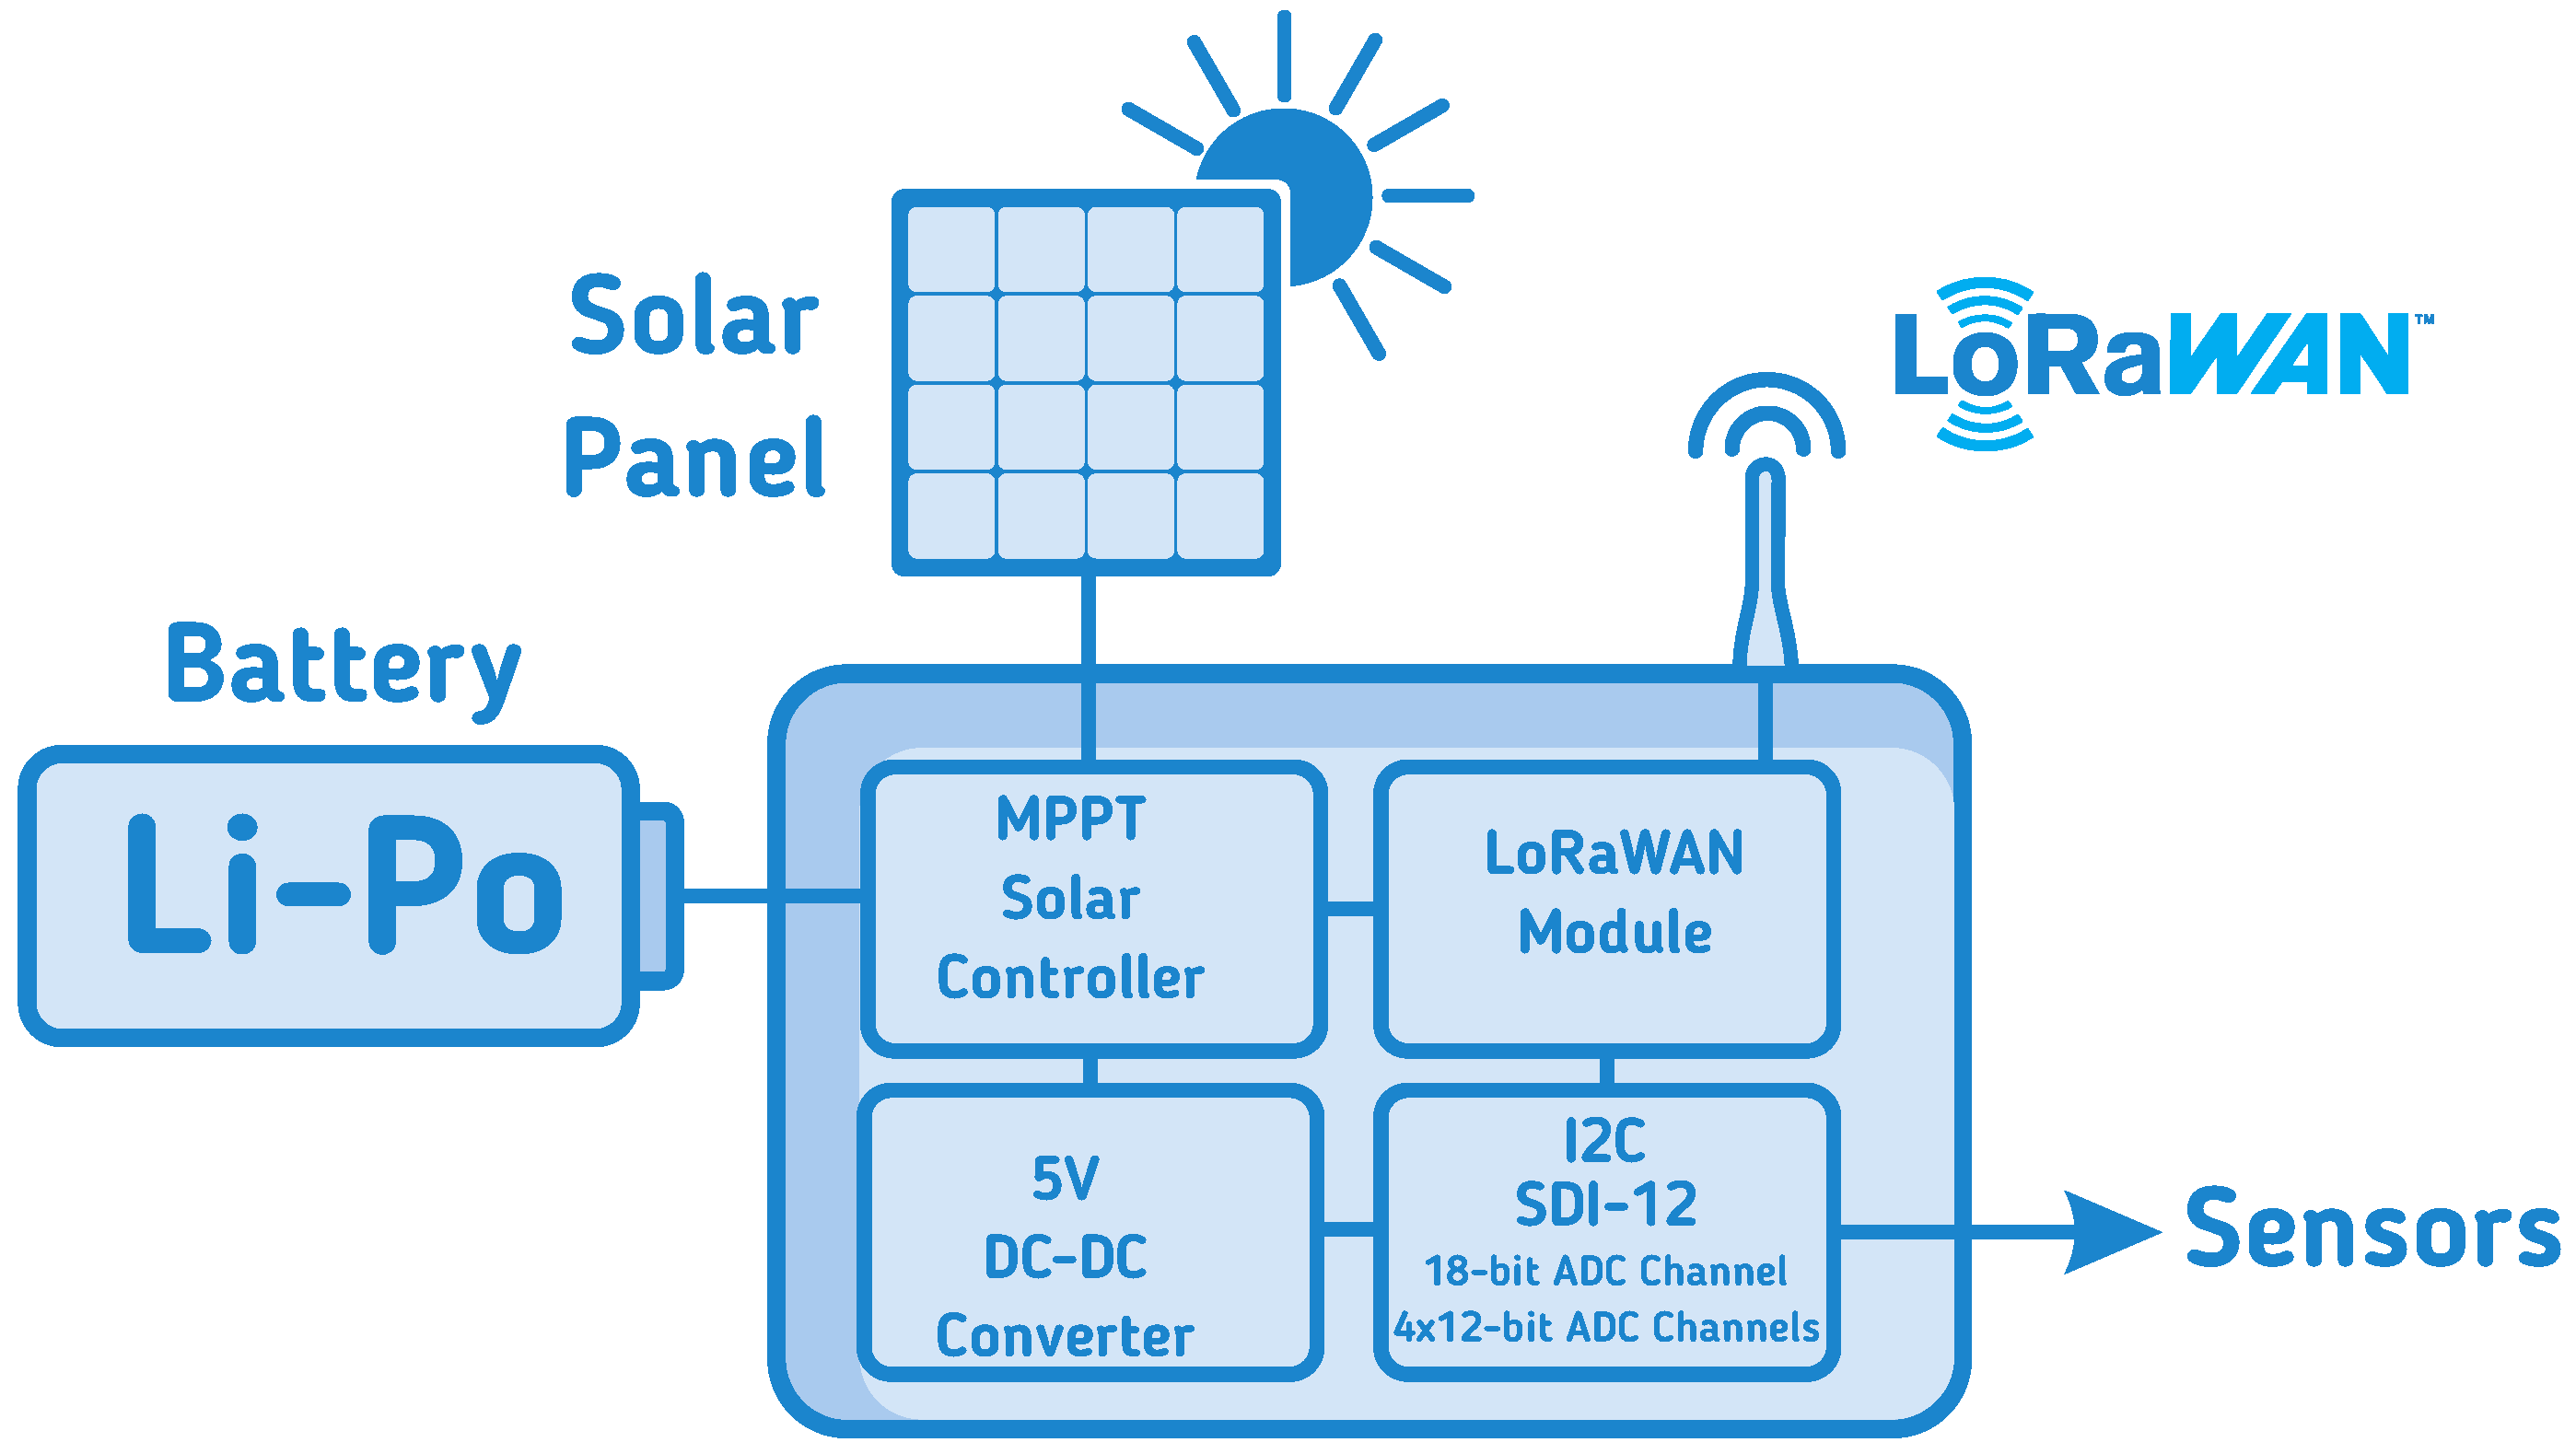
As we are in a new paradigm of Internet of Things, each ‘thing’ will have to have special characteristics such as: being of small dimensions, being self-sufficient in terms of energy, being of low cost (a considerable density of sensors will always be necessary) and, essentially, having only one sensor or set of sensors for a given measurement. In addition to these characteristics, the developed system must have standard sensors for agriculture, which normally have SDI-12 communication [8], and air temperature, humidity and atmospheric pressure sensors that, in most cases, communicate by I2C. In addition, it must have analog inputs (ADC) for, among others, connect Irrometer Watermak sensors [39]. Figure 2 presents a block diagram of the proposed system which follows the characteristics presented above.
For the main processor module there are two solutions: use of modules with a microcontroller and LoRaWAN module and then add the other modules of the proposed system; or develop our own system with all the parts. As there are many companies developing modules with the most diverse configurations at very low cost, these options become the most viable to satisfy the low cost and small dimensions. Among these modules, the RAK4260 from RAK Wireless, LoRa One [40] from Sodaq and CubeCell from Heltec are stand alone and self sufficient in terms of energy (they have a connection for LiPo battery and solar panel). Within these modules lies our choice, the CubCell, because in addition to having a solar charger, it is the lowest cost module among those evaluated.
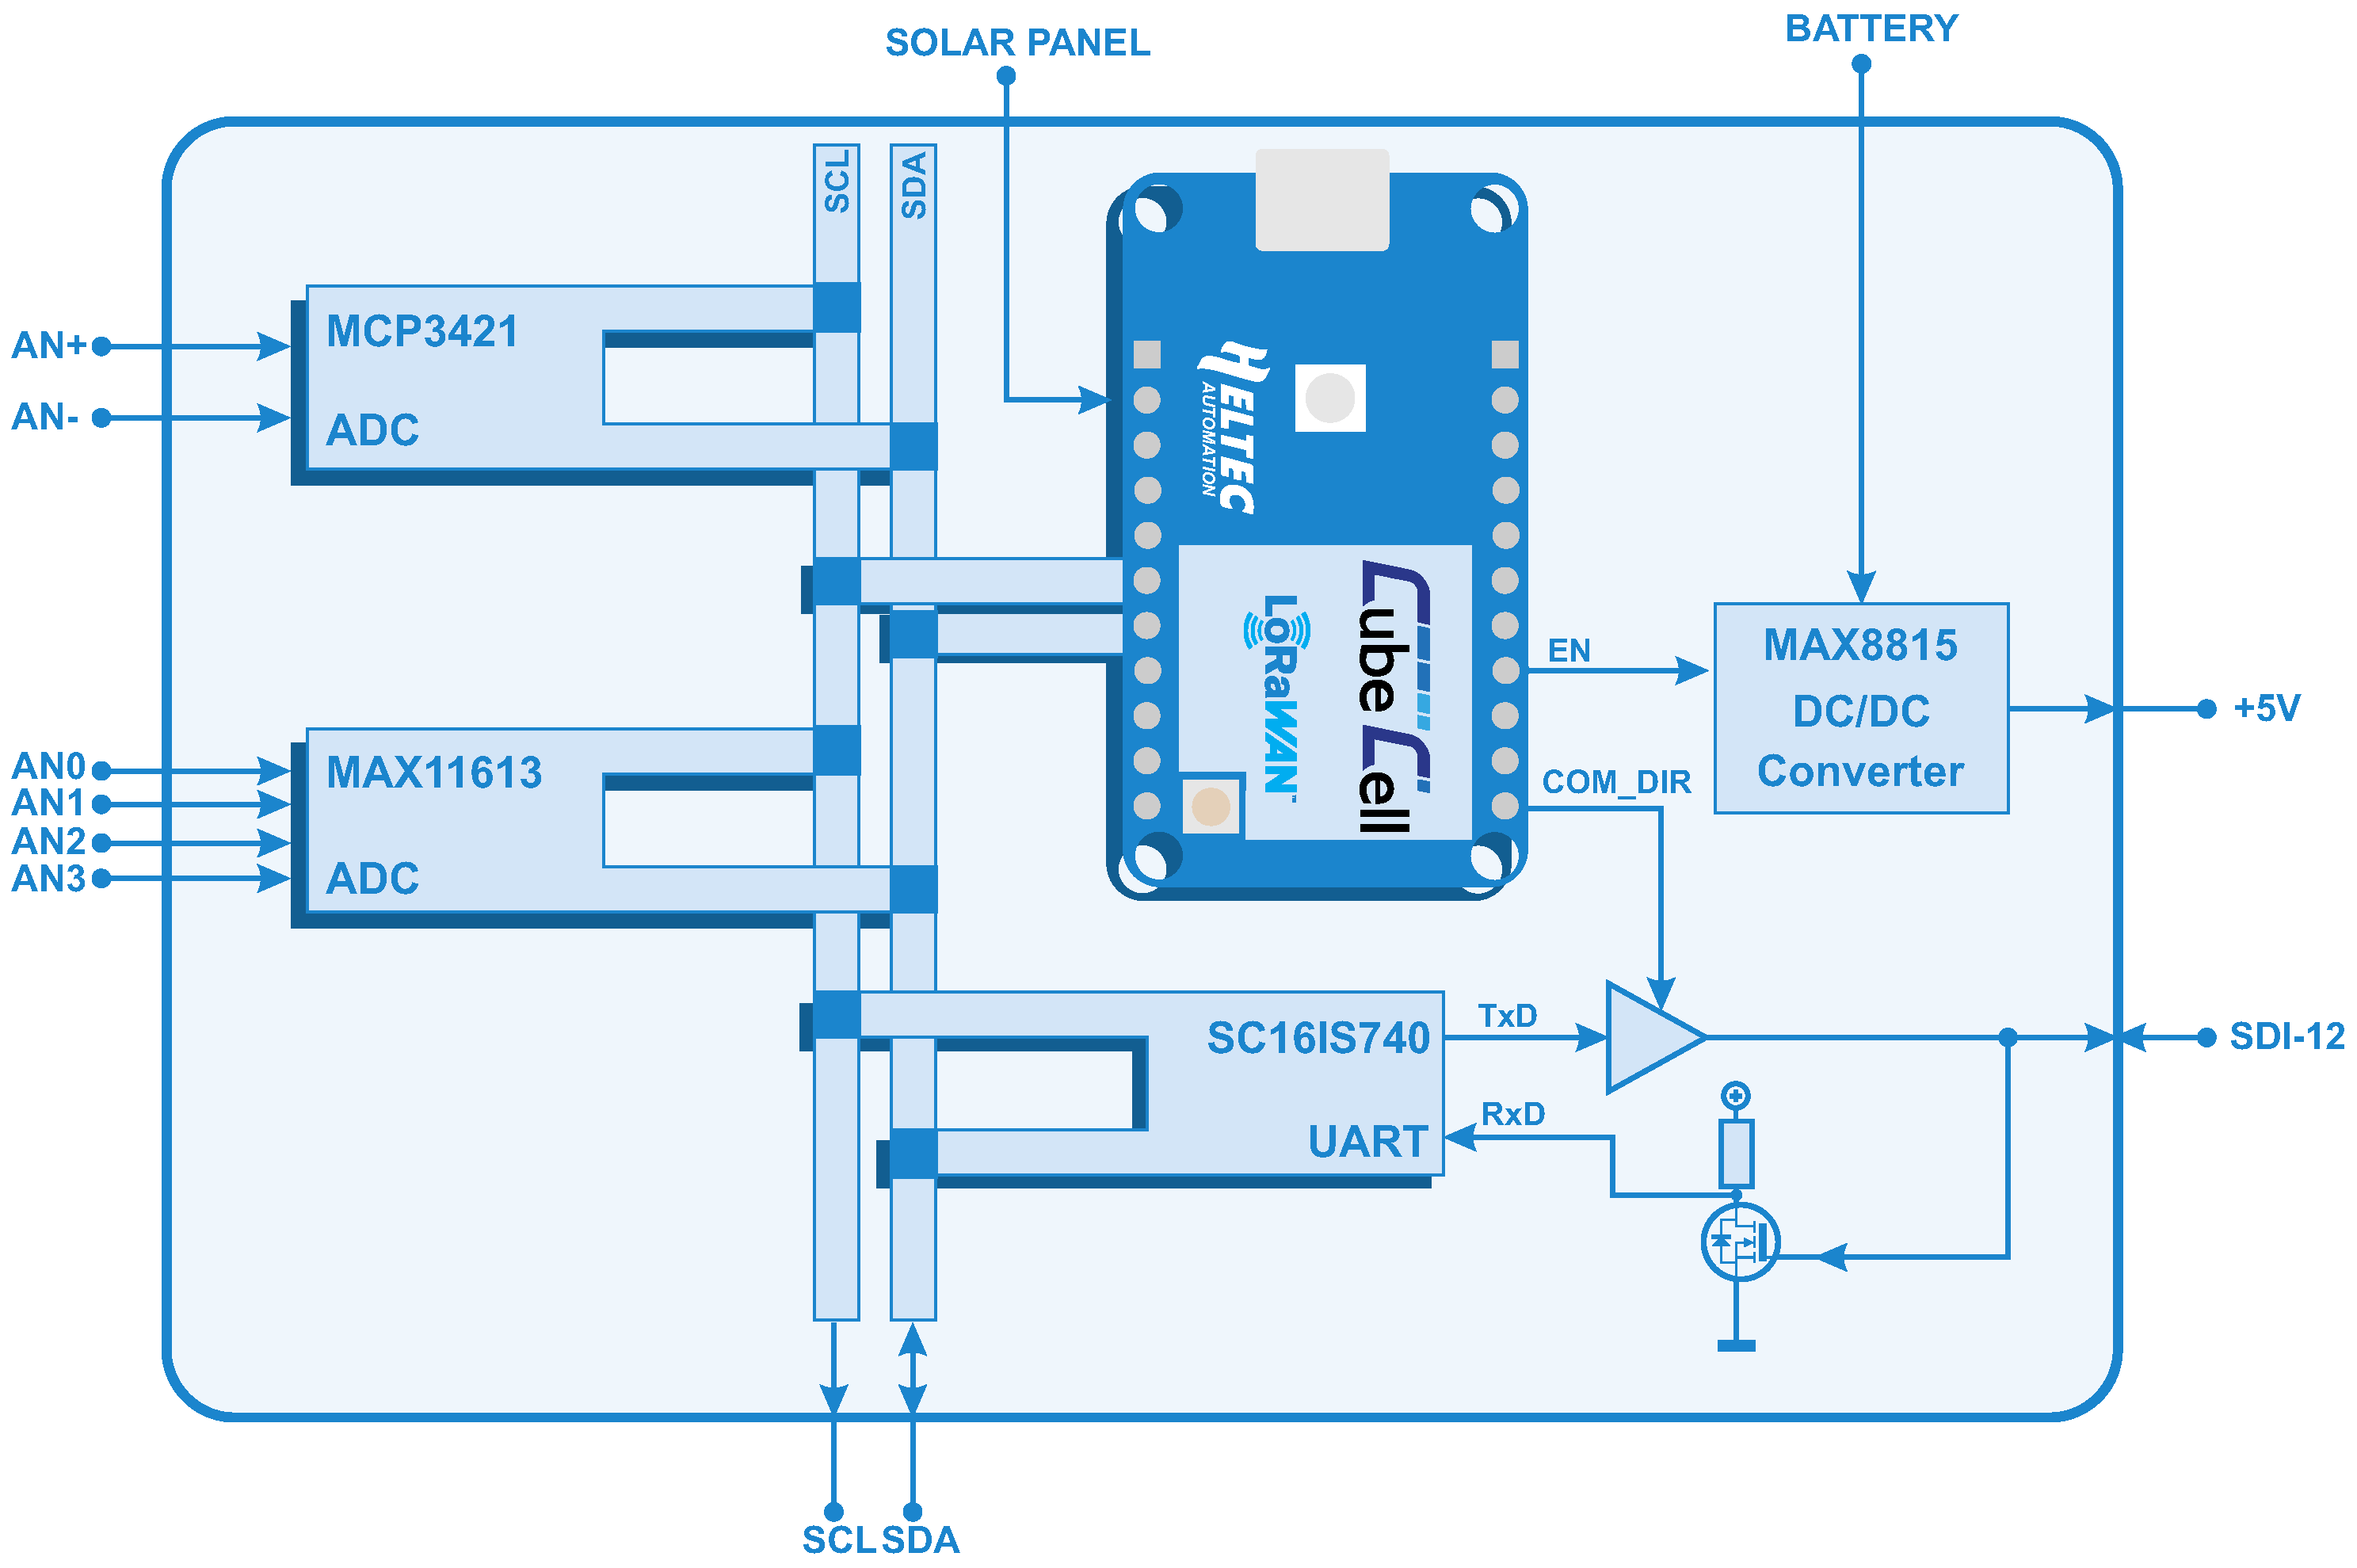
One of the disadvantages of the chosen module is that it only has an analog port (12-bit ADC). Thus, it was necessary to provide the system with more ADC channels. One possibility would be to add an analog multiplexer, but the option was to place external ADC modules with I2C communication. The choice fell on the single-channel 18-bit ADC, Microchip’s MCP3421, and the 12-bit, 4-channel ADC, MAX11613 from Maxim. The module has a UART but it is busy for debugging and programming the module itself. Thus, to implement the SDI-12 communication protocol, it was also necessary to add a UART module with I2C (SC16IS740 from NXP). Figure 3 shows a simplified schematic of the developed system. In order to make the developed system easy to install, it allows simultaneous connection of four sensors with SDI-12 (from a library of about thirty types of sensors) and ten with I2C. In addition, sensors with analog outputs (one high-resolution channel with 2.048 V reference and four 12-bit resolution with 2.048 V or 3.3 V reference) can also be connected to sensors with voltage outputs (<3.3 V), to thermistors, to PT100 and other variable resistance type sensors (e.g., Irrometer Watermark). However, for these the system will no longer be plug-and-play, but a simple configuration will be necessary.
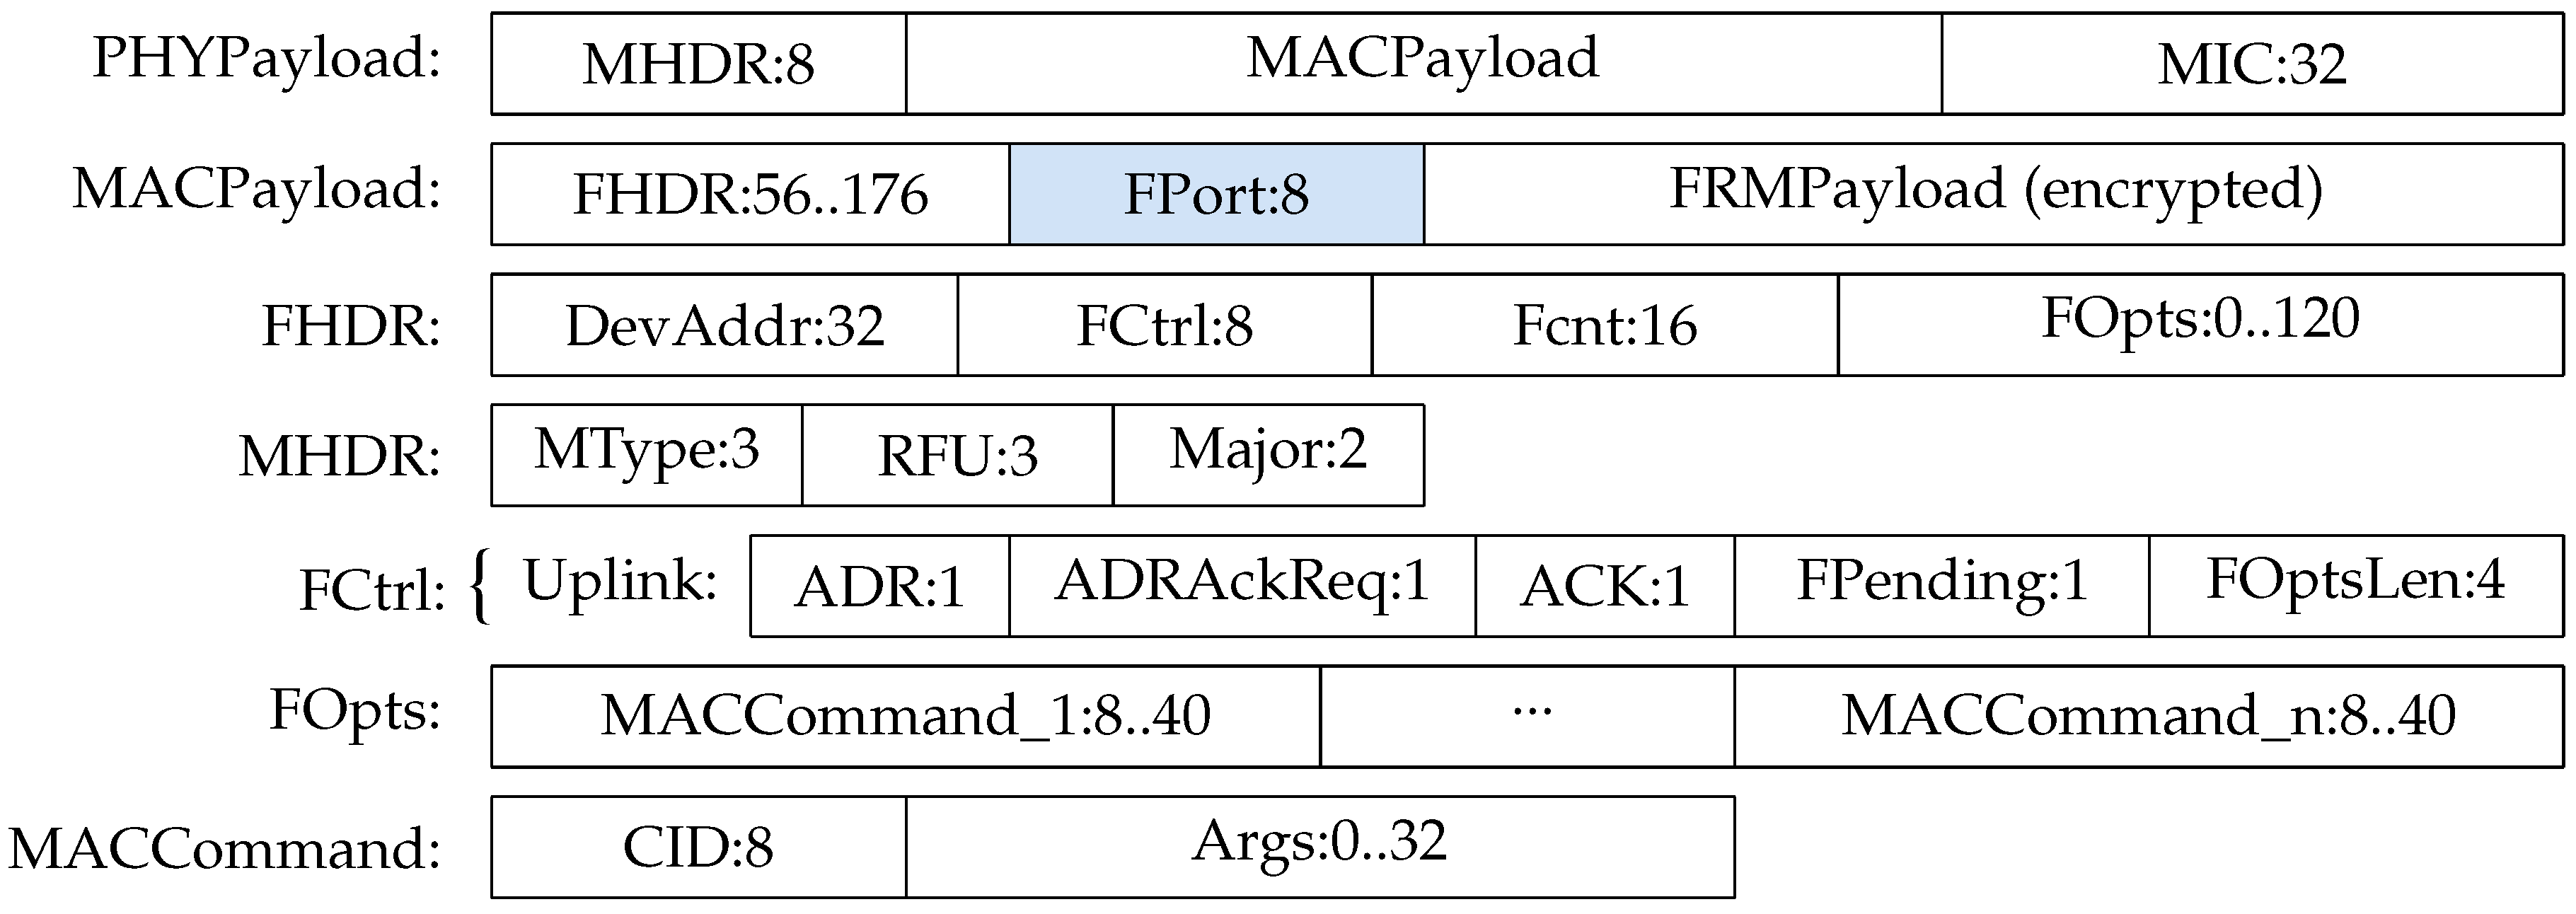
For the system to be mostly plug-and-play (for sensors with SDI-12 or I2C) it was necessary to build a library with identical concept to the Zigbee Cluster Library (ZCL) [16] using the FPort, that is part of the MACPayload from the LoRaWAN frame format (Figure 4), as ‘Cluster Identification’.
Developed Firmware
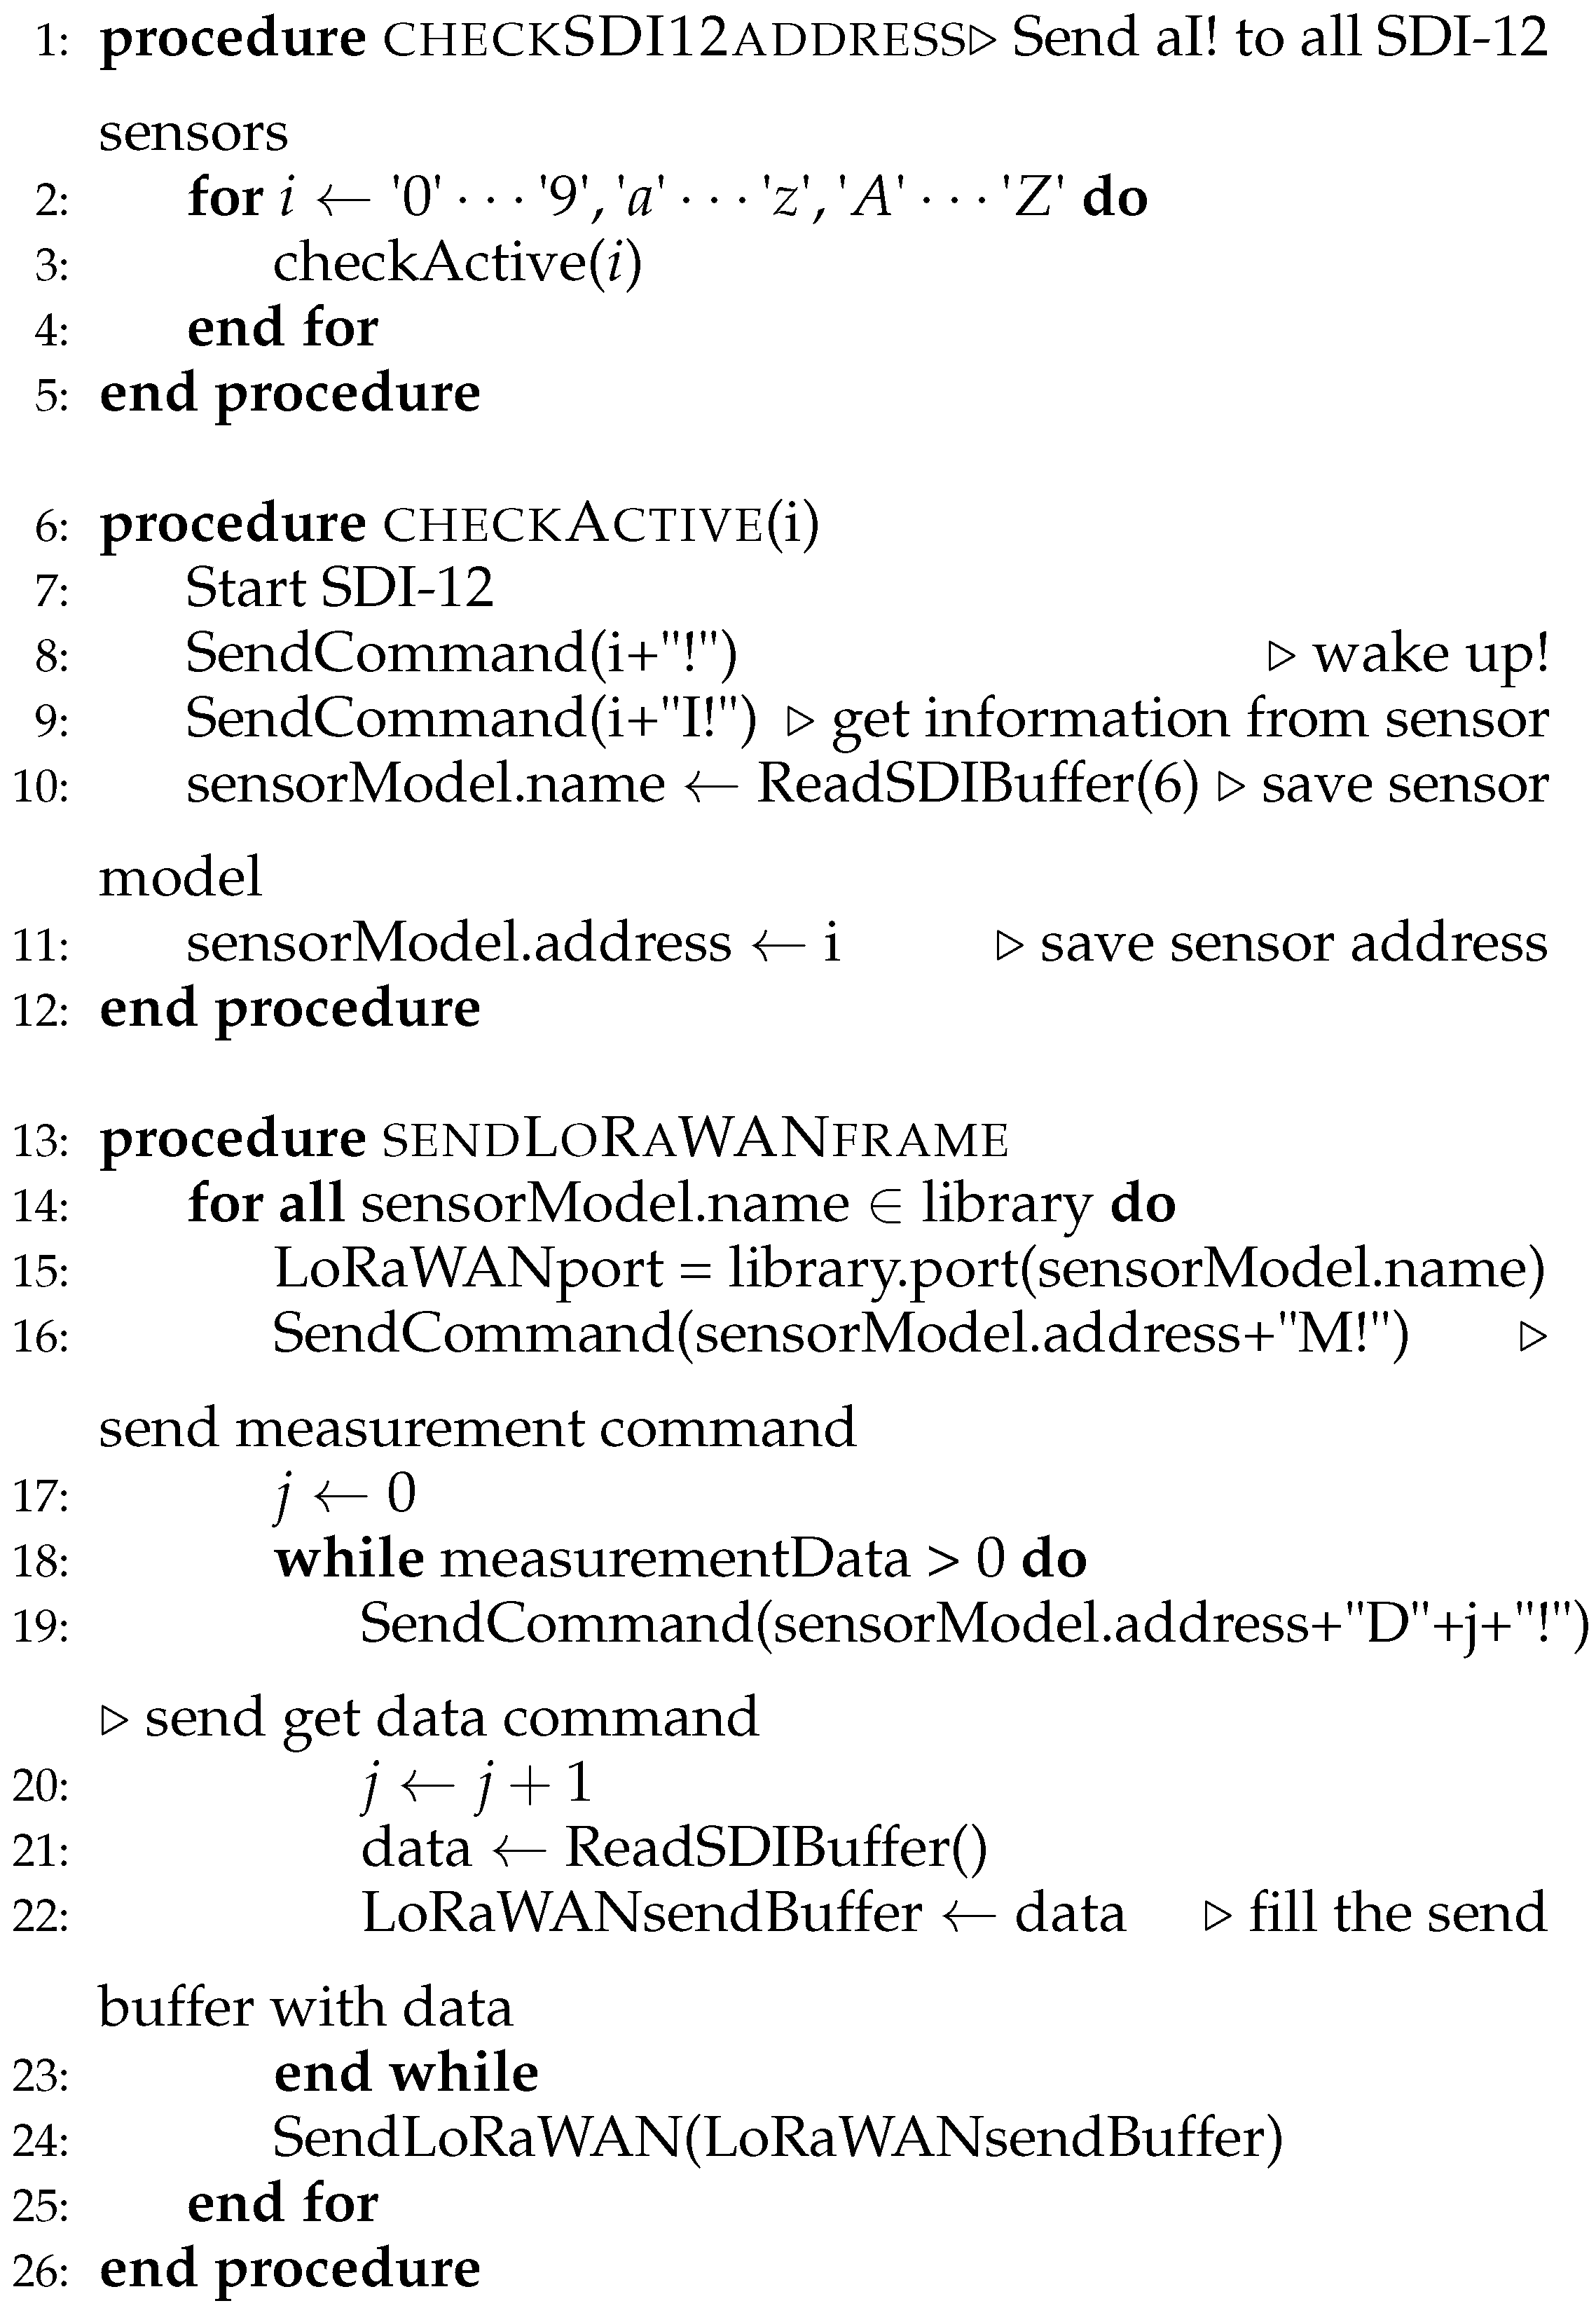
The main block of the developed firmware is about the process that allows plug-and-play. Only the process for the SDI-12 will be presented, however, the process for the I2C is identical, albeit simpler. Figure 5 shows the algorithm for this block. The procedure starts with the traversing through all SDI-12 addresses (the address is formed by an ASCII character that ranges from ‘0’ to ‘9’, ‘a’ to ‘z’ and ’A’ to ‘Z’) by sending the command a! (where a is the address) to ‘wake up’ the device, followed by the command aI! for the device to send a string with device information.
The example of a frame sent is found in Figure 6. This frame has several information in fixed fields (as described in [8]). The first 1 byte field is the device address, followed by 2 bytes representing the SDI-12 protocol version of the sensor (in this case, version 1.3). This is followed by 8 bytes with the manufacturer’s name and then 6 bytes with the model name of the sensor. It is this string, together with the address, that will be stored in a buffer where all sensors connected to the SDI-12 bus will be located (note that all these sensors must already have different addresses). When the data are sent by the node, and for all existing devices, the model name will be searched in the cluster library and the information necessary to obtain the device data and how to proceed to send it will be retained. If any of these devices have the continuous power flag, the power supply for all sensors will always be on.
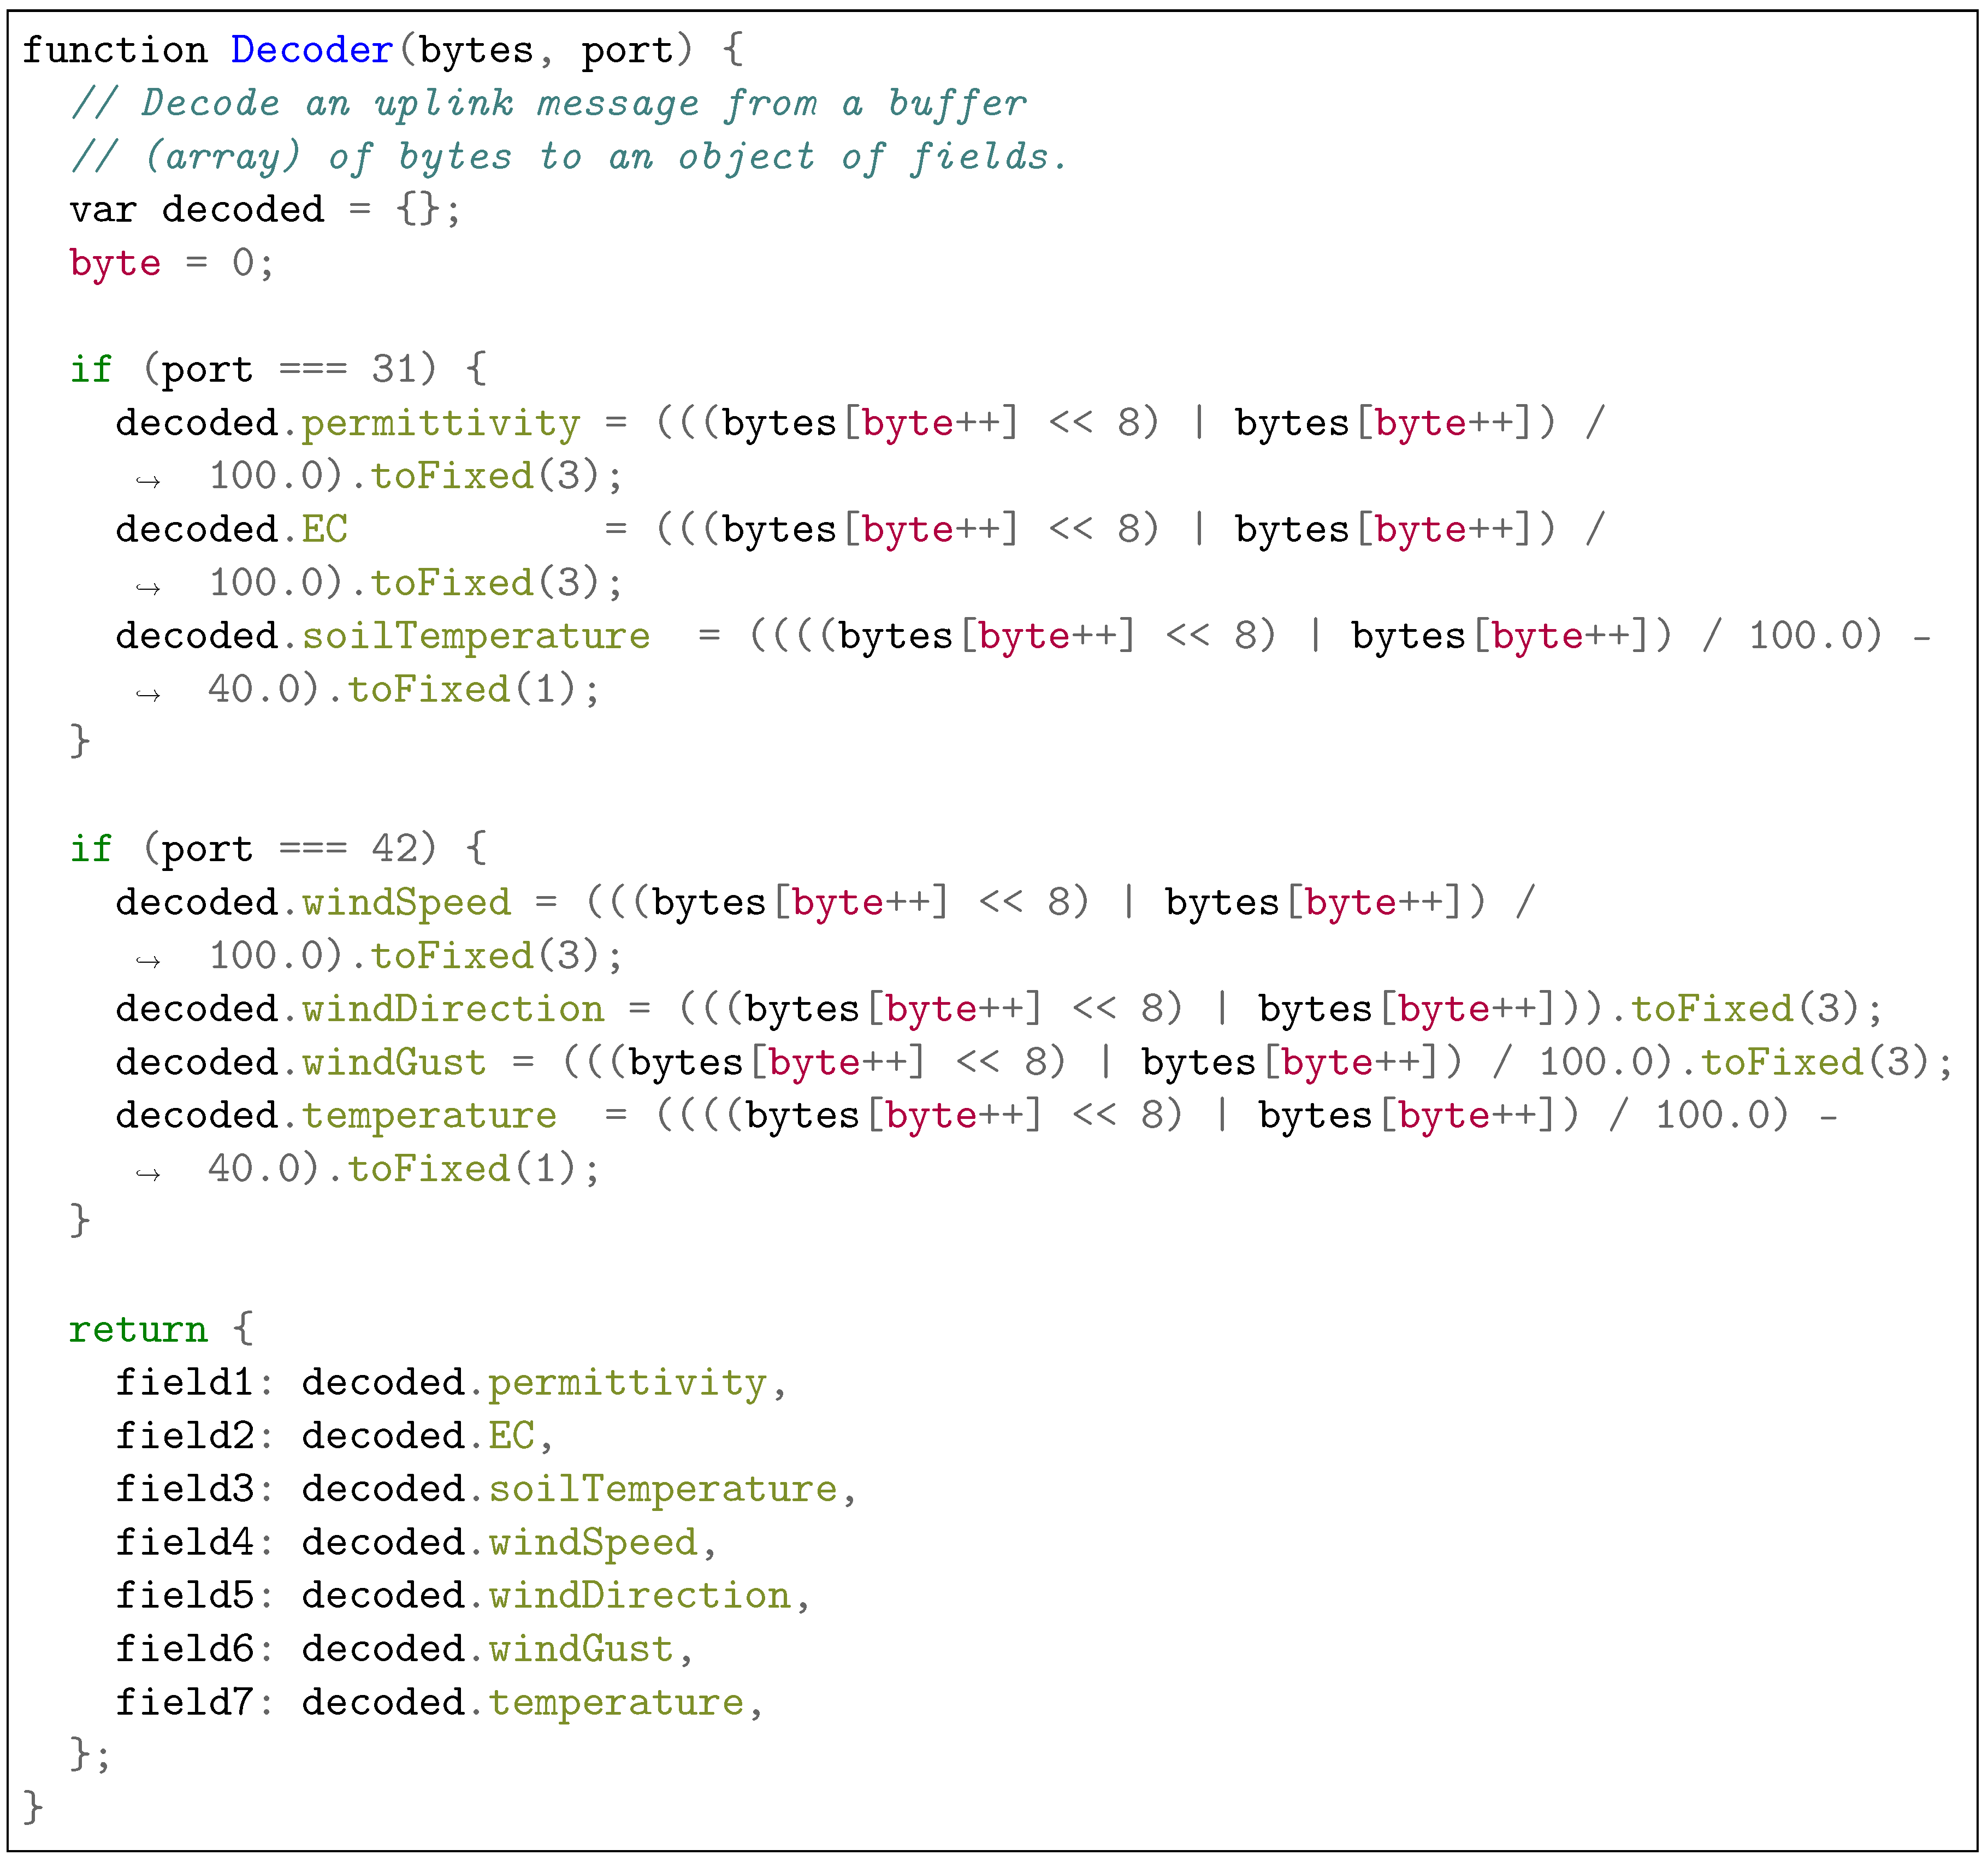
The data are then sent wirelessly via the LoRaWAN protocol to a gateway which will send it over a Wi-Fi connection (or Ethernet or LTE) to the The Things Network [41] (TTN) server. The data on arrival at the TTN are decoded using a Java function. The example of one of these functions is in Figure 7. This is a small demonstrative example of the use of two SDI-12 sensors, a 5TE sensor and an ATMOS22, which, as developed in the cluster library, sends data through port 31 (5TE) and port 42 (ATMOS22). The decode function shown sends the data to ThingsSpeak [42], which is a platform that has the advantage of connecting to Matlab [43] and the disadvantage of allowing only eight data fields (the name of this field must be field1 to field8).
5. Results
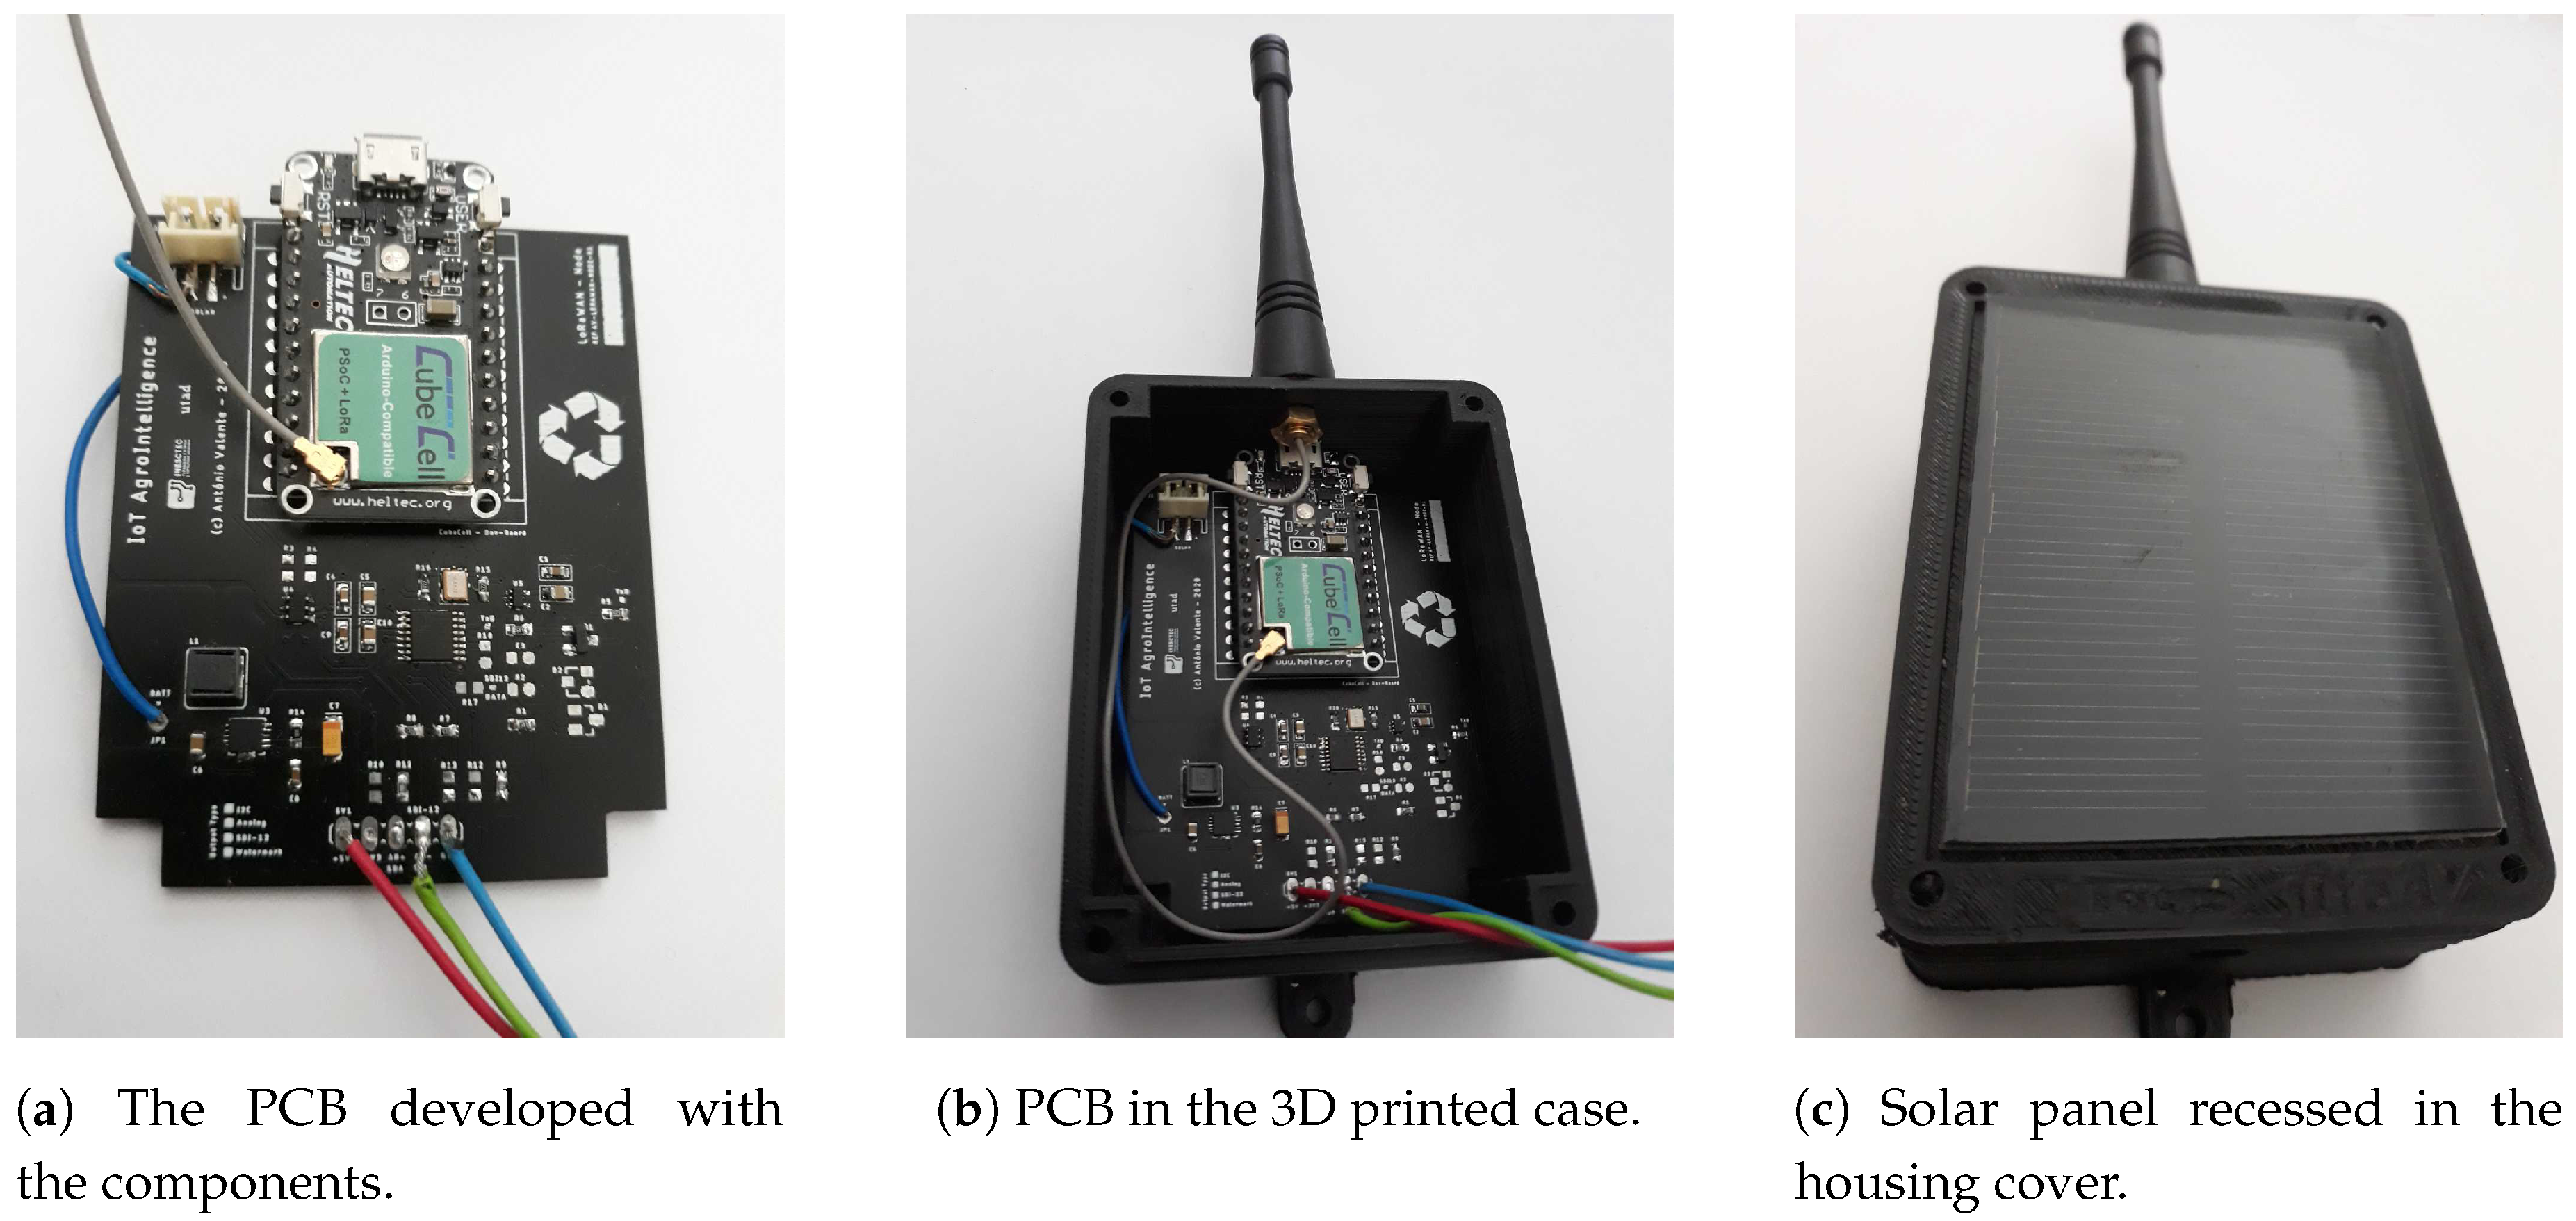
Figure 8 shows the node developed in three phases: only the PCB with all the components, where you can see Heltec’s (Heltec Automation, No. 18 Chenghong Road, Longtan Industrial Park, Chenghua District, Chengdu City, Sichuan Province, China) CubeCell module (Figure 8a); then the PCB already in the 3D printed watertight box (Figure 8b) above the 2000 mAh LiPo battery and Figure 8c shows the box node with the cover where the solar panel is located.
Three nodes were installed on a farm in the Alto Douro Wine Region (UNESCO World Heritage) [44], northern Portugal. Due to confidentiality issues, photos of the location and the location of these nodes will not be presented, however the data obtained from them will be presented.
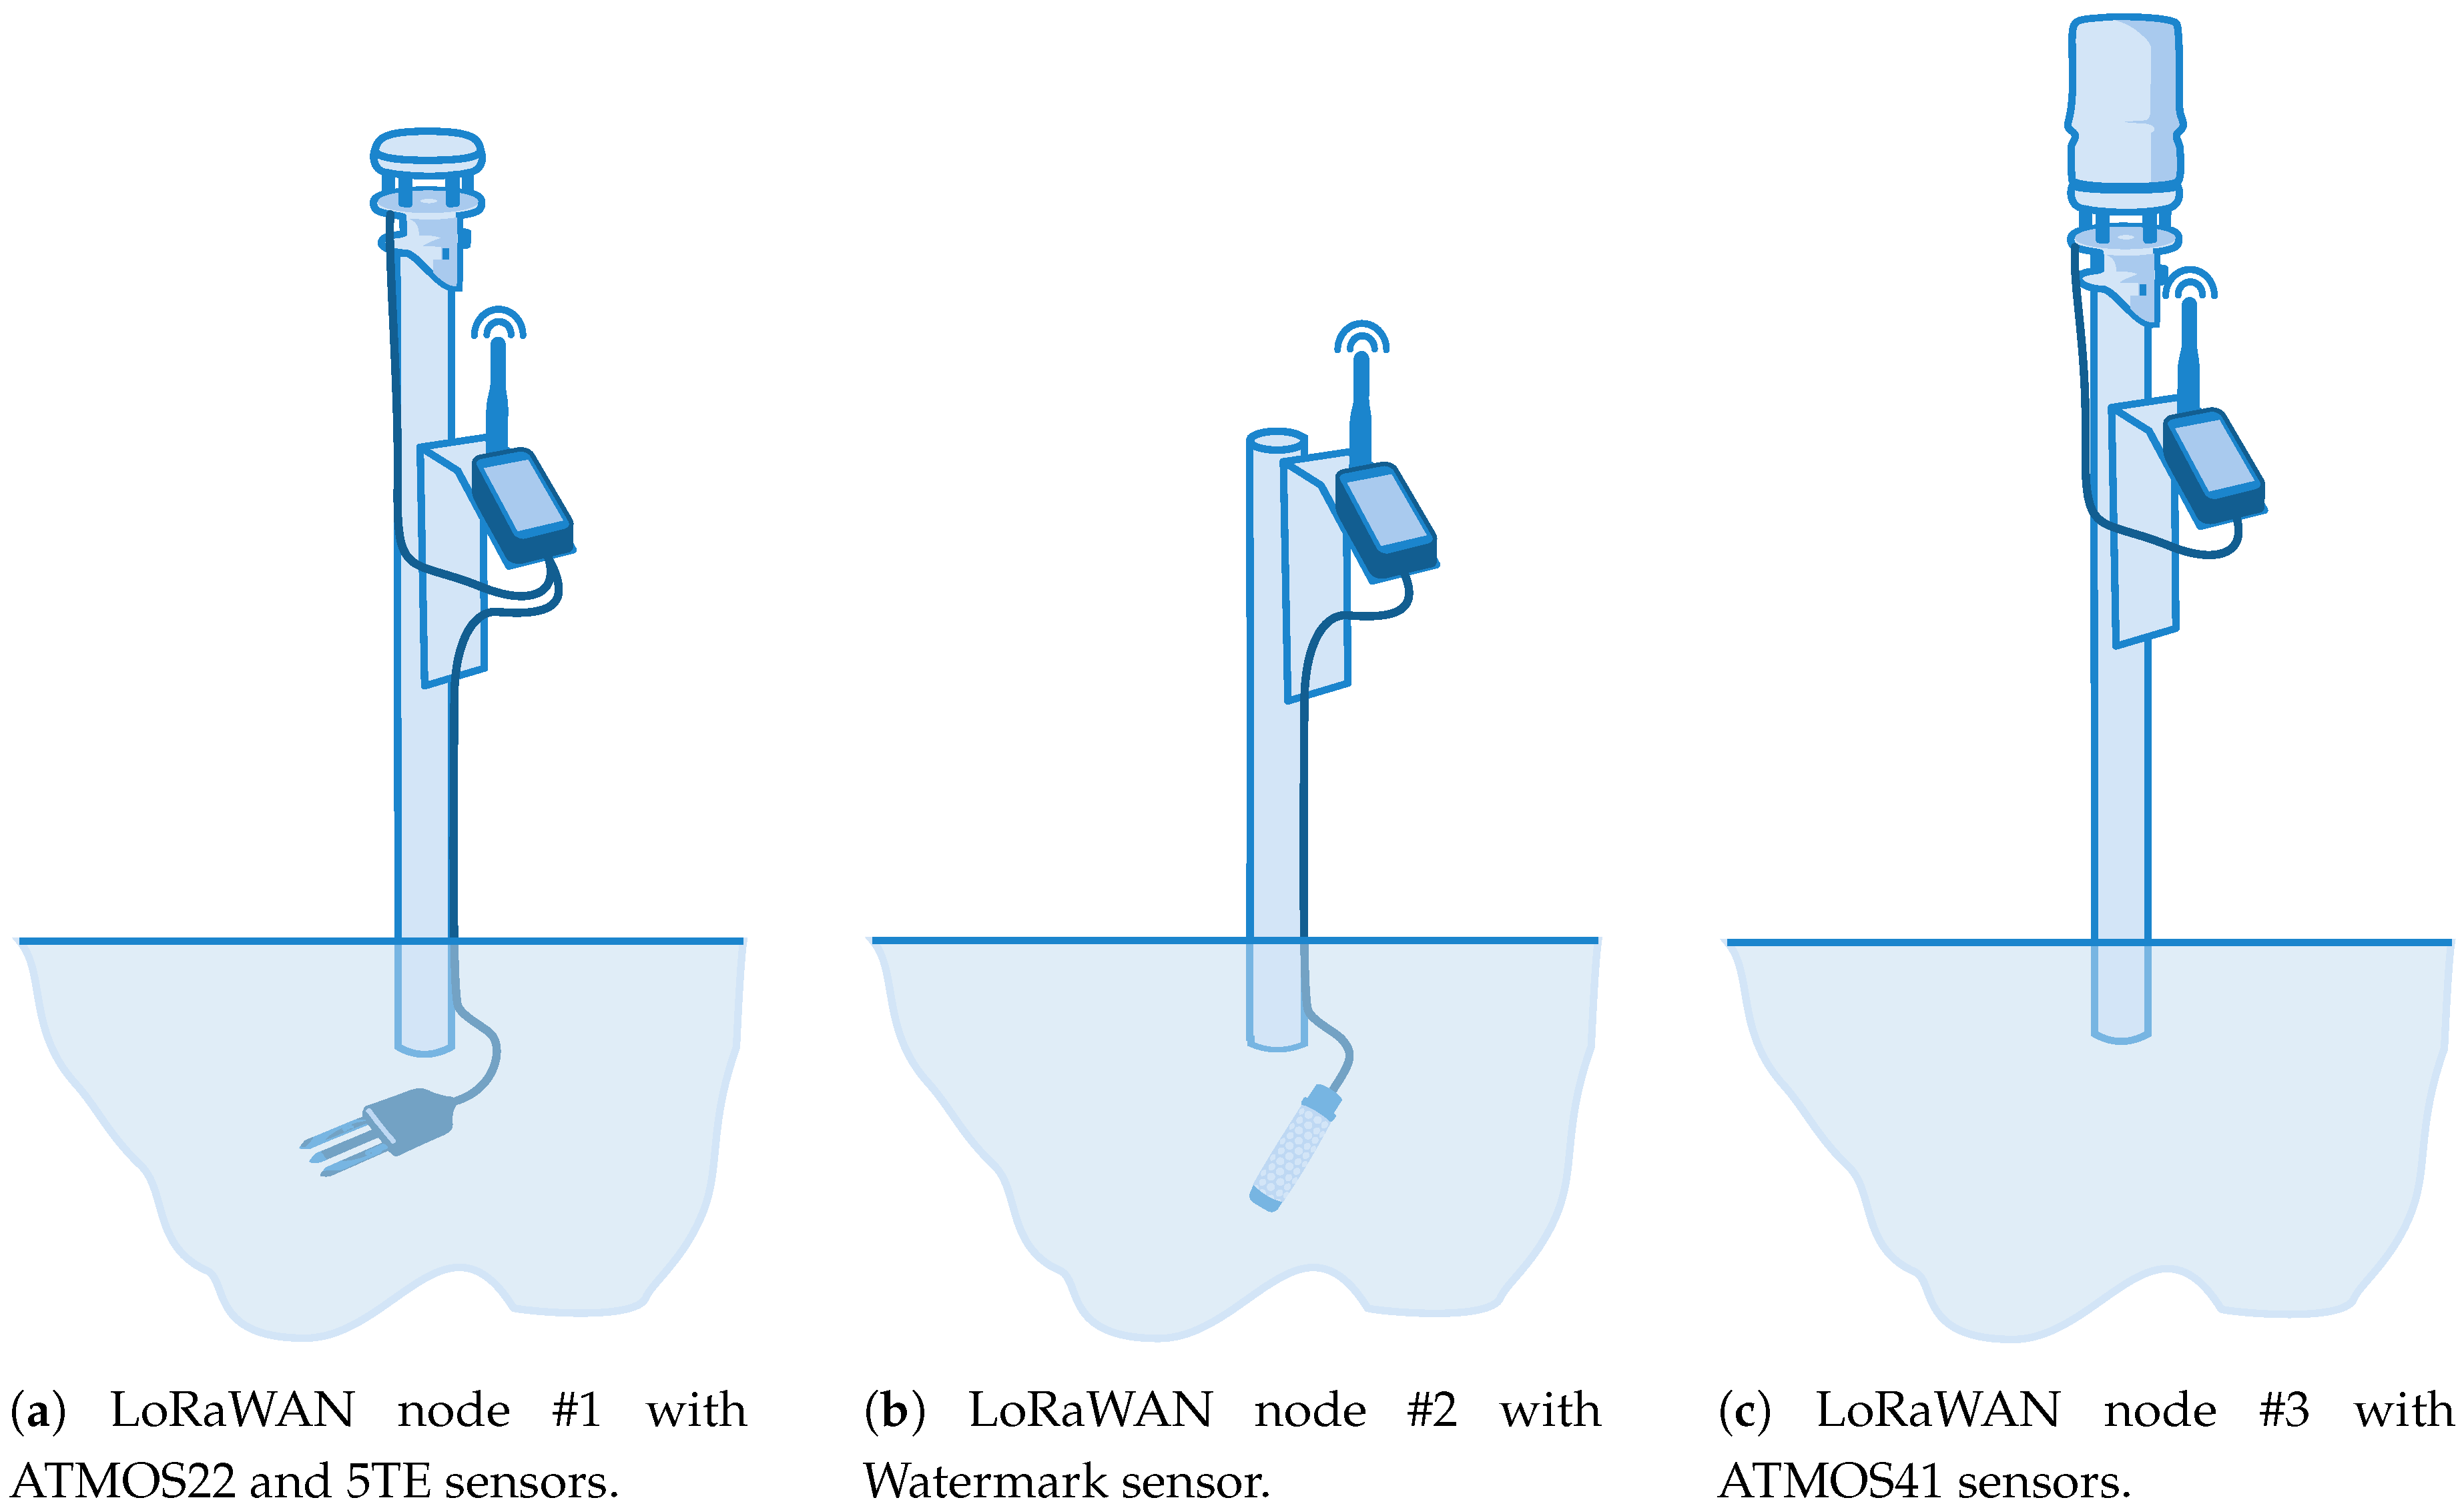
The three installed nodes are outlined in Figure 9 and all send the data hourly. The node in Figure 9a (node #1) contains a sensor, 5TE, which monitors bulk electrical conductivity (EC), in addition to Volumetric Water Content (VWC—by measuring soil permittivity) and soil temperature, and an ATMOS22 sensor, an ultrasonic anemometer that measures the direction and speed of the wind, also reporting the maximum of that speed in the measurement period—gust. Additionally, it also measures air temperature.
A node with only the Irrometer Watermak soil water tension sensor is shown in Figure 9b (node #2). The last node (node #3), in Figure 9c, is connected to the ATMOS41 from Meter. The ATMOS41 is a all-in-one weather station with 12 weather sensors into a single, compact device for atmospheric conditions. ATMOS41 has no moving parts and measures air temperature, relative humidity, vapor pressure, barometric pressure, wind speed, gust and direction, solar radiation, precipitation, lightning strike counter and distance.
5.1. Data from the Nodes
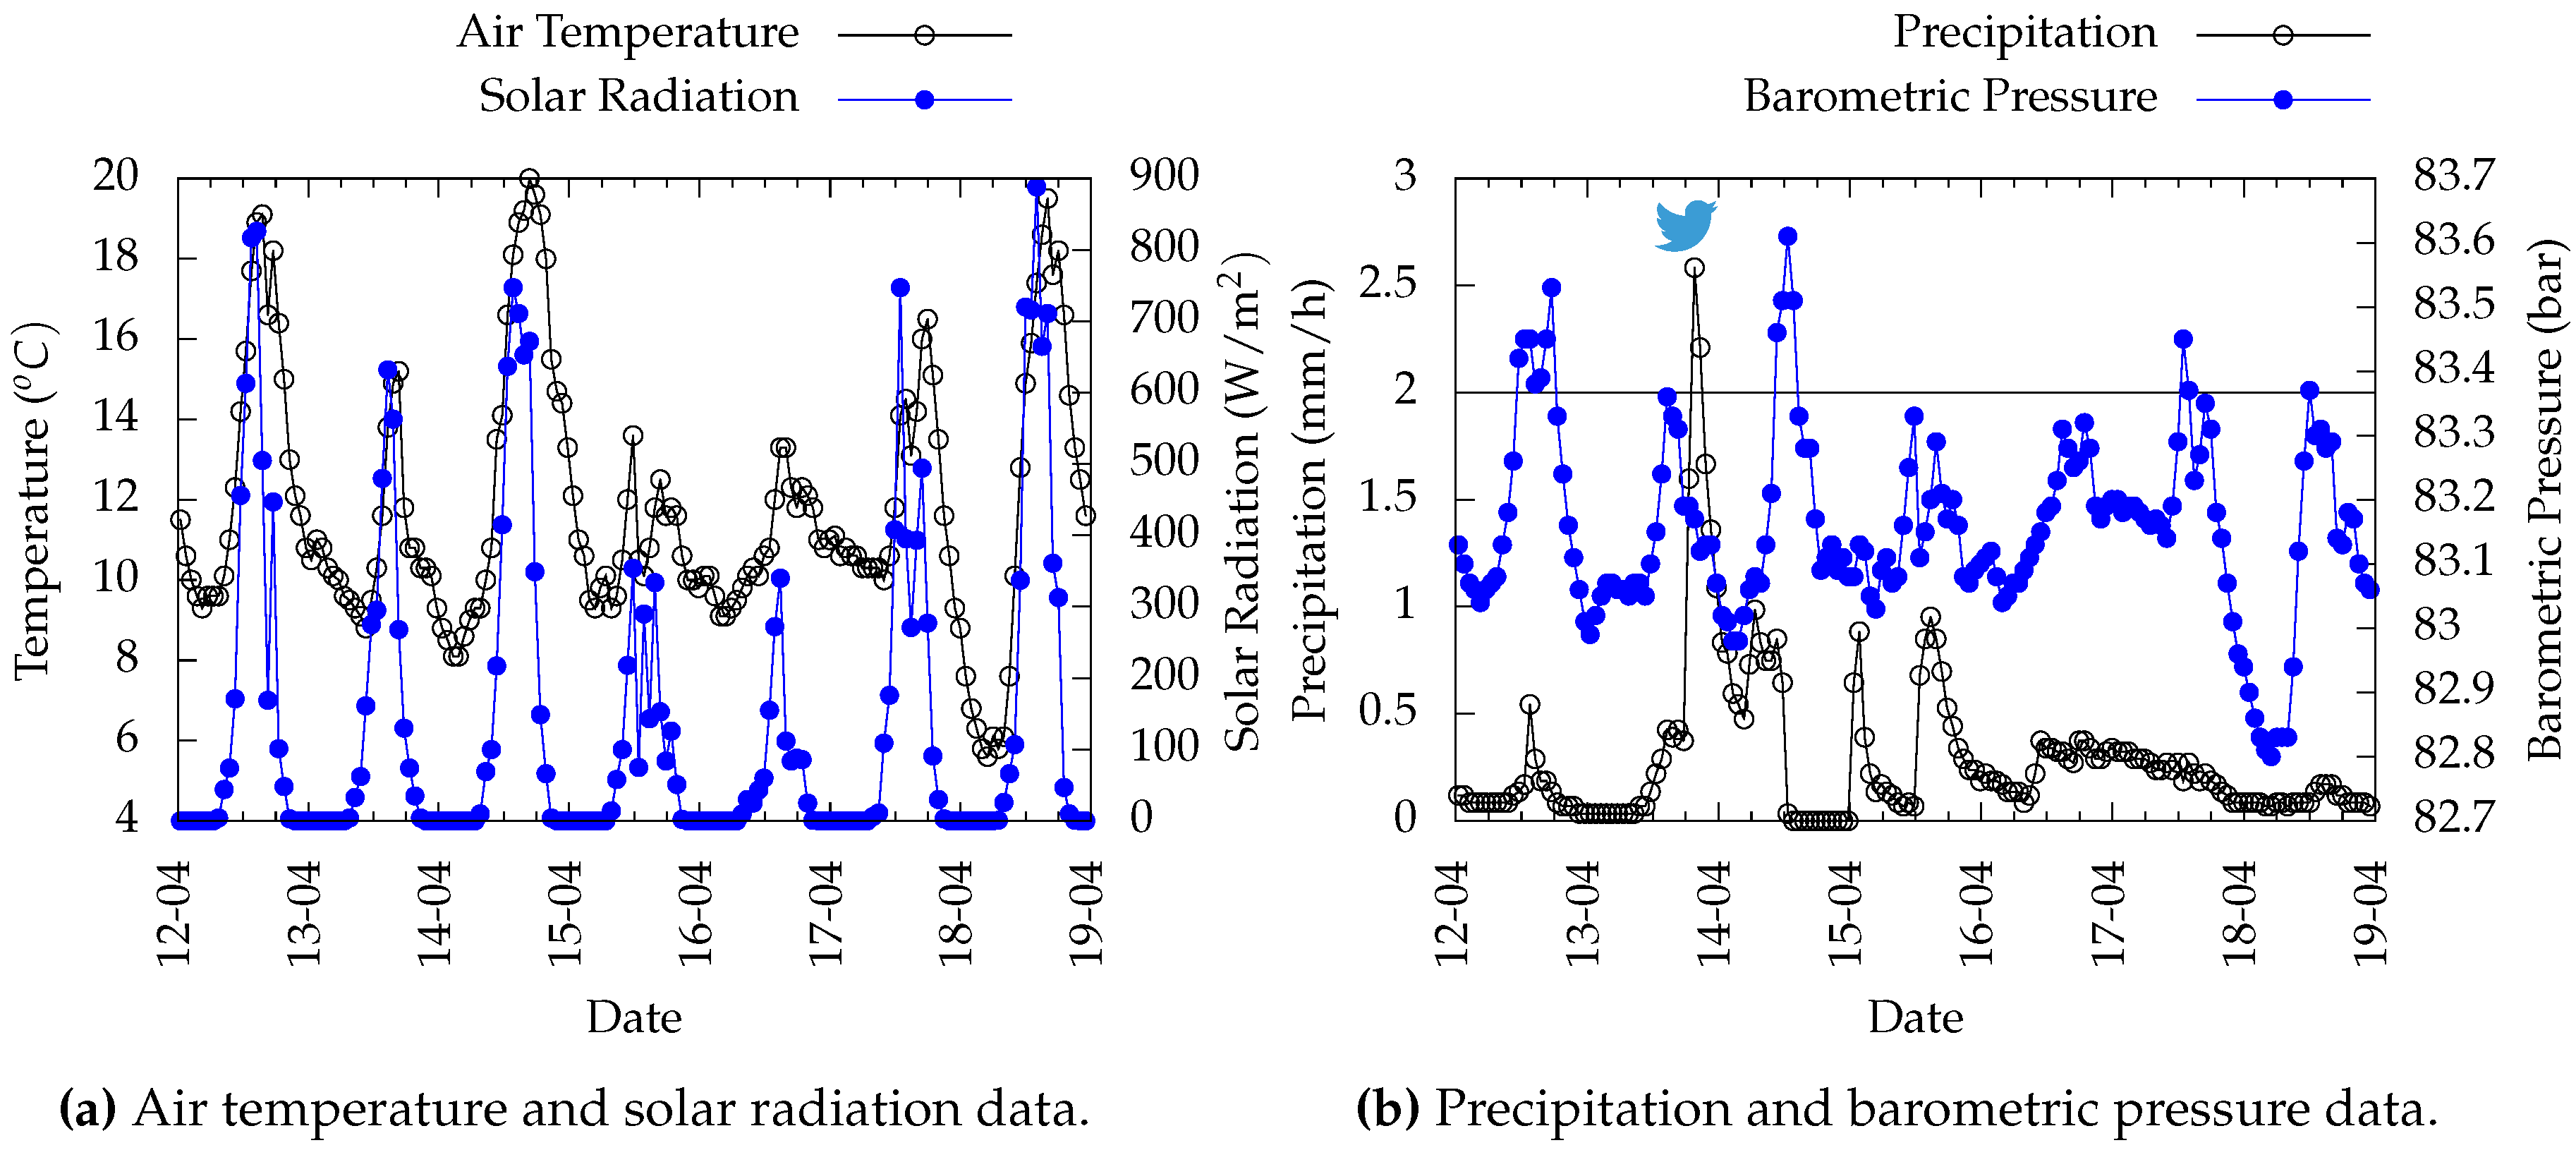
The figures presented in this section (Figure 10, Figure 11, Figure 12 and Figure 13) show the data collected by the three nodes in the week of 12–19 April 2020. The data are presented per node and when there is more than one sensor in a node (case of node #1), data are presented for each sensor. The exception is the Figure 11 that intends to compare air and soil temperature (uses data from 5TE sensors, for soil temperature, and data from ATMOS22, for air temperature). In the case of node #3, connected to the all-in-one weather station, only four parameters are displayed (air temperature, solar radiation, precipitation and barometric pressure). As there is a relationship between air temperature and solar radiation, and some relationship between precipitation and barometric pressure, the data acquired by node #3 intend to show these relationships.
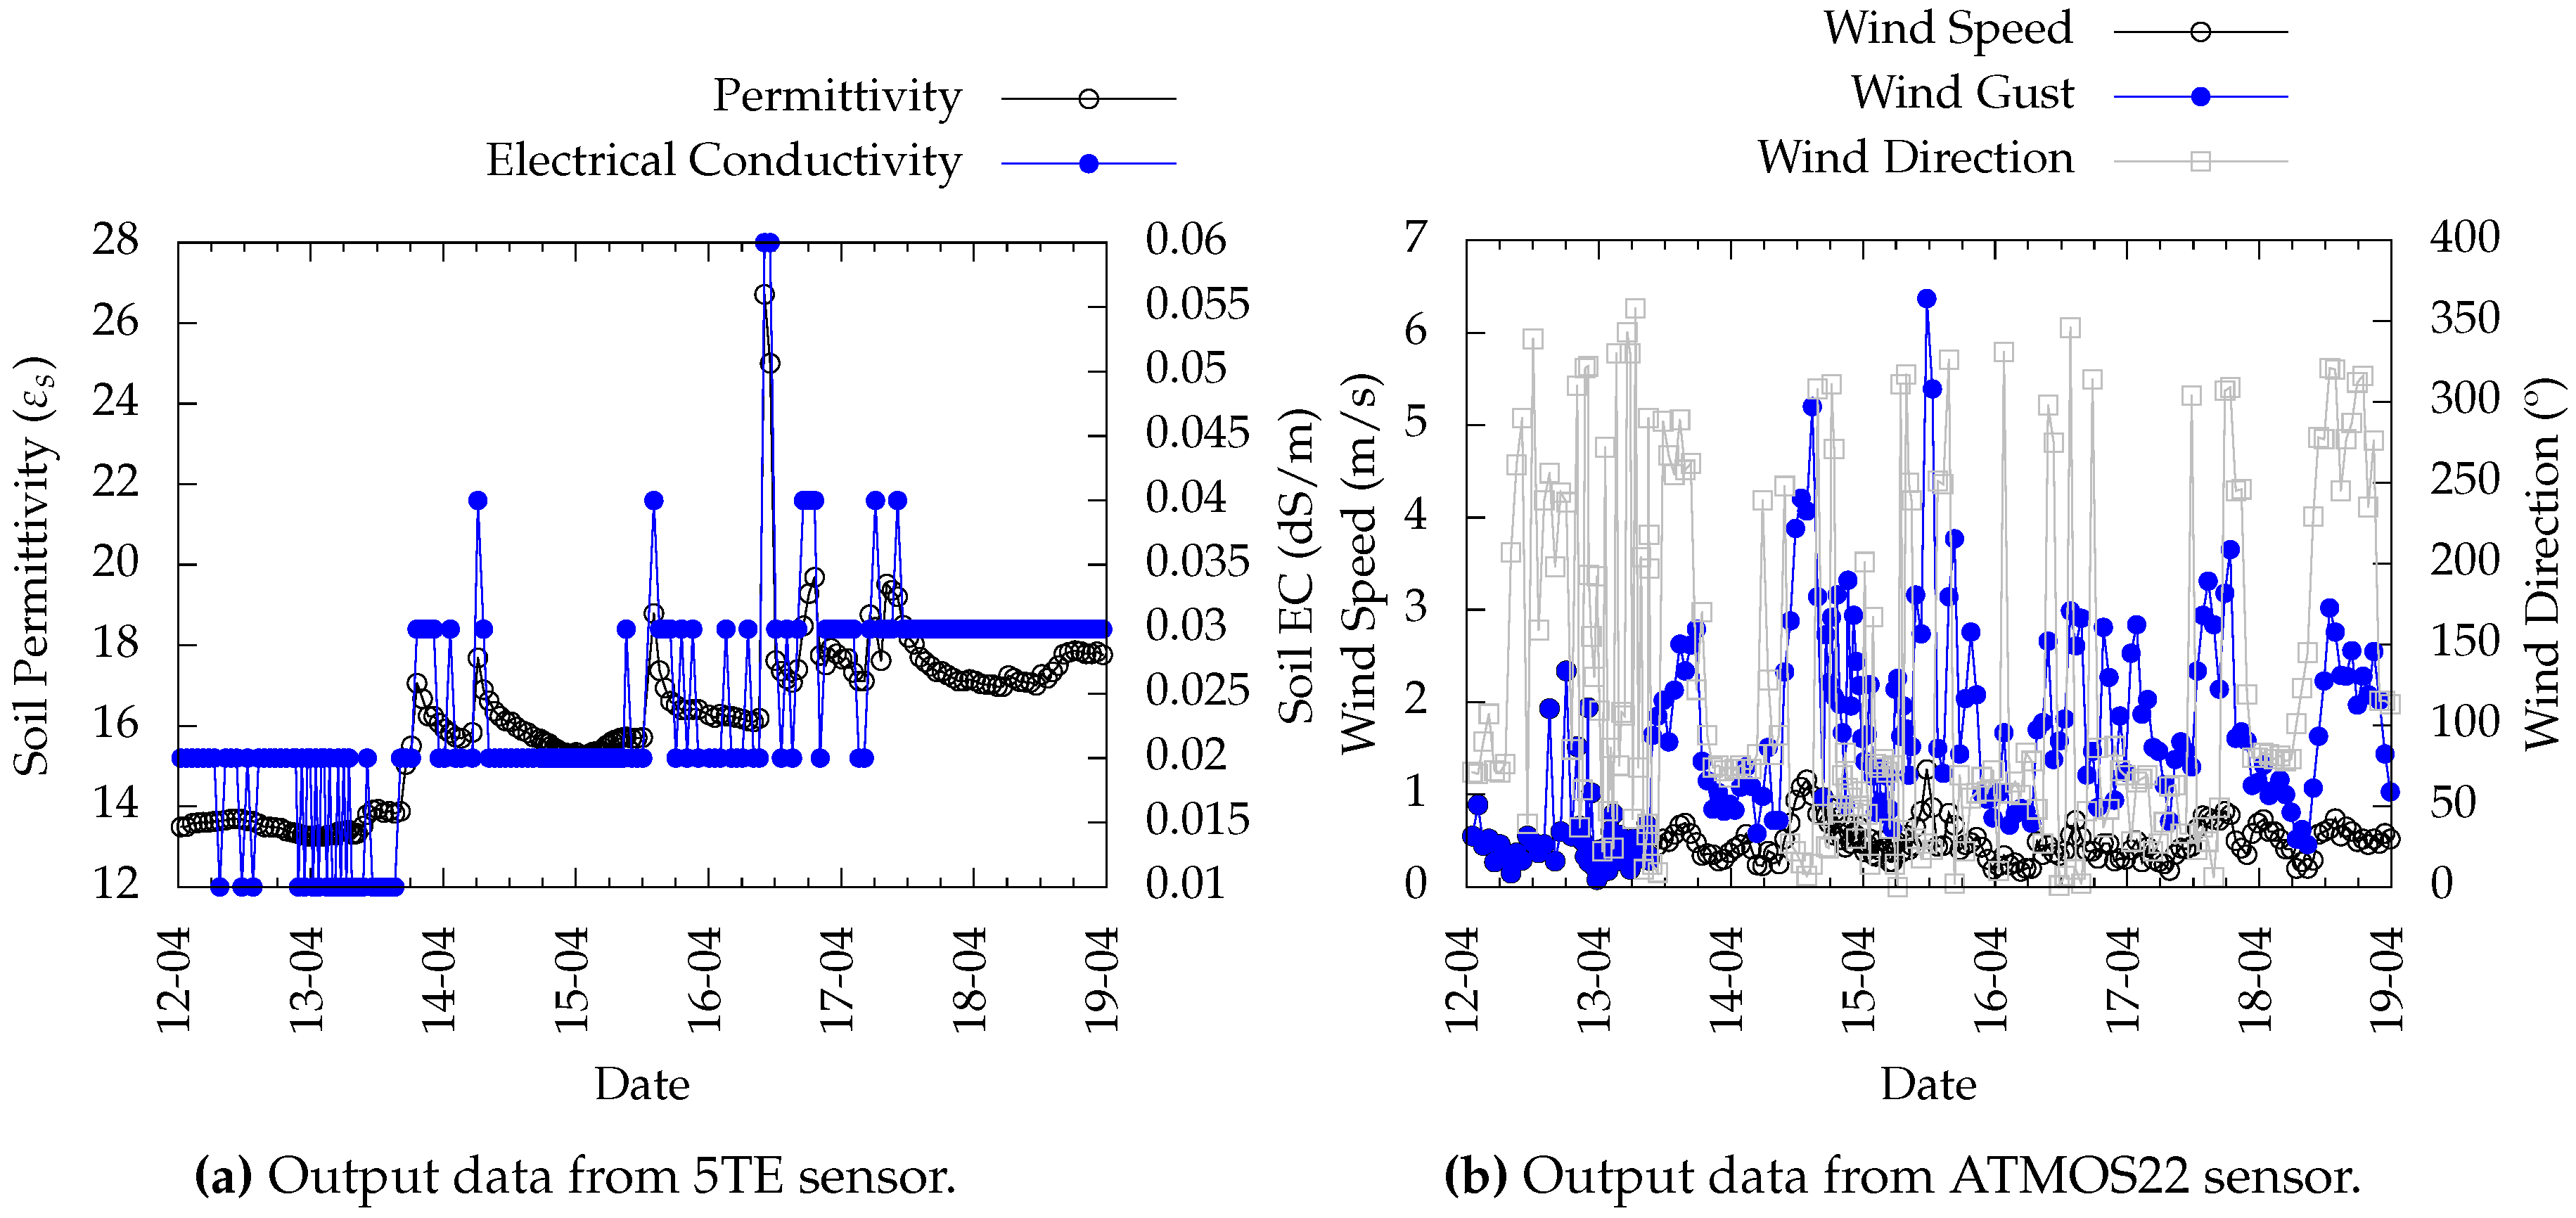
In Figure 10a, the data of node #1 containing the 5TE and ATMOS22 sensor are presented. The data from the 5TE sensor, in Figure 10a, shows soil permittivity (which, using an equation by Topp et al. [45], will allow the determination of the volumetric water content) and soil Electrical Conductivity (EC). On the other hand, Figure 10b shows the Wind Direction, Wind Speed and Wind Gust, provided from the ATMOS22 sensor.
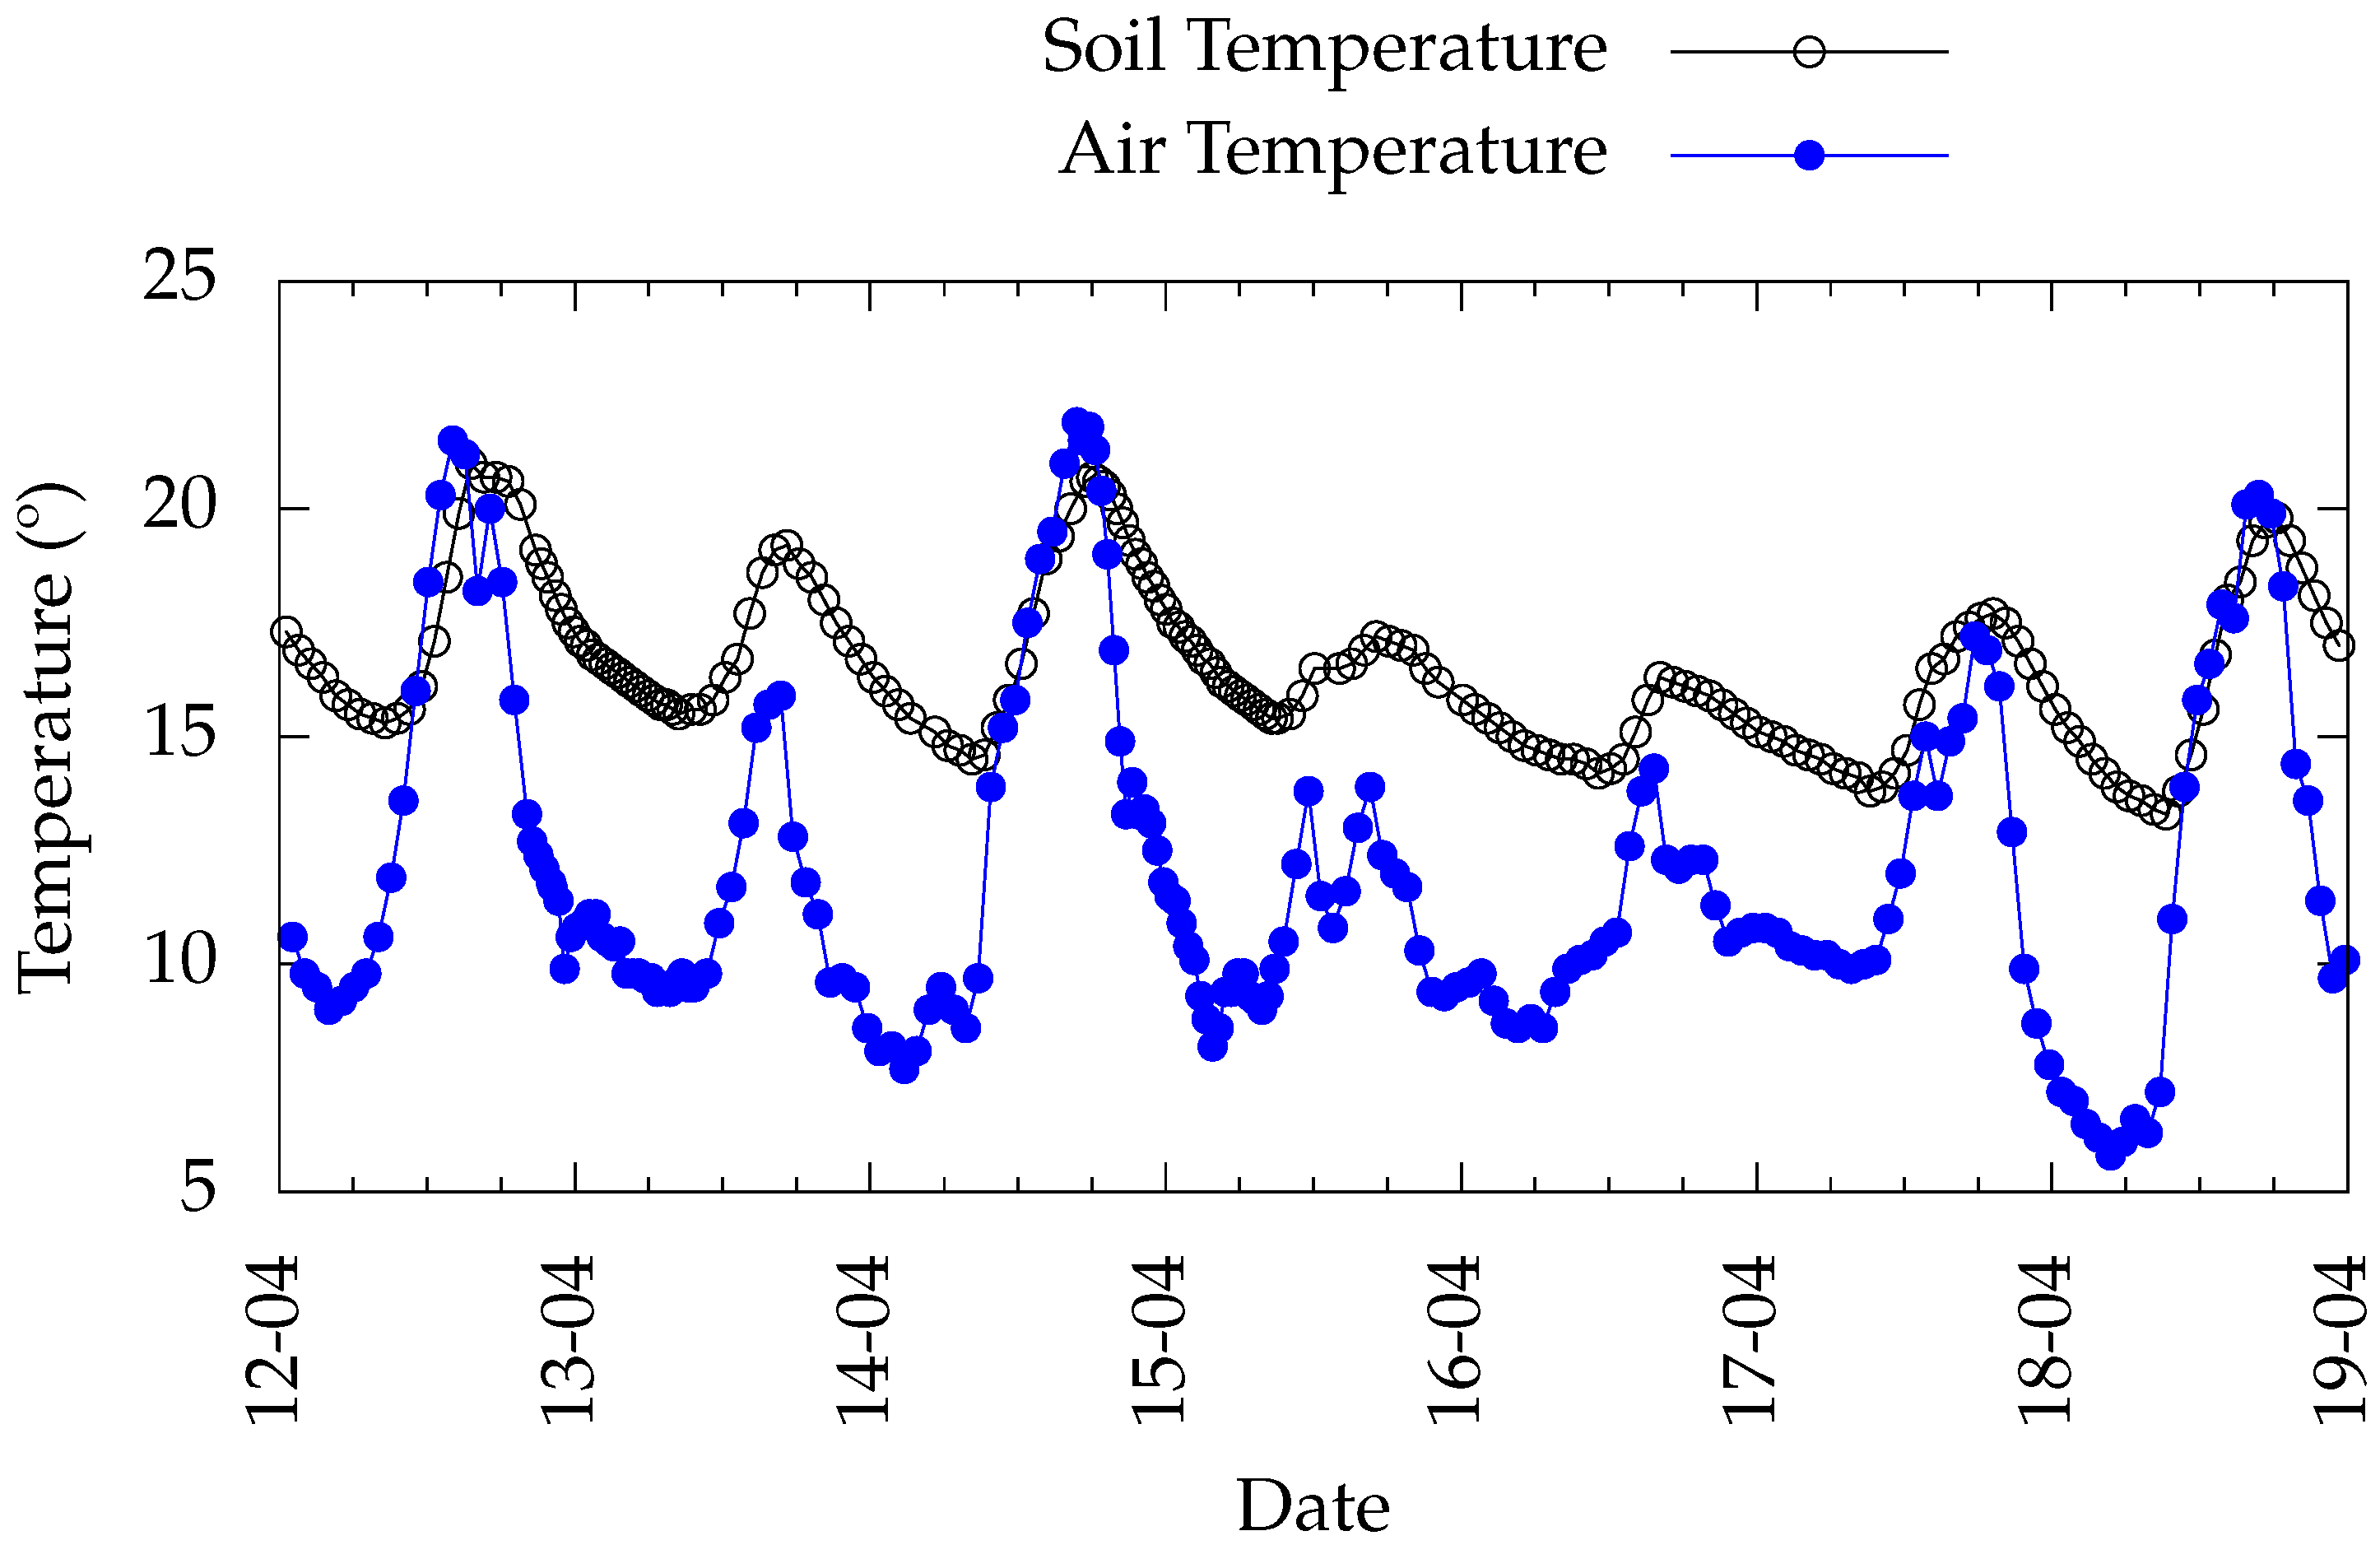
The values of soil temperature (5TE) and air temperature (ATMOS22) are presented in Figure 11 in order to have a comparative idea of these two temperatures.
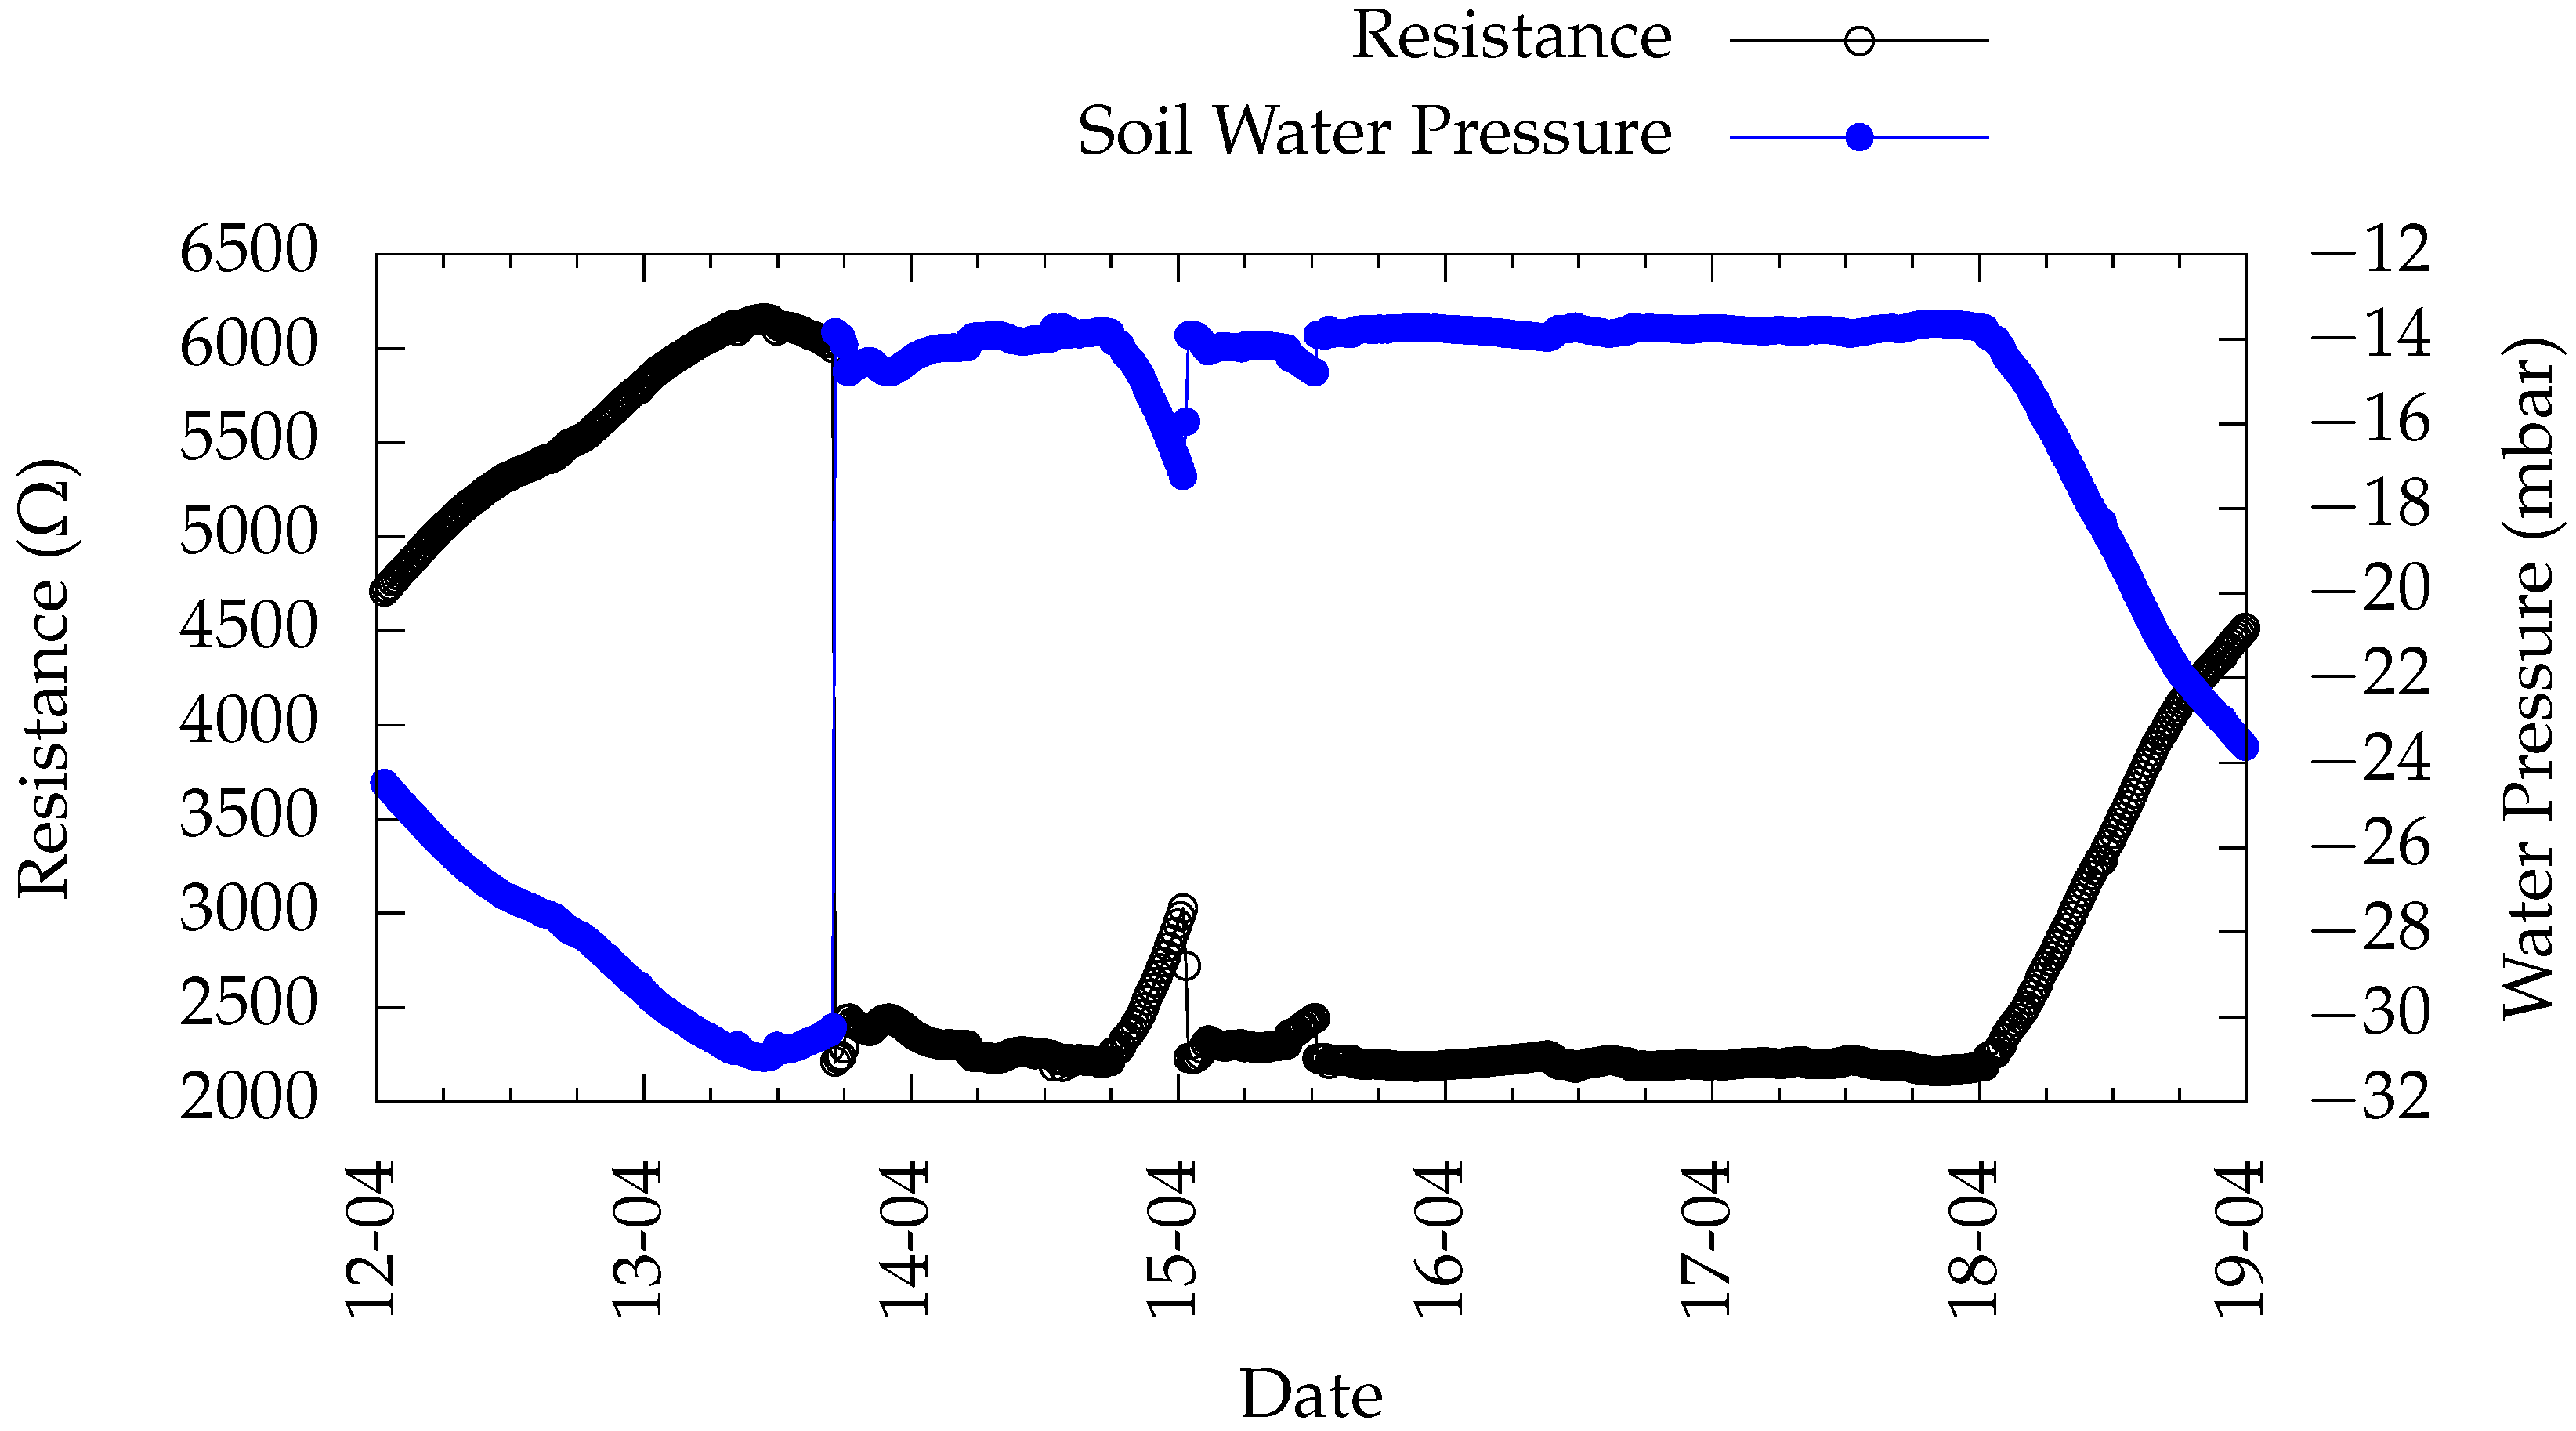
The data for node #2, containing the Watermark sensor, are shown in Figure 12. It should be noted that there is a relationship between the resistance value and the value of water tension given by the Equation (1) [39],
where
is the water tension in cbar, R is the measured resistance in and T is the soil temperature in . It is also noticeable that shortly before April 14 (more precisely on 13 April 2020) an episode of high precipitation (≈ −1) occurred that was detected by the Watermark sensor.
In the case of the node #3 with ATMOS41, all-in-one weather station, only 4 of the possible 12 measured parameters are shown (Figure 13). Remember that although the 12 parameters are sent, only eight can be sent to ThingSpeak. As a result that the wind data are already being presented by another node, we opted for the presentation of solar radiation and air temperature (Figure 13a), barometric pressure and precipitation (Figure 13b). Although the air temperature data obtained by ATMOS22 have also been presented, the data from ATMOS41 will also be presented since they are from another location in the vineyard and the comparison with solar radiation is interesting to show.
The ThingSpeak platform allows sending Tweets through Twitter (ThingTweet app) as response from a reaction. As an example a Tweet is sent whenever the precipitation rate is greater than 2 −1, as documented in Figure 13b (where you can see the threshold line at 2 −1 and when the Twitter is sent—Twitter logo).
5.2. Power Consumption
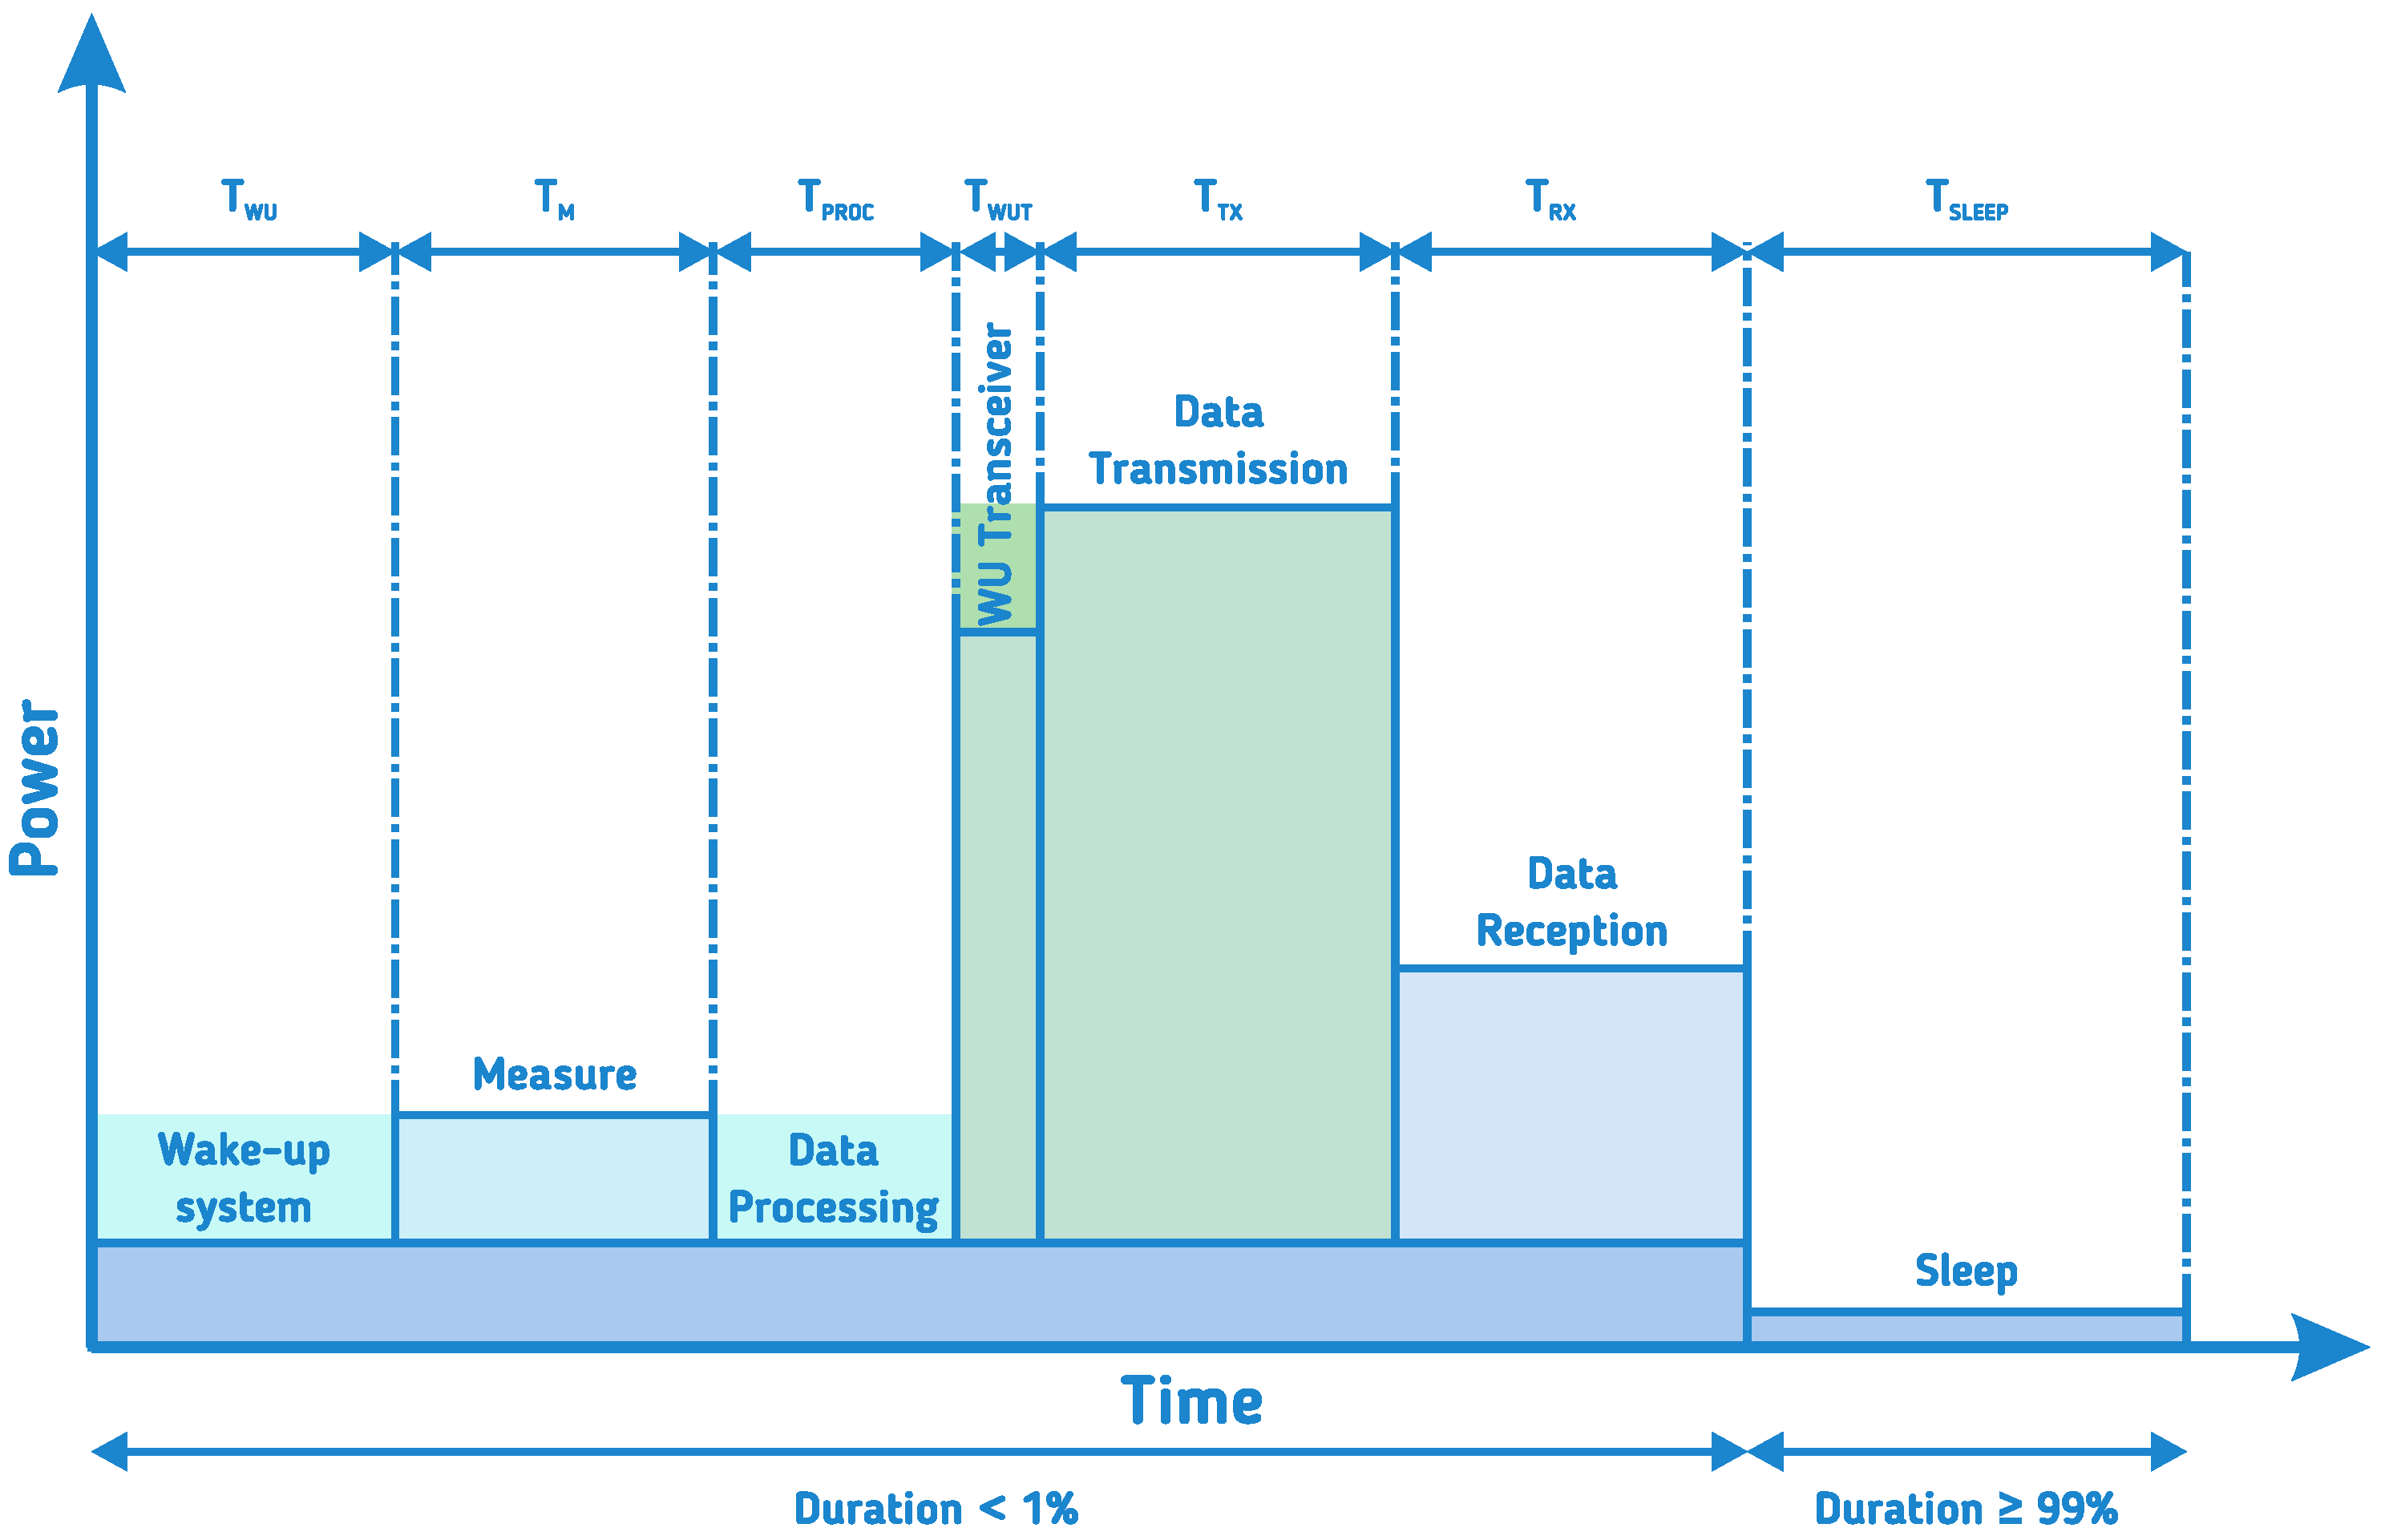
Considering all the possible working sequence of a sensor node with defined different operating modes, presented in Figure 14 [46], we can calculate the average current consumption (sampling time is 3600 ) of the node as,
where T is the time (), I is the current () and subscripts , M, , , , and , represent the Wake-up, Measurement, Processing, Wake-up Transceiver, Data Transmission, Data Reception and Sleep operation modes, respectively.
For simplification and worst case calculations, we can assume that the measured current of the Measure state is the same also in the Wake-up and Processing mode, and that the measured current in the Wake-up Transceiver mode is the same as in the Data Transmission mode.
Therefore,
Considering the case of the node connected to the sensor that consumes the most current the ATMOS41 sensor, and that it must always be connected. Using Equation (3) and the measured values presented in the Table 2, the average current for the worst case node will be .
Regarding commercial products, not everyone has information about consumption. TekBox devices only indicate consumption in Sleep mode (5–7 for TBS12/TBS12B and 35 for TBS12S), whereas those from DecentLab indicate consumption below (with the supply of these devices, it is lower than 300 ) without sensors connected. It should be remembered that for the developed node the calculations were made for the worst case (sensor must be permanently connected). If they were connected to the node they would not need to be always connected, and the consumption would be less than 90 .
The developed node includes a battery and a solar panel. The solution with node #3 that has the higher energy consumption and the one that has been in the field for the longest time because it has the weather station kept its battery at full charge continually for at least six months; that is, no data was recorded below 3.7 V during that period. It demonstrates that the chosen solar panel for this module validates its autonomy.
5.3. Node Cost
The cost of the entire system including the battery (5 €), the solar panel (3 €), the antenna (7 €), all electronic components (20 €), the PCB (1 €) and the box with the cover (1.5 €) will be approximately 37.5 € (values from December, 2019). With the addition of a temperature and humidity sensor with I2C, SHT35, the total cost will be approximately 46.5 €. This value is less than the lowest cost solution on the market (SenseCap by Seeed Studio) which is 78.83 € [47] (value of the solution with the temperature and humidity sensor at Digi-key).
6. Conclusions and Future Work
In this work, we have developed a low-cost node of small dimensions (), thus making it easy to handle and install. Energy consumption depends on the number and type of sensors connected to the node. In the implemented cases, the maximum consumption was ≈400 . The development of the library makes the node plug-and-play. The developed system forms a wireless network based on the LoRaWAN protocol, thus ideal for Agro-Intelligence IoT. The library of clusters developed for the LoRaWAN network, dedicated to agriculture, proved to be effective in the plug-and-play use of digital sensors with SDI-12 communication.
The IoT platform presented in this paper has been validated and used in a smart farming scenario—a vineyard in the Douro region. Thus, the developed node will be a great step forward for the use of wireless sensors in smart agriculture in Douro vineyards.
Finally, in terms of future work, this will be developed in two fundamental areas for smart agriculture, one aspect related to the increase and consultation of the system, and another aspect related to the improvement of the cluster library. In the first case, the aim is to increase the number of nodes, create a dedicated platform for data visualization and develop intelligent data analysis systems. The increase in the number of nodes will give rise to a pilot installation called Lab in-situ, where tests and trials will be carried out, also promoting the production of commercial specifications that will help demonstrate its applicability to the wine industry and replication to the agricultural sector. The platform to be developed will also aim to create an intelligent system capable of supporting the identification of grape varieties and predicting the quality of wine, taking into account Machine Learning tools and heterogeneous data associated with viticulture. In the second case, it is intended to provide the developed library with more types of sensors (especially sensors with SDI-12 communication) and develop techniques to improve the aggregation and compression of data to be sent over the LoRaWAN network.
Author Contributions
Funding acquisition, S.S. (Salviano Soares); investigation, A.V.; methodology, A.V. and S.S. (Sérgio Silva); hardware, A.V. and S.S. (Sérgio Silva); software D.D.; supervision, F.C.P. and S.S. (Salviano Soares); visualization, A.V.; writing—original draft preparation, A.V.; writing—review and editing, A.V., S.S. (Sérgio Silva), D.D. and F.C.P. All authors have read and agreed to the published version of the manuscript.
Funding
This research received no external funding.
Acknowledgments
This work is financed by National Funds through the Portuguese funding agency, FCT—Fundação para a Ciência e a Tecnologia, within project UIDB/50014/2020. Special thanks to those responsible for the Douro farm who were always available to implement this project in one of its vineyards. In particular to Justino Soares and Tomás Roquette for all the cooperation.
Conflicts of Interest
The authors declare no conflict of interest. The funders had no role in the design of the study; in the collection, analyses, or interpretation of data; in the writing of the manuscript, or in the decision to publish the results.
Abbreviations
The following abbreviations are used in this manuscript:
| IoT | Internet of Things |
| LPWAN | Low-Power Wide-Area Network |
| LoRa | Long Range protocol developed by Semtech—physical layer |
| LoRaWAN | Long Rang Wide Area Network—networking layers |
| NB-IoT | Narrowband Internet of Things |
| LTE-M | Simplified industry term for the Long Term Evolution for Machine Type Communication (LTE-MTC) |
| TTN | The Things Network |
| SPI-12 | Serial Digital Interface at 1200 baud |
| I2C or IC | Inter-Integrated Circuit |
References
- Mekki, K.; Bajic, E.; Chaxel, F.; Meyer, F. A comparative study of LPWAN technologies for large-scale IoT deployment. ICT Express 2019, 5, 1–7. [Google Scholar] [CrossRef]
- LoRa Alliance. LoRaWAN® Specification v1.1. Available online: https://lora-alliance.org/resource-hub/lorawanr-specification-v11 (accessed on 13 April 2020).
- Bor, M.; Roedig, U.; Voigt, T.; Alonso, J.M. Do LoRa low-power wide-area networks scale? MSWiM 2016—Proceedings of the 19th ACM International Conference on Modeling, Analysis and Simulation of Wireless and Mobile Systems, Valletta, Malta, 13–17 November 2016; Association for Computing Machinery, Inc.: New York, NY, USA, 2016; pp. 59–67. [Google Scholar] [CrossRef] [Green Version]
- Citoni, B.; Fioranelli, F.; Imran, M.A.; Abbasi, Q.H. Internet of Things and LoRaWAN-Enabled Future Smart Farming. IEEE Internet Things Mag. 2020, 2, 14–19. [Google Scholar] [CrossRef]
- Silva, N.; Mendes, J.; Silva, R.; dos Santos, F.N.; Mestre, P.; Serôdio, C.; Morais, R. Low-cost IoT LoRa® solutions for precision agriculture monitoring practices. In Lecture Notes in Computer Science (Including Subseries Lecture Notes in Artificial Intelligence and Lecture Notes in Bioinformatics); Springer: Berlin, Germany, 2019; Volume 11804, pp. 224–235. [Google Scholar] [CrossRef]
- Rachmani, A.F.; Zulkifli, F.Y. Design of IoT Monitoring System Based on LoRa Technology for Starfruit Plantation. In Proceedings of the In IEEE Region 10 Annual International Conference, Proceedings/TENCON, Jeju, Korea, 28–31 October 2018; Institute of Electrical and Electronics Engineers Inc.: Piscataway, NJ, USA, 2019; pp. 1241–1245. [Google Scholar] [CrossRef]
- Bosch. BME680—Gas Sensor Measuring Relative Humidity, Barometric Pressure, Ambient Temperature and Gas (VOC). Available online: https://www.bosch-sensortec.com/products/environmental-sensors/gas-sensors-bme680/ (accessed on 13 April 2020).
- SDI-12 Support Group. SDI-12 Specification. Available online: http://www.sdi-12.org/ (accessed on 13 April 2020).
- Decentlab. LoRaWAN Products—Decentlab. Available online: https://www.decentlab.com/products (accessed on 13 April 2020).
- Seeed Studio. SenseCap. Available online: https://solution.seeed.cc/product (accessed on 13 April 2020).
- Amit Wireless. IOT400-DL: LoRa Node. Available online: http://www.amitwireless.com/product.php?lang=3&cate=1203&product_id=1202&pid=1196&pid1=124 (accessed on 13 April 2020).
- AgriSense. AgriSense MicroUnits. Available online: http://agrisense.io/ (accessed on 13 April 2020).
- ICT International. IoT Nodes Products. Available online: http://www.ictinternational.com/products/iot-sensors/nodes/ (accessed on 13 April 2020).
- TekBox. TekBox Digital Solutions. Available online: https://www.tekbox.com/ (accessed on 13 April 2020).
- Vinduino. Vinduino R3 Sensor Station. Available online: https://www.vinduino.com/products/ (accessed on 13 April 2020).
- ZigBee Alliance. ZigBee Cluster Library Specification; ZigBee Alliance: Davis, CA, USA, 2016. [Google Scholar]
- Valente, A. MEMS Devices in Agriculture. In Advanced Mechatronics and MEMS Devices II; Springer: Cham, Switzerland, 2017; pp. 367–385. [Google Scholar] [CrossRef]
- Santos, L.C.; Santos, F.N.; Solteiro Pires, E.J.; Valente, A.; Costa, P.; Magalhaes, S. Path Planning for ground robots in agriculture: A short review. In Proceedings of the 2020 IEEE International Conference on Autonomous Robot Systems and Competitions (ICARSC), Ponta Delgada, Portugal, 15–17 April 2020; IEEE: Piscataway, NJ, USA, 2020; pp. 61–66. [Google Scholar] [CrossRef]
- Gebbers, R.; Adamchuk, V.I. Precision agriculture and food security. Science 2010, 327, 828–831. [Google Scholar] [CrossRef] [PubMed]
- Chen, M.; Tang, Y.; Zou, X.; Huang, K.; Huang, Z.; Zhou, H.; Wang, C.; Lian, G. Three-dimensional perception of orchard banana central stock enhanced by adaptive multi-vision technology. Comput. Electron. Agric. 2020, 174, 105508. [Google Scholar] [CrossRef]
- Ge, L.; Yang, Z.; Sun, Z.; Zhang, G.; Zhang, M.; Zhang, K.; Zhang, C.; Tan, Y.; Li, W. A method for broccoli seedling recognition in natural environment based on binocular stereo vision and gaussian mixture model. Sensors 2019, 19, 1132. [Google Scholar] [CrossRef] [PubMed] [Green Version]
- García Cárdenas, D.A.; Ramón Valencia, J.A.; Alzate Velásquez, D.F.; Palacios Gonzalez, J.R. Dynamics of the Indices NDVI and GNDVI in a Rice Growing in Its Reproduction Phase from Multi-spectral Aerial Images Taken by Drones. In Advances in Intelligent Systems and Computing; Springe: Berlin, Germany, 2019; Volume 893, pp. 106–119. [Google Scholar] [CrossRef]
- Navulur, S.; Sastry, A.S.; Giri Prasad, M.N. Agricultural management through wireless sensors and internet of things. Int. J. Electric. Comput. Eng. 2017, 7, 3492–3499. [Google Scholar] [CrossRef] [Green Version]
- Hartung, R.; Kulau, U.; Gernert, B.; Rottmann, S.; Wolf, L. On the Experiences with Testbeds and Applications in Precision Farming. In FAILSAFE 2017—Proceedings of the 1st ACM International Workshop on the Engineering of Reliable, Robust, and Secure Embedded Wireless Sensing Systems, Part of SenSys 2017; Association for Computing Machinery, Inc.: New York, NY, USA, 2017; pp. 54–61. [Google Scholar] [CrossRef]
- Ruiz-Garcia, L.; Lunadei, L.; Barreiro, P.; Robla, I. A Review of Wireless Sensor Technologies and Applications in Agriculture and Food Industry: State of the Art and Current Trends. Sensors 2009, 9, 4728–4750. [Google Scholar] [CrossRef] [PubMed] [Green Version]
- Aqeel-Ur-Rehman; Abbasi, A.Z.; Islam, N.; Shaikh, Z.A. A review of wireless sensors and networks’ applications in agriculture. Comput. Stand. Interfaces 2014, 36, 263–270. [Google Scholar] [CrossRef]
- Anisi, M.H.; Abdul-Salaam, G.; Abdullah, A.H. A survey of wireless sensor network approaches and their energy consumption for monitoring farm fields in precision agriculture. Precis. Agric. 2015, 16, 216–238. [Google Scholar] [CrossRef]
- Kumar, S.A.; Ilango, P. The Impact of Wireless Sensor Network in the Field of Precision Agriculture: A Review. Wirel. Pers. Commun. 2018, 98, 685–698. [Google Scholar] [CrossRef]
- López Riquelme, J.A.; Soto, F.; Suardíaz, J.; Sánchez, P.; Iborra, A.; Vera, J.A. Wireless Sensor Networks for precision horticulture in Southern Spain. Comput. Electron. Agric. 2009, 68, 25–35. [Google Scholar] [CrossRef]
- Morais, R.; Fernandes, M.A.; Matos, S.G.; Serôdio, C.; Ferreira, P.J.; Reis, M.J. A ZigBee multi-powered wireless acquisition device for remote sensing applications in precision viticulture. Comput. Electron. Agric. 2008, 62, 94–106. [Google Scholar] [CrossRef]
- Abbasi, M.; Yaghmaee, M.H.; Rahnama, F. Internet of Things in agriculture: A survey. In Proceedings of the 3rd International Conference on Internet of Things and Applications, IoT 2019, Isfahan, Iran, 17–18 April 2019; Institute of Electrical and Electronics Engineers Inc.: Piscataway, NJ, USA, 2019. [Google Scholar] [CrossRef]
- Bacco, M.; Berton, A.; Ferro, E.; Gennaro, C.; Gotta, A.; Matteoli, S.; Paonessa, F.; Ruggeri, M.; Virone, G.; Zanella, A. Smart farming: Opportunities, challenges and technology enablers. In Proceedings of the In 2018 IoT Vertical and Topical Summit on Agriculture—Tuscany, IOT Tuscany 2018, Tuscany, Italy, 8–9 May 2018; Institute of Electrical and Electronics Engineers Inc.: Piscataway, NJ, USA, 2018; pp. 1–6. [Google Scholar] [CrossRef]
- Davcev, D.; Mitreski, K.; Trajkovic, S.; Nikolovski, V.; Koteli, N. IoT agriculture system based on LoRaWAN. In Proceedings of the 2018 14th IEEE International Workshop on Factory Communication Systems (WFCS), Imperia, Italy, 13–15 June 2018; Institute of Electrical and Electronics Engineers Inc.: Piscataway, NJ, USA, 2018; pp. 1–4. [Google Scholar] [CrossRef]
- Tresca, G.; Vista, F.; Boccadoro, P. Experimenting LoRa-compliant solutions in Real-World Scenarios. Internet Technol. Lett. 2020, 3, e136. [Google Scholar] [CrossRef] [Green Version]
- Ibayashi, H.; Kaneda, Y.; Imahara, J.; Oishi, N.; Kuroda, M.; Mineno, H. A reliable wireless control system for tomato hydroponics. Sensors 2016, 16, 644. [Google Scholar] [CrossRef] [PubMed] [Green Version]
- Brunelli, D.; Albanese, A.; d’Acunto, D.; Nardello, M. Energy Neutral Machine Learning Based IoT Device for Pest Detection in Precision Agriculture. IEEE Internet Things Mag. 2020, 2, 10–13. [Google Scholar] [CrossRef]
- Konstantopoulos, C.; Koutroulis, E.; Mitianoudis, N.; Bletsas, A. Converting a plant to a battery and wireless sensor with scatter radio and ultra-low cost. IEEE Trans. Instrum. Meas. 2016, 65, 388–398. [Google Scholar] [CrossRef]
- Sartori, D.; Brunelli, D. A smart sensor for precision agriculture powered by microbial fuel cells. In Proceedings of the SAS 2016—Sensors Applications Symposium, Proceedings, Catania, Italy, 20–22 April 2016; Institute of Electrical and Electronics Engineers Inc.: Piscataway, NJ, USA, 2016; pp. 42–47. [Google Scholar] [CrossRef]
- Irrometer. Watermark Sensor. Available online: https://www.irrometer.com/200ss.html (accessed on 13 April 2020).
- Sodaq. LoRa One. Available online: https://www.kickstarter.com/projects/sodaq/loraone-the-lora-iot-development-board/description (accessed on 13 April 2020).
- The Things Industries. The Thing Network. Available online: https://www.thethingsnetwork.org/ (accessed on 13 April 2020).
- ThingSpeak. ThingSpeak for IoT Projects. Available online: https://thingspeak.com/ (accessed on 13 April 2020).
- MathWorks. Matlab. Available online: https://www.mathworks.com/products/matlab.html?s_tid=hp_products_matlab (accessed on 13 April 2020).
- UNESCO. Alto Douro Wine Region. Available online: https://whc.unesco.org/en/list/1046 (accessed on 13 April 2020).
- Topp, G.C.; Davis, J.L.; Annan, A.P. Electromagnetic determination of soil water content: Measurements in coaxial transmission lines. Water Resour. Res. 1980, 16, 574–582. [Google Scholar] [CrossRef] [Green Version]
- Bouguera, T.; Diouris, J.F.; Chaillout, J.J.; Jaouadi, R.; Andrieux, G. Energy consumption model for sensor nodes based on LoRa and LoRaWAN. Sensors 2018, 18, 2104. [Google Scholar] [CrossRef] [PubMed] [Green Version]
- Digi-Key. 1597-114991726-ND SenseCap LoRaWAN Air Temperature. Available online: https://www.digikey.pt/product-detail/en/seeed-technology-co-ltd/114991726/1597-114991726-ND/11306865?_ga=2.259223117.676792370.1588071042-2020319761.1588071042 (accessed on 13 April 2020).
Figure 1.
Overview of the implemented system architecture.

Figure 2.
LoRaWAN system node overview.

Figure 3.
LoRaWAN node simplified schematic.

Figure 4.
LoRaWAN frame format.

Figure 5.
Part of the firmware algorithm. The SDI-12 related high-level pseudo-code.

Figure 6.
Serial-Digital Interface at 1200 baud (SDI-12) example of a information response frame.

Figure 7.
Example of one decode function at The Things Network (TTN).

Figure 8.
The developed LoRaWAN node.

Figure 9.
The experimental setup.

Figure 10.
Data from LoRaWAN node with 5TE and ATMOS22 sensors.

Figure 11.
Temperature data from 5TE (soil) and ATMOS22 (air).

Figure 12.
Output data from the Watermark sensor.

Figure 13.
Data from LoRaWAN node with ATMOS41 all-in-one weather station.

Figure 14.
Node working scenario. (adapted from [46]).
Figure 14.
Node working scenario. (adapted from [46]).


Table 1.
Long Rang Wide Area Network (LoRaWAN) enabled commercial solutions.
| Company | Model | Arduino | SDI-12 | Change | Agriculture Use | Easy to | ||
|---|---|---|---|---|---|---|---|---|
| Name | Like | Sensors | Envir. | Soil | Plant | Install | ||
| Vinduino | R4 Sensor Station | ✓ | possible | × | - | ✓ | - | ☺ |
| AMIT Wireless | IOT400 | ✓ | possible | ✓ | ✓ | ✓ | ✓ | ☺ |
| Seeed Studio | SenseCap | × | fixed | × | ✓ | ✓ | ✓ | ☺☺☺ |
| Decentlab | DL Series | × | fixed | × | ✓ | ✓ | ✓ | ☺☺☺ |
| Libelium | PRO | ✓ | - | ✓ | ✓ | ✓ | ✓ | ☺☺ |
| XTREME | ✓ | ✓ | ✓ | ✓ | ✓ | ✓ | ☺☺ | |
| TekBox | TBS12B | × | ✓ | only SDI-12 | ✓ | ✓ | ✓ | ☺☺ |
| TBS12S | × | ✓ | only SDI-12 | ✓ | ✓ | ✓ | ☺☺ | |
| TBSL1/RFB-LoRa | × | ✓ | ✓ | ✓ | ✓ | ✓ | ☺☺ | |
| ICT Inter. | AD-NODE | × | × | ✓ | ✓ | ✓ | ✓ | ☺☺ |
| S-NODE | × | ✓ | ✓ | ✓ | ✓ | ✓ | ☺☺ | |
| MRF-NODE | × | ✓ | ✓ | ✓ | ✓ | ✓ | ☺☺ | |
Table 2.
Time and current consumption for the node working states.
| State | Time (s) | Current (mA) |
|---|---|---|
| Wake-up system | ≈2 (SFR12) | 8 |
| Measure | ||
| Data Processing | ||
| Wake-up Transceiver | 2 | 105 |
| Data Transmission | ||
| Data Reception | 3 | 10 |
| Sleep | 3593 | 0.311 |
© 2020 by the authors. Licensee MDPI, Basel, Switzerland. This article is an open access article distributed under the terms and conditions of the Creative Commons Attribution (CC BY) license (http://creativecommons.org/licenses/by/4.0/).
Share and Cite
MDPI and ACS Style
Valente, A.; Silva, S.; Duarte, D.; Cabral Pinto, F.; Soares, S. Low-Cost LoRaWAN Node for Agro-Intelligence IoT. Electronics 2020, 9, 987. https://0-doi-org.brum.beds.ac.uk/10.3390/electronics9060987
AMA Style
Valente A, Silva S, Duarte D, Cabral Pinto F, Soares S. Low-Cost LoRaWAN Node for Agro-Intelligence IoT. Electronics. 2020; 9(6):987. https://0-doi-org.brum.beds.ac.uk/10.3390/electronics9060987
Chicago/Turabian StyleValente, Antonio, Sérgio Silva, Diogo Duarte, Filipe Cabral Pinto, and Salviano Soares. 2020. "Low-Cost LoRaWAN Node for Agro-Intelligence IoT" Electronics 9, no. 6: 987. https://0-doi-org.brum.beds.ac.uk/10.3390/electronics9060987
Note that from the first issue of 2016, this journal uses article numbers instead of page numbers. See further details here.