1. Introduction
The Internet of Things (IoT) is a new paradigm in which several devices are interconnected to monitor activities and extract information that can be useful for different purposes. Advances in the design of sensors and communications have allowed the development of IoT networks in different fields, such as smart cities [
1], the agroindustry [
2], economics [
3], and healthcare [
4,
5].
The advantages of IoT networks are essential for industry to optimize their resources and benefits. Companies, like Bosch, Repsol, and Thyssenkrupp, have applied the IoT to retrieve information and improve their services. IoT is especially important for companies when the number of users of those services increases as it provides additional benefits, such as in airports. More users are using airports to travel, either for business or pleasure. According to [
6], the international tourist arrivals increased to 1.186 billion in 2015. This number is going to keep growing in the next years. This fact, together with the current COVID-19 situation, has created an ideal scenario to apply intelligent trategies [
7] and maximize the comfort and satisfaction of travellers during their use of airports.
One of the services that usually receives the highest number of complaints is the maintenance of the toilets. It is also one of the places where the visitors can catch COVID-19 more easily [
8]. Currently, these companies must address how to plan cleaning shifts, control the capacity of toilets, and the lack of soap or paper. Some of these tasks are usually challenging, as predicting how many users will need the toilet in the next few hours is a complex task. We constructed an IoT system based on a sensors network to improve the user’s experience and optimize company resources. This system combines the information provided by different sensors mechanisms to determine the status of toilets and improve the cleaning services.
An IoT network needs two main components: communication and sensors. For two devices to communicate, different technologies have been developed, including Wi-Fi, RFID, and Bluetooth. In [
9], the authors compared energy consumption with the use of the LoRa protocol in the communication of the data. The results showed promise in conjunction with other protocols. However, these technologies usually have a limited range and they consume a large amount of resources. Recently, a new communication protocol, called LoRa, was developed. The main advantage of LoRa compared with Wi-Fi or Bluetooth is its low power requirement and long-range capability. Therefore, we selected LoRa as our communication channel to improve the communications among devices in IoT networks.
To connect the devices and construct a new architecture, we combined a multi-agent system with LoRa protocol [
10] and devices that detect the user’s activity and the soap load. We incorporated load cells, such as Wheatstone bridges, PIRs, and time of flight devices, in order to detect users’ movements and the soap levels. An architecture of these characteristics must implement a behavior that can adapt to possible errors or changes that may occur in the environment or the system, such as possible failings or changes in the monitoring areas. Modelling the system as a multi-agent system (MAS) enabled the description of the elements of a specific architecture and the incorporation of mechanisms that provide the system with the needed robustness to cope with the dynamic changes that may occur during operation.
The remainder of the paper is structured, as follows:
Section 2 provides a brief background about the communication protocol and the sensors applied in the present work.
Section 3 describes the proposed architecture.
Section 4 outlines technical details of the developed case study. Finally,
Section 5 describes the results, along with the discussion and conclusions.
2. Background
Nowadays, IoT systems are widely used in different applications, including the airport management. One of the main topics addressed is the security. Li et al. [
11] propose a novel radar system to detect objects or drones. It makes use of Wi-Fi connection to communicate the sensors and obtain information. Martelli et al. [
12] also develop a multi-sensor network to detect drones near the airport space. The system includes the use of infrarred sensors, camera, and radars that are connected via Wi-Fi. Galati et al. [
13] generate a system that is capable of detecting drones and intruder through a sensor network connected by Wi-Fi.
The current situation with the COVID-19 pandemic has encouraged to many scientists to propose solutions that involve new technologies and sensors to control crowds or maximize cleaning issues. There are some works that develop a mobile platform that traces the position of the user to control contact between people [
14,
15,
16]. However, most part of the recent literature that involves new technologies and COVID-19 have been centered on improving smart cities [
5], or, above all, in healthcare to improve the situation of patients or the efficiency of the health system [
17,
18].
In general contexts, there are interesting developments to manage the airport resources. Milbredth et al. [
19] manage the traffic in airports by detecting the position of passengers and aircrafts and transmitting this information through a Wi-Fi connection. Toth et al. [
20] monitor the trajectory of an aircraft through a complex sensor network that gives information of the topography, air, objects, etc. Other proposals try to improve the experience at the airport. This is the case of the work proposed by [
21], which develops a guidance system that helps passengers to move in the airport. Nuijten et al. [
22] propose a sensor network to detect and predict conditions for possible slippery and get the best decision to avoid it. Ghazal et al. [
23] create a mobile application that is based on QR Codes and Wi-Fi connection to track your luggage in the airport.
After a deep study of the state of the art, we detect two limitations. Firstly, most part of the solutions are centered in security and transport problems in airports, rather than in the cleaning services. However, such services are currently essential in order to minimize the number of infections of COVID-19 as much as possible. Additionally, the use of Wi-Fi connection, despite its advantages, increase the consumption levels regarding energy and resources, as this kind of connection hast a low range, and usually requires the installation of a high number of devices. Therefore, we propose an IoT system for the management of cleaning services, applying a new protocol, called LoRa, in order to communicate sensors for localization and levels measurement.
Two main challenges are then present: make them communicate; handle their energy consumption while respecting some cost constraints. Low-power wide area networks (LPWANs) tackle these challenges by offering long-distance coverage while guaranteeing the use of a very little amount of energy for communications. Among many LPWAN technologies, long range (LoRa) networks provide a very promising but incomplete basis for satisfying the needs expressed by the applications running on low-power devices [
24]. They will ease the connection of billions of low-power devices to the Internet, thus increasing the M2M traffic that is offered for novel IoT applications [
25].
LoRa technology has been applied to smart cities [
26], indoor localization [
27] and PV Panels [
28]. The advantages shown in these works against Wi-Fi and similar standards include the low cost of maintenance, the high range, and the facility of installation and communication of IoT heterogeneous devices. LoRa is also preferred to mount sensor networks, as is demonstrated in works like [
29,
30]. Drawing on the positive results in previous works, this work will present an IoT network whose devices are communicated via a LoRa protocol.
When dealing with IoT networks, not only the communication technology that will be used has to be considered, but also the sensors that will be applied to create the system. Currently, there is a growing interest in reducing costs of power generation, transmission, and consumption of electrical energy through efficient energy management, as well as the possibility of extending the lifespan of power system components and users appliances. These features are of particular interest for our problem, as it supposes an important energy and logistic saving. Therefore, this work makes use of sensors that reduces energy costs and extends the life of the components, such as PIRs, Wheatstone bridges, and time of flights.
We apply PIR and Time of Flight sensors to detect user‘s presence and movement. PIR are switching devices that respond to the presence and absence of people in its field of view [
31]. Its low cost design makes PIR sensor an ideal option for monitory purposes, as demonstrated in [
32]. Likewise, time of flight sensors are a highly accurate technology, capable of mapping objects and measuring distances mapping and 3D imaging technology with a single shot [
33], which makes it an ideal option to detect objects saving energy and time (Ringbeck, n.d.). There are a few applications that demonstrate their successful results to construct collaborative robots [
34], to help people with visual difficulties [
35,
36], or to detect fluids in channels [
37].
A load cell is needed in order to measure the soap load. Wheatstone bridges are low cost sensors that are used for measuring the very low resistance values precisely. Applications include calculations of hydrogene levels or gases levels in a recipient [
38,
39], in order to measure the wind speed and direction [
40] or for tactile touch monitoring [
41]. Accordingly, with these sensors, the system obtained the state of the bathrooms. This information can be used to help the airport cleaners and minimize the time that they spend cleaning the bathrooms and maximize the satisfaction of the airport’s users. Therefore, a fuzzy control system is proposed to determinate when a bathroom needs cleaning. Fuzzy control systems have been applied in the field of airports [
42,
43,
44]. However, none of them are applied to the task of bathroom cleaning.
3. Proposed Architecture
The architecture that is proposed in this section provides a solution to a problem that occurs in different environments. The Internet of Things (IoT) aims to maximize the use of devices with limited resources and low cost, such as microcontrollers that have low processing power and low energy consumption. In an IoT architecture, one of the main characteristics is the hybrid and dynamic topologies that can offer service availability, high security, and data redundancy. The architecture of these characteristics must have the ability to adapt to anomalies, errors, or changes that may occur in the network, such as the appearance of a new area to monitor or a sensor that stops working. One of the characteristics of this architecture is a design that is based on organizational theory, which can both imitate and collaborate with human organizations, such as a team responsible for cleaning bathrooms. Multi-agent architectures do not have organizational aspects that allow the definition of rules for the incorporation of new agents, or the reorganizations and defined communications with the system.
Given the requirements that are described above, we propose using a multi-agent system (MAS) platform for automatic construction of organizations of intelligent agents (PANGEA) as a starting point. PANGEA allows elements to dynamically move in and out of the platform, and it can be part of the architecture at any time satisfying the specific demands of the system. MAS architectures have to offer services on demand, because agents, when they join the network, are responsible for reporting the services they have and can offer to other entities within the architecture market.
Figure 1 Multi-agent architecture of system based in PANGEA shows the different virtual organizations and main agents that compose the multi-agent architecture designed for this system.
PANGEA is an open system that we previously developed; we have extensive experience with the integration of PANGEA with many systems based on wireless sensor networks. The principal decision to use PANGEA was based on its ability to create virtual organizations, which are characterized by their dynamic nature. PANGEA is a free to anyone or any research group who wants to use it. What distinguishes PANGEA from the different multi-agent systems is its rule engine and load distribution, which enable the system to adapt to the computational needs of the system at any given time. The last characteristic that distinguishes PANGEA from other systems, such as THOMAS or the java agent development framework (JADE), is that it allows computing features.
The designed architecture is composed of two different parts. The top of
Figure 1 shows the minimum agents for the operation of the PANGEA multi-agent system; the bottom shows the virtual organizations upon which the case study was based.
The organizations are detailed, as follows:
Organization Smart Monitoring: This organization refers to the extraction and collection of information from different sensors. Its main functionality is based on transforming the data of the physical layer, so that it can be used by other organizations. Communications that occur with agents are one-way with the central agent, which is in charge of communications with the other architecture organizations. These agents are deployed in the nodes; the central node represents the microcontroller and the others represent the attached sensors.
Table 1 describes the hardware agents of this organization, which represent the hardware sensors.
Organization Control Center: this organization monitors the agents that belong to organization smart monitoring. The most important task of this organization is intelligence in information analysis and prediction based on the information collected from the sensors. The main agent of this organization is the cleaner, which is in charge of coordinating the monitoring, analysis, and alert generation tasks. These alerts are generated in the event of an anomaly in a reading from the sensors, or if it is necessary to perform cleaning, reloading some roll of toilet paper, or refilling soap. These notifications are sent to the nearest cleaner’s mobile device or to the person in charge of the task in the area. The analysis agent is responsible for using the information obtained from the organization smart monitoring to determine if the bathrooms need to be maintained. To solve this problem, the agent has an intelligent fuzzy logic system. The fuzzy system uses the information stored in the database to determine an action in the system. In the proposed method, the actions are sent to notify the cleaners if a bathroom in the system needs cleaning. This agent can obtain and report metrics regarding people in a certain space. This agent can notify security agents or gambling controllers if gambling is not being respected in certain rooms or areas.
Organization Application Interface: this organization can adapt the information generated by the other organizations to the application layer. This organization is the interface; the applications that belong to this organization can interact directly with the system. As an example, in this case study, an external device may require functionality in the system or any application that workers carry on their mobile devices. The data are adapted from raw format to a format that can be easily understood by a human. In this case study, several connectors or gateways were provided so that the information could be represented both by the mobile application, web app, or external applications.
PANGEA Multi-Agent System: as mentioned above, this organization is composed of the minimum agents for the PANGEA system to work. The agents of this organization are specialized in managing virtual organizations and each of their agents. Below, the basic functionality of each of the agents of this organization is described.
- —
Database Agent: the only agent with access privileges to the database. This agent provides persistent information storage within the organization. It is responsible for making backups and ensuring the consistency of information.
- —
Information Agent: manages the services within the virtual organization. It has access to the directory and allows the other agents to publish the services that each one has available that can be accessed by the others. When a new device or application uses the architecture for the first time, the corresponding agent must consult the services that are offered by the virtual organization.
- —
Normative Agent: one of the most important components in a virtual organization is the rules used for governance. This agent is responsible for security when establishing connections between devices.
- —
Service Agent: this agent distributes functionality through web services. It is the gateway that allows communication of external services with the agents of the organization. It is used as an abstraction layer of the internal architecture and allows easy integration of different programming languages.
- —
Manager Agent: in charge of checking the state of the system periodically, verifying whether there is any overloaded functionality, and ensuring that there are no errors between the agents of different organizations.
- —
Organization Agent: responsible for verifying all operations of virtual organizations, checking security and load balancing, and offering encryption among the most important agents.
The APP monitoring database includes different types information, such as the values at which alerts are generated and the geographical locations of each of the sensors. This database is synchronized with the central server to manage cleanings.
The architecture that is described above was used in the case study due to the robustness offered by PANGEA, which allows the dynamic integration of new sensor functionalities without affecting the other parts of the system. One of the main characteristics of the architecture is that it allows for the acquisition and processing of information independent of the technology used by the sensors, being able to easily adapt to each case of the specific application. Finally, this architecture based on PANGEA was designed based on our previous experience of the development of this multi-agent system and understanding of the robustness it offers.
4. Case Study
This section presents the case study of the application of a monitoring system for optimizing resources and improving the cleanliness of the bathrooms in a low-cost building, monitoring capacity, helping to maintain existing regulations and social distancing, and a multi-agent system that allows the fusion of captured information from different sensors. In the first phase, the system of the devices was installed in the public toilets of the Santander and Malaga airports in Spain in order to test the application prior to installation at all of the airports in Spain.
It was necessary to identify the largest number of metrics that can influence the cleanliness of the bathrooms or their state to monitor the state of the bathrooms. Various nodes were developed to obtain these metrics wirelessly. The metrics captured by these nodes include the flow of people in a given interval, the percentage of paper available on a roll of paper, and the percentage of soap available in a soap dispenser. We also obtained environmental metrics, such as luminosity, temperature, and humidity.
A device must be used to warn the user at the time of entry if they can continue or must stop in order to control gauging and determine the current state of the bathroom to let people know whether they can enter or must wait.
In IoT devices, the electrical consumption of a device is important. In some cases, these can be connected to the electrical network, which can be a minor problem, but for autonomous devices such as people-counting devices, soap dispensers, toilet paper dispensers and indicator devices in all bathrooms in an airport, electrical installations cannot be provided for each of the devices due to the high cost of installation. Apart from being economically unfeasible, the regulation imposed by the airport regulatory entity regarding the installation of devices states that the installation must be reversible, which is, they must be able to be removed without leaving a trace of existence. Given this context, the main requirement is that the monitoring nodes have low power consumption. The low power consumption of the devices is affected both by the consumption of the microcontroller and the communication required to send the data, since their communication must be wireless.
Given the data produced by the sensors in the system, it will be carried out for long periods of more than several minutes, and very small amounts of data, such as four bytes. We were interested in the system being low-cost with a large nominal range that consumes the least amount of energy possible. Of the analyzed technologies, we opted for the LoRaWAN technology. The communication is explained in detail in
Section 4.1.
In order to evaluate the proposed system, visualization applications were developed to monitor the global state of the system and the application for workers so they can identify the toilets to be cleaned and determine the status of each toilet paper roll, soap dispenser, and fill status of the waste bins. These applications are described in detail in
Section 4.6.
4.1. LoRa and LoRaWAN
The LoRa technology is separated into three parts: the physical layer, which is patented by Semtech, the MAC layer of the protocol, and the network architecture, called LoRaWAN. The physical layer can operate different frequency bands such as 433, 868, or 915 MHz; in Europe, it can only operate on the 868 and 915 MHz frequencies. In the physical layer, spread spectrum modulation and error correction techniques are used to create robust communications against noise and interference in order to increase receiver sensitivity. LoRaWAN architecture was previously used in monitoring tasks, as described in the previous sections.
The LoRaWAN network architecture uses a star topology, where end devices can only communicate with LoRaWAN gateways and not directly with other end nodes. The gateways are connected to the central server. Gateways are only responsible for routing packets from end nodes to the server in raw format. LoRa’s server is responsible for sending downlink packets to devices if necessary.
As for the end nodes of a LoRaWAN network, the standard defines three classes. Class A is supported by almost all devices because it is the one that offers higher energy savings, since it only enters listening mode after sending data to the gateway, which is ideal for devices that use a battery as a source of power. In class B, the devices have reception windows that are based on predetermined times with the gateway. Currently, some services offer this implementation. Class C offers less energy savings because the nodes are always in listening mode and only when necessary do they change their mode to transmission mode, normally used in devices that have a power supply.
The next step after selecting LoRaWAN was the selection of the LoRaWAN network server type and all the software involved. For a deployment, there are three types of possibilities that offer the same functionality, but with different prices and responsibilities. The first option is to use an implementation of the LoRaWAN network server provided by a company, such as The Things Industries (TTI), which offers turnkey solutions for infrastructure and data storage and analysis. The second option on the market is a collaborative solution, such as The Things Network (TTN), which provides a self-hosted solution, in which they are in charge of deploying and maintaining the LoRaWAN server, but the gateways are deployed by the community. These are used by all the nodes that use that platform. The last option available is the free and open option, such as LoRa (LoRaserver.io), which provides all of the software for the implementation of the functionality required for LoRaWAN to work, especially the LoRa gateway bridge (forwarder package), LoRaWAN network server, and LoRaWAN application server. The maintenance of the network, the host, and the applications is the responsibility of the user.
Two conditions were considered when choosing the network server. The first condition was imposed by the company requesting the system, which indicated that the system should be closed regarding the deployment of nodes, such as in an airport. With this restriction, collaborative solutions, such as TTN, were discarded. The other condition was that it should be inexpensive. Given these conditions, we chose to implement the LoRaWAN closed network server using the software provided by
LoRaserver.io.
In our application, the services are deployed on a single server (private LoRa server) that provides the following services: MQTT broker, LoRa server, and the LoRa APP server.
Figure 2 shows the architecture used for the deployment of a private LoRa server network. Deployment can be performed by providing all of the necessary services on a single server or on independent or replicated servers to increase availability and replicate the system. These services can be easily separated in the future without affecting the system. The LoRa packet-forwarder and LoRa gateway were deployed on each of the network gateways.
4.2. LoRa Network Protocol and LoRa Frame Format
The LoRa protocol was developed by LoRa Alliance. LoRaWAN’s protocol consists of a MAC layer, and an application layer; its operates on the LoRa physical layer.
Figure 3 shows the LoRa frame structure for the physical, MAC, and application layers.
The physical layer starts with a preamble. The preamble of synchronization defines the packet modulation scheme. The preamble is followed by the physical header and header CRC. The physical header contains information about the length of the physical layer payload. The physical payload contains a MAC frame. The CRC payload is present in the LoRa physical frame, but it is only present in UPLINKS.
The MAC layer consists of a MAC header, a MAC payload, and message integrity code (MIC). In the MAC header, the protocol version of message is defined. The MAC payload contains all frames of the application layer. The MAC header and protocol are used to compute the MIC value with a network session key. The MIC value validates whether messages sent by the node were previously authenticated in the network.
The application layer contains the frame header, port, and payload. The frame header includes a device address and any frame parameters. The frame port depends on the application. The frame payload value is encrypted with value from the app session key. This frame payload is used for sending data from the end nodes to our application.
4.3. Gateway LoRa
When choosing the LoRa gateway, two main characteristics were considered: (1) the need for the support of downlinks, so that the messages can be confirmed once the messages are received by the LoRa network server. Downlinks are also necessary to remotely change the configuration of the node, such as the transmission frequency. (2) Low cost was the other consideration. Given the other elements of the system, the dual-channel Draginos gateway was chosen due to these characteristics. Because the network that was deployed is privately owned, the number of nodes is not excessively high.
4.4. Monitoring Nodes
This section presents the different nodes that have been developed to carry out the complete monitoring of the toilets. These nodes are intended to measure the greatest number of metrics that may affect or that can indicate the state of the toilets. For this, the first metric that is considered to be necessary to know for monitoring is to know the flow of people who accessed the bathrooms for a moment of time. Another piece of information requested by the cleaning experts was to know exactly the level of the hand soap dispensers and the paper available in each of the dispensers on the assigned route, in order to optimize the amount to move both soap and of paper before the completion of the route, without the need to make extra trips for more quantities or carry too many.
Next, the microcontroller used as the basis for each of the nodes will be explained, and the technical specifications of each of the monitoring nodes will also be detailed.
4.4.1. Microcontroller and LoRa Transmissor
A microcontroller unit is used to manage each of the end nodes and to capture the values of the different sensors and send them to the LoRaWAN network. The LoRa frame is generated by the MCU and it is sent by the LoRa transmitter. This process is coupled due to the existence of devices that integrate a microcontroller and a LoRa transmitter on the same board on the market. Rocket Scream’s Mini Ultra Pro node has been used as a low-power version of the Arduino Zero. It features an ARM Cortex M0 + ATSAMD21G18A 32 bit to 48 MHz processor that provides high processing power capacity and a low price.
This node has an RFM95W module as a LoRa long-range modem that provides high immunity against interference with low power consumption. This module has been tested in urban areas and with a spreading factor of 12, with a 15 dBi antenna, a power of 20 dBm, and reaching distances of 8 km.
In the node, there are characteristics that differentiate it from others, which we considered when selecting this node as a basis for the development of the final nodes of the network. The first characteristic is related to the energy consumption of the device when it is in sleep mode, which is only 20.0 A. The nodes are in this mode most of the time; they only leave this mode when a person passes through the device, when they have to measure the factors to be monitored and send the messages. The second characteristic that was considered for the choice of the node was that the board incorporates an RTC device with calendar support. This can be achieved with periodic-sending nodes that can simultaneously receive external interruptions that allow for it to be lifted from deep sleep mode. Another important feature of this node is the incorporation of a voltage sensor that allows the remote monitoring of the battery status. The last characteristic that led to the choice of these nodes was that their development was under the open-source license, which allows future adjustments or the creation of hardware with the integrated sensors.
4.4.2. People Counter
People counting is a spatiotemporal function of human perception at any given time in a particular area. People counting is useful because it helps to understand the flow of people. The constant movement of people, different age groups, and different body types make counting people a challenging task. The people counter also includes an integrated ambient temperature and humidity sensor so they are also able to monitor two of the most important environmental constants at precise locations.
The people detector consists of a passive pyroelectric sensor, which is capable of detecting infrared emission. The human body emits this type of radiation due to being warmer than the surrounding environment.
A pyroelectric sensor has an element that is sensitive to small changes in temperature. A black coating on the element absorbs infrared radiation in the form of heat, minimally heating the pyroelectric element. A compensation element mounted next to the sensor ensures that changes in the external temperature do not affect the measurement. As such, the sensor is only dependent on the temperature variation produced by infrared radiation.
The tiny signal that is produced by the sensor is amplified by very low noise JFET field junction transistors. A light filter in the front of the sensor ensures that it only passes infrared radiation of a certain frequency in order to prevent other types of radiation, such as visible light, from affecting the sensor.
The model of pyroelectric sensor used is HC-501. Its principal characteristics that we came to use is because its current in normal use is less than 50 A and your possibility that wake up from deep sleep the microcontroller with your incorporated trigger when the sensor is activated by the detection of a human. The sensor’s angle of actuation is 110 degrees, which can cover most of the doors at 8 m width if the sensor is placed at one distance of 3.2 m of the floor.
The environmental temperature and humidity sensors are integrated into the same digital sensor, which is an SHT21 integrated circuit. The integrated circuit includes the temperature sensor, the humidity sensor, an AD converter, and an inter-integrated circuit (I2C) digital interface.
The first cause that comes us to use this sensor is your power consumption. In sleep mode, this sensor only consumes 0.4 A and in measuring mode this sensor consumes 333 A.
The temperature sensor is based on the small change in conductivity of a silicon PN junction when its temperature changes. The signal produced is amplified and converted into digital data inside the sensor.
The humidity sensor has an external element with variable capacitance, depending on the amount of water vapor in the atmosphere. The variation in the capacitance is detected and amplified for its subsequent conversion to digital data.
The sensor sends the temperature and relative humidity data directly in digital values through an I2C serial interface.
The data sent by this sensor in the application layer payload, described in
Section 4.2, of the LoRa network, are shown in
Table 4. The fist byte, the battery, is encoded from 0% to 100%; the next two bytes are reserved for the number of people counted since the last sending of data to the server, with a range of a 16 bit signed integer. The last bytes provide data from the temperature sensor and relative sensor humidity.
Our custom electronic diagram of the sensor is shown in
Figure 4a, with its placement in the door shown in
Figure 4b.
4.4.3. Soap Dispenser
Monitoring the amount of soap in each of the different dispensers in public services is useful when optimizing bathroom cleaning hours and the speed of soap renewal in the event of a low level. It can also be used as an extra element for monitoring the relative number of people who use the service.
The soap dispenser is mounted on an electronic pressure sensor that measures the weight of the entire assembly, determining the amount of soap by relating the weight to the density.
A load cell is a sensor that uses a series of pressure transducer elements together in order to obtain a measurement of a force with very high precision. Strain gauges are the transducers used in load cells. They are able to modify their resistance according to an external physical deformation or pressure. This type of transducer is considerably affected by temperature changes, leading to unstable measurements in a variable temperature environment.
Using four strain gauges in an electronic configuration, called the Wheatstone bridge [
45] (
Figure 5), high measurement accuracy is achieved while minimizing the negative effect of temperature on the transducers.
When applying a force on the load cell, two diagonally opposite transducers are excited by compression (positive pressure), while the other two located on the other diagonal of the Wheatstone bridge are excited by decompression (negative pressure). In this way, the electrical resistance of the transducers changes oppositely in pairs, resulting in a variation in the output voltage of the Wheatstone bridge (Equation (
1)).
This voltage is too small to be used directly by a microcontroller; therefore, it needs to be amplified. For this purpose, an HX711 integrated circuit is used to amplify the signal from the Wheatstone bridge and digitally convert and encode the measurement. Subsequently, a microcontroller can directly use the data without performing any type of analog–digital conversion.
The HX711 in sleep mode the power consumption is less than 1 A and in normal mode is the approx. of 1.6mA. The model of load ceil is CZL635, it can translate up to 20 kg of pressure to electric signal than is used by HX711 to calculate the total weight of the device.
Unlike the previous sensor, the data can be encoded in two bytes (
Table 5). The first byte represents the percentage of the battery and the second one, the percentage of soap inside the dispenser.
Figure 6a shows our custom diagram of the sensor;
Figure 6b shows the placement of the load cell sensor to load soap dispenser.
4.4.4. Toilet Paper Dispenser
Like the soap dispensers that are explained above, monitoring the amount of toilet paper in each toilet considerably increases the efficiency of cleaning times, which, in turn, improves the optimization and speed when changing paper rolls. The amount of paper in real time is information that can be contrasted with the data provided by other sensors and, therefore, increase the precision of the measurement of the number of people.
We can calculate the amount of paper by measuring the radius of the toilet paper roll. This requires the sensor to be calibrated beforehand, so that the system knows its thickness.
In a roll cross-section, the area of the circular crown formed by the inside and the outside diameters of the roll correspond to the amount of toilet paper. Likewise, in a cross-section of the fully unrolled paper, the total length of the paper and its thickness form another area that, by definition of the problem, must be the same as the area of the circular crown calculated by the internal and external diameters of the roll. This is illustrated in
Figure 7a,b. With the thickness measurement, we can apply Equation (
2) and calculate the length from the measured radius.
For this purpose, a digital time of flight (ToF) sensor measures the distance by emitting a laser pulse and measuring the time that it takes to return to a detector on the same sensor. Using the speed of light (299,792,458 m/s) and the time measured by the sensor, the distance from the sensor to the roll is obtained, and thereby the radius of the roll.
Using the equation defined below and the value of the paper thickness, obtained while using the previously defined calibration equation, the remaining length of paper and, therefore, the remaining percentage of paper, are obtained with high accuracy.
The model of sensor used in this case is VL53L0X. Its have a nominal range at 2 m, but the principal characteristic that comes us to choose this sensor is your resolution that is 1 mm with a 3% error. This resolution permits calculating the exact percentage of paper available in the dispenser.
The data that are obtained from the sensor are encoded in the remaining paper percentage and sent via LoRa using the same frame model as the two-byte sensor above (
Table 6).
Figure 8a shows our custom diagram of the sensor and
Figure 8b shows the placement of the laser sensor inside the paper dispenser.
4.4.5. Garbage Bin
The last of the devices developed to monitor of public baths is the monitoring of garbage bins. The state of a litter bin can describe the state of cleanliness of the bathroom, according to experts. This is why we been decided to incorporate this monitoring into the bins to decide whether it is necessary to collect the garbage and clean the bathroom.
Low-cost sensors were incorporated to determine two types of metrics to monitor the garbage bins: (1) the percentage of filling of the paper mill. To calculate this metric, we decided to use a sensor of distance placed in the upper side of the bin, as identifying the distance to the bottom of the bin would determine the percentage of filling. (2) The second metric was used to monitor the weight of the bin, which is important for larger bins, as there is a limit on the number of bins a worker can pick up without exceeding the recommended weight on their transport trolleys.
To detect the weight, the same mechanism, as described in
Section 4.4.3, was used, but after several attempts, the best result was the placement of a load cell in each of the four lower corners of the bin.
For the volumetric sensor, although it was tested with different sensors, the sensors that offered the best results were the ultrasonic sensors that are completely directional when compared to the laser sensors, such as the sensor used in the toilet paper dispenser. Ultrasonic sensors have a larger degree of openness during detection, reaching 15 degrees. The sensor used in this case is GY-US42, it includes an internal MCU to calculate the distance and send it by I2C serial interface, the power consumption of this sensor is approx. of 9mA in normal use.
Unlike the previous sensors, the data can be encoded in three bytes (
Table 7). The first byte represents the percentage of the battery, the second represents the percentage of filling, and the last represents the weight of the garbage.
The sensor is depicted in
Figure 9a,b shows the placements of the ultrasound sensor on top of trash and the installed load cells under the trash.
4.5. Fuzzy Logic System
One of the contributions of this work is the implementation of an intelligent Mamdani fuzzy system in order to determinate whether a bathroom needs to be checked. In the current section, we explain how the system is configured. As a Mamdani fuzzy system uses a series of rules that try to imitate the behavior of a human expert, both the rules and fuzzy variables were defined with the help of airport cleaners with the experience to ensure the effectiveness of the fuzzy system.
The fuzzy system was tested in the MATLAB module Simulink, which allowed us to deploy a system and visualize its behavior. The fuzzy system was designed considering the opinion of experts in the field. The system contains a series of variables with different possible states. These states are usually fuzzy states, the limits of which limits have to be defined to identify when a variable changes state. Hence, according to the experience of the airport cleaners, the membership functions of the variables were defined, as illustrated in
Table 8. The variables are related to the data that were obtained from the Organization Smart Monitoring. The system includes one input for every sensor. In the case where the bathroom includes several sensors of the same type, the fuzzy system includes an input for every deployed sensor. This was the case considered in this study, where the system was tested on a bathroom with one people count sensor, three paper count sensors, three gel soap count sensors, three hydroalcoholic gel count sensors, and two trash count sensors. The membership function for every input was defined according to the advice of the airport cleaners. The toilet paper, soap, and hydroalcoholic gel membership functions are identical, with five different states; the trash function has another five states. The people count sensor has five different membership functions.
In order to better understand the information gathered in
Table 8, we decided to include
Figure 10, where the membership functions of the different variables defined in the table are displayed visually.
The fuzzy system must also have membership functions for the output variable, as shown in
Table 9. As the fuzzy system only has two possible actions (to clean or not to clean), the output only provides two possible states: “Clean” and “Do not clean”. The first state has a value that is close to one and the second has a value close to zero.
Figure 11 visually displays the same information shown in the table.
Once the variables’ intervals were defined, we defined the rules that were considered to respond to the system. In this step, the airport cleaners were consulted to define the most appropriate rules. Accordingly, the rules for the current fuzzy system were defined, as follows (the number after each rule indicates the weight of each rule; the weight can be assigned a value from 0 to 1; the higher the value, the more relevant it is):
IF (“people” IS “much”) OR (“people” IS “too much”) OR (“paper1” IS “very low”) OR (“paper2” IS “very low”) OR (“paper3” IS “very low”) OR ((“gel1” IS “very low”) AND (“gel2” IS “very low”) AND ( “gel3” IS “very low”)) OR ((“hydroalcoholic gel1” IS “very low”) AND (“hydroalcoholic gel2” IS “very low”) AND (“hydroalcoholic gel3” IS “very low”)) OR ((“trash1” IS “full”) AND (“trash2” IS “full”)) THEN (“output” IS “clean”) (1)
IF (“people” IS “normal”) AND ((“paper1” IS “low”) OR (“paper2” IS “low”) OR (“paper3” IS “low”)) AND ((“gel1” IS “low”) AND (“gel2” IS “low”) AND (“gel3” IS “low”)) AND ((“hydroalcoholic gel1” IS “low”) OR (“hydroalcoholic gel2” IS “low”) OR (“hydroalcoholic gel3” IS “low”)) AND ((“trash1” IS “lot”) OR (“trash2” IS “lot”)) THEN (“output” IS “clean”) (0.5)
IF (“people” IS “normal”) AND (“trash1” IS “lot”) AND (“trash2” IS “lot”) THEN (“output” IS “clean”) (0.5)
IF (“people” IS “normal”) AND (“hydroalcoholic gel1” IS “low”) AND (“hydroalcoholic gel2” IS “low”) AND (“hydroalcoholic gel3” IS “low”) THEN (“output” IS “clean”) (0.5)
IF (“people” IS “normal”) AND ((“paper1” IS “low”) OR (“paper2” IS “low”) OR (“paper3” IS “low”)) THEN (“output” IS “clean”) (0.5)
IF (“people” IS “few”) OR (“people” IS “very few”) THEN (“output” IS “no clean”) (0.5)
ELSE THEN (“output” IS “no clean”) (0.5)
Hence, the fuzzy system guarantees cleaning action when any of the sensors reach some of their negative limits (rule number one), according to these rules. The fuzzy system controls when several sensors are close to their negative limits and places them earlier in the cleaning order (rules number two and three). The rest of the possible combinations propose a “do not clean” action. The MATLAB module does not allow for the combination of “AND” and “OR” operators, so, in the case study, the fuzzy system has to include more rules to integrate all the possible combinations of rules number one, two, five, and six.
4.6. Developed Prototype
This section describes the prototypes and modifications to existing devices that were implemented for the validation and deployment of the system at airports. We also describe some of the features of the software that was developed and some of the additional features that were implemented in the architecture that uses PANGEA and the LoRaWAN as a means of intercommunication.
All of the sensor devices of the system were designed to perform without the need for power; each device is powered by type CR18650 rechargeable batteries. The only device that has some requirements for its installation is the Dragino dual-channel gateway. These devices require a power supply and Internet connection.
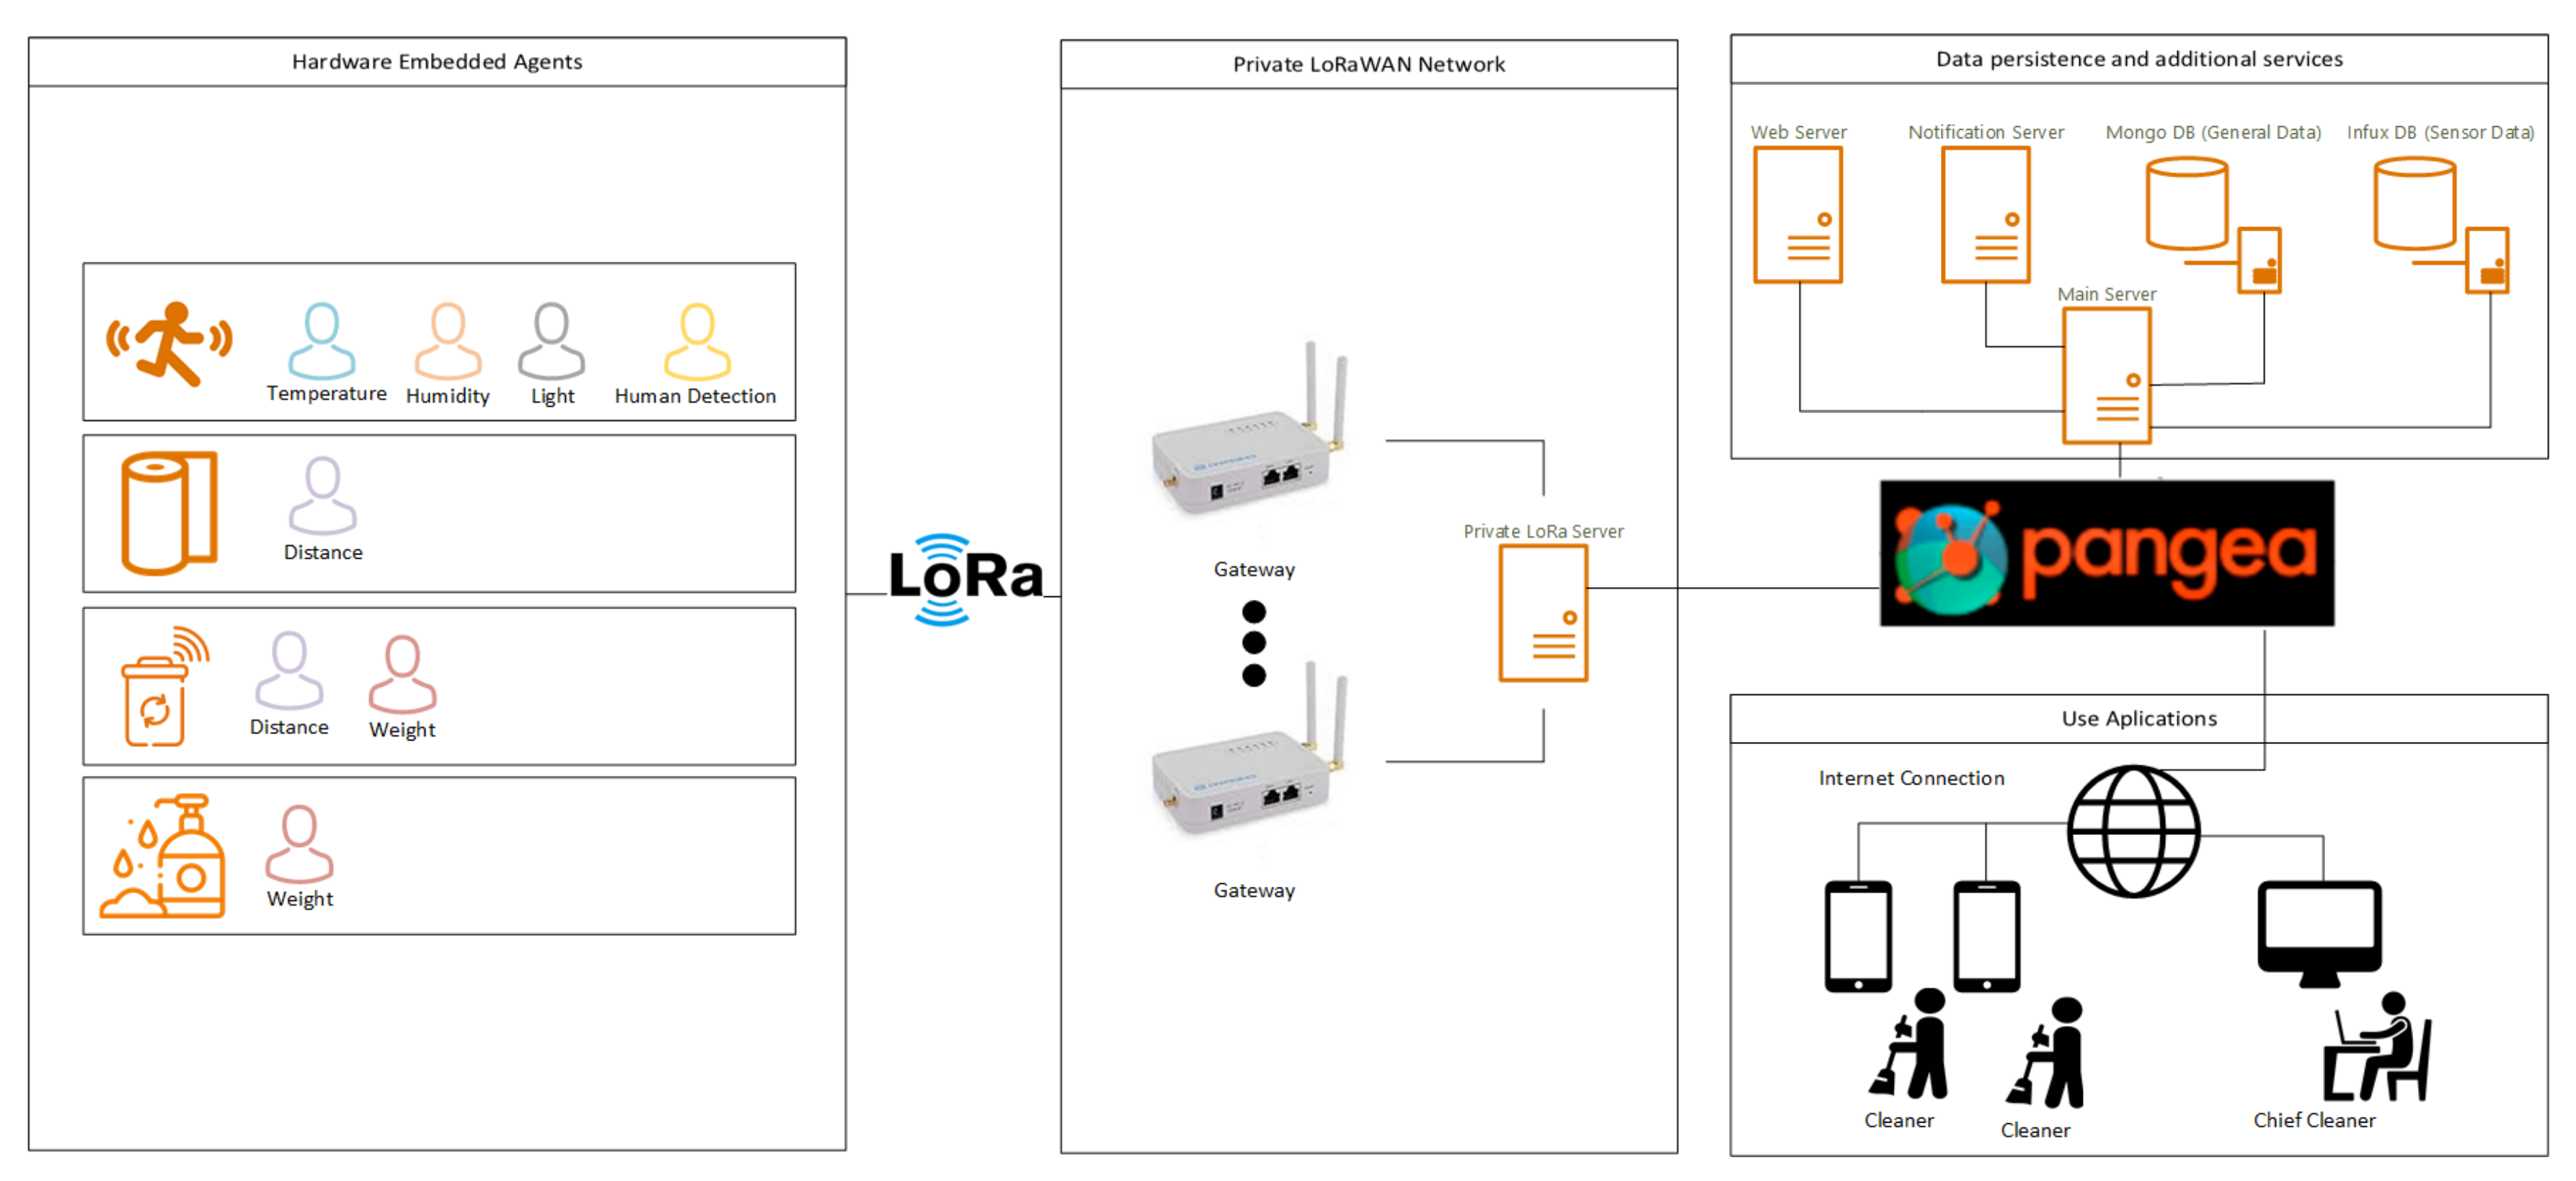
Figure 12 shows the final architecture of the system, which is divided into five main sections. The section that captures information is the hardware-embedded agents, the transmission or information propagation layer is the private LoRaWAN Network, the self-organization layer is PANGEA, and the other sections are additional services, information persistence, and user applications.
Next, some characteristics of the monitoring devices are detailed, some of which are depicted in
Figure 13.
The installation was designed to be as simple as possible, so we attempted to minimize the aesthetic modifications to the devices. With in this mind, the modification to the paper dispensers consisted of creating a hole in the upper side of the dispenser, as shown in
Figure 14a, so the sensor could easily measure the distance left to the paper. A 3D-printed piece was manufactured to cover and protect the electronics and improve the aesthetics.
For the soap dispenser, the modification consisted of attaching the device to the load cell, and the load cellwasis attached to the wall, as shown in
Figure 6b. For this small adaptation, a small 3D part was fabricated, which, with a small modification, allows the use of any type of dispenser. The position of the load cell is displayed in
Figure 14b. For the people counters, there was no device to modify, as this was a new device. Accordingly, a waterproof box was used to store all of the components, as shown in
Figure 14c. A small gap was made in the box, so that the PIR sensor would only detect in that orientation.
Figure 14d shows the installation of this sensor in the laboratory.
Each one of the devices are represented as agents within the system; their functionality is basic, since their task only consists of sending the data from each one of the sensors periodically through the physical LoRa layer until they reach the gateways.
Regarding software in the architecture in
Figure 12, the use of the LoRaServer as a private LoRa network is detailed. A small REST was integrated in the LoRA Server to allow PANGEA agents to extract data from the LoRa server. For data persistence, we used two different types of database. The open source database InfluxDB was used; it is a high availability database for writing and querying. Using this database is convenient for data that will not be modified over time, such as sensor data, generated alerts, etc. The second database was MongoDB, since it allows for changes to be simply made in the models and it is scalable. This database allows changes in the user data, configuration of bathrooms, etc. Finally, the web server and the notification server were used for the applications of the users in charge of cleaning. In the applications, the users can monitor the actual state of each one of the sensors, as shown in
Figure 15a. The historical configuration of the fuzzy logic rules and the mobile applications are shown in
Figure 15b, including notifications sent to the person in charge of cleaning that location about the need to replace any item in the bathroom.
The system has the capacity to continue working and, in some, cases detect the anomaly in the case of failures in the system due to the loss of a sensor package or a sensor sending erroneous measurements. As all the developed devices are only for monitoring and send data periodically, during sending, collisions can occur when using LoRaWAN. Because most of the devices send the status read by each one of the sensors using a value between 0 and 100, as it is the case of the soap dispenser, toilet paper dispenser, or the trash can, the loss of a transmitted message is not a problem because with the next message, the status is updated successfully. However, in the case of the people counter, only increases in people entering and leaving since the last time the measurement was sent are sent. In this case, the LoRaWAn confirmation of reception is used, which consists of a configuration in which the node sends the messages repeatedly until the gateway answers it with a confirmation. This increases energy consumption, but ensures the arrival of the messages. For the detection of failures of the sensors, the system knows the periodic sending time at which each of the devices are configured. If data are not received X times during the configured time, whether it has no coverage or it has run out of battery, the system creates an alert to send a person responsible to check the device.
The developed fuzzy control system provides an intelligent system that is able to determine when a bathroom needs cleaning. The fuzzy system calculates the most accurate output based on the value of the inputs and the rules determined.
Figure 16 shows how the Mamdami control determines the output of the system.
The use of this system helps cleaners to minimize the number of times that they clean the bathrooms in the airport. With the help of the fuzzy system, the global system notifies the cleaners when they need to clean the bathroom. With this system, we also increase the satisfaction of bathroom users.
5. Conclusions
Analyzing the results of this research, we found that it is possible to design an IoT system that is capable of improving the cleaning services in an airport. A multi-agent architecture based on the PANGEA platform was designed to maximize efficiency. This architecture obtains data from sensors to process and extracting information that can be analyzed and studied by the users. The proposed system provides a solution that is based on sensor networks, using fuzzy logic to improve the cleaning organization, which is a problem of vital importance given the current worldwide situation caused by the COVID-19 pandemic. Specifically, the system displays the level of use of different airport bathroom supplies to intelligently infer when airport cleaners must clean and/or check the public bathroom. With this case study, the effort that is required by employees to check the toilets is minimized and the cleanliness of the airport services are improved. All of these improvements minimize the chance of contracting a COVID-19 infection in the bathroom facilities, which are places that trigger feelings of worry and anxiety about human health, according to the literature researched and described previously.
As the origin of the problem, the monitoring devices had to be as simple and low consumption as possible, since, at the product start-up level, electrical installation for each of the devices was not economically viable. The use of LoRaWAN technology for communication enabled the creation of the devices with the lowest cost and low energy consumption, thereby offering a wider range of operation. The use of the Rocket Scream’s Mini Ultra Pro board and its configuration allow for the microcontroller to sleep and the disabling of all the sensors during the entire period they are asleep.
The fuzzy logic system that was developed in this study was designed to help those responsible for cleaning by informing them of the state of each of the bathrooms before starting work and knowing the number of provisions needs for each of the utilities. This system was successful not only in reducing the number of times the cleaners have to check the condition of the toilets, but also in increasing the satisfaction of the users because everything is in a clean and usable condition and replacement is performed when indicated by the system.
Future lines of this research work will include the fusion of information on the departure and arrival of flights at airports and the number of passengers on each flight. This will allow reinforcing the need to clean of the toilets not only from when there is more influx, but also when flights arrive from countries where there the pandemic situation is more critical than the country where the system is installed. Some intelligent algorithms could be incorporated in order to predict the presence of COVID-19. The focus of this research work was the use of low consumption sensors, although there are currently no sensors that can control the temperature or social distance with these characteristics. We will continue researching this area and the integration of information obtained from sensors outside the system. We also plan to incorporate a method of validating user satisfaction with cleaning services into the proposed system.

 ,
, 


