Article

Identification of Financing Barriers to Energy Efficiency in Small and Medium-Sized Enterprises by Integrating the Fuzzy Delphi and Fuzzy DEMATEL Approaches

School of Economics and Management, North China Electric Power University, Beijing 102206, China
*
Author to whom correspondence should be addressed.
Submission received: 25 June 2017 / Revised: 1 August 2017 / Accepted: 5 August 2017 / Published: 9 August 2017

Abstract

:
Energy efficiency is one of the most practical ways for China to simultaneously tackle environmental issues and achieve sustainable development. However, the issue of inadequate capital inflows is a bottleneck in energy efficiency projects, especially for small and medium-sized enterprises (SMEs). This study focuses on the complicated financial barriers to effectively promoting such projects for SMEs. A hybrid framework was proposed to recognize the most obvious financing barriers under uncertain circumstances. Potential barriers were collected firstly to build an index system, including the five dimensions of “policy and regulation”, “economic market”, “financial institutions”, “behavior” and “economic non-market”. Then, this paper introduced a novel way to combine a fuzzy Delphi and a fuzzy decision making trial and evaluation laboratory (DEMATEL) method. The fuzzy Delphi method was applied to extract significant factors from potential barriers. To analyze a series of causal relationships, the fuzzy DEMATEL approach was employed. Moreover, triangular fuzzy numbers (TFNs) are used firstly to express vague linguistic ratings in the proposed framework. Based on the experts’ opinions, seventeen significant factors were chosen to assemble a final evaluation system. Eleven key barriers were identified by analyzing cause-effect relations, including “slight fiscal incentives”, “inadequate energy market trading mechanisms”, “a low priority of energy saving issues”, etc. The key barriers affiliated with “market” and “policy and regulation” are much more important than the others. Except for B11 and B53, the others are the original factors. Finally, we listed relevant suggested measures to help SMEs, government departments and financial institutions overcome the key barriers.

1. Introduction

China is endowed with abundant fossil energy resources and relies heavily on coal to drive economic growth. Unfortunately, huge energy demands for national productions and awful pollutant emissions pose a threat to sustainable socioeconomic development [1]. The country has become the largest energy consumer and the top CO2 emitter in the world nowadays [2]. Energy security issues are drawing more and more attention. Frequent hazy weather and polluted water have negative impacts on people’s lives. Increasing urbanization, a high level of car ownership, and energy-consuming appliances represent inefficient lifestyles and production modes. There is a critical need to change backward development trajectories and improve resource utilization. Energy efficiency is a powerful way to simultaneously promote the sustainable development of energy industries and battle climate changes [3]. Implementing such projects can contribute to a reduction of greenhouse gas emissions and a decline in reliance on fossil fuels [4].
Energy efficiency in China is still at an infant stage and far from sustainable development. Large and state-owned enterprises from the manufacturing, construction and transportation sectors are generally the main implementers [5], but in fact, more than half of the total pollutants are emitted by private SMEs [6]. They are considered to have great potential for energy efficiency improvement. However, these SMEs are of small size, with little available capital, limited revenue and weak experiences in large-scale projects. Because of the high cost in equipment, construction and operation of energy saving projects, SMEs usually give low priorities to such investments. To further enhance the overall energy efficiency, it is critical for SMEs to obtain sufficient and sustainable financial support.
Many studies have been published on the barriers to energy efficiency, which contain many aspects such as institutional construction [5], policies and regulations [7], technical update [8] and market mechanisms [9]. Most of them have pointed out that more attention should be paid to financial obstacles to the promotion of energy efficiency [5,6,7,8]. In order to recommend the most effective policies for such projects, it is very important to fully understand and handle the massive difficulties existing in the financing processes. These difficulties include the multiple perspectives of policies, economic markets, financial institutions, behavior and economic non-market. Obviously, a systematic study on analyzing the critical financing barriers for sustainable energy efficiency is very valuable in a cost-effective way [10].
Some research methods have been developed to focus on key barrier analyses, such as the fuzzy analytic hierarchy process method [11], the conceptual structure [12] and the separate logit model [13]. Apparently, a barrier may trigger, strengthen or weaken others. Important interactions between these barriers are often implicit. Most researchers ignore these interactions in the analysis of vital factors. Such neglect may lead to the omission of some fundamental factors. Thus, these implicit relations must be clarified firstly to simplify complexity of massive barriers, which constitutes a multi-criteria decision making (MCDM) issue. There are plenty of MCDM techniques that can be applied to analyze such interactions, including the interpretative structural modeling (ISM) [14], the analytic network process (ANP) [15], the technique for order preference by similarity to an ideal solution (TOPSIS) [16]. Thus, suitable approaches should be found out to simplify the complexity of the financing barriers and reveal their interactions effectively.
A Delphi method has been widely applied to obtain the most consensus comments through a series of questionnaires. Significant barriers can be easily screened based on its clear operation processes [17]. A DEMATEL method has been used to clear different degrees of causalities and extract more fundamental barriers with respect to industrial reliability assessment, management strategy selection, public policy analysis etc. [18]. However, it is most noted that decision information is refined generally according to the experts’ domain knowledge under a fuzzy environment. The preferences of the barriers may be not crisp. Thus, a fuzzy set theory should be introduced to quantify vague decision information [19]. Triangular fuzzy numbers (TFNs), as the most common fuzzy numbers, are applicable to map the uncertain information into precision numbers. An extended research framework integrating the fuzzy Delphi and the fuzzy DEMATEL is proposed to analyze and determine key barriers in a real environment. The main contributions of this paper are:
(1)
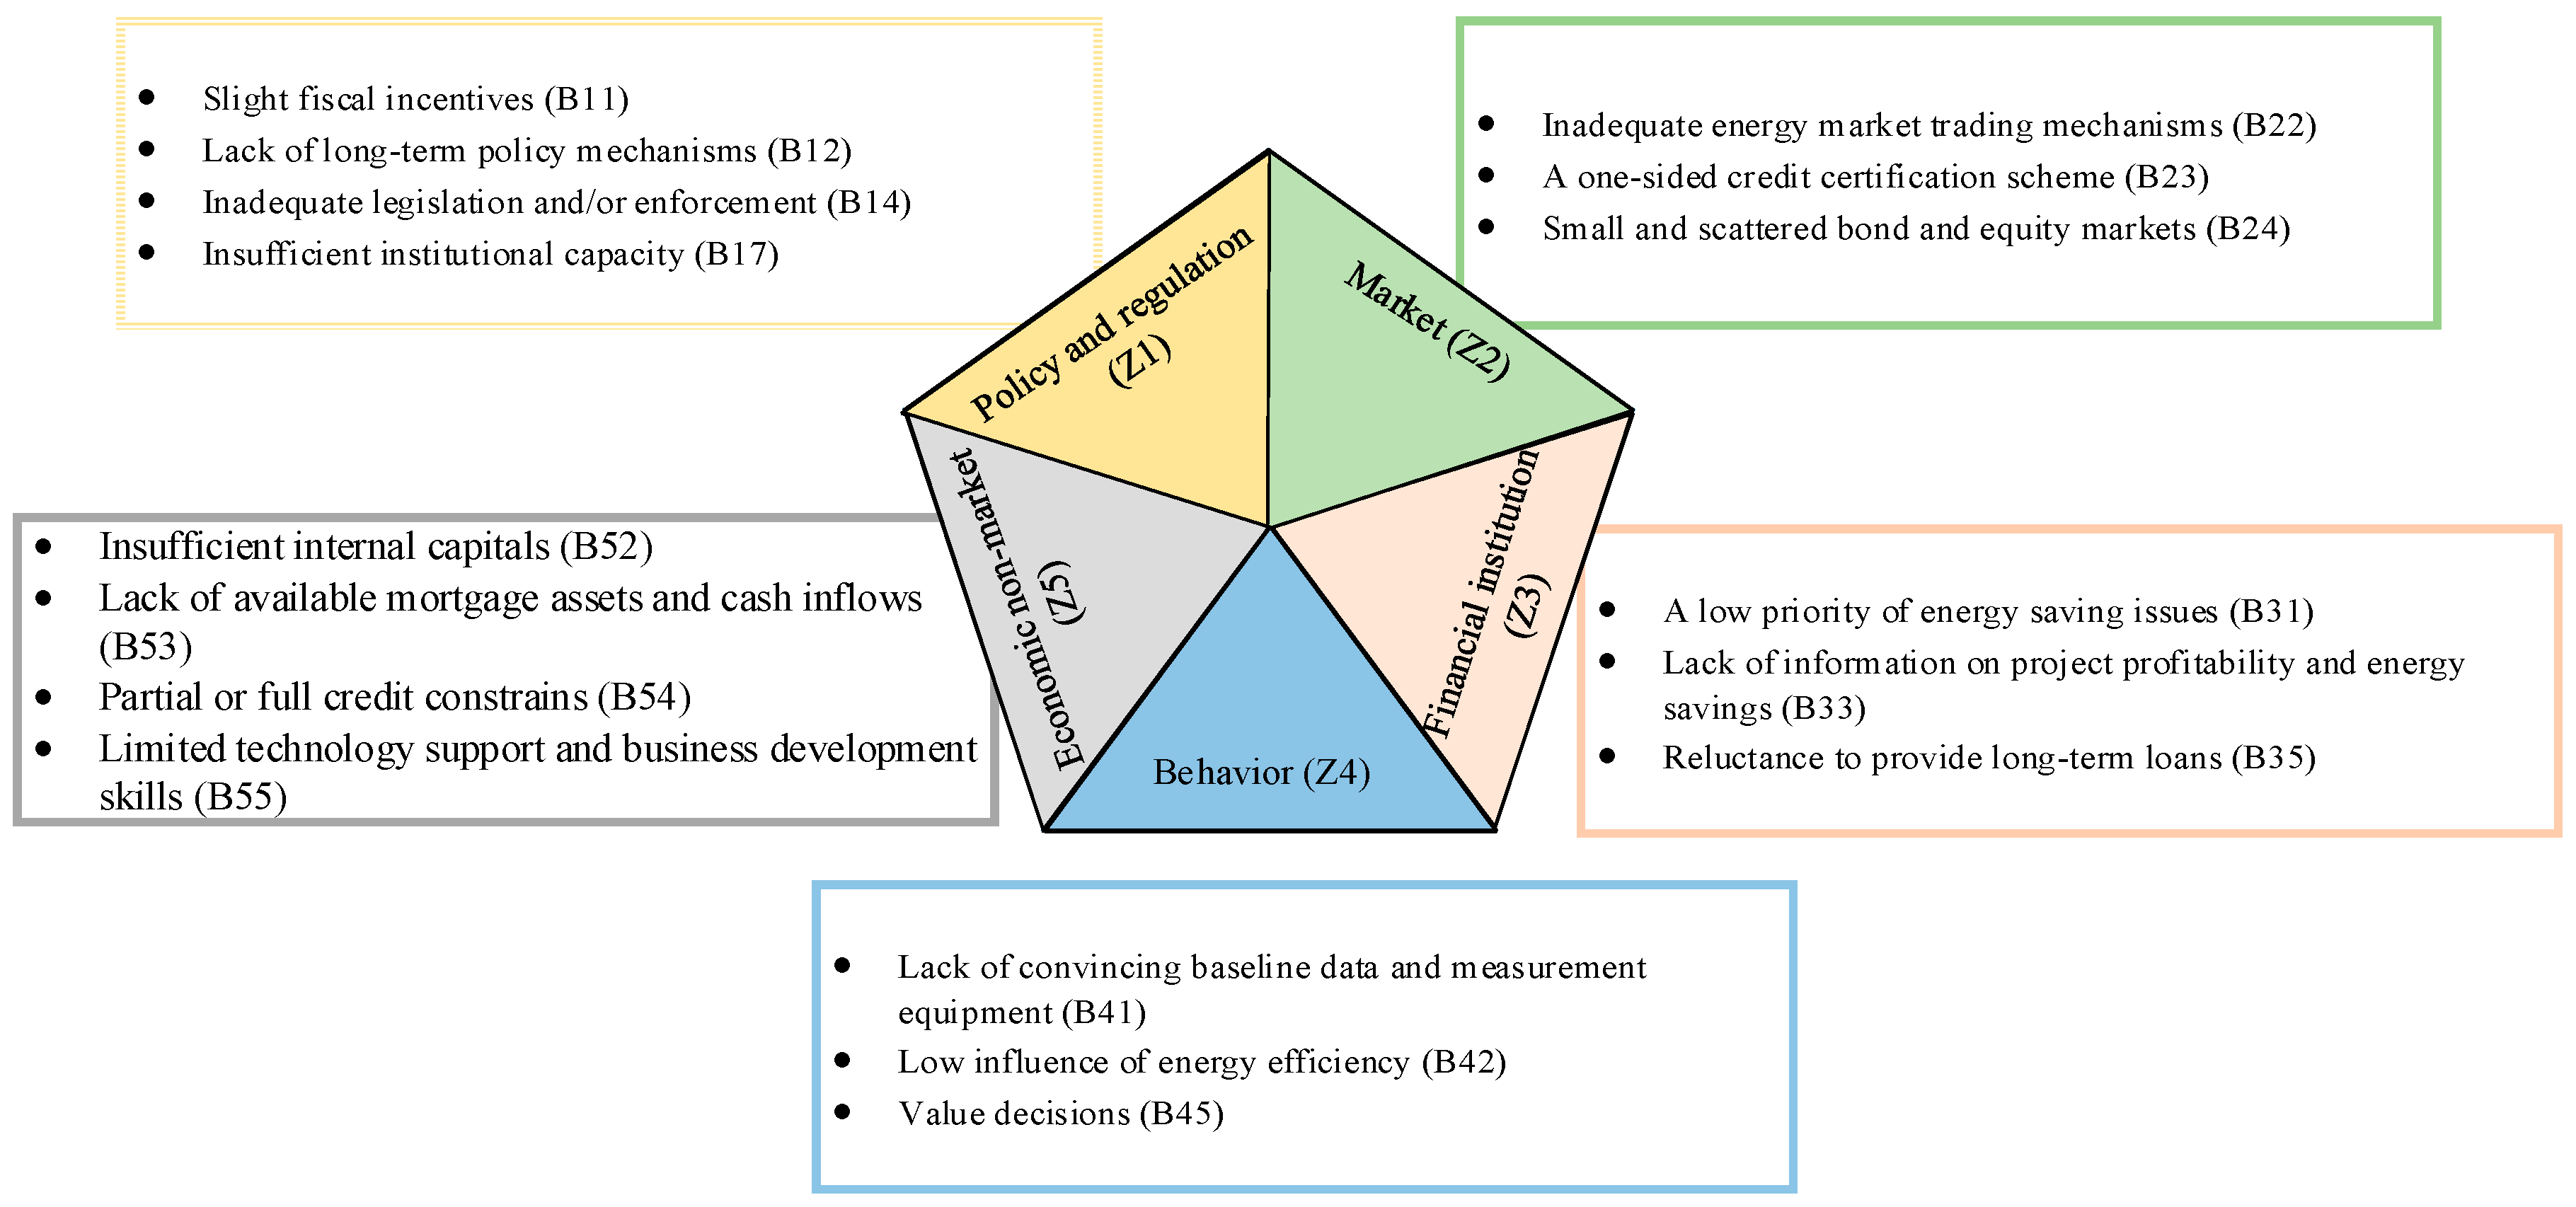
Previous studies indicated that financing bottlenecks were the main constraints restricting continued development of energy efficiency programs [5,6,7,8,9]. To the best of our knowledge, this is the first research that provides deep analysis for that issue from a comprehensive perspective, involving five aspects of “policy and regulation”, “market”, “financial institution”, “behavior” and “economic non-market”. A complete index system with two layers was established firstly to analyze the energy efficiency financing issue.
(2)
The fuzzy DEMATEL method has good performance in barrier identification under a vague environment. We developed a novel way to integrate the fuzzy Delphi method into the fuzzy DEMATEL to provide a reasonable index system for selecting main barriers. Moreover, the TFNs were introduced firstly to handle vague linguistic ratings in similar framework, which extend the combined methodology. The hybrid technique was appropriate to recognize key financing barriers of energy efficiency in a vague environment. This paper can be considered to expand the application areas of these methods.
(3)
In order to find out key barriers and obtain better insight into their relationships, a series of analyses on causal structures were performed. Because of the index system with two layers, these causal structures of different criteria groups were conducted according to layer by layer analysis and drawn into two-dimensional coordinates and logical frameworks. A deep discussion was given to analyze casual characteristics of the barriers and probe into their cause and effect relations. Moreover, we proposed a series of suggested measures to aid SMEs to overcome main obstacles effectively.
The remainder of this paper is organized as follows: Section 2 summarizes the potential financing barriers of energy efficiency by reviewing literatures and reports. In Section 3, a research framework is elaborated by using the fuzzy Delphi and the fuzzy DEMATEL methods based on TFNs. Detailed calculations are performed in Section 4. Section 5 selects main financing barriers and lists some suggested measures by discussing plenty of causal relations. Conclusions are drawn in Section 6.

2. Literature Overview

2.1. Barrier Factors of Financing Energy Efficiency

Investments in the energy sector are from several channels, including fiscal incentives, private funds, commercial bank loans, public stock markets, international capitals, etc., [20,21]. Primary energy efficiency financing channels for Chinese enterprises are described in Figure 1 [22,23].
Despite efforts to promote diversified financing sources, there are still a series of financial barriers hindering energy efficiency investments. It is still hard for SMEs to fill the financing gap. We aim to collect these barriers from a comprehensive perspective through a literature review. Indeed, a complete categorization for these barriers is vital to get a enough understanding of the financing issue and find out the most important factors [24].
Cagno [25] categorized barriers of energy efficiency improvement as external and internal with respect to industrial enterprises. The external factors include market, governmental policy, technology, finance, design and manufacture elements. The internal factors include the aspects of economy, behavior and organization related to enterprises. Sorrell [26] classified these barriers into four categories, involving economic non-market failure, economic market failure, behavioral and organizational. This taxonomy was adopted by Rohdin [24] and Trianni [27]. Considering the different financing sources, we extend the classification system proposed by Cagno and Sorrell and add some barriers from the perspectives of “policy and regulation” and “financial institution”. Thus, all financing barriers are classified into five dimensions, which are “policy and regulation”, “economic market”, “financial institution”, “behavior” and “economic non-market”:
(1) Policy and regulation factors
Sound financing policies and regulations are extremely important to leverage government funds and mobilize additional capital from commercial banks, host companies and private equity funds for energy efficiency. Excessive restrictive measures and imperfect guidelines may cause a failure to implement green financing. Lack of unified measurement criteria may make investors worry about the effectiveness of such projects.
(2) Market factors
Project funds can be obtained through strong capital markets from domestic and abroad. However, due to a range of market barriers about price mechanisms, information exchanges, bond issuance, foreign exchange control, etc., it is difficult to perform energy efficiency commercialized operation in developing countries [4].
(3) Financial institution factors
Commercial banks, credit cooperatives, securities companies, etc. are encouraged to develop green loans just as a matter of corporate social responsibility. Most financial institutions symbolically carry out financing mechanisms for energy saving under official pressure. Meanwhile, a bank-led financial structure makes it difficult for SMEs to get enough loans. Because of some barriers from financial institutions, the financing channels are restricted increasingly.
(4) Behavior factors
Energy efficiency involves many changes in production processes, equipment and technologies. Individuals may overlook cost-effectiveness of such projects and resist these changes due to bounded rationality, habitual thoughts and local public impression etc., which can be regarded as behavior barriers and must be paid attention.
(5) Economic non-market factors
An economic non-market dimension contains some barriers from SMEs in terms of cost, risk management, technologies, etc. These factors should not be overlooked in decision-making about large-scale projects.
The various financing barriers discussed in existing literatures are summarized in Table 1.

2.2. Delphi Method

The Delphi method, developed by Dalky and Helmer [38] in 1963, is a significant methodology to obtain anonymous feedbacks and modify previous comments through several rounds of communication among experts. It has been widely applied to various domains, including industrial quality evaluation, investment decisions, production prediction, etc.
Numerous researchers have made improvements for the traditional Delphi method. Kauko [39] developed a post-survey adjustment model for the method to perform an experimental study on financial market variables. In order to deal with ambiguous subjective judgments from decision makers, a fuzzy set theory was considered by some scholars. Bouzon [40] integrated the fuzzy set theory into the Delphi method to identify reverse logistics barriers under a vague environment. Zhao [41] established a hybrid decision making model based on the fuzzy Delphi method to optimize charging stations of electric vehicles.

2.3. DEMATEL Method

The DEMATEL technique is a practical tool to cope with decision-making issues and search for overall solutions. It was proposed by Gabus and Fontela [42] in 1972 and has been widely employed to clarify structural cause-effect relations existing in evaluation and making decisions [43,44,45,46]. Due to the uncertainty in human’s decision making, the fuzzy theory was introduced into the DEMATEL to help managers handle real MCDM problems. Mirmousa [47] used the fuzzy DEMATEL method to select the best suppliers. Jassbi [48] applied the method to deal with strategy mapping.

3. Analytical Methods and Framework

3.1. Fuzzy Logic

A fuzzy set theory is used to cope with imprecision and vagueness of human descriptions and thought. A fuzzy set a ˜ is usually defined as a subset in a universe of discourse X, which is an ordered pair with characteristics of a membership function μ a ˜ ( x ) indicating a mapping μ a ˜ ( x ) : X [ 0 , 1 ] . All elements are gathered in to X. The membership of each element x is represented as the value of μ a ˜ ( x ) , which reflects an actual degree to what x belongs to a ˜ . μ a ˜ ( x ) = 1 indicates that x belongs to a ˜ completely, while μ a ˜ ( x ) = 0 reveals that x is not an element in a ˜ .
A TFN can be designated as a triplet A ˜ = ( L , M , R ) , where L, M and R are crisp numbers and < L M R < + . Related membership function μ A ˜ ( x ) is defined as:
μ A ˜ ( x ) = { ( x L ) / ( M L ) L x < M ( R x ) / ( R M ) M x R 0 x < L   o r   x > R
Let A ˜ 1 = ( L 1 , M 1 , R 1 ) and A ˜ 2 = ( L 2 , M 2 , R 2 ) be TFNs, some operational principles are listed:
A ˜ 1 A ˜ 2 = ( L 1 + L 2 , M 1 + M 2 , R 1 + R 2 )
A ˜ 1 A ˜ 2 = ( L 1 L 2 , M 1 M 2 , R 1 R 2 )
A ˜ 1 A ˜ 2 = ( L 1 × L 2 , M 1 × M 2 , R 1 × R 2 )
A ˜ 1 1 = ( 1 R 1 , 1 M 1 , 1 L 1 )
In MCDM processes, human often face uncertain circumstances and give ambiguous answers rather than accurate values. The fuzzy set theory and TFNs are usually used to map qualitative linguistic terms such as “poor”, “good” and “important” to quantitative number intervals, which are often recommended to reflect performance evaluation. In order to remove ambiguity of fuzzy numbers and obtain clear information, a graded mean integration representation (GMIR) method is often used to transform a TFN A ˜ = ( L , M , R ) into a precise value:
G ( A ˜ ) = L + 4 M + R 6

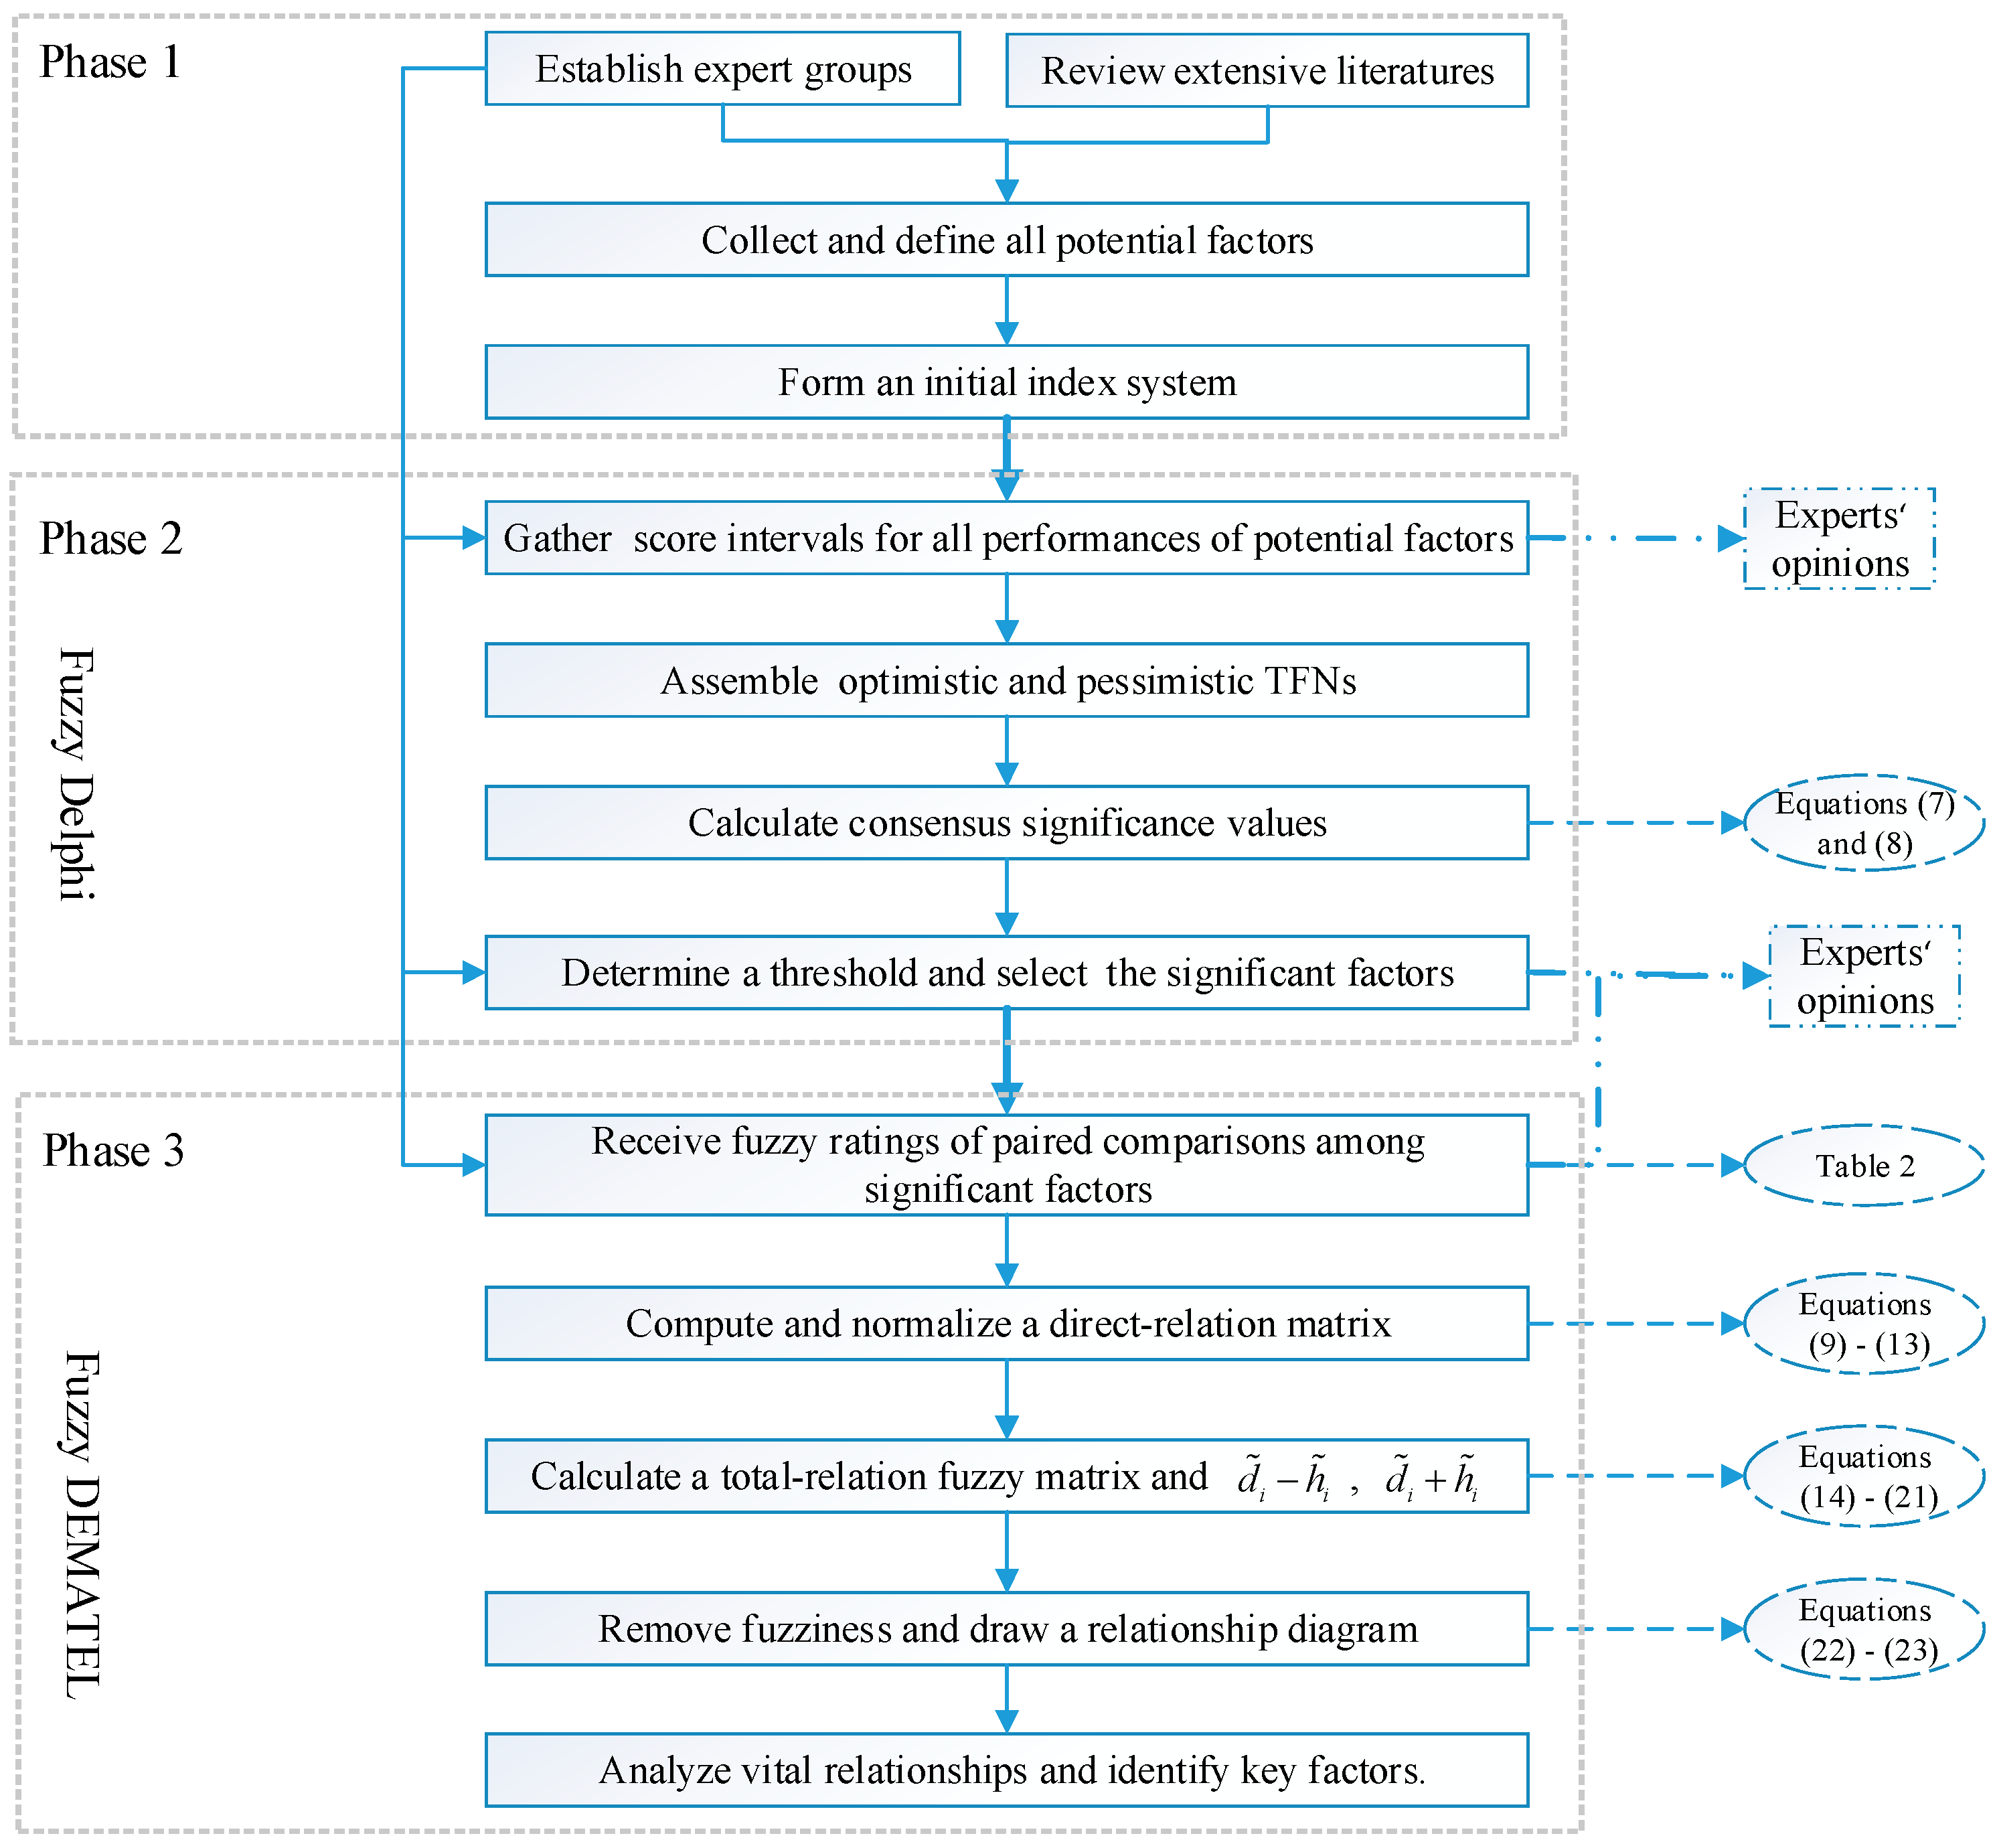
3.2. Fuzzy Delphi Method

The Delphi method is a common expert opinion communication technique to distill consistent judgments. Experts can take advantage to receive feedback information and modify previous judgments through several consecutive rounds of written communications. Its basic features are anonymous responses, controlled and iterative feedback and statistical group responses. But there are some deficiencies of the traditional method in handing uncertain decision information, such as low convergence ratings, distorted expert opinions, high execution cost and so on. Thus the fuzzy logic theory was posited into the Delphi method to solve these defects, named fuzzy Delphi method. Decision makers can express their comments through TFNs. Compared with the conventional method, the fuzzy Delphi method has the following advantages: (a) it can reflect full valuable information from vague subjective judgments; (b) Final decisions can be obtained by only one round of a written communication rather than multiple rounds of communications and modifications. Thus, the fuzzy Delphi method is introduced to recognize significant financial barriers. Key procedures are:
Step 1: Design appropriate questionnaires to reveal the importance of potential factors. Score intervals ranging from 0 to 10 should be assigned to the factors by selected experts according to these questionnaires. They can represent the importance of the factors. 0 and 10 represent “absolutely unimportant” and “absolutely important” respectively. The maximum of the score interval represents optimistic cognition, while the minimum reflects pessimistic cognition.
Step 2: Gather the maximum and minimum values of all score intervals for each factor and compute the geometric average correspondingly. An optimistic TFN O i = ( L i o , M i o , R i o ) and a pessimistic TFN P i = ( L i p , M i p , R i p ) should be integrated, i = 1 , 2 , , N . L i o and L i p represent the minimum values of all experts’ optimistic cognition and pessimistic cognition, respectively. R i o and R i p represent the maximum values of all experts’ optimistic cognition and pessimistic cognition, respectively. M i o and M i p represent the geometric average values of all experts’ optimistic cognition and pessimistic cognition, respectively.
Step 3: Test the consistency of all experts’ comments and calculate a consensus significance value C i for factor i. The consensus significance value is applied to measure a consistent degree of these comments on each factor. The greater this value of C i is, the better the consistency is. It can be obtained by the following:
(a)
If L i o R i p , factor i holds a complete consensus, the consensus significance value C i is:
C i = M i o + M i p 2
(b)
If L i o < R i p , there is a gray interval T i = R i p L i o .
(i)
If T i is less than an interval H i = R i o M i p , the comments on factor i are consistent and C i is:
C i = M i o × R i p L i o × M i p ( R i p M i p ) + ( M i o L i o )
(ii)
If T i is more than H i , the comments are not consistent. New comments for factor i should be provided through repeating steps 1 to 3 until all factor comments are consistent and corresponding consensus significance values can be computed.
Step 4: Set a threshold value η for these consensus significance values and choose significant factors. η should be established to exclude some factors with weak correlations. It can be set up by selected experts to reflect an acceptable minimum consistent degree. If C i is less than η, relative factors should be excluded. The rest can form a final evaluation system.

3.3. Fuzzy DEMATEL Method

The DEMATEL technique is a practical tool to analyze cause and effect relations between evaluation criteria. It can be used to form an understandable structural model including the interactions among criteria as well as degrees of influential effect through matrices or digraphs. On the basis of a graph theory, complicated causal relationships between criteria can be examined by visualization to explain some problems [44]. Considering experts’ uncertain judgments, the conventional technique should be extended by applying the fuzzy logic theory. The fuzzy DEMATEL method is proposed to solve fuzziness of decision making in real MCDM issues. In order to retain complete decision making information, subjective opinions with respect to different interactions can be determined by using fuzzy linguistic variables rather than precise numerical values. Thus, the extended method is introduced to effectively analyze a causal structure of energy efficiency financing barriers for SMEs. Calculation steps are as follows:
Step 1: Define linguistic variables and obtain fuzzy ratings by paired comparisons. Suppose a final evaluation system includes n significant factors, which have been selected by using the fuzzy Delphi method. A series of linguistic variables should be defined to reflect the relationships between factors. They are divided into five degrees as Very high, High, Low, Very low and None, and can be expressed as TFNs according to Lin [49], as shown in Table 2.
Then, K selected experts should give linguistic ratings of causality relations through pairwise comparisons according to Table 2. Let f ˜ i j k = ( l i j k , m i j k , r i j k ) represent a TFN of the linguistic rating given by expert k, k = 1 , 2 , , K . A fuzzy matrix f ˜ K can be:
f ˜ k = [ 0 f ˜ 12 k f ˜ 1 n k f ˜ 21 k 0 f ˜ 2 n k f ˜ n 1 k f ˜ n 2 k 0 ] n × n
where f ˜ i i k on the diagonal can be regarded as a TFN (0, 0, 0) and i , j = 1 , 2 , , n .
Step 2: Aggregate an initial direct relation matrix. There are K fuzzy matrices denoting all causality assessments. An initial direct relation matrix F ˜ can be acquired by averaging the fuzzy metrics, as is:
F ˜ = f ˜ 1 f ˜ 2 f ˜ K K
It is expressed in:
F ˜ = [ 0 F ˜ 12 F ˜ 1 n F ˜ 21 0 F ˜ 2 n F ˜ n 1 F ˜ n 2 0 ]
Step 3: Establish a normalized direct relation matrix S ˜ . A linear scale variation is employed to normalize F ˜ . Let the TFN S ˜ i j = ( L i j s , M i j s , R i j s ) represent an element in S ˜ . A definition is given as:
P = max ( j = 1 n R i j )
S ˜ can be computed as:
S ˜ = 1 P × F ˜
where S ˜ i j = ( L i j s , M i j s , R i j s ) = ( L i j P , M i j P , R i j P ) . Suppose that there are at least one factor i such as max ( j = 1 n R i j ) < P .
Step 4: Calculate a total relation fuzzy matrix T ˜ . Let t ˜ i j = ( L i j , M i j , R i j ) , T ˜ is expressed as:
T ˜ = [ t ˜ 11 t ˜ 12 t ˜ 1 n t ˜ 21 t ˜ 22 t ˜ 2 n t ˜ n 1 t ˜ n 2 t ˜ n n ]
It can be computed by ensuring lim δ S ˜ δ = [ 0 ] n × n , as is:
T ˜ = lim δ ( S ˜ + S ˜ 2 + S ˜ δ ) = S ˜ ( 1 S ˜ ) 1
In order to obtain T ˜ , the elements in S ˜ are extracted to form three precise matrices S L , S M , S R , as are:
S L = [ 0 L 12 s L 1 n s L 21 s 0 L 2 n s L n 1 s L n 2 s 0 ] , S M = [ 0 M 12 s M 1 n s M 21 s 0 M 2 n s M n 1 s M n 2 s 0 ] ,   S R = [ 0 R 12 s R 1 n s R 21 s 0 R 2 n s R n 1 s R n 2 s 0 ]
Then corresponding matrices T L , T M and T R are computed as:
T L = S L ( I S L ) 1 , T M = S M ( I S M ) 1 , T R = S R ( I S R ) 1
The fuzzy matrix T ˜ can be obtained by aggregating T L , T M and T R .
Step 5: Compute the sum of rows and columns of T ˜ . Let vector d and h be the row and column values respectively, as are:
d = ( d ˜ i ) n × 1 = ( j = 1 n t ˜ i j ) n × 1
h = ( h ˜ j ) 1 × n = ( i = 1 n t ˜ i j ) 1 × n
where d ˜ i = ( L i d , M i d , R i d ) and h ˜ j = ( L j h , M j h , R j h ) .
Step 6: Calculate d ˜ i h ˜ i and d ˜ i + h ˜ i to clear the performances of barriers. Generally, d ˜ i h ˜ i represents which factor is the cause and which one is the result, as is:
d ˜ i h ˜ i = ( L i d L i h , M i d M i h , R i d R i h )
where d ˜ i + h ˜ i denotes effect intension of factor i, as defined by:
d ˜ i + h ˜ i = ( L i d + L i h , M i d + M i h , R i d + R i h )
For accurate comparison, d ˜ i h ˜ i and d ˜ i + h ˜ i should be transformed into crisp values using the GMIR method (Equation (6)). They are denoted by Y i * and X i * respectively, as:
Y i * = ( L i d L i h ) + 4 ( M i d M i h ) + ( R i d R i h ) 6
X i * = ( L i d + L i h ) + 4 ( M i d + M i h ) + ( R i d + R i h ) 6
If the value of Y i * is greater than zero, the factor i belongs to a cause group. On the contrary, the factor i is a part of a result group. The greater the value of X i * is, the more important the factor i is.
Step 7: Build a structural model for causal relationships. In order to reveal the causality between barriers, a cause-and-effect relationship diagram can be drawn by plotting a series of data pairs ( X i * , Y i * ) into a two-dimensional coordinate. Then reasonable analyses are performed to extract key barriers.

3.4. The Proposed Research Framework

An evaluation model is proposed to analyze the structure of financing energy efficiency barriers. Significant factors should be selected firstly from an initial index system by applying the fuzzy Delphi method. Then the fuzzy DEMATEL method is employed to analyze causal relations among these significant factors in order to identify fundamental factors.
The framework by combining the two methods includes the following three phases, as shown in Figure 2.
Phase 1: Collect potential financing barriers to build an index system. Experienced experts on energy efficiency should be selected from government departments, financing organizations, SMEs, electricity utilities, etc. to establish appropriate expert groups. All of potential barrier factors were listed by reviewing extensive literatures and interviewing the expert groups in order to build an initial index system.
Phase 2: Recognize significant factors based on the fuzzy Delphi method. First, a questionnaire on these potential factors was distributed to the expert groups. A series of score intervals can be obtained to reveal the importance of the factors. Then, consensus significance values were calculated based on the optimistic TFNs and the pessimistic TFNs. At last, the expert groups set a threshold to select significant factors.
Phase 3: Conduct a causal structure model and select key factors using the fuzzy DEMATEL. First, a questionnaire on the relations between significant factors was assigned to the expert groups in order to obtain fuzzy ratings by paired comparisons. Second, a total relation fuzzy matrix was calculated based on an initial direct relation matrix. Then, vectors d, h and d ˜ i h ˜ i , d ˜ i + h ˜ i were computed and defuzzified. Finally, a causal structural model was established in a two-dimensional coordinate system. Vital relationships can be revealed based on the structural model to identify key factors.
This proposed hybrid framework based on the fuzzy Delphi and DEMATEL methods has the following advantages. First, linguistic variables and TFNs were applied to transfer vague judgments into quantitative values and keep information completely. Then, the fuzzy Delphi method could be employed to integrate all experts’ fuzzy comments and map them into specific quantitative intervals. At last, the fuzzy DEMATEL was a good tool to discuss on correlations between significant factors through cause and effect relationship diagrams, which is help to find out fundamental barriers under uncertain circumstances. Thus, this framework is very suitable to cope with real decision-making issues, including obstacle identification of energy efficiency financing for SMEs.

4. Research Results

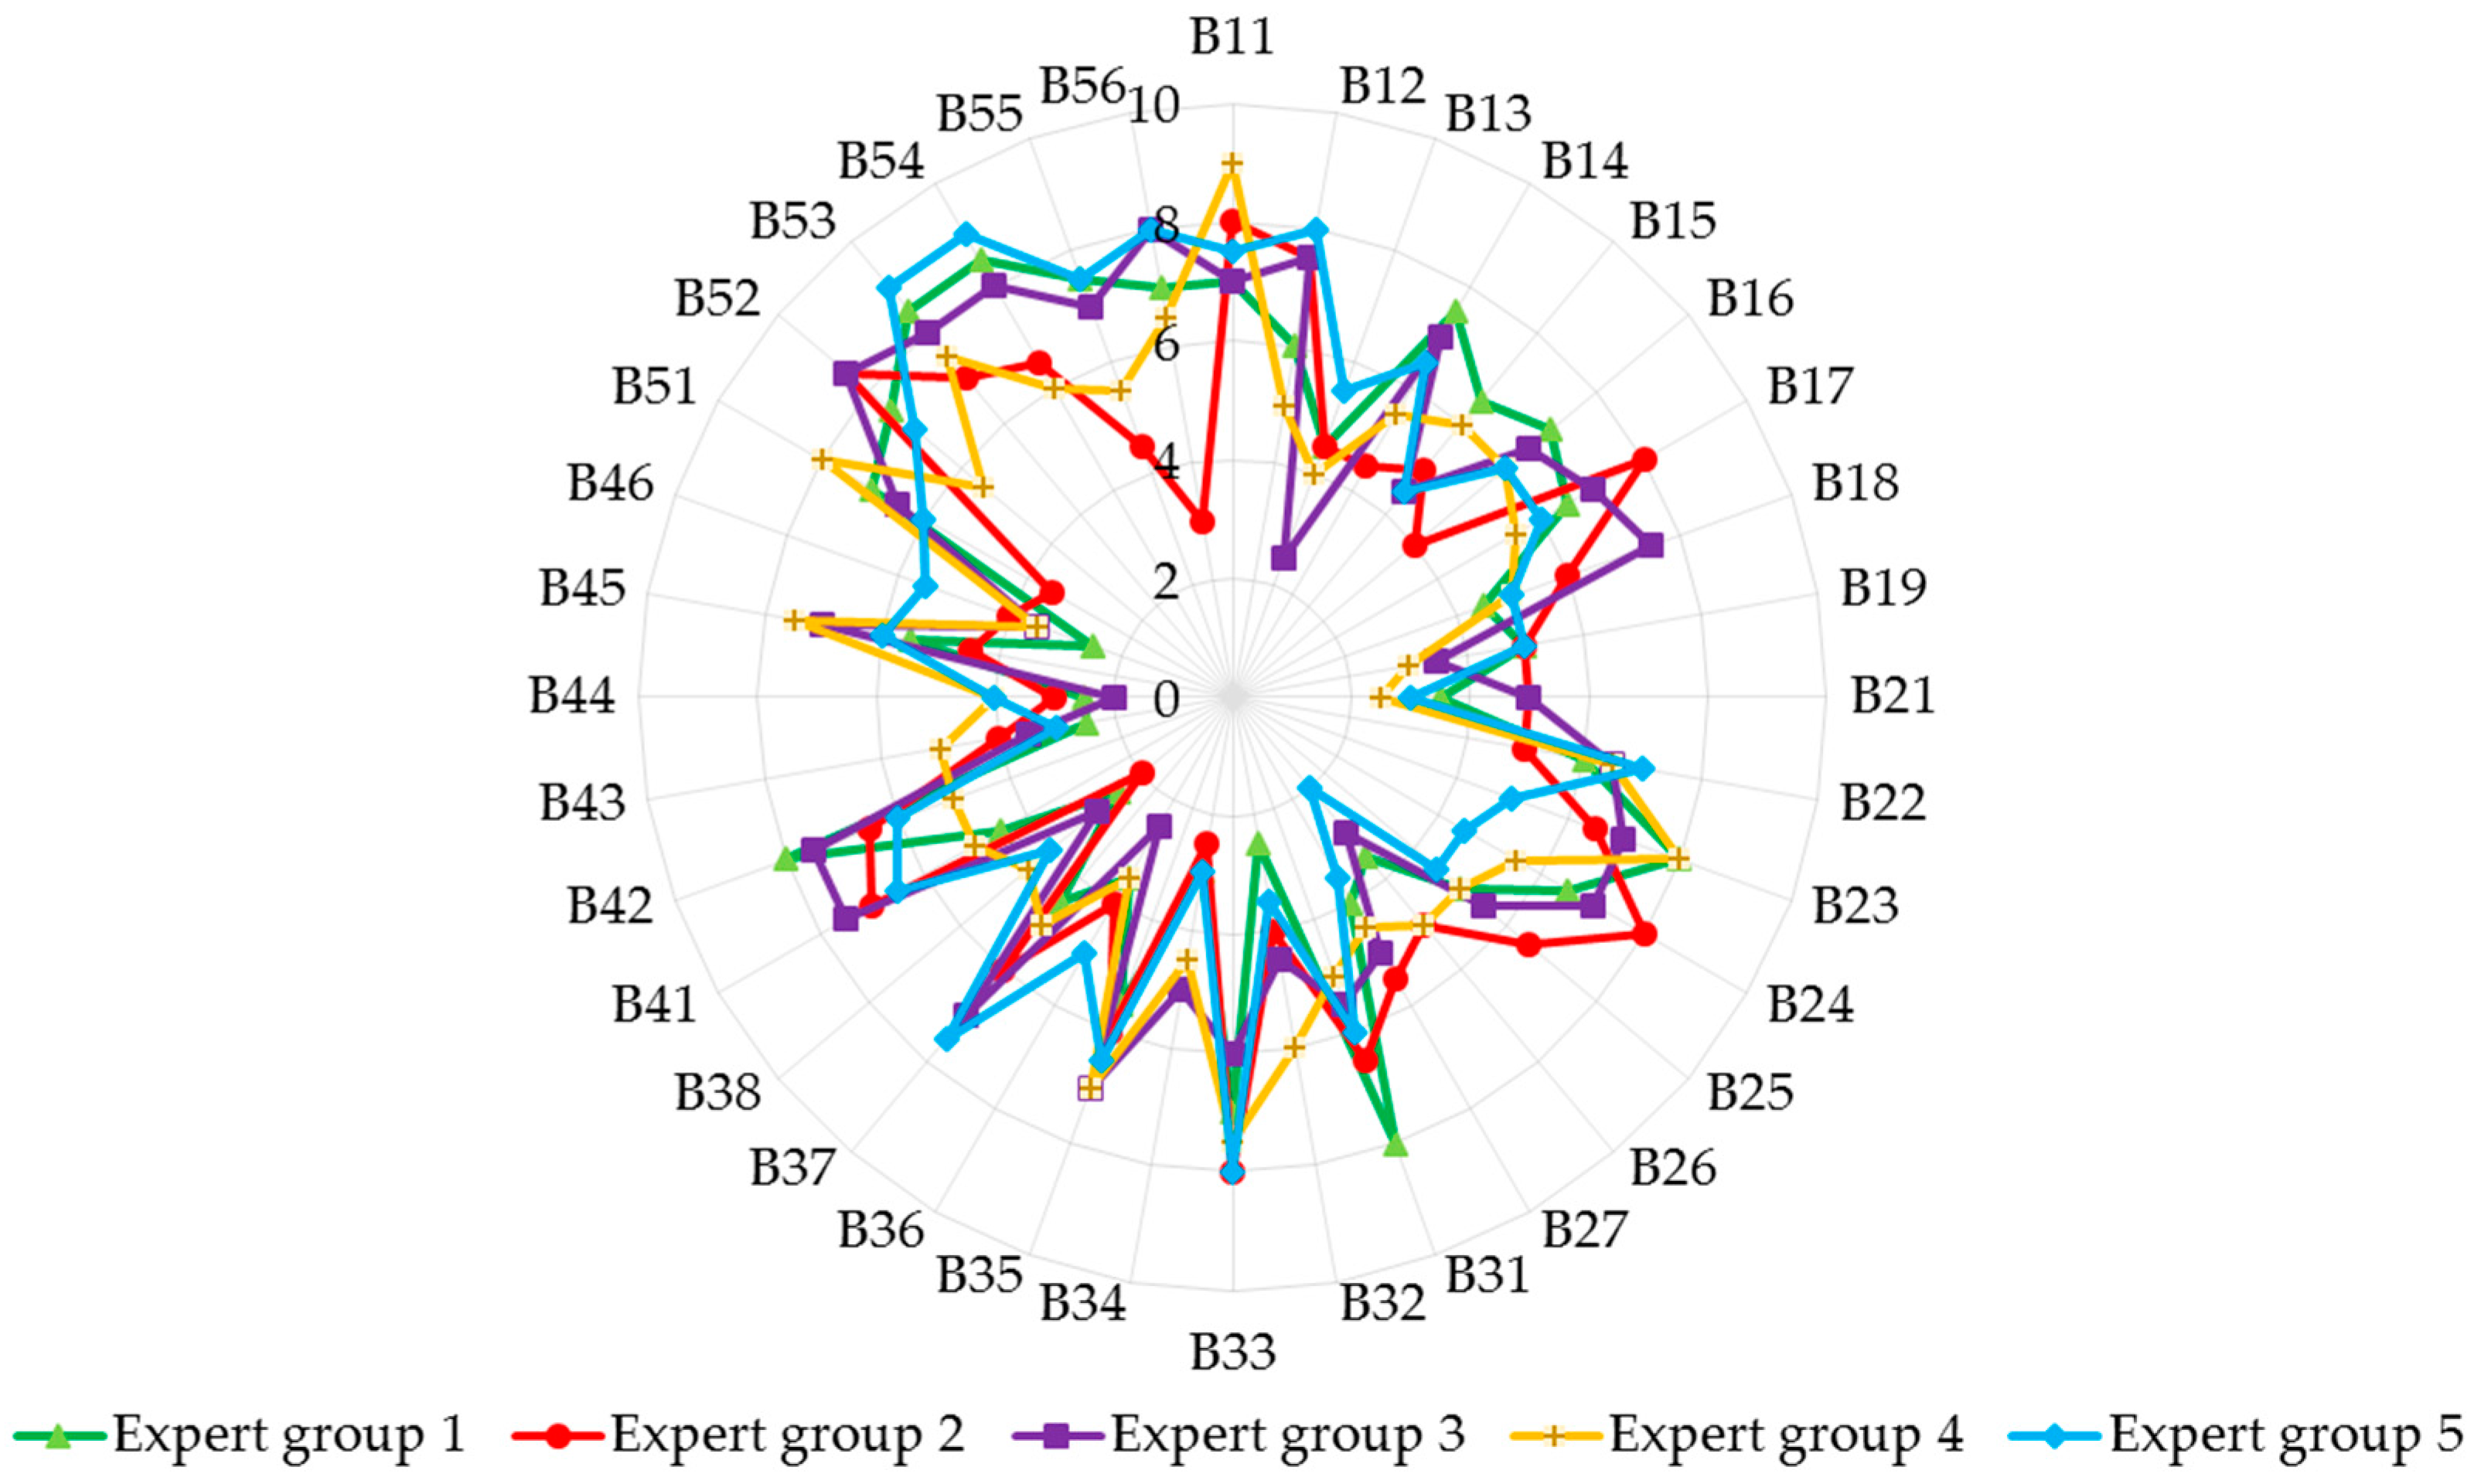
4.1. Describe the Characteristics of the Expert Groups

Credible linguistic preference ratings about importance and relations of financing barriers are the foundation to perform the proposed framework. Powerful expert groups can ensure the accuracy of corresponding data and research results. The judgment of all the representative stakeholders such as administrative executors for energy efficiency planning, researcher for demand side management, financiers for energy investment, engineers in electricity utilities and SME entrepreneurs should be incorporated in the decision-making processes. Accordingly, 20 qualified respondents, including four administrators working for government departments, four professors researching on energy saving, four financing experts who have wide experience on project investment, four electric engineers and four entrepreneurs of SMEs were invited to participate in a communication meeting. These respondents were divided into five groups, as shown in Table 3.
The communication meeting was conducted by a coordinator selected from our team. The five groups of experts were asked to express the importance of barrier factors firstly. The threshold value η for the fuzzy Delphi are determined by experts’ opinions base on the rule of “the minority is subordinate to the majority”. Then, the relationships between each pair of relative barrier factors can be determined based on the Table 2. Complicated arithmetic processes with respect to the fuzzy Delphi and DEMATEL methods were performed by our research team.

4.2. Make the Initial Evaluation System

We have collected a lot of potential barriers by reviewing massive literatures and reports, as shown in Table 1. These criteria were divided into five dimensions including policy and regulation (M1), economic market (M2), financial institutions (M3), behavior (M4) and economic non-market (M5). All of the criteria were adopted by these expert groups based on the current stable policy environment, incomplete electric power market and imperfect financial markets in China. The initial index system was built and defined in Table 4.

4.3. Recognize Significant Barriers

The fuzzy Delphi method was applied to select significant barriers from the initial evaluation system. A survey was answered by the five expert groups during the communication meeting. All experts expressed their comments on sub-criteria relative importance through score intervals. These intervals were aggregated as the corresponding groups’ comments, as shown in Table 5.
These scattered comments expressed as score intervals should be aggregated into a series of pessimistic TFNs and optimistic TFNs. Then the consensuses of all comments were checked by the values of H i T i . If they were all more than 0, these comments are consistent. Consensus significance values Ci were computed according to Equations (7) and (8). Detailed calculations are shown in Table 6. The threshold value η was set to 6, which was approved by the expert groups. Finally, 17 significant sub-criteria were screened, as marked with √ in Table 6. These are aggregated to form the final evaluation system (Figure 3).

4.4. Build the Causal Structure Model

The fuzzy DEMATEL approach was applied to establish the structural model. First, fuzzy ratings of all criteria and sub-criteria were obtained and then transformed into fuzzy matrices. There is an example of linguistic ratings of all main criteria relationships given by an expert group in Table 7.
Second, all of linguistic ratings from five expert groups were gathered. The initial direct relation matrices were formed and normalized according to Equations (10)–(13). The initial and normalized direct relation matrices of the main criterion group are shown in Table 8 and Table 9.
Third, total relation fuzzy matrices for all criterion groups were built by applying Equations (14)–(16). Table 10 presents a total relation fuzzy matrix for main criterion.
Then, the sum of rows d and columns h can be obtained. All d ˜ i h ˜ i and d ˜ i + h ˜ i could be computed and transformed into crisp values. At last, a cause-and-effect relationship diagram was drawn by plotting these crisp values. The crisp values of d ˜ i + h ˜ i represent the importance of the influences among criteria. The crisp values of d ˜ i h ˜ i were applied to divide these factors into the cause and result groups. All of calculation results were obtained by repeating the above processes, as shown in Table 11 and Table 12.

5. Discussion and Implications

5.1. Findings

In order to obtain significant factors rationally, we aggregated the different comments on relative importance from the five expert groups with different professional backgrounds in the application of the fuzzy Delphi method. For comparison, fuzzy score intervals on these comments (Table 5) were transformed into crisp numbers by using a geometric mean method. Figure 4 presents the different importance for all criteria. We can observe that there is an obvious concordance in the evaluation of the relative importance of these sub-criteria among the five expert groups. The criteria B11, B33, B53 and B54 have great geometric means exceeding the threshold value 6 and were considered as the most important factors by all expert groups. Whereas the geometric means of criteria B13, B19, B21, B26, B27, B34, B36, B38, B43, B44 and B46 are lower than the threshold. These criteria were excluded by all expert groups.
In the light of the values of the d ˜ i + h ˜ i , d ˜ i h ˜ i , X* and Y*, several cause-effect relationship diagrams were obtained to divide the criteria into a cause group and a result group. At the aim of finding out fundamental factors, significant interactive relationships between factors must be determined and descripted. All of the total relation fuzzy matrices should be defuzzified firstly by applying Equation (6) to obtain crisp relationships. Then the arithmetic means of all elements in the matrices could be regarded as several threshold values to determine the significant relations according to Hsu et al. [50]. Only if the element values are larger than these thresholds, the interactive relationships are significant and should be described in figures.
For the main criterion group, a crisp total relation matrix was computed as the above calculation processes, as shown in Table 13. Significant interactive relationships were designated by asterisks (*). A cause and effect diagram with respect to the main criteria was drawn up in Figure 5. Figure 5a shows the causal attributes of all main criteria. Figure 5b illustrates the significant relations between main criteria. Double arrows represent significant mutual effects between two criteria and dotted lines represent obvious one-way causal effects.
As shown in Figure 5a, the main criterion with the highest Y* is “Policy and regulation (Z1)”, meaning that it is a vital cause of the others. “Market (Z2)” has the second highest Y* in the cause group and may affect other main criteria easily. “Behavior (Z4)” in the cause group can effect on “Financial institution (Z3)” and “Economic non-market (Z5)” and should be paid attention. Besides being effected by others, Z3 and Z5 interact with each other. Z3 and Z5 with high values of X* are more important than others and also should be paid appropriate attention.
For the Z1 group, Figure 6 was obtained to descript significant causal relations through the above processes. Figure 6a showed the sub-criteria causal attributes affiliated with the group. Figure 6b described the significant relations between these sub-criteria. In Figure 6a, “Lack of long-term policy mechanisms (B12)” and “Inadequate legislation and/or enforcement (B14)” have obvious positive values of Y* and thus were the core criteria affecting others. They also have interaction relationships (as shown in Figure 6b). “Slight fiscal incentives (B11)” in the result group has a great X*, meaning that it is strongly effected by B12 and B14. While “Insufficient institutional capacity (B17)” is at the bottom left, meaning that it may be affected slightly by others. Thus, B11, B12 and B14 should be regarded as critical sub-criteria.
For the Z2 group, cause and effect diagrams were presented in Figure 7, which illustrated the causal attributes of the sub-criteria in this group (Figure 7a) and corresponding significant relations (Figure 7b). “Inadequate energy market trading mechanisms (B22)” has a positive Y*, indicating that it could cause others as an origin and should be paid more attention. “A one-sided credit certification scheme (B23)” and “Small and scattered bond and equity markets (B24)” in the result group were low values of X* and can be ignored.
The cause and effect diagrams for Z3 were described in Figure 8, which illustrated the causal attributes of corresponding sub-criteria (Figure 8a) and significant interactions (Figure 8b). “A low priority of energy saving issues (B31)” and “Lack of information on project profitability and energy savings (B33)” with positive Y* were assigned to the cause group and have interaction relationships between each other. While “Reluctance to provide long-term loans (B35)” with low values of X* and Y* is slightly influenced by B31 and B33. Thus, B31 and B33 are very important.
For the main criterion Z4, Figure 9 was drawn to present the causal characteristics of corresponding sub-criteria (Figure 9a) and obvious cause and effect relations (Figure 9b). “Low influence of energy efficiency (B42)” was the most significant Y* and high X*, meaning that it influences others enormously and is vital without doubt. “Lack of convincing baseline data and measurement equipment (B41)” in the cause group is the greatest X*, indicating that it has a significant impact on “value decisions (B45)”. While B45 is in the bottom left and should be neglected.
The causal attributes and significant relationships of sub-criteria affiliated with Z5 were described in the Figure 10a and 10b, respectively. “Insufficient internal capitals (B52)” and “Limited technology support and business development skills (B55)” belong to the cause group. It is highly possible that they trigger others. According to the values of X*, the importance of the sub-criteria were ranked from “most important” to “least important” and the prior sequence is B52, B53 (Lack of available mortgage assets and cash inflows), B55 and B54 (Partial or full credit constraints). B54 in the bottom left is not important. Therefore, B52, B55 and B53 are the critical sub-criteria affiliated to Z5.
Therefore, eleven sub-criteria were considered very important, as listed in Figure 11. The importance of these key barriers can be ranked according to corresponding X i * values, as shown in Table 14. It can be seen that B22 affiliated with “Market” and B12, B11 and B14 affiliated with “Policy and regulation” are much more important than the others. All factors except B11 and B53 are the origins of the financial difficulties. These findings can aid SMEs’ entrepreneurs, administrators and financiers to overcome obstacles efficiently during energy efficiency financing processes.

5.2. Suggested Measures

According to the above findings, favorable policies are in great need and promotion of such policies is an essential step to overcome these key barriers. Several suggested measures were given by the five expert groups to eliminate key obstacles or weaken their intensity in the current economic and social situations, as shown in Table 15.

6. Conclusions

We have deeply analyzed the difficulties of hindering the financing energy efficiency for SMEs in this paper. Key financing barriers were identified to help authorities, entrepreneurs and financiers in effectively overcoming the serious issues. Our study contributes a valuable way to the elimination of financing bottlenecks and the improvement of investment environment of energy saving. Some main research results have been shown as following.
(1)
A hybrid research framework combining the fuzzy DEMATEL with the fuzzy Delphi approaches was built based on the initial index system. Seventeen significant factors were chosen from potential barriers using the fuzzy Delphi method, involving “policy and regulation”, “market”, “financial institution”, “behavior” and “economic non-market” main criteria. Their causal relations were determined by applying the fuzzy DEMATEL method. Moreover, the expert groups’ opinions were expressed as linguistic ratings to reflect full performances. Clear calculation processes can be performed easily to find out key barriers effectively.
(2)
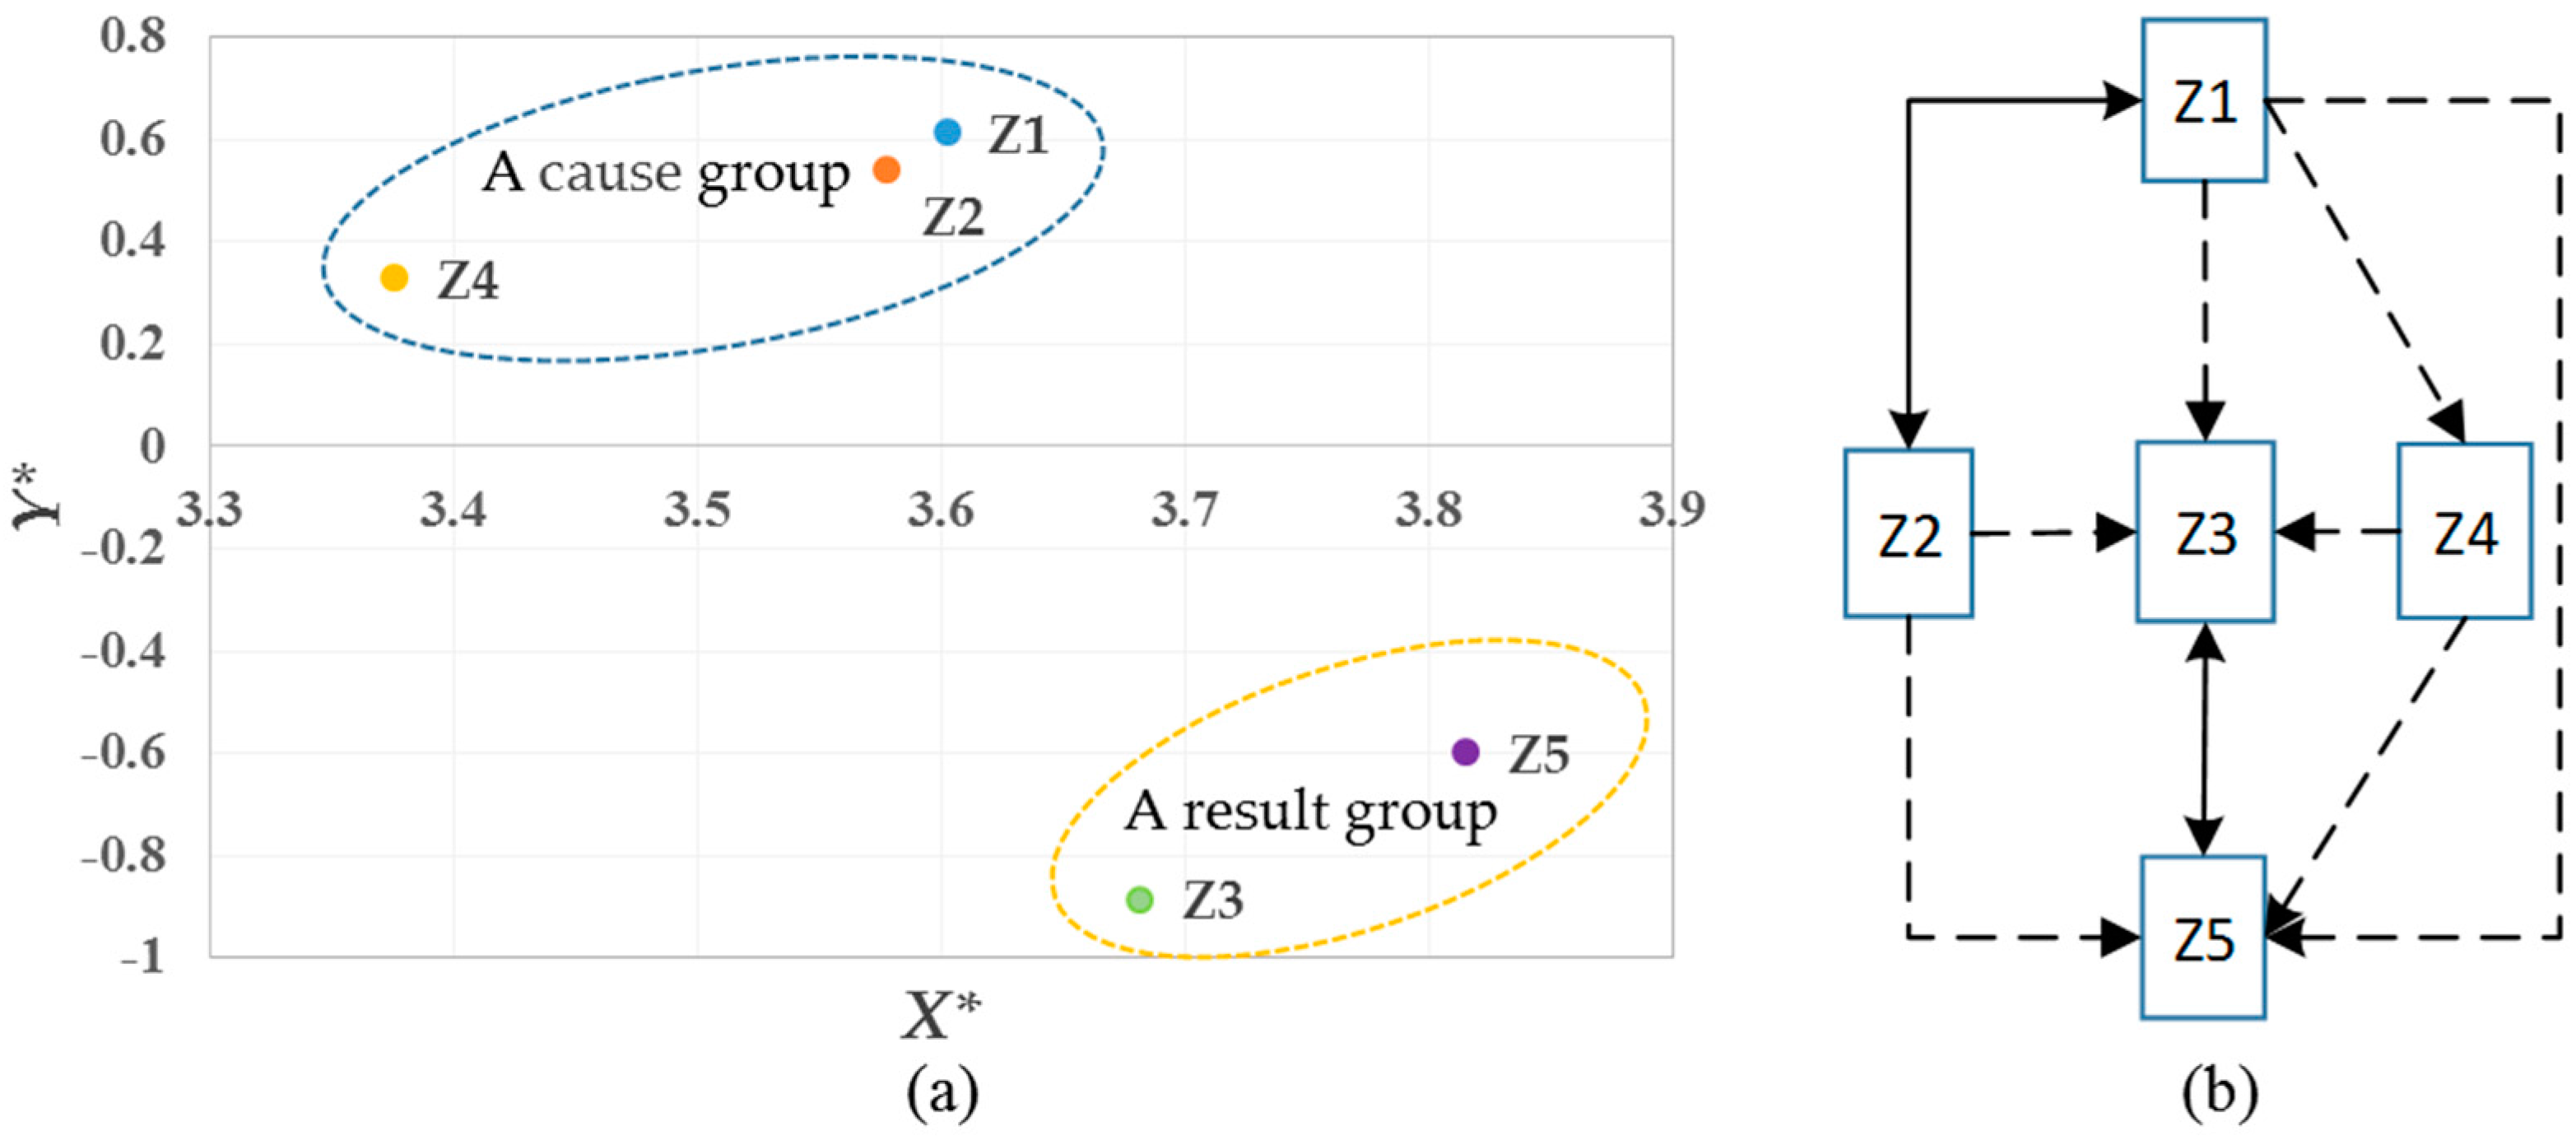
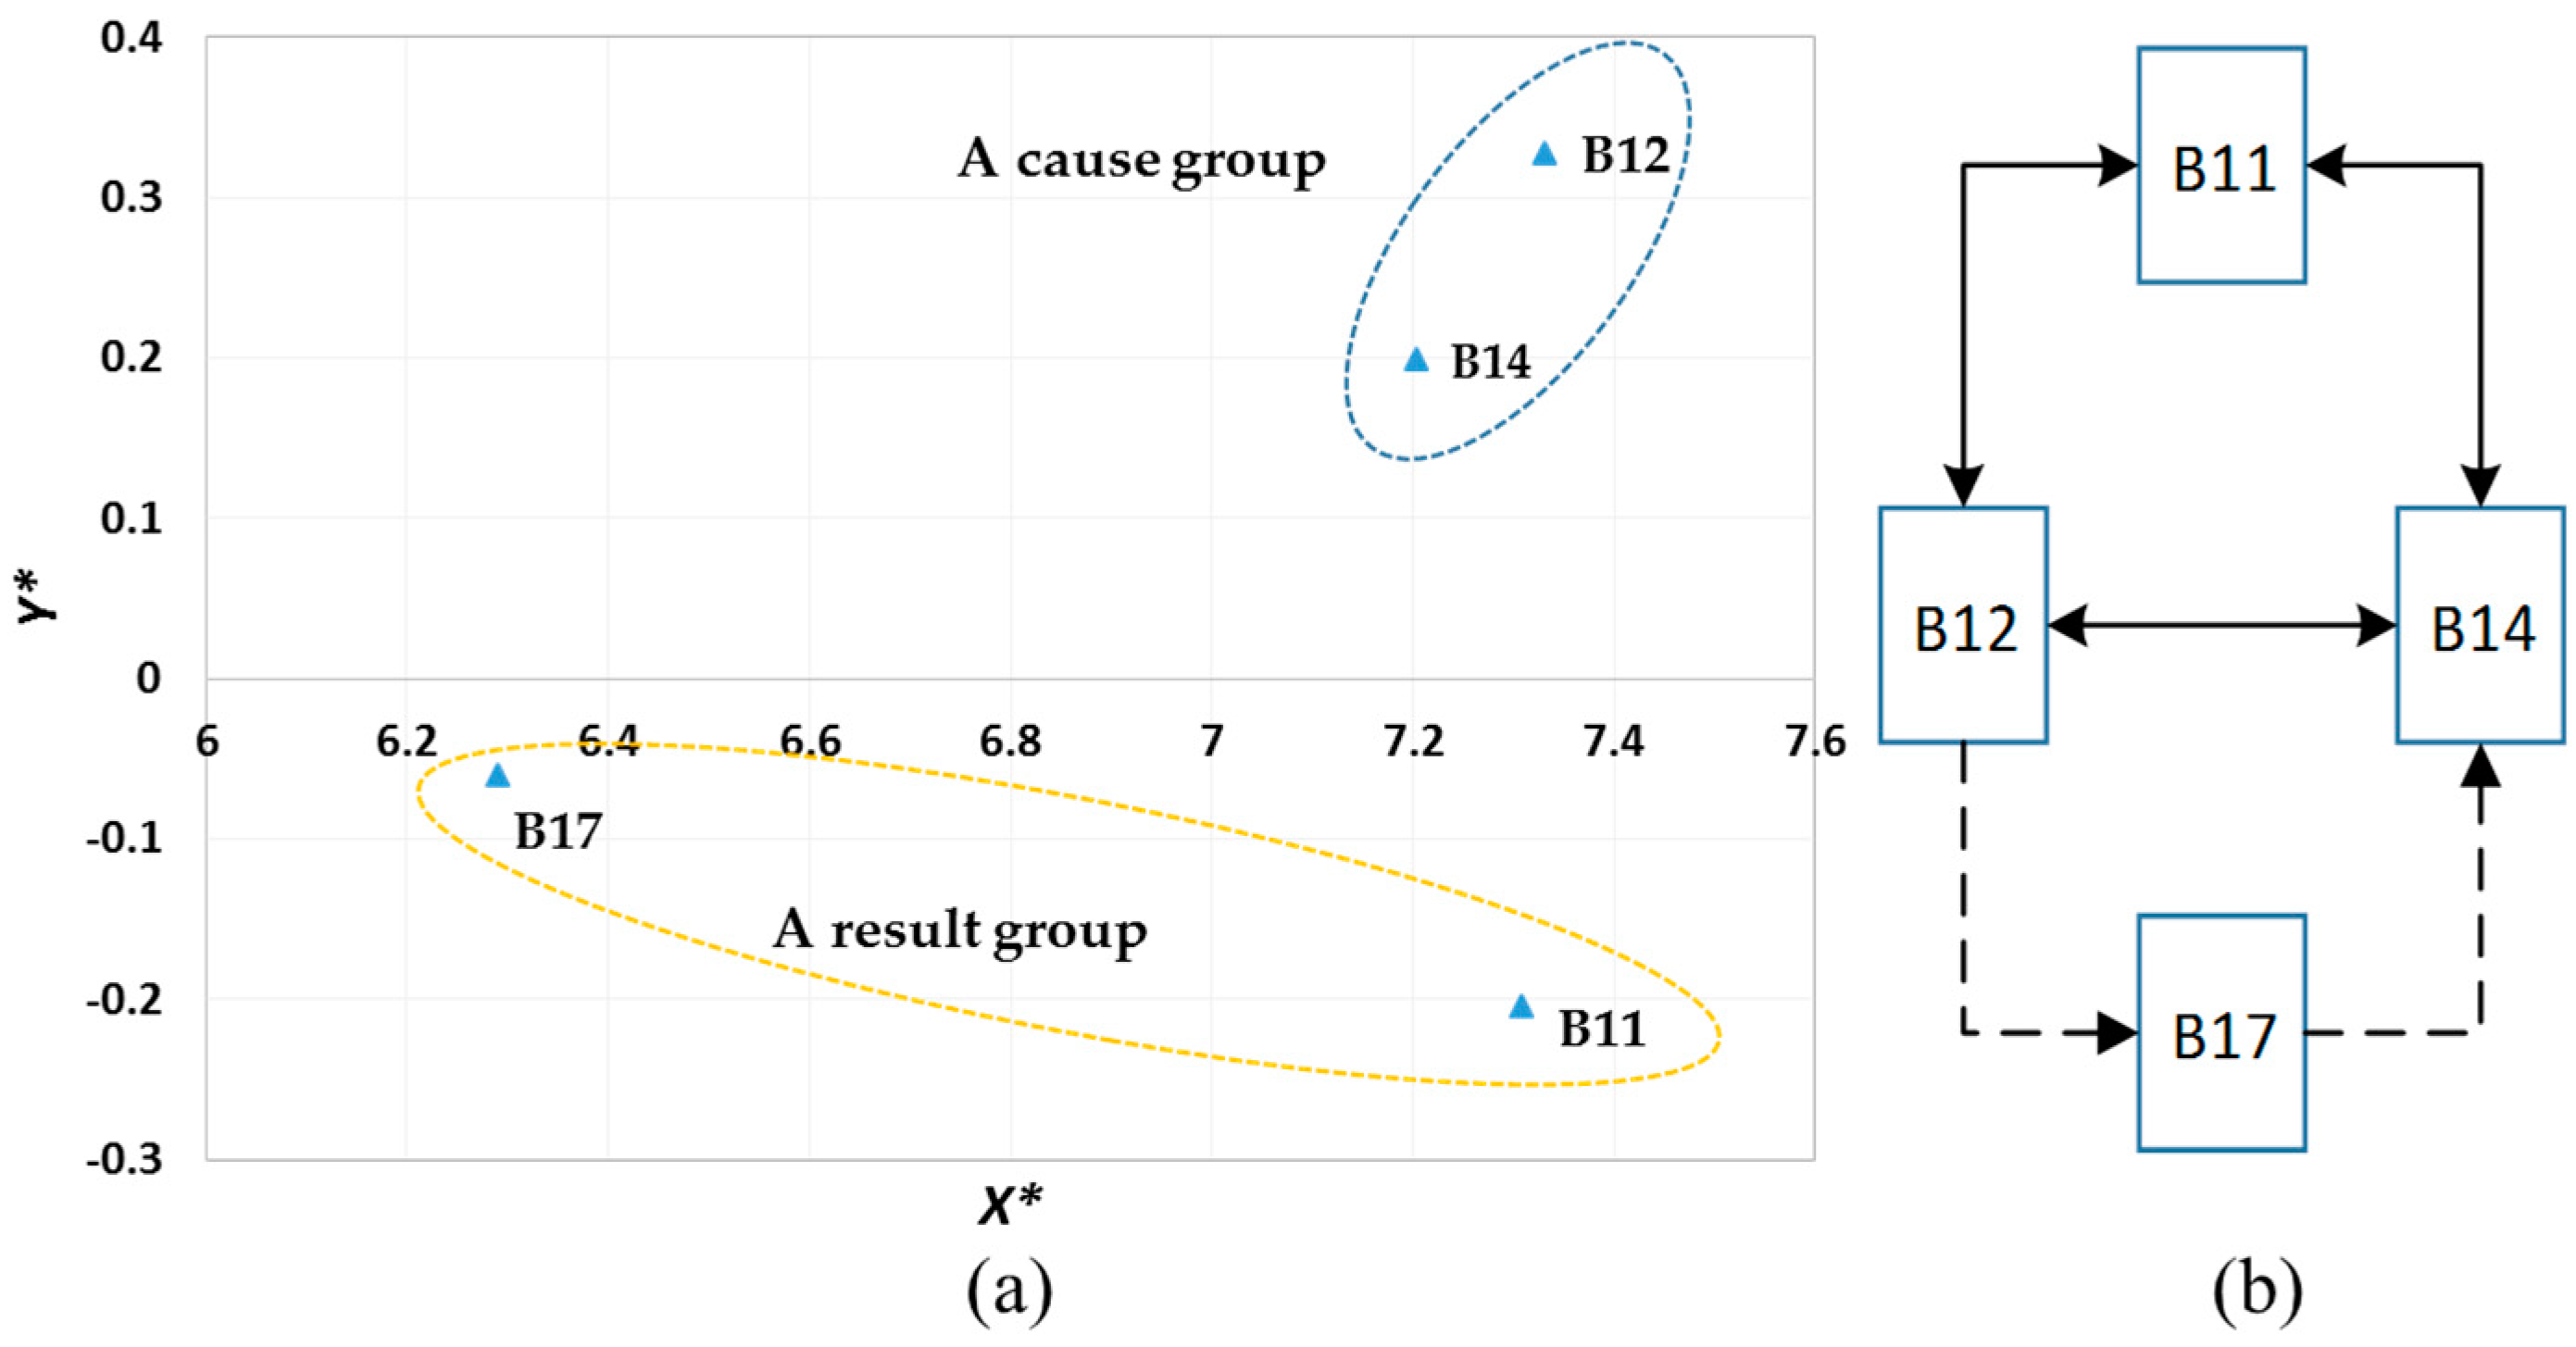
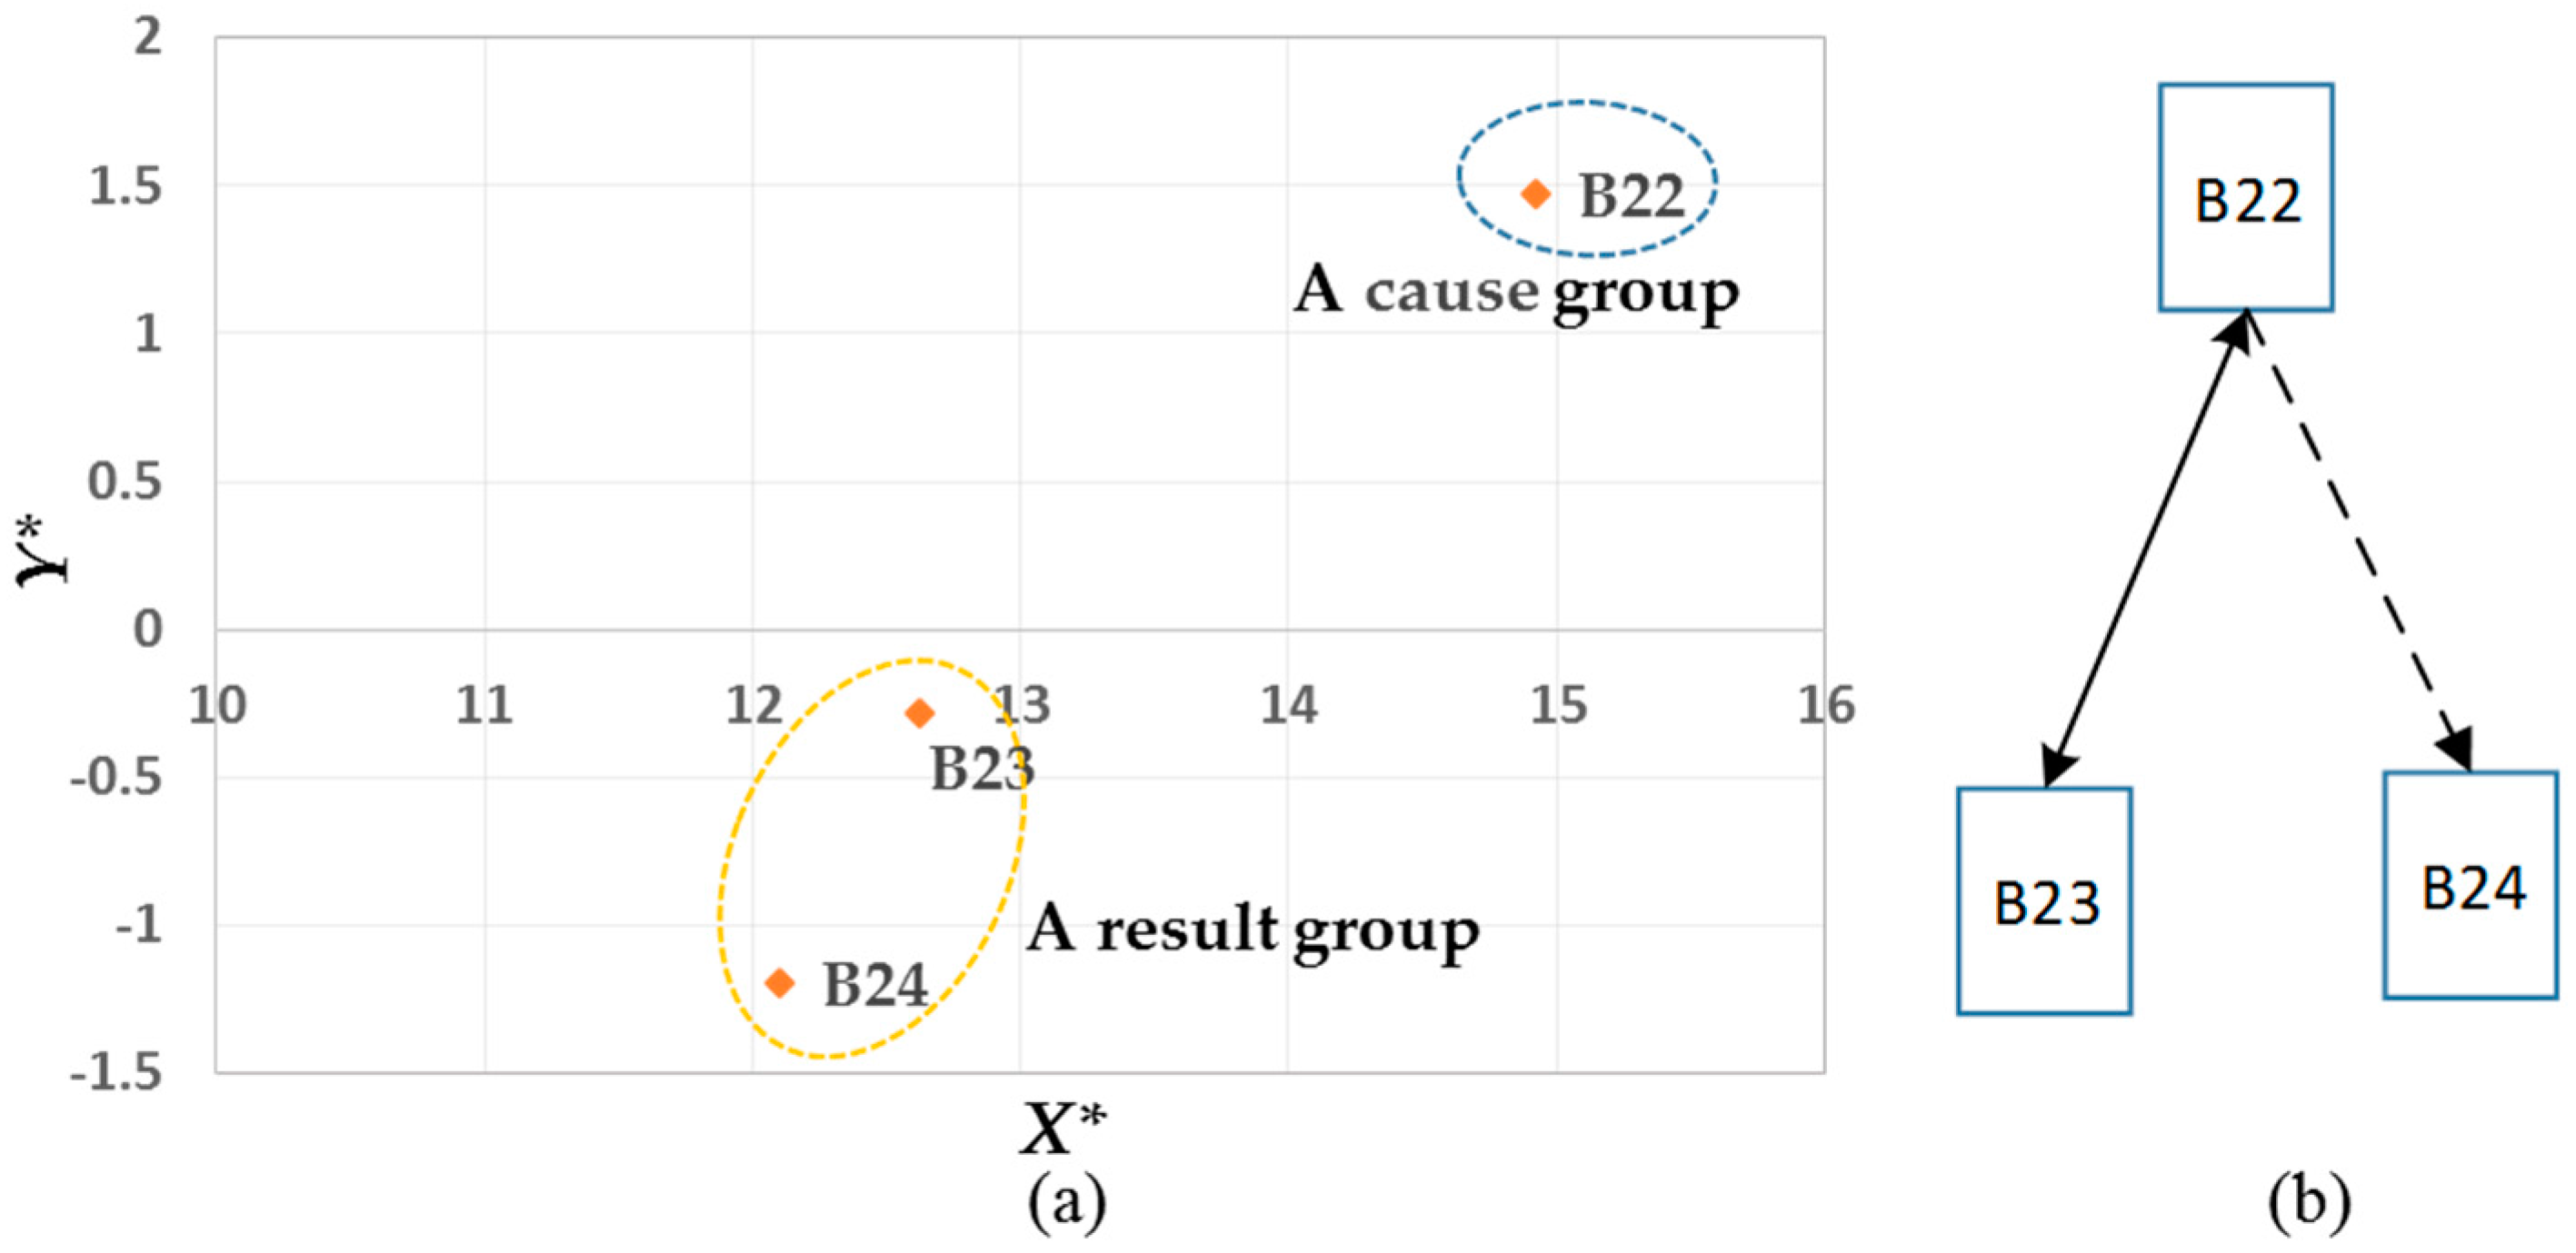
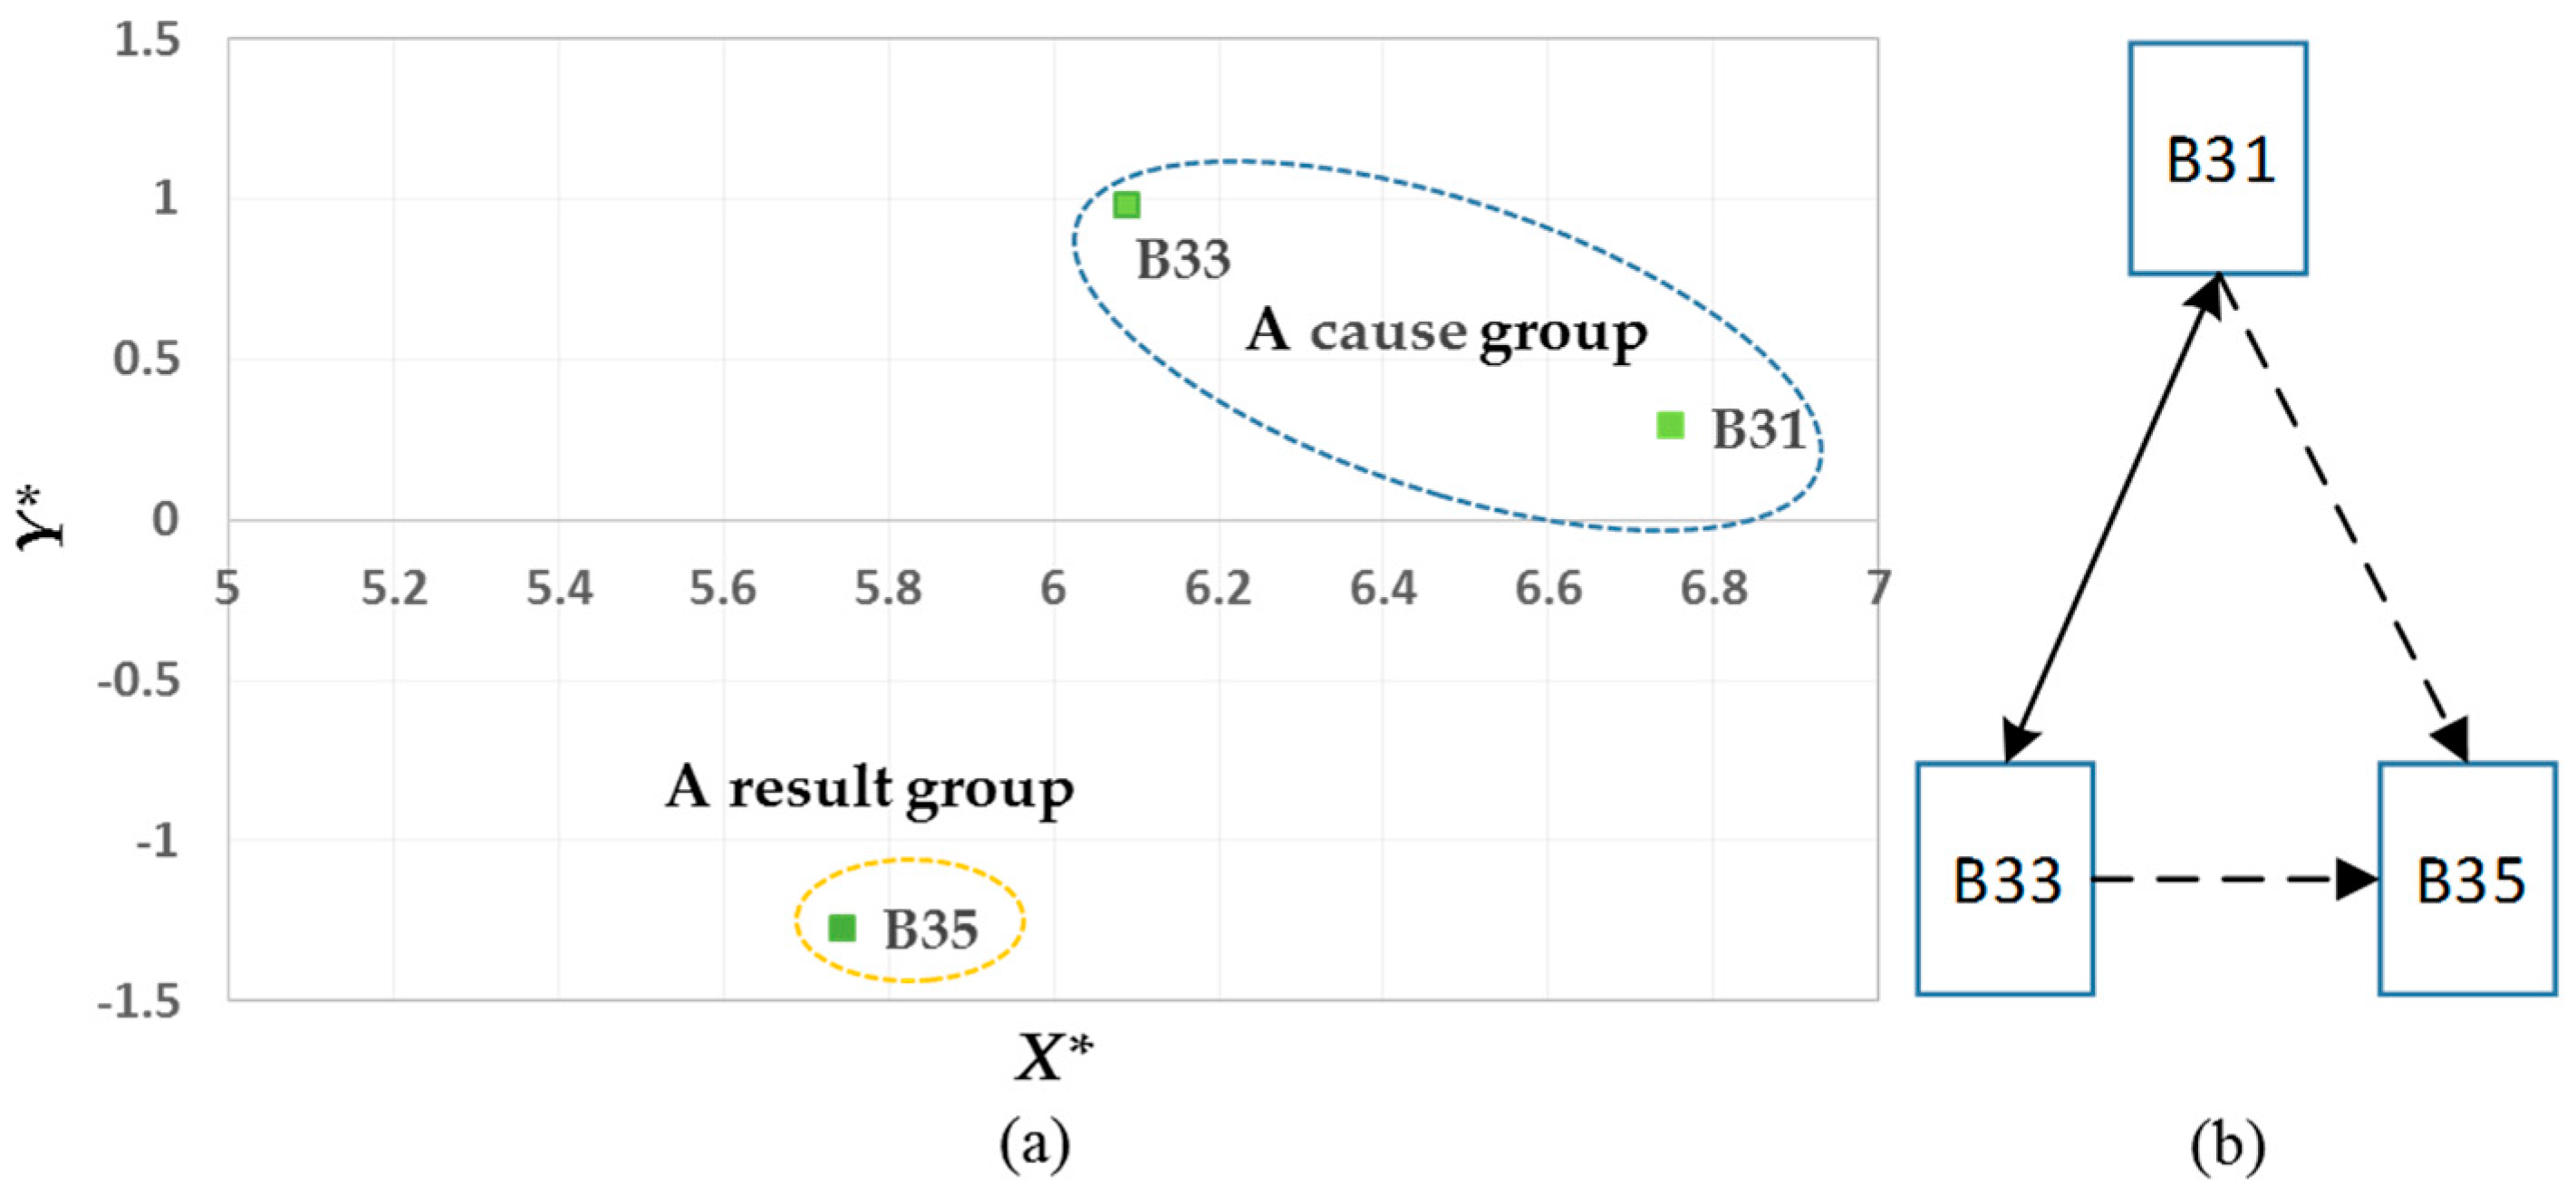
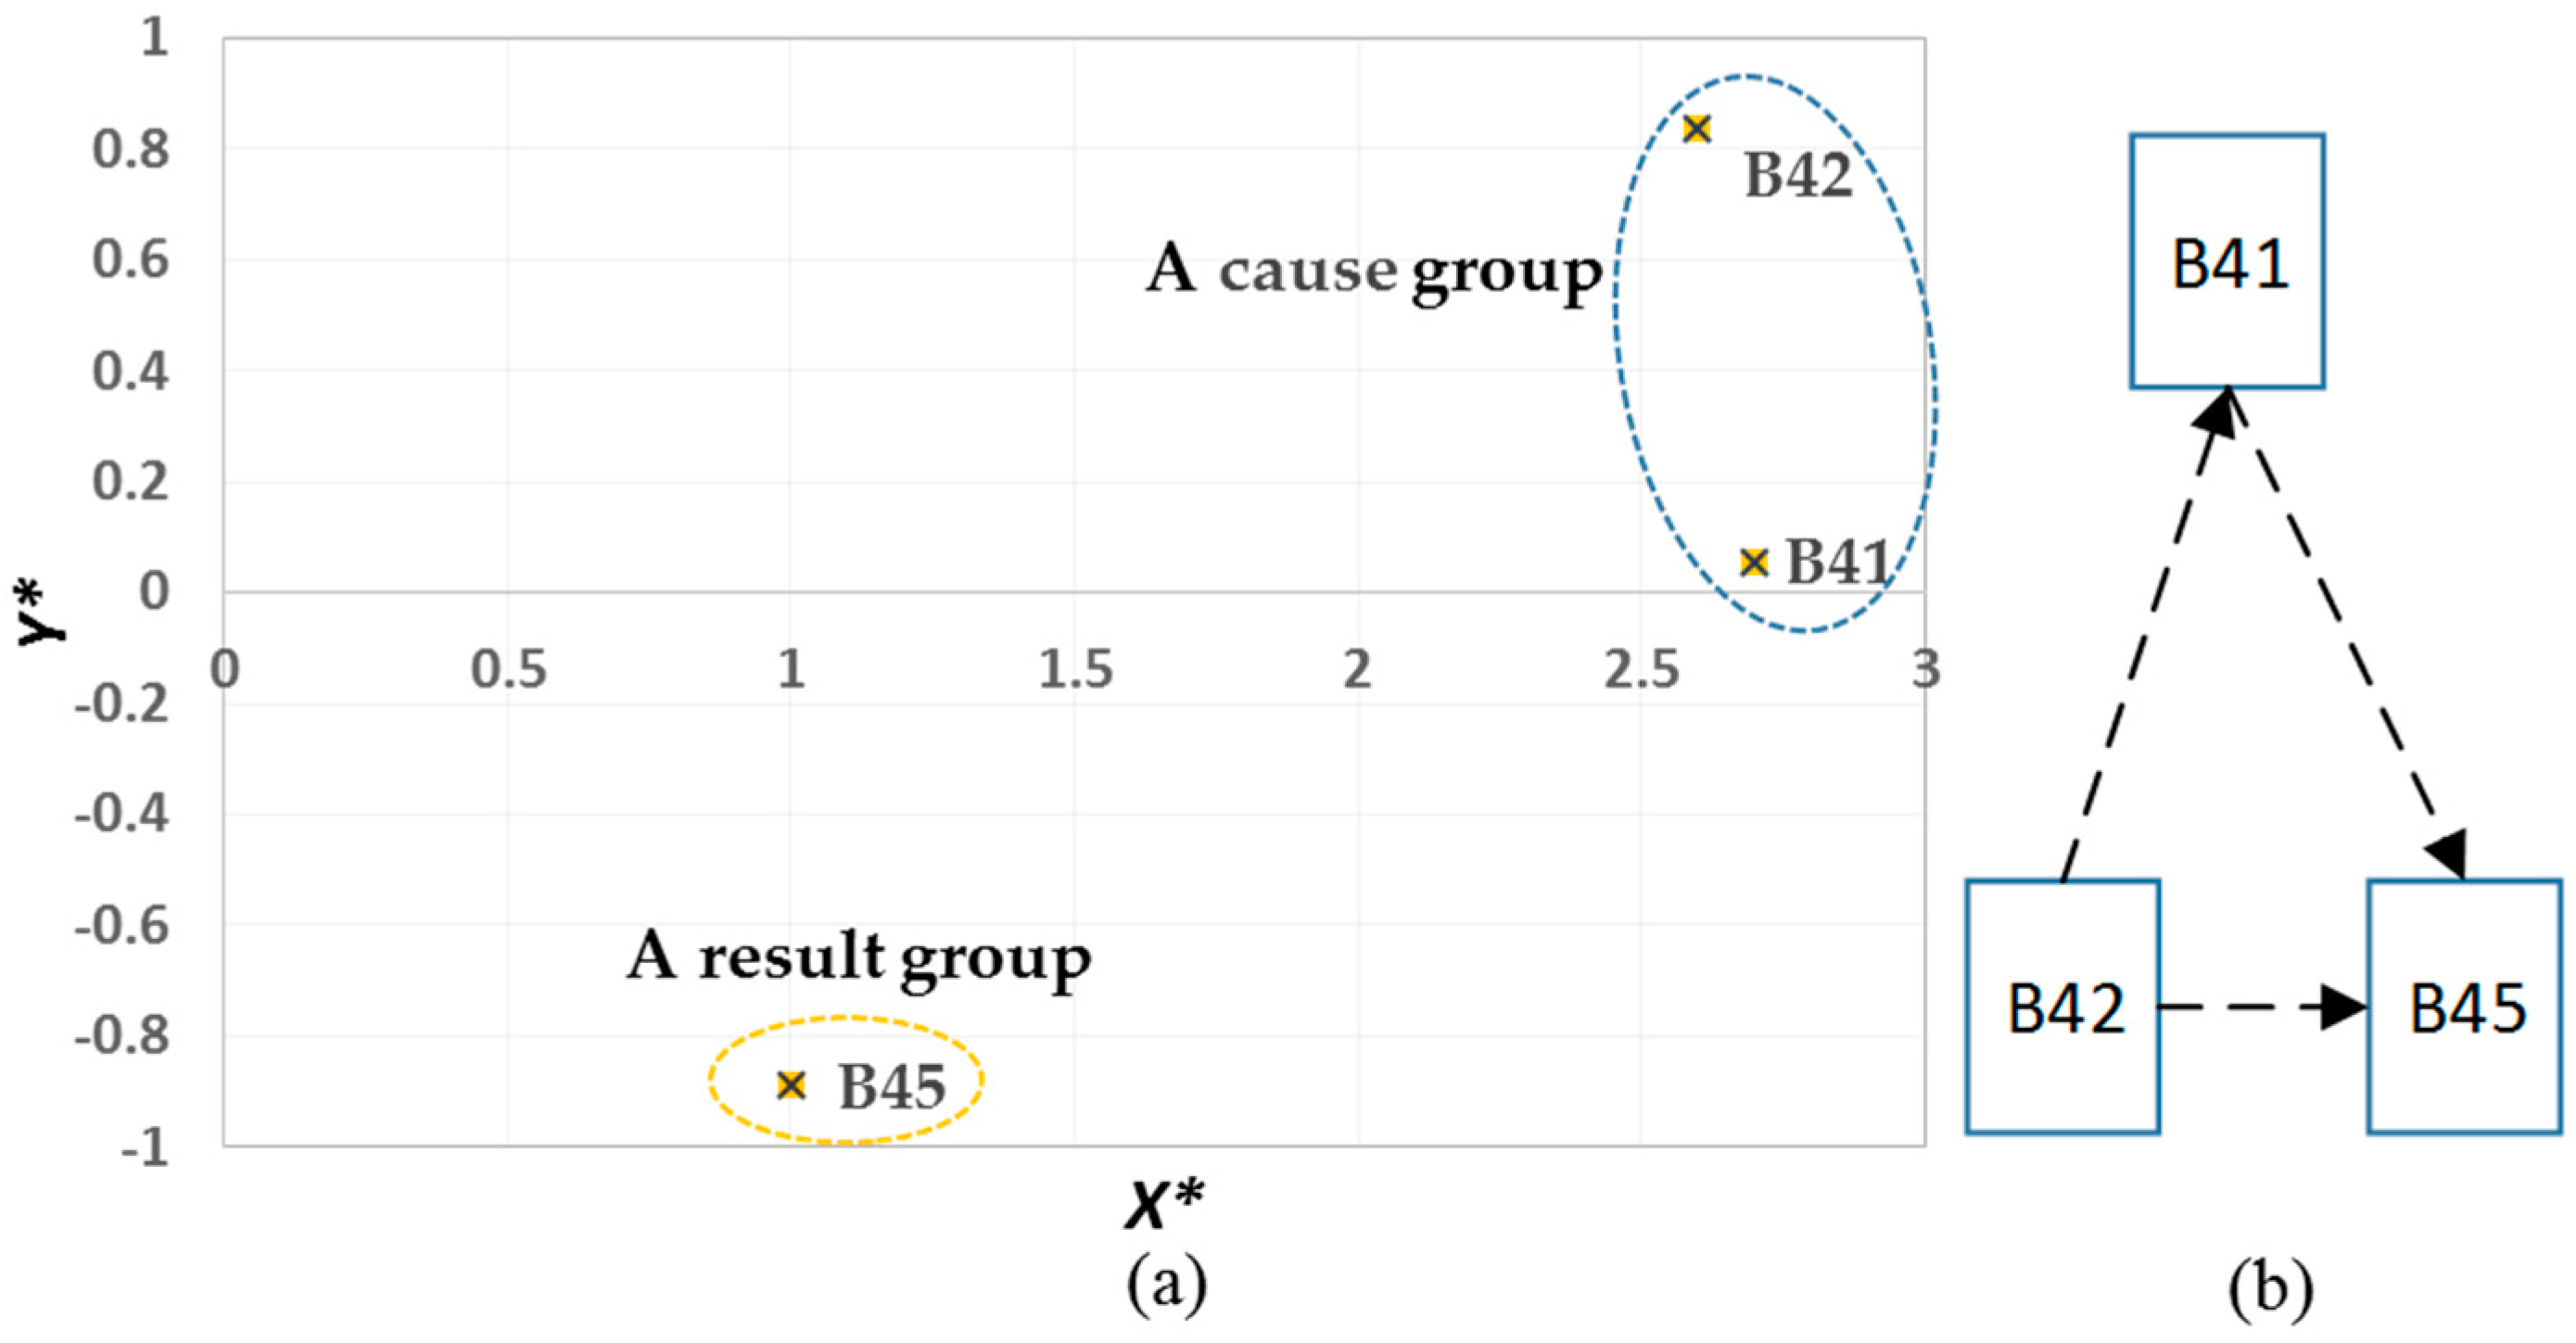
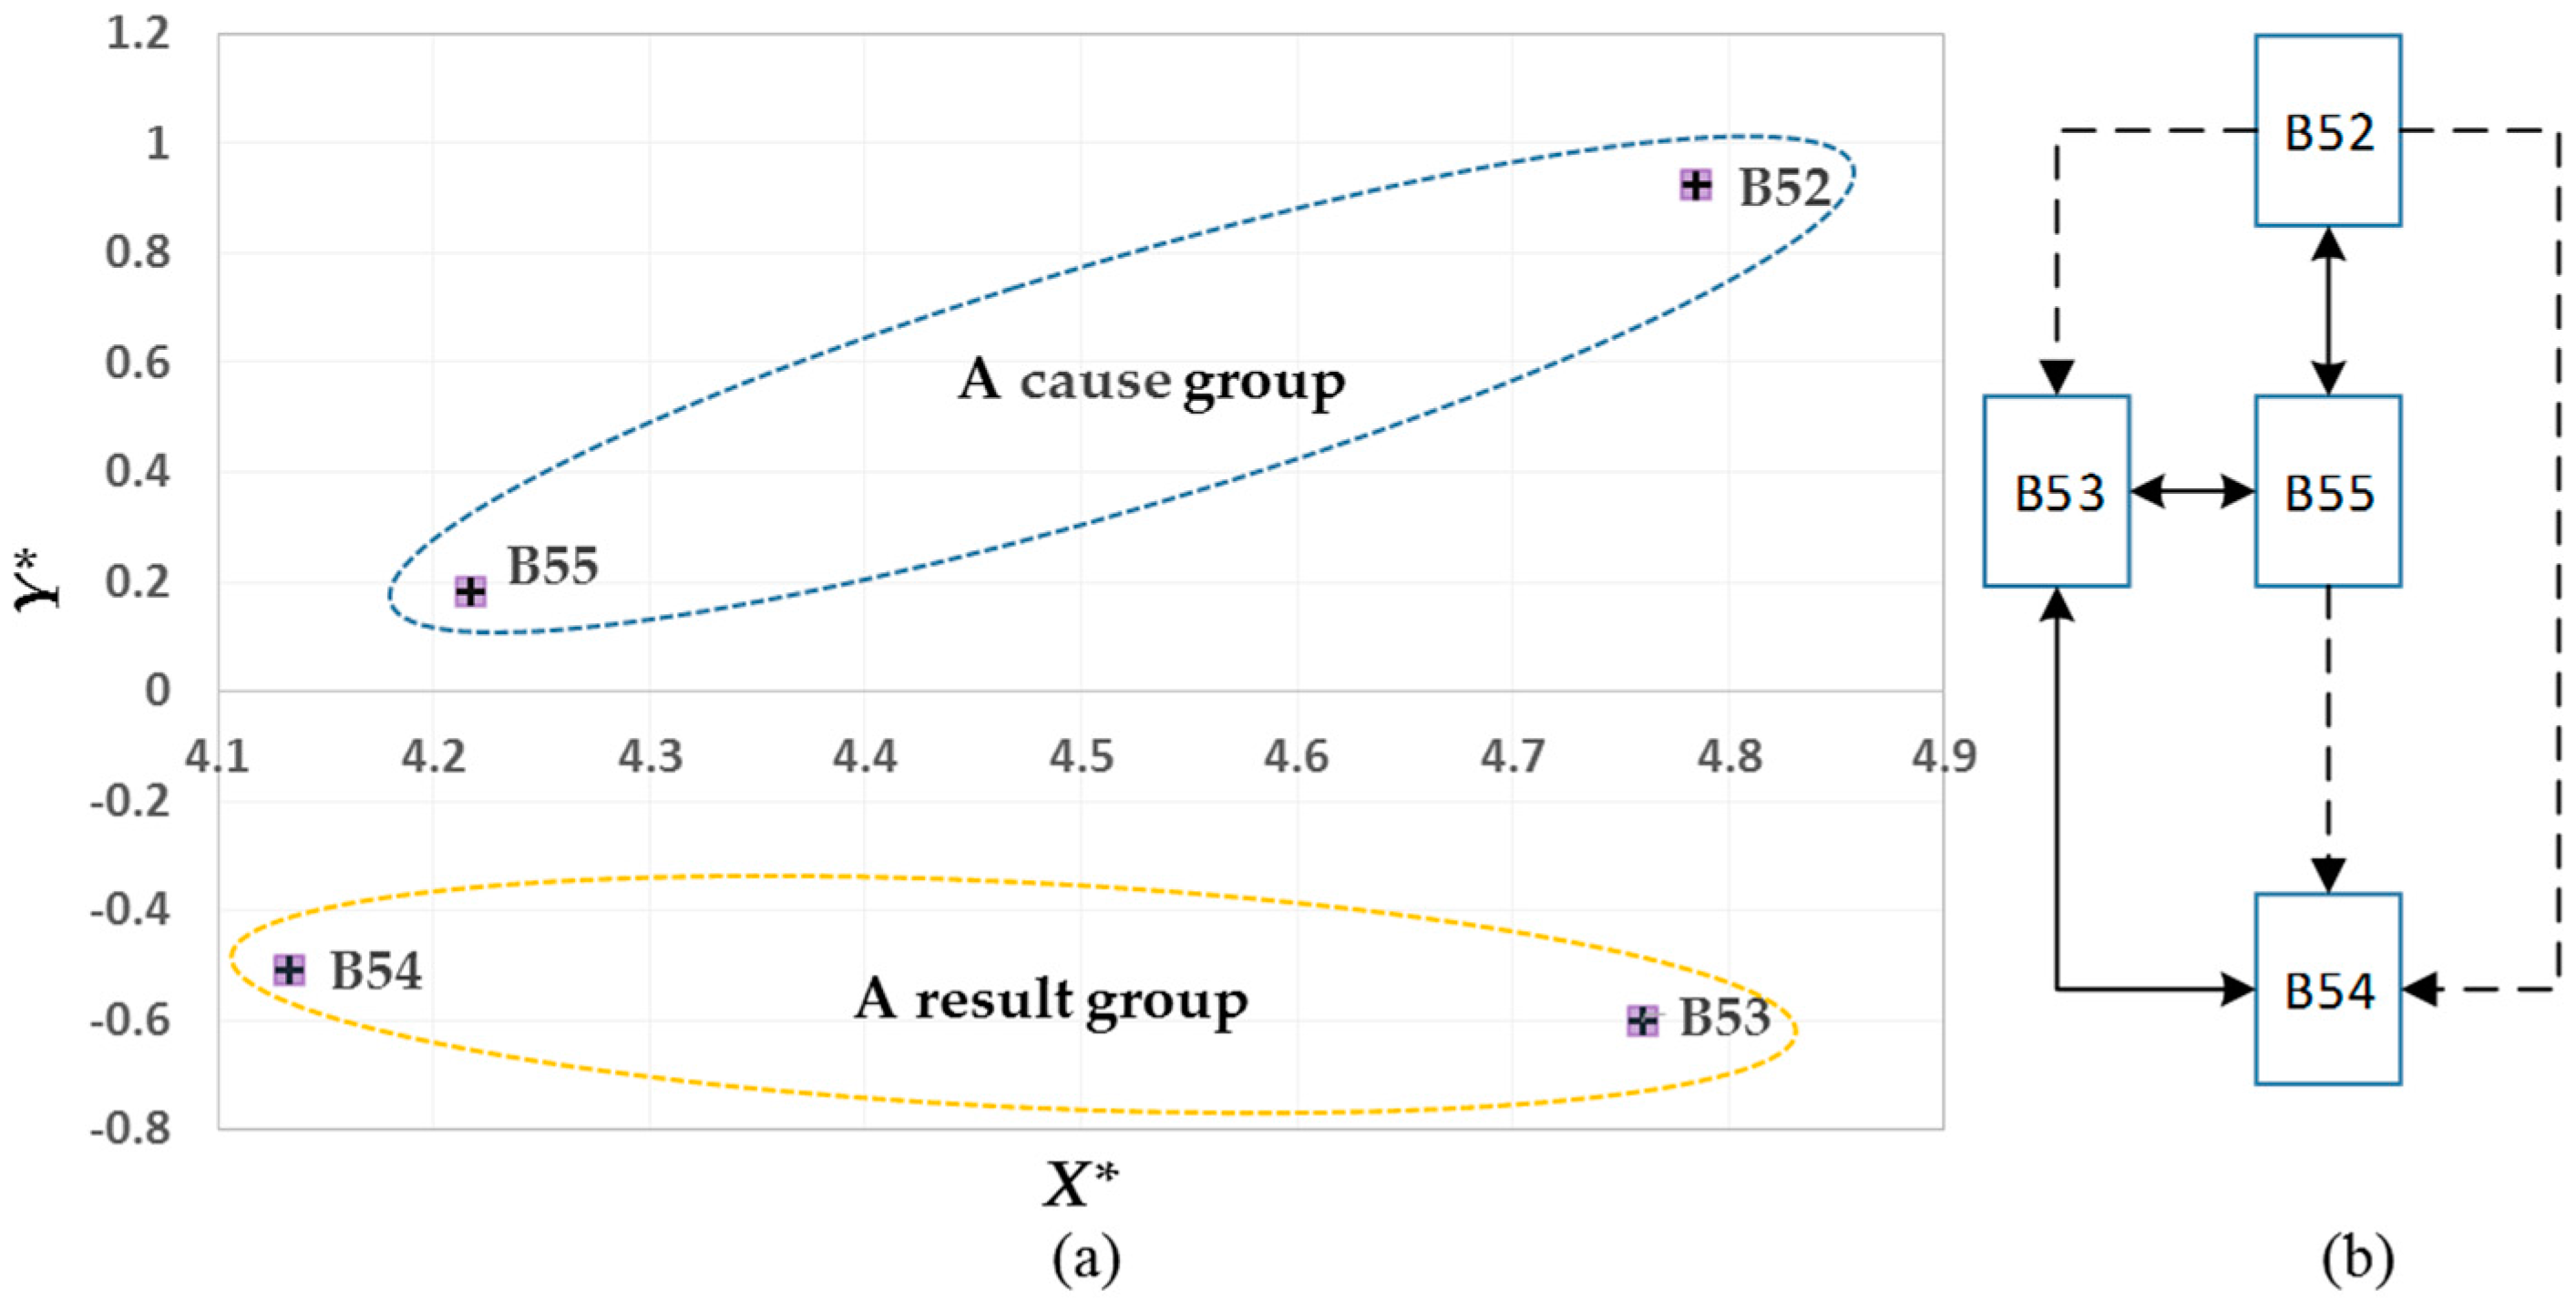
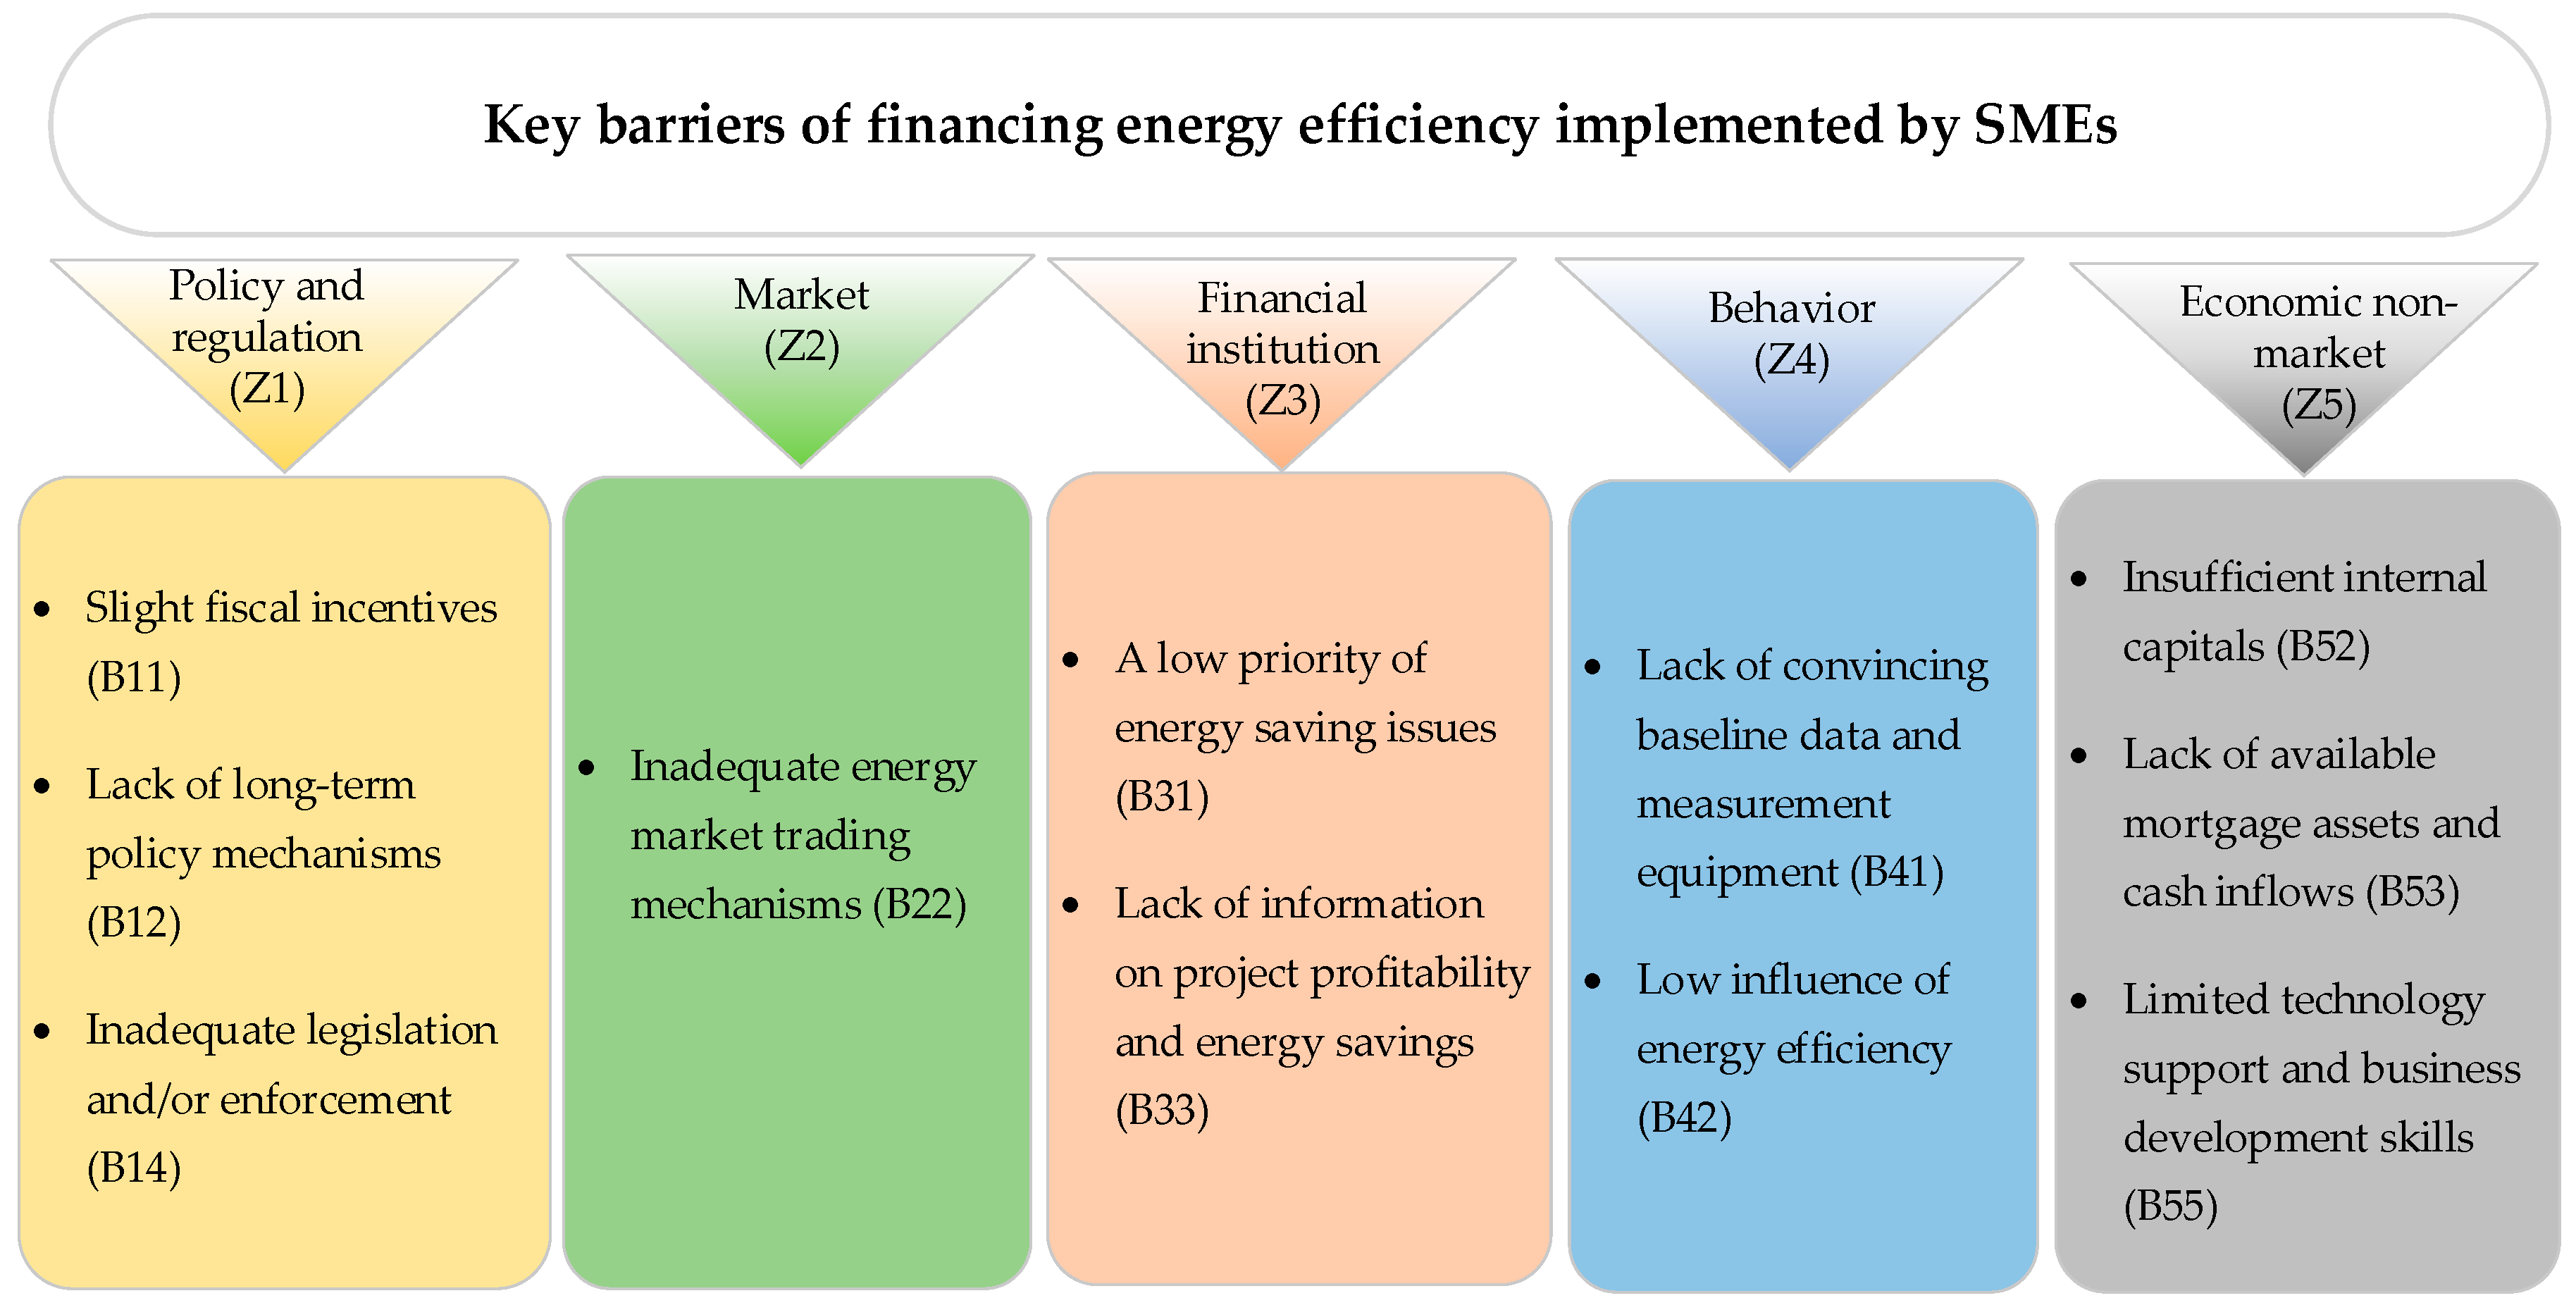
All cause and effect diagrams for different criterion groups were described in Figure 5, Figure 6, Figure 7, Figure 8, Figure 9 and Figure 10. They were analyzed firstly to determine causal characteristics of the significant factors. Eleven factors were chosen as vital barriers, including “Slight fiscal incentives (B11)”, “Lack of long-term policy mechanisms (B12)”, “Inadequate legislation and/or enforcement (B14)” “Inadequate energy market trading mechanisms (B22)”, “A low priority of energy saving issues (B31)”, “Low influence of energy efficiency (B42)”, etc. They are listed in Figure 10. Moreover, B22 in the “Market” and B12, B11 and B14 in the “Policy and regulation” were obtained more attention than the other key barriers. With the exception of B11 and B53, the rest were the origins of energy efficiency financing bottlenecks for SMEs.
(3)
A series of suggested measures were obtained from these expert groups according to the key barriers. These measures are helpful to overcome the energy efficiency financing issues under the current market environment in China. They were listed in Table 15, including a long-term development plan, punitive measures, reliable technical baseline data, etc. In addition, these measures are more likely to be adopted as soon as possible in order to test their effects. Appropriate adjustment is necessary in action to deal with energy efficiency financing bottlenecks for SMEs completely.
It is obvious that the evaluation index system must be changed with development of the market situation. We will grasp the policy and market changes timely and update the potential barriers. The research framework will be computed again based on a new index system in order to track the evolutions of key barriers. In addition, the hybrid methodology can be also applicable to recognize financing obstacles in other domains. In our further study, other methods such as an analytic network process, an ISM method, a fuzzy clustering method, etc. can be involved to extend this research framework. Meanwhile, these analysis results obtained from different methods can also be compared to better overcome ambiguity in group decisions and improve the research results.

Acknowledgments

This study is supported by the Fundamental Research Funds for the Central Universities under Grant No. 2016XS68, Energy Foundation No. G-1509-23762 and Asian Development Bank technical assistance project.

Author Contributions

Jun Dong and Huijuan Huo conceived the research ideas; Huijuan Huo designed the research method framework, performed the empirical analysis and wrote the paper.

Conflicts of Interest

The authors declare no conflict of interest.

References

  1. Ming, Z.; Song, X.; Mingjuan, M.; Xiaoli, Z. New energy bases and sustainable development in China: A review. Renew. Sustain. Energy Rev. 2013, 20, 169–185. [Google Scholar] [CrossRef]
  2. Wang, H.; Zhang, Y.; Lu, X.; Nielsen, C.P.; Bi, J. Understanding China’s carbon dioxide emissions from both production and consumption perspectives. Renew. Sustain. Energy Rev. 2015, 52, 189–200. [Google Scholar] [CrossRef]
  3. Herring, H. Energy efficiency—A critical view. Energy 2006, 31, 10–20. [Google Scholar] [CrossRef]
  4. Jiang, P.; Chen, Y.; Geng, Y.; Dong, W.; Xue, B.; Xu, B. Analysis of the co-benefits of climate change mitigation and air pollution reduction in China. J. Clean. Prod. 2013, 58, 130–137. [Google Scholar] [CrossRef]
  5. Sarkar, A.; Singh, J. Financing energy efficiency in developing countries—Lessons learned and remaining challenges. Energy Policy 2010, 38, 5560–5571. [Google Scholar] [CrossRef]
  6. Teng, F.; Gu, A. Climate change: National and local policy opportunities in China. Environ. Sci. 2007, 4, 183–194. [Google Scholar] [CrossRef]
  7. Yu, Y. Policy redesign for solving the financial bottleneck in demand side management (DSM) in China. Energy Policy 2010, 38, 6101–6110. [Google Scholar] [CrossRef]
  8. Stieß, I.; Dunkelberg, E. Objectives, barriers and occasions for energy efficient refurbishment by private homeowners. J. Clean. Prod. 2013, 48, 250–259. [Google Scholar] [CrossRef]
  9. Du Can, S.D.L.R.; Leventis, G.; Phadke, A.; Gopal, A. Design of incentive programs for accelerating penetration of energy-efficient appliances. Energy Policy 2014, 72, 56–66. [Google Scholar] [CrossRef]
  10. Raeesi, R.; Dastranj, M.; Mohammadi, S.; Rasouli, E. Understanding the interactions among the barriers to entrepreneurship using interpretive structural modeling. J. Bus. Res. 2013, 8, 56. [Google Scholar] [CrossRef]
  11. Li, Y. AHP-Fuzzy evaluation on financing bottleneck in energy performance contracting in China. Energy Procedia 2012, 14, 121–126. [Google Scholar] [CrossRef]
  12. Chai, K.-H.; Yeo, C. Overcoming energy efficiency barriers through systems approach—A conceptual framework. Energy Policy 2012, 46, 460–472. [Google Scholar] [CrossRef]
  13. Schleich, J.; Gruber, E. Beyond case studies: Barriers to energy efficiency in commerce and the services sector. Energy Econ. 2008, 30, 449–464. [Google Scholar] [CrossRef]
  14. Venkatesh, V.; Rathi, S.; Patwa, S. Analysis on supply chain risks in Indian apparel retail chains and proposal of risk prioritization model using Interpretive structural modeling. J. Retail. Consum. Serv. 2015, 26, 153–167. [Google Scholar] [CrossRef]
  15. Xu, P.; Chan, E.H.; Visscher, H.J.; Zhang, X.; Wu, Z. Sustainable building energy efficiency retrofit for hotel buildings using EPC mechanism in China: Analytic Network Process (ANP) approach. J. Clean. Prod. 2015, 107, 378–388. [Google Scholar] [CrossRef]
  16. Garg, N.; Maji, S. Fuzzy TOPSIS approach in selection of optimal noise barrier for traffic noise abatement. Arch. Acoust. 2015, 40, 453–467. [Google Scholar] [CrossRef]
  17. Dos Muchangos, L.S.; Tokai, A.; Hanashima, A. Application of the Delphi method to the identification of barriers to a waste management policy in Maputo city, Mozambique. J. Sustain. Dev. 2015, 8, 146. [Google Scholar] [CrossRef]
  18. Dos Muchangos, L.S.; Tokai, A.; Hanashima, A. Analyzing the structure of barriers to municipal solid waste management policy planning in Maputo city, Mozambique. Environ. Dev. 2015, 16, 76–89. [Google Scholar] [CrossRef]
  19. Rezazadeh, A.; Najafi, S.; Hatami-Shirkouhi, L.; Miri-Nargesi, S. Evaluating and prioritising critical success factors of TQM implementation based on fuzzy AHP. Int. J. Product. Qual. Manag. 2012, 9, 1–24. [Google Scholar] [CrossRef]
  20. Cai, W.; Wu, Y.; Zhong, Y.; Ren, H. China building energy consumption: Situation, challenges and corresponding measures. Energy Policy 2009, 37, 2054–2059. [Google Scholar] [CrossRef]
  21. Taylor, R.P.; Govindarajalu, C.; Levin, J.; Meyer, A.S.; Ward, W.A. Financing Energy Efficiency: Lessons from Brazil, China, India, and Beyond; World Bank Publications: Washington, DC, USA, 2008. [Google Scholar]
  22. Chandler, W.; Gwin, H.; Chen, S.P. Financing Energy Efficiency in China: 2011 Update; Energy Transition Research Institute: Annapolis, MA, USA, 2011. [Google Scholar]
  23. Shen, B.; Wang, J.; Li, M.; Li, J.; Price, L.; Zeng, L. China’s approaches to financing sustainable development: Policies, practices, and issues. Wiley Interdiscip. Rev. Energy Environ. 2013, 2, 178–198. [Google Scholar] [CrossRef]
  24. Rohdin, P.; Thollander, P.; Soldin, P. Barriers to and drivers for energy efficiency in the Swedish foundry industry. Energy Policy 2007, 35, 672–677. [Google Scholar] [CrossRef]
  25. Cagno, E.; Worrell, E.; Trianni, A.; Pugliese, G. A novel approach for barriers to industrial energy efficiency. Renew. Sustain. Energy Rev. 2013, 19, 90–308. [Google Scholar] [CrossRef]
  26. Sorrell, S.; Schleich, J.; Scott, S.; O’malley, E.; Trace, F.; Boede, U.; Ostertag, K.; Radgen, P. Reducing Barriers to Energy Efficiency in Public and Private Organizations Energy Research Centre—Science and Technology Policy Research (SPRU); University of Sussex: Brighton, UK, 2000. [Google Scholar]
  27. Trianni, A.; Cagno, E. Dealing with barriers to energy efficiency and SMEs: Some empirical evidences. Energy 2012, 37, 494–504. [Google Scholar] [CrossRef]
  28. Da-li, G. Energy service companies to improve energy efficiency in China: Barriers and removal measures. Procedia Earth Planet. Sci. 2009, 1, 1695–1704. [Google Scholar] [CrossRef]
  29. Wang, T.; Li, X.; Liao, P.C.; Fang, D. Building energy efficiency for public hospitals and healthcare facilities in China: Barriers and drivers. Energy 2016, 103, 588–597. [Google Scholar] [CrossRef]
  30. Brown, M.A. Market failures and barriers as a basis for clean energy policies. Energy Policy 2001, 29, 1197–1207. [Google Scholar] [CrossRef]
  31. Wang, G.; Wang, Y.; Zhao, T. Analysis of interactions among the barriers to energy saving in China. Energy Policy 2008, 36, 1879–1889. [Google Scholar] [CrossRef]
  32. Painuly, J.P.; Park, H.; Lee, M.K.; Noh, J. Promoting energy efficiency financing and ESCOs in developing countries: Mechanisms and barriers. J. Clean. Prod. 2003, 11, 659–665. [Google Scholar] [CrossRef]
  33. Nagesha, N.; Balachandra, P. Barriers to energy efficiency in small industry clusters: Multi-criteria-based prioritization using the analytic hierarchy process. Energy 2006, 31, 1969–1983. [Google Scholar] [CrossRef]
  34. Hasanbeigi, A.; Menke, C.; Du Pont, P. Barriers to energy efficiency improvement and decision-making behavior in Thai industry. Energy Effic. 2010, 3, 33–52. [Google Scholar] [CrossRef]
  35. Thollander, P.; Dotzauer, E. An energy efficiency program for Swedish industrial small-and medium-sized enterprises. J. Clean. Prod. 2010, 18, 1339–1346. [Google Scholar] [CrossRef]
  36. Haselip, J.; Desgain, D.; Mackenzie, G. Financing energy SMEs in Ghana and Senegal: Outcomes, barriers and prospects. Energy Policy 2014, 65, 369–376. [Google Scholar] [CrossRef]
  37. Garbuzova-Schlifter, M.; Madlener, R. Prospects and barriers for Russia’s emerging ESCO market. Int. J. Energy Sect. Manag. 2013, 7, 113–150. [Google Scholar] [CrossRef]
  38. Dalkey, N.; Helmer, O. An experimental application of the Delphi method to the use of experts. Manag. Sci. 1963, 9, 458–467. [Google Scholar] [CrossRef]
  39. Kauko, K.; Palmroos, P. The Delphi method in forecasting financial markets—An experimental study. Int. J. Forecast. 2014, 30, 313–327. [Google Scholar] [CrossRef]
  40. Bouzon, M.; Govindan, K.; Rodriguez, C.M.T.; Campos, L.M. Identification and analysis of reverse logistics barriers using fuzzy Delphi method and AHP. Resour. Conserv. Recycl. 2016, 108, 182–197. [Google Scholar] [CrossRef]
  41. Zhao, H.; Li, N. Optimal siting of charging stations for electric vehicles based on fuzzy Delphi and hybrid multi-criteria decision making approaches from an extended sustainability perspective. Energies 2016, 9, 270. [Google Scholar] [CrossRef]
  42. Gabus, A.; Fontela, E. World Problems, an Invitation to Further thought within the Framework of DEMATEL; Battelle Geneva Research Center: Geneva, Switzerland, 1972. [Google Scholar]
  43. Tzeng, G.-H.; Chiang, C.-H.; Li, C.-W. Evaluating intertwined effects in e-learning programs: A novel hybrid MCDM model based on factor analysis and DEMATEL. Expert Syst. Appl. 2007, 32, 1028–1044. [Google Scholar] [CrossRef]
  44. Yang, Y.-P.O.; Shieh, H.M.; Tzeng, G.H. A VIKOR technique based on DEMATEL and ANP for information security risk control assessment. Inf. Sci. 2013, 232, 482–500. [Google Scholar] [CrossRef]
  45. Govindan, K.; Khodaverdi, R.; Vafadarnikjoo, A. Intuitionistic fuzzy based DEMATEL method for developing green practices and performances in a green supply chain. Expert Syst. Appl. 2015, 42, 7207–7220. [Google Scholar] [CrossRef]
  46. Jia, H.; Qi, Y.; Mu, Y. Frequency response of autonomous microgrid based on family-friendly controllable loads. Sci. China Technol. Sci. 2013, 56, 693–702. [Google Scholar] [CrossRef]
  47. Mirmousa, S.; Dehnavi, H.D. Development of criteria of selecting the supplier by using the fuzzy DEMATEL method. Procedia Soc. Behav. Sci. 2016, 230, 281–289. [Google Scholar] [CrossRef]
  48. Jassbi, J.; Mohamadnejad, F.; Nasrollahzadeh, H. A Fuzzy DEMATEL framework for modeling cause and effect relationships of strategy map. Expert Syst. Appl. 2011, 38, 5967–5973. [Google Scholar] [CrossRef]
  49. Lin, C.; Wu, W.W. A fuzzy extension of the DEMATEL method for group decision making. Eur. J. Oper. Res. 2004, 156, 445–455. [Google Scholar]
  50. Hsu, C.-Y.; Chen, K.-T.; Tzeng, G.-H. FMCDM with fuzzy DEMATEL approach for customers’ choice behavior model. Int. J. Fuzzy Syst. 2007, 9, 236. [Google Scholar]
  51. Kostka, G.; Moslener, U.; Andreas, J. Barriers to increasing energy efficiency: Evidence from small-and medium-sized enterprises in China. J. Clean. Prod. 2013, 57, 59–68. [Google Scholar] [CrossRef]
Figure 1. Primary financing sources for energy efficiency projects.
Energies 10 01172 g001
Figure 2. A fuzzy Delphi-DEMATEL based framework of energy efficiency financing barriers analysis.
Energies 10 01172 g002
Figure 3. The final evaluation system of identifying key energy efficiency financing barriers for SMEs.
Energies 10 01172 g003
Figure 4. Sub-criteria importance results for the five expert groups.
Energies 10 01172 g004
Figure 5. Cause and effect diagrams among main criteria. (a) The causal attributes of all main criteria and (b) the significant relations between main criteria
Energies 10 01172 g005
Figure 6. Cause and effect diagrams for the policy and regulation. (a) The sub-criteria causal attributes affiliated with the group and (b) the significant relations between these sub-criteria.
Energies 10 01172 g006
Figure 7. Cause and effect diagrams for the market. (a) The causal attributes of the sub-criteria in this group and (b) corresponding significant relations.
Energies 10 01172 g007
Figure 8. Cause and effect diagrams for the financial institution. (a) The causal attributes of corresponding sub-criteria and (b) significant interactions.
Energies 10 01172 g008
Figure 9. Cause and effect diagrams for the behavior. (a) The causal characteristics of corresponding sub-criteria and (b) obvious cause and effect relations.
Energies 10 01172 g009
Figure 10. Cause and effect diagrams for the economic non-market. (a) The causal attributes and (b) significant relationships of sub-criteria affiliated with Z5.
Energies 10 01172 g010
Figure 11. A list of key financial barriers.
Energies 10 01172 g011
Table 1. A summary of barriers of energy efficiency financing for SMEs based on literatures.
Barrier FactorsLiteratures
CriteriaSub-Criteria
Policy and regulation
  • Slight fiscal incentives
  • Da-li [28], Wang et al. [29], Brown [30]
  • Lack of long-term policy mechanisms
  • Shen et al., [23], Wang et al. [31], Painuly et al. [32]
  • Lack of appropriate evaluation guidelines
  • Shen et al., [23], Cagno [25]
  • Inadequate legislation and/or enforcement
  • Da-li [28],Wang et al. [31], Nagesha et al. [33]
  • Insufficient monitoring
  • Trianni et al. [27], Da-li [28]
  • Strict constraints on foreign exchange
  • Shen et al. [23]
  • Insufficient institutional capacity
  • Shen et al. [23], Nagesha et al. [33], Hasanbeigi [34]
  • Limited energy efficiency standards
  • Shen et al. [23], Wang et al. [31]
  • Lack of enforceable measurement criteria
  • Shen et al. [23], Da-li [28], Thollander [35]
Market
  • Energy price fluctuations
  • Hasanbeigi [34], Thollander [35]
  • Inadequate energy market trading mechanisms
  • Shen et al. [23], Painuly et al. [32]
  • A one-sided credit appraisal scheme
  • Shen et al. [23], Da-li [28]
  • Small and scattered bond markets
  • Shen et al. [23]
  • Fluctuations of interest rates and exchange rates
  • Shen et al. [23], Cagno [25]
  • Unfamiliar with local markets for international donor agencies
  • Shen et al. [23], Cagno [25], Painuly et al. [32]
  • Lack of third-part measurement and verification schemes
  • Sarkar [5], Shen et al. [23]
Financial institution
  • A low priority of energy saving issues
  • Trianni et al. [27], Brown [30]
  • Lack of special institutions focused on energy efficiency borrowing-lending activities
  • Shen [23], Painuly [32]
  • Lack of information on project profitability and energy savings
  • Rohdin [24], Wang [31], Thollander [35]
  • Insufficient professional knowledge and financing experience
  • Wang et al. [29], Hasanbeigi [34],
  • Reluctance to provide long-term loans
  • Rohdin [24], Da-li [28], Haselip [36]
  • Weak awareness of corporate social responsibility and environmental protection
  • Rohdin [24], Garbuzova-Schlifter [37]
  • Other preferences for capital investment
  • Rohdin [24], Thollander [35]
  • Invisible costs
  • Shen [23], Trianni et al. [27], Garbuzova-Schlifter [37]
Behavior
  • Lack of reliable measurement equipment and convincing baseline data
  • Shen [23], Da-li [28], Garbuzova-Schlifter [37]
  • Low influence of energy efficiency
  • Da-li [28]
  • Bounded rationality
  • Schleich [13], Trianni et al. [27], Brown [30]
  • Resistance to update
  • Hasanbeigi [34]
  • Value decisions
  • Trianni et al. [27], Hasanbeigi [34]
  • Culture
  • Schleich [13], Cagno [25]
Economic non-market
  • Weak risk management support
  • Wang et al. [31], Hasanbeigi [34]
  • Insufficient internal capital
  • Shen [23], Cagno [25]
  • Lack of available mortgage assets and cash inflows
  • Sarkar [4], Trianni et al. [27]
  • Partial or full credit constraints
  • Sarkar [4], Shen [23], Da-li [28]
  • Limited technology support and business development skills
  • Cagno [25], Thollander [35], Hasanbeigi [34]
  • Long payback periods
  • Wang et al. [29]
Table 2. Linguistic variables and TFNs to measure influence relationships.
Linguistic TermsTFNs
Very high impact (VH)(0.75, 1, 1)
High impact (H)(0.5, 0.75, 1)
Low impact (L)(0.25, 0.5, 0.75)
Very low impact (VL)(0, 0.25, 0.5)
None impact (N)(0, 0, 0.25)
Table 3. The characteristics of the five expert groups.
NameGenderAge RangeEducational LevelExperience (Year)Affiliation
MaleFemale
Expert group 13136–62Master or above≥5Government departments
Expert group 22229–56Doctor≥6Universities
Expert group 33134–41Master or above≥7Financing institutions
Expert group 41333–57Bachelor or above≥8Electricity utilities
Expert group 53136–48Bachelor or above≥5SMEs
Table 4. Potential barrier factors of energy efficiency financing for SMEs.
CriteriaSub-CriteriaDescription
Policy and regulation (Z1)
  • Slight fiscal incentives (B11)
  • Available fiscal incentives such as special funds, subsidies, tax breaks, etc. were less effective for SMEs than that for large enterprises.
  • Lack of long-term policy mechanisms (B12)
  • Energy efficiency involves many related departments such as industry, finance, tax, resources, etc. Long-term policy mechanisms are vital to coordinate interests and promote continuous development.
  • Lack of appropriate evaluation guidelines (B13)
  • Proper evaluation guidelines are often missing to direct policy implementation and measure the effects.
  • Inadequate legislation and/or enforcement (B14)
  • Protection of SME benefits and promotion of diversified financing channels for energy efficiency should be reflected fully in laws or implemented enforcedly.
  • Insufficient monitoring (B15)
  • Due to inefficient monitoring and control, distinction between good and bad performers may be confused and SME entrepreneurs may lose enthusiasm.
  • Strict constraints on foreign exchanges (B16)
  • Strict control on foreign exchanges for other purposes may bring bad consequences for overseas investments.
  • Insufficient institutional capacity (B17)
  • Weak institutional capacity may cause failures of coordinating multiple participants and developing large projects.
  • Limited energy efficiency standards (B18)
  • Missing or obsolete national standards with legal enforcement in some fields may hinder investments andor cause project failures.
  • Lack of enforceable measurement criteria (B19)
  • Reliable measurement and verification criteria of energy savings should be unified compulsorily to avoid contract disputes.
Market (Z2)
  • Energy price fluctuations (B21)
  • Uncertain changes in energy prices may make investors and financiers into confusions about energy efficiency investment.
  • Inadequate energy market trading mechanisms (B22)
  • Robust energy markets for electricity supply, carbon trading, energy-saving services, etc. are vital to improve energy efficiency and attract investment.
  • A one-sided credit certification scheme (B23)
  • SMEs are often poor credits due to an imperfect credit certification system led by banks, which focus on assets and credit history.
  • Small and scattered bond and equity markets (B24)
  • Private capitals, as important financing sources for SMEs, are difficult to obtain due to small size and poor liquidity of bonds and equities.
  • Fluctuations of interest rates and exchange rates (B25)
  • Rising interest rates keep loan rates at a high level, which makes SMEs hard to bear borrowing cost. And changes in exchange rates make foreign investors hesitant.
  • Unfamiliar with local markets for international donor agencies (B26)
  • Due to local markets with no full knowledge, donor programs from international agencies, such as Global Environment Facility, the World Bank, etc. are not well developed to meet partners’ benefits continuously.
  • Lack of third-part measurement and verification schemes (B27)
  • Some third-part institutions are needed to provide fair and independent services on measurement of energy savings, which are essential to attract investors.
Financial institution (Z3)
  • A low priority of energy saving issues (B31)
  • Financiers don’t focus on energy efficiency investment because it isn’t their core businesses.
  • Lack of specialized financial institutions (B32)
  • Institutions specialized in energy efficiency lending activities are missing.
  • Lack of information on project profitability and energy savings (B33)
  • Lack of such important information may make financers miss good investment opportunities of cost-effective projects.
  • Insufficient professional knowledge and financing experiences (B34)
  • Managers of financial institutions are often unfamiliar with energy efficiency and difficult to recognize such investment.
  • Reluctance to provide long-term loans (B35)
  • Financers are willing to provide short-term loans to low risk businesses rather than such energy efficient projects.
  • Weak awareness of corporate social responsibility and environmental protection (B36)
  • Corporate social responsibility and environmental protection are often ignored by financers who give priorities to economic interests.
  • Other preferences for capital investments (B37)
  • Financiers tend to invest in traditional and stable businesses instead of energy efficiency implemented by SMEs.
  • Invisible costs (B38)
  • Invisible costs are transaction costs, opportunity costs, fees of gathering and analyzing information, overhead expenses, etc.
Behavior (Z4)
  • Lack of convincing baseline data and measurement equipment (B41)
  • Limited or unreliable baseline data and measurement equipment for energy savings may increase technical difficulties of verification services.
  • Low influence of energy efficiency (B42)
  • Due to lack of publicity, people may have poor awareness of energy efficiency.
  • Bounded rationality (B43)
  • Because of imperfect information, investors make decisions by rules of thumb and may ignore comprehensive benefits from such projects.
  • Resistance to update (B44)
  • Individuals who are not willing to change production processes may overlook benefits and hinder these projects.
  • Value decisions (B45)
  • These projects are most likely to be considered if their values are perceived fully by investors.
  • Culture (B46)
  • Organizations may neglect energy efficiency due to weak culture with energy security and environment values.
Economic non-market (Z5)
  • Weak risk management support (B51)
  • SMEs often have not perfect risk management systems to deal with project risks, such as production interruptions, capital strand breaks and unforeseen cost rises.
  • Insufficient internal capitals (B52)
  • SMEs are absence of sufficient internal capitals for such project investment to scale-up productions.
  • Lack of available mortgage assets and cash inflows (B53)
  • SMEs with light assets are difficult to obtain enough loans through mortgages.
  • Partial or full credit constraints (B54)
  • SMEs are more likely to be credit constraints partially or fully, entrepreneurs are hard to get plenty of loans from commercial finance institutions.
  • Limited technology support and business development skills (B55)
  • Technical bottlenecks make projects hard to suit local conditions, while limited business skills can be referred to implement large-scale projects.
  • Long payback periods (B56)
  • Payback periods may be more than 3 years for most projects, which may cause risks.
Table 5. Sub-criteria relative importance given by the five expert groups.
Potential BarriersExpert Group 1Expert Group 2Expert Group 3Expert Group 4Expert Group 5
Main-CriteriaSub-CriteriaMinMaxMinMaxMinMaxMinMaxMinMax
Z1B1168796881069
B125769784679
B134545233556
B147836684758
B156746365745
B166835584857
B175879684757
B183657694637
B194637252446
Z2B212537461424
B225746675868
B237967687946
B245879684736
B254658474636
B262537244613
B273547463625
Z3B317958473748
B321435365725
B336879576979
B342414463624
B354757686858
B362535142546
B373657684669
B381413243635
Z4B413668784658
B427958693757
B431435254624
B441424132635
B454736687857
B461435252547
Z5B516825587957
B52697107104768
B53710687969810
B54710587957810
B556936684769
B566824796779
Table 6. Calculation results of financing barriers based on the fuzzy Delphi method.
Potential BarriersPessimistic TFNsOptimistic TFNs H i T i Consensus ValueResults
Main-CriteriaSub-Criteria L i p M i p R i p L i o M i o R i o C i
Z1B1166.55888.77103.457.66 > 6
B1245.67767.7192.336.56 > 6
B1323.44534.6860.564.04 < 6-
B1434.79767.3582.216.38 > 6
B1534.28656.1571.725.4 < 6-
B1634.48657.0982.525.58 < 6-
B1745.3777.7693.76.53 > 6
B1834.04666.9294.965.48 < 6-
B1922.86445.574.144.18 < 6-
Z2B2112.17445.0774.833.62 < 6-
B2245.14667.1682.866.15 > 6
B2345.88767.7192.126.6 > 6
B2434.79767.5393.216.41 > 6
B2533.95566.5585.055.25 < 6-
B2612.17434.7973.833.49 < 6-
B2723.1455.7574.94.43 < 6-
Z3B3134.42777.7694.586.09 > 6
B3212.46545.373.544.34 < 6-
B3356.15778.3692.857.26 > 6
B3412.17444.763.833.44 < 6-
B3545.14677.5883.866.36 > 6
B3612.17444.9663.833.57 < 6-
B3734.64667.1194.365.88 < 6-
B3811.78334.2864.223.03 < 6-
Z4B4134.79767.1382.216.34 > 6
B4235.01777.9593.996.48 > 6
B4312.17444.7463.833.46 < 6-
B4411.64334.2864.362.96 < 6-
B4534.79767.1682.216.34 > 6
B4612.17445.1174.833.64 < 6-
Z5B5124.62757.2692.385.97 < 6-
B5245.88778.72104.127.3 > 6
B5366.76889.17103.247.97 > 6
B5456.28878.72102.727.5 > 6
B5534.82667.7194.186.27 > 6
B5625.12747.1190.885.87 < 6-
Table 7. Linguistic ratings of the main criteria given by an expert group.
Main CriteriaZ1Z2Z3Z4Z5
Z1-LHVLVH
Z2H-HLVH
Z3VLL-VLH
Z4HVHL-H
Z5VLLHH-
Table 8. The initial direct relation matrix of the main criteria.
Main-CriteriaZ1Z2Z3Z4Z5
Z1(0, 0, 0)(0.45, 0.7, 0.9)(0.55, 0.8, 1)(0.4, 0.65, 0.85)(0.45, 0.7, 0.9)
Z2(0.45, 0.7, 0.9)(0, 0, 0)(0.6, 0.85, 1)(0.2, 0.45, 0.7)(0.55, 0.8, 0.95)
Z3(0.05, 0.25, 0.5)(0.1, 0.35, 0.6)(0, 0, 0)(0.1, 0.35, 0.6)(0.5, 0.75, 0.95)
Z4(0.15, 0.4, 0.65)(0.3, 0.55, 0.75)(0.45, 0.7, 0.95)(0, 0, 0)(0.55, 0.8, 0.95)
Z5(0.25, 0.5, 0.75)(0.1, 0.3, 0.55)(0.55, 0.8, 0.95)(0.2, 0.45, 0.7)(0, 0, 0)
Table 9. The normalized direct relation matrix of the main criteria.
Main-CriteriaZ1Z2Z3Z4Z5
Z1(0, 0, 0)(0.115, 0.179, 0.231)(0.141, 0.205, 0.256)(0.103, 0.167, 0.218)(0.115, 0.179, 0.231)
Z2(0.115, 0.179, 0.231)(0, 0, 0)(0.154, 0.218, 0.256)(0.051, 0.115, 0.179)(0.141, 0.205, 0.244)
Z3(0.013, 0.064, 0.128)(0.026, 0.09, 0.154)(0, 0, 0)(0.026, 0.09, 0.154)(0.128, 0.192, 0.244)
Z4(0.038, 0.103, 0.167)(0.077, 0.141, 0.192)(0.115, 0.179, 0.244)(0, 0, 0)(0.141, 0.205, 0.244)
Z5(0.064, 0.128, 0.192)(0.026, 0.077, 0.141)(0.141, 0.205, 0.244)(0.051, 0.115, 0.179)(0, 0, 0)
Table 10. The total relation fuzzy matrix of the main criteria.
Main-CriteriaZ1Z2Z3Z4Z5
Z1(0.040, 0.179, 0.743)(0.172, 0.333, 0.927)(0.231, 0.462, 1.192)(0.127, 0.327, 0.935)(0.192, 0.436, 1.146)
Z2(0.143, 0.327, 0.913)(0.067, 0.175, 0.721)(0.238, 0.466, 1.168)(0.081, 0.284, 0.891)(0.209, 0.448, 1.131)
Z3(0.031, 0.173, 0.679)(0.055, 0.191, 0.692)(0.048, 0.182, 0.749)(0.037, 0.196, 0.707)(0.151, 0.338, 0.924)
Z4(0.068, 0.248, 0.821)(0.124, 0.276, 0.834)(0.185, 0.404, 1.097)(0.023, 0.157, 0.69)(0.193, 0.416, 1.071)
Z5(0.79, 0.24, 0.777)(0.060, 0.204, 0.739)(0.183, 0.384, 1.017)(0.069, 0.237, 0.781)(0.051, 0.208, 0.797)
Table 11. The values of vector d + h, d−h, X* and Y* for the main criteria.
Main-Criteria d ˜ i + h ˜ i d ˜ i h ˜ i X*Y*
Z1(1.123, 2.903, 8.876)(0.401, 0.569, 1.010)3.6020.614
Z2(1.215, 2.878, 8.738)(0.258, 0.521, 0.910)3.5770.542
Z3(1.207, 2.977, 8.974)(−0.563, −0.819, −1.471)3.682−0.885
Z4(0.929, 2.702, 8.517)(0.258, 0.3, 0.509)3.3750.328
Z5(1.237, 3.118, 9.181)(−0.355, −0.571, −0.959)3.815−0.6
Table 12. The values of vector d + h, d−h, X* and Y* for the sub-criteria.
Main-CriteriaSub-Criteria d ˜ i + h ˜ i d ˜ i h ˜ i X*Y*
Z1B11(1.28, 4.037, 26.421)(−0.146, −0.204, −0.259)7.308−0.204
B12(1.273, 4.071, 26.431)(0.126, 0.215, 0.98)7.3310.328
B14(1.242, 4.017, 25.907)(0.094, 0.162, 0.456)7.2030.199
B17(0.839, 3.283, 23.773)(0.003, −0.043, −0.195)6.291−0.061
Z2B22(1.603, 5.047, 67.731)(0.463, 0.774, 5.295)14.9211.475
B23(1.165, 3.973, 58.665)(−0.14, −0.14, −1.004)12.621−0.284
B24(0.988, 3.665, 56.969)(−0.323, −0.634, −4.291)12.103−1.192
Z3B31(1.107, 3.447, 25.588)(0.118, 0.248, 0.634)6.7470.290
B33(0.834, 2.97, 23.822)(0.336, 0.665, 2.884)6.0900.980
B35(0.776, 2.805, 22.461)(−0.454, −0.913, −3.518)5.743−1.271
Z4B41(0.855, 2.257, 6.326)(0.05, 0.068, −0.013)2.7020.052
B42(0.768, 2.15, 6.226)(0.529, 0.805, 1.274)2.5990.837
B45(0.896, 2.322, 6.385)(−0.579, −0.873, −1.26)2.761−0.889
Z5B52(1.304, 3.589, 13.051)(0.489, 0.861, 1.613)4.7850.924
B53(1.251, 3.542, 13.142)(−0.344, −0.588, −0.902)4.76−0.6
B54(0.92, 2.98, 11.959)(−0.21, −0.422, −1.149)4.133−0.507
B55(0.94, 3.064, 12.107)(0.064, 0.149, 0.437)4.2170.183
Table 13. The crisp total relation matrix for the main criterion.
Main-CriteriaZ1Z2Z3Z4Z5
Z10.2500.405 *0.545 *0.395 *0.513 *
Z20.394 *0.2480.545 *0.3510.522 *
Z30.2340.2520.2540.2550.404 *
Z40.3130.3440.483 *0.2240.488 *
Z50.3030.2690.456 *0.3000.28
* Stand for higher then the threshold of 0.361.
Table 14. Ranks and attributes of the key financial barriers.
ItemsB11B12B14B22B31B33B41B42B52B53B55
Ranks3241561011789
Cause--
Result---------
Table 15. Suggested measures to overcome key barriers.
Main-CriteriaSub-CriteriaSuggested Measures
Z1B11
A target of energy efficiency should be set explicitly. A long-term development plan will be established for SMEs to assure returns, including, sustainable fiscal incentives, continued tax breaks, loan interest rate discounts, long term technical support etc. [51]
B12
B14
Legal status and punitive measures should be clarified for energy efficiency
Z2B22
Valuable international experience should be referred to promote energy markets and establish a market-oriented mechanism.
Z3B31
Special financial institutions should be established to promote innovation of financing products to perform energy efficiency, including combined green bond issuance to SMEs [31].
B33
Systematic means should be developed by administrators to disseminate energy-efficiency information and investment opportunities, including special financing platforms, energy-saving technology and standard databases. [51]
Z4B41
Professionals and industry associations should determine reliable measurement equipment and technical baseline data of energy efficiency for all areas.
B42
Authorities should spend enough money and time to enhance the awareness of energy efficiency. Efforts including distributing energy-efficiency handbooks in official websites and forums and making propaganda films are helpful.
Z5B52
Capital accumulation should be focused on and a variety of financial products should be used to modernize financing structures [31].
B53
Authorities should give SMEs and financial institutions assistance to create credit information and establish a scoring system of business creditworthiness.
B55
Authorities should organize regular, different level trainings and seminars about financing strategies, risk management, technological development, etc.

