Energy Consumption and Economic Development in Hong Kong, China


1
School of Business, Macao Polytechnic Institute, Macao, China
2
Department of Logistics and Maritime Studies, The Hong Kong Polytechnic University, Hong Kong, China
*
Author to whom correspondence should be addressed.
Energies 2017, 10(11), 1883; https://0-doi-org.brum.beds.ac.uk/10.3390/en10111883
Submission received: 19 September 2017
/
Revised: 13 November 2017
/
Accepted: 14 November 2017
/
Published: 16 November 2017
Abstract
:The economic structure of a city evolves as the city develops, resulting in a change in energy consumption. This paper presents a historical review of Hong Kong’s economic development and energy consumption from 1970 to 2015. Based on the official data from the Hong Kong government, it was found that Hong Kong’s gross domestic product increased from HKD 208 billion in 1970 to HKD 2398 billion in 2015 in which the contribution from the manufacturing sector peaked in 1985. Energy consumption increased by 9.3 times from 140.2 PJ in 1970 (mostly oil products) to 1298.2 PJ (including oil products, natural gas, coal, and imported electricity) in 2015. The greenhouse gas (GHG) emissions due to energy consumption were determined based on emission factors for different fuels. Results show that GHG emissions increased from 10.7 million tons (Mt) of CO2-equivalent in 1970 to 99.1 Mt of CO2-equivalent in 2015.
1. Introduction
Over the past few decades, most Asian cities have essentially followed the same development pattern, which consists in transitioning from a manufacturing-based economy to a service-based economy [1,2]. Unfortunately, the pollution footprint of these cities has increased despite the substantial reduction in their manufacturing activities and shifting to the so-called low energy intensive and low carbon intensive sectors [2,3,4,5]. In these cities, the rapid development in the commerce, service, and hospitality sectors has led to the massive construction of commercial buildings, shopping malls, hotels, luxury high-rise apartments, and electrified metro systems [6,7,8]. Specifically, the hospitality sector covers a wide range of organizations offering food, drink, entertainment, and accommodation to visitors. Many of these buildings and systems are occupied and utilized by people for more than 16 hours a day, with some being occupied 24 h a day [8]. These buildings and systems directly and indirectly consume a substantial amount of fossil fuel energy [8]. Besides, with an increase in human activities, road traffic is bound to increase. For example, the number of licensed private cars in Hong Kong increased from 93,000 in 1970 to 521,852 in 2015 [9]. The number of other motorized vehicles in the city, including buses, light vehicles, and trucks, also increased from 50,000 in 1970 to 206,411 in 2015 [9]. These considerable changes have put great pressure on Hong Kong’s transportation network and environment. Air traffic in Hong Kong also increased substantially from 2.2 million passengers and 60 kilotons (kt) of cargo a year in 1970 to 68.5 million passengers and 4.38 million tons (Mt) of cargo a year in 2015. In 2015, 406,048 aircraft movements were recorded at the Hong Kong International Airport [9]. Hong Kong’s port capacity increased from 0.5 million twenty-foot equivalent unit (TEU) in 1970 to 20.1 million TEU in 2015 [9]. Air pollutants from stationary sources, such as power plants, commercial establishments, and buildings [3,10,11] and mobile sources, such as cars, trucks, ships, and aircraft [11,12,13], have also increased drastically, adversely affecting people’s health [14,15] and climate conditions [16,17,18]. It has been known that air pollutants such as sulfate aerosols and particulate matter can have an impact on radiative forcing, thus either warming or cooling the Earth’s atmosphere system [16], as well as visibility in cities [17,18]. Although some previous studies explored the causal relationship between economic growth and energy consumption [19,20,21,22,23] as well the effect of climate conditions on energy consumption [24,25], very few of them focused on a densely populated city such as Hong Kong [24,25] and using long-term time series data [11]. Besides, very few studies, except Warren-Rhodes and Koenig [11], explored Hong Kong’s total energy consumption (local use and consumption due to outbound transportation services) using long-term time-series data. Warren-Rhodes and Koenig [11] showed that Hong Kong’s CO2 emission had risen by 250% from 1971 to 1997. Yet, no new study about Hong Kong’s total CO2 emission has been reported since Warren-Rhodes’ [11] work.
As Hong Kong is a special administrative region (SAR) of China—a key signatory of the Paris climate agreement—Hong Kong must determine and monitor its total energy consumption and greenhouse gas (GHG) emissions [26]. In fact, the central government of China stated clearly that the Paris climate agreement applies to Hong Kong and the Hong Kong Government had set an ambitious carbon intensity reduction target by lowering its total GHG emissions by 26–36% in 2030 using 2005 as the base year [26]. Hence, the objectives of the paper are to (i) provide a historical review of Hong Kong’s energy consumption and economic development from 1970 to 2015, (ii) determine Hong Kong’s GHG emissions due to energy consumption, and (iii) explore how GHG emissions are related to energy mix, population, and economic growth. The study contributes to understanding the relationships between urban socio-economic development, energy consumption, and GHG emissions. The findings can shed light to government of Hong Kong and that of other cities (including those in Mainland China) in developing appropriate energy policy and GHG mitigation plans.
2. Method
2.1. Data Sources
The annual energy data, population and employment data, and sectoral and total gross domestic product (GDP) of Hong Kong from 1970 to 2015 were obtained from the Hong Kong Census and Statistics Department [9,27]. The annual consumption of oil products, coal, and natural gas for local electricity generation was collected from the Hong Kong Annual Digest of Statistics as well as the environmental and sustainability reports published by Hong Kong’s power companies [28,29,30].
2.2. Determination of Emission Factors of Fuels and Sensitivity Analysis of GHG Emissions
According to the Intergovernmental Panel on Climate Change (IPCC), the combustion of fossil fuels inevitably produces GHGs, including carbon dioxide (CO2), methane (CH4), and nitrous oxide (N2O) [31]. Table 1 shows the calorific values and emission factors of different fossil fuels used in Hong Kong.
2.3. Regression Analysis and Coefficient of Determination
After determining the total GHG emissions from the use of primary energy (or the use of primary energy in producing electricity) per year in Hong Kong, regression analysis was performed to examine its relationship with demographic characteristics such as population and affluence. Past studies showed that the environmental impact of a community depends on its population and degree of affluence [33,34,35]. Hence, the linear function between population, affluence, and a specific environmental impact (for example annual total GHG emissions) can be determined by regressing population (POPYear) and proxy indicators of affluence such as per capita GDPYear and per capita ENERGY USEYear on annual total GHG emissions, ITotal CO2-eq,Year as shown in Equation (1):
In a multiple linear regression analysis, the coefficient of determination R2 represents the percentage of variability explained by the predictors. The value of R2 is always between 0 and 1. The higher R2 is, the higher prediction accuracy of a multiple linear regression model is.
3. Results and Analysis
3.1. Economic Structural Change
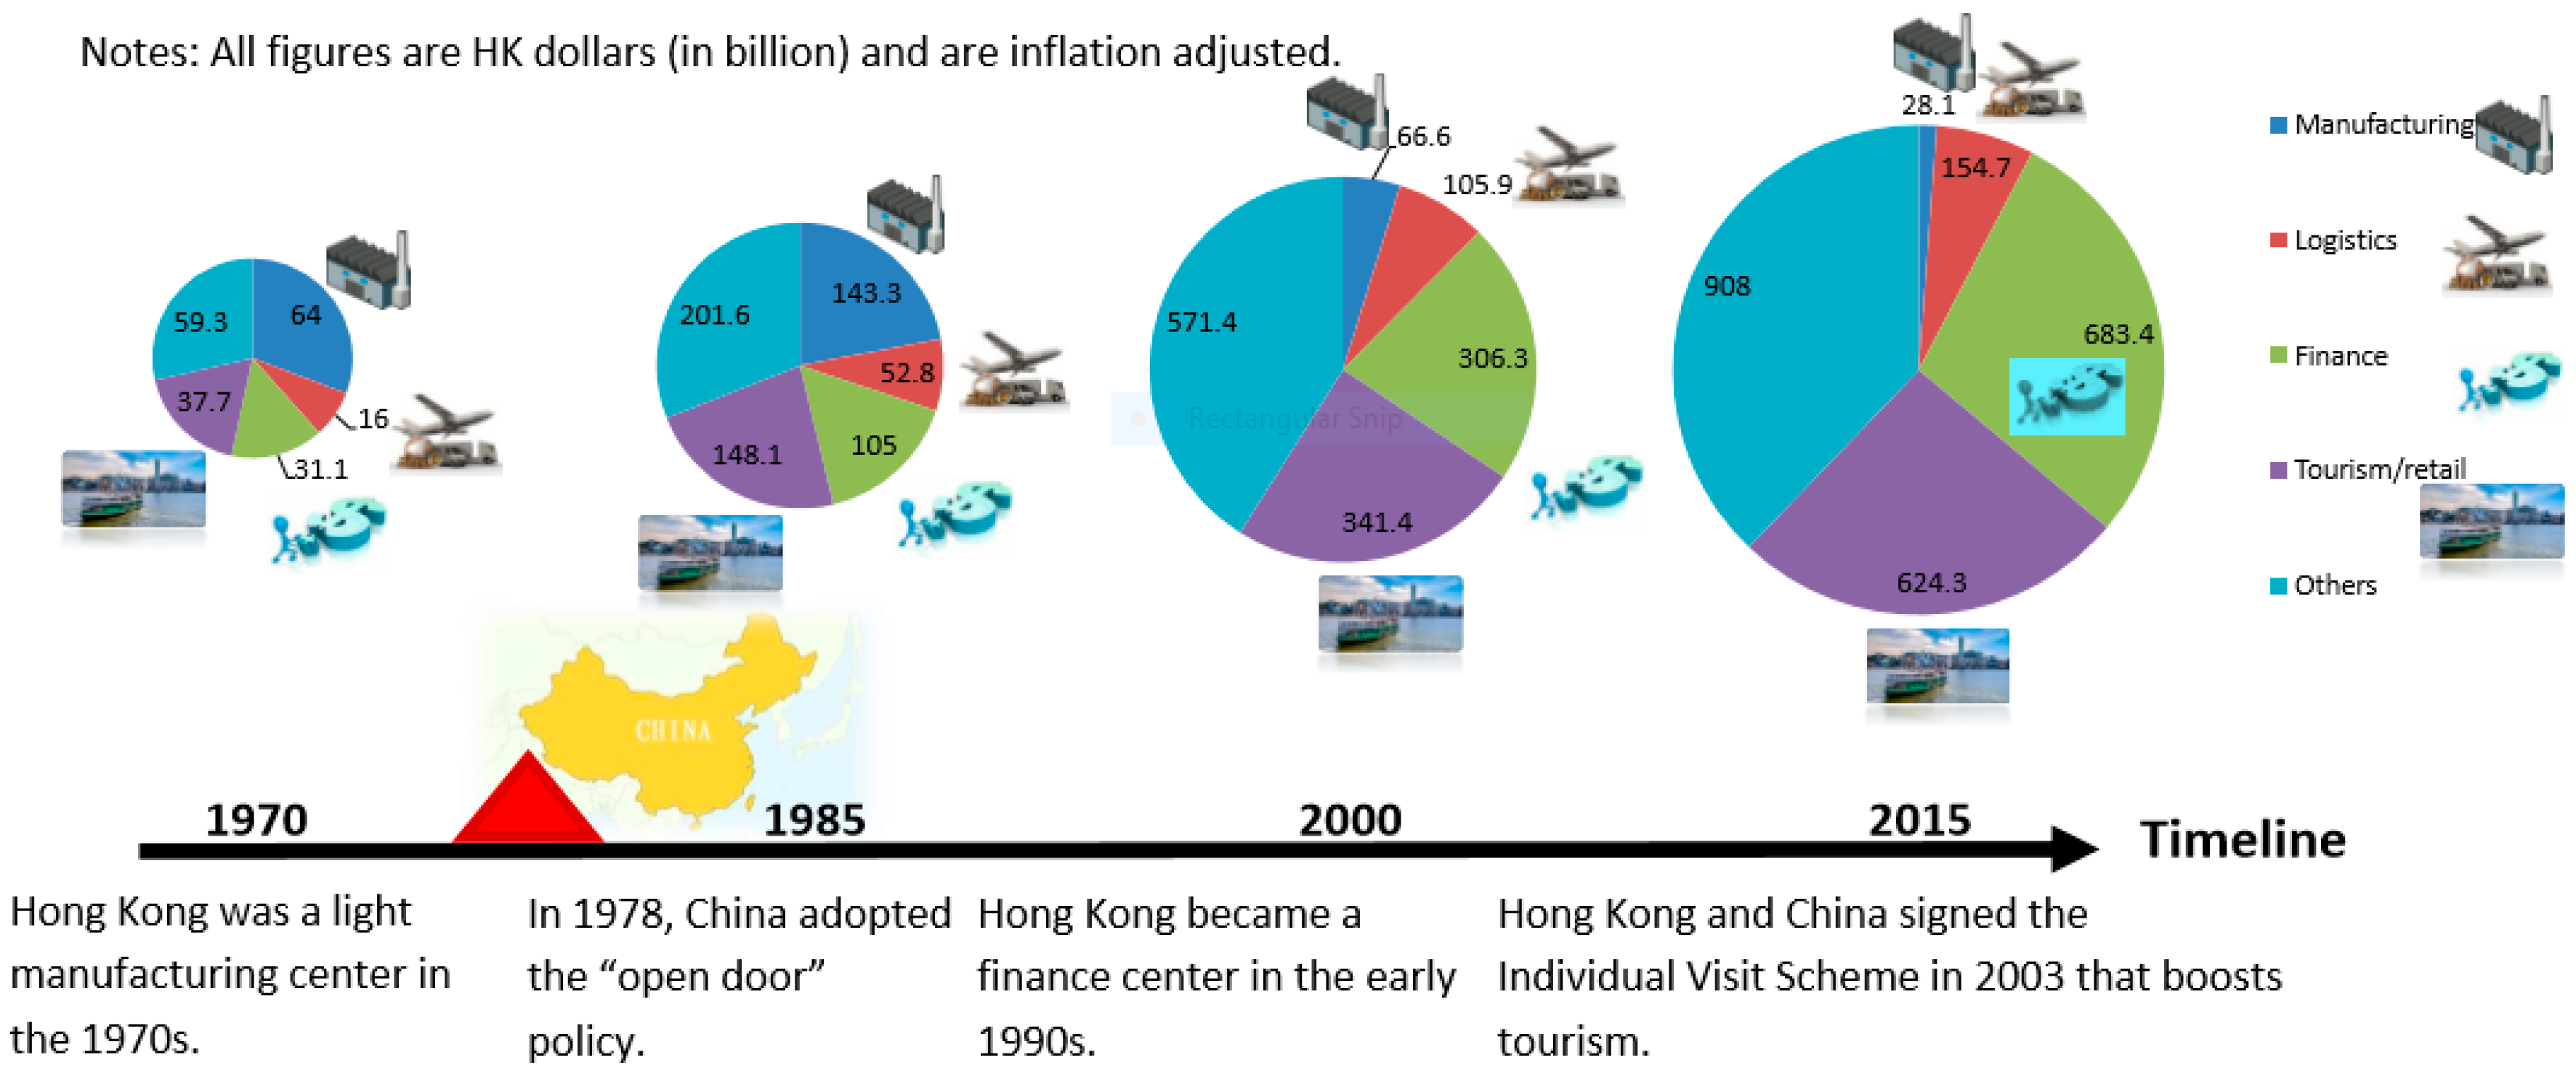
As one of the four Asian dragons, Hong Kong was a light industrial center in the 1970s [17]. During this period, the manufacturing sector of the city, including its textile, garment, toy, plastic, and light metal industries, flourished because of factors such as relatively low land prices, abundant number of workers migrating from Mainland China legally and illegally, minimum interference from the laissez-faire colonial government, and low profit taxes [36]. The manufacturing sector contributed 64 billion Hong Kong dollars (HKD) or 30.8% to Hong Kong’s GDP in 1970 [27]. This value generated by the manufacturing sector increased to HKD 76.9 billion in 1975, HKD 116.1 billion in 1980, and peaked at HKD 143.3 billion in 1985 as shown in Table 2 [9,27]. Percentage-wise, the contribution of the manufacturing sector to Hong Kong’s GDP has steadily decreased since 1970, i.e., from 30.8% in 1970, to 22% in 1985, then to 1.2% in 2015 [27].
The change in Hong Kong’s economic structure in the 1980s and 1990s was partly caused by the adoption of the “open door” policy in Mainland China in 1978 in which countries and entrepreneurs were encouraged to trade directly with and invest directly in China [37]. In Hong Kong, land and property values surged rapidly as the baby boomers entered their marriage years and generated a great demand for housing [38]. Between 1980 and 1990, wages surged significantly, and operating costs became too high for industrial companies to survive. Driven by the push–pull effect of the high costs in Hong Kong and the abundant resources in the mainland, industrialists started relocating their production facilities and factories to Mainland China in the late 1980s [39,40].
Despite this relocation, Hong Kong did provide manufacturing-related support services to China [39]. With Hong Kong having the best deep-water harbor and container terminals in South China, it has become the logistics hub of Asia. In fact, Hong Kong has been one of the top five busiest container ports in the world since 2000 [41,42]. In recent years, Hong Kong has also been ranked as the busiest airport for international air cargo. The Hong Kong International Airport handles 4.38 Mt of freight, which is equivalent to HKD 3020 billion or about 40% of the total value of Hong Kong’s external trade [9]. Thousands of trucks travel between Hong Kong and other provinces in China every day. Concurrently, the finance, insurance, real estate, and business service sectors have gradually expanded. Since 1992, the Hong Kong stock market has been one of the most active financial markets in the world. In the past decade, Hong Kong’s tourism industry (i.e., wholesale, retail and import and export trades, restaurants, and hotels) has benefitted significantly from the Individual Visit Scheme. Over 59 million travelers visited Hong Kong in 2015. Many of them arrived from other China’s cities by road, rail, and air. Figure 1 shows the evolution of Hong Kong’s economic from 1970 to 2015.
The contribution of the manufacturing sector to Hong Kong’s GDP declined steadily between 1970 and 2015. According to the latest information provided by the Hong Kong Census and Statistics Department, the contribution of the sector to Hong Kong’s GDP was 1.2% in 2015 [9]. Meanwhile, the primary sector, construction, and utilities contributed 5.9% to Hong Kong’s GDP. The tertiary sector, including the finance, real estate, trading, tourism, logistics, and public service sectors, is now the biggest contributor to Hong Kong’s GDP at a level of over 92% [9]. In 2015, the finance, real estate, trading, and tourism-related services alone contributed 54.5% to Hong Kong’s GDP while the logistics sector contributed 6.5% [9]. Thus, the contributions of the manufacturing and non-manufacturing sectors to Hong Kong’s GDP changed from a ratio of (31:69) in 1970 to a ratio of (1.2:98.8) in 2015.
Table 2 shows the economic structural change from 1970 to 2015. It illustrates that as a free-market economy, Hong Kong reaps great benefits because it serves a critical link between China and the rest of the world through its different roles at different periods of time.
3.2. Population Growth and the Changing Role of the Manufacturing and Service-Related Sectors in Employment
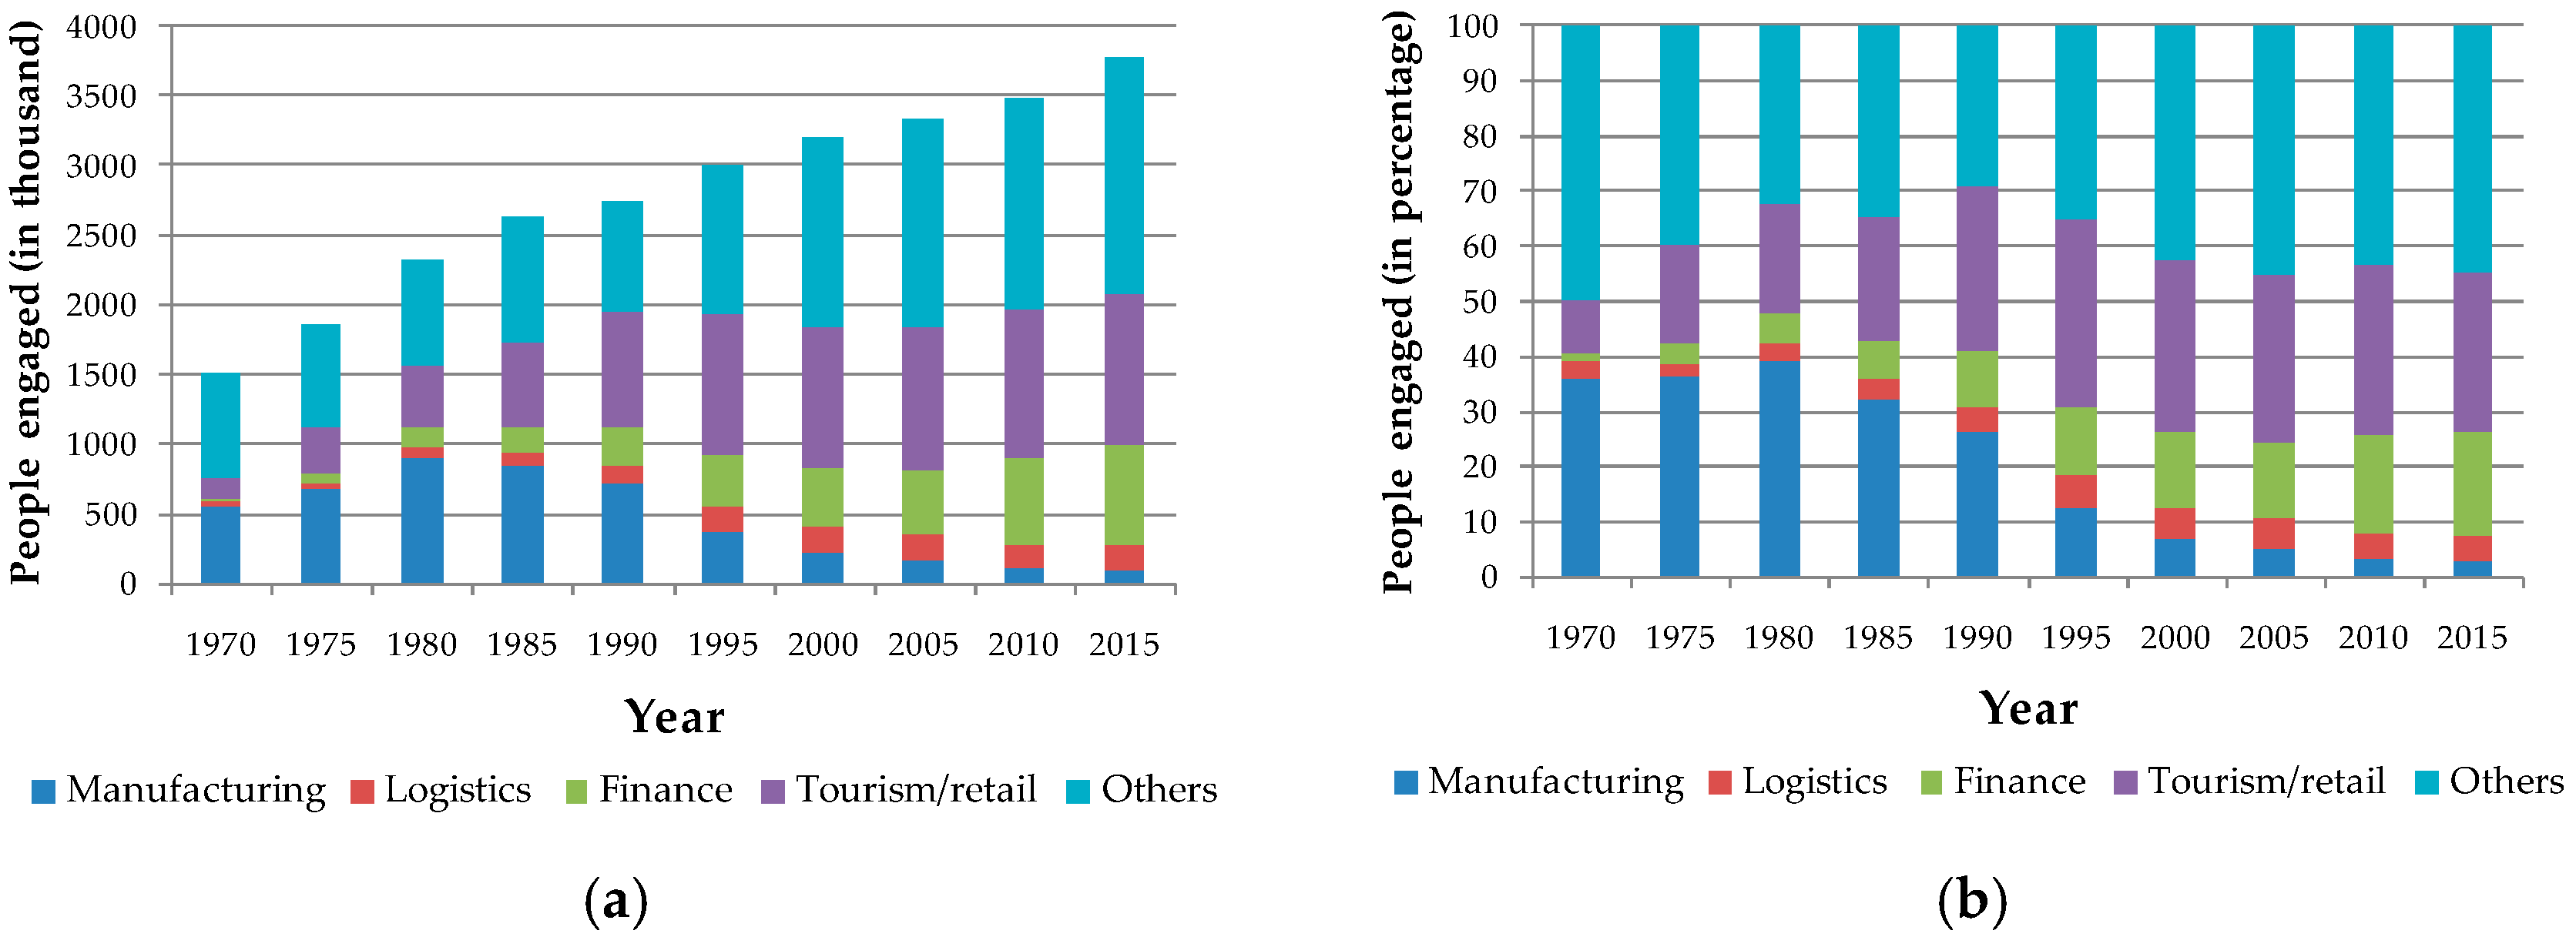
The population of Hong Kong increased from 4.0 million in 1970 to 7.31 million in 2015. In fact, it increased quite linearly during this period [3,9]. In terms of employment, over half a million were employed in the manufacturing sector in 1970. The number of employees in this sector increased to over 0.91 million in 1980. Since then, the number of employees in the manufacturing sector has decreased steadily.
Figure 2 shows Hong Kong’s labor force from 1970 to 2015. Hong Kong’s tertiary sector, especially its finance and tourism industries, has expanded rapidly since 1970. The number of employees and the percentage of employment in the manufacturing sector increased from 549,178 (36.2% of total employment) in 1970 to 907,463 (39.1% of total employment) in 1980. Subsequently, the number of employees and the percentage of employment decreased gradually in the 1980s and very rapidly in the 1990s. From 2000 to 2015, around 30% of the workforce was engaged in the tourism and retailing industry while around 16% was employed in the finance, insurance, real estates, and business services industry.
3.3. Energy Consumption at Different Periods of Time
Table 3 shows the consumption of primary energy sources, including oil products, natural gas, and coal, from 1970 to 2015. Table 3 also shows electricity exported/imported from Mainland China and consumption of secondary energy sources such as electricity (mostly derived from burning of coal and natural gas since 1985) and town gas during the same time period. It should be noted that the consumption of gas oil, diesel oil, naphtha, and fuel oil decreased by over 35% from 2010 to 2015.
In terms of the consumption of primary energy, Hong Kong relied heavily on oil products in the 1970s. In fact, Hong Kong’s power companies, namely, China Light and Power Co Ltd. (CLP) and Power Assets Holdings Ltd. (PAH), burnt heavy fuel oil to generate electricity. The reliance on oil products changed when both CLP and PAH switched to another fossil fuel, that is, coal, in 1982 with an aim to stabilize Hong Kong’s electricity production sector away from radical changes in oil prices or supplies as what happened in the 1970s. In the 1990s, the Hong Kong Government urged power companies to use natural gas, which is a clean fossil fuel, as a substitute for a portion of the fuel that they were using. CLP started burning coal and natural gas in its power plants in 1995. In addition, CLP has been annually importing around 10 TWh of electricity from Daya Bay Nuclear Power Plant in Shenzhen since 1995. PAH started mixing its fuel by burning coal and natural gas in its power plants in 2006. To et al. [3] found that the emission factor was 778.8 g of CO2-equivalent/kWh electricity produced in Hong Kong in 2010. When the imported electricity from Daya Bay Nuclear Power Plant was considered, the emission factor was found to be 722.1 g of CO2-equivalent/kWh electricity consumed in Hong Kong in 2010. This emission factor is comparable with that of other plant powers reported by Treyer and Bauer [43]. Treyer and Bauer [43] studied GHG emissions from the production of electricity in 50 countries and indicated that the emission factors of coal-fired power plants ranged from 814 and 1445 g of CO2-equivalent/kWh and the emission factors of natural gas-fired power plants ranged from 398 and 823 g CO2-equivalent/kWh. Hong Kong’s power plants use both coal and natural gas as fuels.
Hong Kong also consumed a large amount of oil products because the number of licensed vehicles, including private cars, buses, and trucks, experienced a 5.1-fold increase from 143,000 in 1970 to 728,263 in 2015. Although the Hong Kong Government has encouraged taxi and minibus owners to adopt liquefied petroleum gas as fuel for their vehicles, the amount of gasoline and diesel that the transportation sector consumes continues to increase yearly. In 2015, the number of aircraft movements increased to 406,048, while the number of vessel movements reached 376,032. Meanwhile, some hotels, industrial companies, and public institutions including hospitals still use oil-fired boilers to generate hot water and/or stream for their own consumption [44].
In the domestic environment, many families use liquefied petroleum gas or town gas for cooking and boiling water. Previously, the Hong Kong and China Gas Company Limited processed naphtha to generate town gas with a calorific value of 27.56 MJ/kg [44]. In 2006, the gas company began to introduce natural gas as feedstock in addition to naphtha to produce town gas and supplied gas to more than 1.7 million residential and commercial customers.
3.4. Energy Mix and GHG Emissions
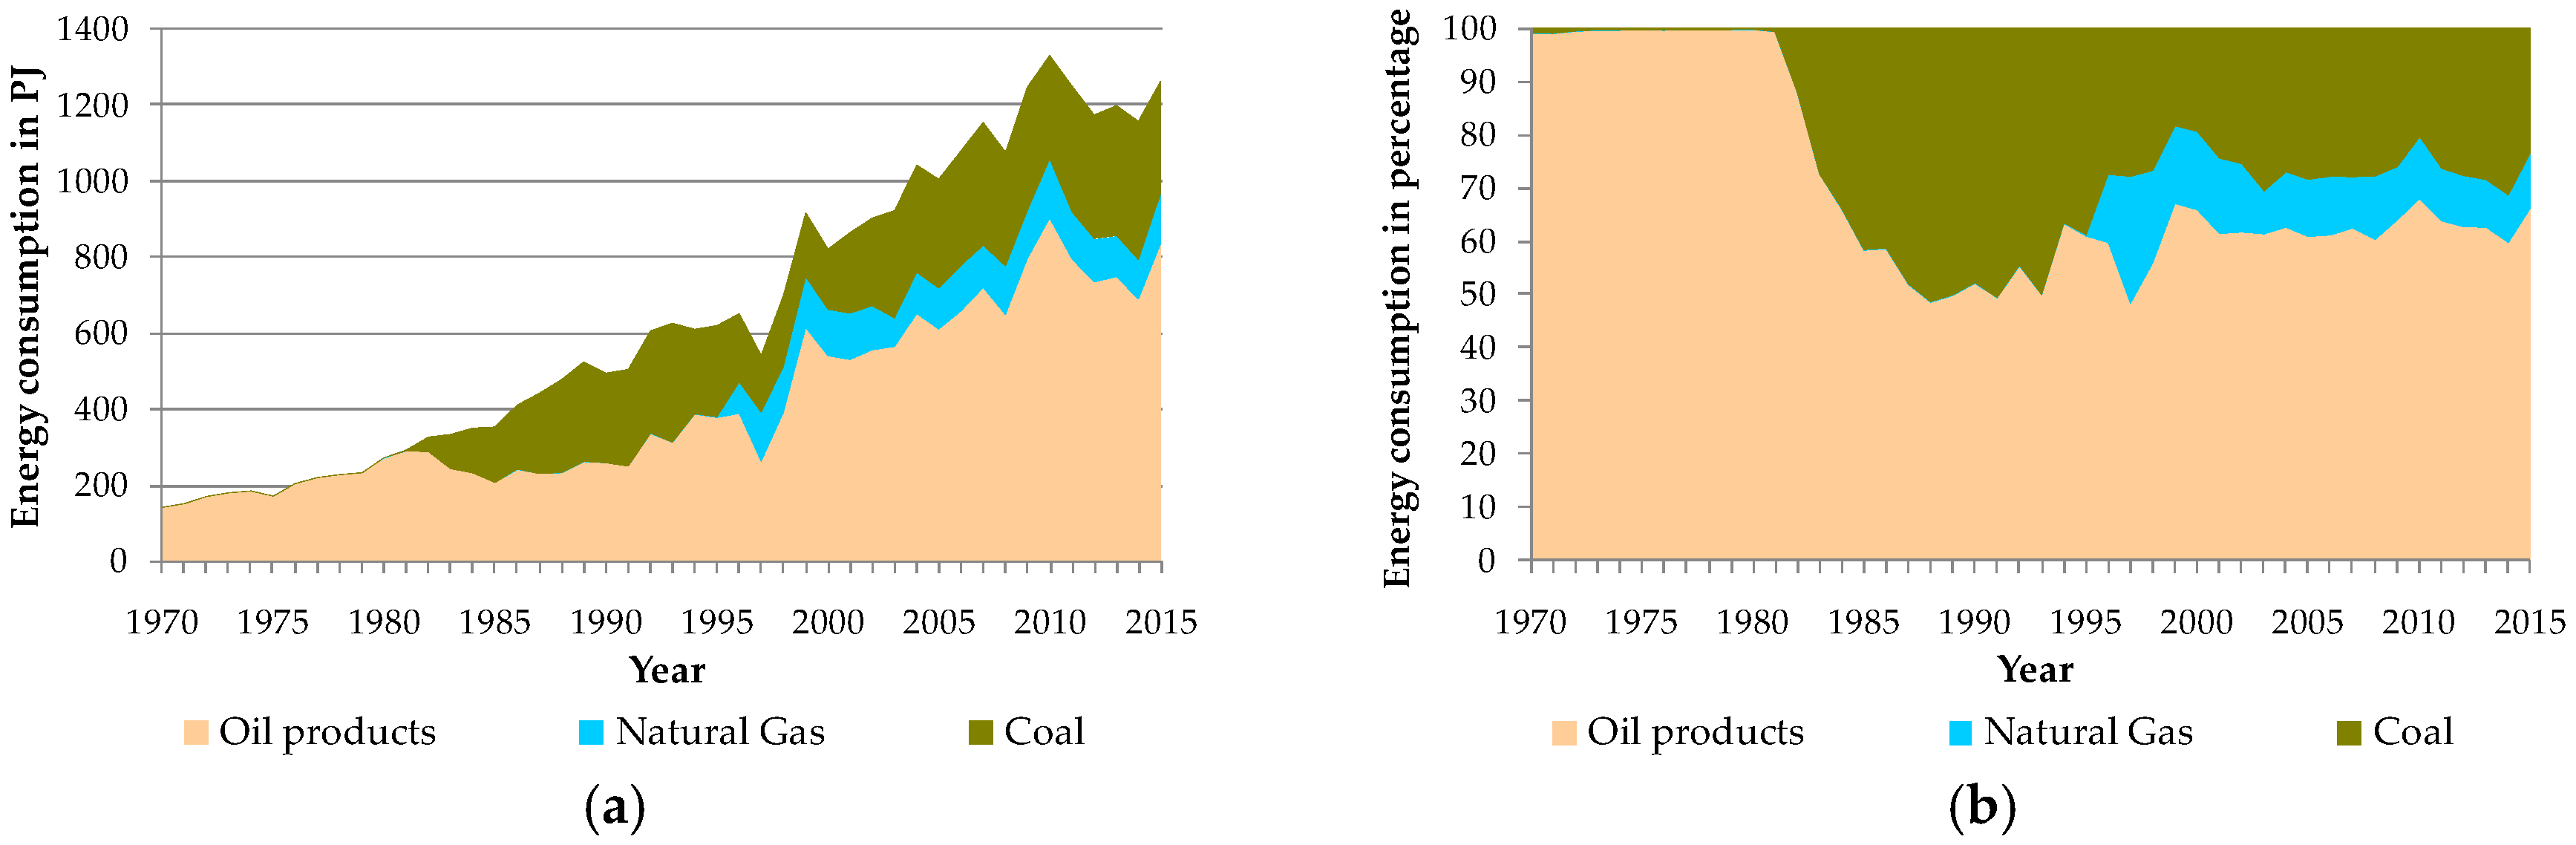
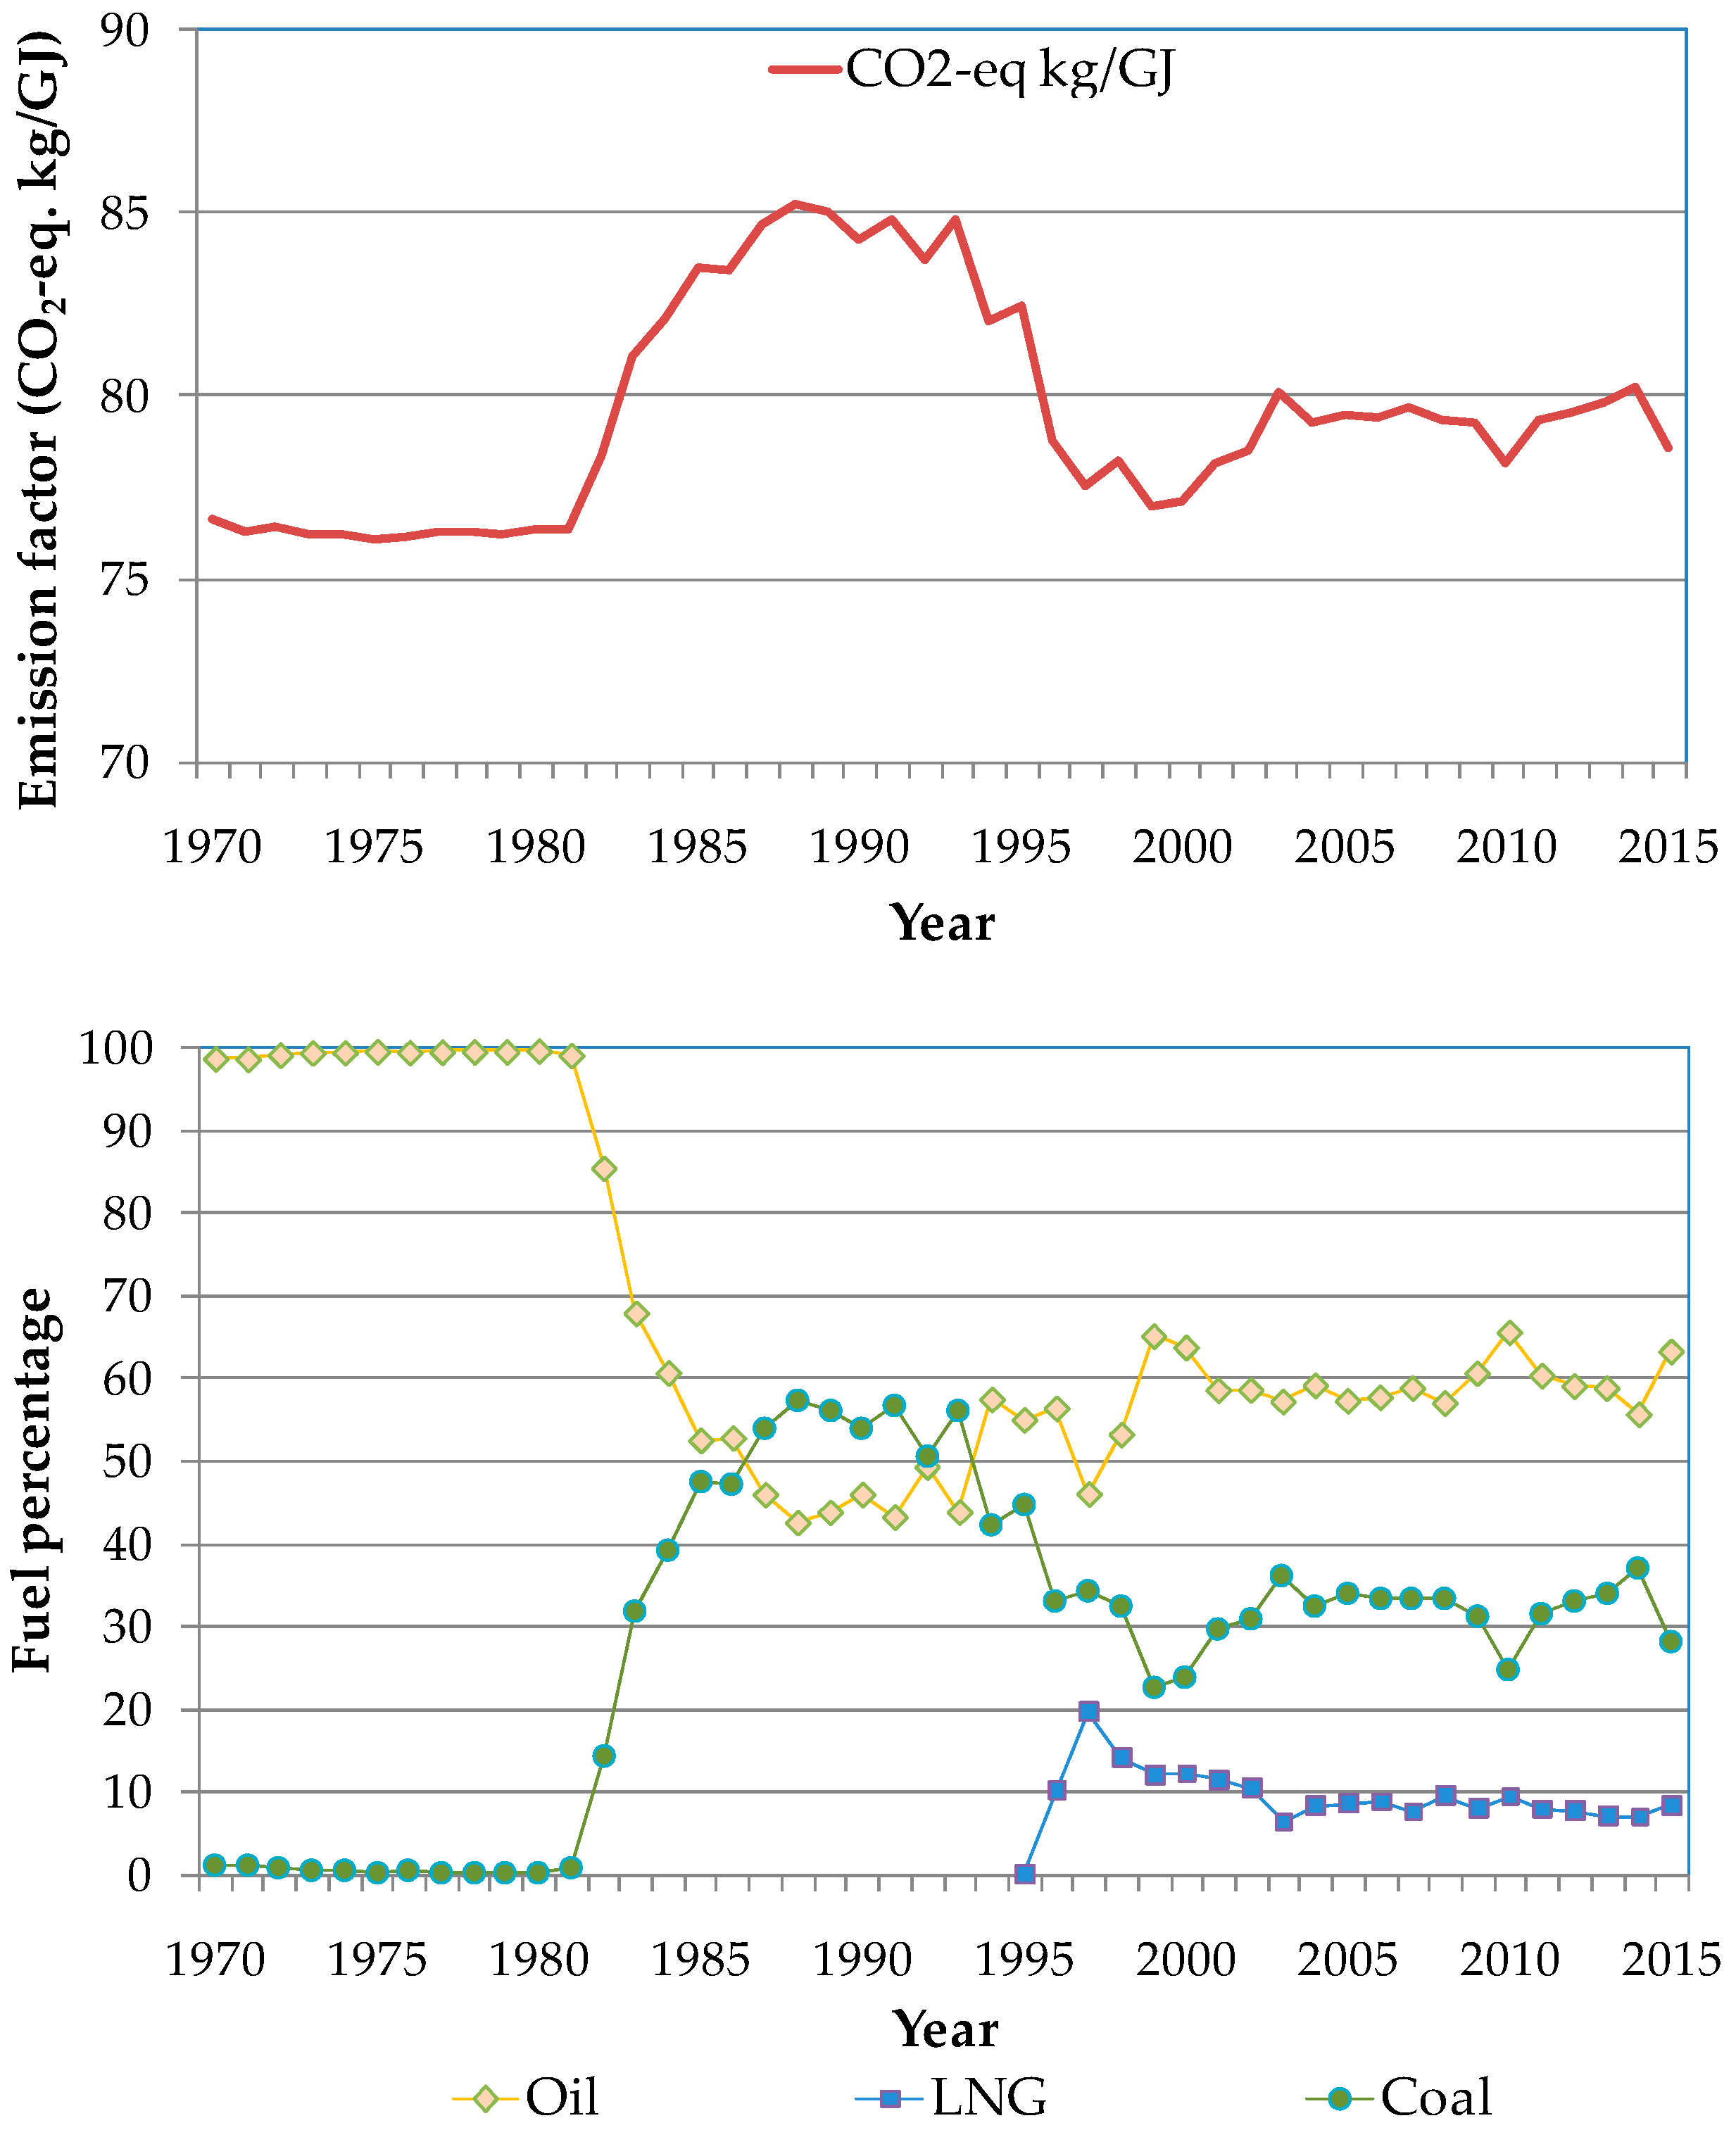
Table 3 shows the consumption of primary energy sources in terms of volume or weight. Using the calorific values of oil products, natural gas, and coal as suggested by IPCC [31] and IEA [45] such as 0.0358 PJ/ML for aviation gasoline and kerosene, 0.0332 PJ/ML for motor gasoline, 0.0366 PJ/ML for gas and diesel oil, 0.0404 PJ/ML for heavy fuel oil, 0.0473 PJ/kt for LPG, 0.0544 PJ/kt for natural gas, and 0.0264 PJ/kt for coal, we determined the energy consumption of Hong Kong for the period from 1970 to 2015 in terms of PJ as shown in Figure 3a. Besides, we determined that the overall thermal efficiency of power plants in Hong Kong was 34% in 2015 based on the calorific values of natural gas and coal, and local electricity generation in that year. Figure 3a indicates that Hong Kong consumed an increasing amount of fossil fuel energy between 1970 and 2015, from 140 PJ in 1970 to 1298 PJ in 2015, which represents a 9.3-fold increase. In terms of energy mix, Hong Kong primarily used oil products before 1982. Between 1985 and 1995, around 50–60% of the energy consumed in Hong Kong was derived from oil products, while the rest of the consumed energy originated from coal burning in power plants. After 1995, around 60–70% of the energy consumed in Hong Kong was derived from oil products, 10% of the consumed energy came from burning natural gas in power plants and conversion of natural gas to town gas, and the rest from coal burning in power plants. Details of the energy mix are shown in Figure 3b. A close observation of Figure 3a reveals that Hong Kong energy consumption dropped by 17% in 1998 and 7% in 2008 because the local economy was badly hit by the 1997 Asian financial turmoil and the 2007 world financial crisis that was triggered by the US sub-prime mortgage problem.
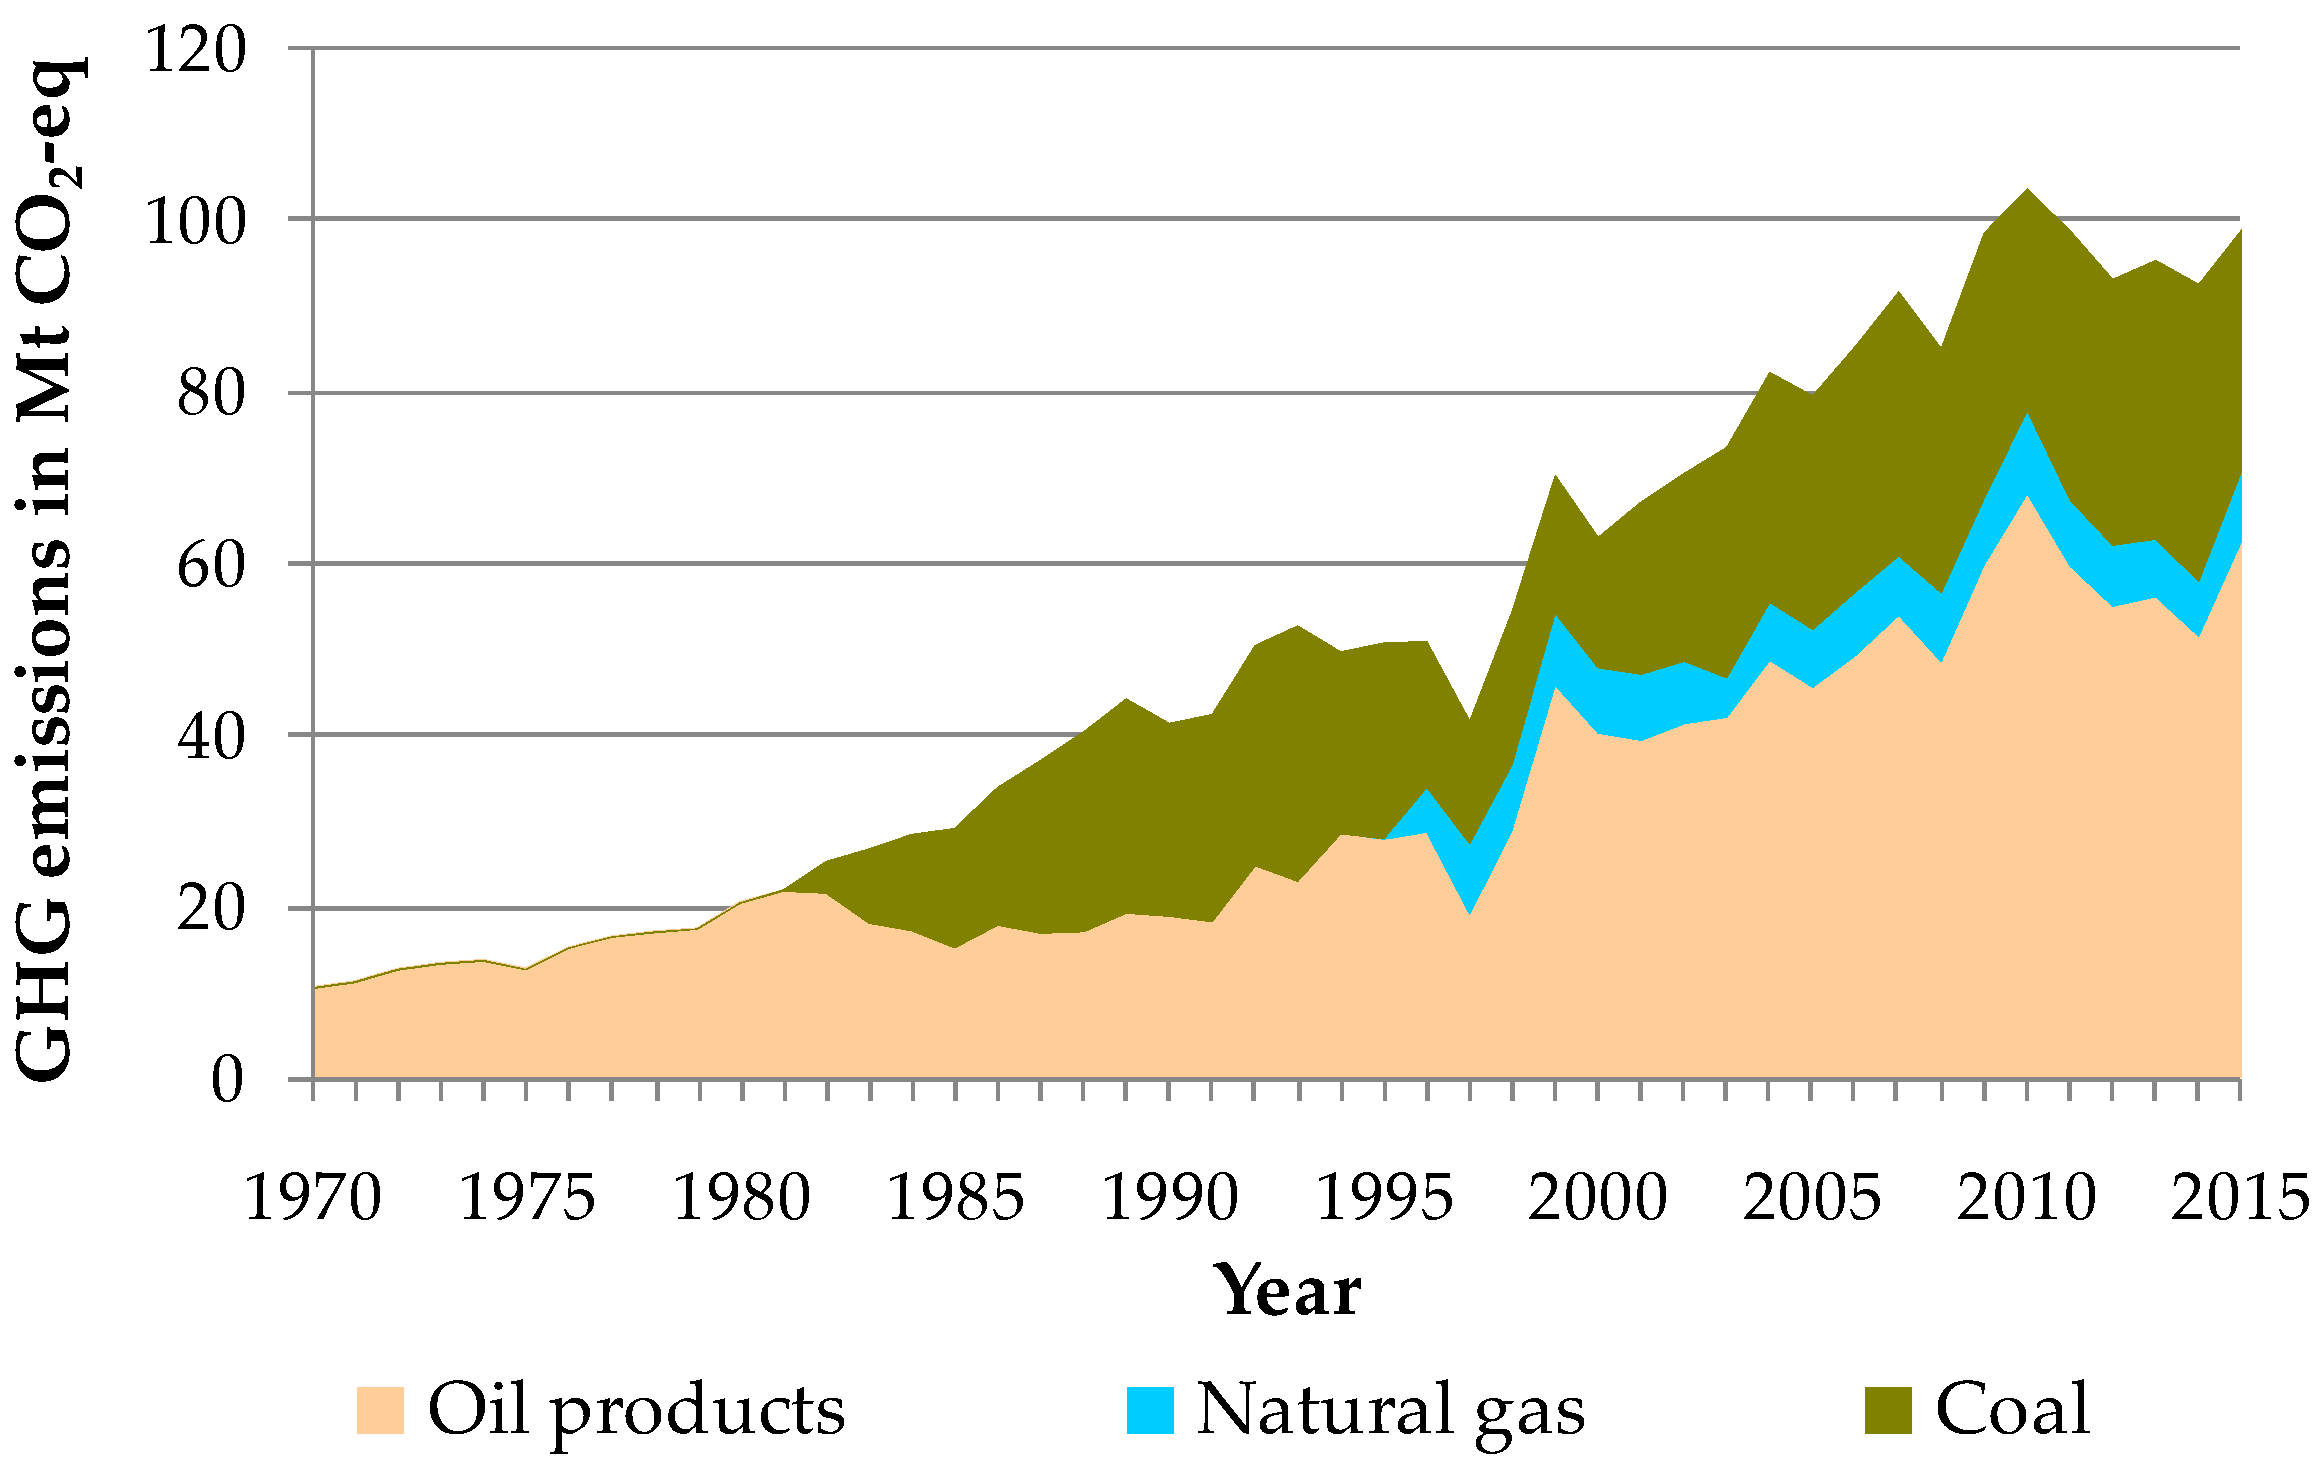
Figure 4 shows that GHG emissions increased rapidly from 10.7 Mt CO2-equivalent in 1970 to 99 Mt CO2-equivalent in 2015, which represents a 9.3-fold increase.
Figure 5 shows the emission factor in terms of CO2-equivalent kg/GJ in total primary energy consumption in Hong Kong from 1970 and 2015. This figure indicates that the emission factor was higher when more coal was burned in local power plants.
3.5. Sensitivty Analysis of GHG Emissions
The IPCC [31] suggests that the 95% confidence intervals of CO2 emission for aviation gasoline/kerosene, motor gasoline, gas/diesel oil, heavy fuel oil, liquefied petroleum gas, natural gas, and coal are [69,700, 74,000], [67,500, 73,000], [72,600, 74,800], [75,500, 78,800], [61,600, 65,600], [58,300, 70,400], and [87,300, 101,000] kg per TJ, respectively. The 95% confidence intervals of CH4 and N2O emissions for various fuels are also given by IPCC for stationary sources and mobile sources [31]. The intervals range from [0.2, 1] to [1.1, 13] kg per TJ for CH4 and from [0.2, 2] to [1.9, 17] kg per TJ for N2O [32]. The values of CO2, CH4, and N2O emissions for oil products, natural gas, and coal follow lognormal distributions [31].
Monte Carlo simulations were performed 1000 times to determine the confidence intervals of GHG emissions. Monte Carlo simulations took care of the uncertainties associated with CO2, CH4, and N2O emissions from the consumption of different fuels in a probabilistic manner. The calculated results showed that total GHG emissions in 2015 were 99.0 Mt CO2-equivalent with a 95% confidence interval of [96.7, 101.3] Mt.
3.6. GHG Emissions, Population, and GDP
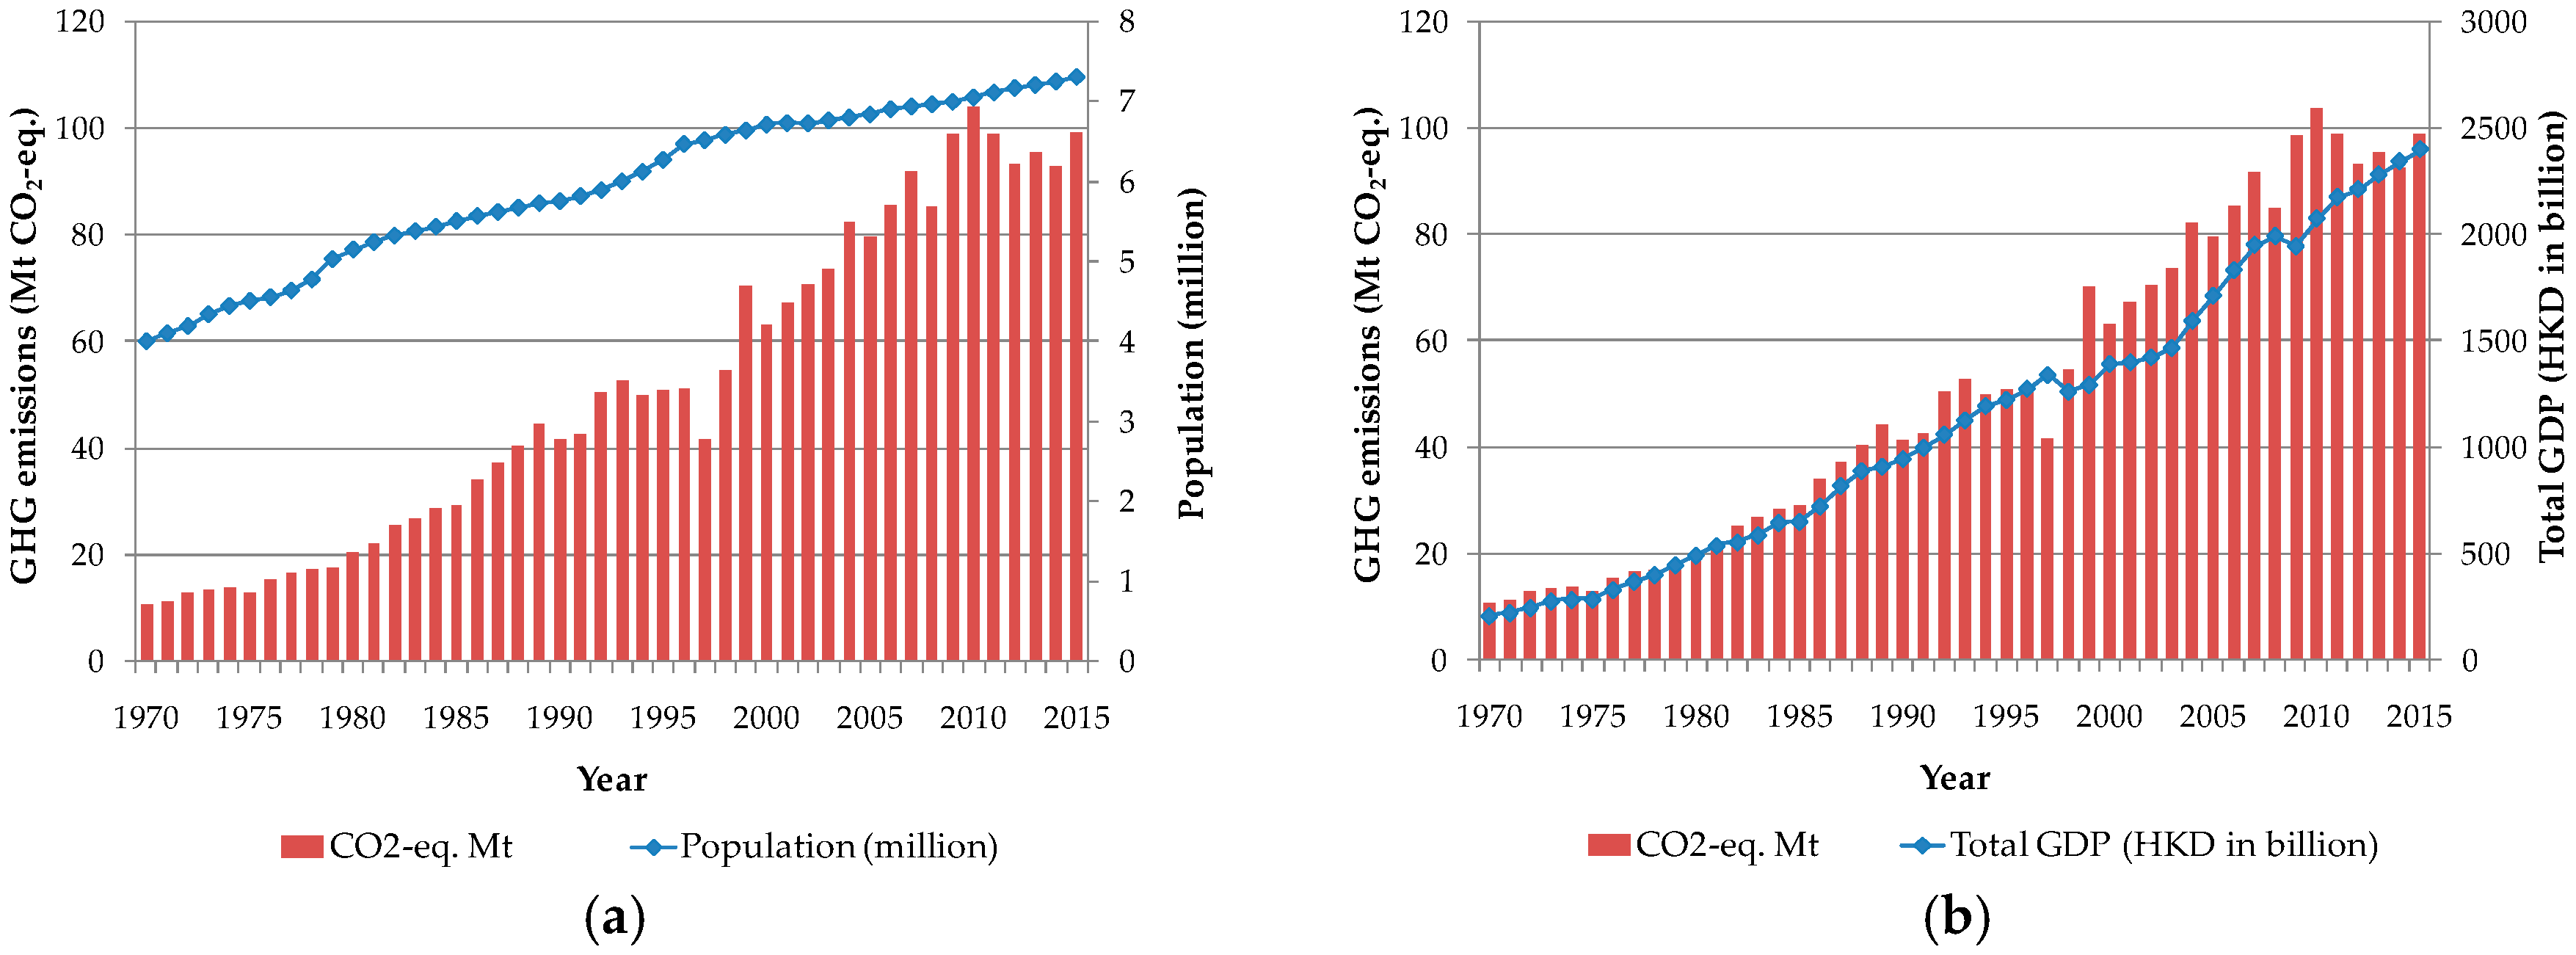
Figure 6 shows the annual GHG emissions, population, and total GDP in Hong Kong between 1970 and 2015. Figure 6a shows that GHG emissions were strongly associated with population and Figure 6b shows that GHG emissions were very strongly associated with total GDP.
The values of per capita GDP and per capita ENERGY USE were then determined. The value of per capita GDP and per capita ENERGY USE were 0.052 million HKD and 0.035 TJ in 1970, respectively. The values of per capita GDP and per capita ENERGY USE increased to 0.338 million HKD and 0.178 TJ in 2015, respectively. As indicated in Equation (1), we regressed POPYear, per capita GDPYear in million HKD, and per capita ENERGY USEYear on ITotal CO2-eq,Year in Mt to obtain Equation (2). POPYear was eliminated due to its multicollinearity with per capita GDPYear and per capita ENERGY USEYear:
where m1 is the coefficient of the rate at which ITotal CO2-eq,Year increases by one unit increase of per capita GDPYear, m2 is the coefficient of the rate at which ITotal CO2-eq,Year increases by one unit increase of per capita ENERGY USEYear, and C is a constant. As shown in Table 4, the values of m1 and m2 were found to be 58.63 and 50.98, respectively, while C was found to be −11.323.
The value of R2 of this regression model was 0.998, which indicates that 99.8% of variance in GHG emissions could be explained by two indicators of affluence i.e., per capita GDPYear and per capita ENERGY USEYear. Moreover, Equation (2) indicated that an increase in per capita GDPYear by HKD 0.1 million was associated with an increase of GHG emissions by 5.863 Mt CO2-equivalent, and an increase in per capita ENERGY USEYear by 0.1 TJ was associated with an increase of GHG emissions by 5.098 Mt CO2-equivalent. Hence, GHG emissions are likely to increase because Hong Kong’s GDP is likely to increase due to preferential treatment by Mainland China. Specifically, Ma et al. [46] indicated that the total energy consumption of Hong Kong was projected to grow by 1% per year during the period from 2010 to 2020 but To and Lee [47] indicated that Hong Kong’s electricity consumption might only increase by 1.5% from 2015 to 2020.
4. Discussion
The previous sections showed Hong Kong’s economic development and the associated change in energy consumption as well as GHG emissions during the period from 1970 to 2015. Although the manufacturing sector expanded between 1970 and 1980 and shrank rapidly afterwards, Hong Kong’s carbon footprint continuously increased. This increase was due to the fact that Hong Kong became a major logistics hub, financial center, and tourist destination in Asia between 1980 and 2000. Since the beginning of the millennium, Hong Kong has further transformed into a global financial center with support from the central government. Hong Kong has been the world’s largest initial public offering market since 2009, and its tourism industry benefits significantly from the Individual Visit Scheme.
Between the late 1980s and 2015, the number of establishments and employees in many service-related sectors increased rapidly, while the number of establishments and employees in the manufacturing sector decreased steadily. Skyscrapers, hotels, serviced apartments, and shopping malls were constructed, occupied, and utilized by finance, business services, and retailing firms. The Hong Kong Mass Transit Railway Corporation (now called MTR) built a number of electrified commuter lines and airport express. Nowadays, MTR trains carry an average of 4 million passengers every day. Moreover, road traffic intensified rapidly. In summary, the population of Hong Kong increased by 82% during the period from 1970 to 2015, total GDP exhibited a 11.5-fold increase, per capita GDP increased 6.3-fold, fossil fuel energy consumption increased 9.3-fold, and GHG emissions increased 9.3-fold. In terms of per capita GHG emissions, each Hong Kong citizen used to generate 2.7 t of CO2-equivalent in 1970. The value of per capita GHG emissions increased to 13.6 t of CO2-equivalent in 2015. On one hand, Hong Kong’s total GDP and per capita GDP increased much faster than Hong Kong’s population growth because Hong Kong has benefited from China’s strong economy in the past four decades [48]. On the other hand, Hong Kong’s fossil fuel energy consumption and GHG emissions also increased at a very high rate because environmental awareness was never a key concern in Hong Kong education or business practices until the past decade [49,50,51].
The observations from the study indicated that the tertiary sector consumes significantly more energy than most people realize. Besides, the results of this paper illustrated that Hong Kong society as a whole performed badly in environmental aspects, particularly in energy resource consumption and GHG emissions. In fact, the Hong Kong government’s expenditure on electricity consumption increased from HKD 1.4 billion in 1999 to HKD 2.3 billion in 2008, with an annual increase of 5.7% [52]. Moreover, the number of government vehicles increased from 3097 in 1970 to 6251 in 2015, without taking into account a large number of contract vehicles purchased for the Hong Kong government’s contracts in recent years [9]. The Hong Kong government should review its own energy and electricity consumption. It should also overhaul its energy policy to encourage utilities to use a relatively clean fuel such as natural gas (under a cap-and-trade policy as suggested by Brown et al. [53]) and to explore renewable energies such as solar energy and wind energy with realistic target and public engagement [54]. Energy efficiency analyses should be carried out to identify the best fuels for commercial and residential appliances, considering the cost, effectiveness, and environmental aspects simultaneously. Commercial building owners, property management companies, and utilities should try their best to deploy intelligent systems for managing energy use in different seasons. Although the adoption of these strategies does not immediately and significantly slow down the increasing demand of energy consumption, these strategies will in the long run raise people’s awareness and encourage organizations to audit their energy consumption and find ways to minimize energy consumption for economic and environmental reasons. Importing electricity from a neighboring city can only solve problems in the short term and gives rise to environmental ethical issues [18].
All in all, this study not only contributes to the existing literature that explores the relationships between economic growth and energy consumption [19,20,21,22,23], but also highlights that changing a city’s economic structure (shifting its industrial activities to services) does not slow down the growth of energy consumption and its GHG emissions. The paper is one of the first papers to explore this topic in one of the most densely populated cities—Hong Kong—based on long-term time series data.
5. Conclusions
This paper provides a historical review of Hong Kong’s energy consumption and economic development during the period from 1970 to 2015. Based on data from the Hong Kong government, it was found that Hong Kong’s energy consumption increased from 140.2 PJ to 1,298.2 PJ in 2015, while its GDP increased from HKD 208 billion to HKD 2398 billion during the same period. In 2015, Hong Kong imported 18.2 Mt of oil products, 2.39 Mt of natural gas, 11.18 Mt of coal, and 10.56 TWh electricity (with net amount imported from Mainland China). In turn, the combustion of oil products, natural gas, and coal produced 99.1 Mt CO2-equivalent. As the population of Hong Kong was 7.31 million by the end of 2015, each Hong Kong citizen generated 13.6 t of CO2-equivalent GHG directly and indirectly through service provision. This value of per capita CO2-equivalent emission was much higher than the 5 t per capita CO2 emission in Mainland China [55]. Although the Hong Kong Government has suggested total GHG emissions will peak in 2020 and has set an ambitious carbon intensity reduction target by lowering its total GHG emissions by 26–26% in 2030 using 2005 as the base year [26], the regression analysis results and the long-term trend of GHG emissions show that achieving these objectives will be difficult if not impossible.
Acknowledgments
This study was supported in part by The Hong Kong Polytechnic University (Project Code: G-YBQN).
Author Contributions
Wai-Ming To and Peter K. C. Lee conceived the study. Wai-Ming To performed the data collection and analyzed the data; Wai-Ming To and Peter K. C. Lee prepared the paper. Both authors have read and approved the final version of the manuscript.
Conflicts of Interest
The authors declare no conflicts of interest.
References
- Zhao, S.X. Information exchange, headquarters economy and financial centers development: Shanghai, Beijing and Hong Kong. J. Contemp. China 2013, 22, 1006–1027. [Google Scholar] [CrossRef]
- Lai, T.M.; To, W.M.; Lam, K.H.; Lo, W.C.; Chung, W.L. Electricity consumption in Hong Kong: Trend analysis and greenhouse gases emission. HKIE Trans. 2014, 21, 81–88. [Google Scholar] [CrossRef]
- To, W.M.; Lai, T.M.; Lo, W.C.; Lam, K.H.; Chung, W.L. The growth pattern and fuel life cycle analysis of the electricity consumption of Hong Kong. Environ. Pollut. 2012, 165, 1–10. [Google Scholar] [CrossRef] [PubMed]
- Mi, Z.F.; Pan, S.Y.; Yu, H.; Wei, Y.M. Potential impacts of industrial structure on energy consumption and CO2 emission: A case study of Beijing. J. Clean. Prod. 2015, 103, 455–462. [Google Scholar] [CrossRef]
- Huisingh, D.; Zhang, Z.; Moore, J.C.; Qiao, Q.; Li, Q. Recent advances in carbon emissions reduction: Policies, technologies, monitoring, assessment and modeling. J. Clean. Prod. 2015, 103, 1–12. [Google Scholar] [CrossRef]
- Chen, Y.; Zacharias, J. A comparison of the public realm in CBDs in Shenzhen. In Proceedings of the International Conference on Chemical, Material and Food Engineering, Kyoto, Japan, 6–7 April 2015; pp. 402–407. [Google Scholar]
- Tiry, C. Hong Kong’s future is guided by transit infrastructure. Jpn. Railw. Transp. Rev. 2003, 35, 28–35. [Google Scholar]
- To, W.M.; Lai, T.M.; Ku, K.I. The growth of the tourism industry and its effect on resource consumption in Macao SAR, China. Prog. Ind. Ecol. Int. J. 2016, 10, 90–113. [Google Scholar] [CrossRef]
- Hong Kong Census and Statistics Department. Hong Kong Annual Digest of Statistics, 2016th ed.; Hong Kong Census and Statistics Department: Hong Kong, China, 2017.
- To, W.M.; Lau, Y.K.; Yeung, L.L. Emission of carcinogenic components from commercial kitchens in Hong Kong. Indoor Built Environ. 2007, 16, 29–37. [Google Scholar] [CrossRef]
- Warren-Rhodes, K.; Koenig, A. Escalating trends in the urban metabolism of Hong Kong: 1971–1997. AMBIO 2001, 30, 429–438. [Google Scholar] [CrossRef] [PubMed]
- Guo, H.; Lee, S.C.; Ho, K.F.; Wang, X.M.; Zou, S.C. Particle-associated polycyclic aromatic hydrocarbons in urban air of Hong Kong. Atmos. Environ. 2003, 37, 5307–5317. [Google Scholar] [CrossRef]
- Wang, X.K.; Lu, W.Z. Seasonal variation of air pollution index: Hong Kong case study. Chemosphere 2006, 63, 1261–1272. [Google Scholar] [CrossRef] [PubMed]
- Lee, S.L.; Wong, W.H.S.; Lau, Y.L. Association between air pollution and asthma admission among children in Hong Kong. Clin. Exp. Allergy 2006, 36, 1138–1146. [Google Scholar] [CrossRef] [PubMed]
- Wong, T.W.; Tam, W.S.; Yu, T.S.; Wong, A.H.S. Associations between daily mortalities from respiratory and cardiovascular diseases and air pollution in Hong Kong, China. Occup. Environ. Med. 2002, 59, 30–35. [Google Scholar] [CrossRef] [PubMed]
- Marmer, E.; Langmann, B.; Fagerli, H.; Vestreng, V. Direct shortwave radiative forcing of sulfate aerosol over Europe from 1900 to 2000. J. Geophys. Res. Atmos. 2007, 112, S17. [Google Scholar] [CrossRef]
- To, W.M. Association between energy use and poor visibility in Hong Kong. Energy 2014, 68, 12–20. [Google Scholar] [CrossRef]
- To, W.M.; Lee, P.K.C.; Ng, C.T. Factors contributing to haze pollution: Evidence from Macao, China. Energies 2017, 10, 1352. [Google Scholar] [CrossRef]
- Kraft, J.; Kraft, A. On the relationship between energy and GNP. J. Energy Dev. 1978, 3, 401–403. [Google Scholar]
- Yoo, S.H. The causal relationship between electricity consumption and economic growth in the ASEAN countries. Energy Policy 2006, 34, 3573–3582. [Google Scholar] [CrossRef]
- Sharma, S.S. The relationship between energy and economic growth: Empirical evidence from 66 countries. Appl. Energy 2010, 87, 3563–3574. [Google Scholar] [CrossRef]
- Lai, T.M.; To, W.M.; Lo, W.C.; Choy, Y.S.; Lam, K.H. The causal relationship between electricity consumption and economic growth in a gaming and tourism center—The case of Macao SAR, the People’s Republic of China. Energy 2011, 36, 1134–1142. [Google Scholar] [CrossRef]
- He, J.; Zhuang, T.; Xie, X. Energy consumption, economic development and environmental improvement in China. Energy Environ. 2014, 25, 1345–1357. [Google Scholar] [CrossRef]
- Lam, J.C.; Tang, H.L.; Li, D.H.W. Seasonal variations in residential and commercial sector electricity consumption in Hong Kong. Energy 2008, 33, 513–523. [Google Scholar] [CrossRef]
- To, W.M.; Lee, P.K.C.; Lai, T.M. Modeling of monthly residential and commercial electricity consumption using nonlinear seasonal models—The case of Hong Kong. Energies 2017, 10, 885. [Google Scholar] [CrossRef]
- Hong Kong Environment Bureau. Hong Kong’s Climate Action Plan 2030+; Hong Kong Environment Bureau: Hong Kong, China, 2017.
- Hong Kong Census and Statistics Department. Hong Kong Annual Digest of Statistics (Various Issues from 1971 to 2015); Hong Kong Census and Statistics Department: Hong Kong, China, 2016.
- Hong Kong Census and Statistics Department. Quantity of Retained Imports of Oil Products (Annual Data from 1997 to 2016); Hong Kong Census and Statistics Department: Hong Kong, China, 2017.
- CLP Group. Sustainability Report (Various Issues); Hong Kong’s CLP Group: Hong Kong, China, 2017. [Google Scholar]
- Power Assets Holdings Ltd. Sustainability Report (Various Issues); Hong Kong’s Power Assets Holdings Ltd.: Hong Kong, China, 2017. [Google Scholar]
- Intergovernmental Panel on Climate Change (IPCC). 2006 IPCC guidelines for national greenhouse gas inventories. In IPCC National Greenhouse Gas Inventories Programme; Egglestrom, S., Buendia, L., Miwa, K., Ngara, T., Tanabe, K., Eds.; Intergovernmental Panel on Climate Change: Geneva, Switzerland, 2010. [Google Scholar]
- Intergovernmental Panel on Climate Change (IPCC). Change in Atmospheric Constituents and in Radiative Forcing—IPCC Fourth Assessment Report (AR4); Intergovernmental Panel on Climate Change: Geneva, Switzerland, 2007. [Google Scholar]
- Ehrlich, P.R.; Holdren, J.P. Impact of population growth. Science 1971, 171, 1212–1217. [Google Scholar] [CrossRef] [PubMed]
- Dietz, T.; Rosa, E.A. Effects of population and affluence on CO2 emissions. Proc. Natl. Acad. Sci. USA 1997, 94, 175–179. [Google Scholar] [CrossRef] [PubMed]
- Rosa, E.A.; York, R.; Dietz, T. Tracking the anthropogenic drivers of ecological impacts. AMBIO 2004, 33, 509–512. [Google Scholar] [CrossRef] [PubMed]
- Young, A. A tale of two cities: Factor accumulation and technical change in Hong Kong and Singapore. In NBER Macroeconomics Annual; MIT Press: Cambridge, MA, USA, 1992; pp. 13–54. [Google Scholar]
- Zhang, Z. Energy, climate and environmental policy in China: Introduction to the special double issue. Energy Environ. 2013, 24, 1201–1208. [Google Scholar] [CrossRef]
- Forrest, R.; Lee, J. Cohort effects, differential accumulation and Hong Kong’s volatile housing market. Urban Stud. 2004, 41, 2181–2196. [Google Scholar] [CrossRef]
- Tao, Z.; Wong, R.Y.C. Hong Kong: From an industrialized city to a centre of manufacturing-related services. Urban Stud. 2002, 39, 2345–2358. [Google Scholar] [CrossRef]
- Tuan, C.; Ng, L.F.Y. The turning point of the Hong Kong manufacturing sector: Impact of outward investment to the Pearl River Delta. J. Int. Trade Econ. Dev. 1995, 4, 153–170. [Google Scholar] [CrossRef]
- Hong Kong Marine Department. Ranking of Container Ports of the World; Hong Kong Marine Department: Hong Kong, China, 2017.
- Hong Kong Census and Statistics Department. A Graphic Guide on Hong Kong’s Development (1967–2007); Hong Kong Census and Statistics Department: Hong Kong, China, 2008.
- Treyer, K.; Bauer, C. Life cycle inventories of electricity generation and power supply in version 3 of the ecoinvent database—Part I: Electricity generation. Int. J. Life Cycle Assess. 2016, 21, 1236–1254. [Google Scholar] [CrossRef]
- To, W.M.; Hung, H.K.; Chung, W.L. Energy, economic, and environmental performance of commercial water heating systems. J. Facil. Manag. 2014, 12, 353–367. [Google Scholar]
- International Energy Agency (IEA). Oil Information Beyond 2002 Documentation; International Energy Agency: New York, NY, USA, 2011. [Google Scholar]
- Ma, T.; Ostergaard, P.A.; Lund, H.; Yang, H.; Lu, L. An energy system model for Hong Kong in 2020. Energy 2014, 68, 301–310. [Google Scholar] [CrossRef]
- To, W.M.; Lee, P.K.C. GHG emissions from electricity consumption: A case study of Hong Kong from 2002 to 2015 and trends to 2030. J. Clean. Prod. 2017, 165, 589–598. [Google Scholar] [CrossRef]
- Sung, Y.W.; Wong, K.Y. Growth of Hong Kong before and after its reversion to China: The China factor. Pac. Econ. Rev. 2000, 5, 201–228. [Google Scholar] [CrossRef]
- Lee, J.C.K.; Ma, W.H.T. Early childhood environmental education: A Hong Kong example. Appl. Environ. Educ. Commun. 2006, 5, 83–94. [Google Scholar] [CrossRef]
- Studer, S.; Welford, R.; Hills, P. Engaging Hong Kong businesses in environmental change: Drivers and barriers. Bus. Strategy Environ. 2006, 15, 416–431. [Google Scholar] [CrossRef]
- To, W.M.; Lam, K.H.; Lai, T.M. Importance-performance ratings for environmental practices among Hong Kong professional-level employees. J. Clean. Prod. 2015, 108, 699–706. [Google Scholar] [CrossRef]
- Hong Kong Audit Commission. Government Electricity Consumption; Hong Kong Audit Commission: Hong Kong, China, 2008.
- Brown, S.P.A.; Krupnick, A.J.; Walls, M.A. Natural Gas: A Bridge to a Low-Carbon Future. Issues Brief 09–11; Resources for the Future: Washington, DC, USA, 2009. [Google Scholar]
- Jefferson, M. Accelerating the transition to sustainable energy systems. Energy Policy 2008, 36, 4116–4125. [Google Scholar] [CrossRef]
- Jefferson, M. Win-win strategies for tackling oil and natural gas constraints while expanding renewable energy use. In Sustainable Energy Production and Consumption; NATO Science for Peace and Security Series C: Environmental Security; Springer: Berlin/Heidelberg, Germany, 2008; pp. 25–42. [Google Scholar]
Figure 1.
An infographic showing the economic change in Hong Kong for the period from 1970 to 2015.

Figure 2.
(a) People engaged in different sectors (thousands) for the period from 1970 to 2015; (b) people engaged in different sectors (in percent) for the period from 1970 to 2015. Note: The data were obtained from the Hong Kong Census and Statistics Department [9,27].

Figure 3.
(a) Primary energy consumption in PJ for the period from 1970 to 2015 (yearly); (b) primary energy consumption in percentage for the period from 1970 to 2015 (yearly).
Figure 3.
(a) Primary energy consumption in PJ for the period from 1970 to 2015 (yearly); (b) primary energy consumption in percentage for the period from 1970 to 2015 (yearly).

Figure 4.
Greenhouse gas (GHG) emissions in Mt from fossil fuel consumption from 1970 to 2015 (yearly).
Figure 4.
Greenhouse gas (GHG) emissions in Mt from fossil fuel consumption from 1970 to 2015 (yearly).

Figure 5.
Emission factor and fuel mix from 1970 to 2015 (yearly).

Figure 6.
(a) GHG emissions and population for the period from 1970 to 2015 (yearly); (b) GHG emissions and total GDP for the period from 1970 to 2015 (yearly).
Figure 6.
(a) GHG emissions and population for the period from 1970 to 2015 (yearly); (b) GHG emissions and total GDP for the period from 1970 to 2015 (yearly).


Table 1.
Calorific values and emission factors of different fossil fuels [31].
Table 1.
Calorific values and emission factors of different fossil fuels [31].
| Fuel | Calorific Values | GHG Emissions kg/TJ | Major Use of Fuel in Hong Kong | ||
|---|---|---|---|---|---|
| CO2 | CH4 | N2O | |||
| Kerosene | 0.0358 PJ/ML | 71,500 | 0.5 | 2 | Aviation |
| Motor gasoline | 0.0332 PJ/ML | 69,300 | 3.8 | 5.7 | Private cars |
| Diesel oil | 0.0366 PJ/ML | 74,100 | 3.9 | 3.9 | Trucks and buses |
| Heavy fuel oil | 0.0404 PJ/ML | 77,400 | 7 | 2 | Marine vehicles |
| Liquefied petroleum gas | 0.0473 PJ/kt | 63,100 | 62 | 0.2 | Taxis and households |
| Natural gas | 0.0544 PJ/kt | 64,200 | 3 | 0.6 | Producing electricity |
| Coal | 0.0264 PJ/kt | 94,600 | 1 | 1.5 | Producing electricity |
Table 2.
Production-based gross domestic product (GDP) by economic activity.
| GDP by Economic Activity in HKD Billion 4 (Percent) | Total GDP HKD Billion 4 | Events in China 5 | |||||
|---|---|---|---|---|---|---|---|
| Year | Manufacturing | Logistics 1 | Finance 2 | Tourism/Retail 3 | Others | ||
| 1970 | 64.0 (30.8) | 16.0 (7.7) | 31.1 (14.9) | 37.7 (18.1) | 59.3 (28.5) | 208.2 | A |
| 1975 | 76.9 (26.9) | 20.4 (7.2) | 48.7 (17.1) | 58.9 (20.6) | 80.5 (28.2) | 285.5 | |
| 1980 | 116.1 (23.6) | 36.1 (7.3) | 113.5 (23.0) | 105.1 (21.3) | 121.9 (24.8) | 492.7 | B |
| 1985 | 143.3 (22.0) | 52.8 (8.1) | 105.0 (16.1) | 148.1 (22.8) | 201.6 (31.0) | 650.8 | |
| 1990 | 134.7 (14.3) | 72.9 (7.7) | 156.9 (16.6) | 193.1 (20.4) | 386.9 (41.0) | 944.4 | |
| 1995 | 101.1 (8.3) | 122.4 (10.0) | 302.7 (24.8) | 327.6 (26.8) | 368.7 (30.1) | 1222.6 | C |
| 2000 | 66.6 (4.8) | 105.9 (7.6) | 306.3 (22.0) | 341.4 (24.5) | 571.4 (41.1) | 1391.5 | |
| 2005 | 49.2 (2.9) | 143.4 (8.4) | 387.5 (22.6) | 493.3 (28.8) | 637.9 (37.3) | 1711.3 | D |
| 2010 | 36.3 (1.7) | 164.5 (7.9) | 563.9 (27.2) | 560.3 (27.0) | 749.1 (36.2) | 2074.0 | |
| 2015 | 28.1 (1.2) | 154.7 (6.5) | 683.4 (28.5) | 624.3 (26.0) | 908.0 (37.8) | 2398.4 | |
1 Logistics includes “transport and storage”. 2 Finance includes “finance, insurance, real estate, and business services”. 3 Tourism/retail includes “wholesale, retail, import/export trades, restaurants, and hotels”. 4 The values of GDP data were inflation-adjusted values. 5 Events: A. Abundant workers from China during the Cultural Revolution between 1966 and 1976; B. The open-door policy was adopted in China in 1978; C. The H-shares (shares of major mainland enterprises) started trading in the HK Stock Exchange in 1992; D. HK and China signed the Close Economic Partnership Agreement and Individual Visit Scheme in 2003. Note: The sectoral and total GDP of Hong Kong from 1970 to 2015 were obtained from the Hong Kong Census and Statistics Department [9,27].
Table 3.
Consumption of energy (primary and secondary) in Hong Kong from 1970 to 2015.
| Primary Energy From Fossil Fuels | ||||||||
| Year | Oil Products | Natural Gas in kt 2 | Coal in kt 3 | |||||
| Aviation Kerosene in Megaliters 1 | Kerosene in Megaliters 1 | Motor Gasoline in Megaliters | Gas and Diesel Oil, Naphtha in Megaliters | Fuel Oil in Megaliters | Liquefied Petroleum Gas in kt | |||
| 1970 | 435 | 210 | 125 | 529 | 2253 | 24 | 0 | 55 |
| 1975 | 702 | 235 | 147 | 748 | 2458 | 73 | 0 | 23 |
| 1980 | 744 | 307 | 258 | 1320 | 4207 | 103 | 0 | 30 |
| 1985 | 1196 | 82 | 269 | 1543 | 2131 | 143 | 0 | 5547 |
| 1990 | 2296 | 7 | 391 | 2691 | 1347 | 169 | 0 | 8957 |
| 1995 | 3318 | 495 | 4691 | 1562 | 124 | 24 | 9114 | |
| 2000 | 4011 | 486 | 7802 | 2141 | 157 | 2207 | 6065 | |
| 2005 | 5425 | 454 | 4992 | 4976 | 340 | 1970 | 10,832 | |
| 2010 | 6510 | 512 | 6572 | 9731 | 389 | 2819 | 10,328 | |
| 2015 | 7380 | 685 | 6046 | 7644 | 378 | 2389 | 11,184 | |
| Secondary Energy | ||||||||
| Year | Net Imported Electricity 4 in PJ | Electricity Consumed in PJ | Town Gas Consumed in PJ | |||||
| 1970 | 0 | 16 | 1 | |||||
| 1975 | 0 | 23 | 2 | |||||
| 1980 | −1 | 39 | 4 | |||||
| 1985 | −4 | 57 | 8 | |||||
| 1990 | −6 | 86 | 15 | |||||
| 1995 | 24 | 107 | 22 | |||||
| 2000 | 32 | 131 | 26 | |||||
| 2005 | 21 | 144 | 27 | |||||
| 2010 | 28 | 151 | 28 | |||||
| 2015 | 38 | 158 | 28 | |||||
1 Aviation kerosene and kerosene are classified under the same item in Hong Kong from 1995. 2 Hong Kong’s power companies have burnt natural gas to generate electricity after 1995. 3 Hong Kong’s power companies have used coal to generate electricity since 1982. 4 Hong Kong exported electricity to Shenzhen from 1979 to 1993 when Shenzhen started transforming itself from an agricultural municipality to an industrial-based special economic zone. The Daya Bay Nuclear Power Plant in Shenzhen was put into operation in 1994. Since then, CLP has imported electricity from this nuclear power plant.
Table 4.
Relationship between GHG emissions and socio-economic variables from 1970 to 2015.
| Variables | Coefficients/Slopes | R2 | |
|---|---|---|---|
| Dependent, y | Independent, xi | mi | |
| per capita GDPYear | 58.63 | 0.998 | |
| per capita ENERGY USEYear | 50.98 | ||
© 2017 by the authors. Licensee MDPI, Basel, Switzerland. This article is an open access article distributed under the terms and conditions of the Creative Commons Attribution (CC BY) license (http://creativecommons.org/licenses/by/4.0/).
Share and Cite
MDPI and ACS Style
To, W.-M.; Lee, P.K.C. Energy Consumption and Economic Development in Hong Kong, China. Energies 2017, 10, 1883. https://0-doi-org.brum.beds.ac.uk/10.3390/en10111883
AMA Style
To W-M, Lee PKC. Energy Consumption and Economic Development in Hong Kong, China. Energies. 2017; 10(11):1883. https://0-doi-org.brum.beds.ac.uk/10.3390/en10111883
Chicago/Turabian StyleTo, Wai-Ming, and Peter K. C. Lee. 2017. "Energy Consumption and Economic Development in Hong Kong, China" Energies 10, no. 11: 1883. https://0-doi-org.brum.beds.ac.uk/10.3390/en10111883
Note that from the first issue of 2016, this journal uses article numbers instead of page numbers. See further details here.