Economic Exposure to Oil Price Shocks and the Fragility of Oil-Exporting Countries

Abstract
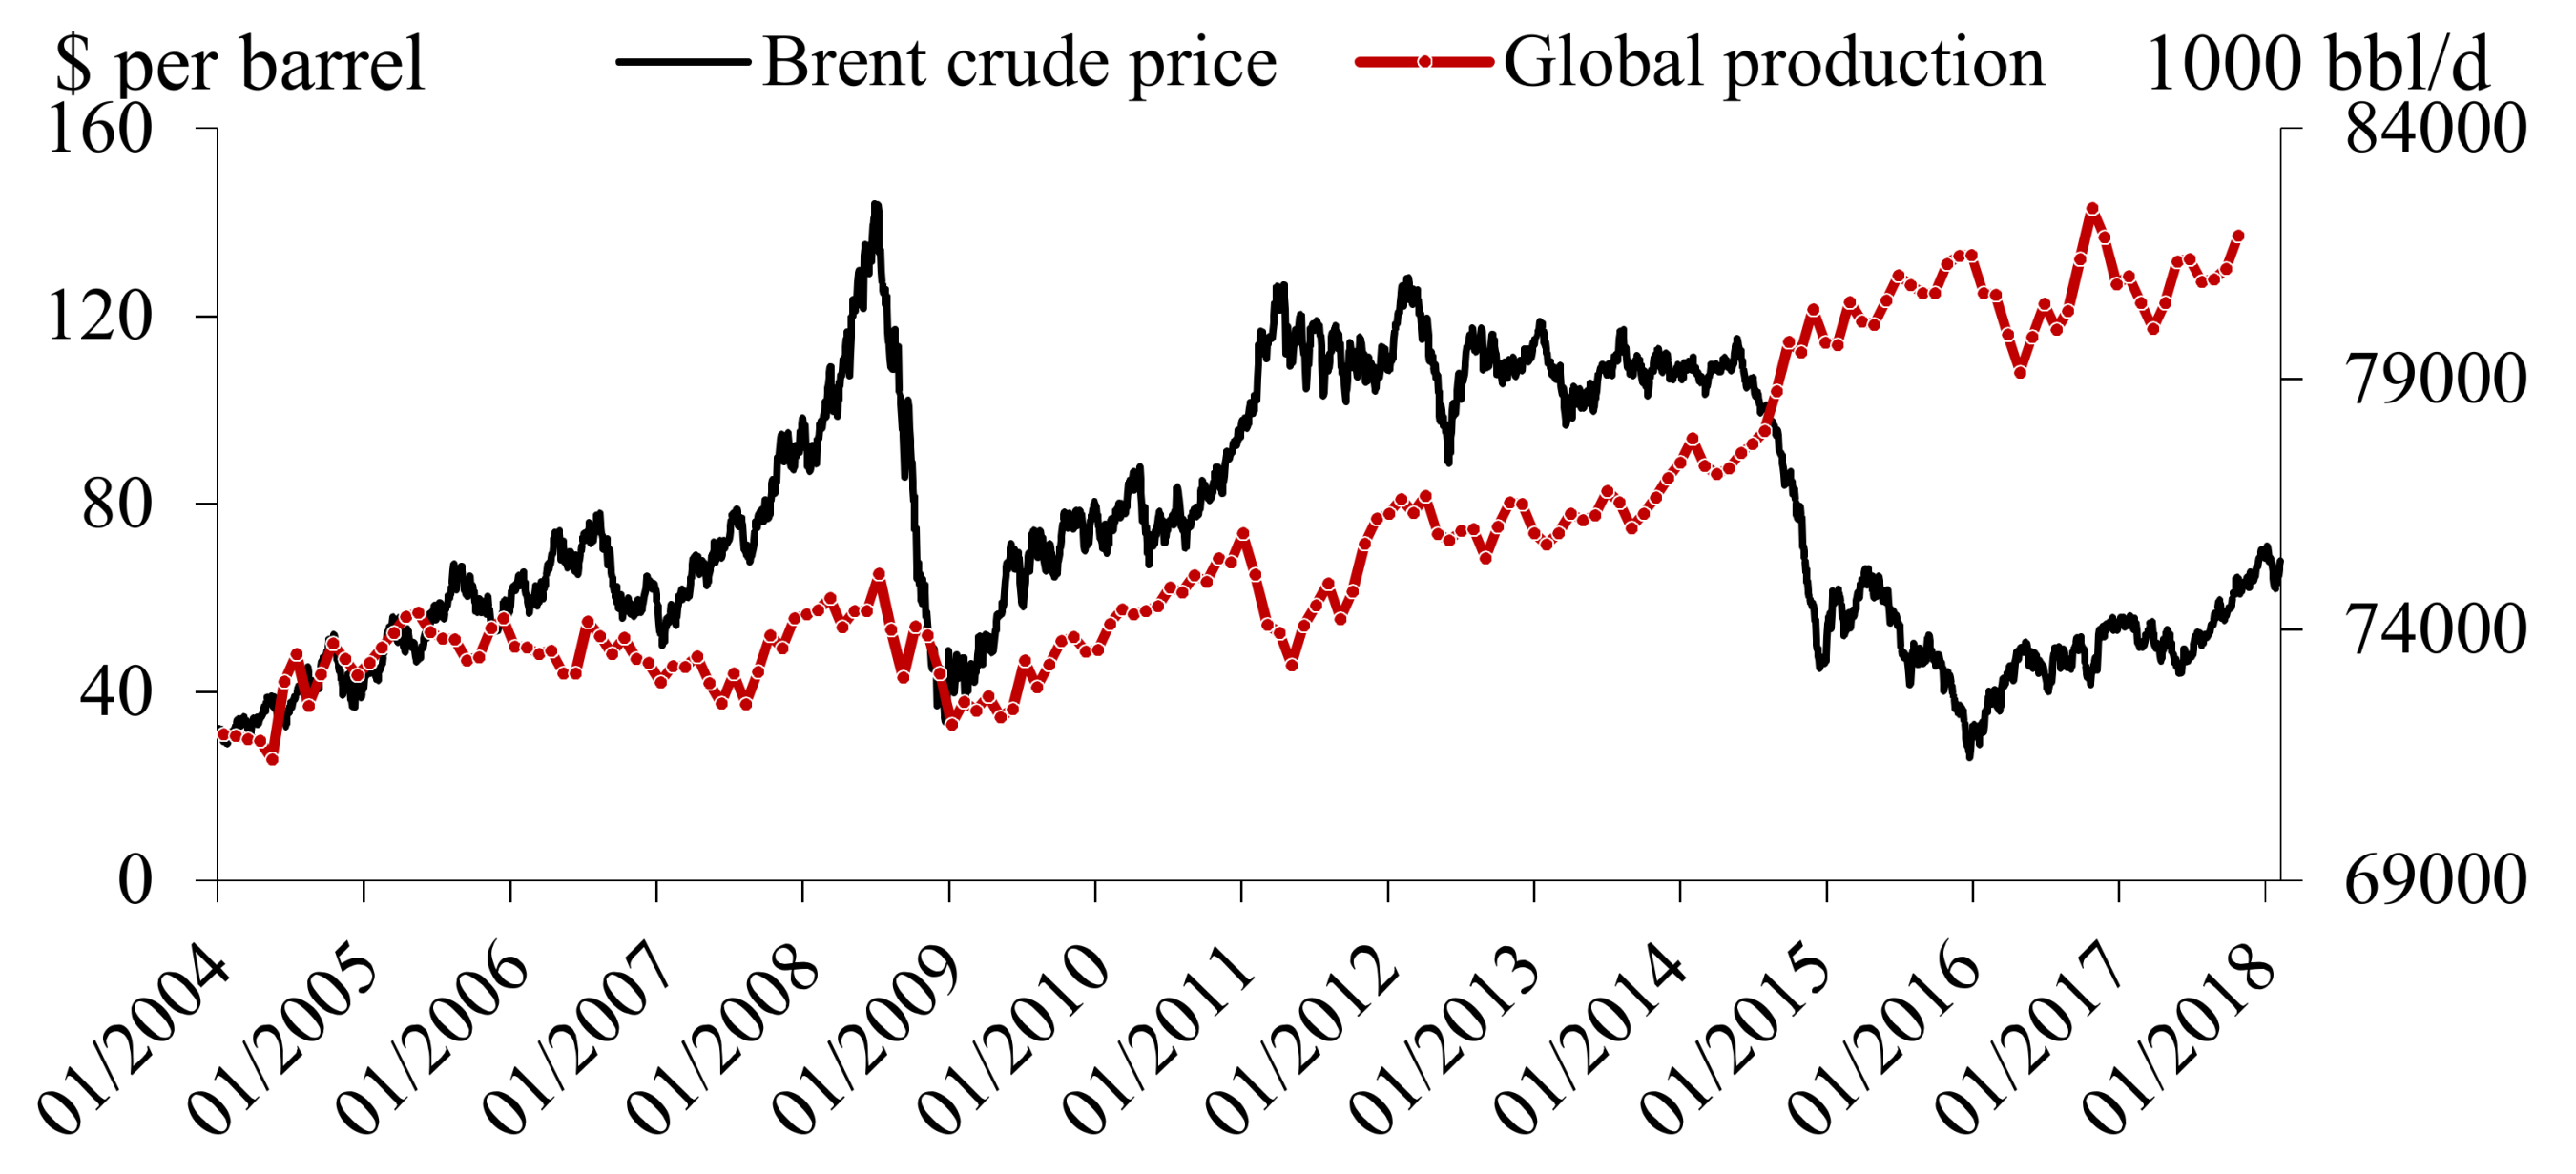
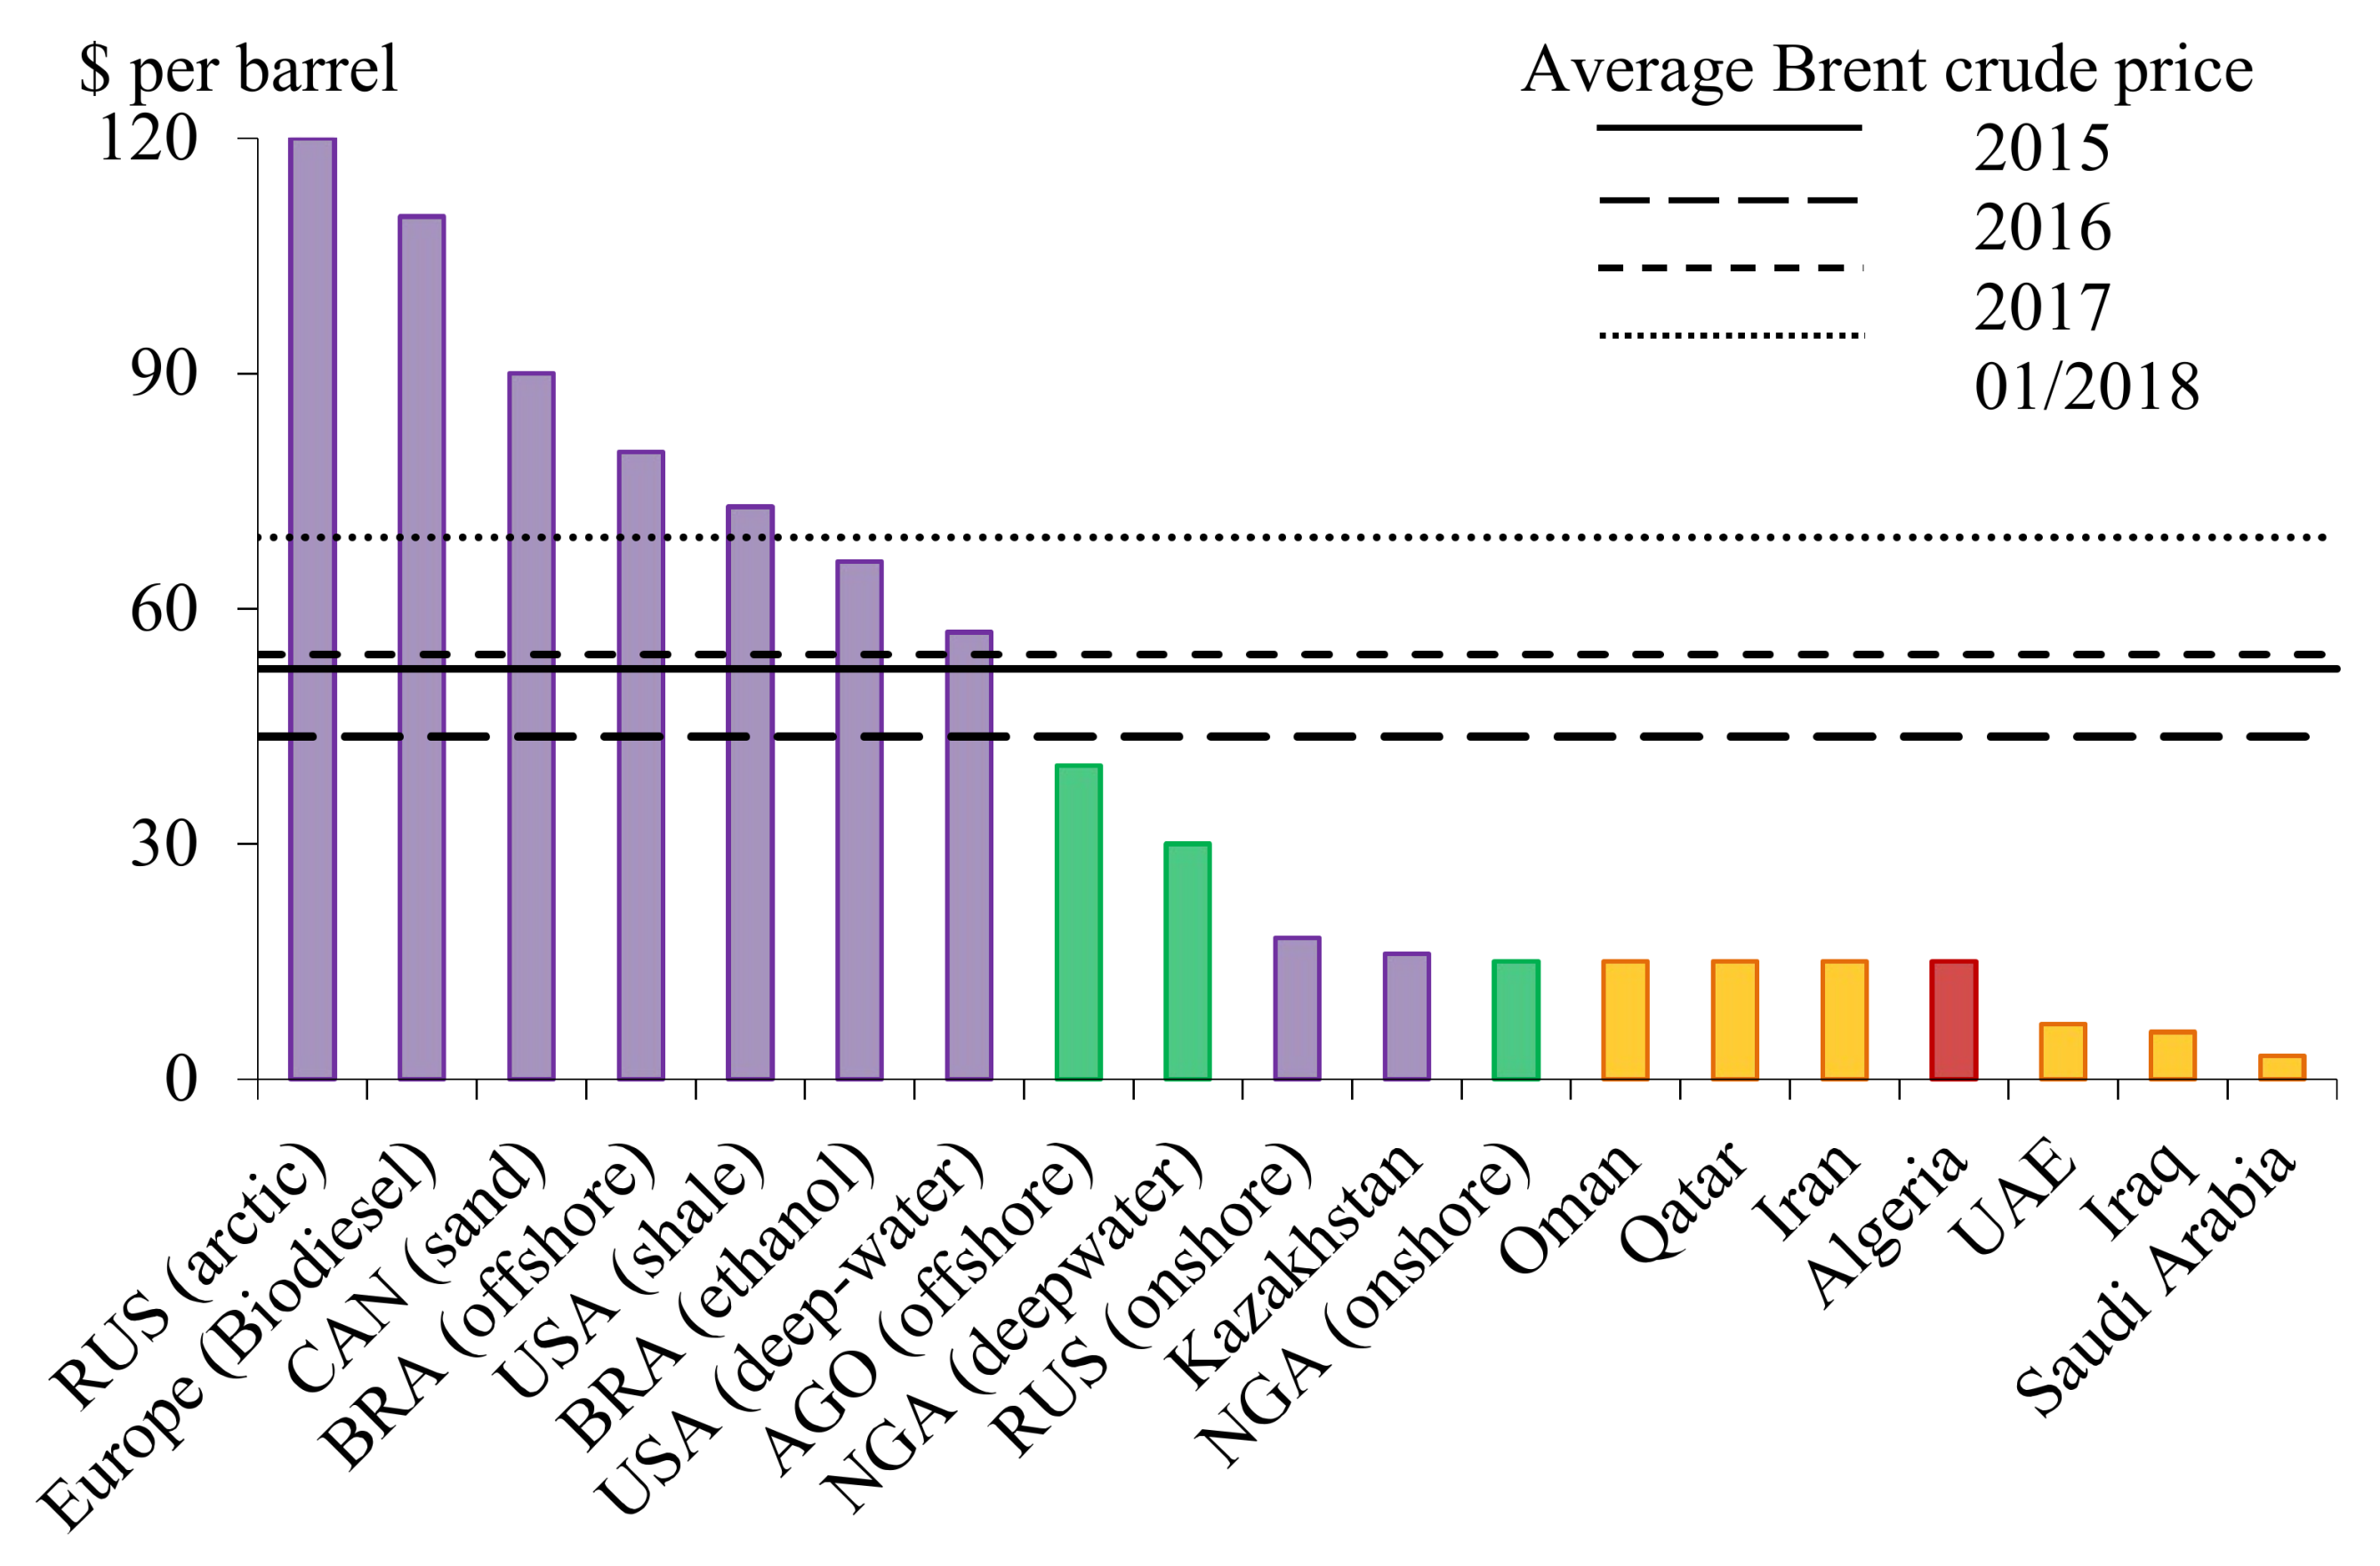
:1. Introduction: Making Sense of the Recent Evolution of the Crude Oil Price
2. Retrospective Analysis of the Exposure to the Global Oil Market
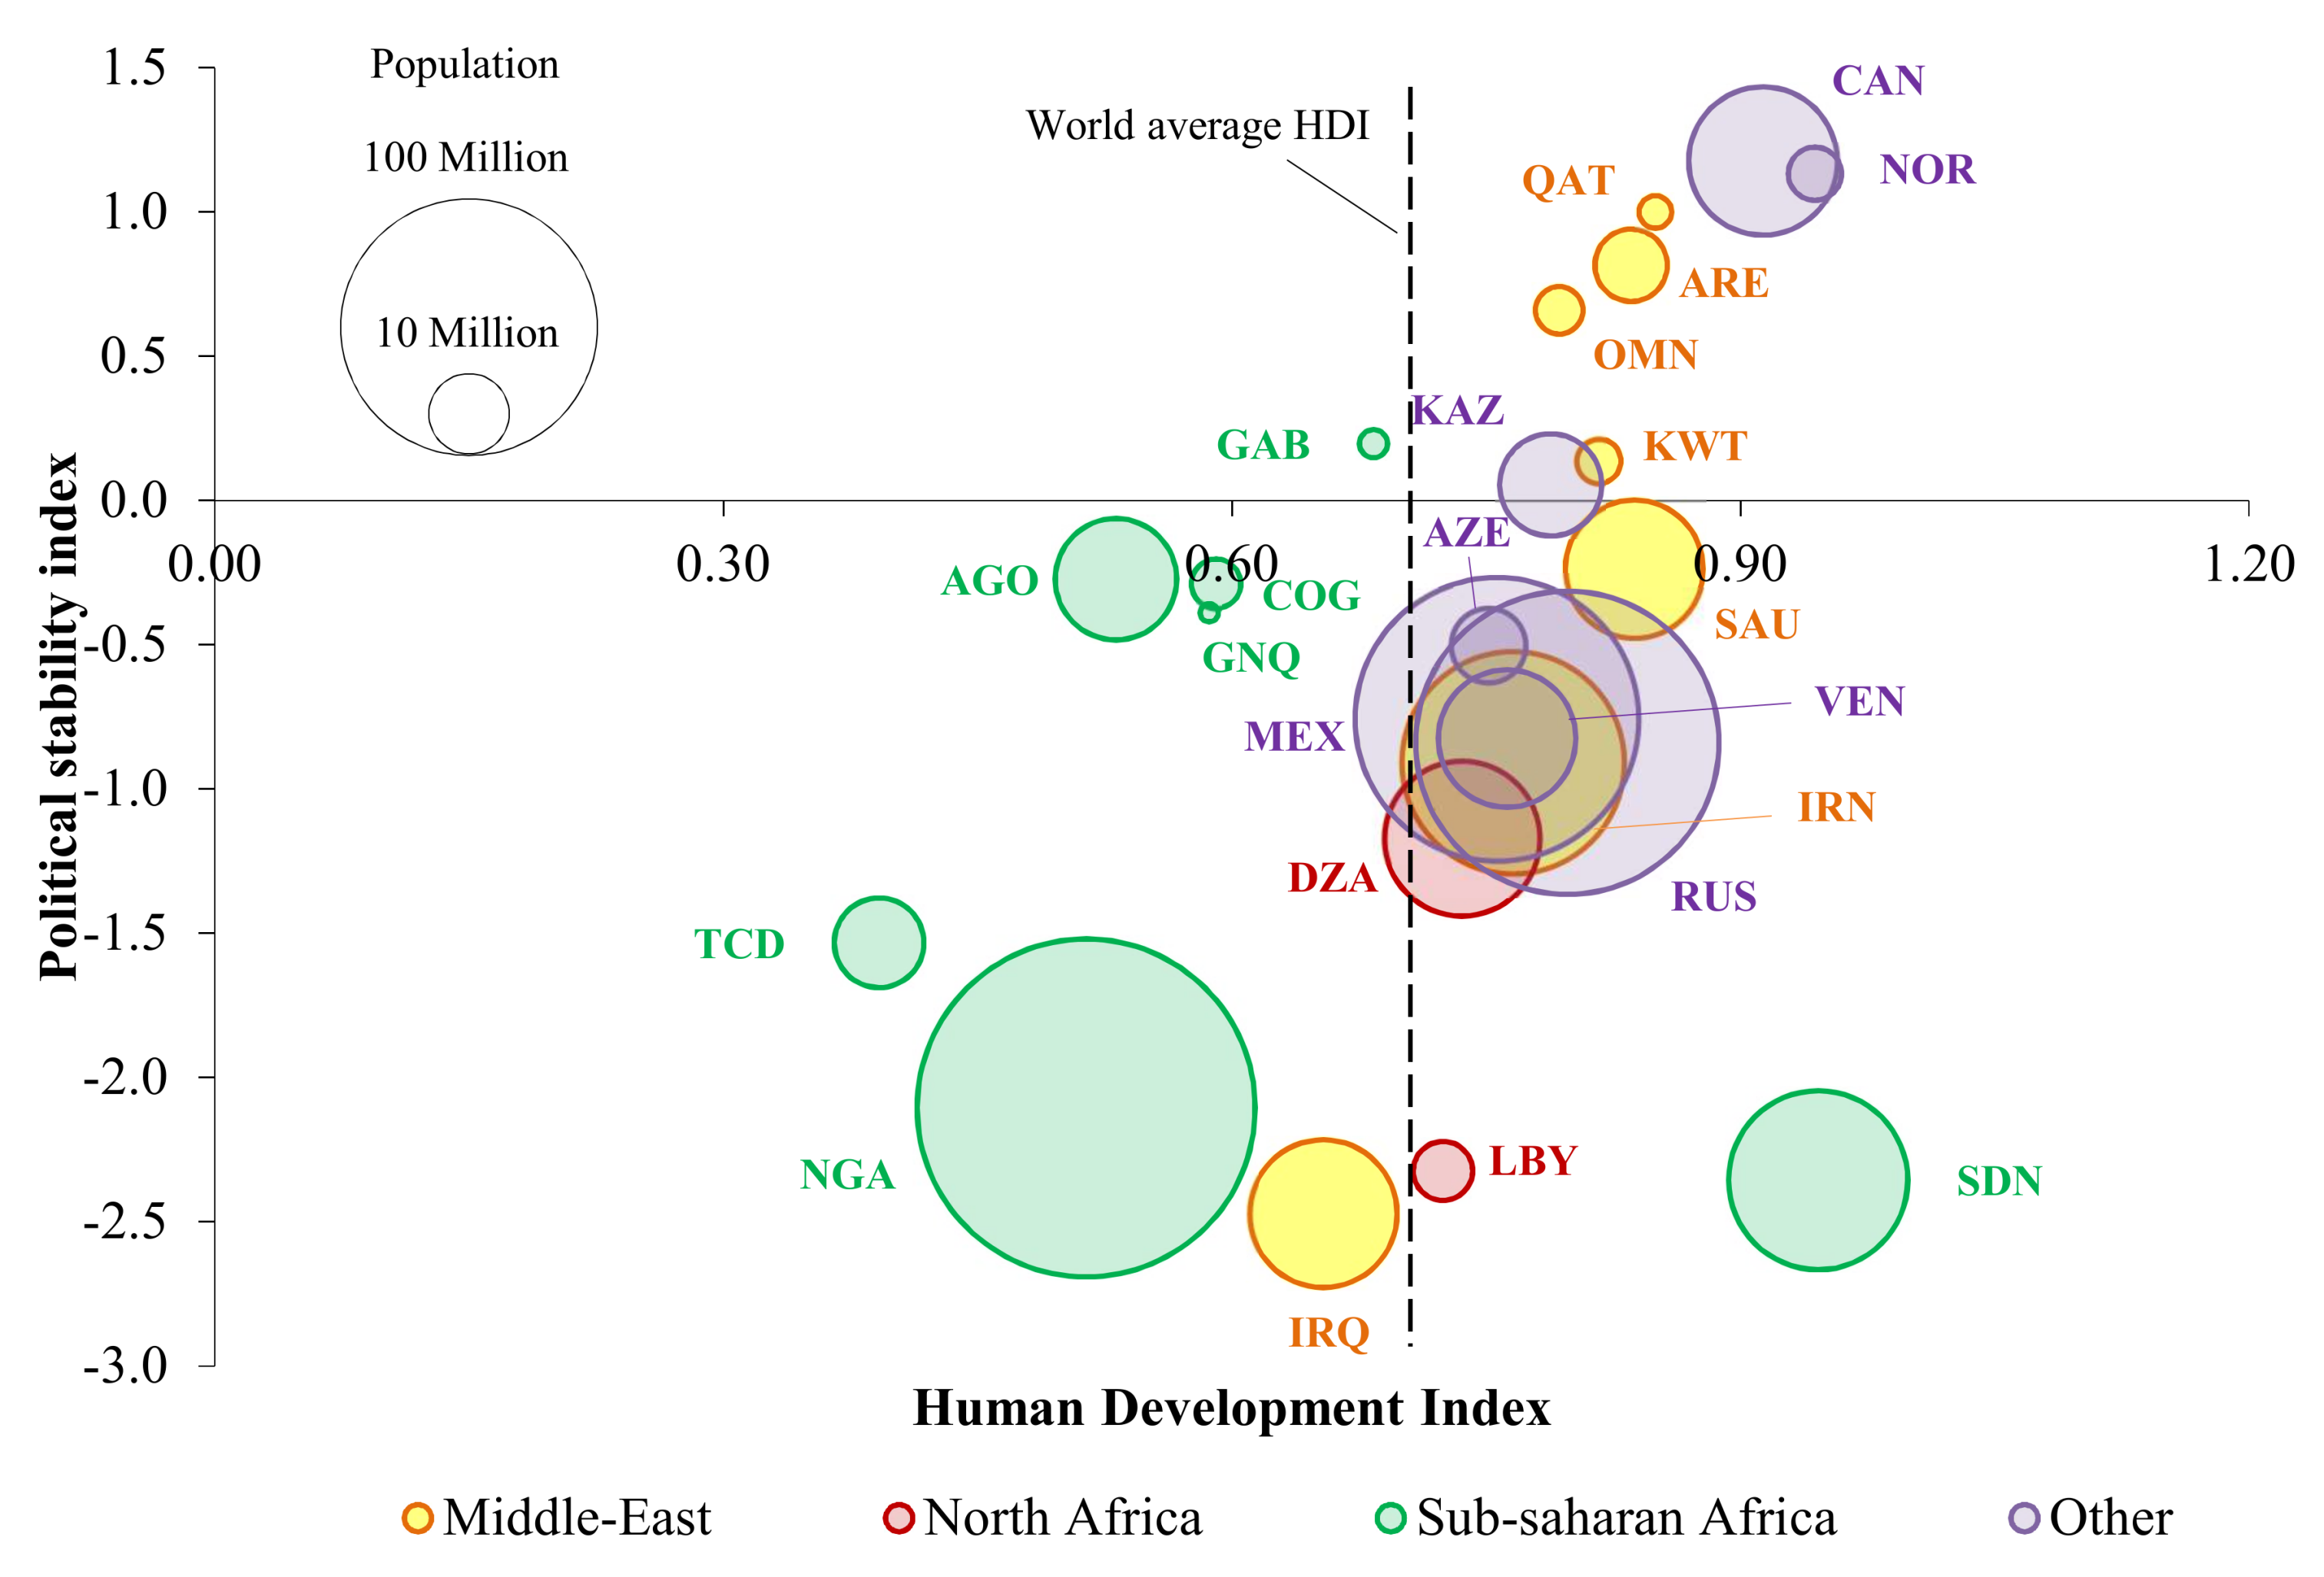
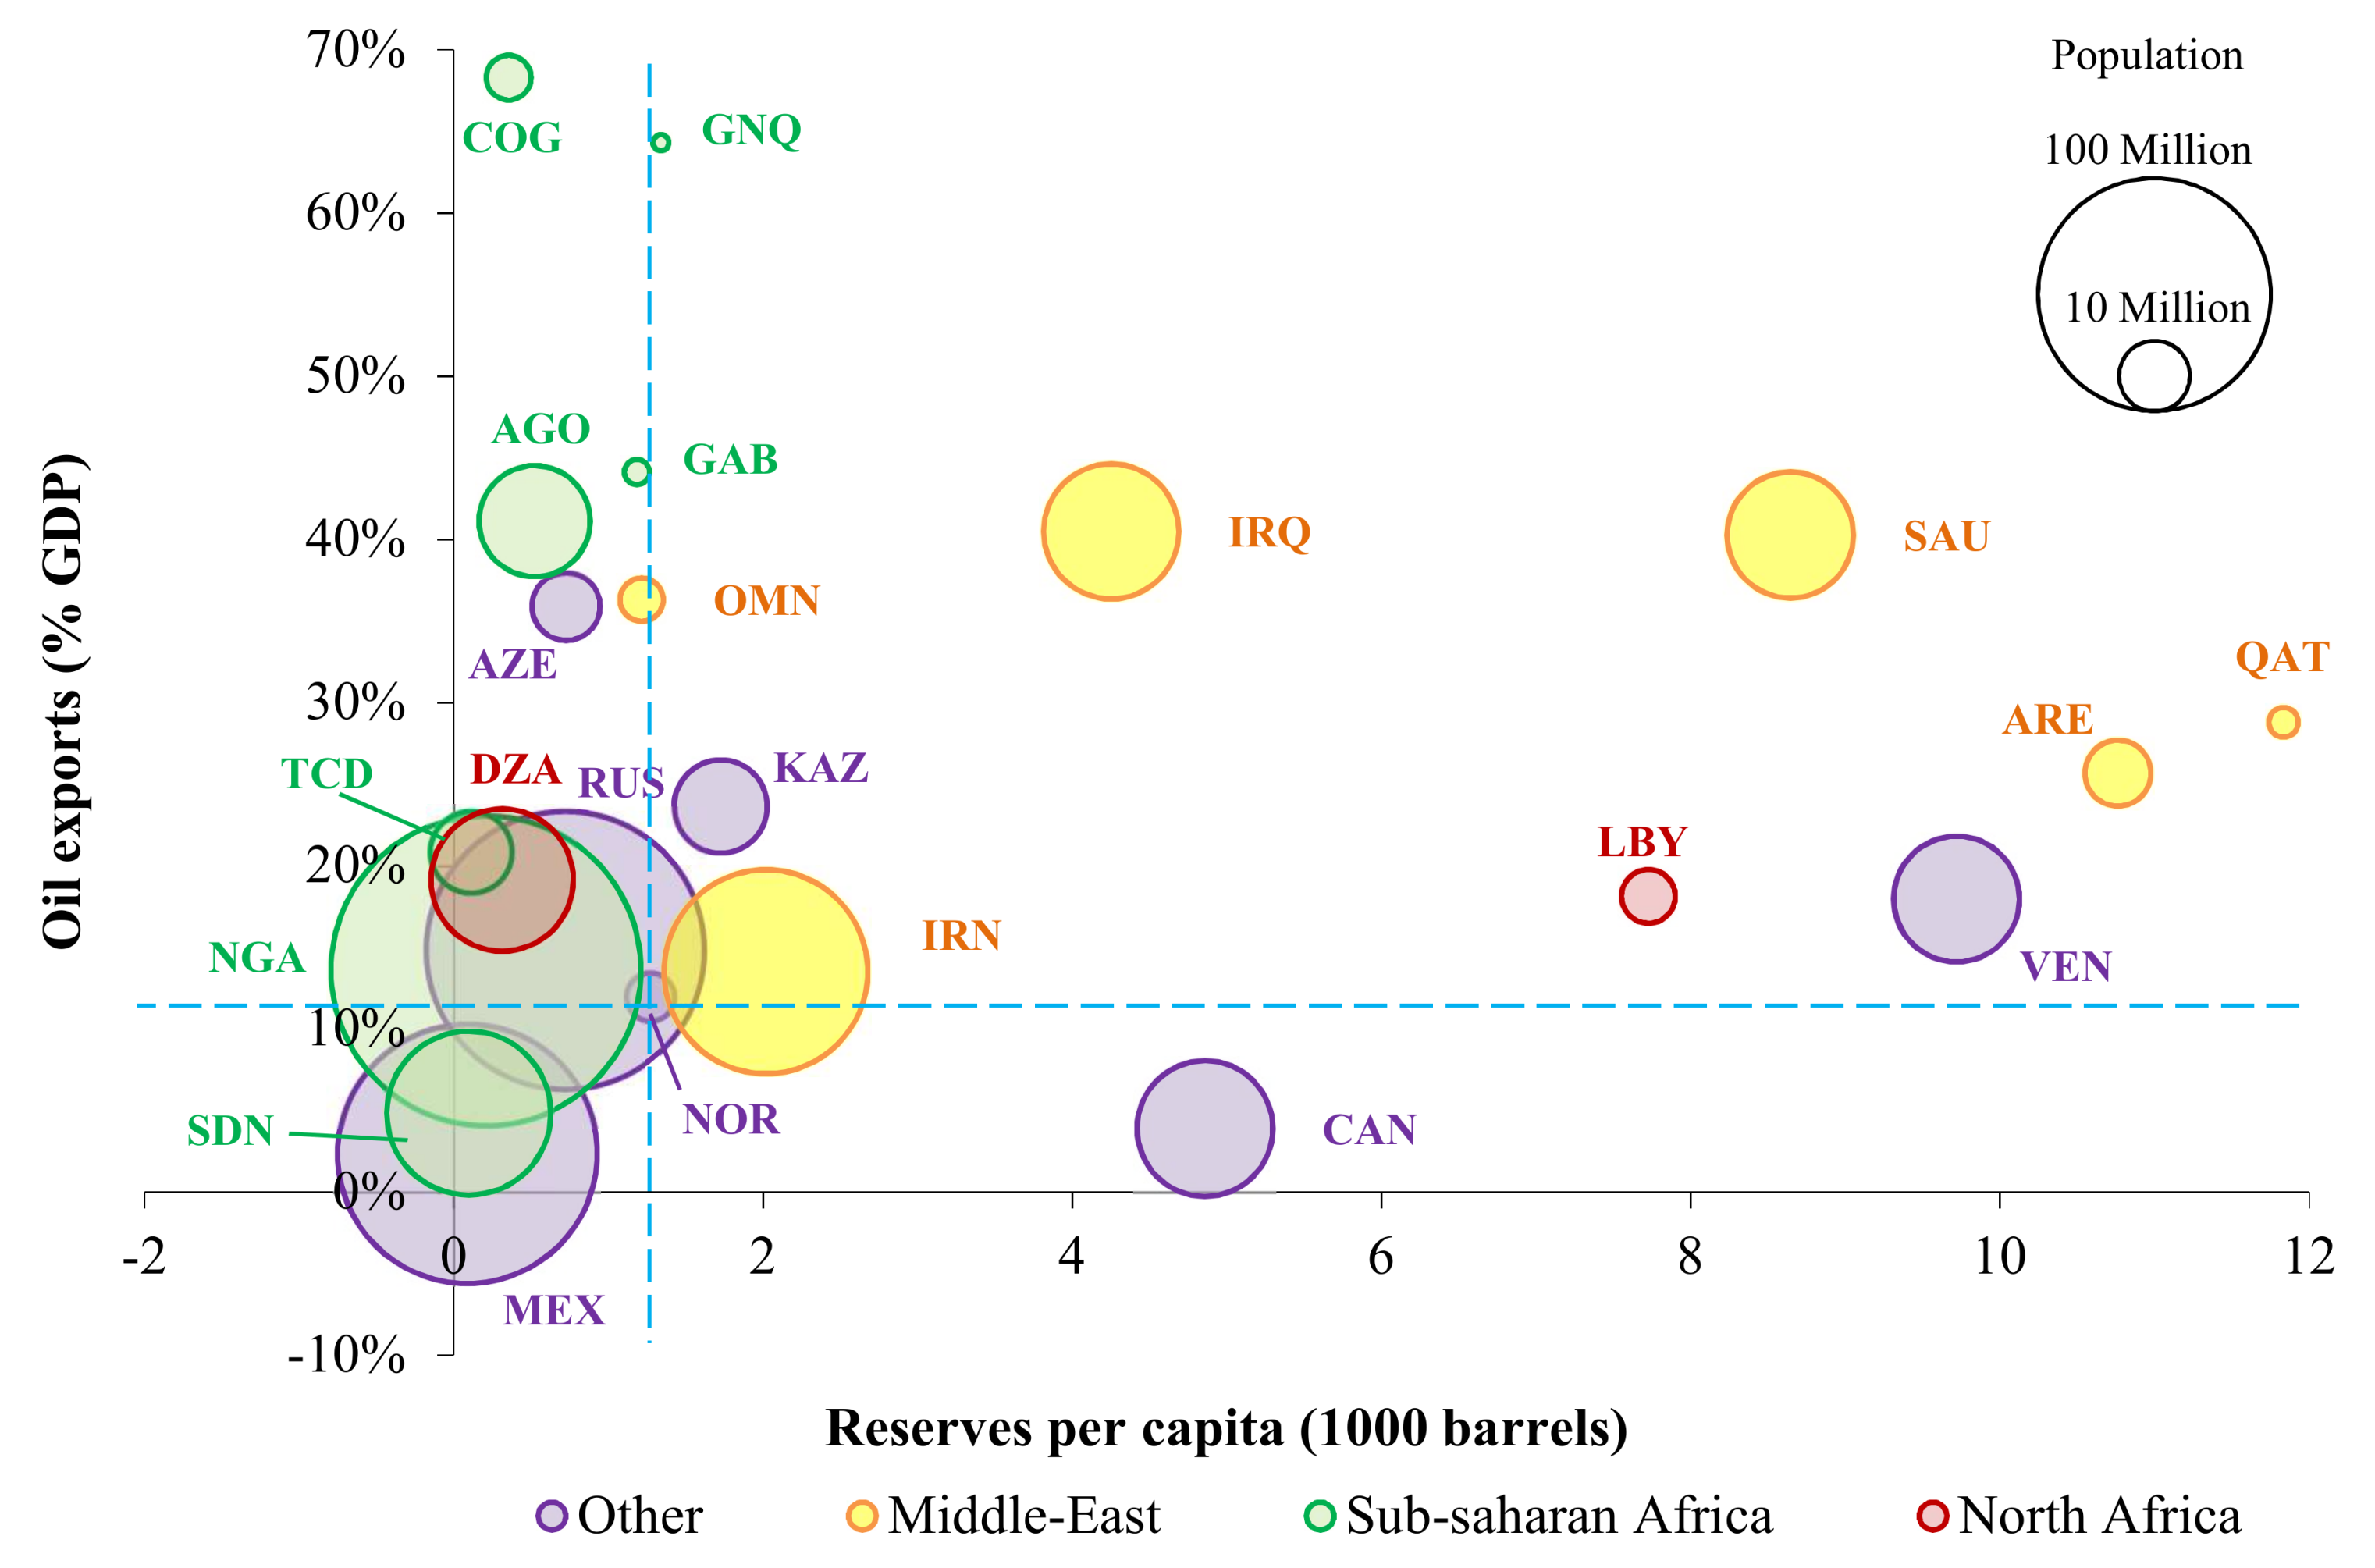
2.1. Exploring the Vulnerability of Oil Exporters to Low Oil Prices
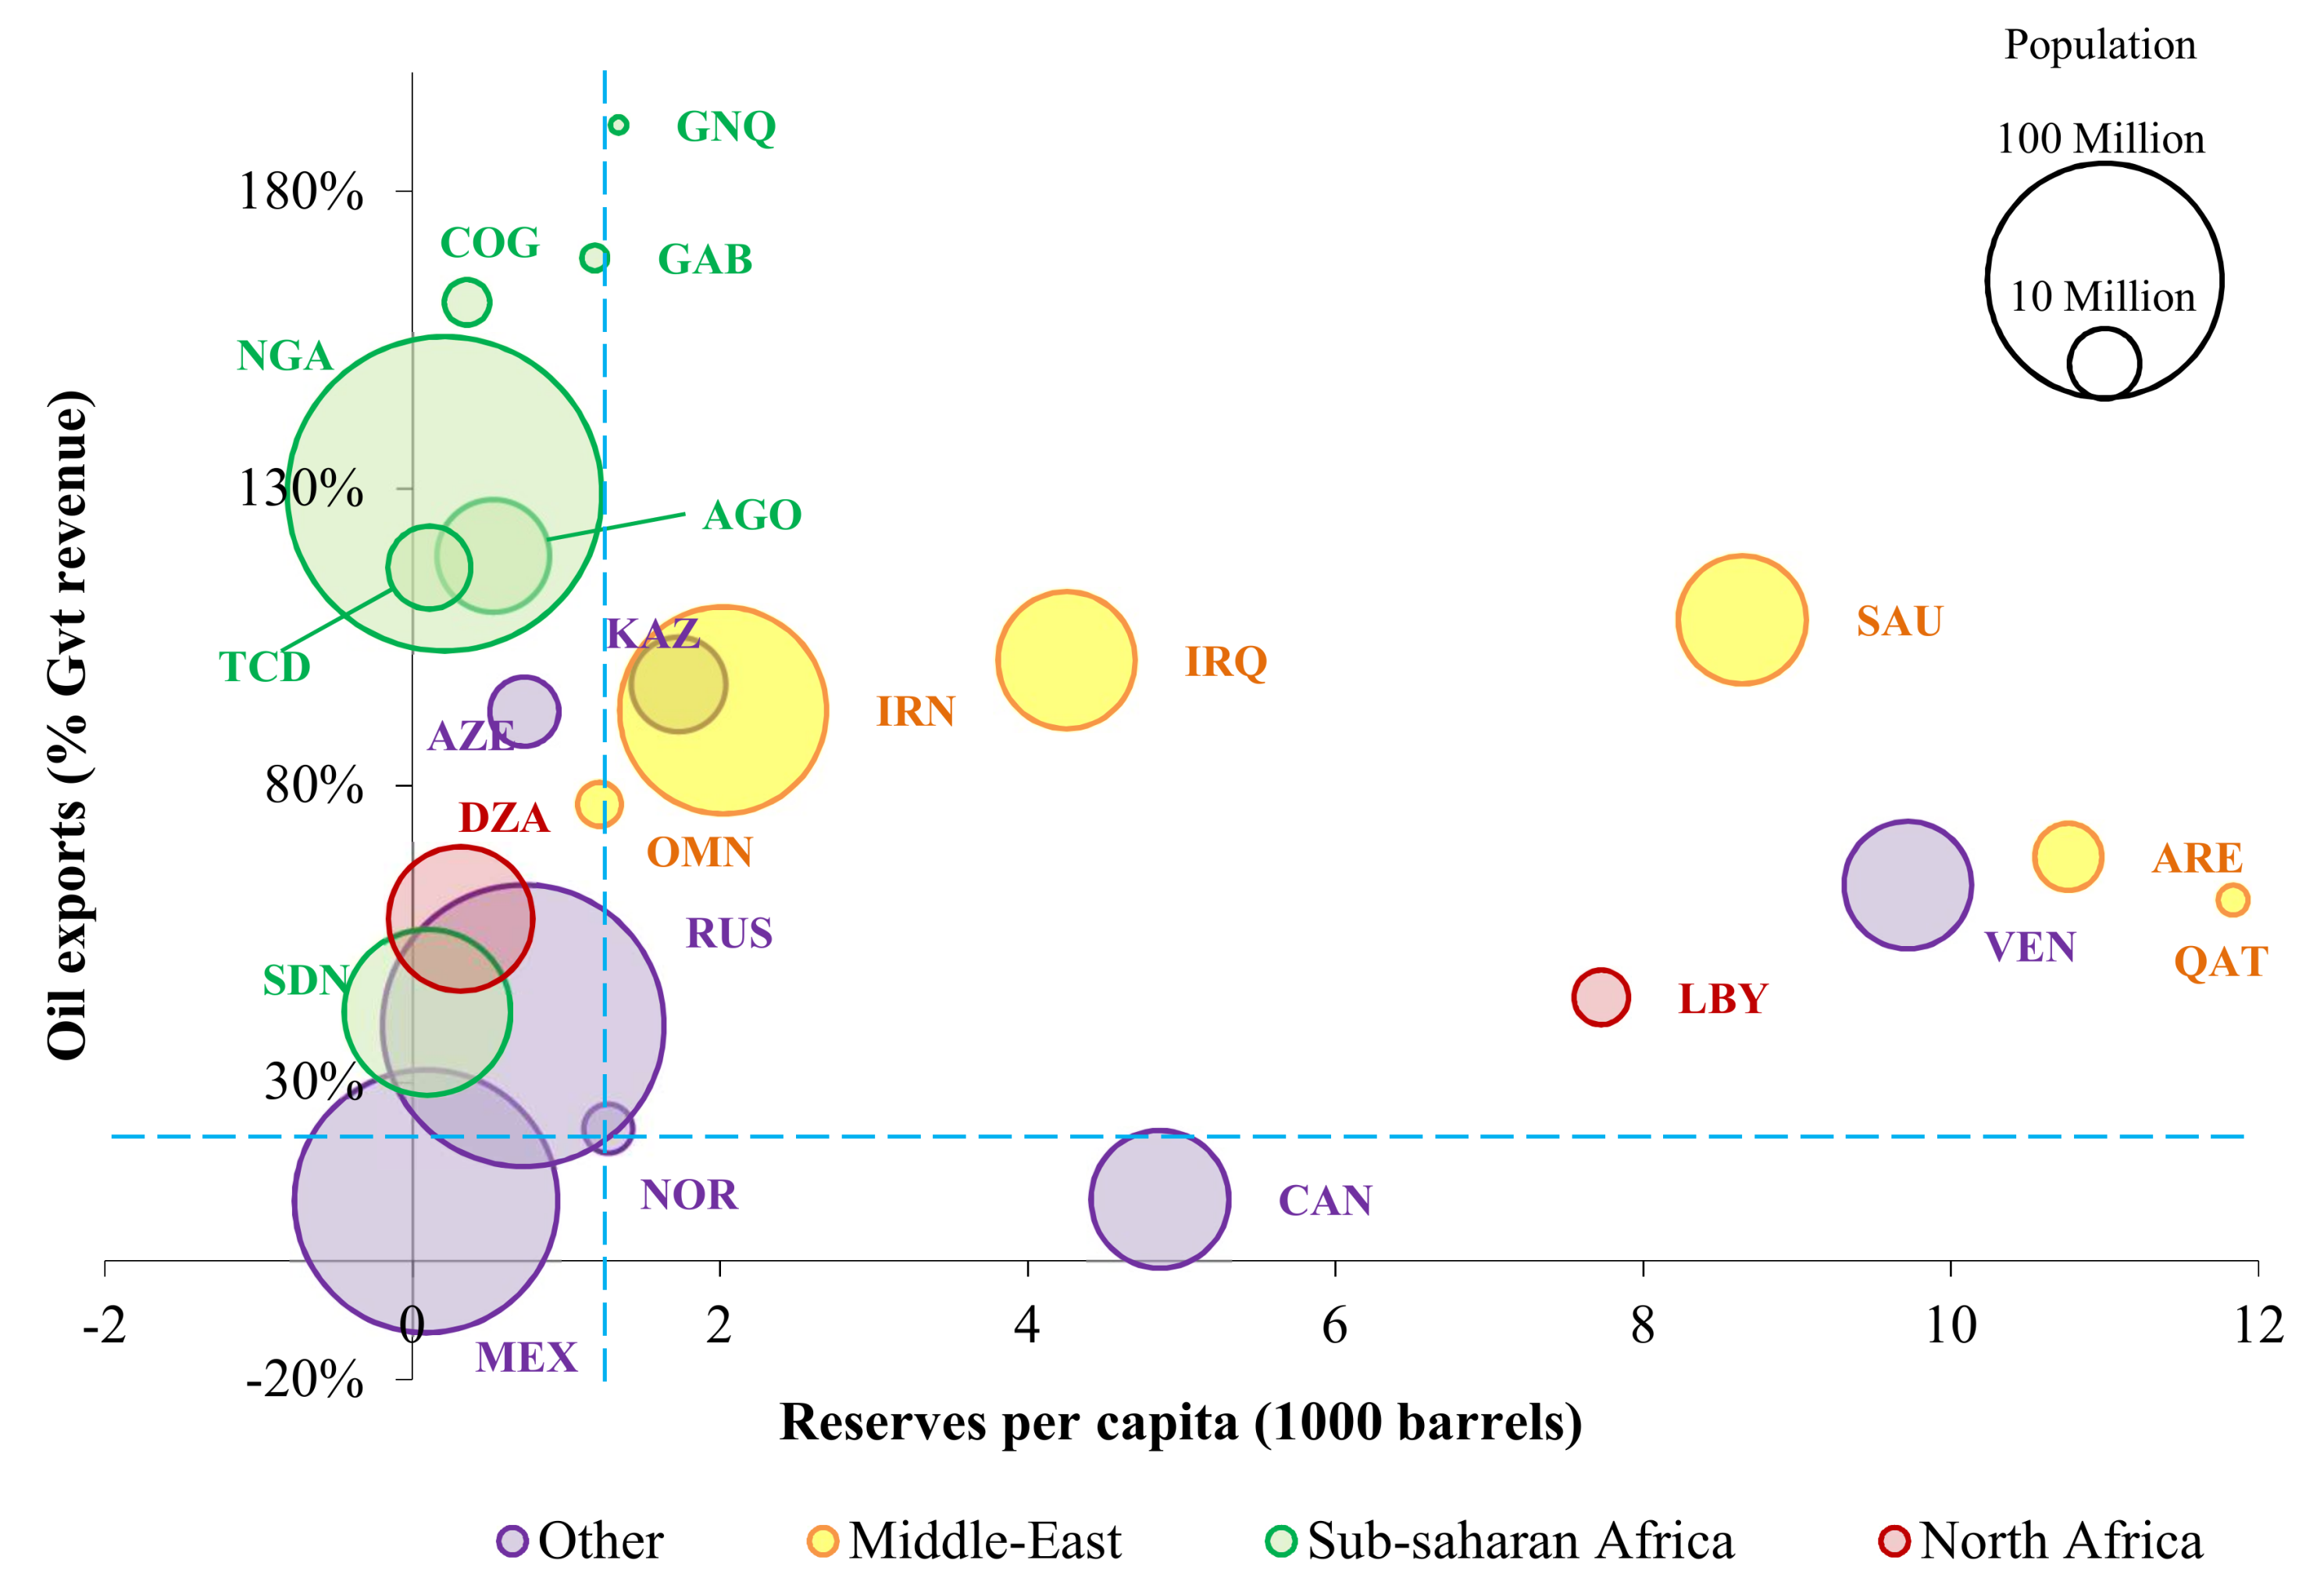
- Upper left: high exposure of the economy and government revenue and limited reserves per capita. This is especially true for Congo (COG), Angola (AGO), Gabon (GAB), and Azerbaijan (AZE), and to a lesser extent for Russia (RUS) and Algeria (DZA). In Nigeria (NGA), the most populated of all exporters, oil exports are larger than the government revenues, indicating that resources for the government are potentially much more exposed to the oil market than when looking only at GDP. When looking at oil exports relative to government revenue, a regional pattern emerges with many Sub-Saharan African countries located in the top left part of Figure 6, suggesting particular vulnerability to oil prices in the region.
- Upper right: high exposure of the economy and government revenue, but high reserves that can act as a long-term buffer for the economy. This group gathers most of the Middle-Eastern exporters. Oil exports are in particular very high compared to GDP for Iraq (IRQ) and Saudi Arabia (SAU), even though their high reserves per capita may give some longer-term resilience to oil price changes. The value of oil exports nearly matches the size of government revenues in Iran (IRN), hinting at a strong relation between the state’s fiscal capacity and the oil price. The conflict in Libya (LBY), a country with very high reserves per capita that is shown in this category, has origins that go beyond the oil market. With high reserves per capita, Venezuela (VEN) also features in this group, with more favorable conditions with respect to exposure and resource availability (including nonconventional oil), although the country is facing an economic downturn as of recently. The latter two examples highlight that oil markets are not the only determinant of political and economic stability.
- Lower left: limited reserves but limited exposure of the economy. This group actually gathers only Mexico (MEX) and Sudan (SDN), two large countries where oil exports are small, making their economies comparably less dependent on the oil market.
- Lower right: high reserves and low exposure of the economy. This is the group with the expected highest economic stability with respect to oil price: small oil exports compared to GDP and high reserves per capita. In this group we find Canada (CAN), which does not come as a surprise based on the high political stability and human development statistics displayed in Figure 4.
2.2. Macroeconomic Performance and Government Revenue
3. Macroeconomic Impacts of a Drop in Oil Prices
3.1. Methods: Scenario Definition and Model Description
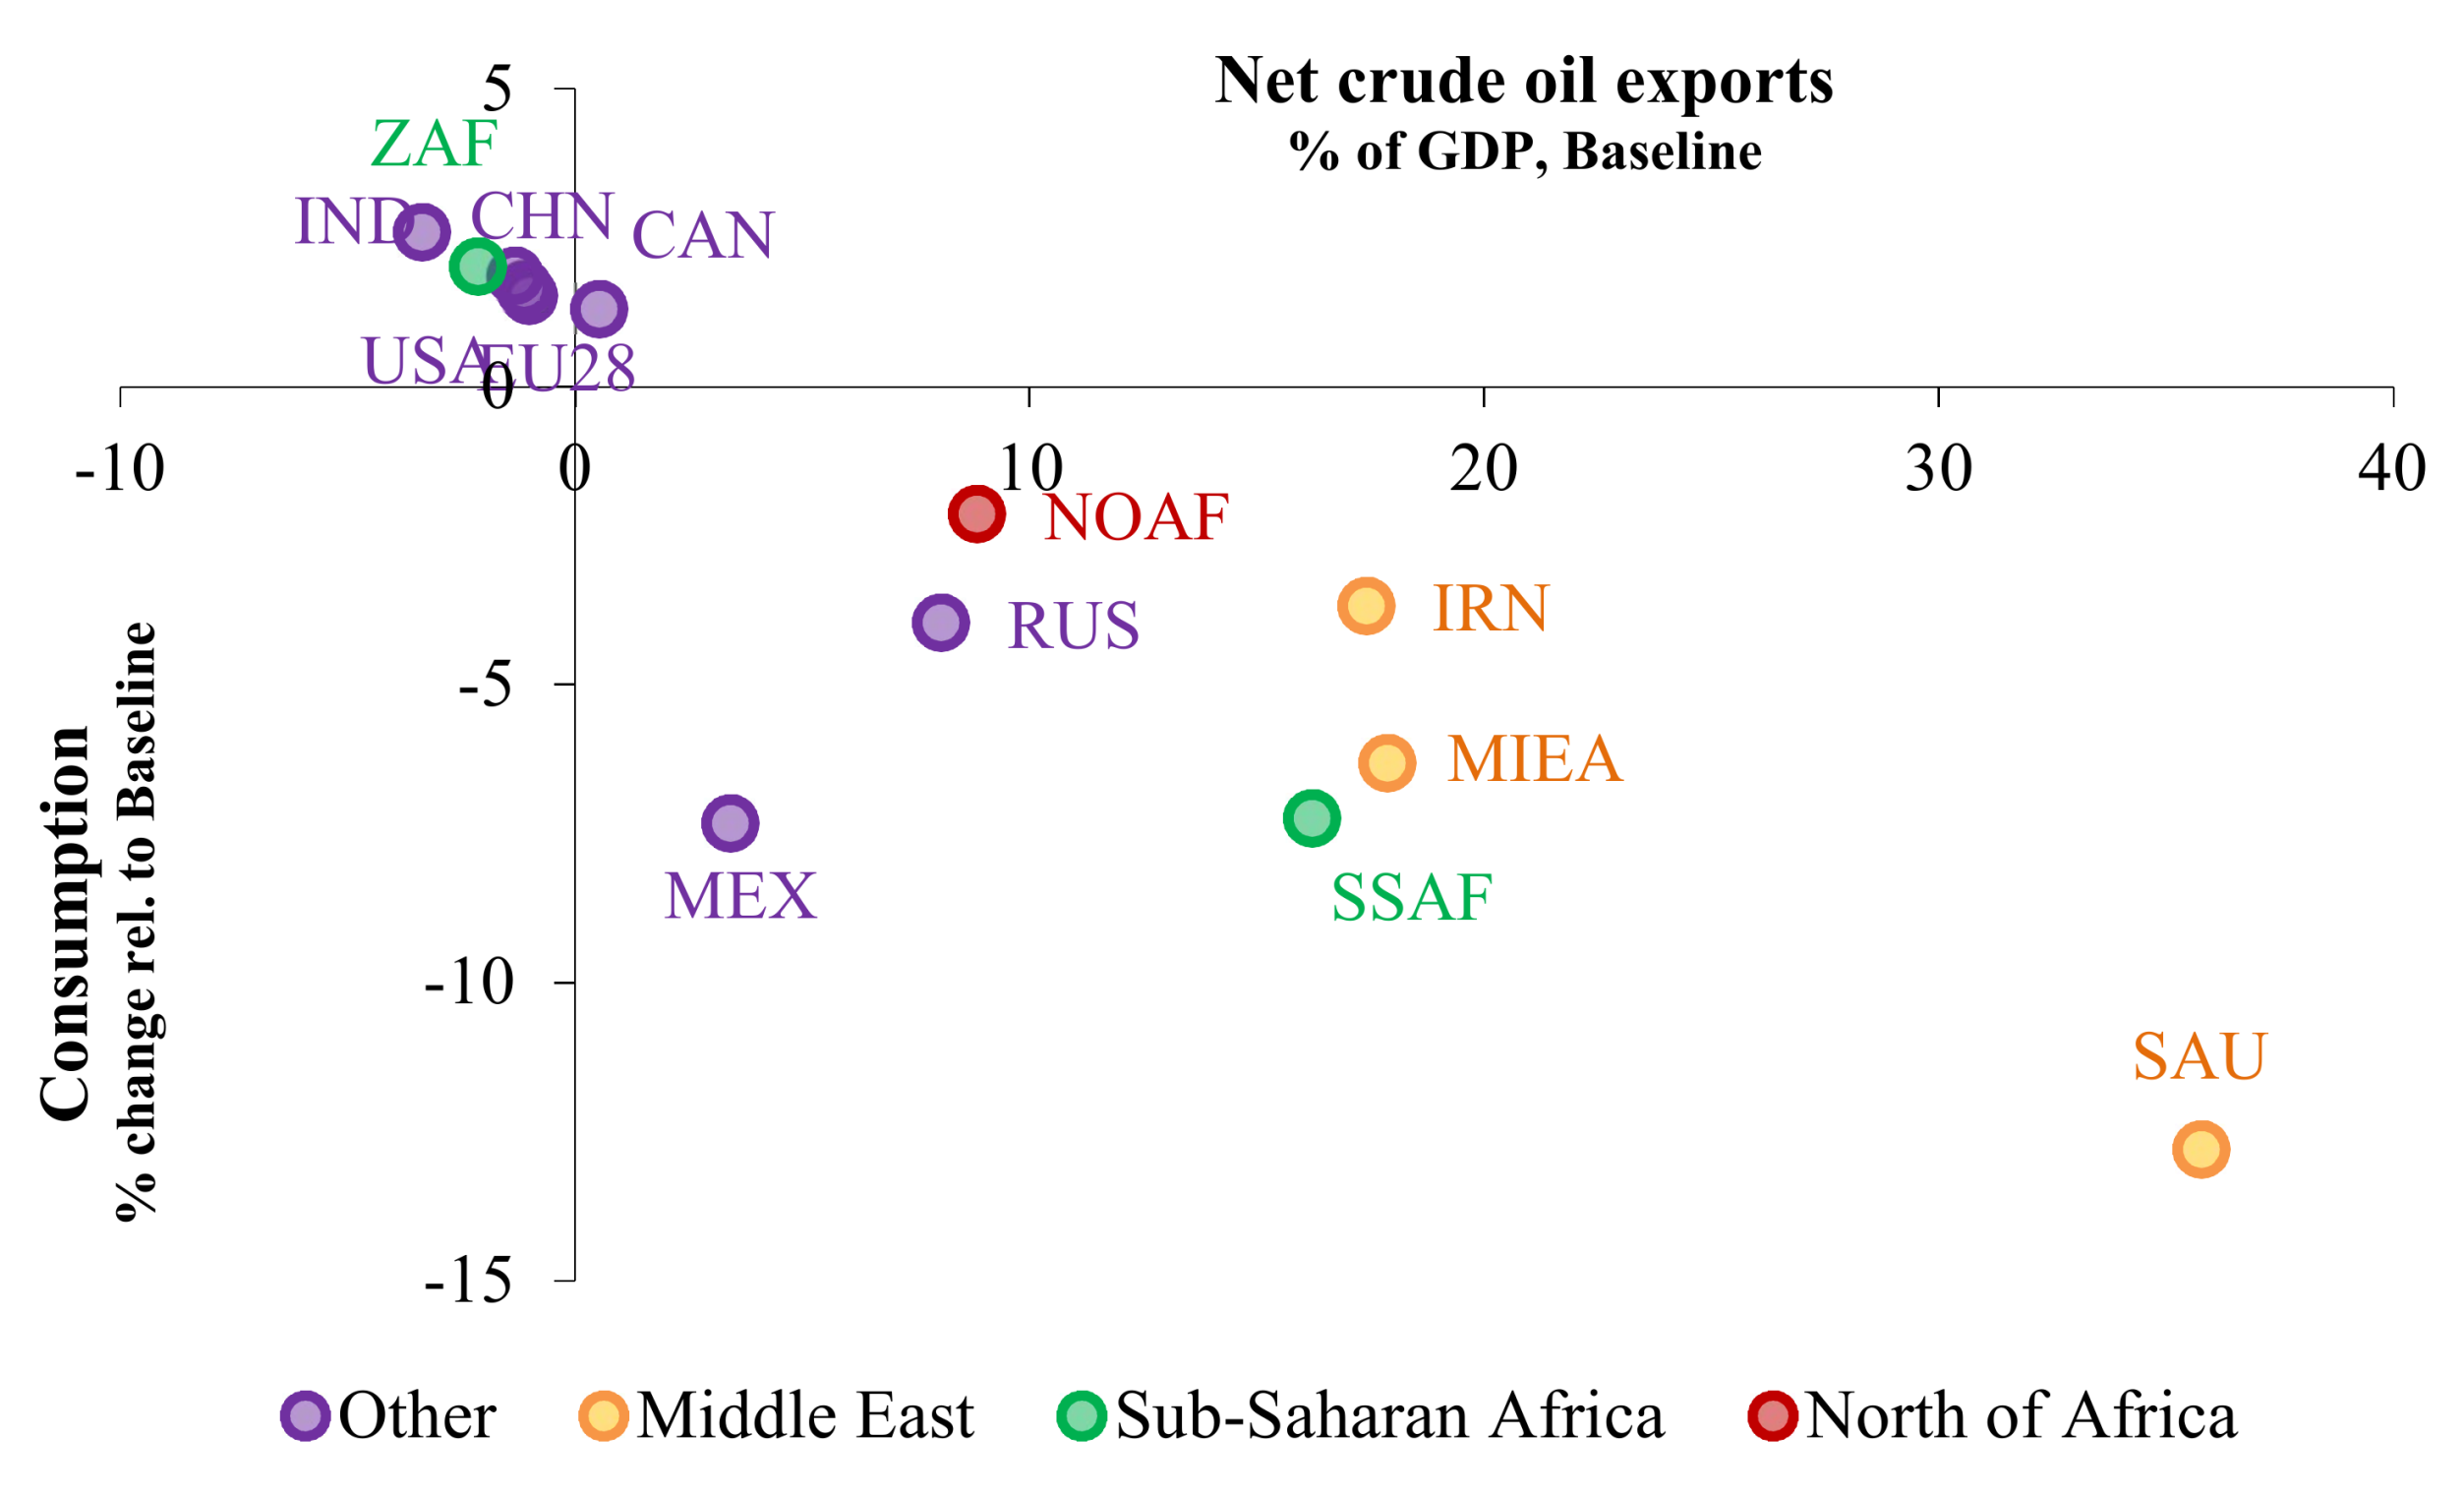
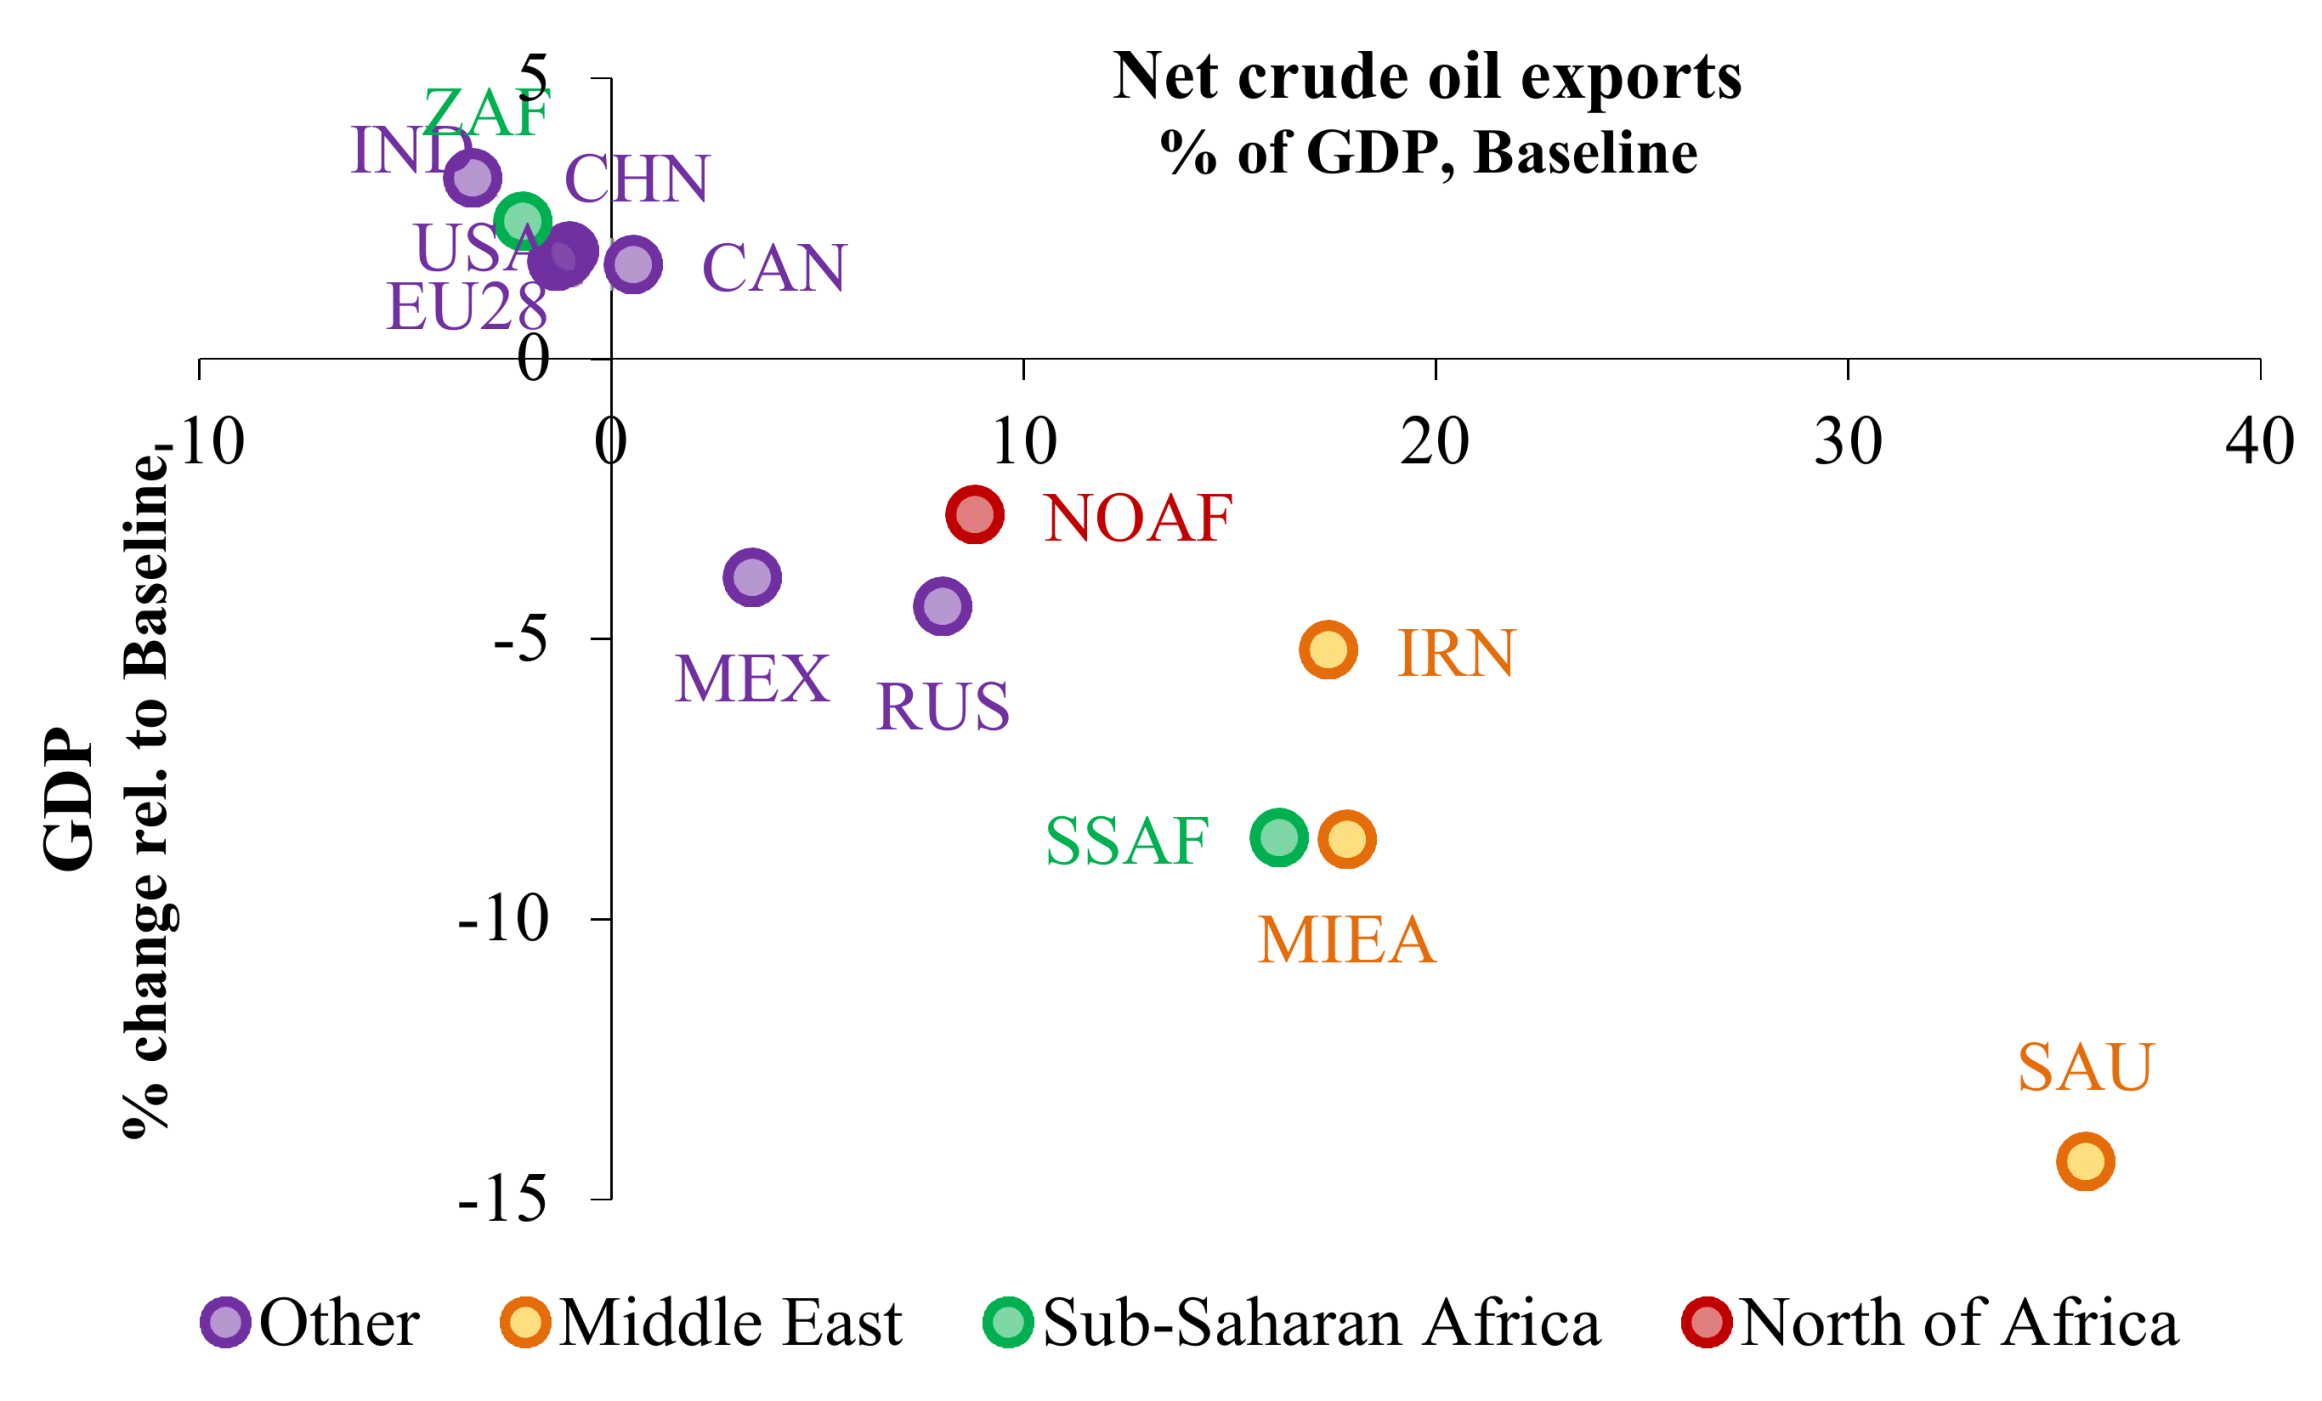
3.2. Simulation Results: The Key Role of Oil Trade Dependence
4. Discussion
Acknowledgments
Author Contributions
Conflicts of Interest
Disclaimer
Appendix A


References
- US Energy Information Administration. Available online: http://www.eia.gov/dnav/pet/pet_pri_spt_s1_d.htm (accessed on 23 March 2016).
- Jacks, D.S. From Boom to Bust: A Typology of Real Commodity Prices in the Long Run; NBER Working Paper, No. w18874; National Bureau of Economic Research: Cambridge, MA, USA, March 2013.
- Arezki, R.; Blanchard, O. Seven Questions about the Recent Oil Price Slump (22/12/2014). IMF Blog Post. Available online: https://blogs.imf.org/2014/12/22/seven-questions-about-the-recent-oil-price-slump/ (accessed on 18 March 2016).
- Baffes, J.; Kose, M.A.; Ohnsorge, F.; Stocker, M. The Great Plunge in Oil Prices: Causes, Consequences, and Policy Response; CAMA Working Paper 23/2015; The World Bank Group: Washington, DC, USA, June 2015. [Google Scholar]
- Baumeister, C.; Kilian, L. Understanding the Decline in the Price of Oil since June 2014. J. Assoc. Environ. Resour. Econ. 2016, 3, 3131–3158. [Google Scholar] [CrossRef]
- Husain, A.M.; Arezki, R.; Breuer, P.; Haksar, V.; Helbling, T.; Medas, P.A.; Sommer, M. Global Implications of Lower Oil Prices; IMF Staff Discussion Note. SDN/15/15; International Monetary Fund: Washington, DC, USA, 2015. [Google Scholar]
- Pflüger, F. Oil Price Decline: No Room For Conspirators (26/01/2015). Energy Post. 2015. Available online: http://energypost.eu/oil-price-decline-room-conspirators/ (accessed on 24 March 2016).
- Kleinberg, R.L.; Paltsev, S.; Ebinger, C.K.E.; Hobbs, D.A.; Boersma, T. Tight Oil Market Dynamics: Benchmarks, Breakeven Points, and Inelasticities. Energy Econ. 2017, 70, 70–83. [Google Scholar] [CrossRef]
- IEA. Oil Market Report for March 2016; IEA: Paris, France, 2016. [Google Scholar]
- DOE. (US Department of Energy). Fact #918: March 28, 2016 Global Plug-in Light Vehicle Sales Increased by About 80% in 2015. 2016. Available online: https://www.energy.gov/eere/vehicles/fact-918-march-28-2016-global-plug-light-vehicle-sales-increased-about-80-2015 (accessed on 6 April 2016).
- OICA (Organisation Internationale des Constructeurs d’Automobiles). 2005–2015 Sales Statistics. 2016. Available online: http://www.oica.net/category/sales-statistics/ (accessed on 6 April 2016).
- BP. Outlook to 2035. In BP Energy Outlook, 2016 ed.; British Petroleum: London, UK, 2016. [Google Scholar]
- Kitous, A.; Keramidas, K.; Vandyck, T.; Saveyn, B.; Van Dingenen, R.; Spadaro, J.; Holland, M. Global Energy and Climate Outlook 2017: How Climate Policies Improve Air Quality (No. JRC107944); Joint Research Centre (Seville site): Sevilla, Spain, 2017. [Google Scholar]
- Levi, M. Five Things I Learned About the Oil Price Crash (24/02/2015). Energy, Security and Climate Blog. Council on Foreign Relations. 2015. Available online: https://www.cfr.org/blog/five-things-i-learned-about-oil-price-crash#more-5576 (accessed on 24 March 2016).
- EIA. Short-Term Energy Outlook (STEO). March 2016; U.S. Energy Information Administration: Washington, DC, USA, 2016.
- IEA. World Energy Outlook 2015; International Energy Agency: Paris, France, 2015. [Google Scholar]
- EIA. The Annual Energy Outlook 2015 with Projections to 2040; US Energy Information Administration: Washington, DC, USA, 2015.
- Knoema. Marginal Production Cost by Country 2014. 2016. Available online: http://knoema.com/vyronoe/cost-of-oil-production-by-country/ (accessed on 23 March 2016).
- BP. BP Statistical Report 2015. 2015. Available online: https://www.bp.com/en/global/corporate/energy-economics/statistical-review-of-world-energy.html (accessed on 23 March 2016).
- Enerdata. Global Energy Database. 2016. Available online: http://globaldata.enerdata.net/database/ (accessed on 23 March 2016).
- UN. United Nations Population Division. World Population Prospects: The 2015 Revision. 2015. Available online: http://esa.un.org/unpd/wpp/Download/Standard/Population/ (accessed on 23 March 2016).
- WB. Worldwide Governance Indicators. 2016. Available online: http://info.worldbank.org/governance/wgi/ (accessed on 23 March 2016).
- UNDP. United Nations Development Program. Human Development Report 2015, Work for Human Development. Table 1. 2015, p. 208. Available online: http://hdr.undp.org/en/content/human-development-report-2015-work-human-development (accessed on 23 March 2016).
- Wikipedia. Available online: http://en.wikipedia.org/wiki/Sovereign_wealth_fund (accessed on 23 March 2016).
- World Bank. World Development Indicators. 2015. Available online: http://databank.worldbank.org/data/reports.aspx?source=world-development-indicators (accessed on 23 March 2016).
- IMF. World Economic Outlook—Adjusting to Lower Commodity Prices. October 2015. Available online: https://www.imf.org/external/pubs/ft/weo/2015/02/weodata/index.aspx (accessed on 23 March 2016).
- International Monetary Fund. Economic Diversification in the GCC: Past, Present, and Future; IMF Staff Discussion Note, SDN/14/12; International Monetary Fund: Washington, DC, USA, December 2014. [Google Scholar]
- IMF. Statement by IMF Deputy Managing Director Min Zhu on Angola (6 April 2016). Available online: http://www.imf.org/external/np/sec/pr/2016/pr16155.htm (accessed on 8 April 2016).
- Vandyck, T.; Keramidas, K.; Saveyn, B.; Kitous, A.; Vrontisi, Z. A global stocktake of the Paris pledges: Implications for energy systems and economy. Glob. Environ. Chang. 2016, 41, 46–63. [Google Scholar] [CrossRef]
- Ciscar, J.C.; Russ, P.; Paroussos, L.; Stroblos, N. Vulnerability of the EU Economy to Oil Shocks: A General equilibrium Analysis with the GEM-E3 Model. In Proceedings of the 13th Annual Conference of the European Association of Environmental and Resource Economics, Budapest, Hungary, 25–28 June 2004. [Google Scholar]
- Maisonnave, H.; Pycroft, J.; Saveyn, B.; Ciscar, M.J. Does climate policy make the EU economy more resilient to oil price rises? A CGE analysis. Energy Policy 2012, 47, 172–179. [Google Scholar] [CrossRef]
- Kitous, A.; Saveyn, B.; Gervais, S.; Wiesenthal, T.; Soria, A. Analysis of the Iran Oil Embargo; JRC Scientific and Technical Reports EUR 25691 EN; Publications Office of the European Union: Luxembourg, 2013. [Google Scholar]
- Berument, M.H.; Ceylan, N.B.; Dogan, N. The impact of oil price shocks on the economic growth of selected MENA countries. Energy J. 2010, 149–176. [Google Scholar] [CrossRef]
- Ghalayini, L. The Interaction between Oil Price and Economic Growth. Middle East. Finance Econ. 2011, 13, 127–141. [Google Scholar]
- Sachs, J.D.; Warner, A.M. Natural Resource Abundance and Economic Growth (No. w5398); National Bureau of Economic Research: Cambridge, MA, USA, 1995. [Google Scholar]
- Sachs, J.D.; Warner, A.M. The curse of natural resources. Eur. Econ. Rev. 2001, 45, 827–838. [Google Scholar] [CrossRef]
- Frankel, J.A. The Natural Resource Curse: A Survey (No. w15836); National Bureau of Economic Research: Cambridge, MA, USA, 2010. [Google Scholar]
- Haber, S.S.; Menaldo, V. Do Natural Resources Fuel Authoritarianism? A Reappraisal of the Resource Curse. Am. Political Sci. Rev. 2011, 105, 1–26. [Google Scholar] [CrossRef]
- Brunnschweiler, C.N. Cursing the blessings? Natural resource abundance, institutions, and economic growth. World Dev. 2008, 36, 399–419. [Google Scholar] [CrossRef]
- Robinson, J.A.; Torvik, R.; Verdier, T. Political foundations of the resource curse. J. Dev. Econ. 2006, 79, 447–468. [Google Scholar] [CrossRef]
- Van der Ploeg, F.; Poelhekke, S. Volatility and the natural resource curse. Oxf. Econ. Pap. 2009, 61, 727–760. [Google Scholar] [CrossRef]
- Collier, P.; Goderis, B. Commodity Prices, Growth, and the Natural Resource Curse: Reconciling a Conundrum. 2008. Available online: https://ssrn.com/abstract=1473716 (accessed on 23 March 2016).[Green Version]
- Blum, M.; Ducoing, C.; McLaughlin, E. A Sustainable Century? Genuine Savings in Developing and Developed Countries, 1900–2000. In National Wealth What Is Missing, Why It Matters; Hamilton, K., Hepburn, C., Eds.; Oxford University Press: Oxford, UK, 2017. [Google Scholar]
- Bazzi, S.; Blattman, C. Economic shocks and conflict: Evidence from commodity prices. Am. Econ. J. Macroecon. 2014, 6, 1–38. [Google Scholar] [CrossRef]
- Brückner, M.; Ciccone, A. International commodity prices, growth and the outbreak of civil war in Sub-Saharan Africa. Econ. J. 2010, 120, 519–534. [Google Scholar] [CrossRef]
- Besley, T.J.; Persson, T. The Incidence of Civil War: Theory and Evidence (No. w14585); National Bureau of Economic Research: Cambridge, MA, USA, 2008. [Google Scholar]
- Collier, P.; Hoeffler, A.; Söderbom, M. On the duration of civil war. J. Peace Res. 2004, 41, 253–273. [Google Scholar] [CrossRef]
- Collier, P.; Hoeffler, A. On economic causes of civil war. Oxf. Econ. Pap. 1998, 50, 563–573. [Google Scholar] [CrossRef]
- Collier, P.; Venables, A.J. Natural Resources and State Fragility; Robert Schuman Centre for Advanced Studies (RSCAS) working paper; RSCAS: Firenze, Italy, April 2010. [Google Scholar]
- Céspedes, L.F.; Velasco, A. Macroeconomic performance during commodity price booms and busts. IMF Econ. Rev. 2012, 60, 570–599. [Google Scholar] [CrossRef]
- Sala-i-Martin, X.; Subramanian, A. Addressing the natural resource curse: An illustration from Nigeria. In Economic Policy Options for a Prosperous Nigeria; Palgrave Macmillan: London, UK, 2008; pp. 61–92. [Google Scholar]
- Deaton, A. Commodity prices and growth in Africa. J. Econ. Perspect. 1999, 13, 23–40. [Google Scholar] [CrossRef]
- Kitous, A.; Saveyn, B.; Keramidas, K.; Vandyck, T.; Santos, R.L.; Wojtowicz, K. Impact of Low Oil Prices on Oil Exporting Countries; JRC Science Policy Report; Publications Office of the European Union: Luxembourg, 2016. [Google Scholar]
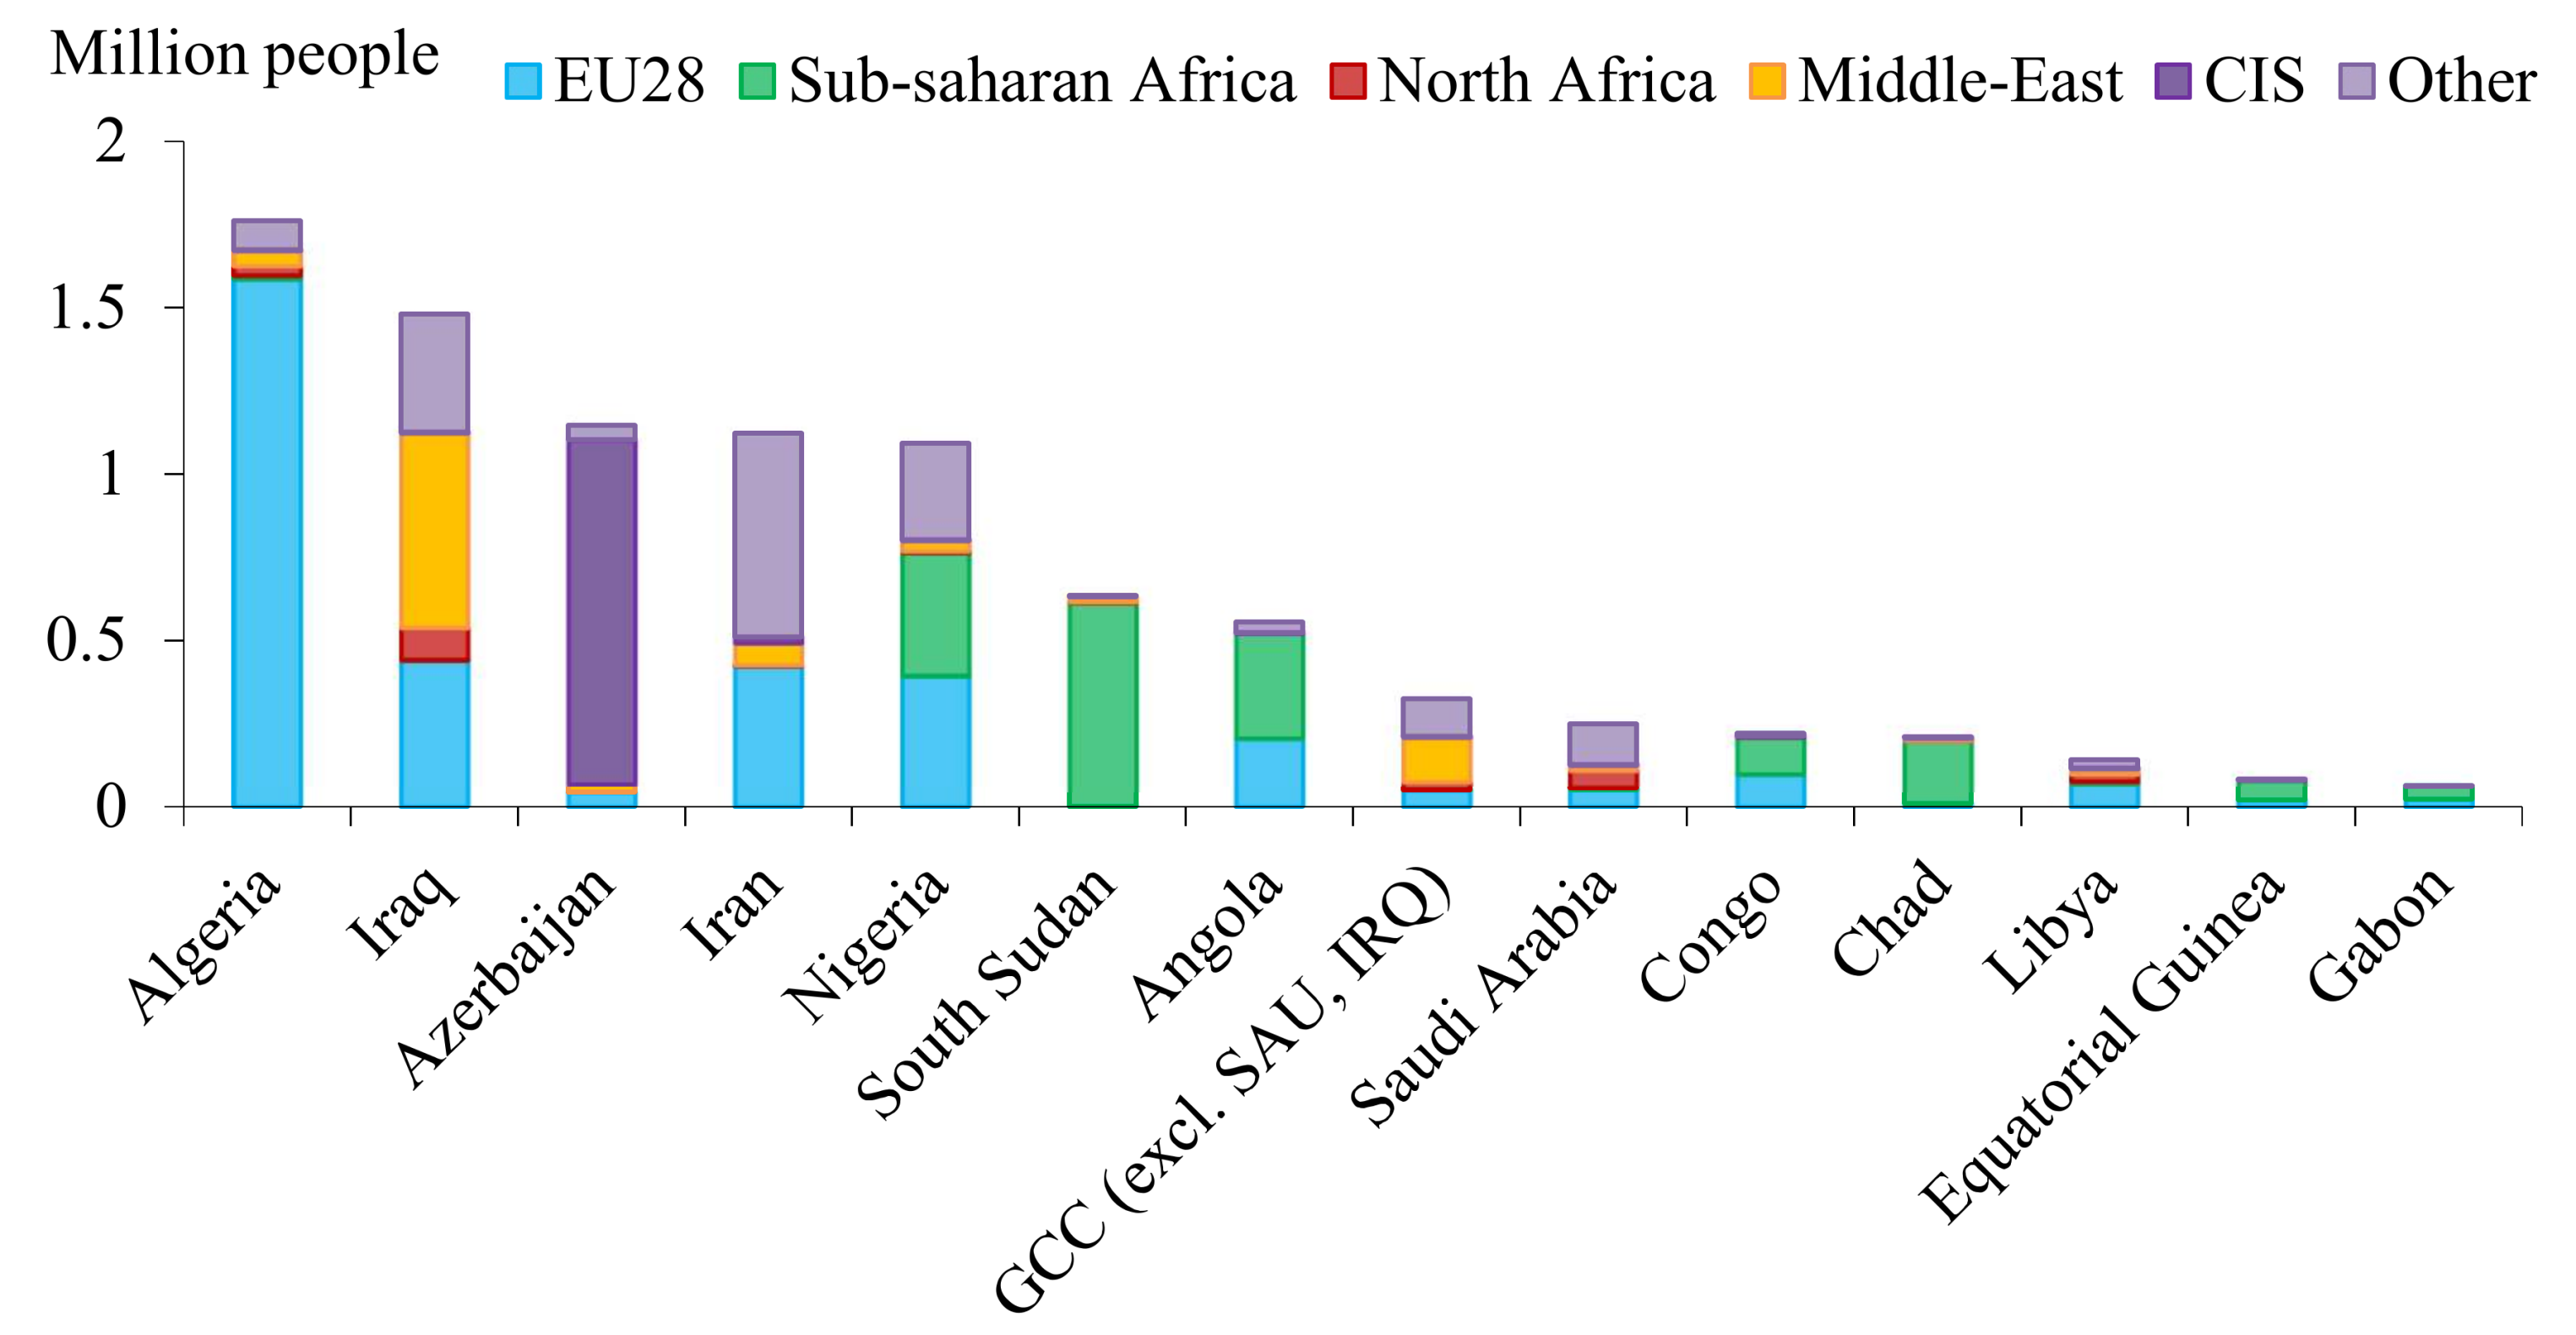
- UN. United Nations Population Division. Trends in International Migrant Stock: Migrants by Destination and Origin; United Nations: New York, NY, USA, 2015. [Google Scholar]


| Country | Code | Region | % of Net Exports | % of Production | Reserves (109 Barrels) | Population (Million) |
|---|---|---|---|---|---|---|
| Saudi Arabia | SAU | Middle-East | 19.0% | 13.0% | 267 | 31 |
| United Arab Emirates | ARE | Middle-East | 6.5% | 4.2% | 98 | 9 |
| Kuwait | KWT | Middle-East | 6.0% | 3.5% | 102 | 4 |
| Iraq | IRQ | Middle-East | 5.7% | 3.7% | 150 | 35 |
| Qatar | QAT | Middle-East | 3.8% | 2.2% | 26 | 2 |
| Iran | IRN | Middle-East | 3.6% | 4.1% | 158 | 78 |
| Oman | OMN | Middle-East | 1.9% | 1.1% | 5 | 4 |
| Algeria | DZA | North Africa | 2.6% | 1.7% | 12 | 39 |
| Libya | LBY | North Africa | 0.5% | 0.6% | 48 | 6 |
| Nigeria | NGA | Sub-Saharan Africa | 4.9% | 2.7% | 37 | 177 |
| Angola | AGO | Sub-Saharan Africa | 3.6% | 1.9% | 13 | 24 |
| Equatorial Guinea | GNQ | Sub-Saharan Africa | 0.6% | 0.3% | 1 | 1 |
| Republic of Congo | COG | Sub-Saharan Africa | 0.6% | 0.3% | 2 | 5 |
| Gabon | GAB | Sub-Saharan Africa | 0.5% | 0.3% | 2 | 2 |
| Sudan * | SDN | Sub-Saharan Africa | 0.3% | 0.2% | 5 | 51 |
| Chad | TCD | Sub-Saharan Africa | 0.2% | 0.1% | 2 | 14 |
| Russia | RUS | Other: CIS | 17.4% | 12.2% | 103 | 143 |
| Kazakhstan | KAZ | Other: CIS | 3.3% | 1.9% | 30 | 17 |
| Azerbaijan | AZE | Other: CIS | 1.7% | 1.0% | 7 | 10 |
| Turkmenistan ** | TKM | Other: CIS | 0.2% | 0.3% | 1 | 5 |
| Brunei ** | BRN | Other: Asia | 0.3% | 0.1% | 1 | 0.4 |
| Venezuela | VEN | Other: Americas | 4.3% | 3.1% | 298 | 31 |
| Canada | CAN | Other: Americas | 4.4% | 4.8% | 173 | 36 |
| Mexico | MEX | Other: Americas | 1.9% | 3.1% | 11 | 125 |
| Colombia ** | COL | Other: Americas | 1.6% | 1.1% | 2 | 48 |
| Ecuador ** | ECU | Other: Americas | 0.7% | 0.6% | 8 | 16 |
| Trinidad & Tobago ** | TTO | Other: Americas | 0.2% | 0.1% | 1 | 1 |
| Norway | NOR | Other: Europe | 3.8% | 2.1% | 7 | 5 |
| Country | Code | Region | Value (Billion USD) | Per Capita (1000 USD) | % GDP | % Government Revenue |
|---|---|---|---|---|---|---|
| United Arab Emirates | ARE | Middle-East | 1214 | 134 | 304% | 805% |
| Saudi Arabia | SAU | Middle-East | 792 | 26 | 106% | 284% |
| Kuwait | KWT | Middle-East | 592 | 158 | 362% | 527% |
| Qatar | QAT | Middle-East | 256 | 118 | 122% | 257% |
| Iran | IRN | Middle-East | 62 | 1 | 15% | 100% |
| Oman | OMN | Middle-East | 40 | 9 | 49% | 103% |
| Iraq | IRQ | Middle-East | 1 | 0 | 0% | 1% |
| Libya | LBY | North Africa | 66 | 11 | 160% | 392% |
| Algeria | DZA | North Africa | 50 | 1 | 23% | 70% |
| Angola | AGO | Sub-Saharan Africa | 5 | 0 | 4% | 10% |
| Nigeria | NGA | Sub-Saharan Africa | 1 | 0 | 0% | 2% |
| Russia | RUS | Other: CIS | 139 | 1 | 7% | 20% |
| Kazakhstan | KAZ | Other: CIS | 79 | 5 | 36% | 149% |
| Azerbaijan | AZE | Other: CIS | 37 | 4 | 50% | 128% |
| Canada | CAN | Other: Americas | 18 | 0 | 1% | 3% |
| Mexico | MEX | Other: Americas | 6 | 0 | 0% | 2% |
| Venezuela | VEN | Other: Americas | 1 | 0 | 0% | 1% |
| Norway | NOR | Other: Europe | 848 | 165 | 170% | 316% |
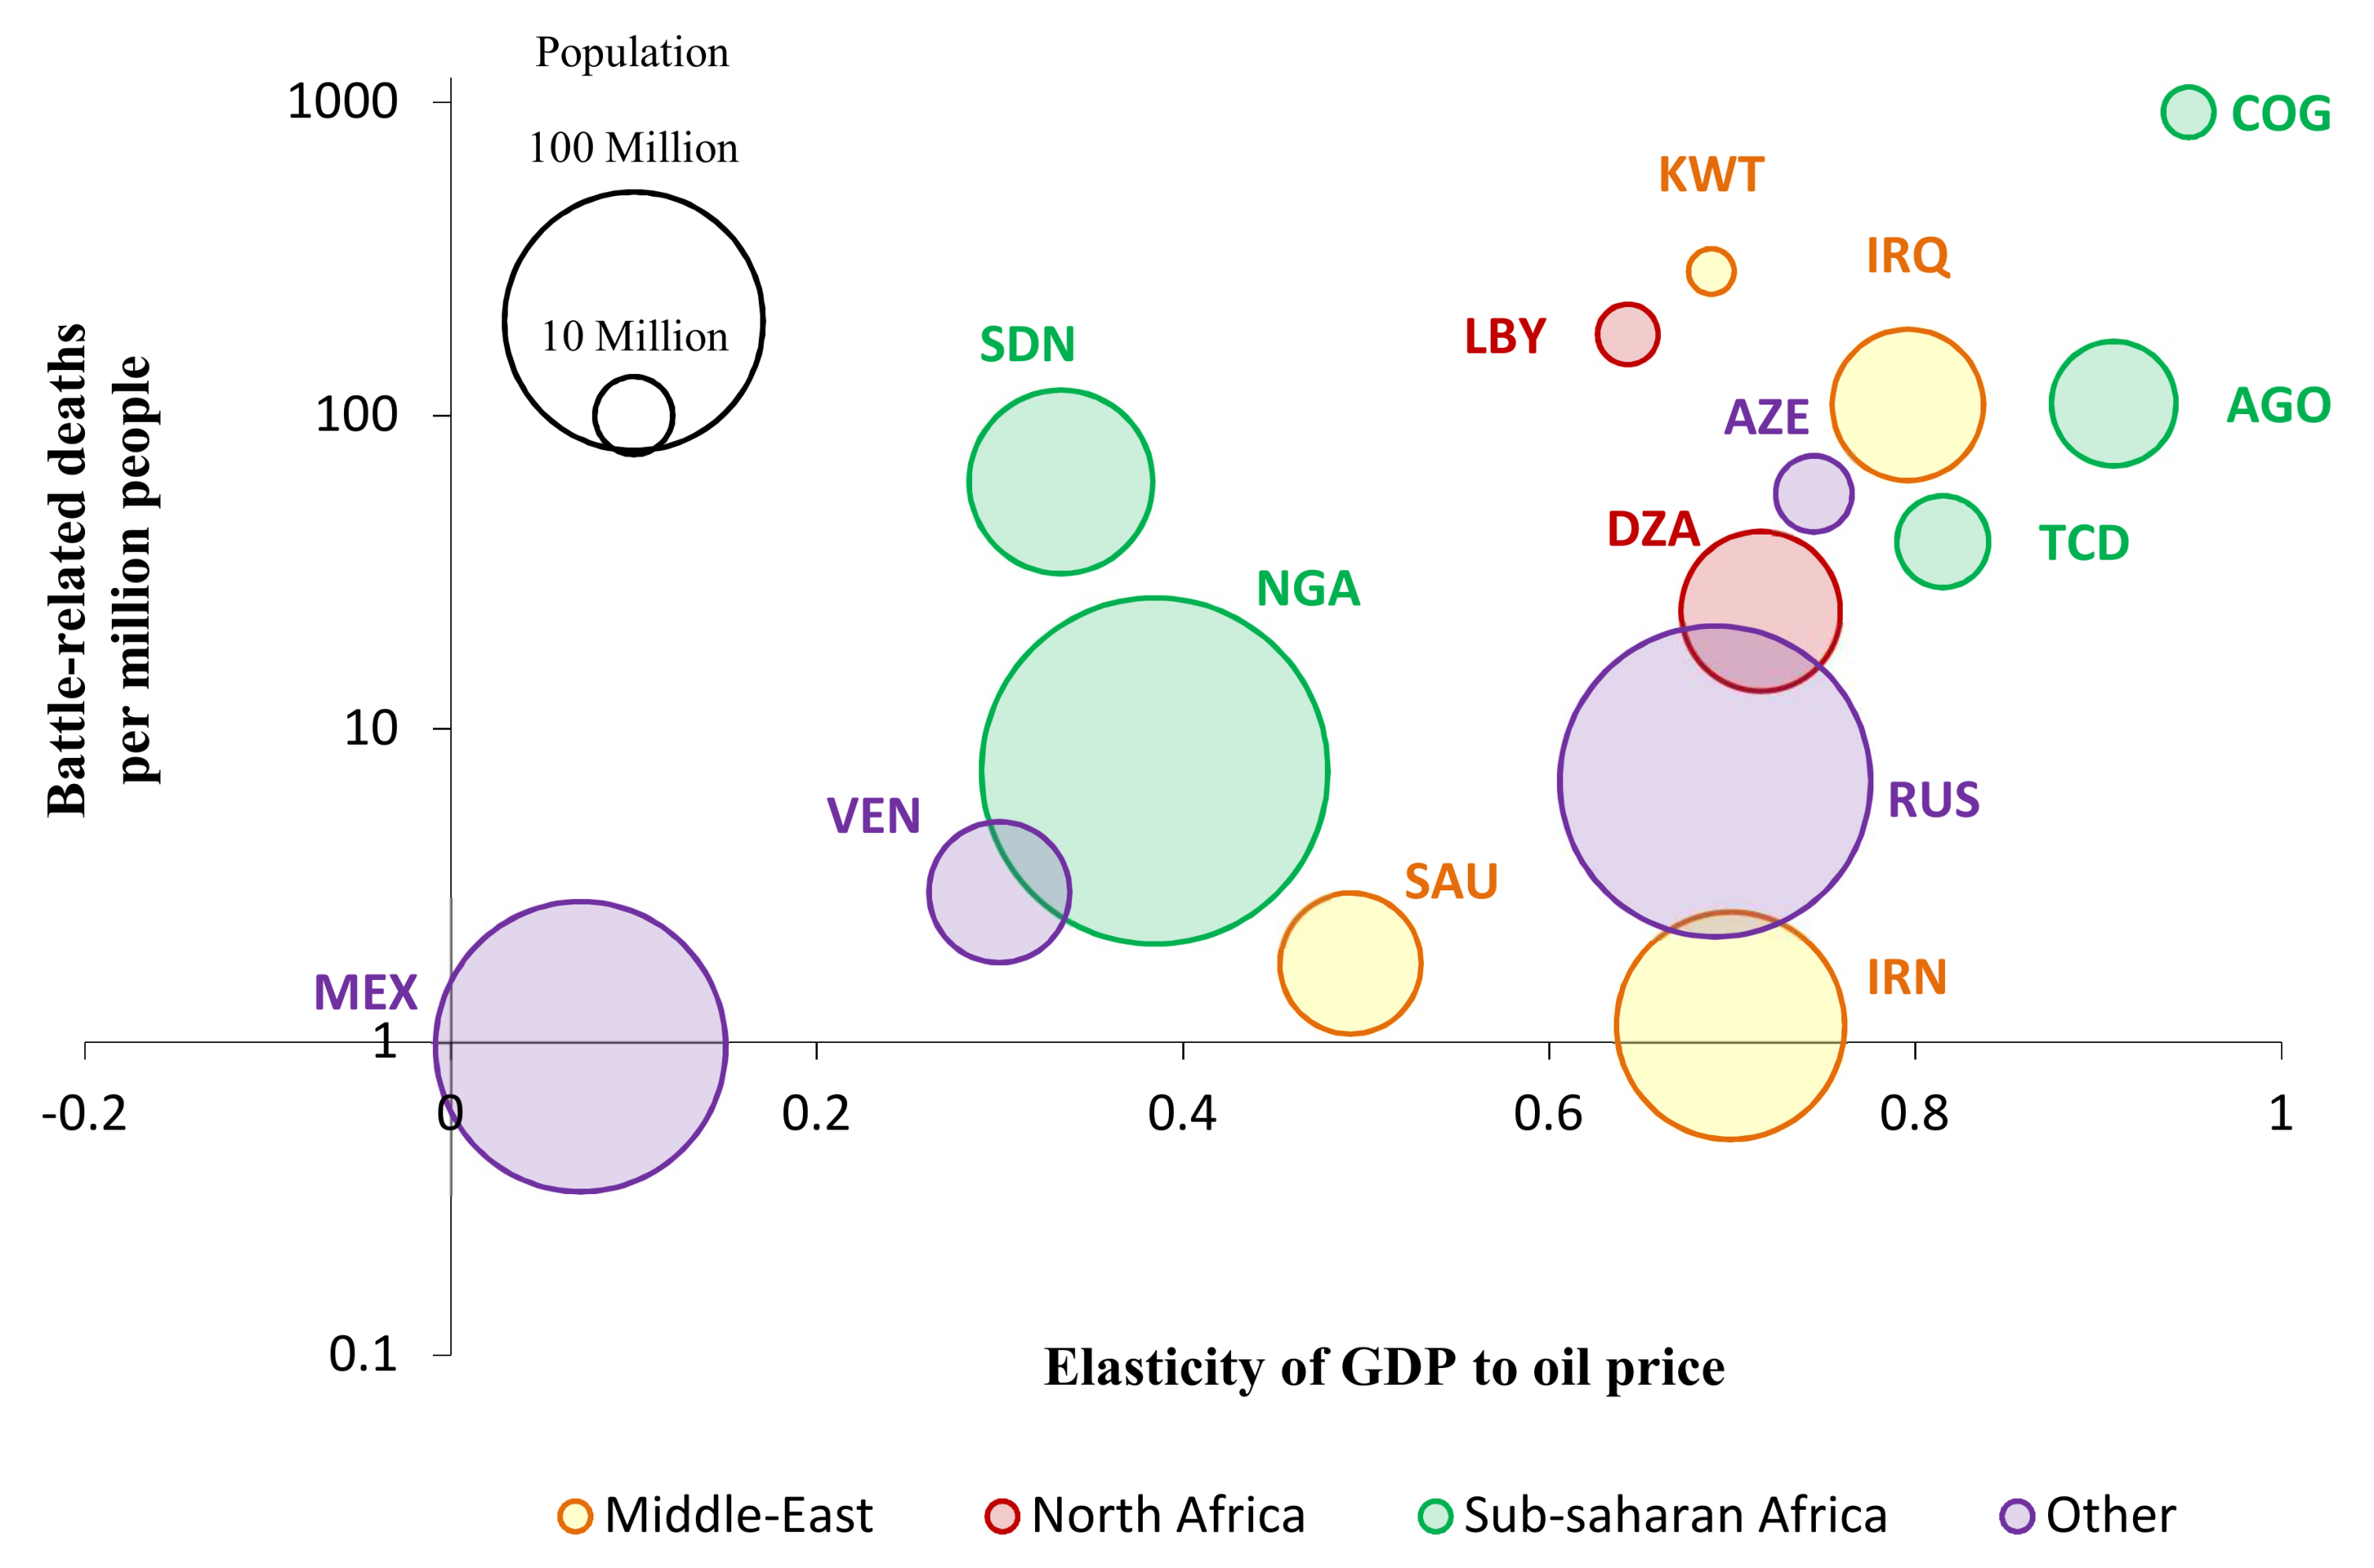
| Country | ISO3 Code | Region | GDP Per Capita vs. Oil Price | Gvt Revenue Per Capita vs. Oil Price | ||
|---|---|---|---|---|---|---|
| Elast. | R2 | Elast. | R2 | |||
| Saudi Arabia | SAU | Middle-East | 0.5 | 97% | 0.9 | 98% |
| United Arab Emirates | ARE | Middle-East | 0.2 | 84% | 0.3 | 45% |
| Kuwait | KWT | Middle-East | 0.7 | 96% | 0.6 | 96% |
| Iraq | IRQ | Middle-East | 0.8 | 98% | 1.1 | 98% |
| Qatar | QAT | Middle-East | 0.4 | 99% | 0.6 | 98% |
| Iran | IRN | Middle-East | 0.7 | 93% | 0.8 | 91% |
| Oman | OMN | Middle-East | 0.5 | 98% | 0.6 | 98% |
| Algeria | DZA | North Africa | 0.7 | 96% | 0.9 | 99% |
| Libya | LBY | North Africa | 0.6 | 68% | 1 | 94% |
| Nigeria | NGA | Sub-Saharan Africa | 0.4 | 98% | 0.8 | 85% |
| Angola | AGO | Sub-Saharan Africa | 0.9 | 97% | 1.4 | 99% |
| Equatorial Guinea | GNQ | Sub-Saharan Africa | 0.7 | 94% | 1.1 | 92% |
| Republic of Congo | COG | Sub-Saharan Africa | 0.9 | 97% | 1.2 | 99% |
| Gabon | GAB | Sub-Saharan Africa | 0.7 | 93% | 0.5 | 93% |
| Sudan | SDN | Sub-Saharan Africa | 0.3 | 99% | 1 | 97% |
| Chad | TCD | Sub-Saharan Africa | 0.8 | 92% | 1.4 | 96% |
| Russia | RUS | Other: CIS | 0.7 | 96% | 0.8 | 96% |
| Kazakhstan | KAZ | Other: CIS | 0.8 | 95% | 1 | 96% |
| Azerbaijan | AZE | Other: CIS | 0.7 | 96% | 0.9 | 96% |
| Venezuela | VEN | Other: Americas | 0.3 | 91% | 0.4 | 93% |
| Canada | CAN | Other: Americas | 0.4 | 99% | 0.3 | 98% |
| Mexico | MEX | Other: Americas | 0.1 | 88% | 0.2 | 95% |
| Norway | NOR | Other: Europe | 0.3 | 98% | 0.3 | 98% |
| Average of exporters | 0.5 | 98% | 0.5 | 99% | ||
| Consumption | |||
|---|---|---|---|
| Change with Baseline, 2015 | % | % | |
| World | 0.96 | Mexico (MEX) | −7.33 |
| European Union (EU28) | 1.52 | Argentina | 0.95 |
| USA | 1.65 | North Africa (NOAF) | −2.14 |
| Russia (RUS) | −3.97 | New Zealand | 1.82 |
| Canada (CAN) | 1.30 | Saudi Arabia (SAU) | −12.81 |
| Japan | 1.36 | Iran (IRN) | −3.68 |
| Australia | 1.33 | South Africa (ZAF) | 2.02 |
| China (CHN) | 1.85 | Rest of Middle East (MIEA) | −6.32 |
| India (IND) | 2.59 | Sub-Saharan Africa (SSAF) | −7.25 |
| Indonesia | 2.88 | Rest of Central and S. America | 0.87 |
| Brazil | 2.05 | Central Asia and Caucasus | −5.88 |
| Republic of Korea | 2.61 | Southeast Asia | 2.58 |
| Rest of Europe and Turkey | 0.57 | Rest of Asia and Pacific | 3.02 |
| Value of GDP | |||
|---|---|---|---|
| Change with Baseline, 2015 | % | % | |
| World | 1.11 | Mexico (MEX) | −3.92 |
| European Union (EU28) | 1.92 | Argentina | 1.16 |
| USA | 1.79 | North Africa (NOAF) | −2.79 |
| Russia (RUS) | −4.43 | New Zealand | 2.42 |
| Canada (CAN) | 1.67 | Saudi Arabia (SAU) | −14.34 |
| Japan | 1.56 | Iran (IRN) | −5.21 |
| Australia | 1.60 | South Africa | 2.45 |
| China (CHN) | 1.73 | Rest of Middle East (MIEA) | −8.58 |
| India (IND) | 3.21 | Sub-Saharan Africa (SSAF) | −8.56 |
| Indonesia | 3.24 | Rest of Central and S. America | 0.90 |
| Brazil | 2.65 | Central Asia and Caucasus | −15.20 |
| Republic of Korea | 3.25 | Southeast Asia | 2.95 |
| Rest of Europe and Turkey | 0.48 | Rest of Asia and Pacific | 3.32 |
© 2018 by the authors. Licensee MDPI, Basel, Switzerland. This article is an open access article distributed under the terms and conditions of the Creative Commons Attribution (CC BY) license (http://creativecommons.org/licenses/by/4.0/).
Share and Cite
Vandyck, T.; Kitous, A.; Saveyn, B.; Keramidas, K.; Los Santos, L.R.; Wojtowicz, K. Economic Exposure to Oil Price Shocks and the Fragility of Oil-Exporting Countries. Energies 2018, 11, 827. https://0-doi-org.brum.beds.ac.uk/10.3390/en11040827
Vandyck T, Kitous A, Saveyn B, Keramidas K, Los Santos LR, Wojtowicz K. Economic Exposure to Oil Price Shocks and the Fragility of Oil-Exporting Countries. Energies. 2018; 11(4):827. https://0-doi-org.brum.beds.ac.uk/10.3390/en11040827
Chicago/Turabian StyleVandyck, Toon, Alban Kitous, Bert Saveyn, Kimon Keramidas, Luis Rey Los Santos, and Krzysztof Wojtowicz. 2018. "Economic Exposure to Oil Price Shocks and the Fragility of Oil-Exporting Countries" Energies 11, no. 4: 827. https://0-doi-org.brum.beds.ac.uk/10.3390/en11040827