Transport Demand Management Policy Integration in Chinese Cities: A Proposed Analysis of Its Effects

1
Faculty of Technology, Policy and Management, Delft University of Technology, Jaffalaan 5, 2628BX Delft, The Netherlands
2
School of International Relations & Public Affairs, Fudan University, Shanghai 200433, China
*
Author to whom correspondence should be addressed.
Energies 2018, 11(5), 1126; https://0-doi-org.brum.beds.ac.uk/10.3390/en11051126
Submission received: 30 March 2018
/
Revised: 21 April 2018
/
Accepted: 1 May 2018
/
Published: 2 May 2018
(This article belongs to the Special Issue The Governance of Sustainable Cities and Innovative Transport)
Abstract
:Transport demand management (TDM) measures are widely regarded as essential tools to deal with traffic issues. Their effectiveness has been under scrutiny. Packaging of TDM measures has recently received much attention from researchers and governments because it can achieve more complex policy goals and resolve the negative effects of single TDM measures. Many studies have examined the concept of policy packaging, the ideal packaging process, and potential barriers at the theoretical level. However, the way TDM packaging as a concept works in a real-world context has received little attention. Additionally, there is little methodology to analyse its characteristics from a dynamic and historical perspective. Therefore, this study provides a methodology for analysing TDM packaging in four dimensions (i.e., density, classification, interaction, and time). These dimensions respectively reveal how many and what kind of TDM measures have been implemented, how they interact in a package, and how these characteristics change over time. We examine this methodology through comparative case studies based on policy document analysis in two Chinese cities, Dalian and Shenzhen, both of which adopt a large number of TDM measures. The results show that this methodology successfully reveals the characteristics of case cities: both tend to put more TDM measures into the transport policy package to deal with traffic issues, but the package in Shenzhen is more integrative than that in Dalian. We also find that with the integration of packaging increasing, transport systems are becoming more sustainable, and Shenzhen performs better in this regard than Dalian. This methodology can be used to analyse policy packaging in broader areas and to examine its influence on transport systems in more case studies in future research.
1. Introduction
Modern societies are struggling with the effects of growing urban mobility, in terms of sustainability and congestion [1]. Governments throughout the world have applied a wide variety of policy measures to improve transport systems’ performances, both in terms of their internal functioning, as well as their negative externalities. As transport-related policy problems are regarded as ‘messy’ or ‘wicked’ [2], inherent difficulties exist in defining the goals and problems and finding adequate measures; the variety of perspectives to a broad set of closely interrelated problems challenges the effectiveness of classic policy development. This complexity of transport systems makes it impossible for policy-makers to fully grasp the effectiveness of each measure or intervention in detail.
A possible way forward to this challenge is to have a more integrated policy perspective [3]. As Banisterunderlines the pluralism of problems, a pluralism of coordinated solutions could be an answer, oftentimes combined with the inclusion of stakeholders that can represent the various perspectives on mobility processes [4]. Yigitcanlar and Teriman further stress the need for integrated planning and decision-making for sustainable urban development [5].
Since the 1970s, governments have aimed to facilitate the growing need for transport. However, it has become clear that keeping pace with the growing demand by supplying more roads to meet increasing travellers’ demands is self-defying: more roads mean more congestion [6,7]. From this point of view, TDM is regarded as a new focus to deal with these problems to achieve equilibrium between supply and demand. There are many TDM measures successful in cities around the world. For example, a congestion fee in Sweden which reduced 20% traffic entering the core and improved the overall accessibility, and individualized travel planning which increased public transport use, and bicycling and walking in Japan, UK, and the US [8].
Although many TDM measures are usually regarded as effective measures on changing travel behaviour and promoting the effectiveness and accessibility of transport systems in principle, individual TDM policies have been proved less effective and may cause unexpected negative side effects after implementation. For example, the policy of car restrictions based on tail numbers in Beijing offered some incentives to households to purchase more cars with distinctive tail numbers [9]. Moreover, it is also accepted that only TDM policies without those policies from supply sides, and even other sectors, cannot solve traffic-related problems, like congestion and pollution.
With the wide set of possible TDM measures and the need for integrated policy-making, a more integrated approach to transport policy making could provide a way forward. Policy packing (or policy mix, or policy portfolio) could provide such an approach. Researchers and practitioners are currently examining concepts of policy packaging, the ideal packaging processes, and potential barriers at the theoretical level [10,11,12]. However, these studies usually explore the components and factors of policy packaging only in principle or seek the best packaging from a static combination of several policies. There are few studies investigating the dynamic process of policy packaging in practical transport management. Additionally, there is limited methodology for analysing its characteristics in real-world applications, comparing different policy packages, and assessing its outcomes from a dynamic perspective.
Therefore, this study aims to design a methodology for analysing TDM packaging in the real world and to explore the impact of TDM packaging on the development of sustainable transportation, by using that methodology. The effectiveness of this methodology is examined in two Chinese cities: Dalian and Shenzhen; both cities are famous for public-transport-oriented development by packaging various TDM measures in recent decades; however, the bus sharing rate, one important indicator of public transport performance, shows Shenzhen passed Dalian in 2008 and has kept growing fast since then [13,14,15,16].
This article is structured as follows: Section 2 establishes the value of policy packaging in a TDM context and the methodological gap for empirical analysis of policy packaging; Section 3 describes the proposed methodology for analysing TDM packaging and details the data sources and information of two case cities; Section 4, by piloting this methodology in Dalian and Shenzhen, illustrates the characteristics of TDM packaging and relationships between their packaging and transport systems’ performances; Section 5 answers the research questions, evaluates this methodology, and provide prospects for future study.
2. Literature Review
2.1. TDM
The concept of TDM, first developed in the United States in the 1970s, has become broad and rather blurred as it is now widely used and modified around the world by a set of professionals specializing in different disciplines with their own background knowledge. For example, engineers view transport demand management as traffic flow control and technological challenges [17], economists regard TDM from the pricing perspective [18], and policy-makers may view it as a regulation within transport systems [19]. The shared perspective is their obvious focus on regulating the demand for mobility, rather that the supply, with large grey areas, for example, in demand-regulating supply, like that of public transport services.
As there is a wide variety of TDM measures in transport management, a need exists for further categorization. The literature provides several. One important categorization is based on transport modes which one TDM measure targets and deals with, including walking, cycling, public transport, private cars and taxis, etc. [20]. TDM measures are also distinguished by different approaches to changing travelling behaviour [21,22]. TDM measures can usually be classified into five categories of focus: facility measures (which change transport infrastructures to increase the attractiveness of alternative travel modes), regulation measures (which directly regulate use), economic measures (raising the costs of private car-use respective to alternative travel modes), information and education measures (which aim at changing people’s beliefs, norms, and values related to car use by providing the latest and sufficient information or knowledge), and service measures (which focus on improving the quality of alternative transport services).
Several studies have examined the effectiveness of various kinds of single TDM measures in ex- and post-ante transport practices [23,24,25,26], where single TDM measures prove disappointing in dealing with broader transport and environmental issues. The reasons manifest in four aspects. Firstly, one individual TDM measure, especially financial measures, are easily rejected or evaded by the public [27]. For example, congestion fees or road fees are often rejected, although these measures have proved effective later [28]. Secondly, one individual TDM measure hardly deals with its possible negative side-effects. For instance, the subsidy for cleaner energy vehicles is aimed at decreasing the greenhouse gas emission per vehicle, but at the same time it can increase the demand for private cars [29]. Thirdly, an individual TDM measure itself generally lacks the power to realise the more ambitious policy goal-behavioural change [30]. Finally, the effectiveness of one individual TDM measure is easily influenced by external factors within, or outside, transport systems [31]. As a consequence, single TDM measures have proven to have limited power in changing urban mobility for the better.
2.2. TDM Packaging
To solve problems of individual policy measures, policy packaging is widely considered by policy-makers and researchers because it could “improve the possibility of policy success” by providing “a wide range of policy options” which can be “implemented in coordination” [27]. Although the normative definition of policy packaging towards a policy mix [32,33], or policy portfolios [11,34], is not a new concept and has been known for many years, the published research on it takes a relatively theoretical perspective, focused around three elements: policy strategy, instruments, and the instrument mix process [33]. Firstly, the literature around policy strategies goes beyond the objectives to be realized through specific policy instruments, and includes a long-term and actor perspective [35]. The instruments are usually classified as two types: the primary measures and ancillary measures [27]. The primary measures are expected to achieve the direct effectiveness of the policy package following expected behaviour, while ancillary measures are related to secondary effects of unexpected behaviour and to ensure packages implementable. Here, packaging follows a normative dynamic process [12], which can be classified into four categories (i.e., replacement, drift, conversion, and laying) according to the consistency between goals and measures [36].
In order to analyse the real-world application of the concept of policy packaging in transport systems, a review is needed of the methodologies used in current studies to evaluate their advantages and disadvantages. Some of them focus on developing a method to design an “ideal” policy package. They usually propose various potential combinations of policy measures as a package and examine their effectiveness and acceptance based on the pre-evaluation from experts, policy-makers, or travellers through interviews and questionnaires [37]. In addition, Taeihagh designs a network-centric method with a computational approach for analysing the interactions of policy measures, to analyse and predict the development of packaging [38]. All these studies focus on the ex-ante analysis of policy packaging. The methods are good at benchmarking and following the criteria of policy packaging in the former literature, but its effectiveness is easily influenced by the representability of the subjective opinions used, and is also restrained by the limited dimensions and factors proposed in the early stage of the research.
In contrast, other studies measure policy packaging, which have been implemented, in different dimensions. A first dimension is the proportion of various measures in one policy package. For example, Filipe and Macário develop an assessment methodology to evaluate the proper percentage of various measures in one package for various Bus Rapid Transit (BRT) development contexts [39]. Additionally, Tønnesen compares two transport policy packages in two Norwegian cities by analysing the different proportion of each kind of measure in the package [31]. A second dimension looks at the categorizations of measures. Davoudi and Sturzakemap categorizations of existing policy packaging and examine its relation to with urban forms [40]. Finally, researchers like Rogge and Reichardtand Kern et al. emphasize time as another crucial dimension for analysing the development of policy packaging and the need to understand the timeline of policy measures based on a systematic review [33,41]. These studies provide fruitful perspectives for the analysis of characteristics of existing policy packaging, but there is still a lack of an approach which can capture the main characteristics of policy packaging and compare the effectiveness by synergizing all available dimensions.
To conclude, in the context of sustainable transport development, policy packaging could be an effective tool for managing real-world mobility, but its effects are poorly understood in real-world contexts. In order to achieve this objective, three aspects should be improved. First, a dynamic perspective should be taken to investigate the whole life-cycle of TDM packaging. TDM packaging is a continuously dynamic process without a precise packaging boundary [33]. Consequently, there is a need to understand the effects within a broader period, looking at TDM packaging from a general and historical perspective. Second, an approach should allow for a straightforward comparison of TDM packaging on different characteristics. Existing research lacks a methodology for analysing policy packaging characteristics, as well as evaluating the outcome of policy packaging, which, to a large degree, limits the guiding functions on the TDM packaging implementation. Third, we needed to evaluate the effectiveness of TDM measures packaging on the sustainable development of transport systems. Although confirming the causal relationship of packaging, excluding other potential contextual factors, such as political, geographical, and cultural factors, is mostly impossible in the real world [42], empirical research from different backgrounds on exploring the correlation between TDM packaging and transport system performance is meaningful for its design and implementation.
3. Methodology
In order to unfold the whole process of policy packaging, a comprehensive approach is unavailable to analyse policy packaging. It is much more meaningful to examine how various policy measures develop over time, rather than to identify an “ideal” static policy package [41]. That approach has to deal with a reality where policy packaging does not occur instantaneously. Policies are packaged with new policies introduced after learning about the effectiveness of implemented policies, understanding the interaction between policies, and the consequent layering of policies that can be done more or less interactively. Those interactions are reflected in the design space (the interaction of various design alternatives, stakeholder involvement, and other context-specific factors), and the layering is found in temporal factors (e.g., sequence of policy measures, and the process of policy implementation), both of which are important in analysing policies [38,43,44]. Therefore, our study develops an integrative method, considering both aspects. Moreover, one further step is made by applying this method, to explore the influence of TDM packaging on the performance of sustainable transport systems.
3.1. Measuring Policy Packaging
This study develops a method to measure policy packaging based on the combination of methodologies selected in the literature review, including four dimensions—density, categorizations, interaction, and time—each of which reveals one character of policy packaging, shown in Table 1. This not only covers the characters of single measures and the interaction among them, but also investigates their change in a dynamic process. The reasons why the methodology includes these characteristics are that, firstly, it includes the temporal factor, which enables us to investigate packaging from a dynamic and historical point of view, and, secondly, the characteristics can provide a whole picture of packaging by describing it from different perspectives: the density reveals the numerical value of TDM packaging; the categorization reflects differences of groups of measures; the interaction indicates the relationships between two measures; and the time presents the change of these characteristics. Lastly, considering the data accessibility, these four characteristics can all be analysed based on contextual analysis.
3.1.1. Density of TDM Measures
A first relevant measure is the density of TDM measures, being the number of TDM measures taken. To establish this, policy documents are scanned for the occurrence of TDM measures, as stated on a first long list of possible TDM measure. This is no indication yet of the integration of policies. Measures may be implemented separately and not considered in their interdependencies. Thus, a first analysis looks only at the number of measures as a measure of intensity: how frequent do TDM measures’ occur in documents. In order to eliminate the interference from unbalanced numbers of policy documents, the density is applied to represent the average intensity of TDM measures per policy document. Our assumption is that this reflects whether, and to what degree, governments are willing to design and implement TDM measures as a package rather than as separated tools.
3.1.2. Categorizations of TDM Measures
A second relevant measure to understand TDM packaging is aimed at understanding categorizations of the packages developed. What categorizations of TDM measures are taken? According to literature reviews, categorizations of TDM measures reflect preferences of governments in selecting appropriate measures. To come to this overview we further developed existing classifications of TDM measures. This study adopts two categorizations, target traffic modes and approaches to changing behaviours. Target traffic modes include pedestrian (P), bike (B), private car (C), public transit (PT), and taxi (T), while the approaches classification include campaign (c), regulation (r), economic (e), service improvement (s), and facility improvement (f) (detailed in Appendix A). The first category can reveal which traffic modes governments focus on and regard as primary issues in the strategies, and the second one implies governance styles in dealing with traffic issues, being soft or hard. Overall, the categorizations of TDM measures are measured and compared by both their intensity and proportion in one package.
3.1.3. Interaction of TDM Measures
A third, and key, measure to understand policy packaging is to understand to what extent those developing the policies see the measures in their mutual dependencies. To establish that we carried out a text analysis to see to what extent the texts suggest interactions between measures. In order to analyse the interaction of measures, social network analysis theory is used. Network analysis is a set of methodological techniques aimed to explore the general patterns in social relationships formed within individuals and groups [45,46]. Except active actors in social and political systems, the links of non-actor items, such as papers and policy documents, can also been investigated by the network analysis. For example, co-citation networks are formed based on the citing and cited relation within papers [47]; the goal and target networks are established to analyse the integration of policies of sustainable development [48].
This method is seemingly straightforward. All categorizations of measures are determined by analysing related contents in policy documents. The links between two measures refer to their co-occurrence in one policy document. The interactions are strengthened with the replication of those same links in different documents. Then the matrix of links is created and used for two-mode network analysis [49]. Via simple network analysis techniques, the network of measures is formed and shown based on degree centrality (which counts how many neighbours a node has) [48]. If one measure has the most connections with others, this measure is regarded as the central or primary measure in the packaging. Moreover, the density of networks, referring to the portion of the potential connections in a network that are actual connections [50], is calculated to represent the degree of packaging integration. A packaging network with higher density means that these measures have been integrated better and this package is likely to make more synergized effects.
3.1.4. Development of TDM Packaging
A fourth measure to understand the dynamics of policy packaging focuses on the temporal development of packaging. This is especially important as we want to understand the possible effects of the packaging, which express themselves over time. This time dimension enables us to investigate the real packaging process from a dynamic point of view by examining the change of three characters. As policies always keep changing, and significant changes usually happen in some crucial moments, it is useful to analyse them in different phases of development [51]. No matter what kind of changes happen, we can determine how a policy package develops and compare packages in different phases. Therefore, this study next analyses each character, combining its development overtime.
3.2. The Influence of TDM Packaging
Finally, the literature expects an effect of policy packaging on the performance of the mobility system of the urban environment. Based on the measurement of TDM packaging above, we can explore the relations between TDM packaging and performances of transport systems. This is our fifth measurement. It should be noted that this study cannot conclusively prove the causal relationship between them because of current data limitations and the potential contextual factors, such as economic and geographical ones. However, to examine the relation between the development of TDM packaging and the changes of performance of transport systems is to set the stage, which is regarded as a meaningful pilot for future research. Specifically, we examine whether the density, categorizations, and interaction of TDM packaging can explain the change of transport performance.
In order to evaluate the influence of packaging on transport systems, indicators of sustainable transport systems are selected to evaluate their performance after issuing some TDM measures. The indicators, well-established in the existing research [52,53], generally include economic, social, and environmental aspects with the data from objective documents and subjective evaluation. Considering the fact that packages target broad goals, as well as the availability of data, this study only selects two broad indicators: the public transport sharing rate and the congestion delay index (see Table 2). Public transport sharing rates reveal the actual role of public transport in travelling, and the congestion delay index mainly reflects how much congestion travellers face when driving cars [54]. It is generally accepted that higher public transport sharing rates and lower congestion delay indices can contribute to more sustainable and higher quality transport systems.
3.3. Data Collection Procedures
This study examines the methodology in two Chinese cities—Dalian and Shenzhen—during the stated period from 2006 to 2017. Multi-case analysis allows for testing the proposed approach more effectively than a single case study and gives a sense of its potential to reveal the influence of packaging [55]. The reasons for selecting these two cities are as follows: (1) Both are facing similarly severe traffic issues, but they have actually adopted different strategies in transport system development. Dalian ranked first as a “public transport city” in China in 2000, but private cars increased dramatically since then. In contrast, Shenzhen is continuously developing its public transport systems and, in fact, surpassed Dalian, rapidly becoming one of the nationally-famous Transit-oriented Development (TOD) cities; (2) Various TDM measures have been implemented to deal with mobility issues since 2006, which makes the study of the process of TDM packaging possible; and (3) These two cities, to some extent, represent numerous other ones in China, Dalian being a relatively more advanced Northeastern city, and Shenzhen acting like a pioneer in the southeast.
Content analysis is applied in this study because key information on TDM packaging showing its implementation can be drawn from policy documents. The sources are mainly open government platforms (http://www.dl.gov.cn/gov/affair/index.vm?type=2&toid=04&lid=3_4_2; http://www.sz.gov.cn/zfbgt/). The data were collected in two rounds. The first round consisted of collecting all types of policy documents (e.g., laws, notices, regulations, and measures) related to transport management from 2006 to 2017. For Chinese cases, this period covers the 11th (2006–2010), 12th (2011–2015), and a part of 13th (2015 to 2017) five-year plans, which provided opportunities for significant changes in policy strategies and specific measures at both the national and local levels. In the second round those documents were screened with the principle that one should at least include one TDM measure. In addition, the data of public transport sharing rates were taken from the China city statistical yearbook and the congestion delay index was derived from Gaode Chinese major city transport reports.
Several qualitative and quantitative analysis tools are used to analyse the data. The qualitative tool, MAXQDA 12 [56] is used to code all collected policy documents based on keywords or sentences referring to any TDM measure. To be specific, when one keyword or sentence of one specific TDM measure occurs, it is counted as one point, but each TDM measure is only counted once in one document. Descriptive analysis of TDM measures are then carried out by SPSS [57] and the packaging relationships between TDM measures is based on a social network analysis tool, Netdraw [58].
4. TDM Packaging and Sustainable Transportation in Dalian and Shenzhen
4.1. TDM Packaging in Dalian and Shenzhen
This section presents the results of three characteristics of packaging—density, classification, and interaction—and their change overtime based on the data from collected policy documents.
4.1.1. Development of TDM Measures in Density
This study firstly analyses the characteristic of TDM measures in terms of number, intensity, and density. In Dalian, 31 policy documents were found with at least one TDM measure mentioned; in Shenzhen, 42 policy documents were found. For both the documents were evaluated from 2006 to 2017 (Table 3). In both cities, the number of policy documents related to transport demand management is increasing over time. It increases more rapidly in Shenzhen, especially in the beginning two years of 13th five-year plan period. The result indicates the Shenzhen government puts more focus on implementing policies that include TDM measures when dealing with transport issues.
The intensity and density of TDM measures in Shenzhen are higher than Dalian in all three periods (Table 3). The intensity indicates there are more measures issued or mentioned in Shenzhen than Dalian at the same time. Table 3 also shows that two governments tend to issue a large number of measures in the beginning year of the plan, such as 2011 and 2016.
In order to check whether the higher intensity is the result of some policy, each containing many measures or many different policies including a few measures, the density of intensity per policy document is calculated. This illustrates that the Shenzhen government packages more TDM measures in one policy document than Dalian, in general (see Table 3 and Figure 1). One of reasons why the trend reversed in 2007 is that Shenzhen issued few policies in that year. It also should be noted that, as TDM measures in the next three years of 13th five-year plan are still unknown, the density of TDM measures in the short period from 2016 to 2017 is lower than the earlier periods.
To sum up, the density of TDM measures in Shenzhen is higher than that in Dalian, and it increases dramatically in the first year of the plans. Therefore, it illustrates that the propensity in Shenzhen is to integrate measures more in one policy and, as such, has a higher packaging level than Dalian.
4.1.2. Development of TDM Measures in Categories
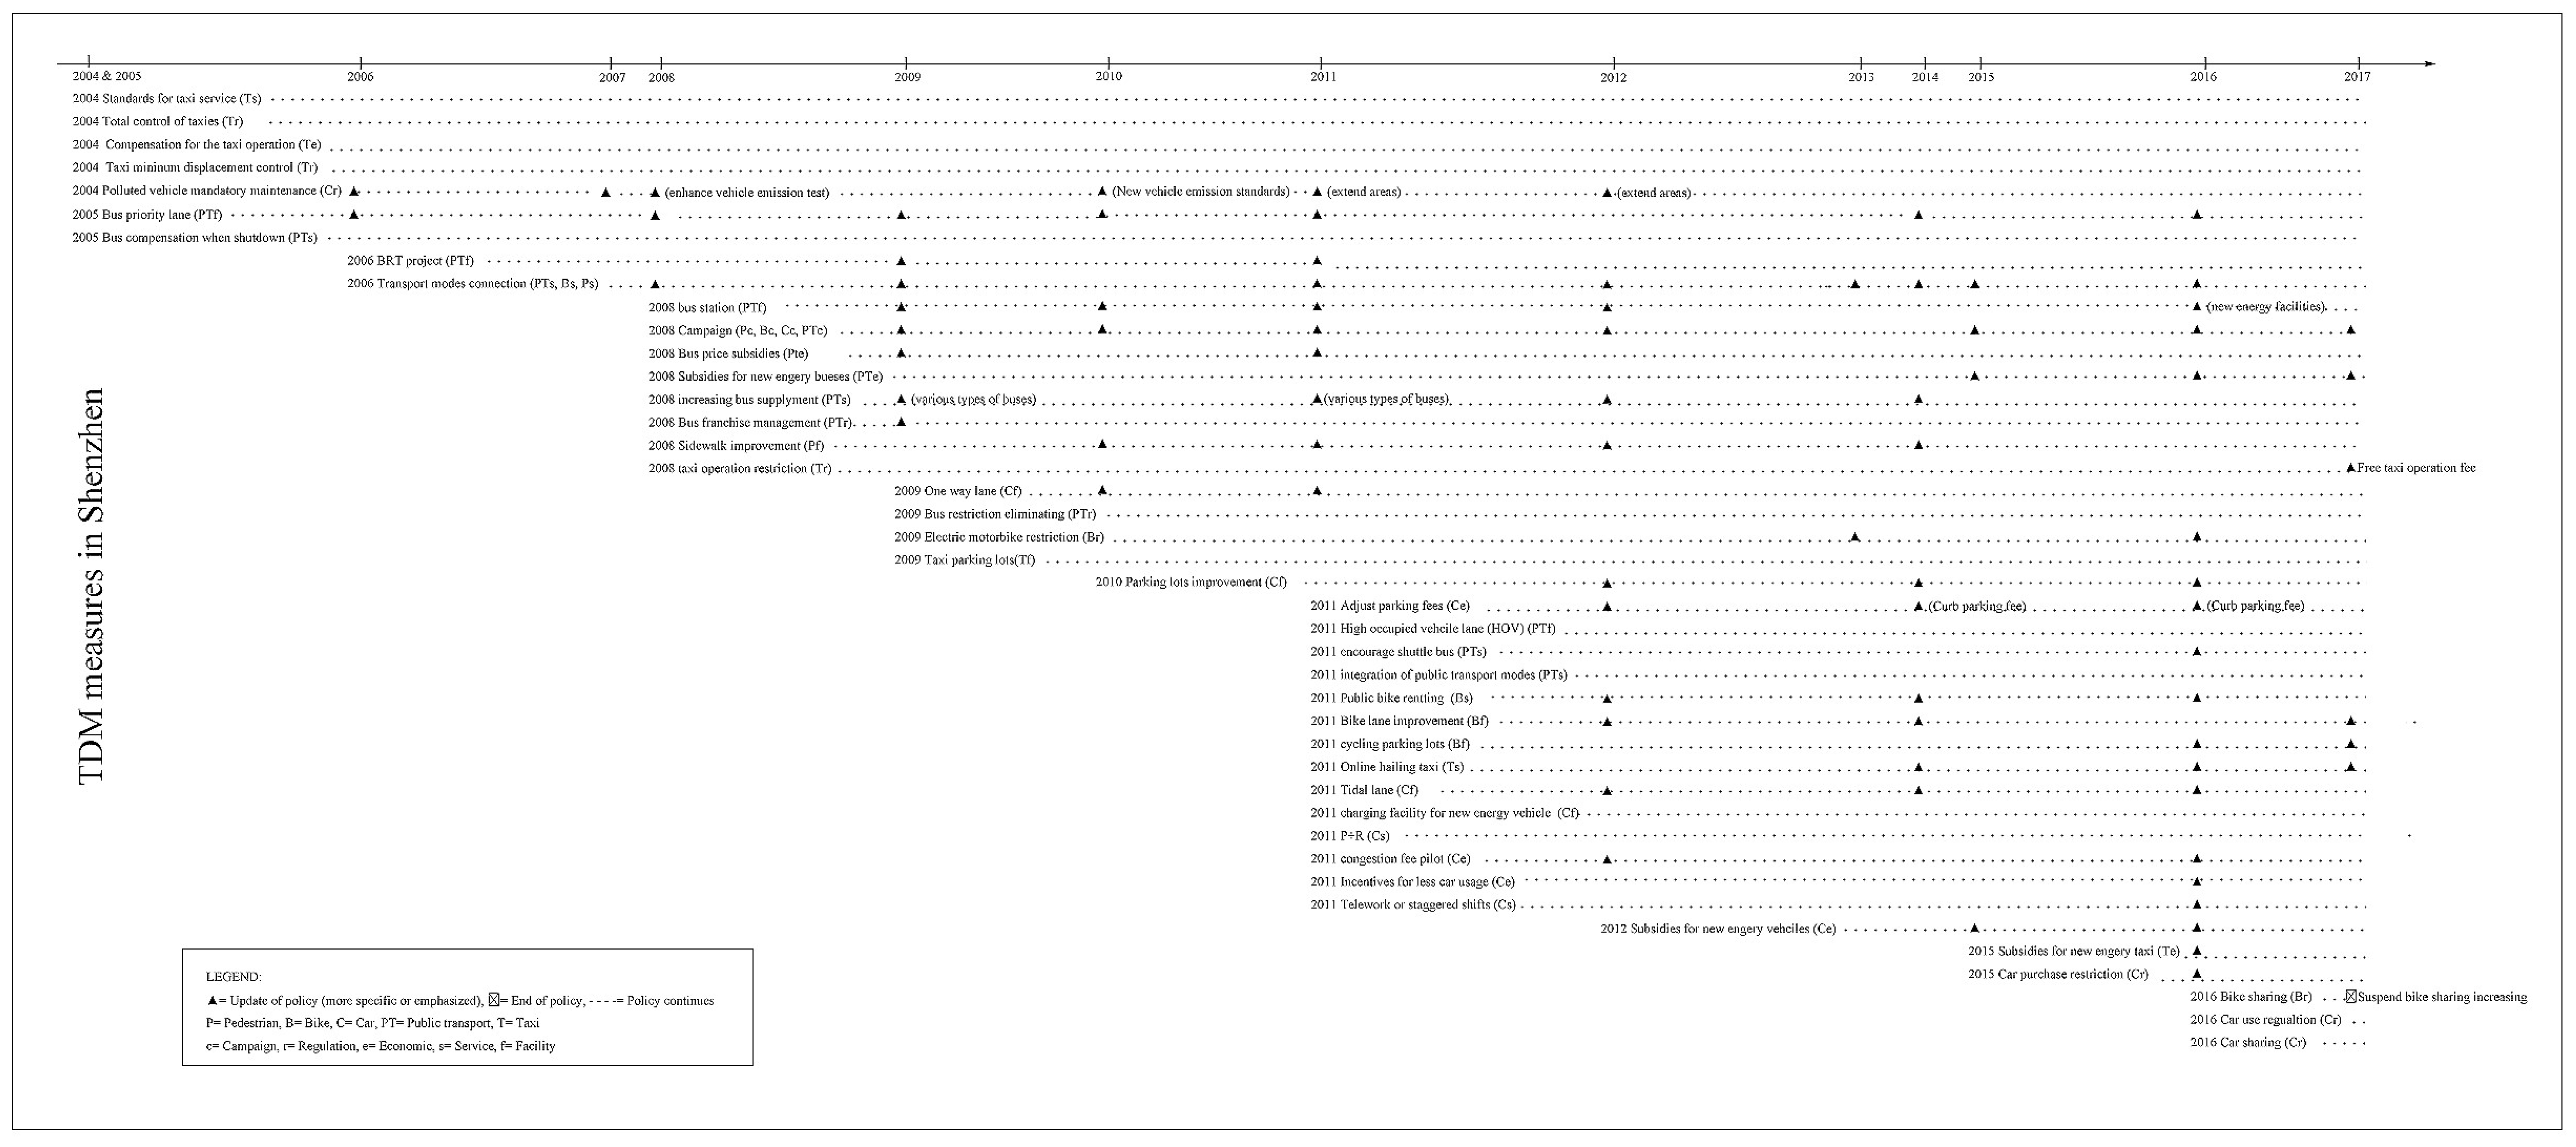
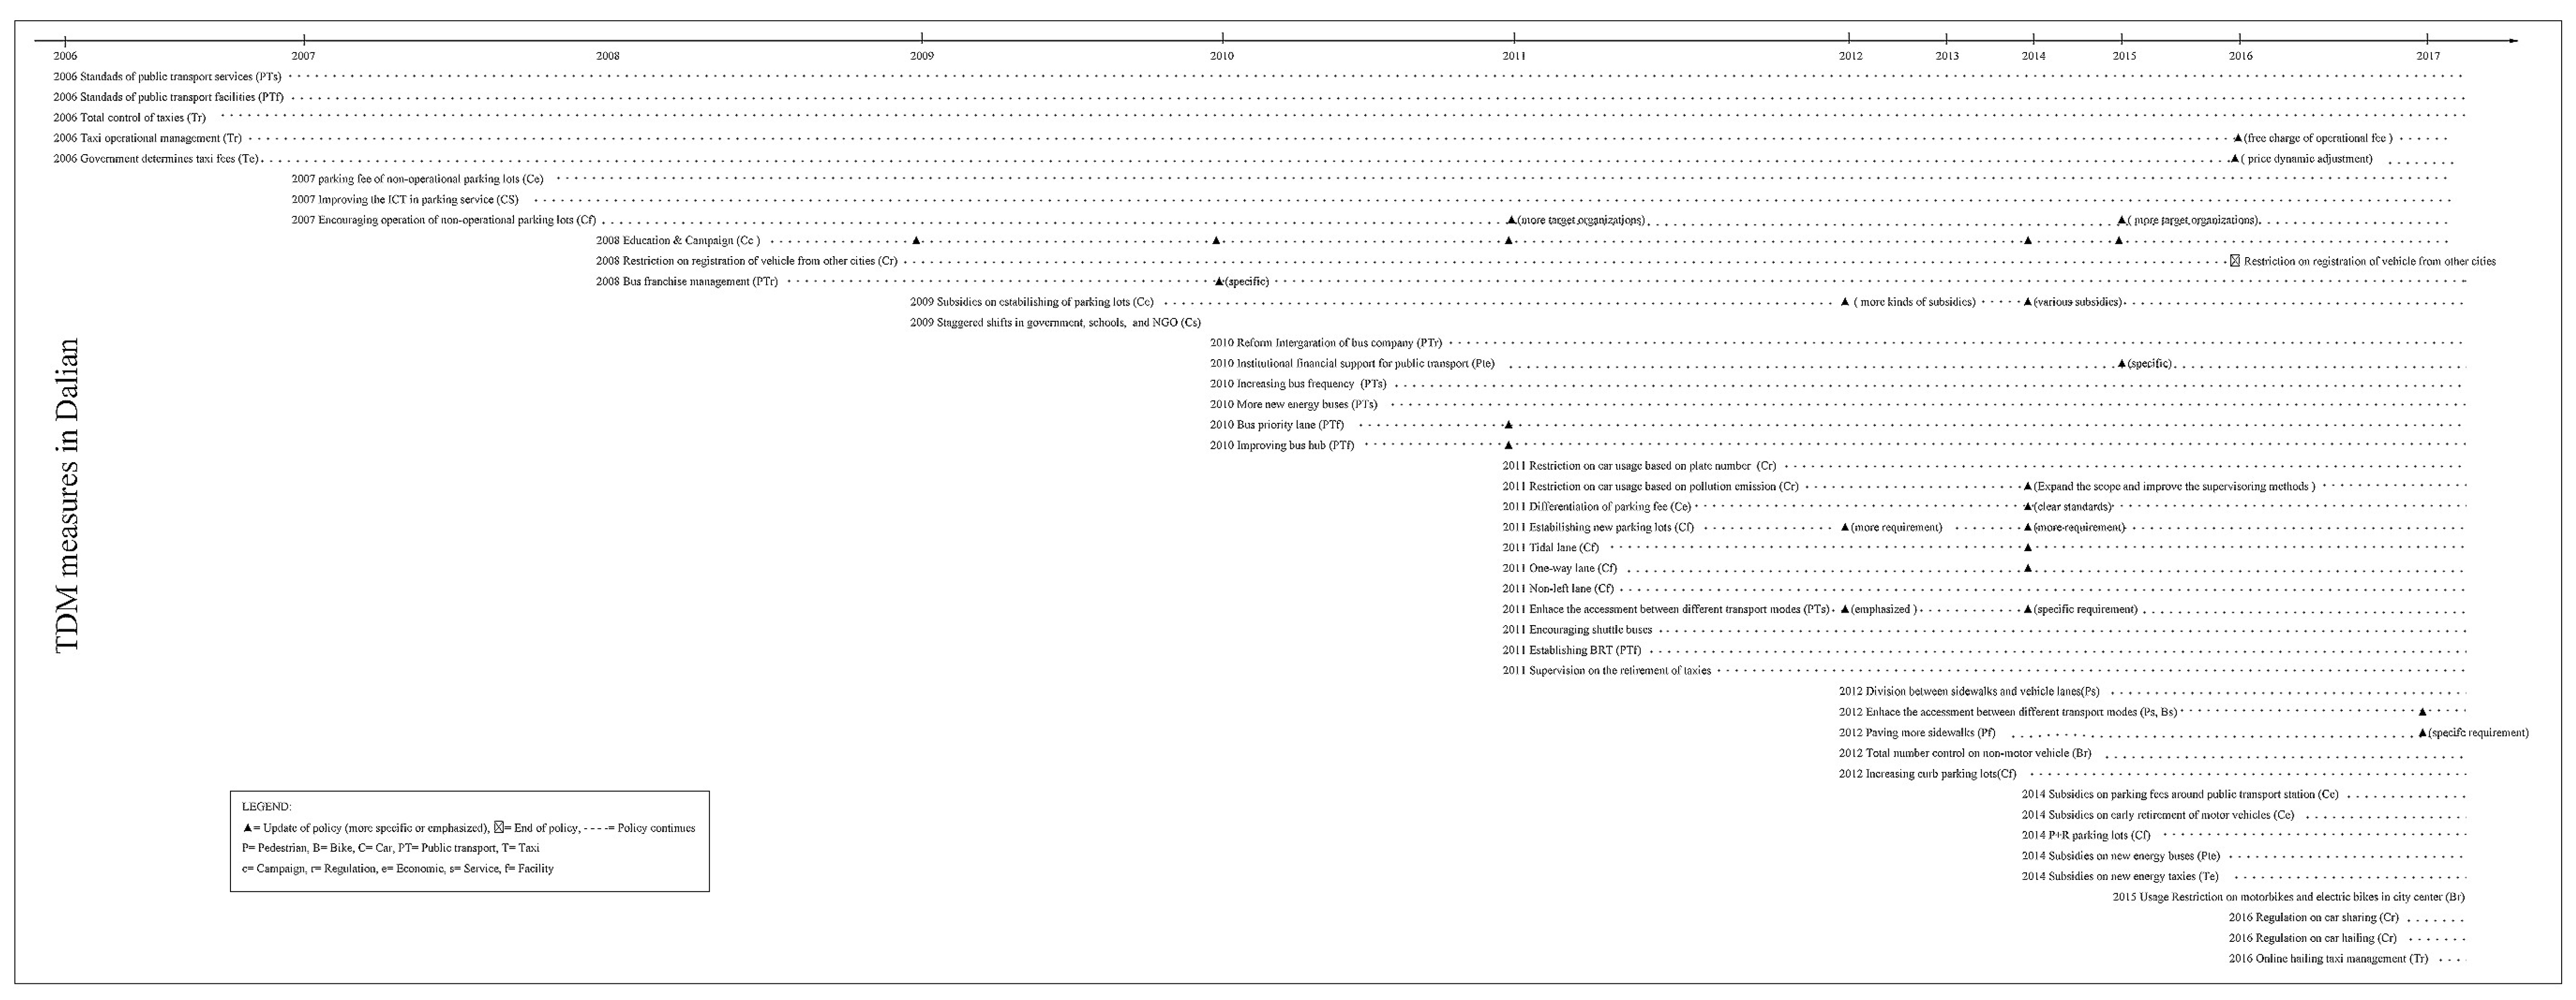
To reveal the overall characteristics of the packaging, the packages are analysed based on categories of measures with a similar feature, rather than single measures. Before the comparison based on categorization, it is necessary to illustrate how many types of measures have been implemented in the two cities. Table 4 shows that Dalian has adopted a wider variety of measures than Shenzhen. One reason why the Dalian government issued more categories of TDM measures from 2006 to 2017 is that some types of TDM measures that had been issued before 2006 (for example in 2004 in Figure 2) are not included. Moreover, Figure 2 and Figure 3 show that more TDM measures have been updated or continuously emphasized (▲ in each row) in Shenzhen than Dalian. This illustrates that the Shenzhen government is more actively optimizing existing TDM measures, while Dalian tends to keep on piloting the effectiveness of new TDM measures.
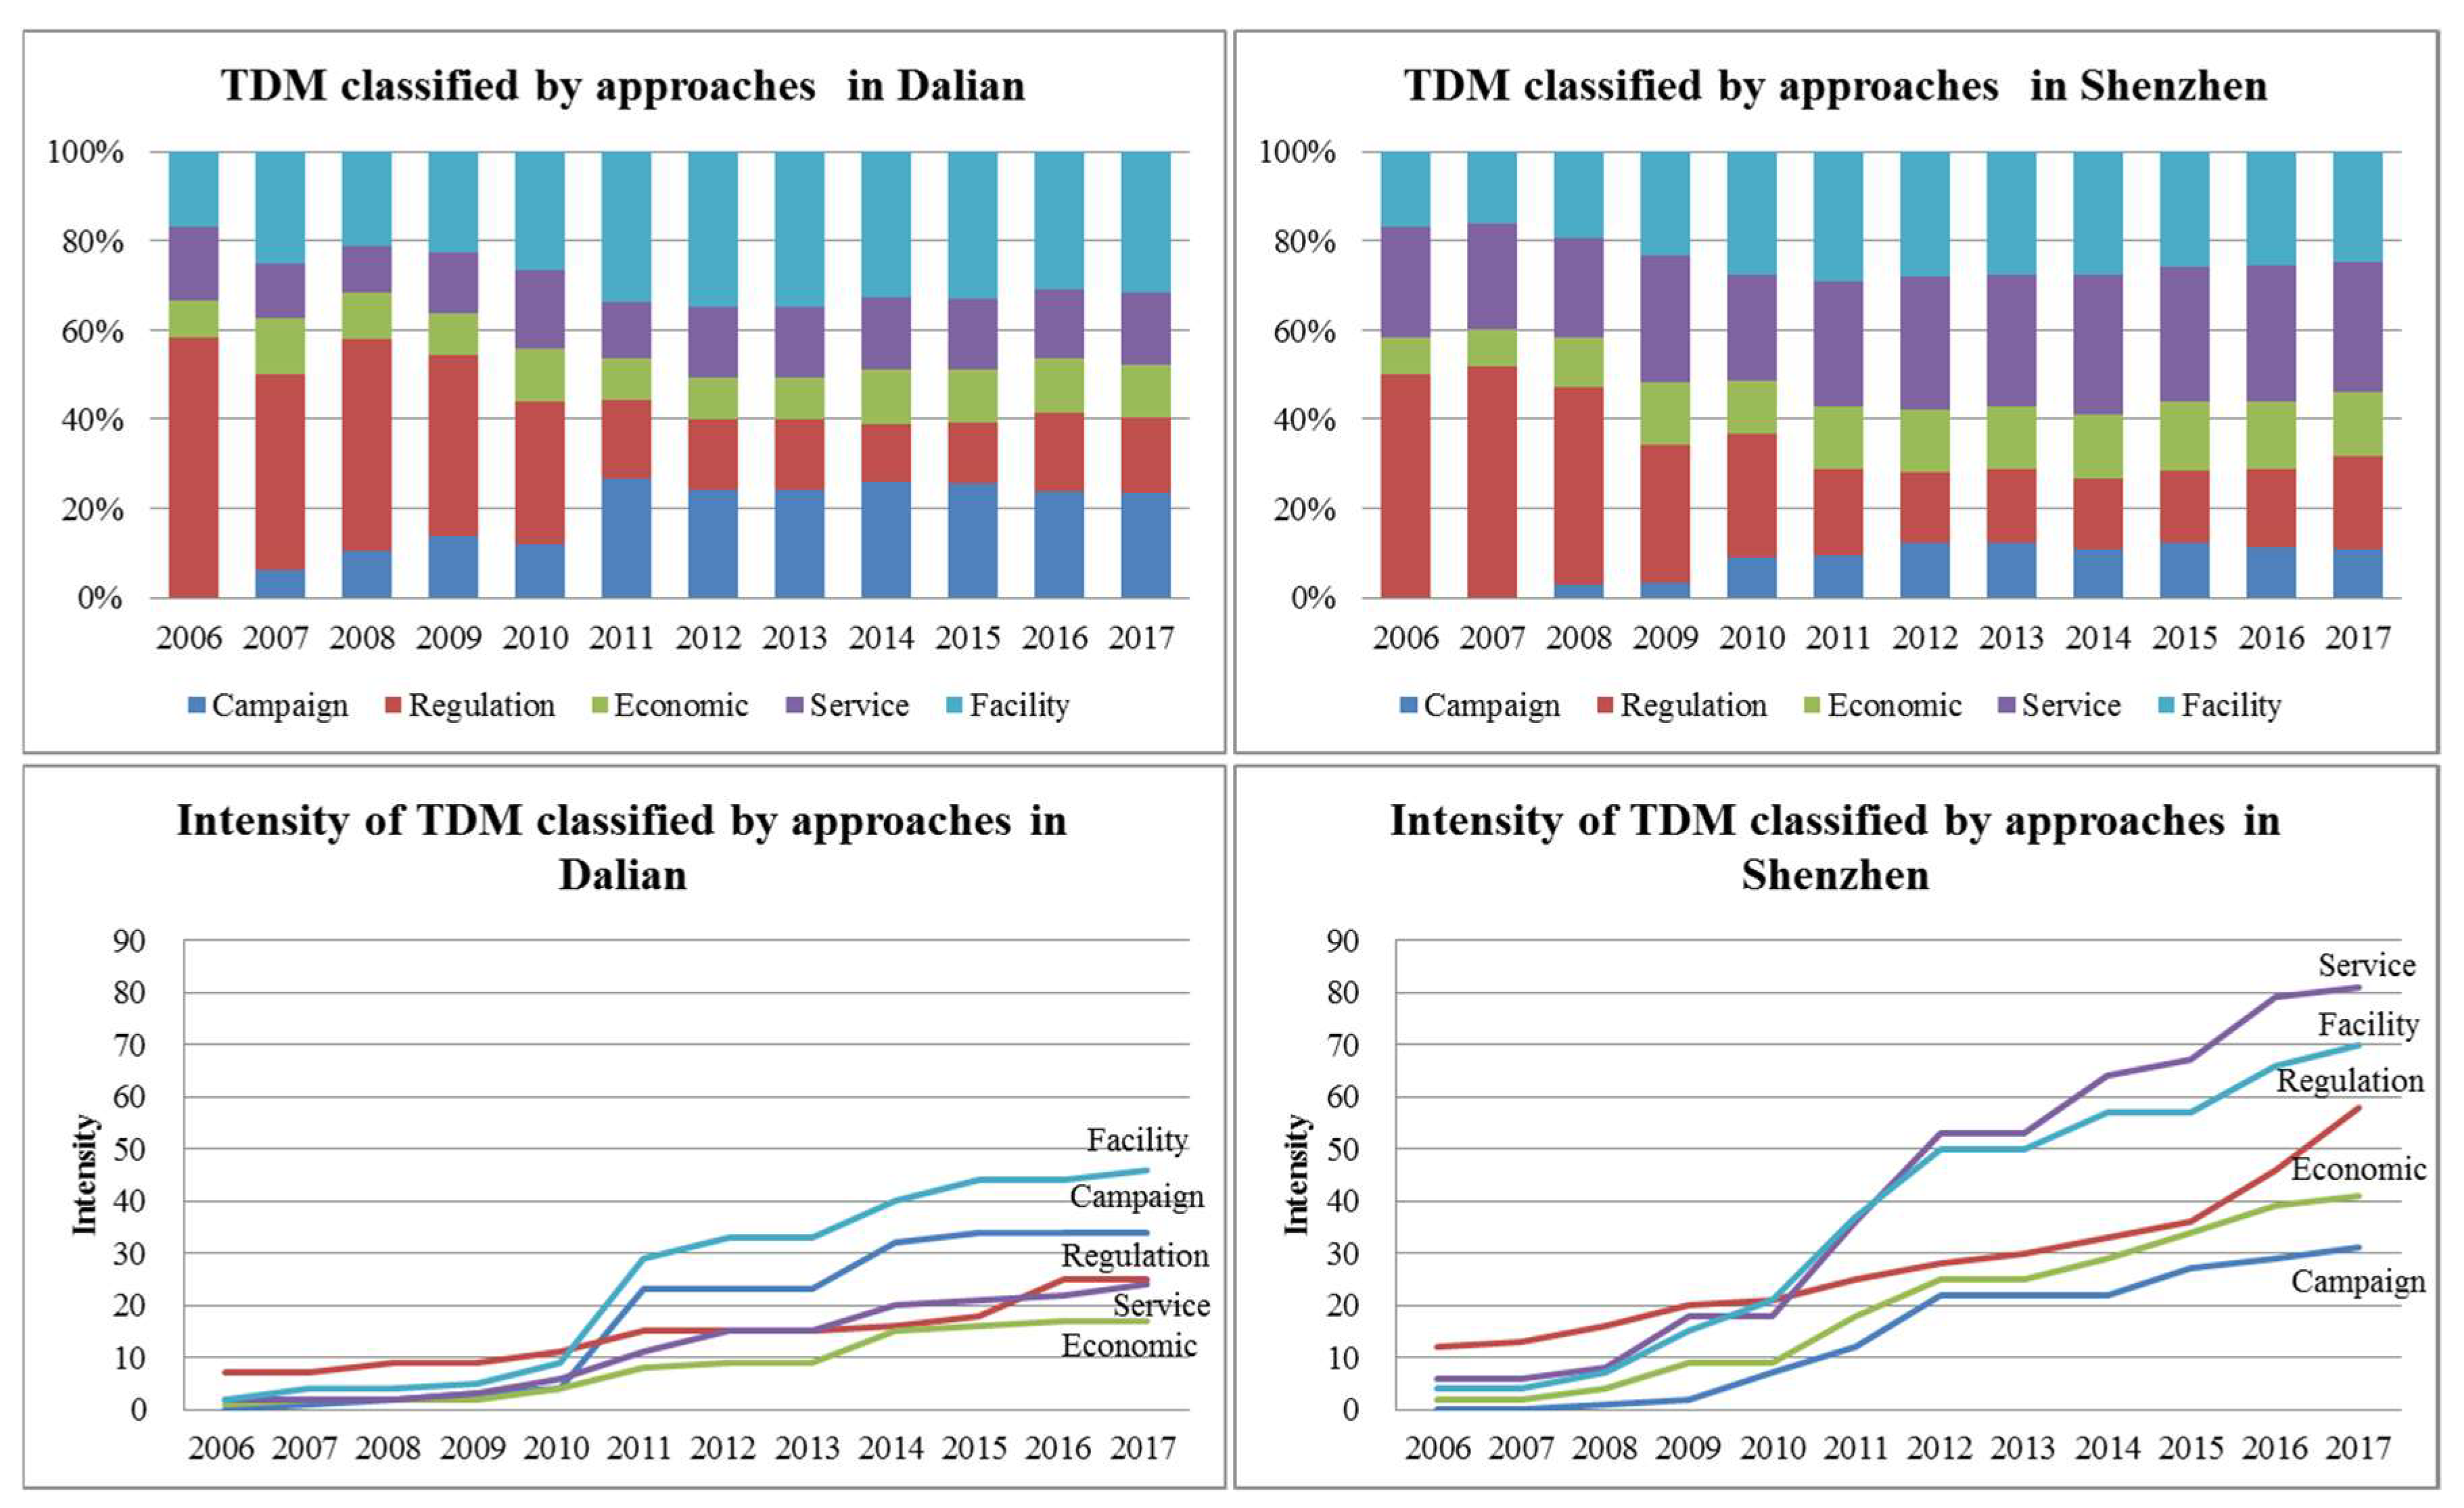
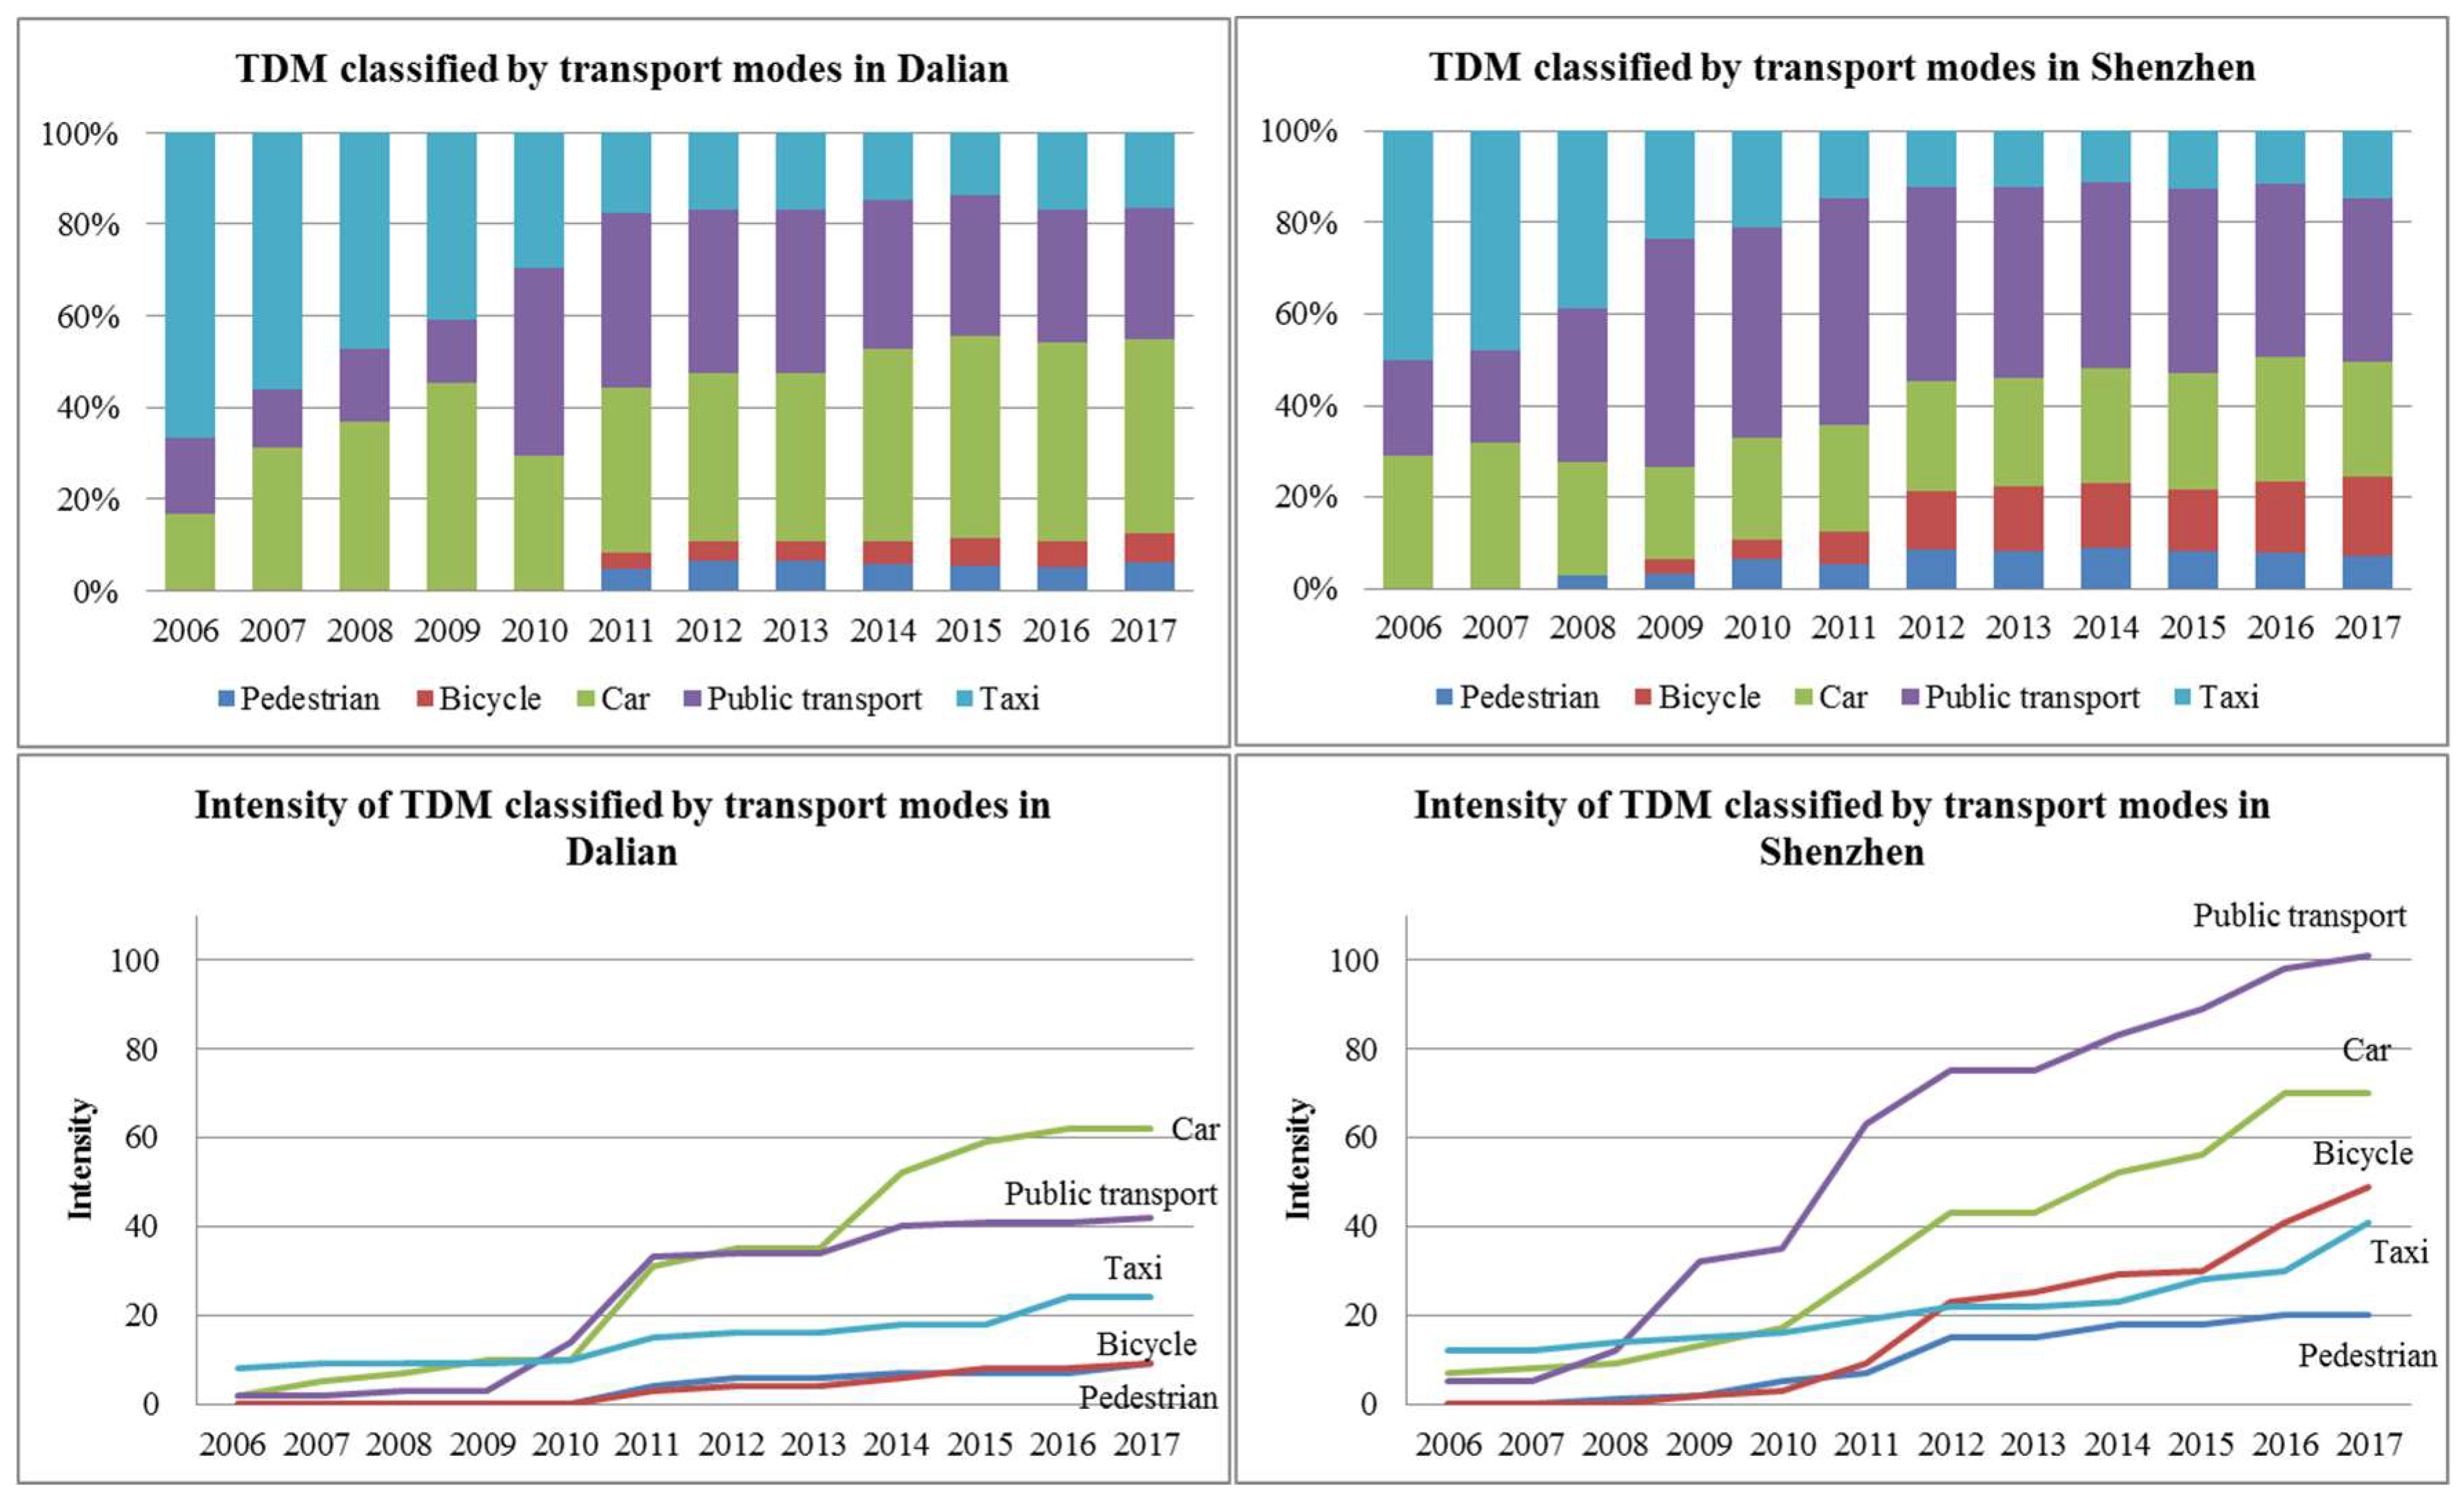
Here, the differences in the various proportions of categories of TDM measures are investigated. As stated above, this study selects two kinds of classification: different transport modes targeted and different approaches to changing behaviours. The differences between the cities are shown below, in Figure 4 and Figure 5. These figures show the percentage of TDM measure categories as mentioned as a proportion of the total mentioned through time on the bottom. On the top, the figures show the intensity of TDM classifications that are outlined in their cumulative occurrence of all types of measures. The measures are expected to produce effects continuously over the years, hence the intensity is looked at cumulatively, with the number in a specific year being the sum of the occurrences of new measures in that year and earlier mentions of policies that are still in place.
There are increasing TDM measures implemented in Dalian and Shenzhen and the specific compositions of TDM packages show a clear difference (Figure 4). Before 2011, measures in the regulation category represent the main approach to deal with traffic issues in both cities. Both cities show a noteworthy shift in the adoption of different TDM measures. Facility (infrastructure for alternative modes) and campaign measures increase rapidly and take the most important role in the Dalian package. Economic measures rank last in Dalian, throughout the years. By contrast, Shenzhen prefers to adopt measures in the service category, providing alternative transport services, in addition to facility measures, as well as regulation measures in recent years. Campaign measures over the years had a much higher occurrence in Dalian than in Shenzhen.
As for the categories that look at the different transport modes, the two cities show two distinct development orientations of TDM measures (Figure 5). In both cities, before 2010, measures of cars and taxis form the core, with significant growth for public transport measures. However, the growth in Shenzhen of public transport measures is much larger than in Dalian. After 2010, the measures oriented towards car and public transport increase most with Shenzhen showing a stronger focus on public transport. From 2013, measures of bicycles and walking increase slowly, more so in Shenzhen than in Dalian. The figure shows that the Shenzhen government has a stronger focus on public transport, walking, and cycling.
In conclusion, results above provide that Shenzhen ends up with a more diverse set of TDM measures, which creates opportunities to enhance the connection of different measures, while Dalian continues to focus on cars and public transport more. In addition, there is a significant focus shift of measures in both cities. In Dalian, the focus shifts away somewhat from the private cars after 2011; however, the Shenzhen government has a stronger shift and keeps improving public transit facilities and services. Finally, the Dalian government prefers the measures that establish transport facilities and conducts broad campaigns (e.g., providing parking facilities and media), while Shenzhen emphasizes the improvement of public transport services (e.g., improving bus accessibility) and slower modes to attract people to change their travel behaviour.
4.1.3. Development of TDM Measures in Interaction
Above, this article describes the characteristics of measures, the components of packaging, and the packaging network, and presents how measures interact with each other in the packaging. The key to understanding policy packaging, however, is to see to what extent these measures were seen in their interdependencies when the policies were developed and proposed. To assess that, social network theory is applied to see whether these dependencies are revealed in the policy documents.
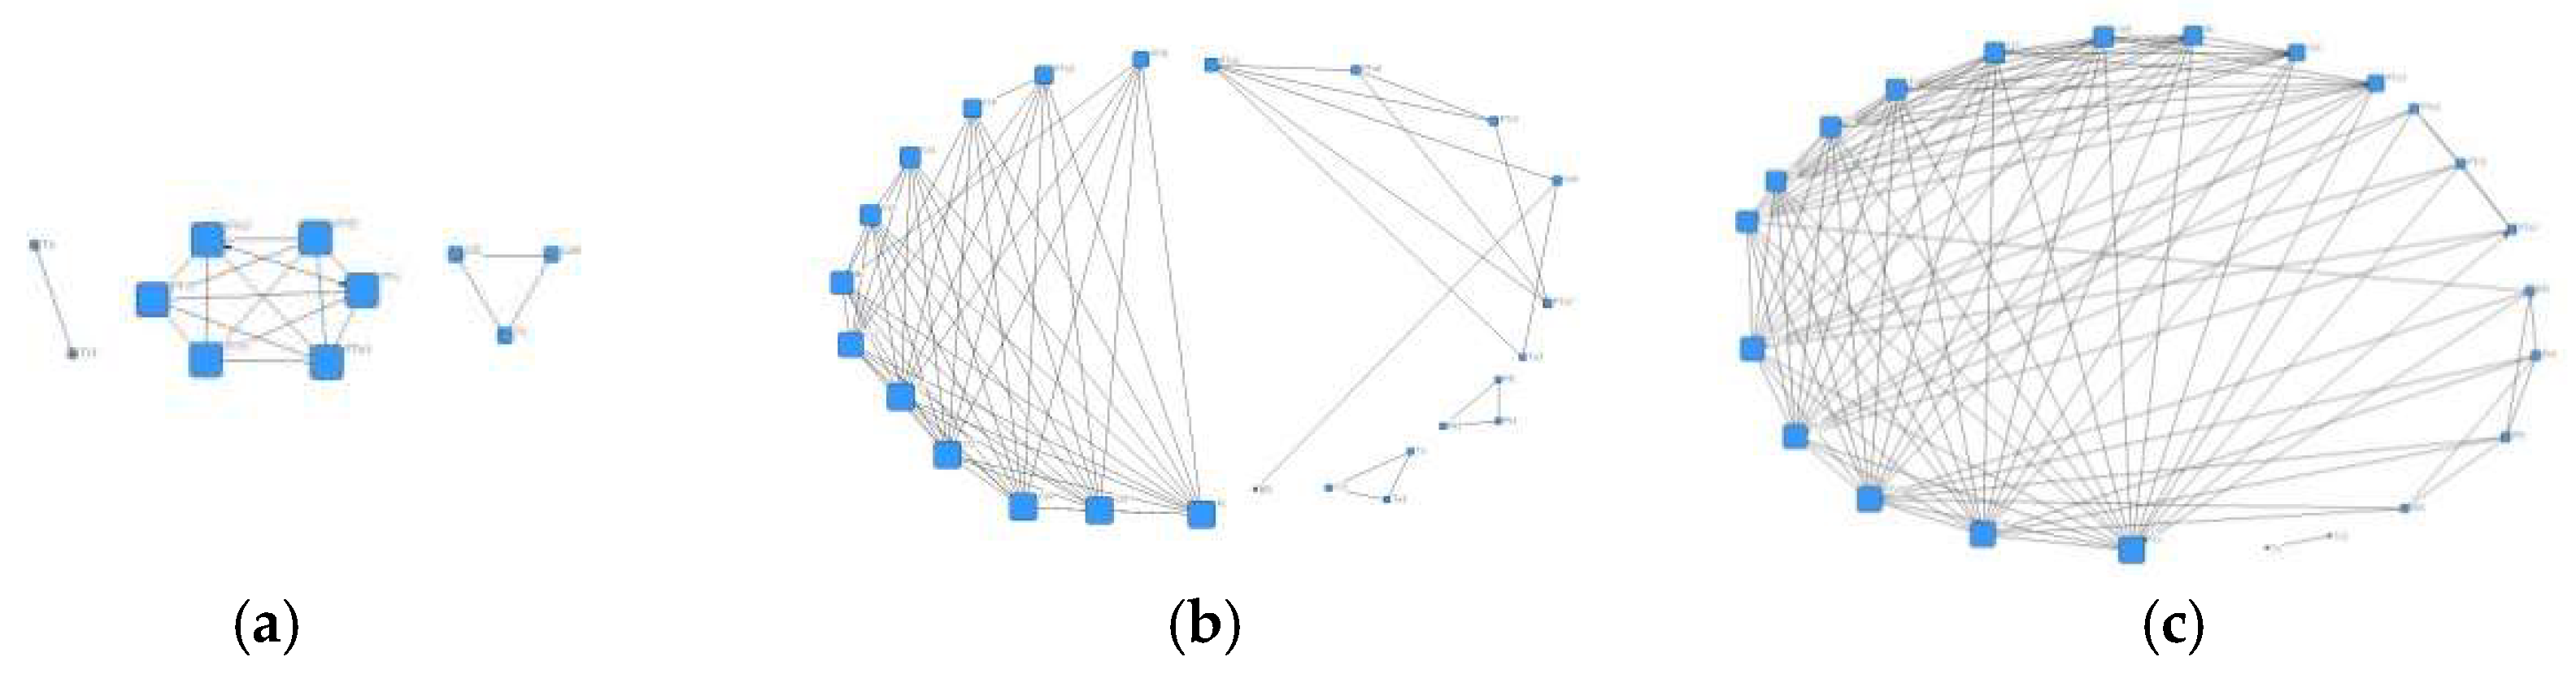
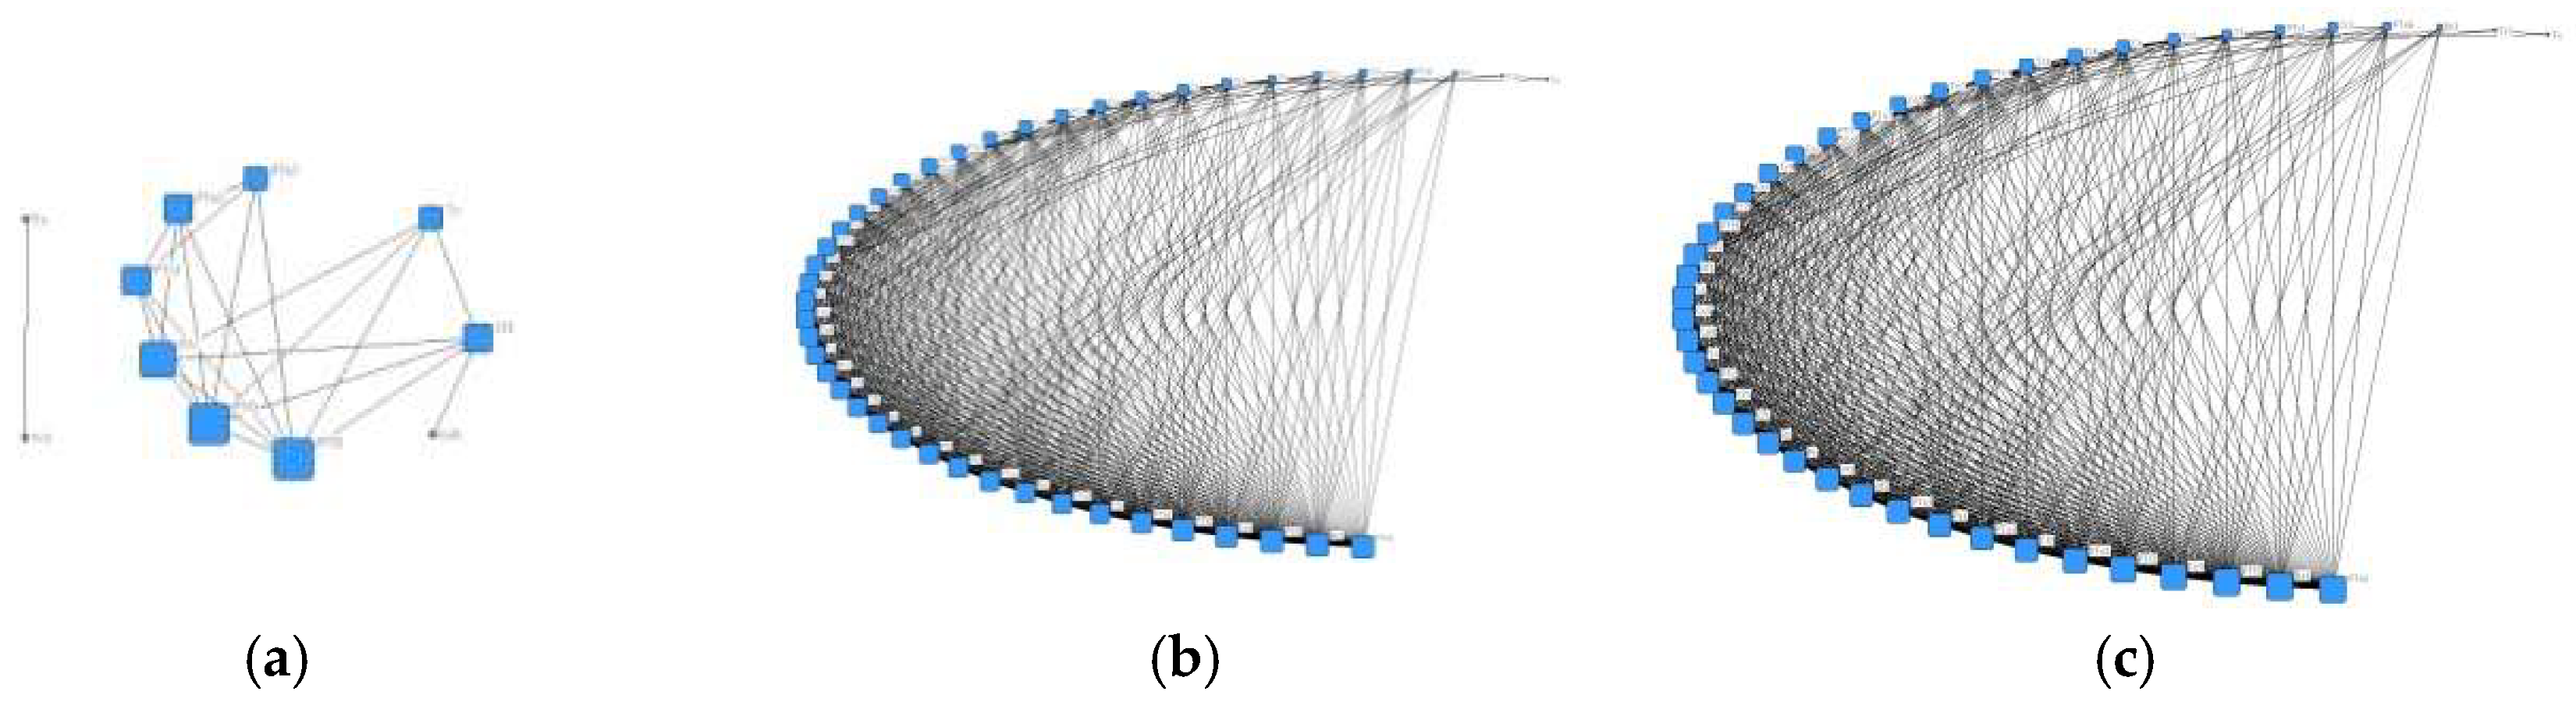
Figure 6 and Figure 7 illustrate the TDM packaging networks and their development in the three plan periods in Dalian and Shenzhen. The dots refer to TDM measures as they were found in the documents, and the lines represent the connection between two measures as mentioned in the documents; a larger dot means this measure has more interaction with others. The results show that the trend of packaging in both cities is continuously becoming more integrative and complex. Compared to Dalian, the packaging network is more interactive and larger in scale, develops more rapidly during the period from 2006 to 2010, from 2011 to 2015, and from 2015 to 2017, and maintains a higher level in the 13th five-year plan.
The 2006–2010 map of Dalian (Figure 6a) shows that in Dalian, originally, three different fields developed, with limited connections. Taxi policies (left line), car policies (right triangle) and public transport policies are dealt with in the documents as separate policy blocks. The 2011–2015 map for Dalian (Figure 6b) shows a large block, mostly cars, on the left, and a large block, mostly public transport, on the right. The 2016–2017 map of Dalian (Figure 6c) shows far more integration. The 2006–2010 map of Shenzhen (Figure 7a) already shows more interconnections, illustrating that in the documents dependencies are already regarded between the different categories. The major policies on public transport and cars are already regarded together. The 2011–2015 map for Shenzhen (Figure 7b) shows a major step in looking at the different policies in their interdependencies, which remains high in the 2016–2017 map of Shenzhen (Figure 7c), both showing high levels of integration, much higher than any of the Dalian maps.
After this more intuitive analysis of the development in packaging networks, we next zoom in on the maps and compare the top 10 core measures that connect most to other ones in each period for both cities (see Table 5). This illustrates that, in Dalian, in the period of 2006–2010, the interaction of measures is more car-oriented, with a focus on facilities. Between 2011 and 2015, with the TDM measures increasing in integration, measures of private cars take the central role in the packaging network. The connection between measures of private cars and public transport increase significantly. From 2016, policy-makers begin to enhance the interaction among more various types of measures. As for Shenzhen, from 2006 to 2010, interactions link different kinds of TDM measures. With the number of TDM measures increasing rapidly in the next period, the interaction of measures became rather tighter than Dalian at the same time. In the last period plan, the network gets even more integrative.
Next, the maps show that interaction and density do not necessarily align. This means the measures that are often mentioned can have few connections. For example, Table 6 shows public transport subsidies (PTe) have been mentioned for most times in Dalian, but it is seldom packaged with other measures. It also presents, in the 2011–2016 period, that there are seven car measures and one public transport measure within the top 10 core measures, but only six car and four public transport measures among the top 10 high-occurrence measures. These core measures show the development of transport systems: Dalian tends to focus more on private car management and few efforts are taken to increase the integration of measures of public transport. For Shenzhen, it is the opposite.
In sum, the results of interaction indicate: TDM packaging is developing with documents, illustrating how policies are becoming more integrative; compared to Dalian, Shenzhen has a more connected and wider packaging network; the measures which frequently occur in policies may not be the ones playing a central role in the packaging; and it is the core measures rather than high-occurrence ones that can exactly reflect the general strategies and development orientation of cities.
4.1.4. Conclusions
TDM packaging in Shenzhen is more integrative than in Dalian. To be specific, firstly, the Shenzhen government put more TDM measures in one policy which enforces their perspective on the interactions between measures. Dalian is starting to do the same in the latest plan, but still has a ways to go, compared to Shenzhen. Secondly, Shenzhen focuses many efforts on public transport development, while Dalian tends to focus on private cars. The difference of core measures in packaging reflects that the two cities have different strategies in dealing with traffic issues. Thirdly, the interaction of measures between policies in Shenzhen is higher than that in Dalian, which illustrates that, compared to Dalian, Shenzhen emphasizes the synergic effects of policies and has the capacity to deal with a complex and comprehensive policy packaging process.
4.2. Influence of TDM Packaging on Transport Systems in Dalian and Shenzhen
4.2.1. Introduction
After having applied the proposed approach for analysing TDM packaging in Dalian and Shenzhen, the next question is whether TDM packaging causes a positive effect on the development of transport systems. As there is limited research on assessing the effectiveness of post-ante TDM packaging, this study preliminarily explores whether TDM packaging can explain the change of sustainable development of transport. Four indicators, i.e., density, categories, interaction, and time, examined above are applied to analyse their relation with transport performance. Public transport sharing rates and the congestion delay index are selected as indicators of the performance of transport systems. They are rather broad but, for the evaluation of policy packaging, this is a prerequisite rather than a weakness. It should be noted that the data of the congestion delay index from transport reports have only been issued since 2010 and it generally ranges from 1.5 to 2.5 [54]. Next, this study explains the different changes of transport performance in the two cities from the point of view of packaging indicators.
4.2.2. Tentative Outcome on the Effects of TDM Packaging on Transport Systems
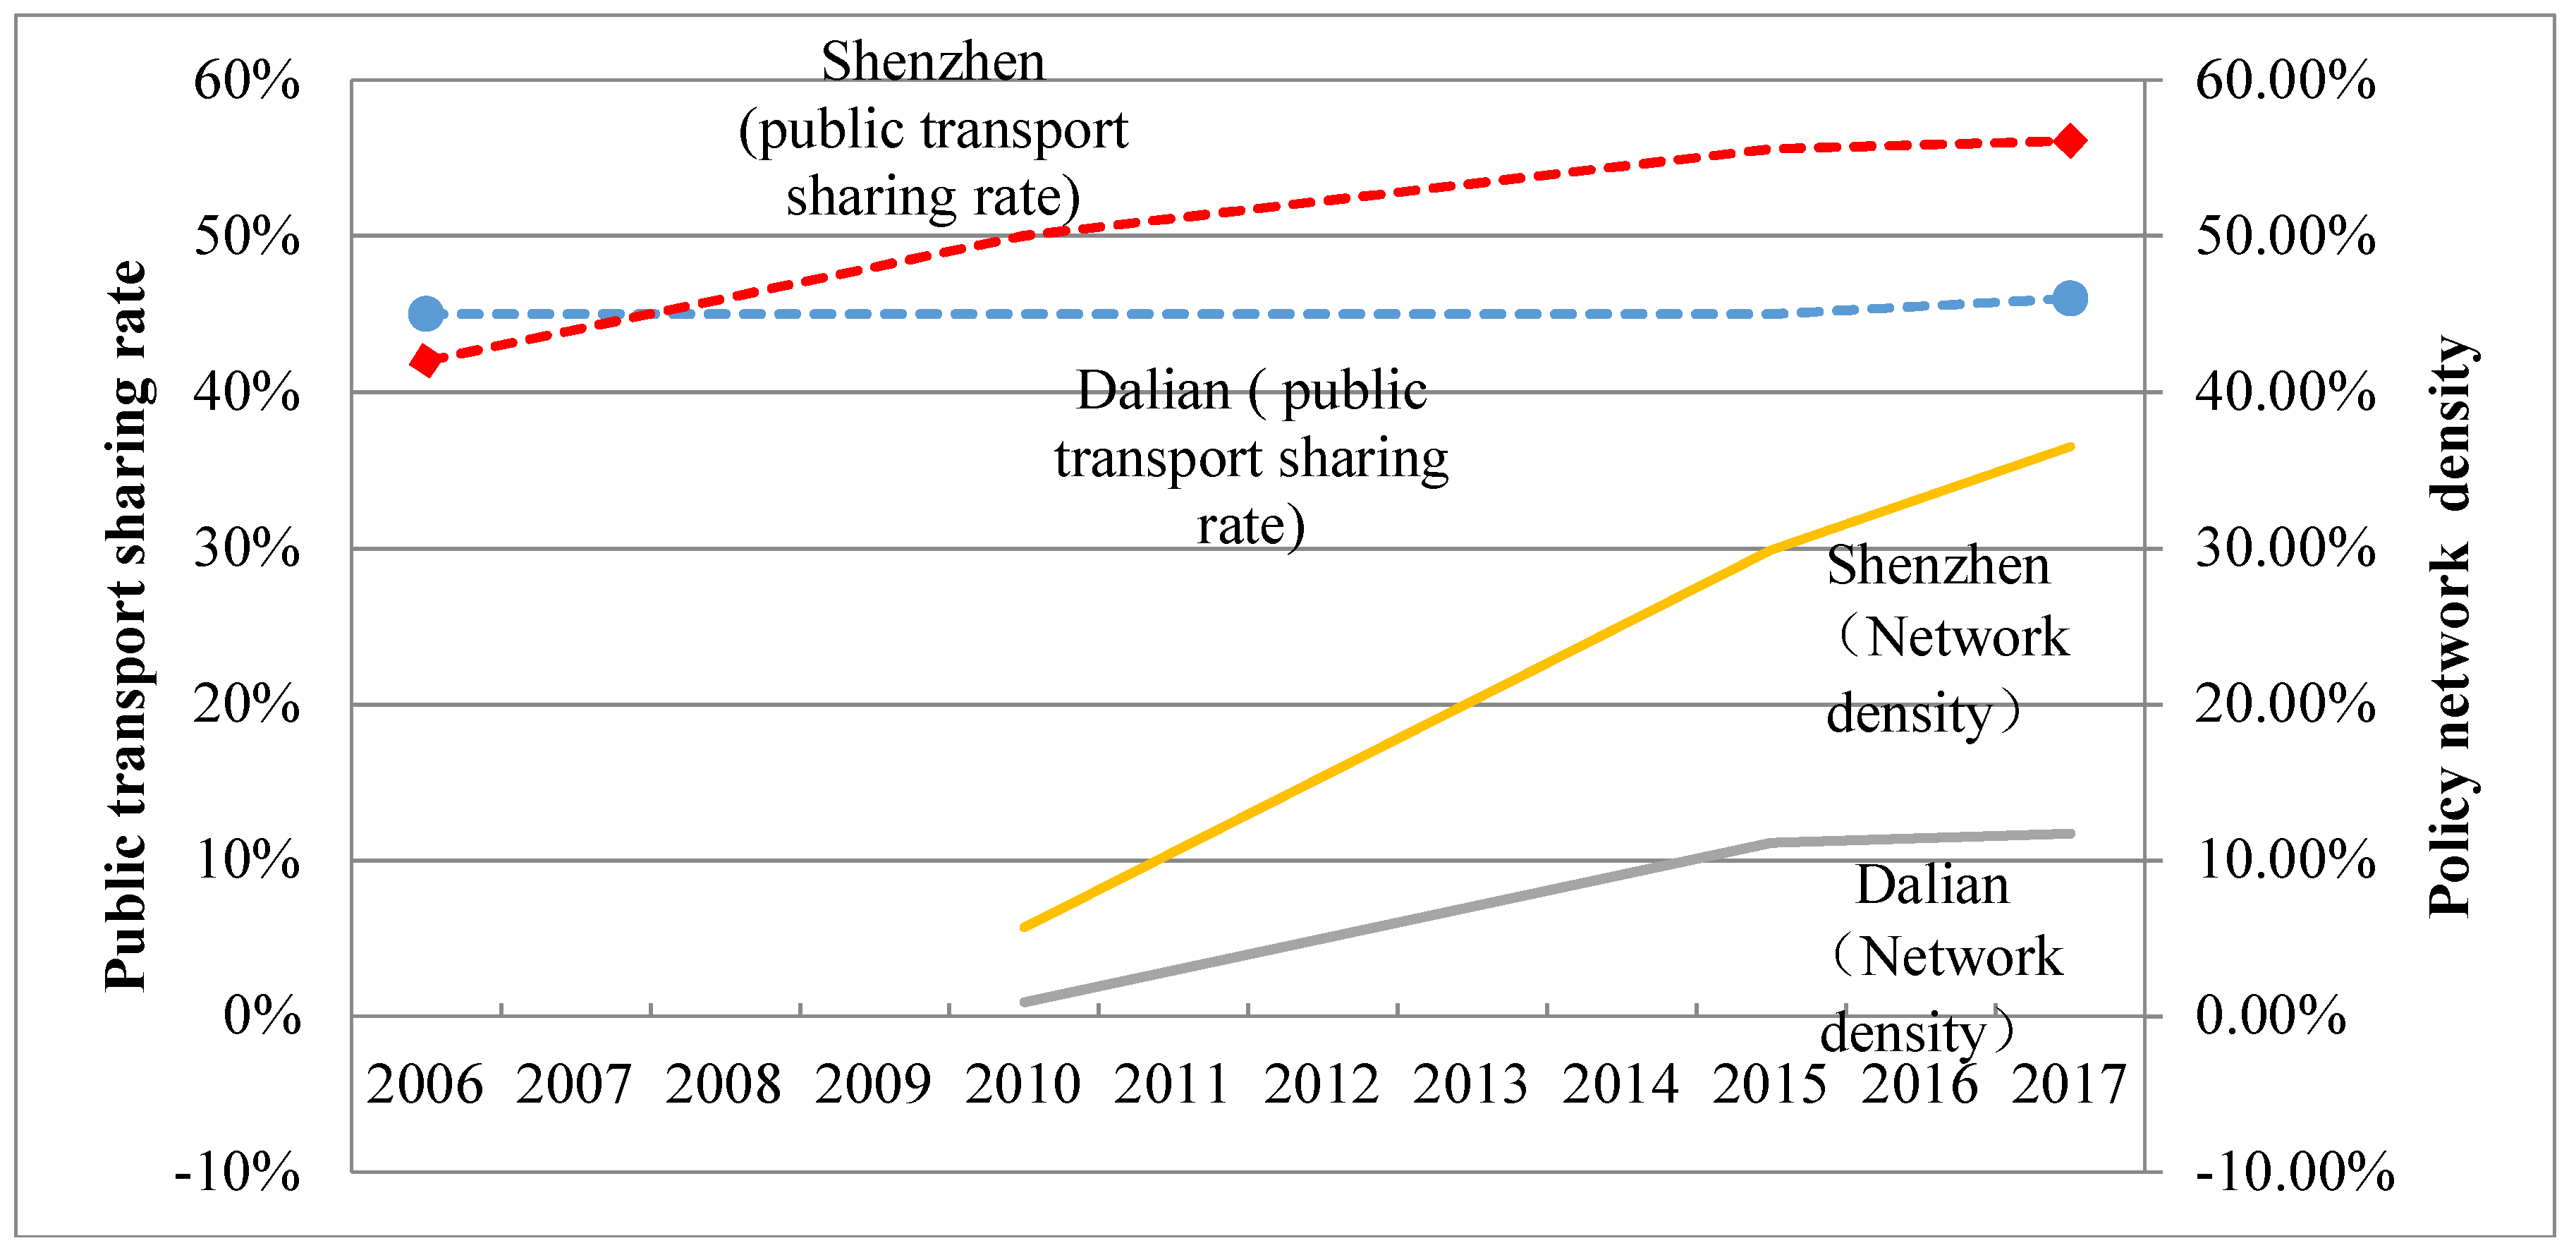
The density, referring to the links between the TDM measures, in Shenzhen is higher than that in Dalian from 2006 to 2017, which means packaging in Shenzhen is more integrative. Figure 8 shows how the density of the packaging network increases and how the percent of the public transport sharing rate continues to grow. Shenzhen achieves a higher public transport sharing rate than Dalian, which could be related to both the stronger focus on public transport measures and the more integrative TDM policies that have been implemented gradually.
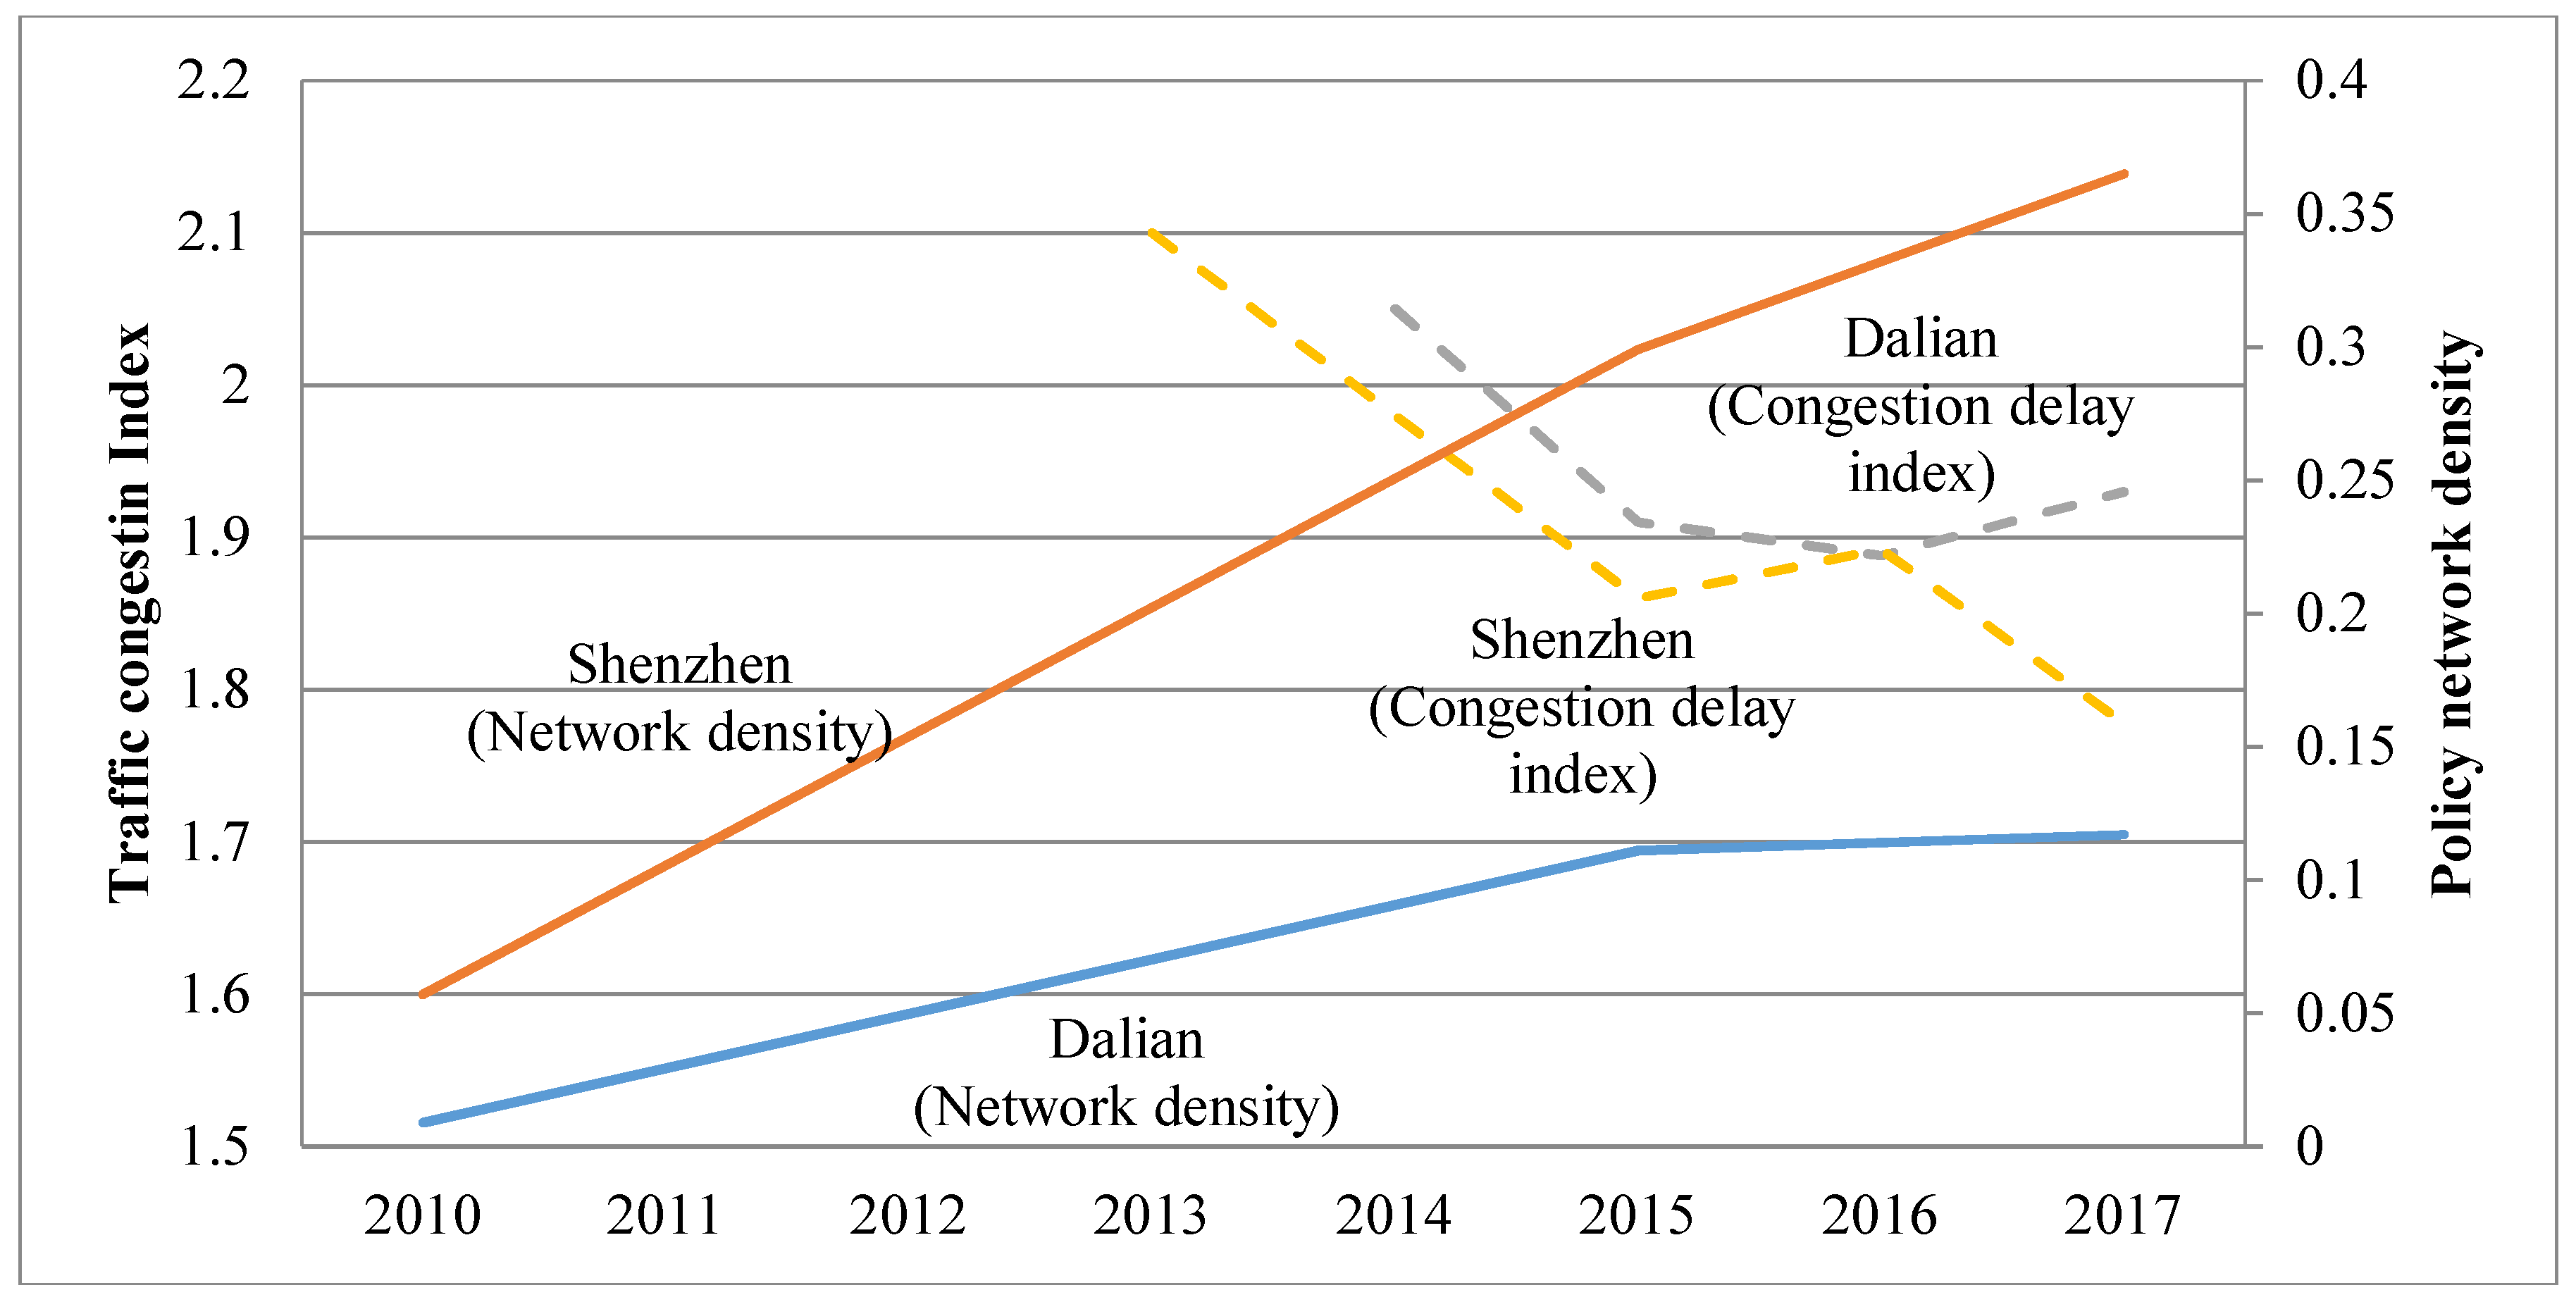
Moreover, Figure 9 shows a significantly decreasing congestion delay index for both cities from 2013 to 2017, at the same time when more policy packaging of TDM is applied in both Dalian and Shenzhen. The decrease is much stronger in Shenzhen, with a stronger focus on policy packaging. Figure 9 also demonstrates the difference in the development of packaging and the slow down after 2015.
As for the different types of TDM measures, Shenzhen continuously enhances public transport, but Dalian tends to put greater focus on private car regulation after 2010 (Figure 5). This can partly explain why the bus sharing rate in Shenzhen increases rapidly, but lags in Dalian.
4.2.3. Conclusions
Above all, the degree of integration of policy packaging is shown to be consistent with the change of performances of transport systems. The cities differ on both the focus on types of measures (on public transport for Shenzhen, and on cars for Dalian), as well as on the level of integration. Although the number of TDM measures increases quickly in both Dalian and Shenzhen, the Shenzhen government integrates these measures much more and seems to achieve higher synergy effects than Dalian. This is likely due to Shenzhen having a more sustainable transport system. Although, we cannot prove to what degree the TDM packaging influences the performance of transport systems, the application presented here shows promise for the analysis of policy packaging by using other quantitative methods based on a much larger dataset.
5. Analysis
The results above demonstrate how this methodology is able to comprehensively capture and analyse the practice of TDM packaging, as such filling a clear gap in the existing literature which just focuses on bundles of isolated TDM measures, or the packaging at one specific time. The methodology includes four dimensions: density, categorization, interaction, and their change with time. Each of them shows one specific character of policy packaging. To be specific, density (refering to the average number of measures in one policy document) illustrates the degree of complexity of one policy, as well as the interaction of measures within one same policy. It could directly reflect to what degree governments put efforts into packaging. The categorization dimension reveals the governments’ preferences of transport measures and the orientation of the packaging’s development. The network dimension shows the interaction of measures from different policies and the key measures supporting, or supported by, other measures. Moreover, changes of these dimensions with time illustrate how packaging develops and when the key window of packaging happens. As these four dimensions describe different aspects of packaging, it is better to analyse them together. Honestly, applications in two cities is limited, but suited the purpose of this paper. The approach looks very scalable, for example, in combination with a Qualitative Comparative Analysis (QCA) approach to support more systematic cross-case analysis.
With this methodology applied in Dalian and Shenzhen, this study shows that both cities have continuously increased the number and the integrity of TDM measures, in order to deal with “wicked” transport issues. This confirms that TDM packaging is widely used in these real-world transport systems. The analysis also illustrates that the development of packaging in two cities is quite different. We find that the Shenzhen government has a more integrated strategy for, and a more stable development of, packaging. It keeps revising and updating measures after 2011, before which various measures were issued, while Dalian adds and pilots more new measures into the existing package. Moreover, Shenzhen continuously focuses on public transport by increasing the number of public-transport-related measures, which is the most compared to other transport modes. In contrast, Dalian shifts to emphasize private car-oriented measures, although Dalian has the largest percent of public transport measures before 2010. We also find the Shenzhen government prefers to integrate single measures into packages. The Shenzhen government regards more, and a wider variety of, measures in one policy document and adopts more, and various, measures to deal with traffic issues as compared to the Dalian government.
Although many contextual factors should be considered, the results at least show that a city, like Shenzhen, which has higher interactions between measures through packaging, could have better performances in the sustainable development of transport. This finding is consistent with Givoni’s argument [27].
6. Discussion and Conclusions
TDM measures are widely used in current transport management, but a single measure or disjoint measures often fail to achieve the multiple goals required of the real-world policies, and it may cause negative effects. Therefore, packaging of TDM measures has received increasing attention from researchers and practitioners. As there is limited research in the assessment of policy packaging in practice and of its influence on transport systems, this article introduces a comprehensive approach to investigate policy packaging from the characteristics of its components (i.e., density, categorization, and interaction) and of its development over time. This approach is applied to study TDM measures and their effects in Dalian and Shenzhen between 2006 and 2017, based on the analysis of policy documents on transportation. The specific aim of this study is (1) to examine the applicability and possible effectiveness of this approach and (2) to describe and compare characteristics of TDM packaging over time in two cities, and to analyse the empirical relation between TDM packaging and performances of transport systems.
Firstly, the results show that this approach is an effective method to capture both overall and specific characteristics of policy packaging, and to compare different packaging. Without analysing complex policy processes, document analysis can be used as a proxy for the manner in which policy packaging is developing. Among the dimensions of this approach, the density reveals how policy documents interrelate different (types of) measures; the categories indicate the direction and possible strategy of packaging, by presenting development of, and links between, different groups of measures; the interaction shows the connecting networks of measures and directly demonstrates the integration of packaging; and the temporal factor enables us to understand how policy packaging keeps changing overtime, which is a vital point of view to analysing the dynamic characteristics of packaging. This method fills the gaps of an efficient approach that can practically measure and compare policy packaging, and also provides an opportunity to analyse the influence of policy packaging on policy performances.
Secondly, we have shown that a city with higher integrative TDM packaging performs better in sustainable transport development, but only based on the comparison between Dalian and Shenzhen. That limited analysis should be extended before we come to definite conclusions, but tentative outcomes are as follows: packaging integration should be one major goal pursued by governments; efforts should be made to enhance the connections between existing measures rather than to issue more, but isolated, ones; and the shift of policy goals or strategies influences the components and integration of packaging. This conclusion remains consistent with the findings of Kern et al. [41].
This methodology does not only work across national contexts, but can also be applied in policies of other disciplines, such as innovation or environment, because the components of the designed methodology (i.e., density, categories, interaction, and time) in this article focus on the features of policy documents themselves, and are not influenced by contextual factors (e.g., geographical and political backgrounds or types of policies). The methodology enables researchers to measure the development of policy packaging in practice and to compare packages across cities or nations. It also, preliminarily, offers evidence that it is useful to analyse the effectiveness of policy packaging by examining the impact of TDM packaging on transport performance.
Clearly, there are limitations to this research. Firstly, the data only comes from secondary sources and some gaps exist in the data, especially for earlier years. Therefore, other kinds of data, such as interviews, could be taken into consideration to further develop the understanding of the outcome of the document analysis and the reality of policy processes. Secondly, the causal relationship between policy packaging and the performance of transport systems is a complex one. Many contextual factors are not included in the current analysis. A combination with a case study analysis could further the understanding of the practice of policy packaging and its effectiveness by interviewing policy-makers and travellers and their experiences with policy packaging. Moreover, more quantitative analysis of a larger dataset could further the understanding of indices of packaging, like what we propose here, and indices of the quality of sustainable transport in a large number of cities. We recommend going in both directions to better understand the potential beneficial effects of policy packaging. Finally, policy packaging not only integrates measures atone horizontal municipal level, but also includes the interaction among different governance levels. In further studies, we will include that aspect and consider the influence of contextual variables.
Author Contributions
W.Y., W.V., and M.d.J. conceived and designed the analysis. W.Y. gathered the data and performed the analysis. W.Y. and W.V. wrote the final manuscript, which was reviewed and approved by W.V. and M.d.J.
Acknowledgments
The authors are grateful for the financial support from the China Scholarship Council (CSC). The authors also thank interviewees from The traffic Police Battalion of the Traffic Police Department of the Dalian Public Security Bureau for providing information of TDM measures.
Conflicts of Interest
The authors declare no conflict of interest.
Appendix A.
Figure A1.
Abbreviations and Categorizations of TDM Measures. (Notes: P, Pedestrian; B, Bicycle; C, Car; PT, Public transport; T, Tax; c, campaign and education; r, regulation; e, economic measures; s, services; and f, facilities).
Figure A1.
Abbreviations and Categorizations of TDM Measures. (Notes: P, Pedestrian; B, Bicycle; C, Car; PT, Public transport; T, Tax; c, campaign and education; r, regulation; e, economic measures; s, services; and f, facilities).

References
- Hassan, A.M.; Lee, H. Toward the sustainable development of urban areas: An overview of global trends in trials and policies. Land Use Policy 2015, 48, 199–212. [Google Scholar] [CrossRef]
- Rittel, H.W.J.; Webber, M.M. Dilemmas in a general theory of planning. Policy Sci. 1973, 4, 155–169. [Google Scholar] [CrossRef]
- Geerlings, H.; Stead, D. The integration of land use planning, transport and environment in European policy and research. Transp. Policy 2003, 10, 187–196. [Google Scholar] [CrossRef]
- Banister, D. The sustainable mobility paradigm. Transp. Policy 2008, 15, 73–80. [Google Scholar] [CrossRef]
- Yigitcanlar, T.; Teriman, S. Rethinking sustainable urban development: Towards an integrated planning and development process. Int. J. Environ. Sci. Technol. 2015, 12, 341–352. [Google Scholar] [CrossRef]
- Downs, A. Why Traffic Congestion is Here to Stay…and Will Get Worse. ACCESS Mag. 2004, 1, 19–25. [Google Scholar]
- Duranton, G.; Turner, M.A. The fundamental law of road congestion: Evidence from US cities. Am. Econ. Rev. 2011, 101, 2616–2652. [Google Scholar] [CrossRef]
- Black, C.S.; Schreffler, E.N. Understanding Transport Demand Management and Its Role in Delivery of Sustainable Urban Transport. Transp. Res. Rec. J. Transp. Res. Board 2010, 2163, 81–88. [Google Scholar] [CrossRef]
- Wang, L.; Xu, J.; Qin, P. Will a driving restriction policy reduce car trips?—The case study of Beijing, China. Transp. Res. Part A Policy Pract. 2014, 67, 279–290. [Google Scholar] [CrossRef]
- Givoni, M.; Macmillen, J.; Banister, D.; Feitelson, E. From Policy Measures to Policy Packages. Transp. Rev. 2013, 33, 1–20. [Google Scholar] [CrossRef]
- Howlett, M.; How, Y.P.; del Rio, P. The parameters of policy portfolios: Verticality and horizontality in design spaces and their consequences for policy mix formulation. Environ. Plan. C Gov. Policy 2015, 33, 1233–1245. [Google Scholar] [CrossRef]
- Justen, A.; Fearnley, N.; Givoni, M.; Macmillen, J. A process for designing policy packaging: Ideals and realities. Transp. Res. Part A Policy Pract. 2014, 60, 9–18. [Google Scholar] [CrossRef]
- Dalian Municipal Bureau of Statistics. Dalian Statistical Yearbook 2008. Available online: http://www.yearbookchina.com/navibooklist-N2009030083-1.html (accessed on 27 March 2018).
- Dalian Municipal Bureau of Statistics. Dalian Statistical Yearbook 2016. Available online: http://www.yearbookchina.com/navibooklist-N2017020215-1.html (accessed on 27 March 2018).
- Shenzhen Municipal Bureau of Statistics. Shenzhen Statistical Yearbook 2008. Available online: http://www.yearbookchina.com/navibooklist-N2009030061-1.html (accessed on 27 March 2018).
- Shenzhen Municipal Bureau of Statistics. Shenzhen Statistical Yearbook 2016. Available online: http://www.yearbookchina.com/navibooklist-N2017060065-1.html (accessed on 27 March 2018).
- Meyer, M.D. Demand management as an element of transportation policy: Using carrots and sticks to influence travel behavior. Transp. Res. Part A Policy Pract. 1999, 33, 575–599. [Google Scholar] [CrossRef]
- Bamberg, S.; Schmidt, P. Theory-driven subgroup-specific evaluation of an intervention to reduce private car use. J. Appl. Soc. Psychol. 2001, 31, 1300–1329. [Google Scholar] [CrossRef]
- VonkNoordegraaf, D.; Annema, J.A.; van Wee, B. Policy implementation lessons from six road pricing cases. Transp. Res. Part A Policy Pract. 2014, 59, 172–191. [Google Scholar] [CrossRef]
- Stewart, G.; Pringle, R. Toronto’s tentative approach to TDM. Energy Policy 1997, 25, 1203–1212. [Google Scholar] [CrossRef]
- Gärling, T.; Schuitema, G. Travel demand management targeting reduced private car use: Effectiveness, public acceptability and political feasibility. J. Soc. Issues 2007, 63, 139–153. [Google Scholar] [CrossRef]
- Santos, G.; Behrendt, H.; Teytelboym, A. Part II: Policy instruments for sustainable road transport. Res. Transp. Econ. 2010, 28, 46–91. [Google Scholar] [CrossRef]
- Eriksson, L.; Garvill, J.; Nordlund, A.M. Acceptability of single and combined transport policy measures: The importance of environmental and policy specific beliefs. Transp. Res. Part A Policy Pract. 2008, 42, 1117–1128. [Google Scholar] [CrossRef]
- Kingham, S.; Dickinson, J.; Copsey, S. Travelling to work: Will people move out of their cars. Transp. Policy 2001, 8, 151–160. [Google Scholar] [CrossRef]
- Loukopoulos, P.; Gärling, T.; Vilhelmson, B. Mapping the potential consequences of car-use reduction in urban areas. J. Transp. Geogr. 2005, 13, 135–150. [Google Scholar] [CrossRef]
- Taylor, C.; Nozick, L.; Meyburg, A. Selection and Evaluation of Travel Demand Management Measures. Transp. Res. Rec. J. Transp. Res. Board 1997, 1598, 49–60. [Google Scholar] [CrossRef]
- Givoni, M. Addressing transport policy challenges through policy-packaging. Transp. Res. Part A Policy Pract. 2014, 60, 1–8. [Google Scholar] [CrossRef]
- Graham-Rowe, E.; Skippon, S.; Gardner, B.; Abraham, C. Can we reduce car use and, if so, how? A review of available evidence. Transp. Res. Part A Policy Pract. 2011, 45, 401–418. [Google Scholar] [CrossRef]
- Herring, H.; Roy, R. Technological innovation, energy efficient design and the rebound effect. Technovation 2007, 27, 194–203. [Google Scholar] [CrossRef]
- Del Mistro, R.; Behrens, R.; Lombard, M.; Venter, C. The Pace of Behaviour Change and Implications for Tdm Response Lags and Monitoring: Findings of a Retrospective Commuter Travel Survey in Cape Town. In Proceedings of the 26th Southern African Transport Conference (SATC 2007), Pretoria, South Africa, 9–12 July 2007; pp. 475–486. [Google Scholar]
- Tønnesen, A. Policy packages and state engagement: Comparing car-use reduction policy in two Norwegian cities. J. Transp. Geogr. 2015, 46, 89–98. [Google Scholar] [CrossRef]
- Lehmann, P. Justifying a policy mix for pollution control: A review of economic literature. J. Econ. Surv. 2012, 26, 71–97. [Google Scholar] [CrossRef] [Green Version]
- Rogge, K.S.; Reichardt, K. Policy mixes for sustainability transitions: An extended concept and framework for analysis. Res. Policy 2016, 45, 1620–1635. [Google Scholar] [CrossRef]
- Doremus, H. A policy portfolio approach to biodiversity protection on private lands. Environ. Sci. Policy 2003, 6, 217–232. [Google Scholar] [CrossRef]
- Hekkert, M.P.; Suurs, R.A.A.; Negro, S.O.; Kuhlmann, S.; Smits, R.E.H.M. Functions of innovation systems: A new approach for analysing technological change. Technol. Forecast. Soc. Chang. 2007, 74, 413–432. [Google Scholar] [CrossRef]
- Kern, F.; Howlett, M. Implementing transition management as policy reforms: A case study of the Dutch energy sector. Policy Sci. 2009, 42, 391–408. [Google Scholar] [CrossRef]
- Tuominen, A.; Tapio, P.; Varho, V.; Järvi, T.; Banister, D. Pluralistic backcasting: Integrating multiple visions with policy packages for transport climate policy. Futures 2014, 60, 41–58. [Google Scholar] [CrossRef]
- Taeihagh, A. Network-centric policy design. Policy Sci. 2017, 50, 317–338. [Google Scholar] [CrossRef]
- Filipe, L.N.; Macário, R. Policy packaging in BRT projects: A methodology for case study analysis. Res. Transp. Econ. 2014, 48, 152–158. [Google Scholar] [CrossRef]
- Davoudi, S.; Sturzaker, J. Urban form, policy packaging and sustainable urban metabolism. Resour. Conserv. Recycl. 2017, 120, 55–64. [Google Scholar] [CrossRef]
- Kern, F.; Kivimaa, P.; Martiskainen, M. Policy packaging or policy patching? The development of complex energy efficiency policy mixes. Energy Res. Soc. Sci. 2017, 23, 11–25. [Google Scholar] [CrossRef]
- Sørensen, C.H.; Isaksson, K.; Macmillen, J.; Åkerman, J.; Kressler, F. Strategies to manage barriers in policy formation and implementation of road pricing packages. Transp. Res. Part A Policy Pract. 2014, 60, 40–52. [Google Scholar] [CrossRef]
- May, P.J. Hints for crafting alternative policies. Policy Anal. 1981, 7, 227–244. [Google Scholar]
- Howlett, M. Designing Public Policies: Principles and Instruments; Routledge: London, UK, 2010; ISBN 1136879005. [Google Scholar]
- Scott, J. Social Network Analysis: A Handbook, 4th ed.; SAGE: New York, NY, USA, 2017. [Google Scholar]
- Drew, R.; Aggleton, P.; Chalmers, H.; Wood, K. Using social network analysis to evaluate a complex policy network. Evaluation 2011, 17, 383–394. [Google Scholar] [CrossRef]
- Otte, E.; Rousseau, R. Social network analysis: A powerful strategy, also for the information sciences. J. Inf. Sci. 2002, 28, 441–453. [Google Scholar] [CrossRef]
- Davies, R. The use of social network analysis tools in the evaluation of social change communications. An Expanded M&E Framework for Socal Change Communication. 2009. Available online: https://richardjdavies.files.wordpress.com/2009/08/the-use-of-social-network-analysis-tools-in-the-evaluation-of-social-change-communications-c.pdf (accessed on 1 May 2018).
- De Nooy, W.; Mrvar, A.; Batagelj, V. Exploratory Social Network Analysis with Pajek; Cambridge University Press: Cambridge, UK, 2011; Volume 27, ISBN 1139501089. [Google Scholar]
- Reagans, R.; McEvily, B. Network structure and knowledge transfer: The effects of cohesion and range. Adm. Sci. Q. 2003, 48, 240–267. [Google Scholar] [CrossRef]
- Bardach, E.; Patashnik, E.M. A Practical Guide for Policy Analysis: The Eightfold Path to More Effective Problem Solving; CQ Press: Washington, DC, USA, 2015; ISBN 1483359476. [Google Scholar]
- Eads, G.C. Indicators of Sustainable Mobility; World Business Council for Sustainable Development (WBCSD): Geneva, Switzerland, 2001. [Google Scholar]
- Gilbert, R.; Irwin, N.; Hollingworth, B.; Blais, P. Sustainable Transportation Performance Indicators (STPI); Transportation Research Board (TRB). Available online: http://citeseerx.ist.psu.edu/viewdoc/download?doi=10.1.1.661.7698&rep=rep1&type=pdf (accessed on 1 May 2018).
- Gaode Map. Main Chinese Municipals Transport Report 2016. Available online: https://report.amap.com/share.do?id=8a38bb865986fdfd0159870377260001 (accessed on 27 March 2018).
- Yin, R.K. Case Study Research: Design and Methods; SAGE: New York, NY, USA, 2013. [Google Scholar]
- MAXQDA, Software for Qualitative Data Analysis; Version 12.0; VERBI Software—Consult—Sozialforschung GmbH: Berlin, Germany, 2015.
- IBM Corp. IBM SPSS Statistics for Windows; Version 22.0; IBM Corp.: Armonk, NY, USA, 2013. [Google Scholar]
- Borgatti, S.P. NetDraw Software for Network Visualization; Analytic Technologies: Lexington, KY, USA, 2002. [Google Scholar]
Figure 1.
Density of TDM measures.

Figure 2.
The development of Shenzhen’s TDM measures, mainly from 2006 to 2015.

Figure 3.
The development of Dalian’s TDM measures, mainly from 2006 to 2015.

Figure 4.
TDM categories by approaches to changing behaviours.

Figure 5.
TDM categories by transport modes.

Figure 6.
Maps of TDM packaging networks in Dalian from 2006 to 2010 (a); from 2011to2015 (b); and from 2016to2017 (c).
Figure 6.
Maps of TDM packaging networks in Dalian from 2006 to 2010 (a); from 2011to2015 (b); and from 2016to2017 (c).

Figure 7.
Maps of TDM packaging networks in Shenzhen from 2006 to 2010 (a); from 2011to2015 (b); and from 2016to2017 (c).
Figure 7.
Maps of TDM packaging networks in Shenzhen from 2006 to 2010 (a); from 2011to2015 (b); and from 2016to2017 (c).

Figure 8.
Public transport sharing rate and policy network density.

Figure 9.
Congestion delay index and policy network density.


Table 1.
Dimensions of TDM packaging.
| Dimensions | Explanations |
|---|---|
| Density | The average occurrence of TDM measures |
| Categorization | The occurrence of each categorization of TDM measures |
| Interaction | The co-occurrence of two TDM measures |
| Time | Changes of density, categorizations and interaction |
Table 2.
Indicators of transport performance.
| Indicator | Explanation |
|---|---|
| Public transport sharing rate | The percentage of public transport trips in total trips |
| Congestion delay index | The quotient of free travel time divided by average travel time |
Table 3.
Summary of TDM measures in Dalian and Shenzhen from 2006 to 2017.
| Summary | City | 2006–2010 | 2011–2015 | 2016–2017 | Total |
|---|---|---|---|---|---|
| Policy documents | Dalian | 10 | 17 | 4 | 31 |
| Shenzhen | 10 | 19 | 13 | 42 | |
| Intensity of TDM | Dalian | 23 | 82 | 12 | 117 |
| Shenzhen | 47 | 117 | 48 | 212 | |
| Density of TDM | Dalian | 2,3 | 4,8 | 3,0 | 3,8 |
| Shenzhen | 4,7 | 6,2 | 3,7 | 5,0 |
Table 4.
Types of TDM measures.
| Type | City | 2006–2010 | 2011–2015 | 2016–2017 | Total |
|---|---|---|---|---|---|
| Types of TDM | Dalian | 19 | 22 | 3 | 44 |
| Shenzhen | 15 | 17 | 3 | 35 |
Table 5.
Top 10 core TDM measures in packaging networks.
| Dalian | Shenzhen | ||||
|---|---|---|---|---|---|
| 2006–2010 | 2011–2015 | 2016–2017 | 2006–2010 | 2011–2015 | 2016–2017 |
| PTf3 | PTc | PTc | PTf2 | PTs1 | PTs1 |
| PTr3 | Cf3 | Cf1 | PTf3 | Bs1 | Bs1 |
| PTs7 | Ce9 | PTs1 | PTc | PTf3 | PTf3 |
| PTf2 | Cf2 | PTf3 | PTr3 | Ce9 | Ce9 |
| PTc | Tc | PTf2 | PTe1 | PTf2 | PTf2 |
| PTe1 | Cr2 | Cc | PTs7 | PTe1 | PTe1 |
| Cf1 | Bc | Pc | Tc | Cf2 | Cf2 |
| Ce9 | Cs2 | Cf3 | Cf1 | PTs2 | PTs2 |
| Tc | Cs1 | Tc | Ce9 | Ps1 | Ps1 |
| Ts | Cr6 | Cr2 | - | PTs3 | PTs3 |
Table 6.
Top 10 high-frequency TDM measures in packaging networks.
| Dalian | Shenzhen | ||||
|---|---|---|---|---|---|
| 11th | 12th | 13th | 11th | 12th | 13th |
| Cc | PTf1 | PTe1 | Cr3 | PTs2 | PTs2 |
| Cf1 | Ce2 | Ps | PTe | Bs2 | Bs2 |
| PTr3 | Cr2 | PTs7 | PTs | Cs | Br |
| PTs6 | Ce7 | Br2 | PTs2 | PTs | Cs |
| PTf2 | PTf | PTf | PTf3 | Br | PTs |
| Cr6 | Cc | Pf1 | Br | Cr3 | PTr |
| Ce9 | Cf4 | Cr | Cf4 | PTr | PTf3 |
| Cs2 | PTs4 | Cf | PTr | PTf3 | Be |
| PTc | PTc | PTc | PTs3 | Bf | Bf2 |
| Pte1 | Ce3 | Pf | PTf | PTf | Cr3 |
© 2018 by the authors. Licensee MDPI, Basel, Switzerland. This article is an open access article distributed under the terms and conditions of the Creative Commons Attribution (CC BY) license (http://creativecommons.org/licenses/by/4.0/).
Share and Cite
MDPI and ACS Style
Yang, W.; Veeneman, W.; De Jong, M. Transport Demand Management Policy Integration in Chinese Cities: A Proposed Analysis of Its Effects. Energies 2018, 11, 1126. https://0-doi-org.brum.beds.ac.uk/10.3390/en11051126
AMA Style
Yang W, Veeneman W, De Jong M. Transport Demand Management Policy Integration in Chinese Cities: A Proposed Analysis of Its Effects. Energies. 2018; 11(5):1126. https://0-doi-org.brum.beds.ac.uk/10.3390/en11051126
Chicago/Turabian StyleYang, Wei, Wijnand Veeneman, and Martin De Jong. 2018. "Transport Demand Management Policy Integration in Chinese Cities: A Proposed Analysis of Its Effects" Energies 11, no. 5: 1126. https://0-doi-org.brum.beds.ac.uk/10.3390/en11051126
Note that from the first issue of 2016, this journal uses article numbers instead of page numbers. See further details here.