Feasibility of a 100 MW Installed Capacity Wind Farm for Different Climatic Conditions


1
Faculty of Mechanical Engineering, TU Bergakademie, 09599 Freiberg, Germany
2
Center for Engineering Research, Research Institute, King Fahd University of Petroleum and Minerals, Dhahran 31261, Saudi Arabia
3
Institute for Turbulence-Noise-Vibration Interaction and Control, Shenzhen Graduate School, Harbin Institute of Technology, Shenzhen 518055, China
*
Author to whom correspondence should be addressed.
Energies 2018, 11(8), 2147; https://0-doi-org.brum.beds.ac.uk/10.3390/en11082147
Submission received: 24 July 2018
/
Revised: 14 August 2018
/
Accepted: 15 August 2018
/
Published: 17 August 2018
Abstract
:Wind power is the world’s fastest-growing energy source. More power can be generated from wind energy through the use of new wind machine designs and techniques. The objective of the present work is to encourage people and governments to develop wind energy-based power plants to achieve sustainable energy infrastructures, especially in developing countries. In this paper, a feasibility study of a 100 MW grid-connected wind farm is conducted for five different cities of Saudi Arabia (KSA). The results indicate that the proposed power plant is feasible both technically and economically. All sites are found to be within the profitable range with Dhahran being the most feasible site among the others for the installation of the wind farm. A sensitivity analysis has also been carried out to find out the effects of different incentives on the payback period of the project.
1. Introduction
Due to the growing environmental concerns, fast depletion of primary energy resources, escalating energy costs, and adverse climatic changes, the focus on the utilization of renewable and clean sources of energy has increased significantly. The renewable sources of energy mainly include wind, solar photovoltaic, solar thermal, large and small hydro, geothermal, biomass, and wave power. Among these sources of clean energy, wind and solar are commercially accepted and economically at par with conventional means. They are both being currently used worldwide. Wind energy is proved to be an economically acceptable and reliable source of energy [1]. The generation of wind power has an edge over other renewable energy technologies because of its simple infrastructure, technological maturity, and low-cost energy generation. Furthermore, the ease of installation and maintenance, long life of wind turbines, minimum time required for the installation and operation after site assessment have led to the fast growth of regional and global wind power. The use of wind energy to meet load demands is expected to play important role in the future worldwide energy scenarios [2].
Additionally, switching from fossil fuels to renewable energy (e.g., wind power resources) promotes energy security, while likewise addressing issues such as global warming and economic growth of a country [3]. Renewable energy contributes to energy resilience through its decentralized structure that can help to lessen the burden on economy of a developing country. According to Fang [4], an increase of renewable energy consumption by 1% drives a growth of real gross domestic products (GDP) by 0.120%, GDP per capita by 0.162%, per capita annual income of rural households by 0.444%, and per capita annual income of urban households by 0.368%. The integration of renewable energy technologies will not only eliminate the power shortage issues but also create new job opportunities. According to IRENA, about 8.1 million jobs were generated though implementation and development of renewable technologies across the world in year 2015. In this way development of wind energy farms as a replacement of fossil fuel operated power plants will have a positive effect on the economic growth of a country like Saudi Arabia.
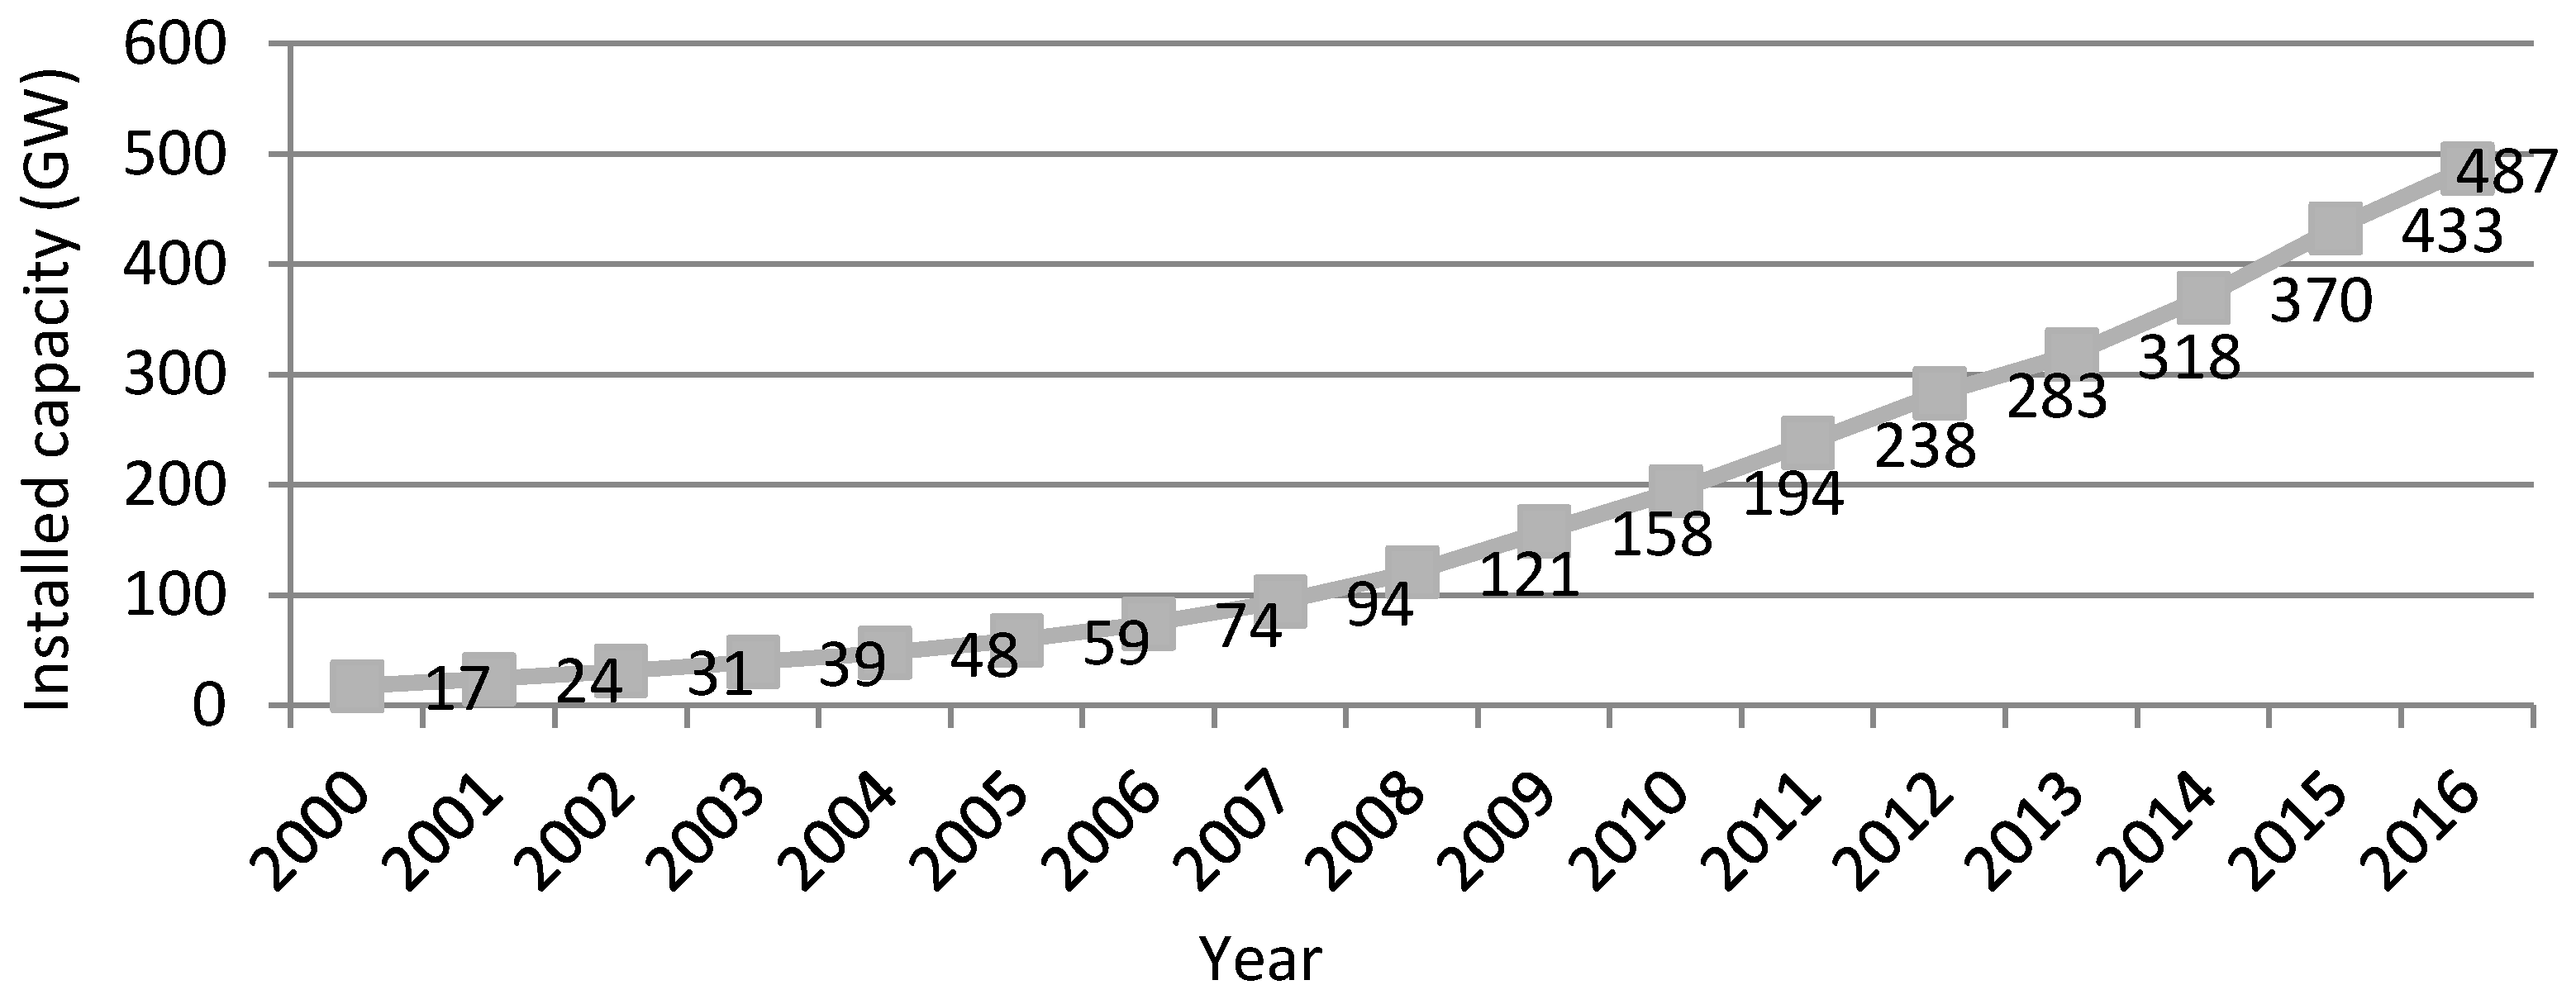
Modern technological developments have led to much advancement in wind power. The wind energy technology is the world’s fastest-growing energy option [5]. More power can be generated from wind energy by adopting new design and techniques of wind energy machines [6]. In the last two decades, the global wind power installed capacity has rapidly increased which is a clear indicative of an increasing role of wind power in fulfilling the future energy demands. An average annual growth of 104% in wind power comes into being over the last 10-year period as can be observed from Figure 1, [7]. In 2016 the global wind power installed capacity rose by 12.5% compared to that in 2015 (Figure 2). China added a total of 23.328 GW wind power in 2016 which is the largest compared with those by any other countries, followed by 8.203 GW by USA.
The initial cost associated with the renewable energy technologies is a major hurdle and disadvantage for promotion and development of these technologies in developing countries. These technologies are beneficial and advantageous when assessed on a long term basis. Site-specific studies are required for the promotion and deployment of wind power technology in the country. Accordingly, the main aim of this paper is to provide a long run scenario of developing wind farms in developing countries like Saudi Arabia. In this paper, a feasibility of a 100-MW grid-tied wind power plant for five different cities in Saudi Arabia has been conducted. The study also aims to partially offset the fossil-fuel based power generation with wind operated power systems. The enviro-economic analysis of installing a wind farm has been investigated by RETScreen software using different performance indicators. The effect of increasing the government incentives and support on the viability of the proposed power system has also been evaluated. The obtained results are important not only for decision makers in the country but also for the continuous development of renewable energy sources in other developing countries.
The paper has been divided into different sections: Section 1 introduces the topic and highlights the major objectives and motivation of this study. The background of wind energy technology with respect to KSA is presented in Section 2; different studies and energy consumption pattern in the country along with environmental concerns are described in detail. The methodology and description of performance indices used are described in Section 3, followed by description and design of wind power system. The obtained results are presented and discussed in Section 4 whereas a summary of achieved results is presented in Section 5.
2. Background
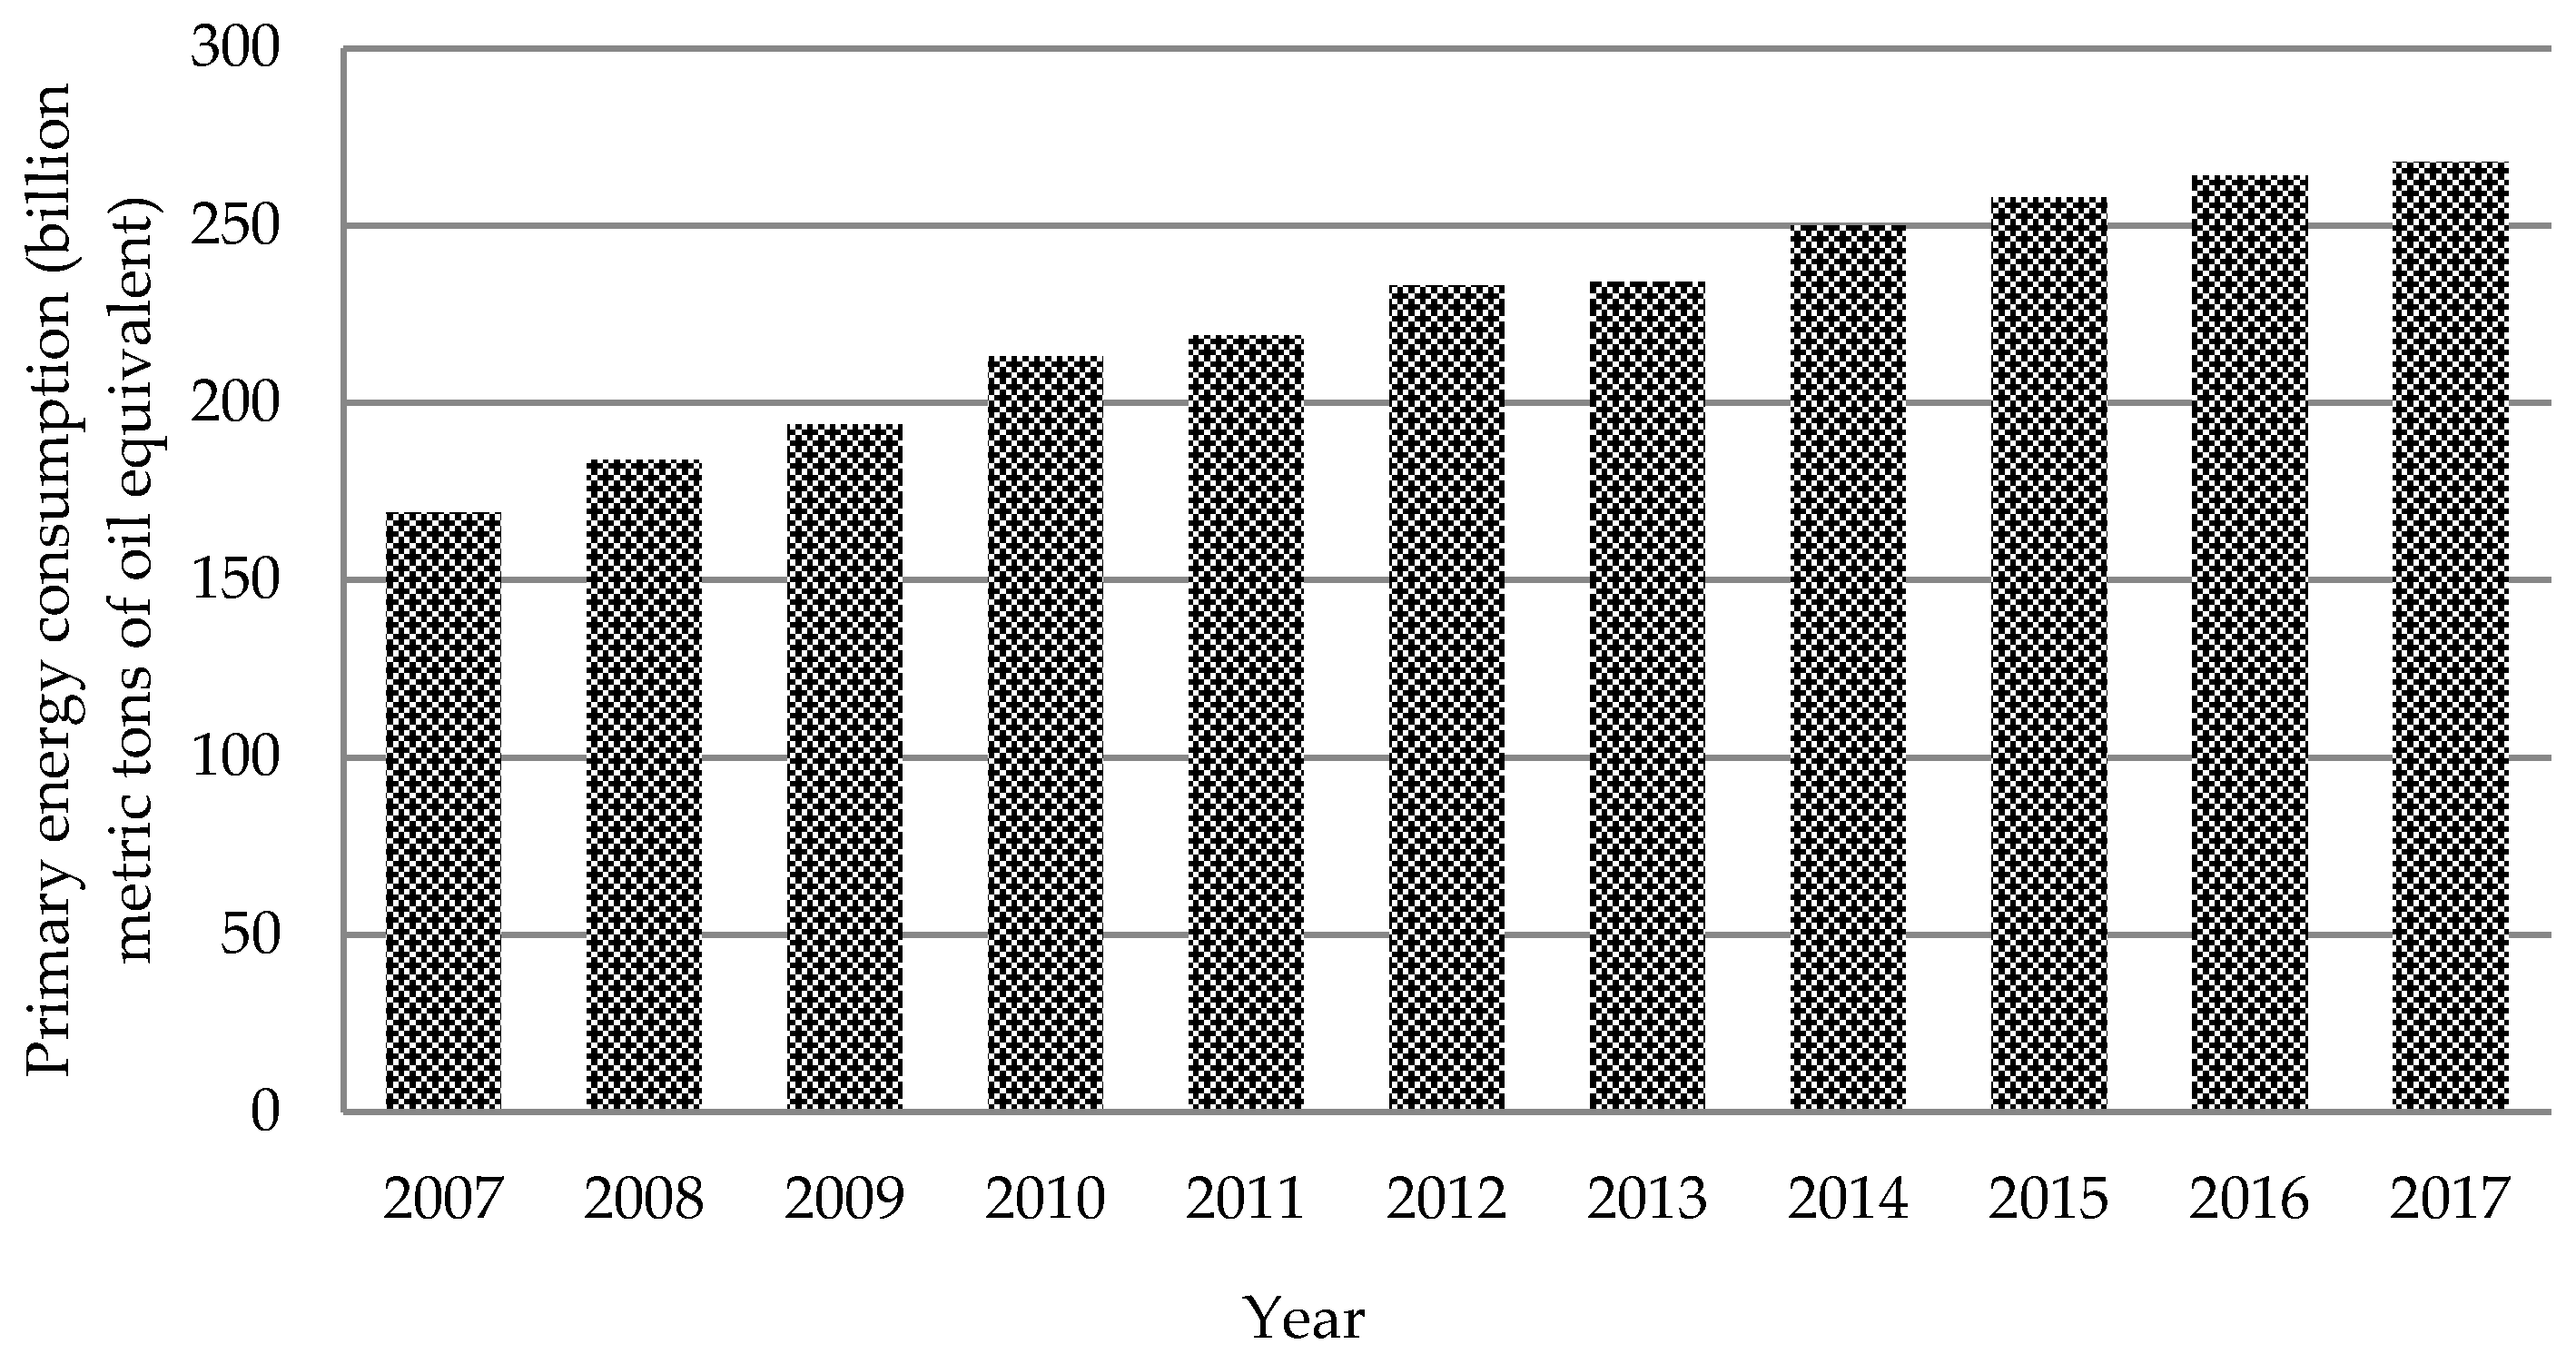
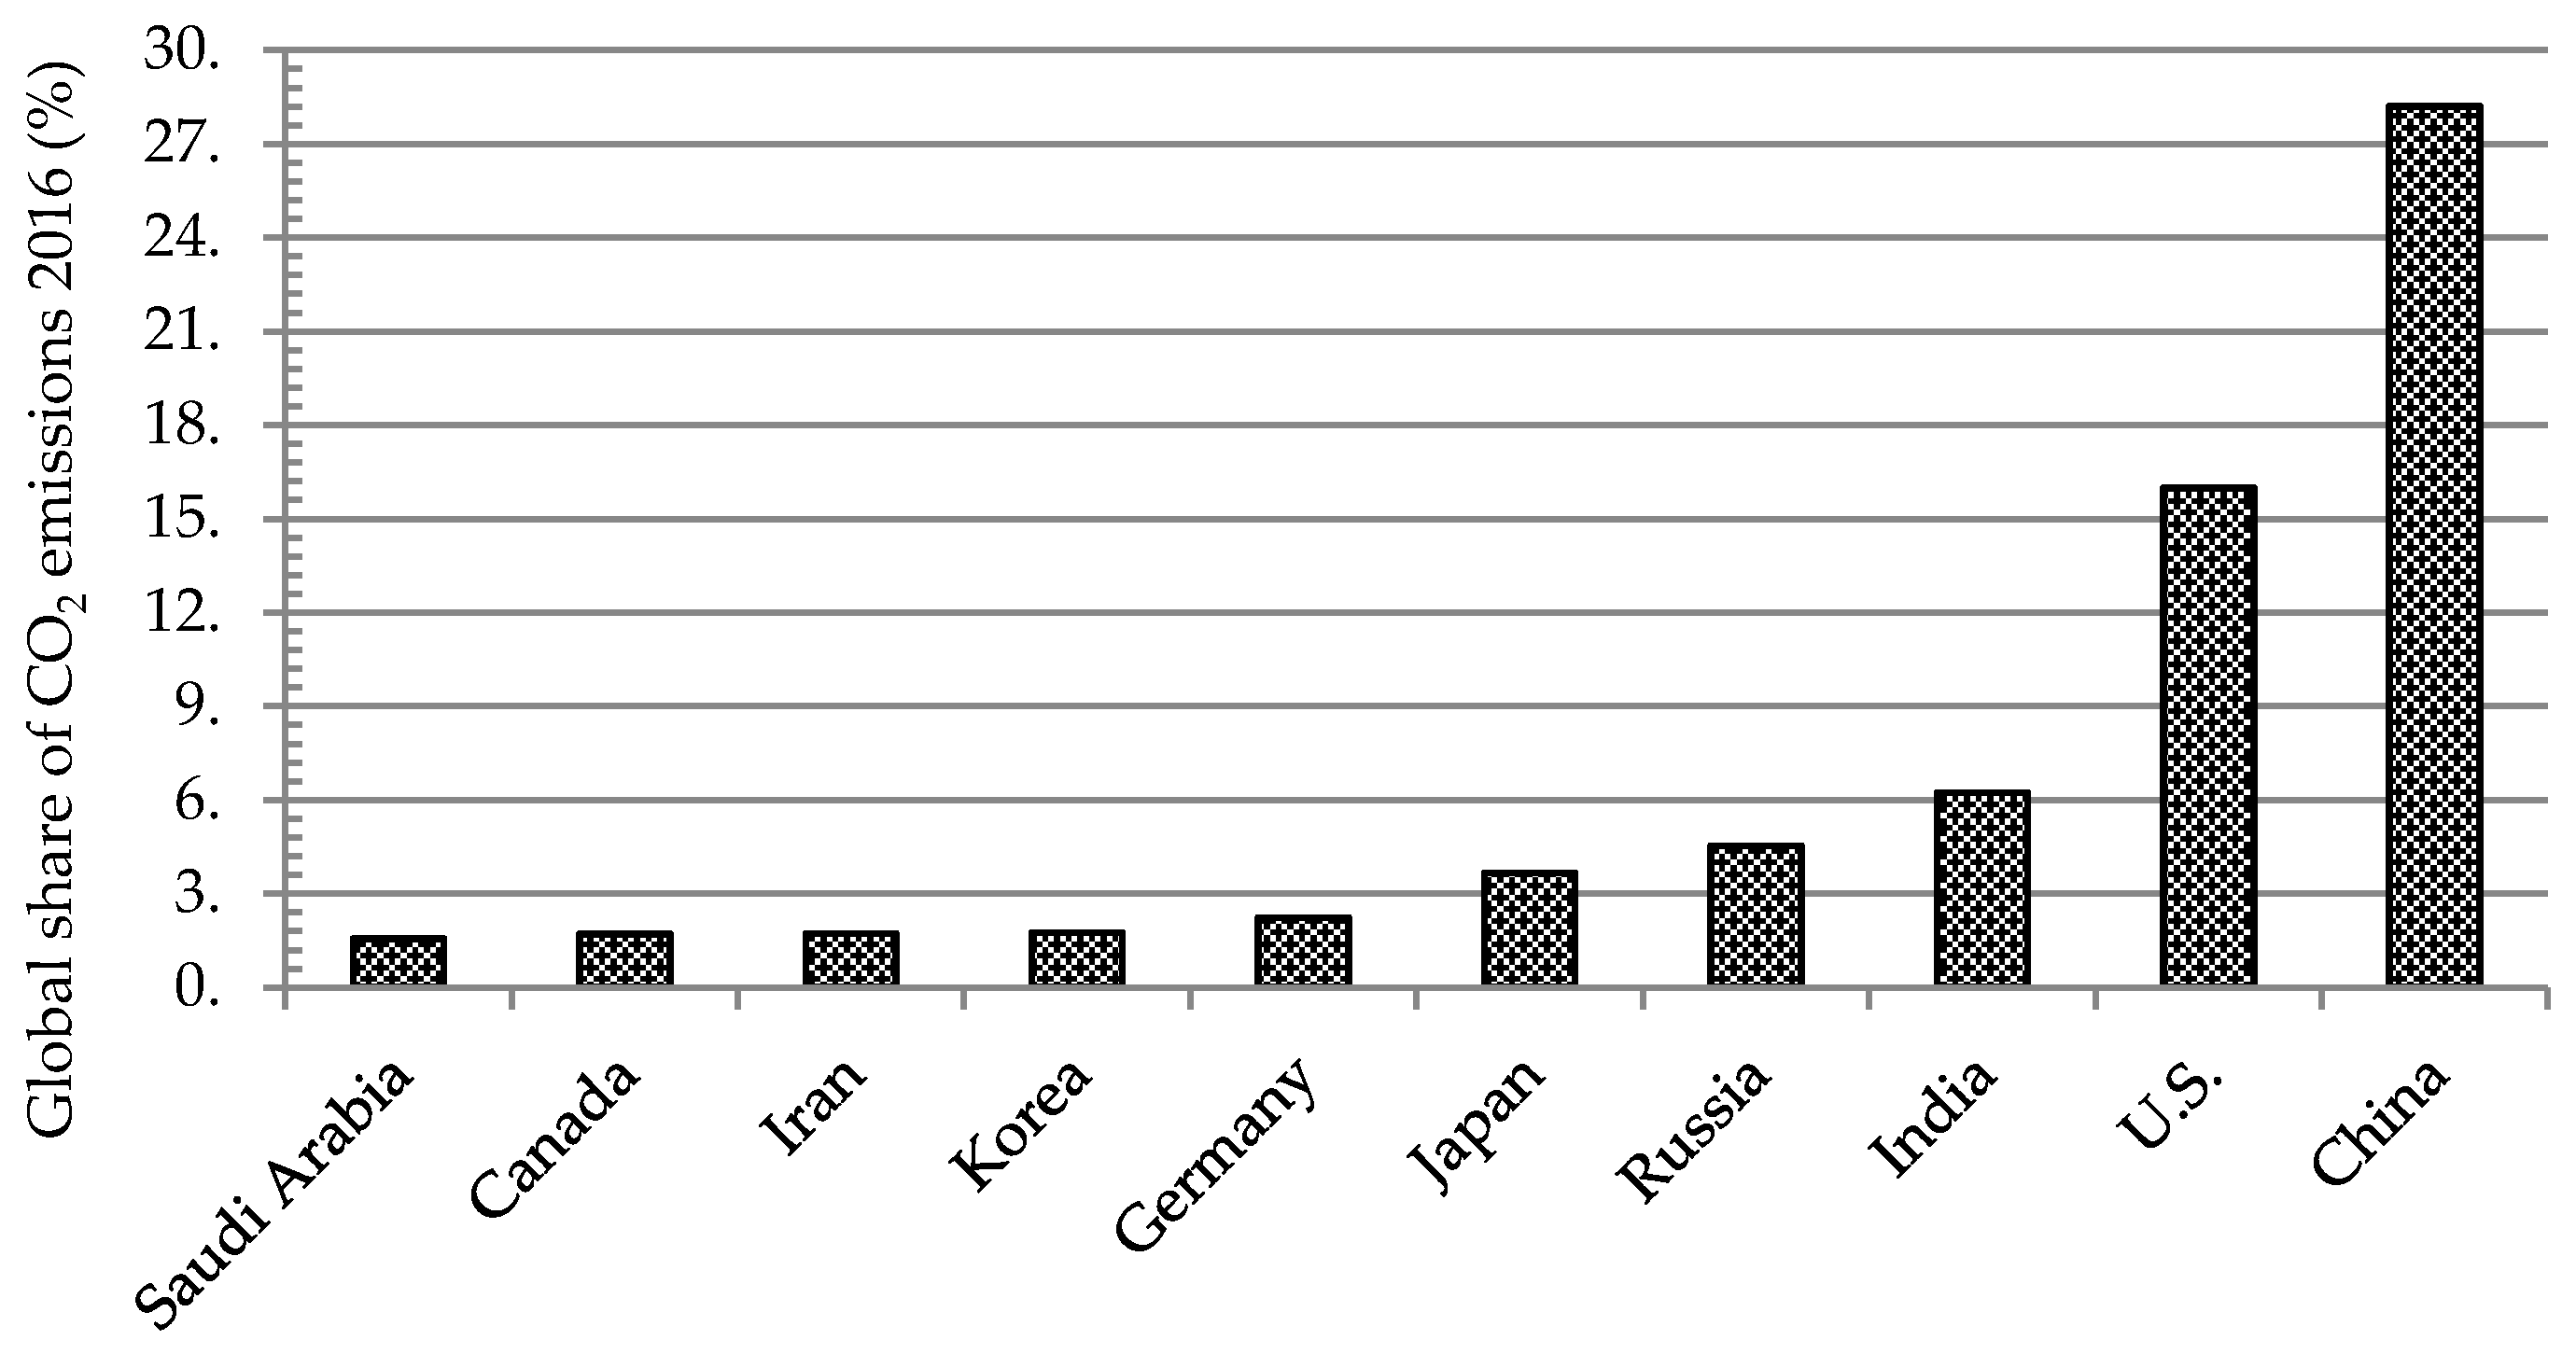
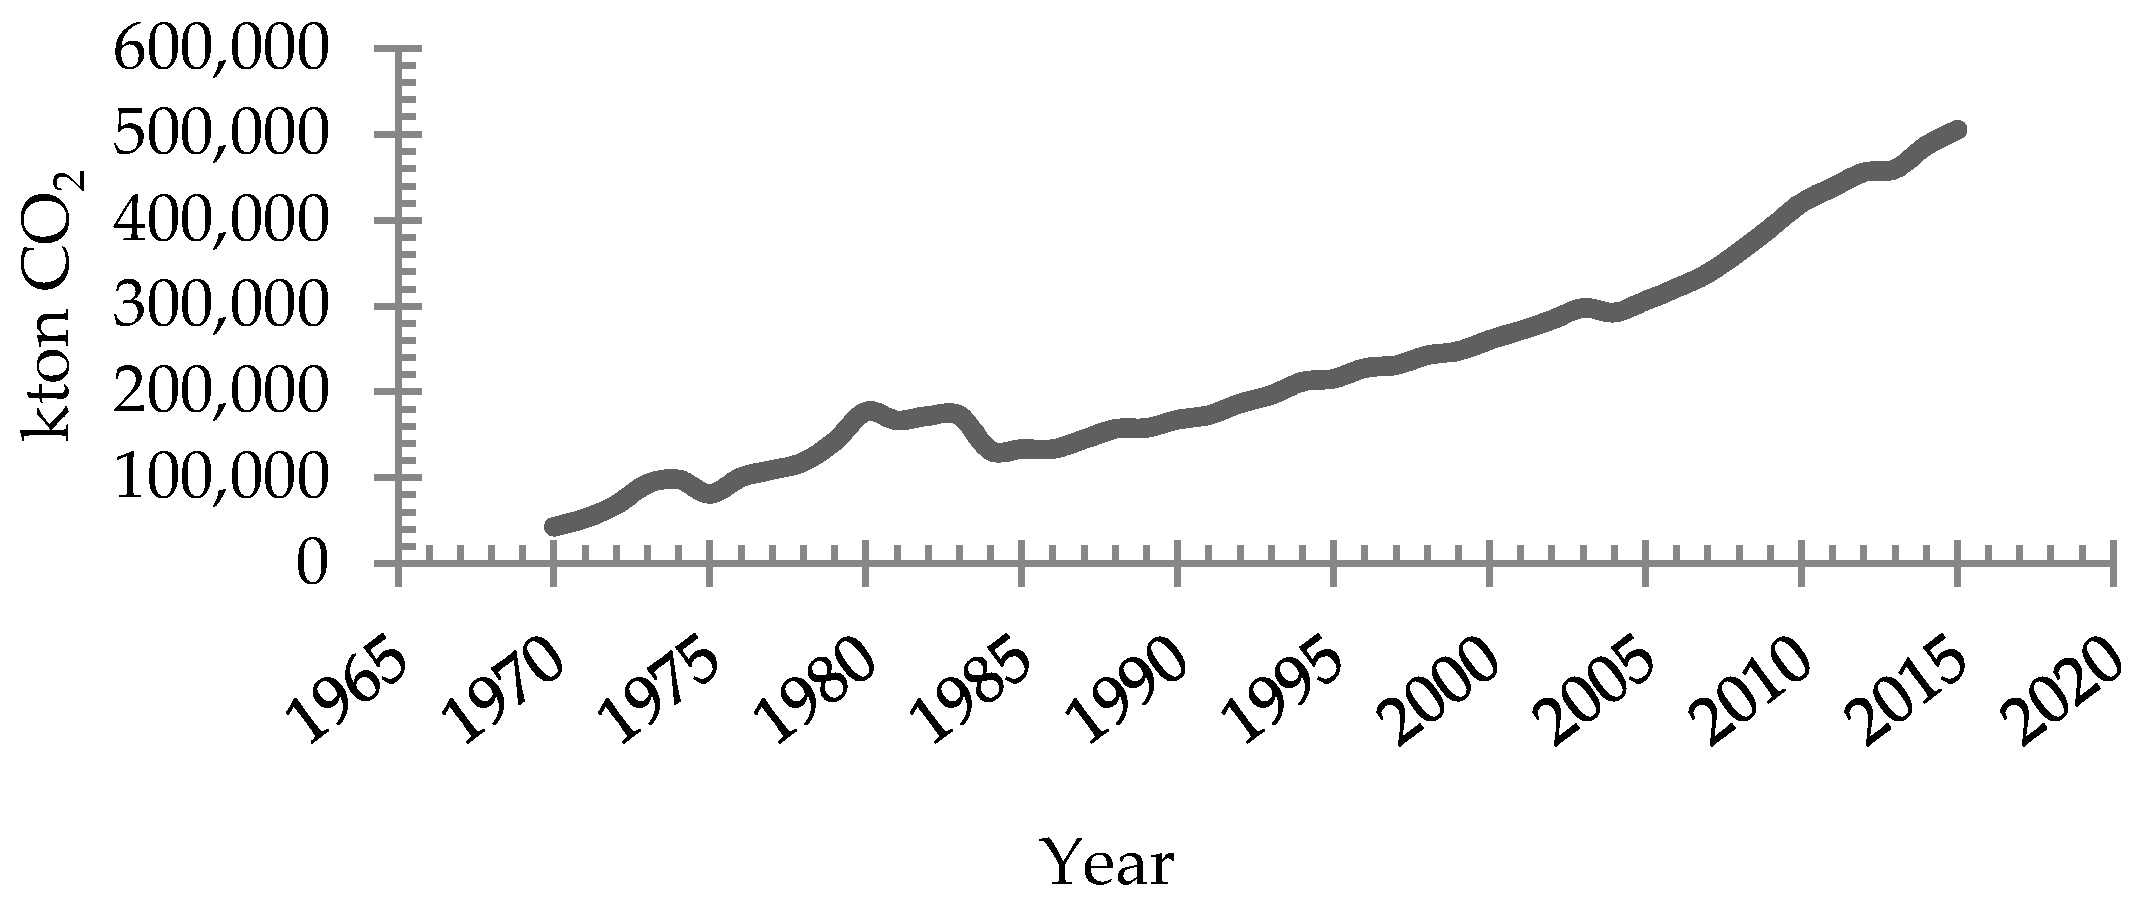
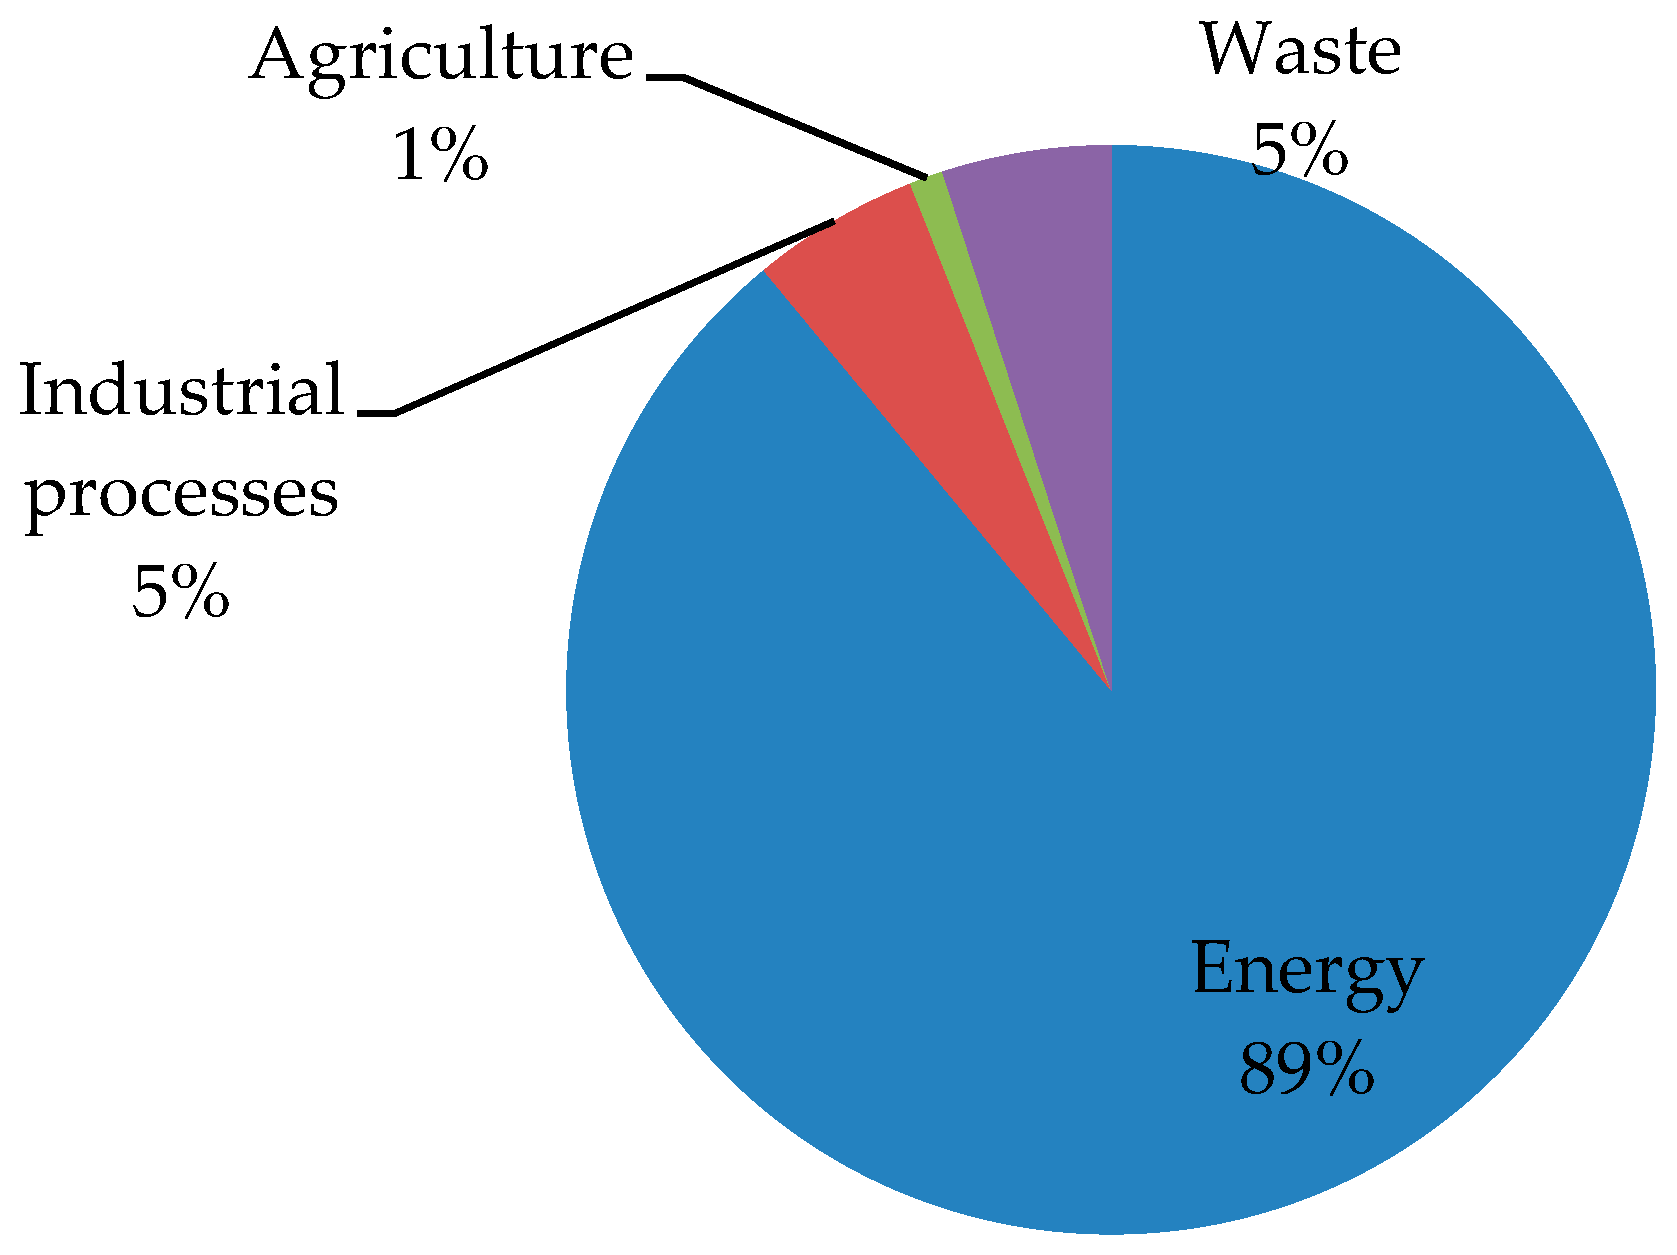
The specific case of Saudi Arabia, where a rapid increase in electricity consumption is leading to technical and economical stress on the utility and the Ministry of Energy, is not an exception. The increasing demand for primary energy in the Kingdom of Saudi Arabia (KSA) is illustrated in Figure 3 [8]. The annual energy consumption was around 169 billion metric ton of oil equivalents in 2007, and reached 268 billion metric ton of oil equivalents in 2017 [8,9]. The comparative greenhouse gas (GHG) emissions for different countries are shown in Figure 4, which indicates the highest emission by China. Saudi Arabia is also among the top ten countries of the world in terms of GHG emissions. The annual growth of GHG emissions in Saudi Arabia is depicted in Figure 5 and shows an increasing trend right from 1970 to 2015 and beyond. The energy sector is also the largest contributor of greenhouse gases (GHG) emissions (~89%) in the country as illustrated in Figure 6 [10].
In order to overcome this rising demands of energy in the country wind energy technology could be beneficial and advantageous, but it is well known that wind power output is not fully dispatchable. This means that it has an uncertainty and randomness problem, which may affect the normal operation of the power system. Thus, quite a lot of research has been done to deal with the uncertainty. At first, the idea of probabilistic forecasting [11,12] has been proposed to quantify the uncertainty of wind power generation. Then, this uncertainty information is also integrated to power system operation and electricity market through stochastic programming [13,14].
In the context of KSA, different studies related to wind energy are available in the literature. These studies include the estimation of wind energy trends using different techniques [15], wind farm layout design optimization [16], analysis of wind power distribution and estimation across different regions [17]. Other studies include the time-dependent estimation of wind speed [18]. Some collaborative work has also been done by different local researchers in collaboration with Greek scientists [19] and Algerian researchers [20] in order to assess wind power potential and its utilization aspects.
Further to overcome the problems associated with wind power technology, site specific studies are required to assess the feasibility of wind power technology. In this regard, different studies have been carried out for implementation of wind energy system and their progress for climatic conditions of KSA [21,22,23]. Ramli et al. [21] assessed the potential of solar and wind energy based power generation with the motivation to maximize the use of renewable energy technologies in KSA. The results of this study showed a combined solar and wind energy potential of 50 GW in the country. Eltamaly [22] and Rehman and Aftab [23] in two different studies presented the wind data analysis for five coastal locations of KSA. The data analysis was carried out using hourly mean values of wind speed and wind direction covering a period of almost 14 years between 1970 and 1983. Furthermore, Bassyouni et al. [24] used a Weibull distribution approach to analyze the wind power potential for Jeddah, the commercial capital of Saudi Arabia. The study concluded that under the present scenario, the wind power potential can be exploited for off-grid applications for power generation. Baseer et al. [25] studied the wind power characteristics for Jubail using hourly mean wind speed measured at 10, 50, and 90 meters above ground level over a period of 5 years from 2008 to 2012. The study reported that 6825 MWh of energy could be generated annually at a plant capacity factor of 25% using a wind turbine of 3 MW rated capacity.
Apart from that, the economics of wind power technology have also been studied [26,27]. Different models for the prediction of wind energy potential have also been investigated in the literature [28,29]. These economics related studies suggested that government should provide incentives to the private and local investor in order to lower the initial associated costs of wind power technology. Furthermore, it has been suggested in these studies are must to generate wind duration curves and to calculate the cost per kWh of electricity generated from the chosen wind-machines. Other studies include the understanding of wind speed trends and inherent properties over a long period using modern techniques such as wavelets and power spectrum [30,31,32] and wind farm layout design optimization and wind turbine selection using multi-criteria algorithms [33]. Furthermore, the wind speed characteristics such as wind turbulence, wind frequency distribution, wind shear exponent, diurnal and seasonal wind speed trends, energy yield, and the capacity factors have been studied in details for different regions of Saudi Arabia [34,35,36,37,38,39,40].
3. Materials and Methods
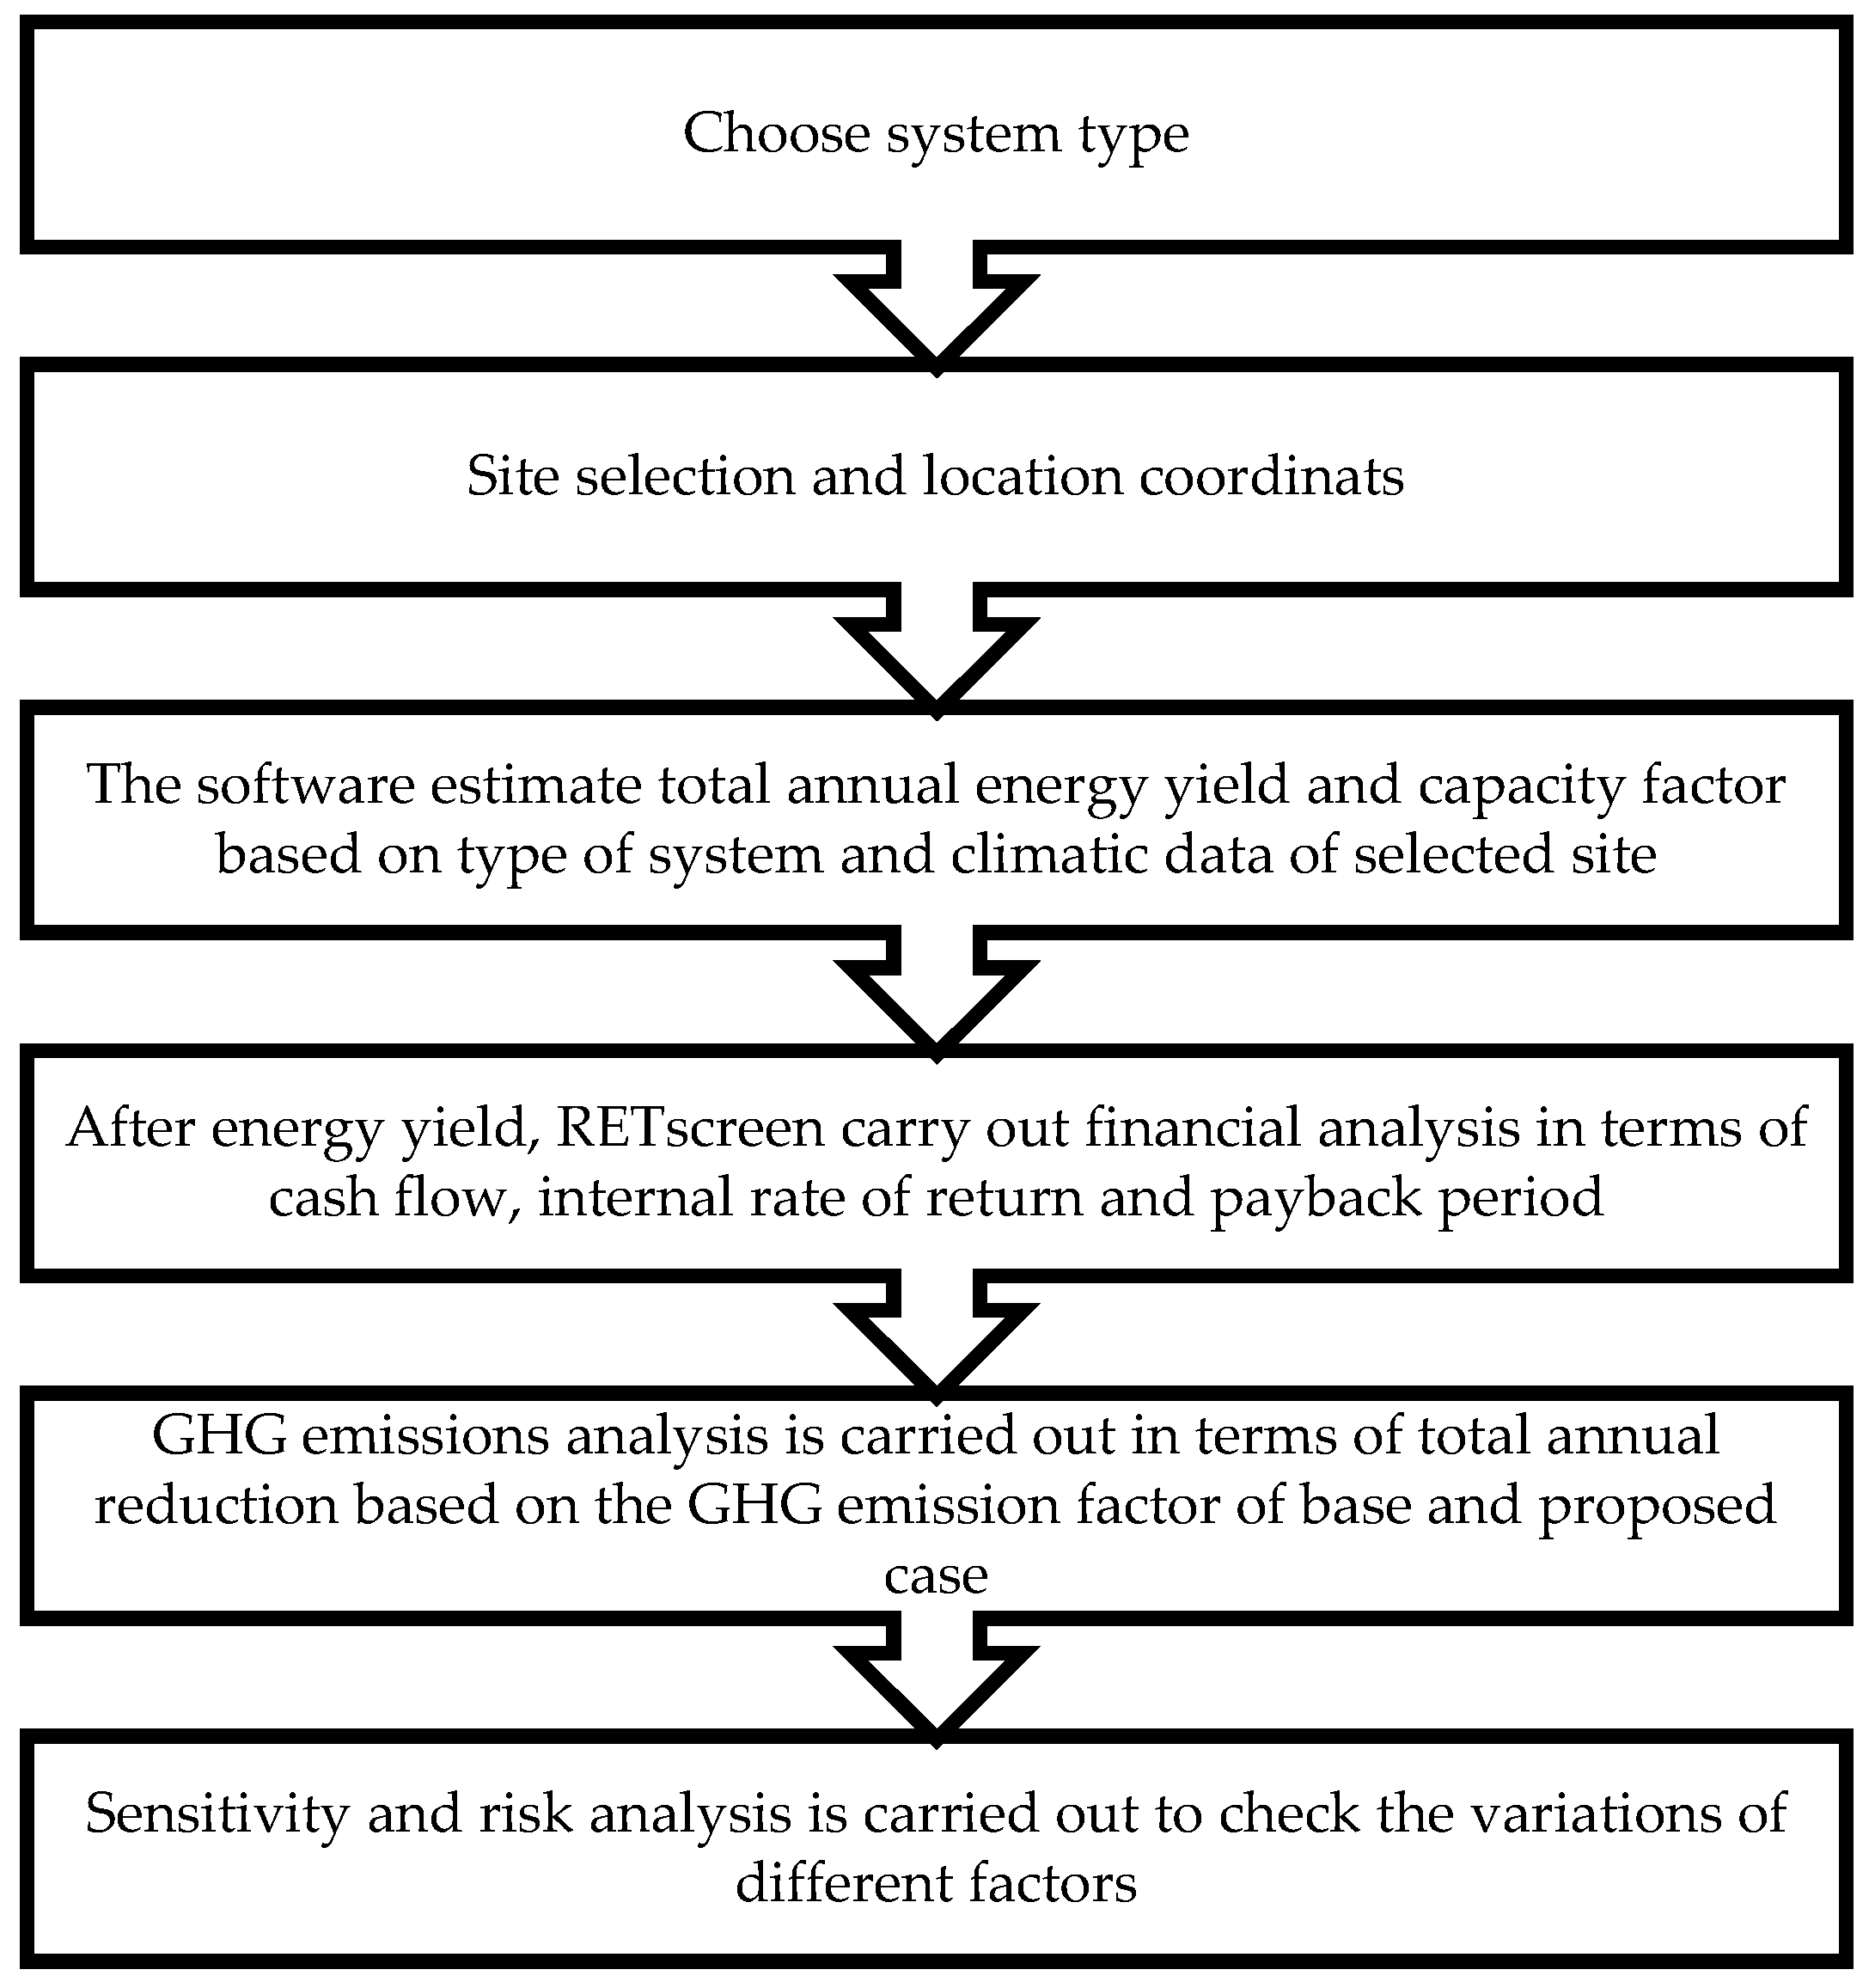
Different technologies and analyses have been utilized by researchers, engineers, and scientists for the development of different wind turbine configurations by determining the optimum working conditions. RETScreen is a clean energy simulation tool which is used worldwide to evaluate the energy production and savings, costs, emission reductions, financial viability and risk for various types of renewable and clean energy technologies. The fundamental of RETScreen software is a comparison between a “base case”, typically the conventional technology, and a “proposed case” that is the clean energy technology which is wind energy in this case. Based on the input data, RETScreen software is capable of estimating annual and monthly energy productions and capacity factor of an installed wind turbine. Furthermore, it can evaluate the financial viability of the project in terms of cash flow, payback period, and internal rate of return.
The profitability, quality, and efficiency of a project are estimated from capacity factor (CF) internal rate of return (IRR) whereas net present value (NPV) indicates the net present value or magnitude added by making an investment. IRR is a discount rate that makes the NPV of all cash flows from a particular project equal to zero. The built-in mathematical expression used for evaluation of all indicators using RETScreen tool are as follows:
The investors interested in the project set their target for the required return rate depending upon the capital cost of the project and then compare it with the project IRR. The IRR value equal or greater than the organization’s required rate of return means that the project is financially profitable and the investment is justified. On the other hand, a negative value of IRR concludes the project to be rejected. The equity-payback period is used to calculate the time required to return the initial investments of the organization involved in the project. The cash flow of the project and the level of debt are considered for equity-payback. A schematic diagram for optimization analysis of the proposed system is presented in Figure 7.
3.1. Site Data Description
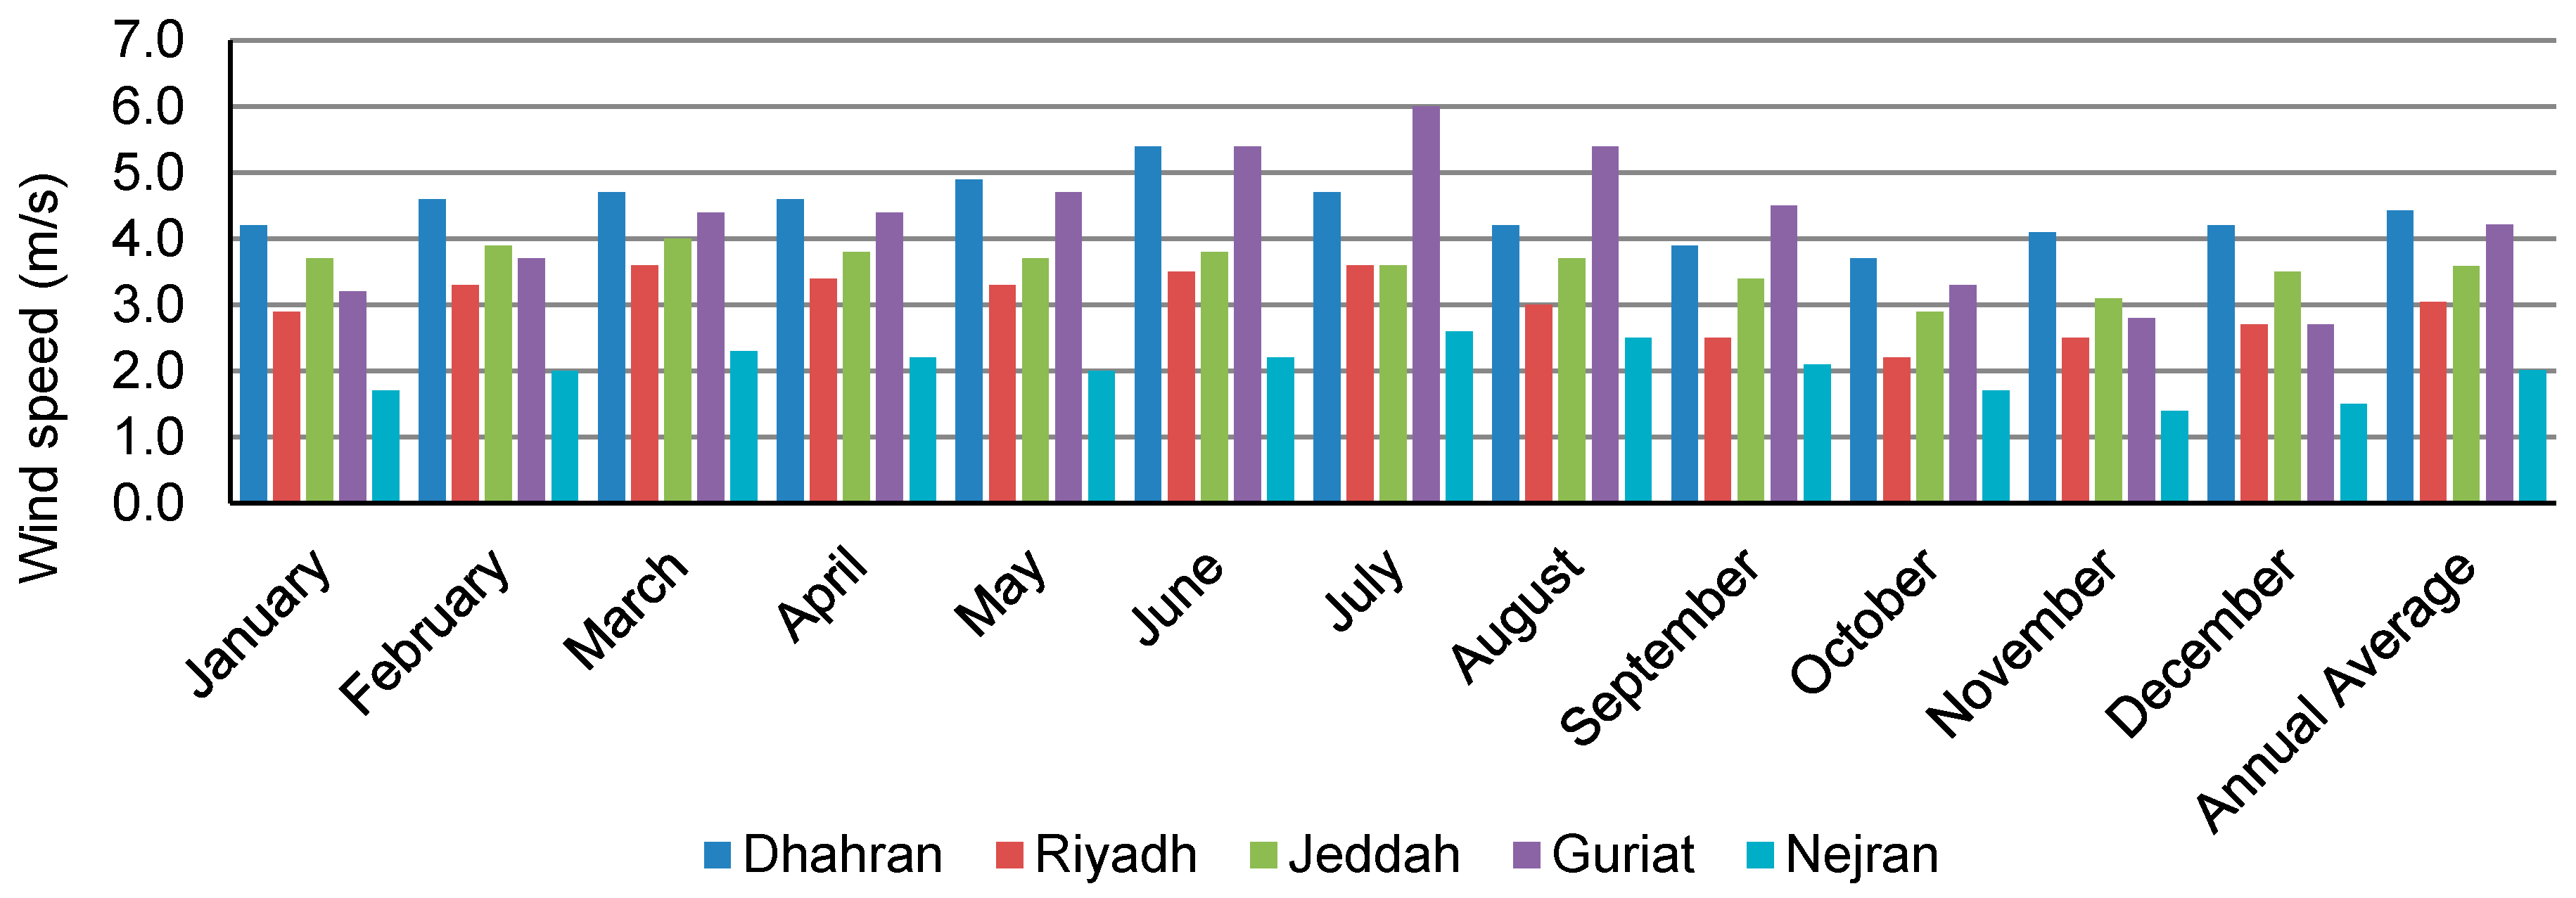
Figure 8 shows the regional map of Saudi Arabia. The locations chosen for the present study are spread across the country. Dhahran and Jeddah are the coastal sites on the Arabian Gulf and the red sea while Riyadh (central), Guriat (extreme north), and Nejran (south-west) are the inland locations. The geographical data for all sites are presented in Table 1 whereas the monthly average wind speed data for different cities are illustrated in Figure 9. The average wind speed is maximum for Dhahran and minimum for Nejran. The average annual wind speed values for Dhahran, Riyadh, Jeddah, Guriat, and Nejran are 4.3, 3.1, 3.6, 4.1, and 2.0 m/s, respectively. In general, higher wind speed values are observed in the summer time while lower in winter time; this coincides with the peak power demand in summer.
3.2. Description and Design of the Wind Power System
The power produced by a wind turbine depends on air flux through the area of interest. The establishment and development of the equation for power output from a wind turbine is explained in this section. The power Pw in the wind is given by the rate of change of energy E, i.e.:
where, T is the time, V is the wind velocity, and m is the mass flow.
The mass flow rate is given by:
where, ρ is the density of air, Af is the swept area, and x is the distance.
The power from the wind turbine for a given wind speed can be calculated by combining Equations (6) and (7):
As a wind turbine cannot convert 100% of wind energy to the output power, the power coefficient Cmax should be introduced in Equation (7) and the value of this coefficient varies according to the turbine used, viz.:
The following vital information can be deduced from Equation (8):
- The power output of a wind generator is proportional to the area swept by the rotor; that is, doubling the swept area makes the power output double.
- The power output of a wind generator is proportional to the cube of the wind speed.
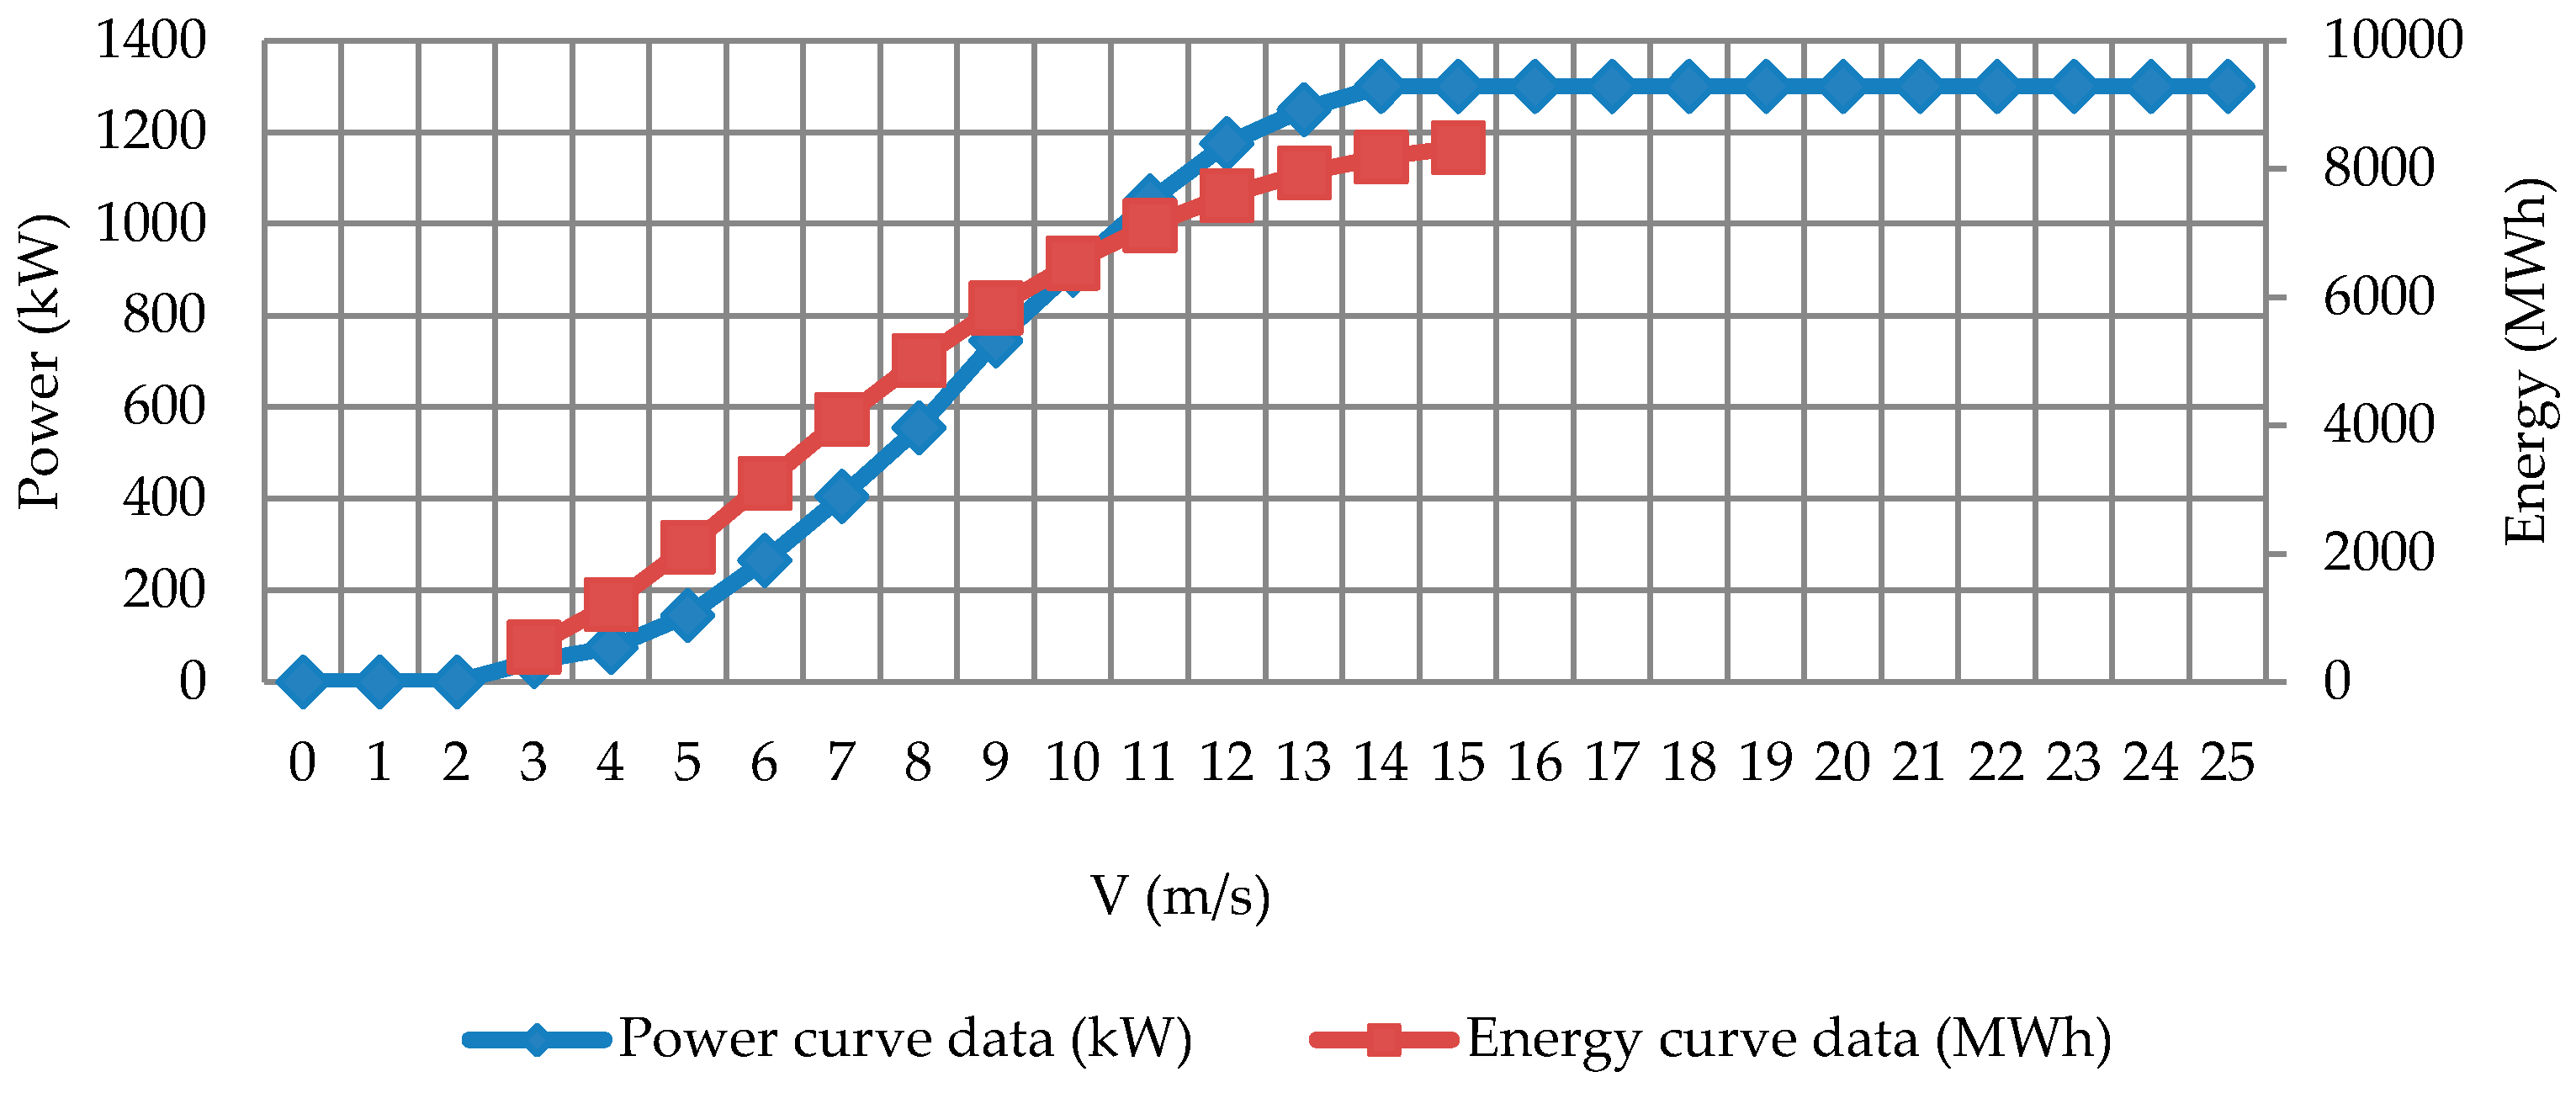
Different models of wind turbines were tested based on the number of turbines required and annual output for all sites using RETscreen input parameter. The configuration that provides maximum output power was then selected as the best configuration. The specifications of the selected wind turbines (AN BONUS 1.3 MW-60) are shown in Table 2. The rated power of the selected turbine models is 1.30 MW and they start working at a wind speed of 3.0 m/s. The cut-out wind speed is selected as 25 m/s. The rotor diameter of the AN BONUS 1.3 MW-60 is 60 m. The wind turbine is equipped with three rotor blades. The AN Bonus 1.3 MW-60 is fitted with a 3 stage spur/planetary gearbox.
The rated power capacity of a single turbine is 1300 kW and a total of 77 turbines are proposed to be used for a total installed capacity of 100 MW sized wind farm. The power curve of a selected wind turbine used is shown in Figure 10. The graph shows the power available from a wind turbine across a range of wind speeds. Based on the wind speed data, it can be estimated how much power will be possible to generate using the chosen wind turbine.
4. Results and Discussion
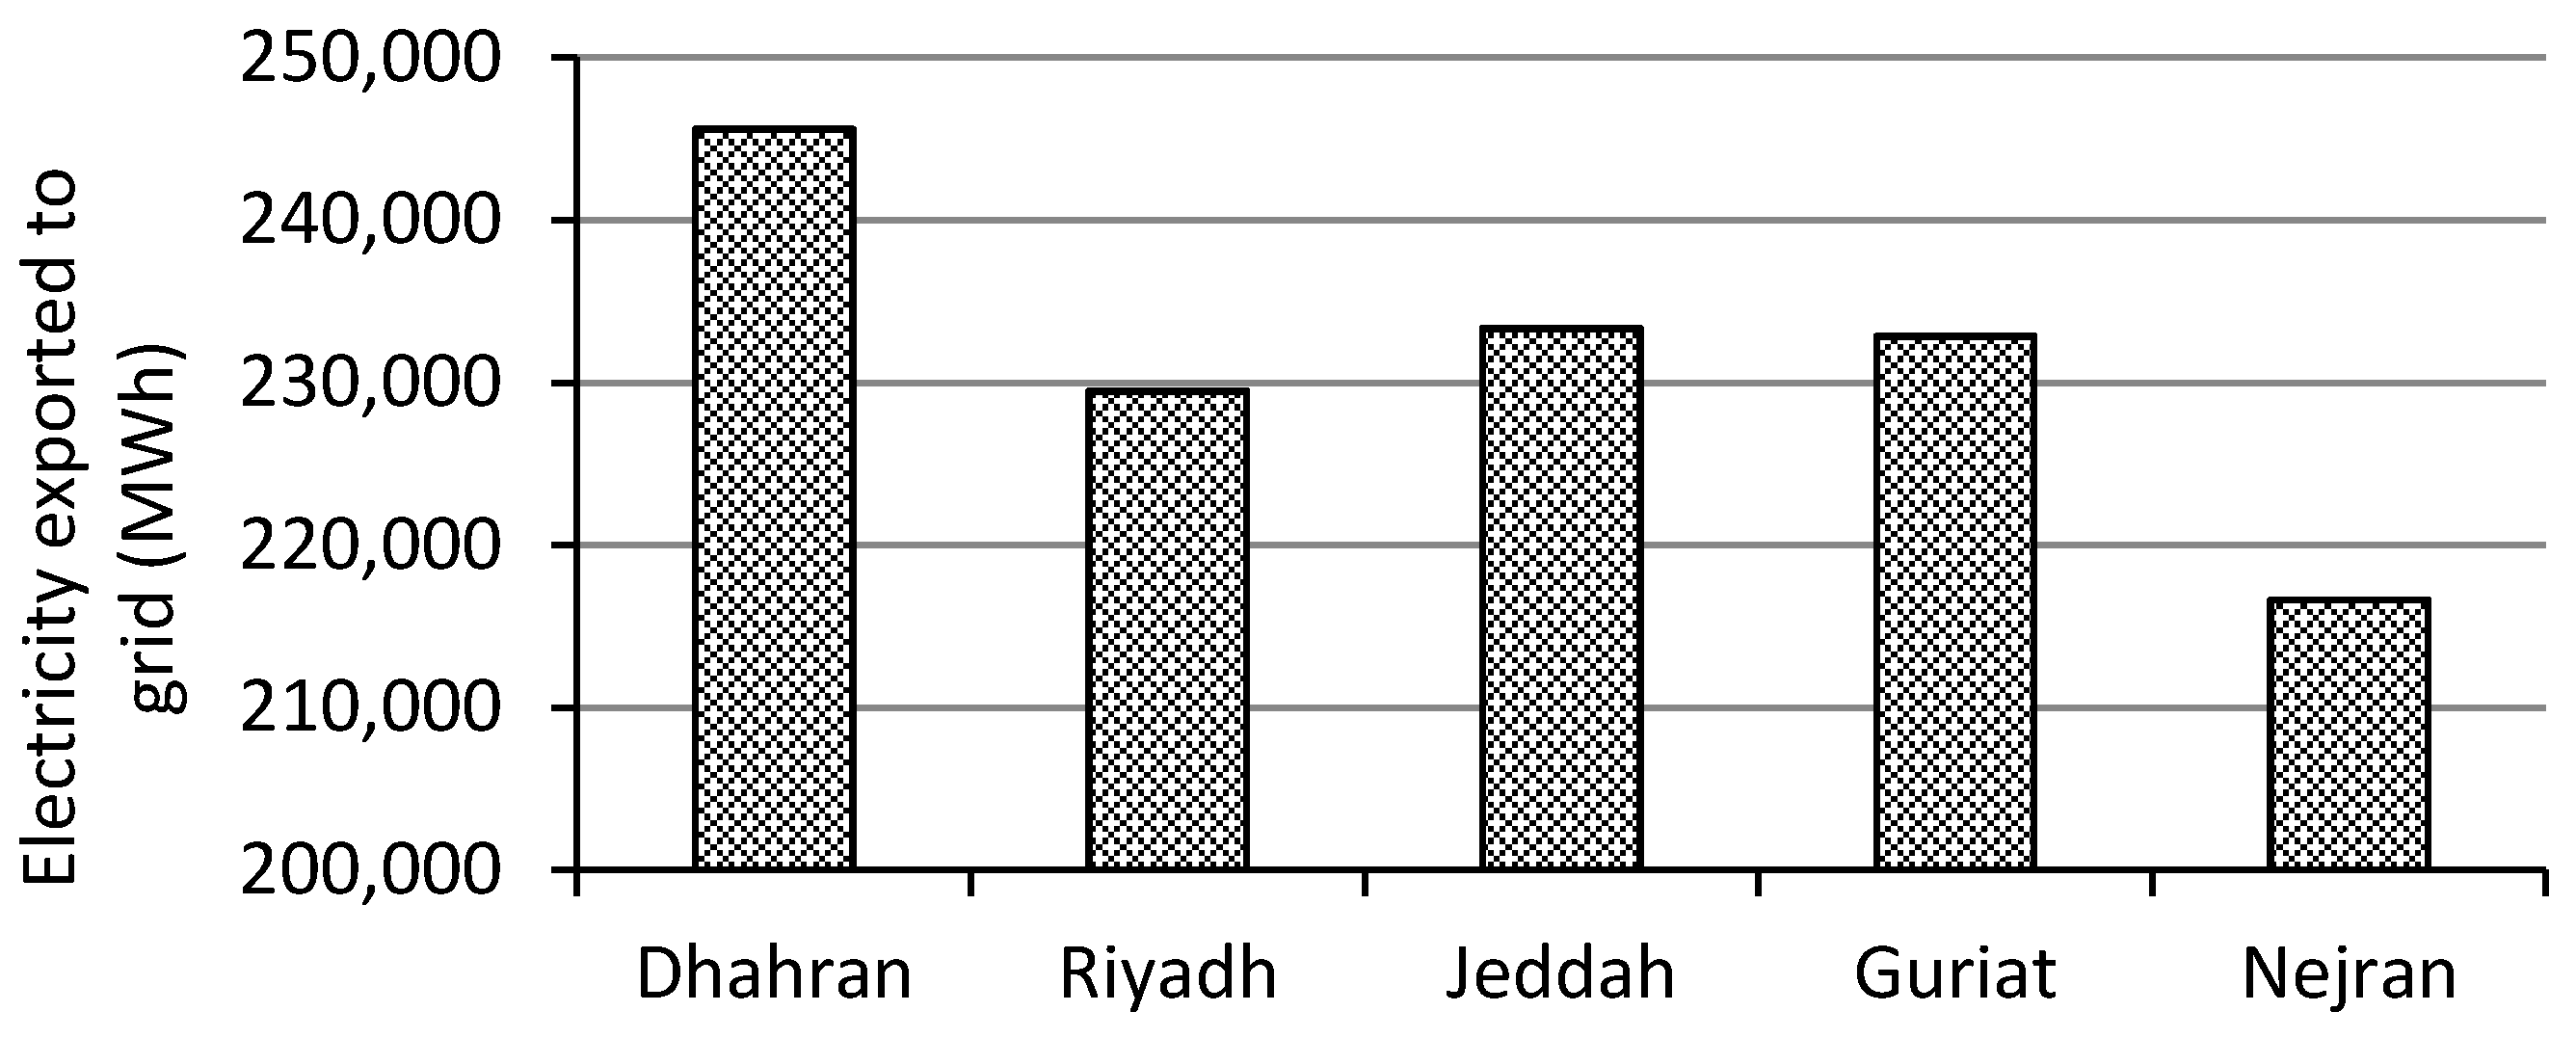
Wind turbine power greatly depends on the wind speed and volume of air passing through the rotors, and its value differs from site to site and month to month. The total annual energy production from the proposed system, exported to the grid for all sites, is shown in Figure 11 whereas Table 3 presents the detailed monthly results for electricity generation from the installed wind farm.
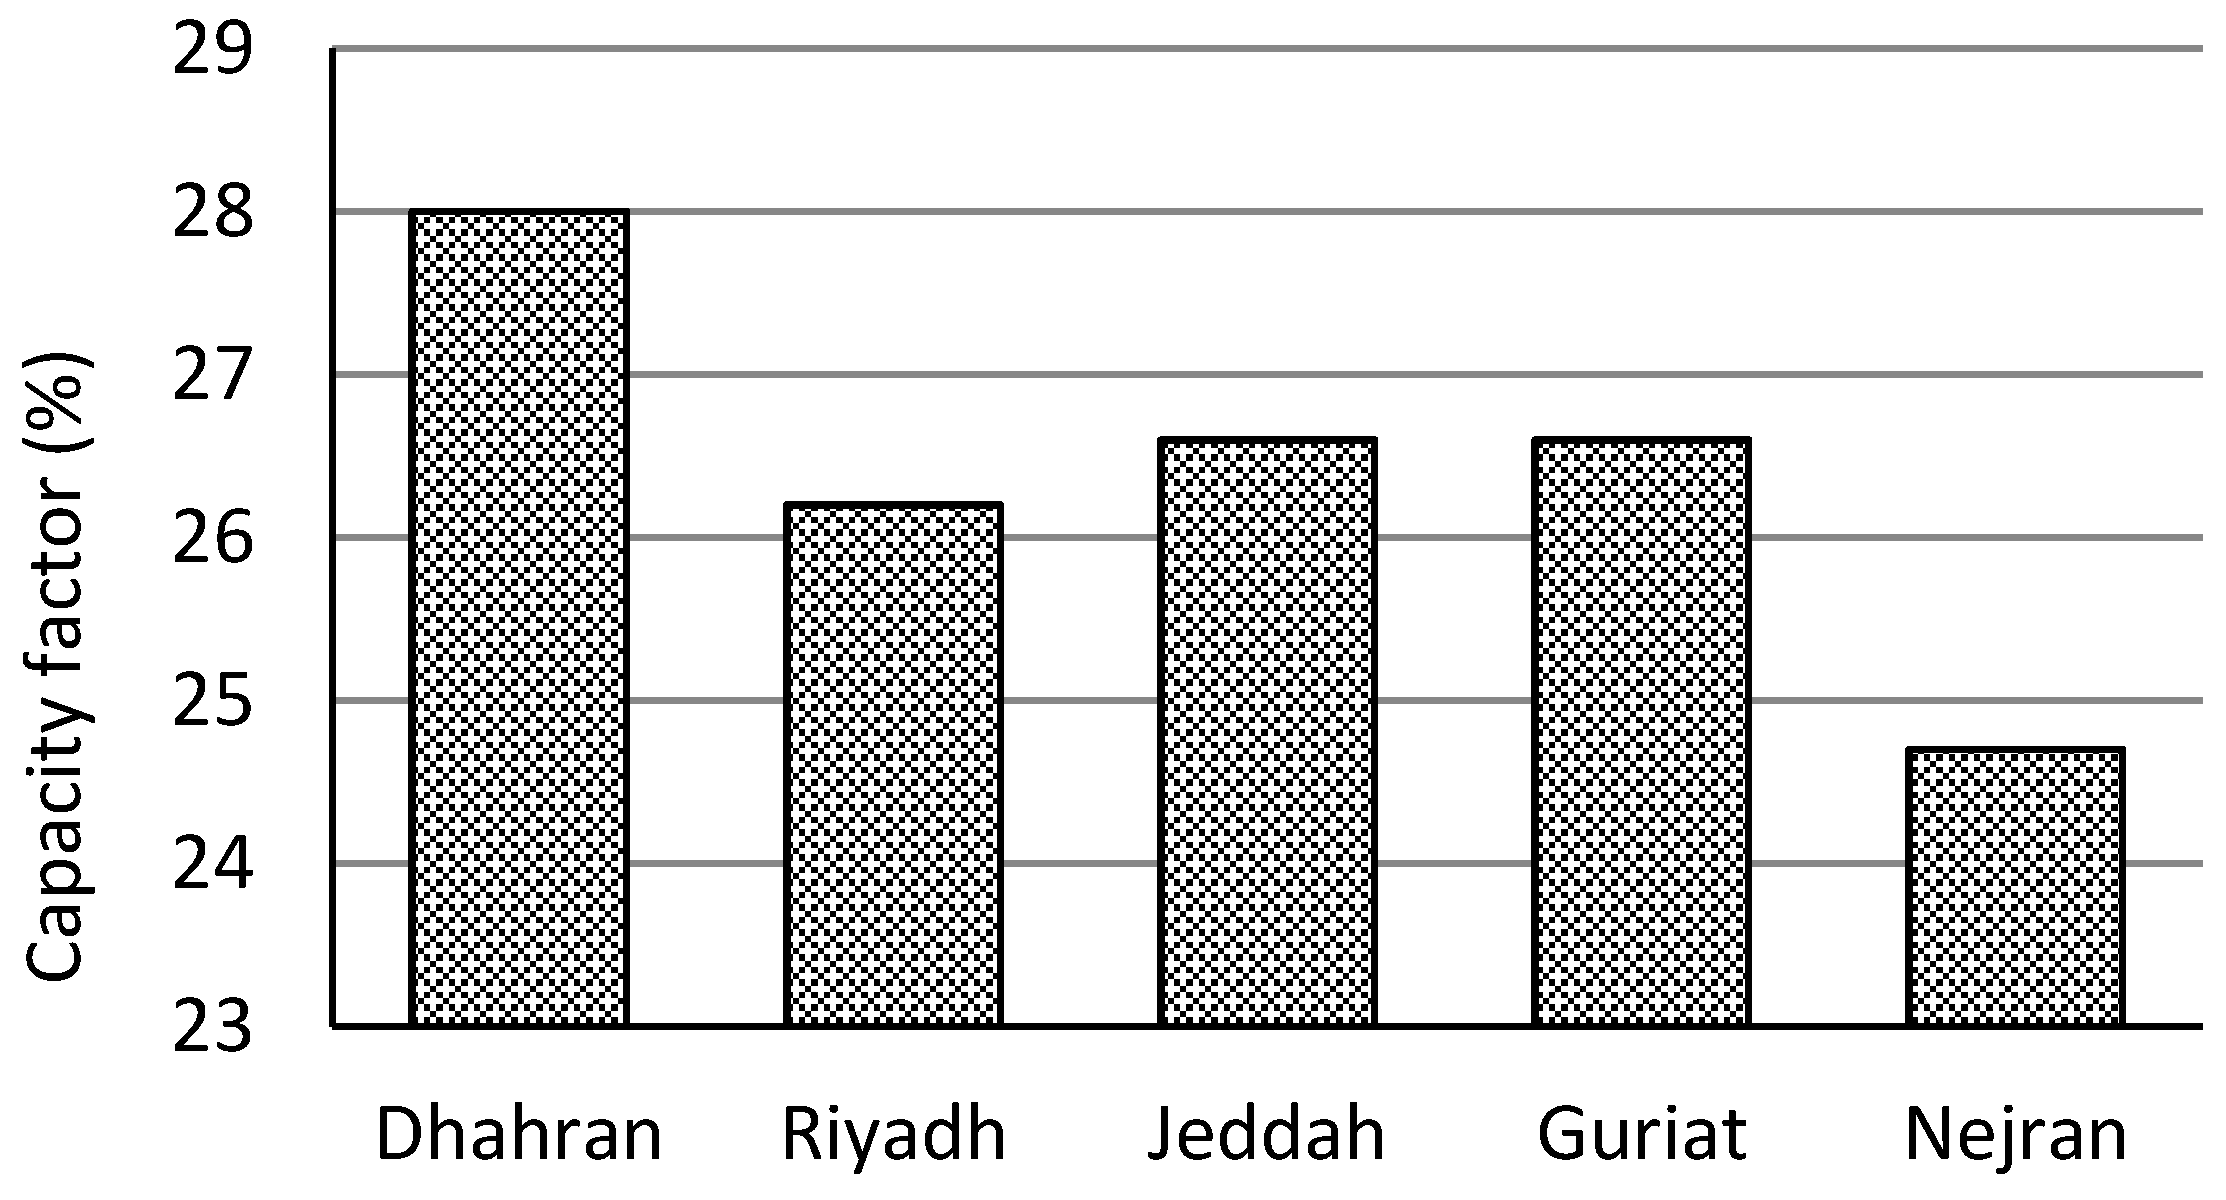
These values are obtained from the RETScreen simulation software for the turbine configurations listed in Table 2 and location-specific data. The annual minimum and maximum energy of 245,000 and 216,000 MWh are exported to the grid for Dhahran and Nejran, respectively. The annual electricity exported for Riyadh, Jeddah, and Guriat is 230,000, 234,000, and 233,500 MWh, respectively. Figure 12 presents the archived values of capacity factor for installed wind turbines for all the sites. A maximum capacity factor of 28% is observed for climatic conditions of Dhahran whereas; for Riyadh, Jeddah, Guriat, and Nejran, capacity factors of 26.1, 26.6, 26.6, and 25.4% are observed, respectively.
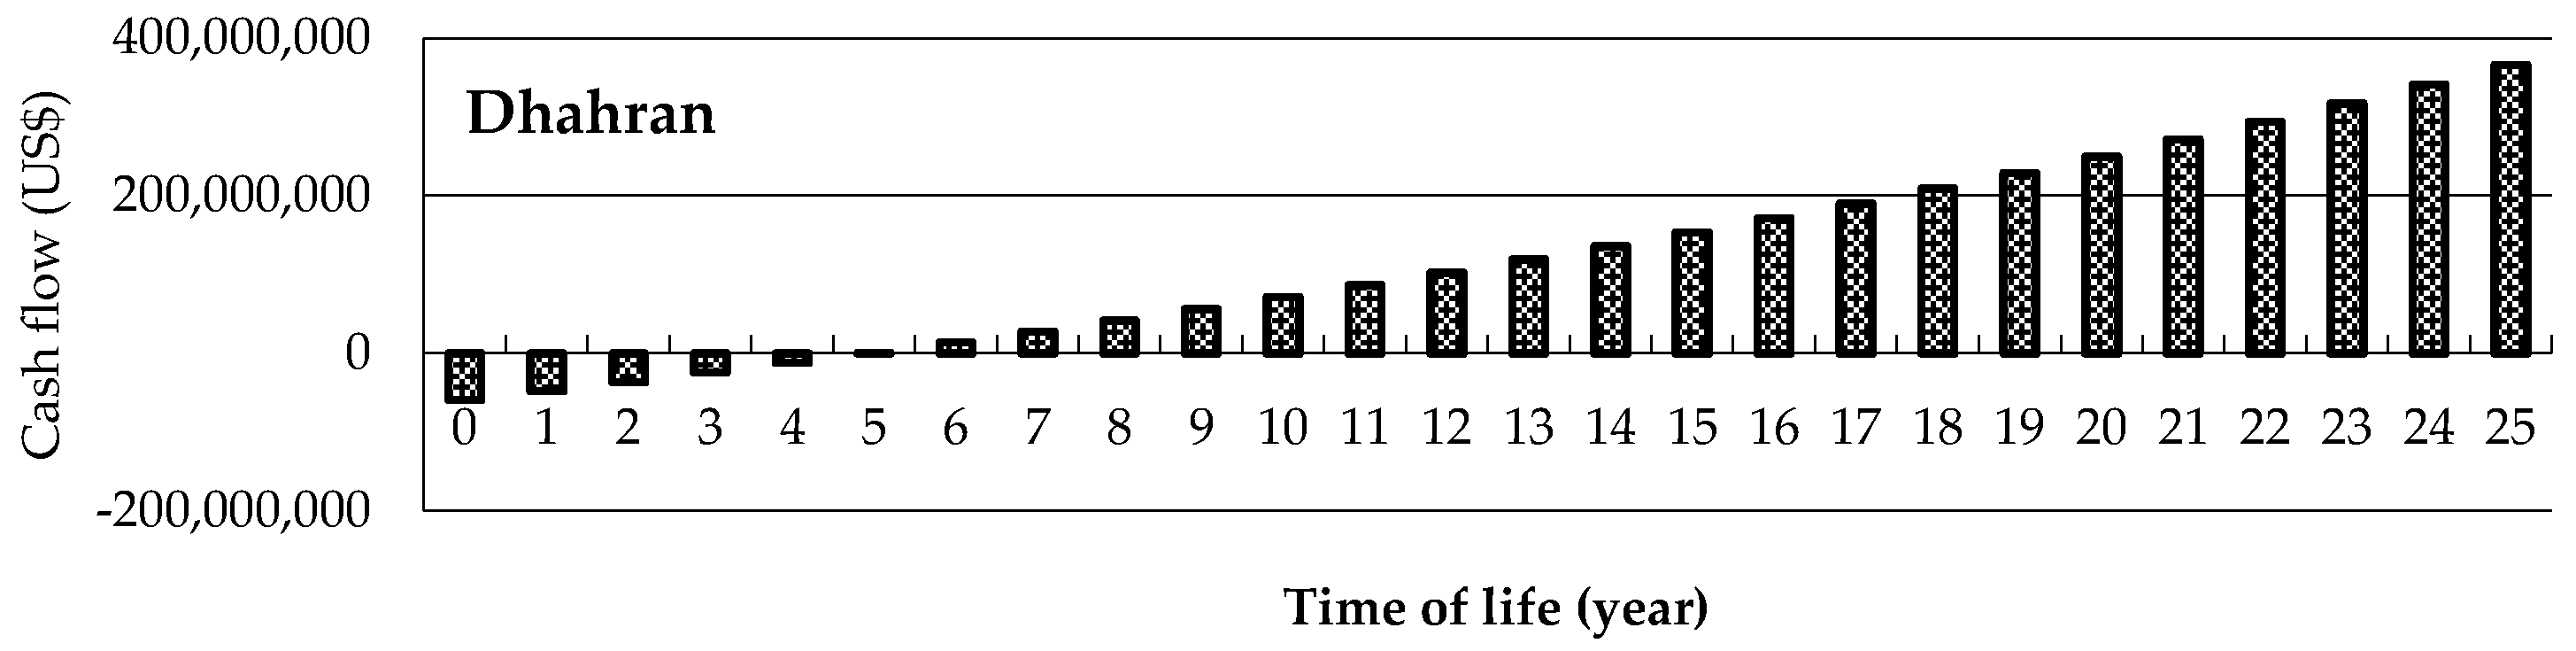
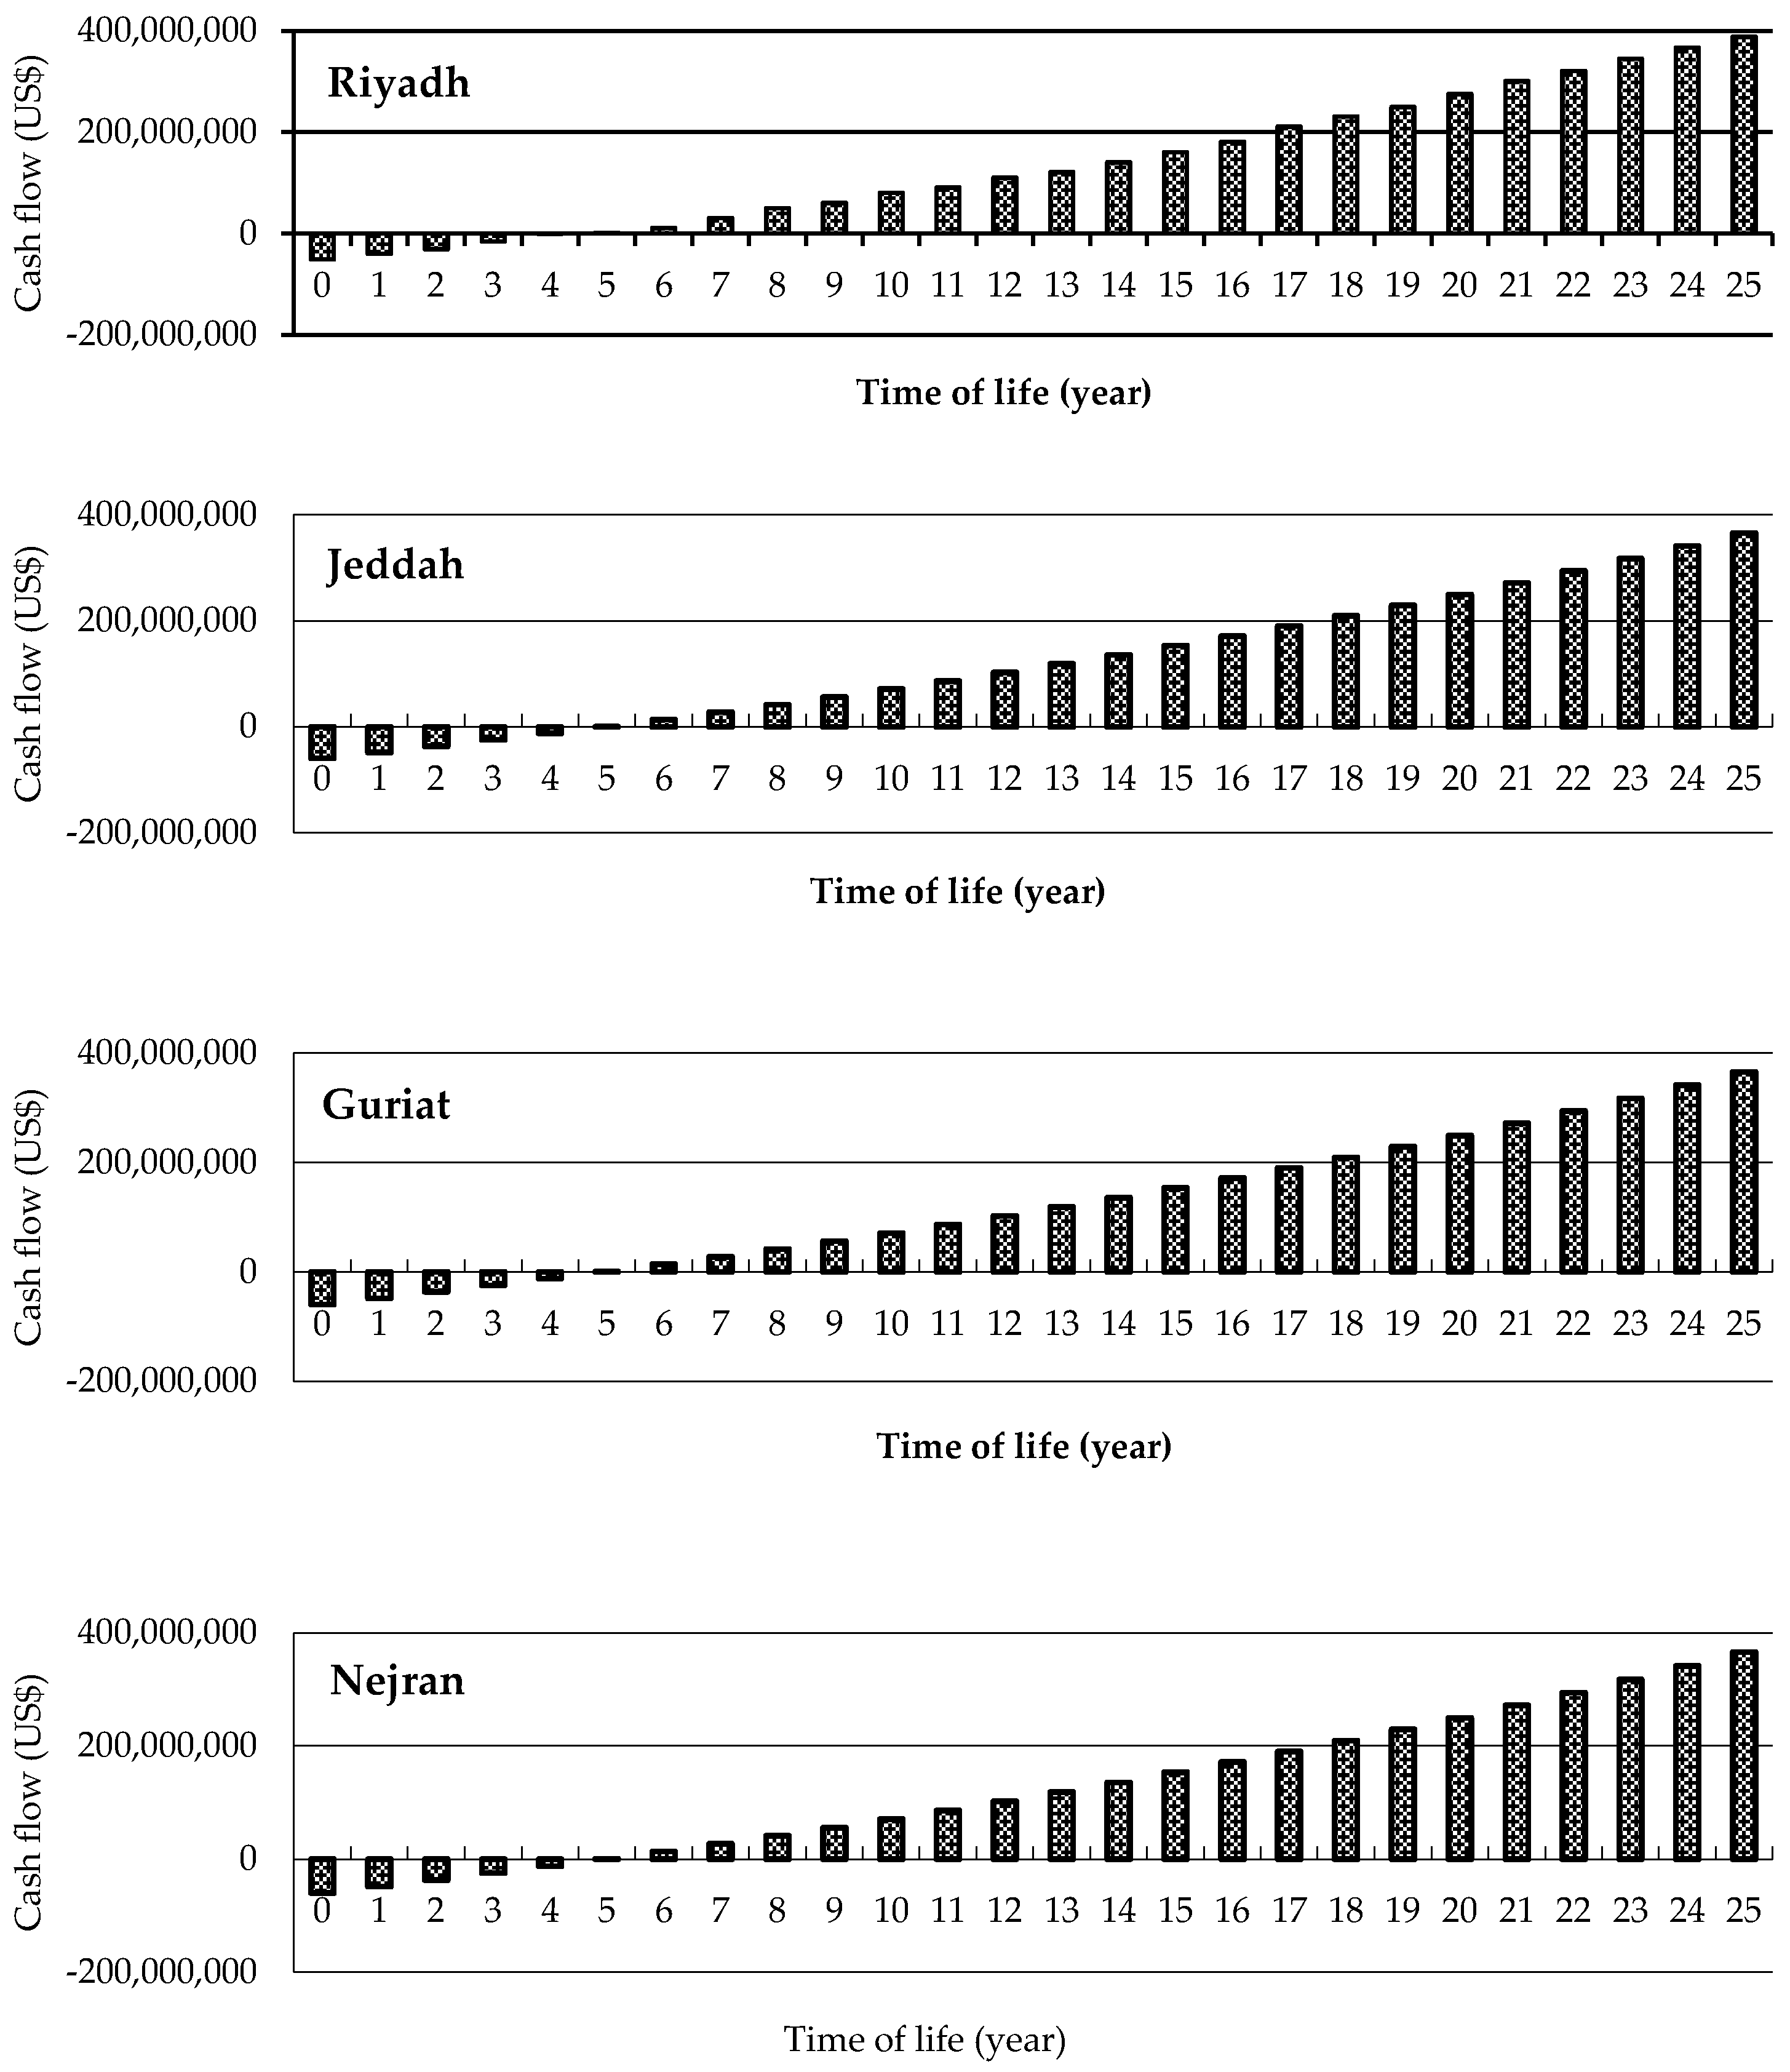
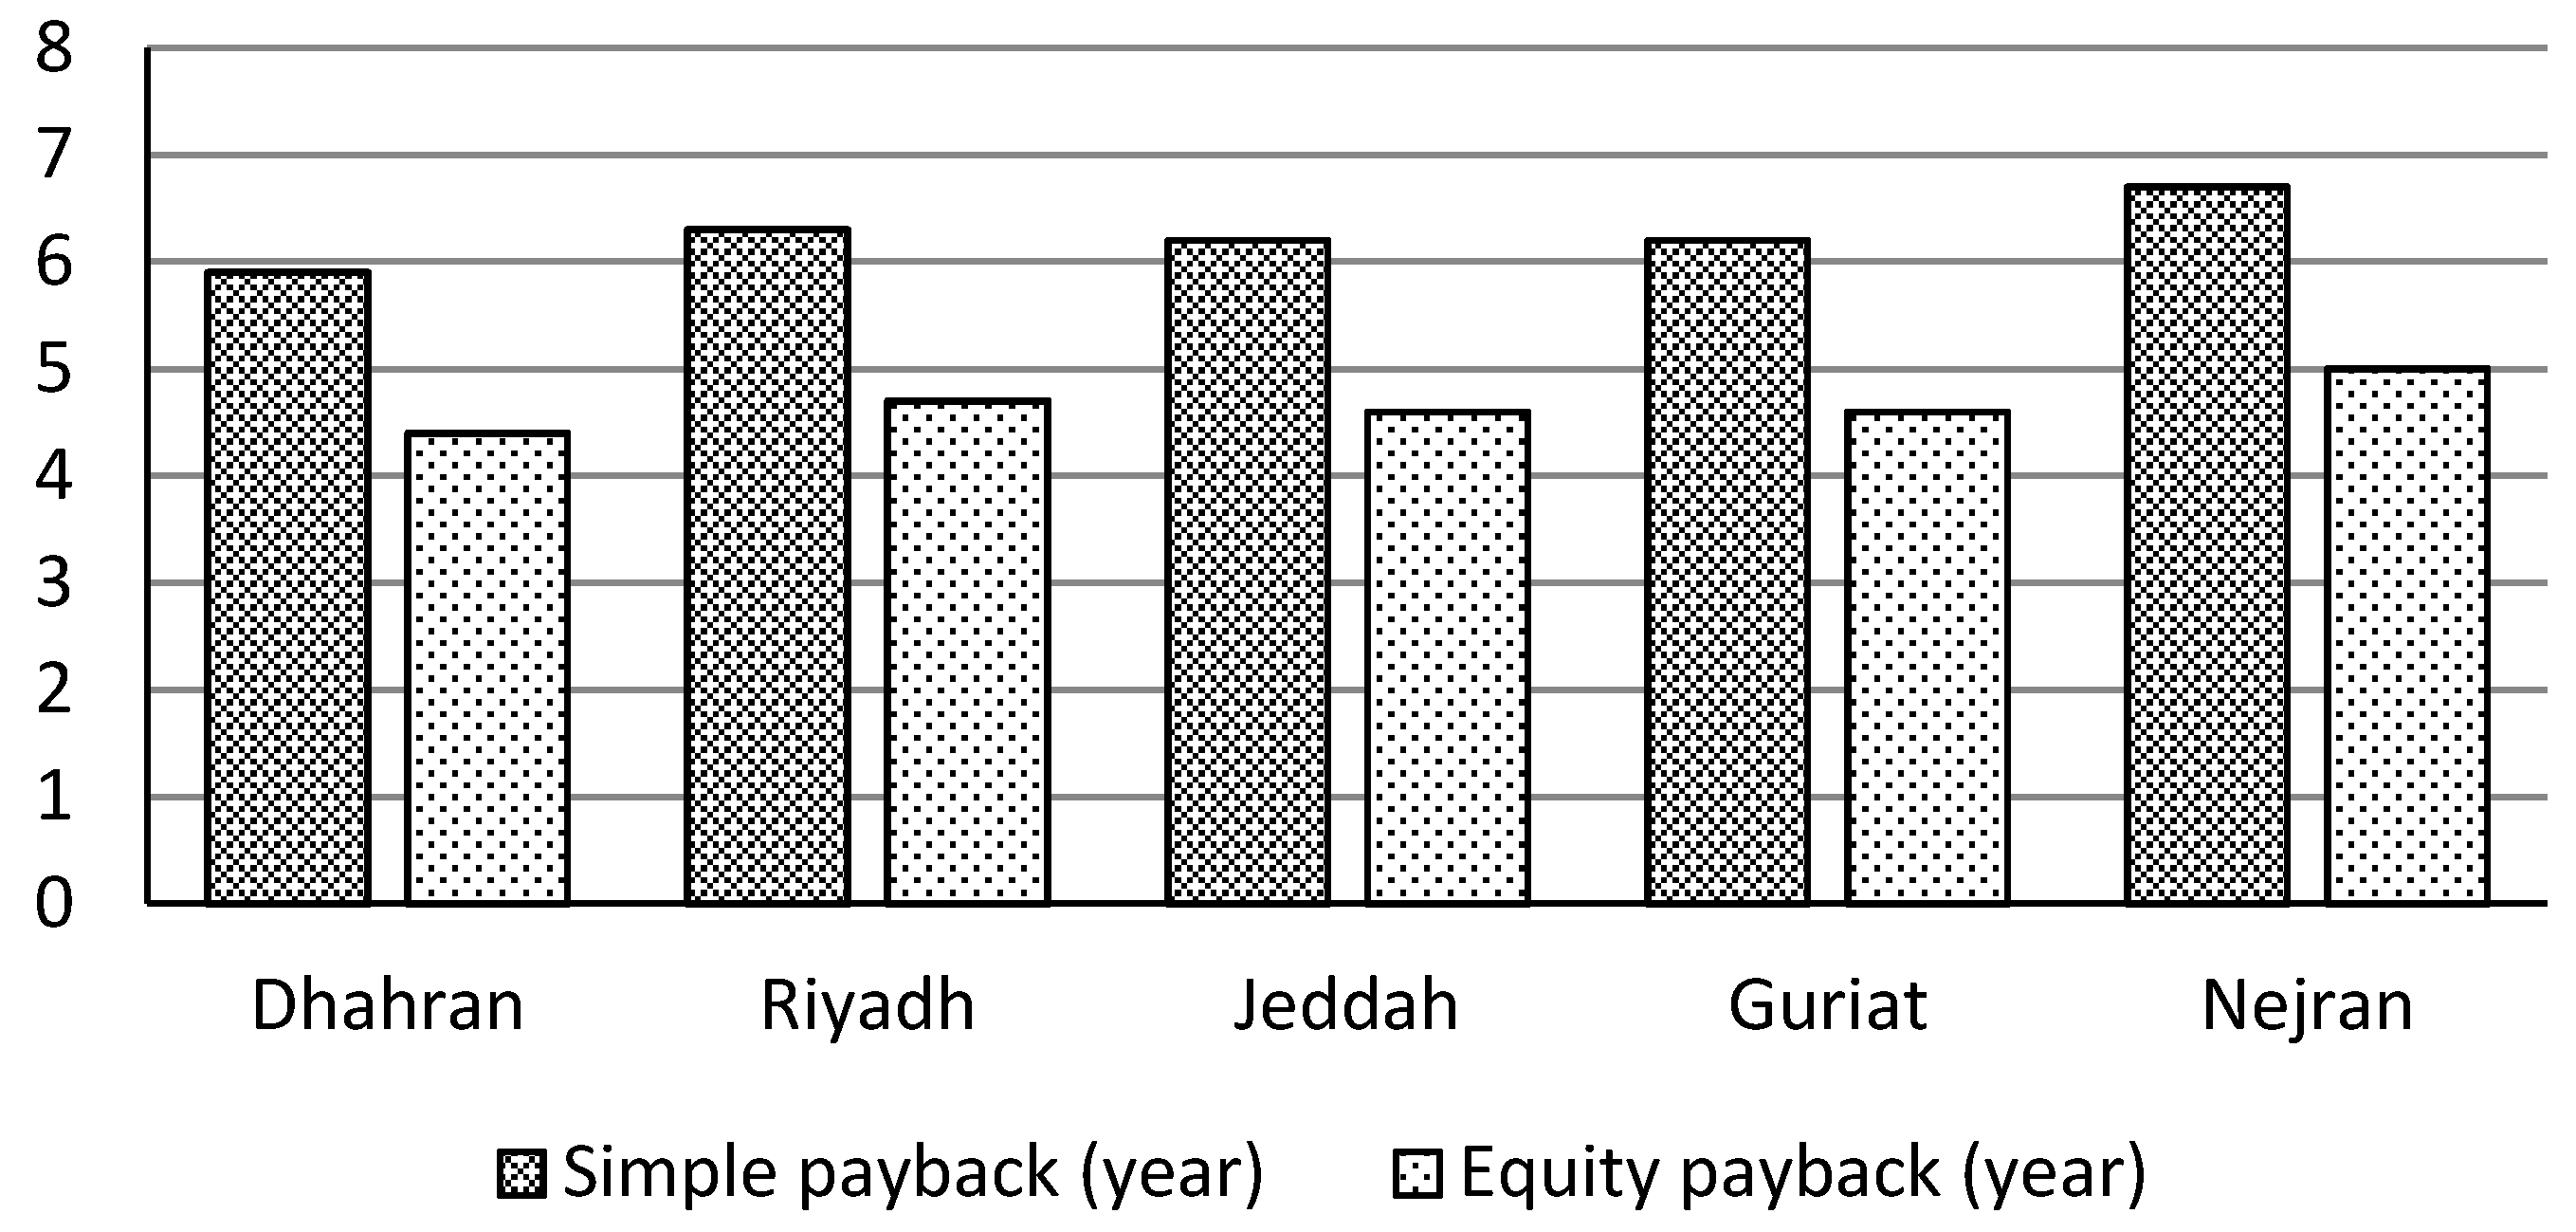
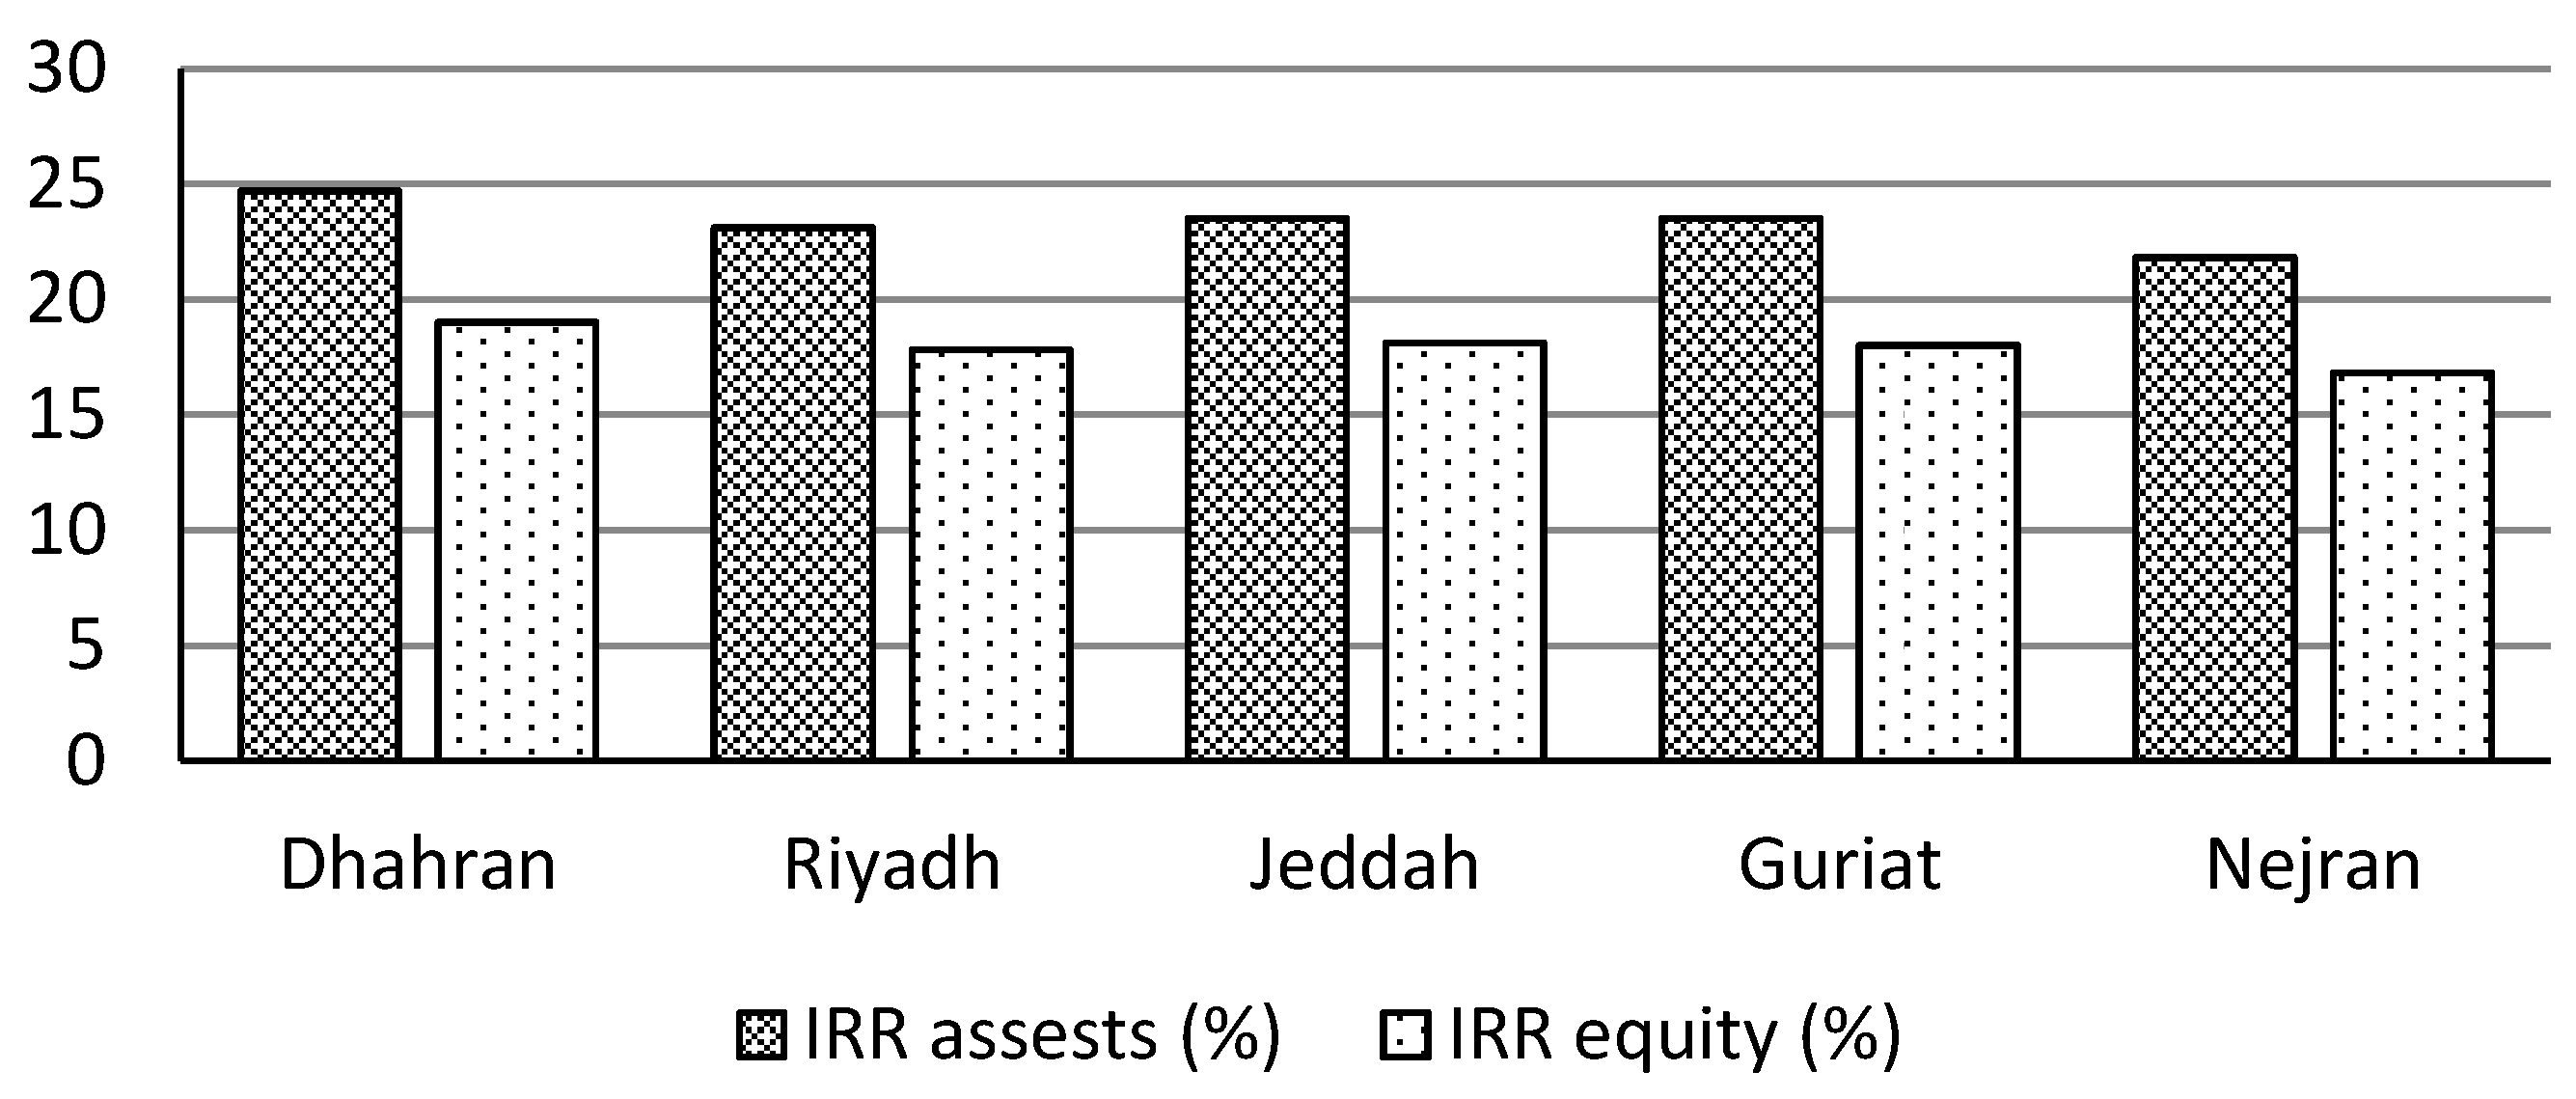
The discount rate for feasibility of renewable based power technologies in KSA is normally taken as 0% [41] which is the case in this paper as well. The interest rates, project life time, and other related financial parameters are illustrated in Table 4. Figure 13 provides an overview of the cash flow over the project life time for all sites. The cash flow indicates that the investor is expected to get a positive cash flow from the 5th year onwards for all sites. Based on this cash flow, simple payback periods of 5.9, 6.3, 6.2, 6.2, and 6.7 years are expected for Dhahran, Riyadh, Jeddah, Guriat, and Nejran, respectively (Figure 14). A minimum equity payback of 4.4 years is observed for Dhahran. Similarly, Figure 15 illustrates the results obtained for IRR assets and equity. Average values of 23 and 18% are observed for IRR assets and equity, respectively, for all sites. All the financial indicators show that the proposed systems seem to be economically feasible.
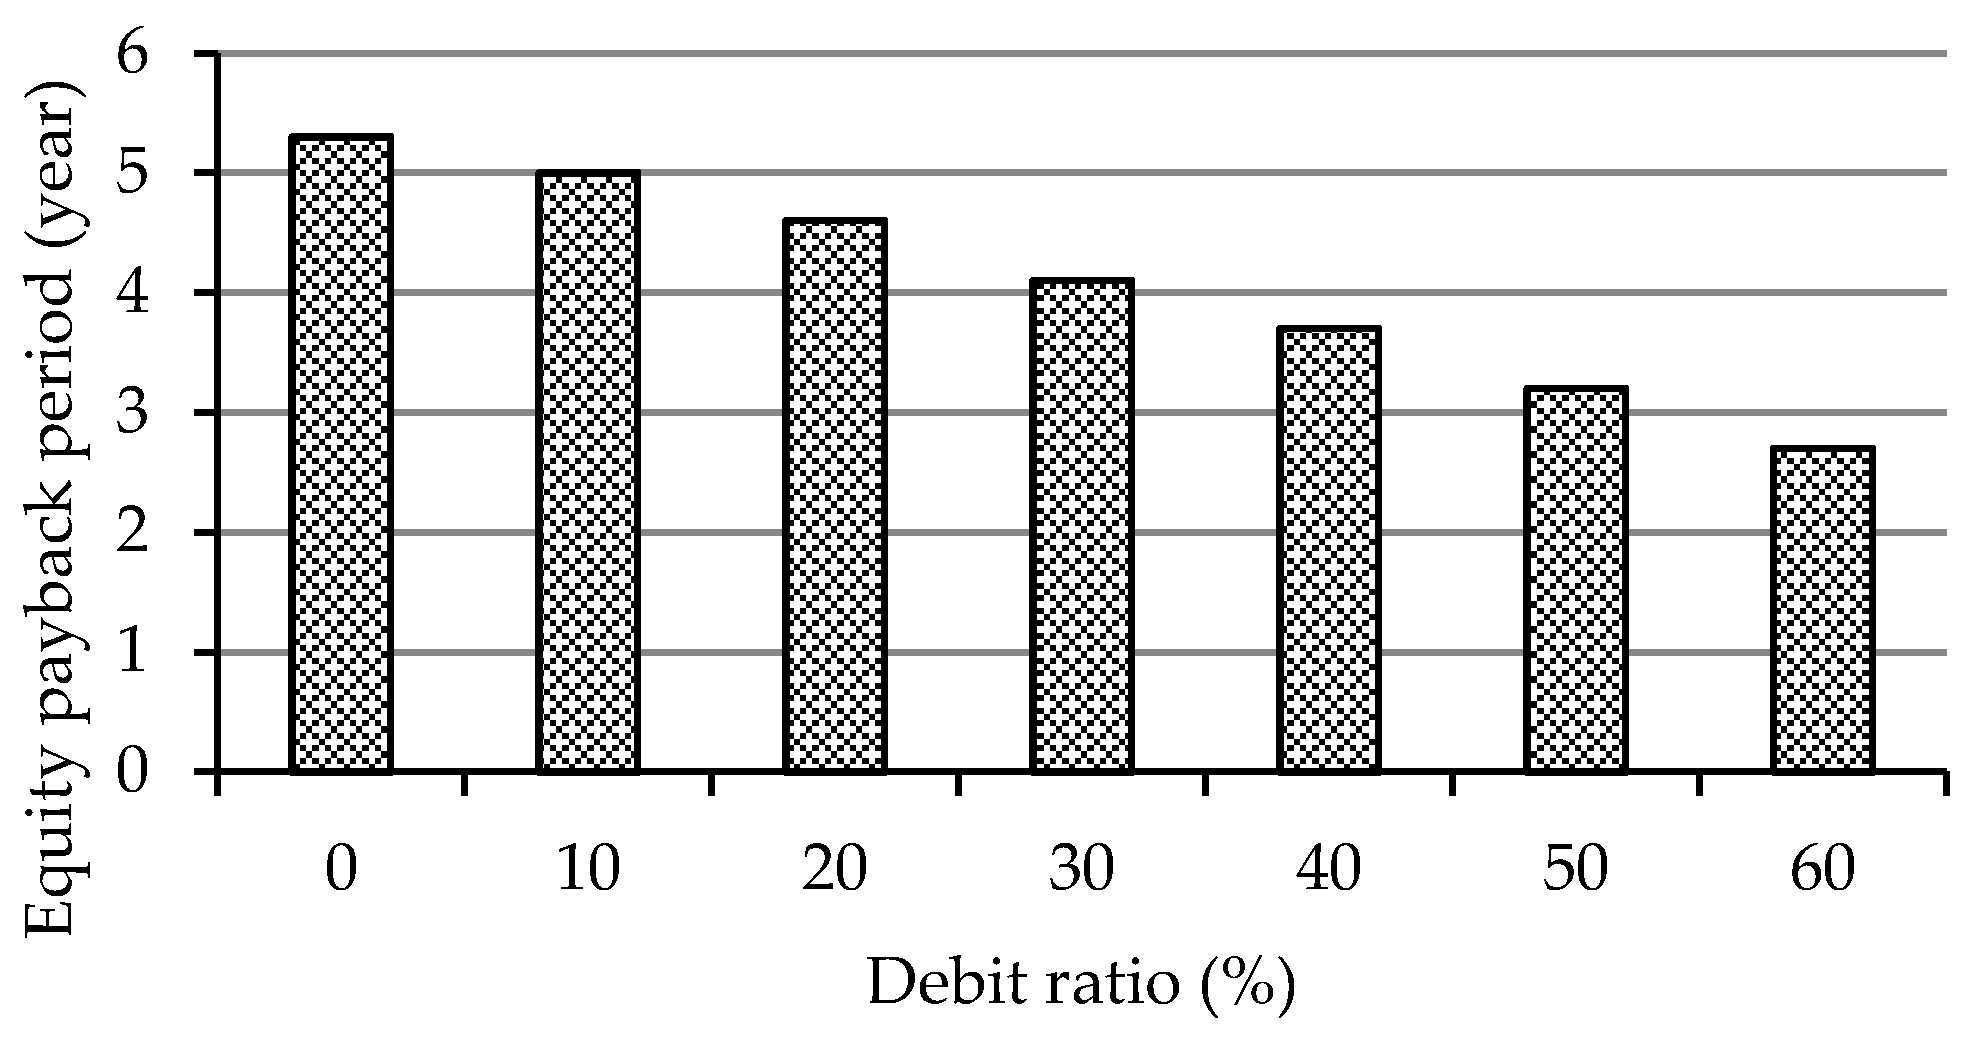
The utilization of wind energy as a partial replacement of traditional power production units in the country significantly reduces the emission of GHG, as can be observed from Table 5. The results are presented in term of GHG reduction when the current energy mix of Saudi Arabia is partially replaced by wind power. The net annual reductions of GHG for Dhahran, Riyadh, Jeddah, Guriat, and Nejran are found to be 180,947, 169,077, 171,914, 171,567, and 159,596 tCO2, respectively. The average GHG reductions for Dhahran, Riyadh, Jeddah, Guriat, and Nejran are equivalent to 33,140, 30,967, 31,486, 31,423, and 29,230 cars and light trucks not used, respectively. This significant decrease of harmful emissions can help to achieve sustainable development in the country. Furthermore, a sensitivity analysis indicated that government incentives in terms of investment loans without any interest can play an important role for development and promotion of this renewable technology as can be observed from Figure 16. A debit ratio of 30–40% can help to achieve a payback period of about 4 years which makes the technology more attractive for the investors.
Risk Analysis
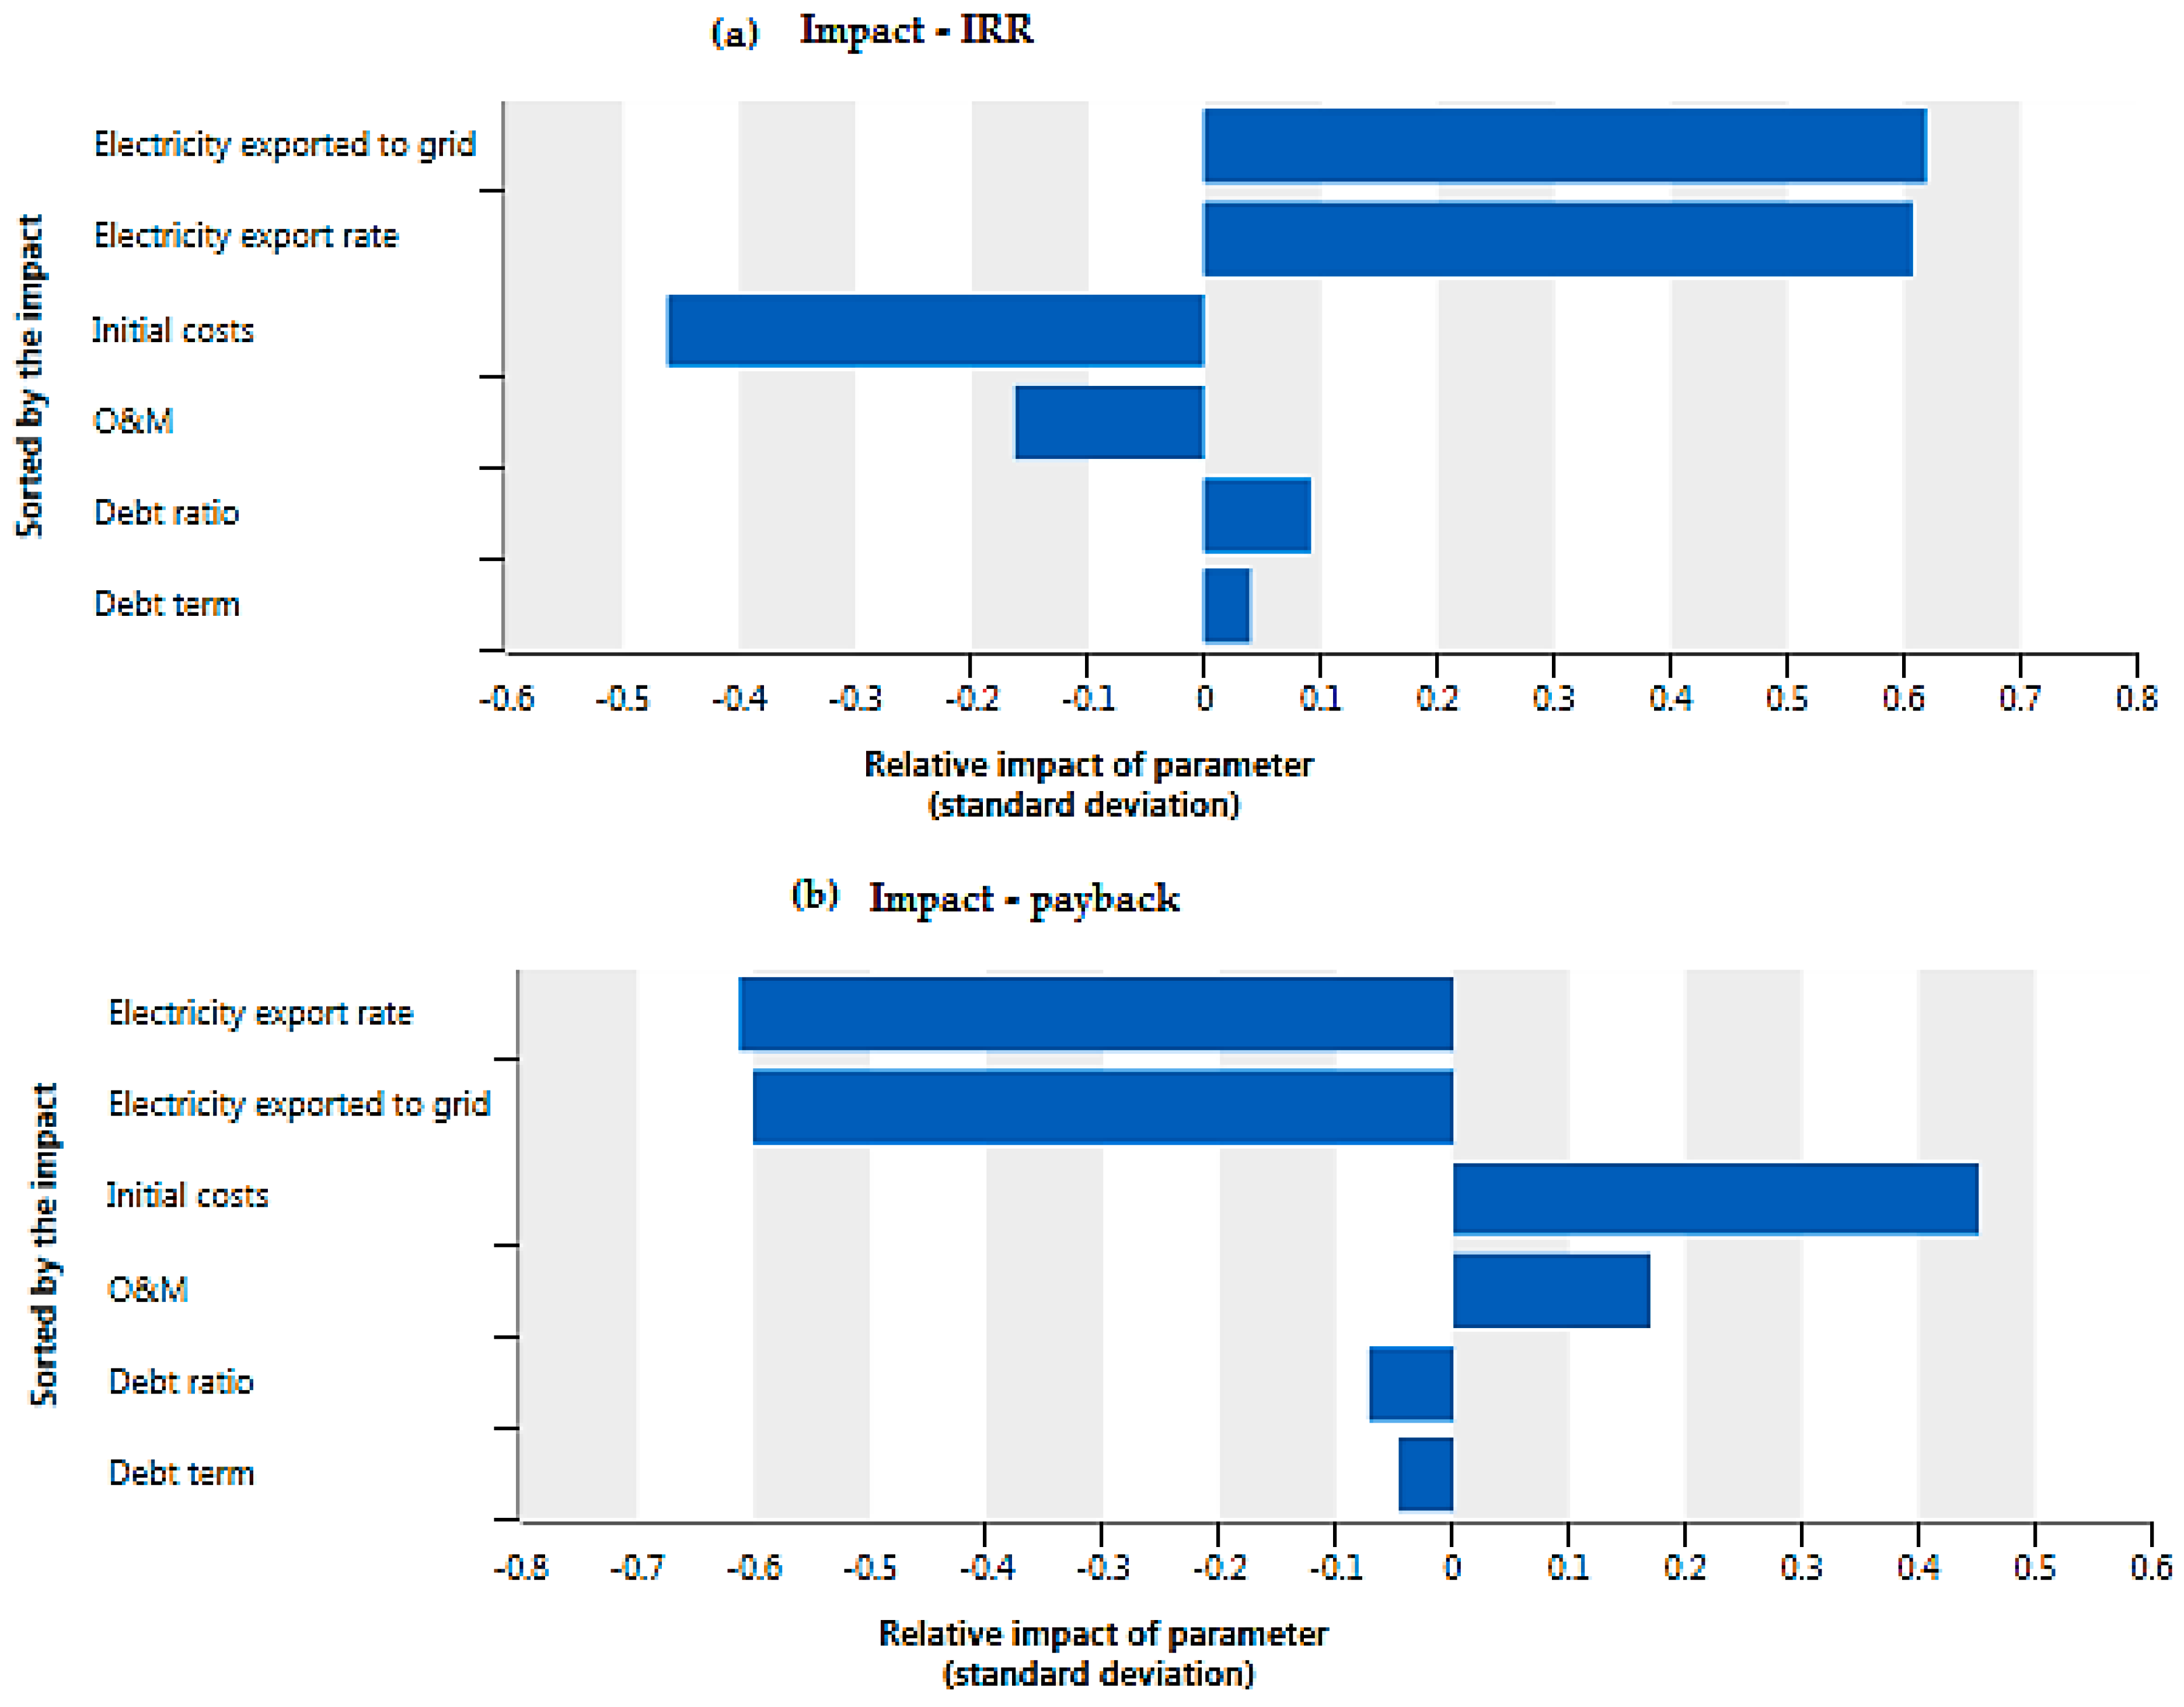
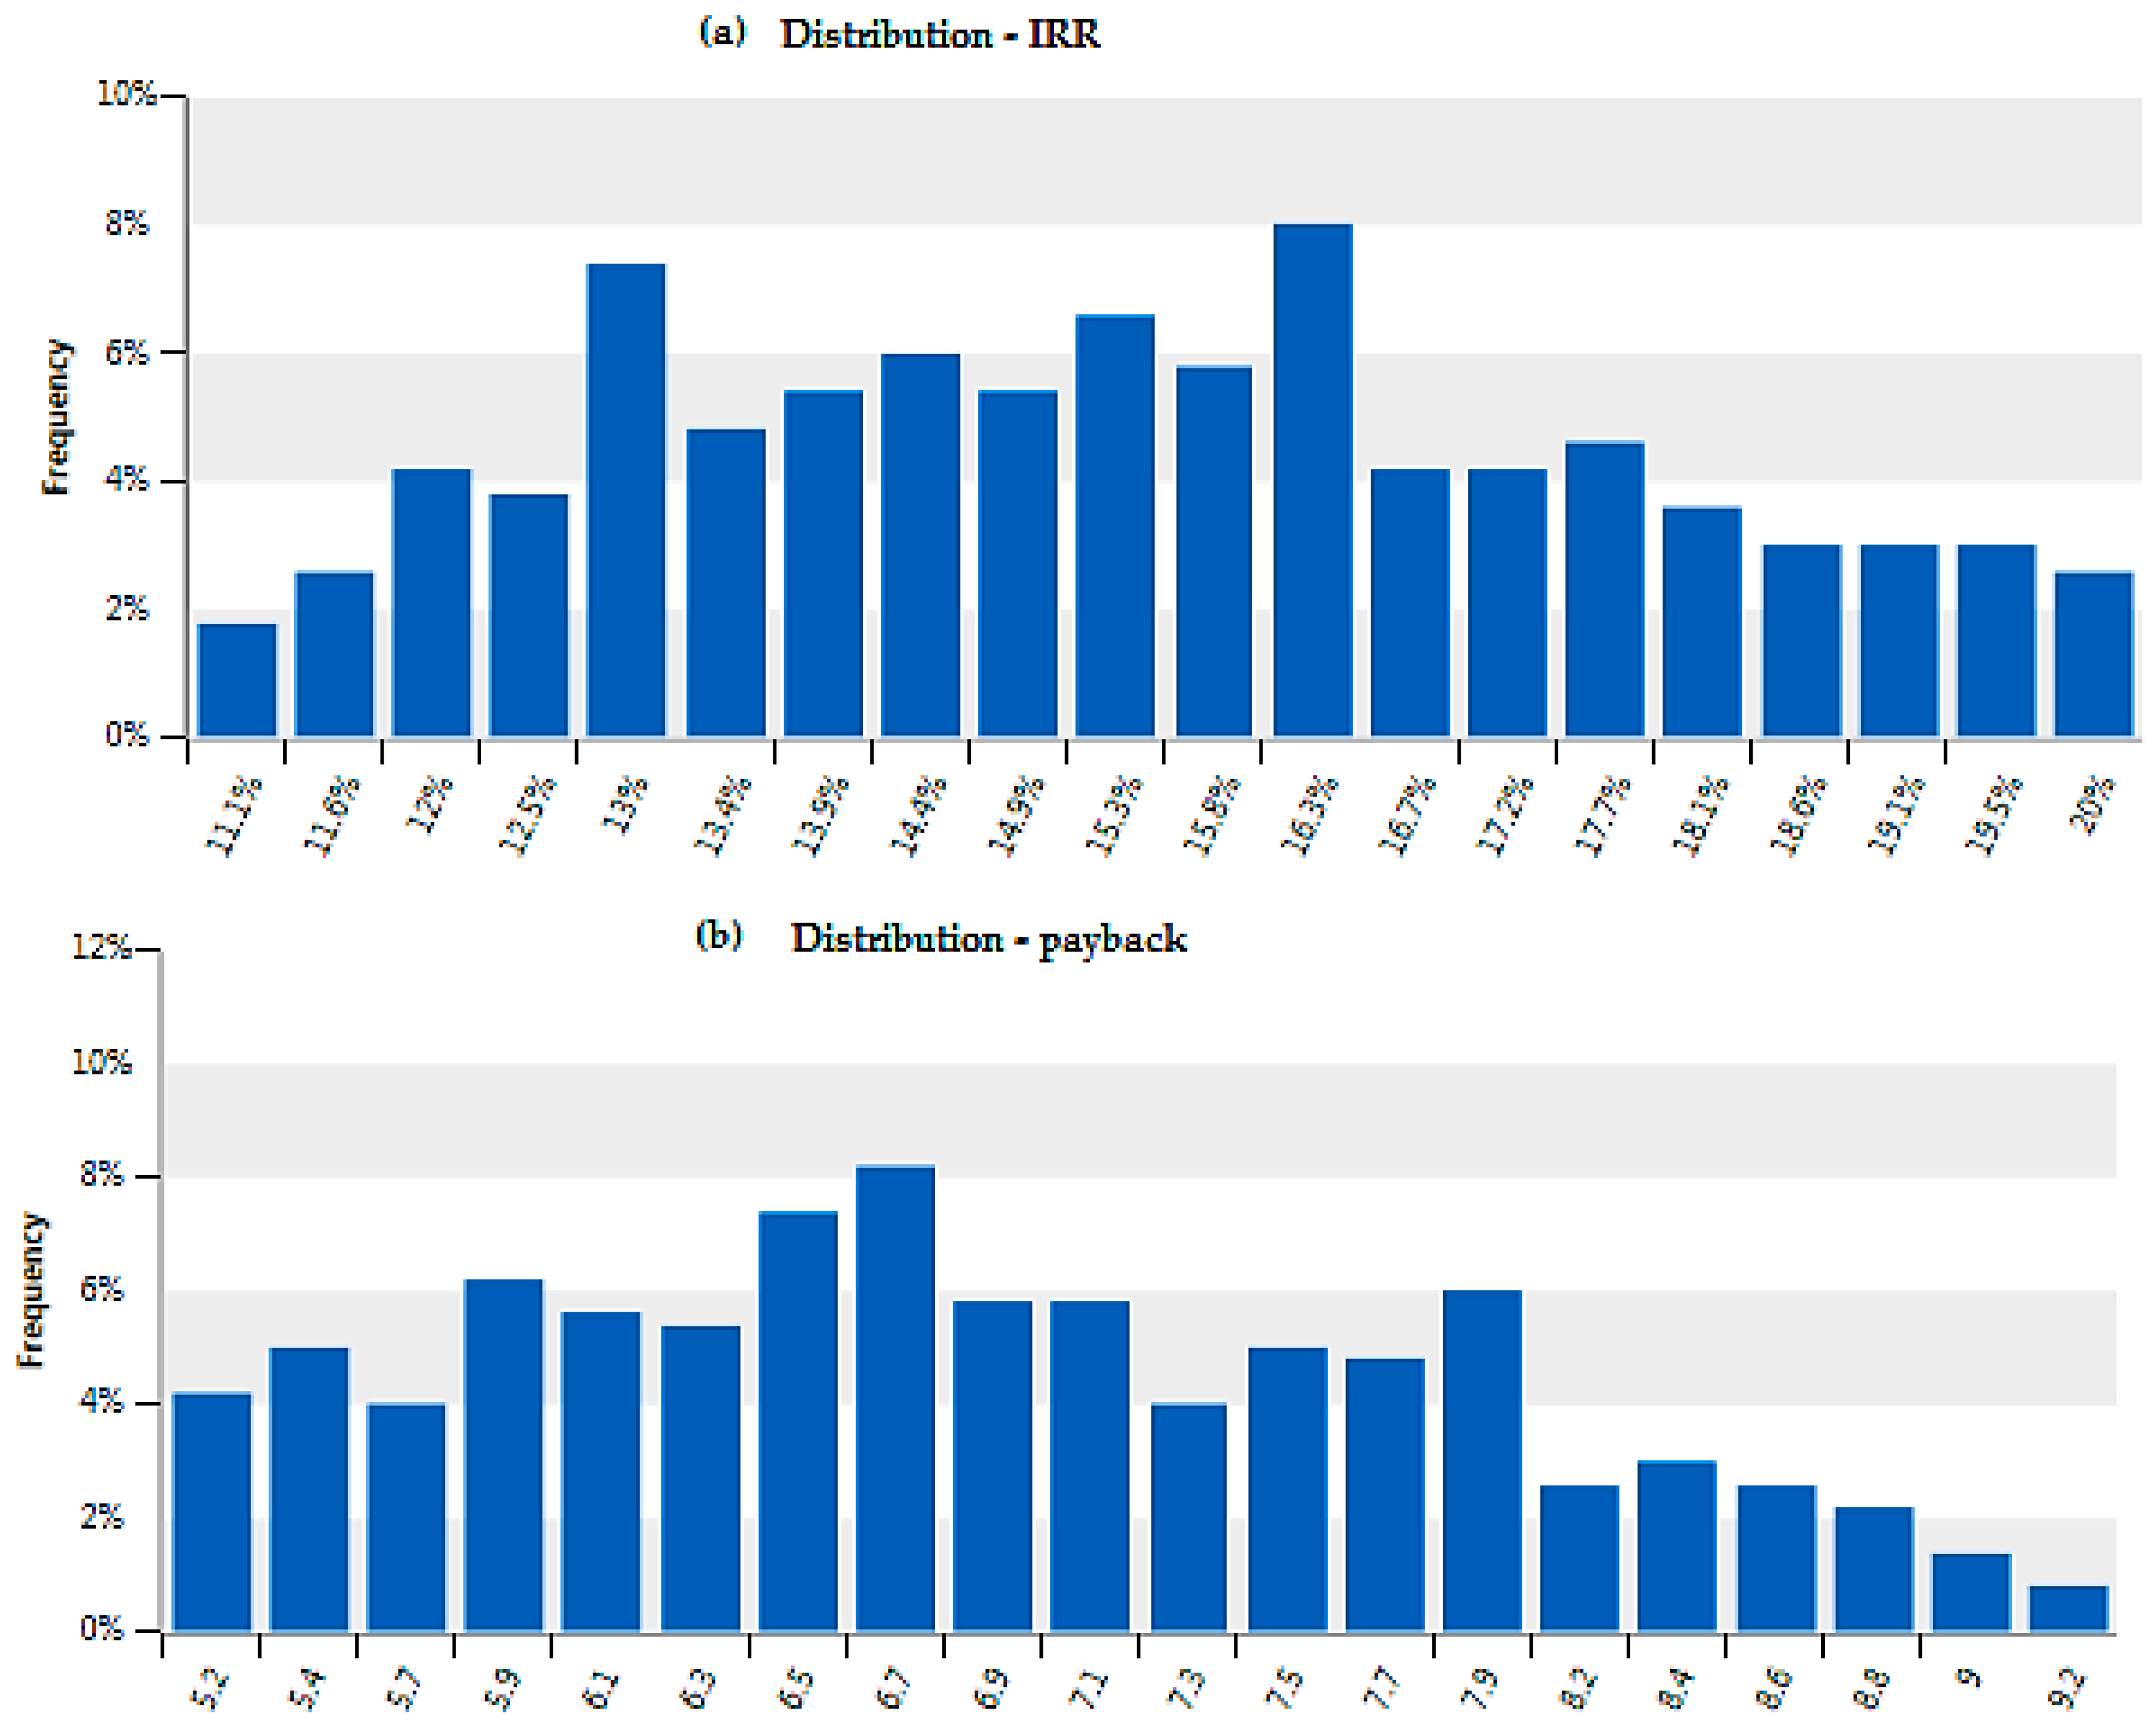
Risk analysis is an analytical framework for dealing with uncertainties of a project. The objective is to reduce the likelihood of carrying projects with loss while not failing to accept good projects as costs and benefits are subjected to uncertainties and may vary from the base case. The risk analysis provides a probability distribution of the project outcome and a level of risk associated with the project. The risk analysis has been done using RETScreen with a risk level of 10%. The obtained results of the risk analysis for the studied wind farm in this paper are illustrated in Figure 17. Different factors such as initial cost, operating and management cost, and debt have different impacts on the thermo-economic feasibility of the proposed project as can be observed in Figure 17. Initial cost is the largest, followed by operating and management costs (O&M). Furthermore, the results obtained for the IRR distribution and payback period are shown in Figure 18. The probability distributions of IRR and payback period show the feasibility of the studied project as the risk of the loss is much lower compared with the profit. The IRR is large between 13% and 16.5%, with two predominant peaks at 13% and 16.3%. On the other hand, the payback largely occurs for years less than 8, with a peak in the 6th year. It declines rapidly after the 8th year.
5. Conclusions
In this study, the RETScreen model is used to investigate the feasibility of a 100 MW wind farm for the climatic conditions of Dhahran, Riyadh, Jeddah, Guriat, and Nejran. The specific case of Saudi Arabia is considered because of a rapid increase in electricity consumption in the country which is posing technical and as well as economical stress on the utility and Ministry of Energy. The current shares of natural gas and oil used for power generation are 37% and 63%, respectively. Furthermore, comparative greenhouse gas (GHG) emissions for different countries indicate that Saudi Arabia is among the top ten countries in terms of GHG emissions. The implementation of the proposed renewable energy power system will help in boosting the deployment of such technologies and at the same time will address the problem GHG emissions.
The proposed wind farms can produce 245, 230, 234, 233.5, and 216 GWh of electricity annually for climatic the conditions of Dhahran, Riyadh, Jeddah, Guriat, and Nejran, respectively. Based on this cash flow simple payback periods of 5.9, 6.3, 6.2, 6.2, and 6.7 years are expected for Dhahran, Riyadh, Jeddah, Guriat, and Nejran, respectively. The average values of 23 and 18% are observed for IRR assets and equity, respectively, for all sites. All the financial indicators show that the proposed system seems to be economically feasible. Furthermore, it has been observed that a partial replacement of the current energy mix with the proposed wind power system can make net annual GHG reductions of 180,947; 169,077; 171,914; 171,567; and 159,596 tCO2 equivalent of GHG for Dhahran, Riyadh, Jeddah, Guriat, and Nejran, respectively. This significant decrease of harmful emissions can help to achieve sustainable development in the country. Furthermore, a sensitivity analysis indicated that government incentive of interest-free loans can play an important role in the development and promotion of wind power technology in this part of the world.
In this paper only wind power technology has been studied, showing a good prospect of electricity generation in KSA. On the other hand, in order to make renewable-based technologies more feasible, using wind power technology alone may not be enough. In that case, hybrid technologies should be considered which could be a combination of two or more different technologies such as wind and photovoltaic (PV). That is why; in future similar studies are required for climatic conditions of KSA which should include combinations of different renewable technologies. In this way, the effective utilization of wind and other renewable energy sources can be enhanced.
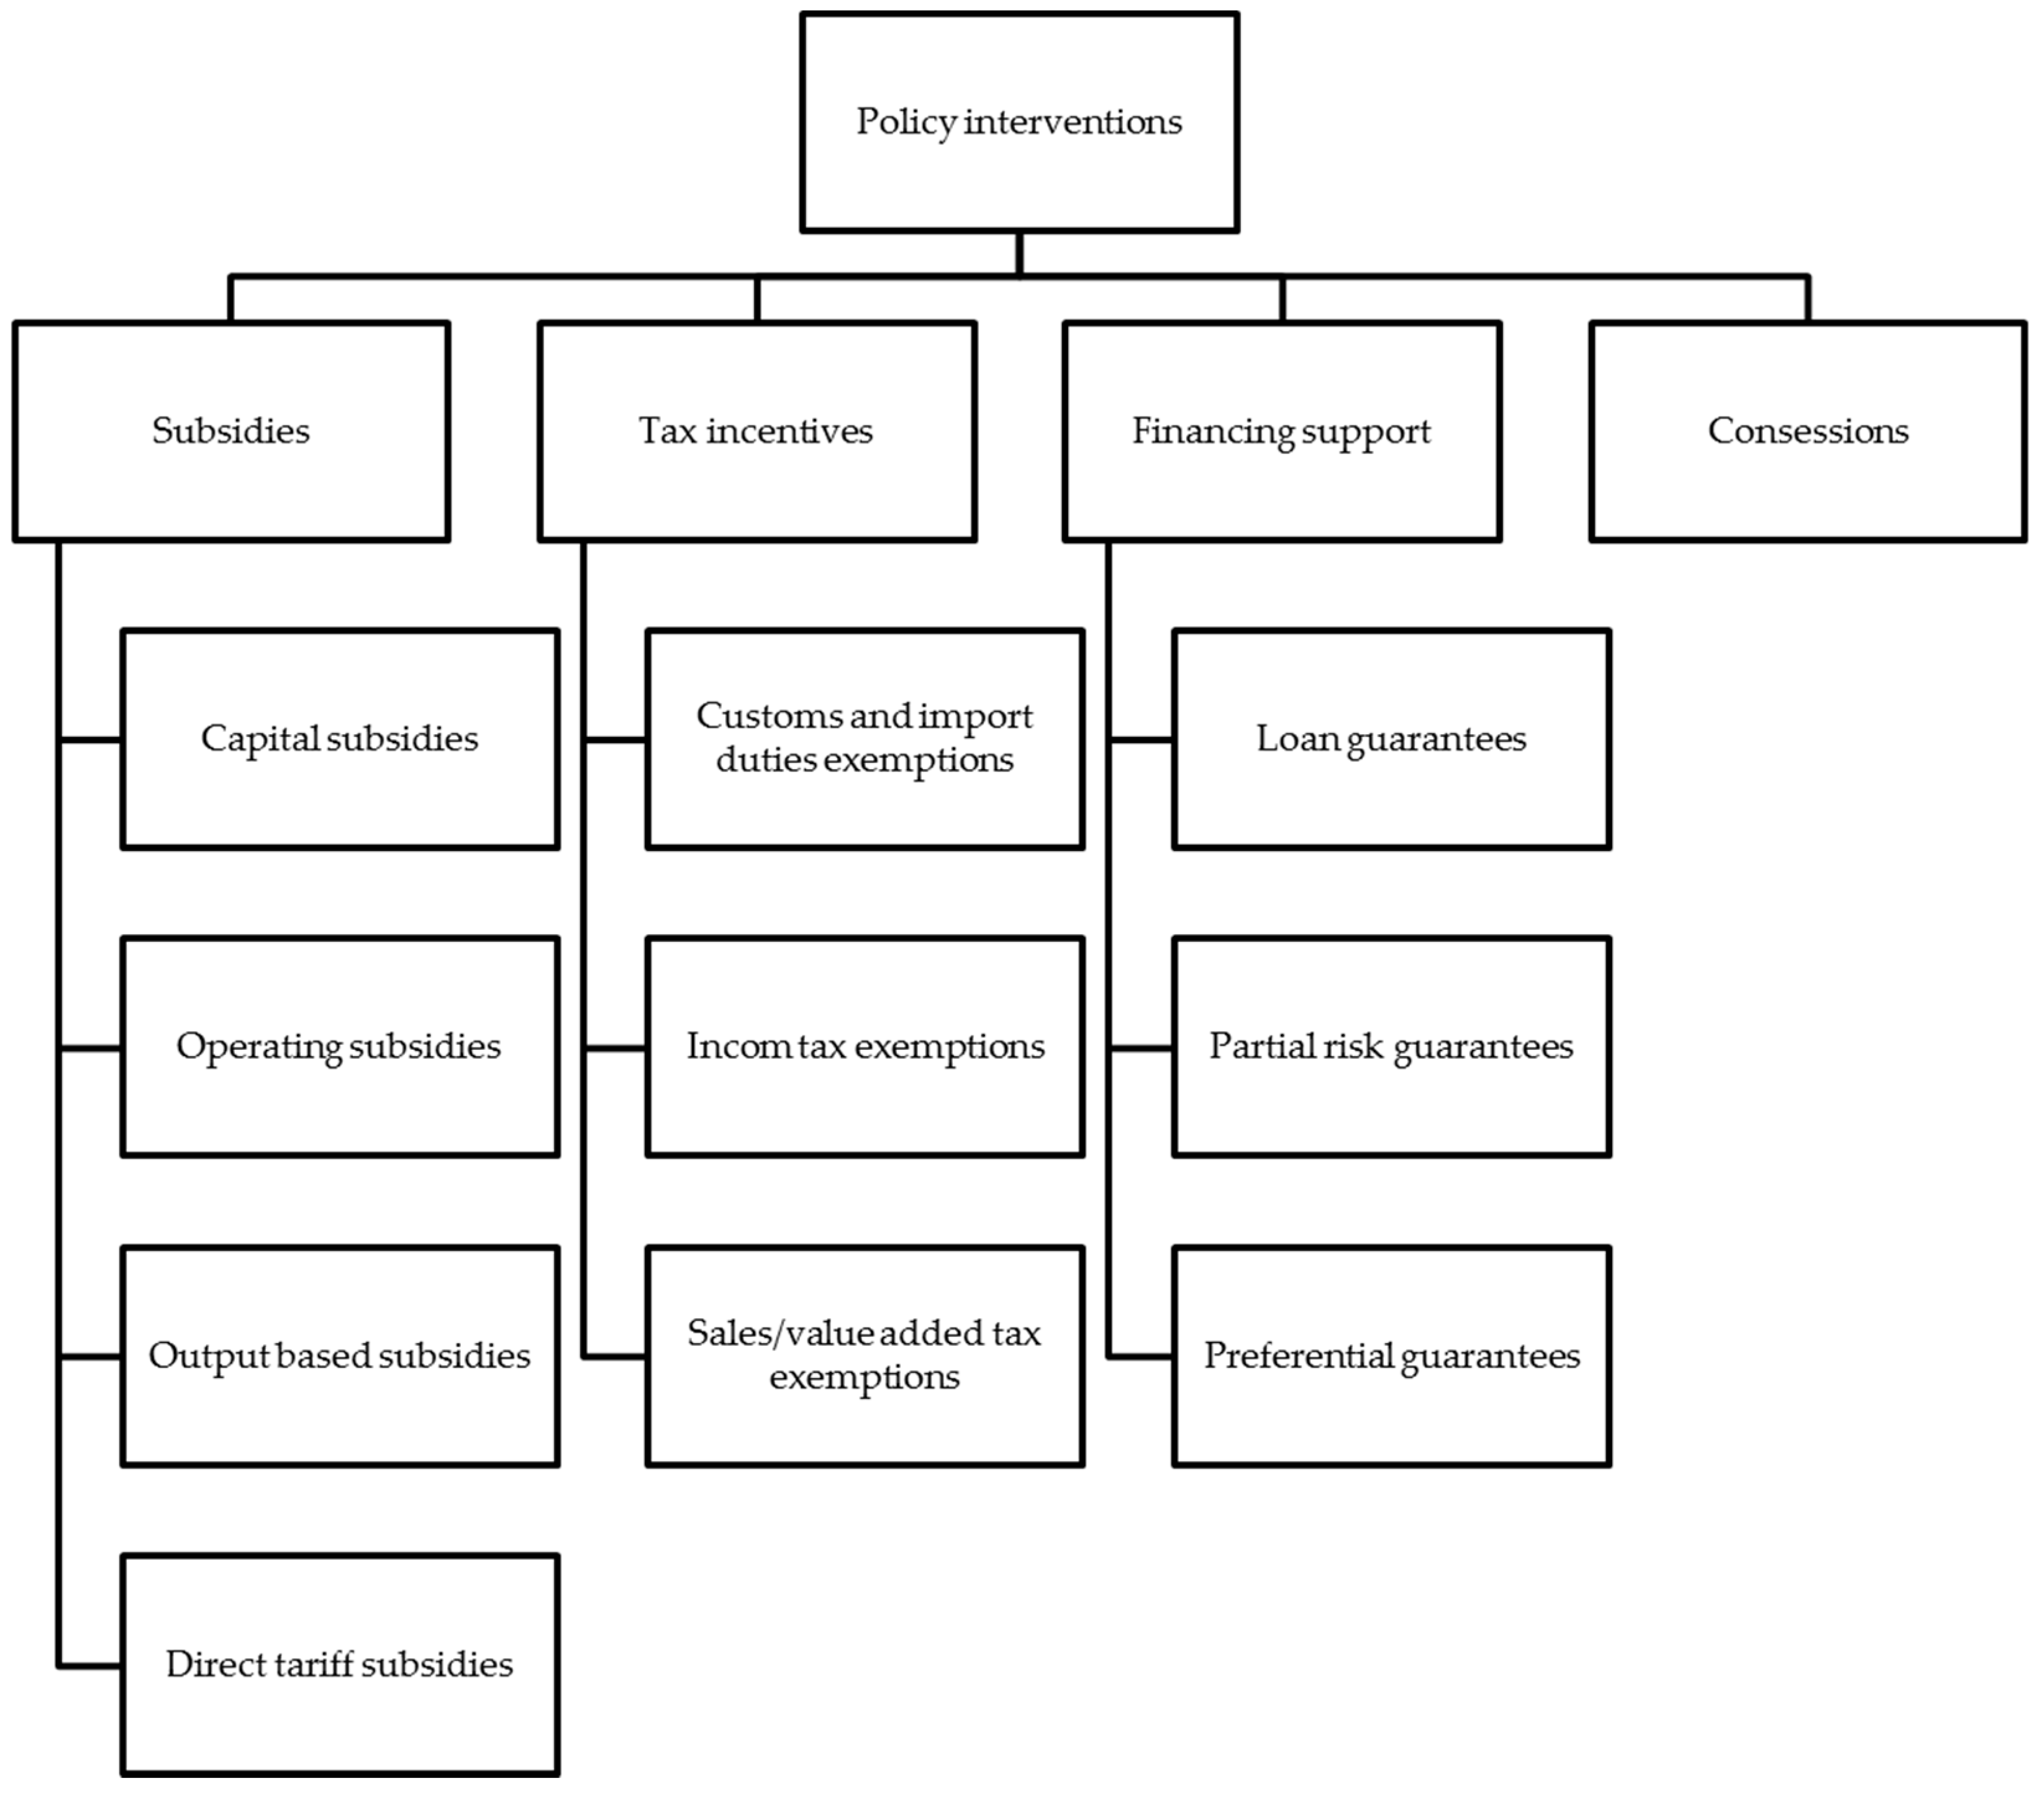
A public-private relationship should be built on a long-term basis for new investments and promotion of these technologies. The companies should be motivated for investment into wind energy projects by providing support and encouragements through different incentives. Different policy implications and interventions are required in order to overcome different barriers to the development and promotion of renewable technologies in the country. An overview of public policy interventions required is presented in Figure 19.
Author Contributions
M.M.R. conceived the idea, performed the simulations and wrote initial draft of the paper with the help of S.R., M.M.A. and L.M.A. helped in writing the paper. The paper was reviewed and revised by M.M. R. and S.R. The final draft of the paper was read and approved by all authors.
Funding
This research was funded by [The Deanship of Scientific Research (DSR) at King Fahd University of Petroleum & Minerals (KFUPM)] grant number [IN151026].
Acknowledgments
The authors would like to acknowledge the support provided by the Deanship of Scientific Research (DSR) at King Fahd University of Petroleum & Minerals (KFUPM) for funding this work through Grant number IN151026. Mr. Muhammad Mujahid Rafique (M. Mujahid Rafique) would like to acknowledge the support of Marie Curie Alumni Association. He carried out this work with the support of the Marie Curie Alumni Association.
Conflicts of Interest
There is no conflict of interest.
Nomenclature
| Af | Frontal area of the blade |
| CP | Total installed plant capacity (kw) |
| Cmax | Power coefficient (%) |
| CF | Capacity factor (%) |
| d | Discount rate (%) |
| E | End annual energy delivered (kwh/year) |
| GHGbase | Proposed case GHG emission factor |
| GHGproposed | Proposed case GHG emission factor |
| IRR | Internal rate of return (%) |
| I | Initial investment (US$) |
| NPV | Net present value (US$) |
| NCi | Net cash inflow (US$) |
| NCt | Total net cash (US$) |
| NCp | Net periodic cash flow (US$) |
| Pw | Wind power (W) |
| PBP | Payback period (years) |
| Pout | Power output from wind turbine (kwh) |
| τ | Time period (hour) |
| t | Number of time periods (%) |
| T | Time (s) |
| V | Wind velocity(m/s) |
| x | Distance (m) |
| ρ | Density of air (kg/m3) |
References
- Bhutta, M.M.A.; Hayat, N.; Farooq, A.U.; Ali, Z.; Jamil, S.R.; Hussain, Z. Vertical axis wind turbine—A review of various configurations and design techniques. Renew. Sustain. Energy Rev. 2012, 16, 1926–1939. [Google Scholar] [CrossRef]
- Fung, K.T.; Scheffler, R.L.; Stolpe, J. Wind energy—A utility perspective. IEEE Trans. Power Appar. Syst. 1981, 100, 1176–1182. [Google Scholar] [CrossRef]
- Armeanu, D.Ş.; Vintilă, G.; Gherghina, Ş.C. Does renewable energy drive sustainable economic growth? multivariate panel data evidence for EU-28 countries. Energies 2017, 10, 381. [Google Scholar] [CrossRef]
- Fang, Y.P. Economic welfare impacts from renewable energy consumption: The China experience. Renew. Sustain. Energy Rev. 2011, 15, 5120–5128. [Google Scholar] [CrossRef]
- Baker, J.R. Features to aid or enable self-starting of fixed pitch low solidity vertical axis wind turbines. J. Wind Eng. Ind. Aerod. 2003, 15, 369–380. [Google Scholar] [CrossRef]
- Joselin Herbert, G.M.; Iniyan, S.; Sreevalsan, E.; Rajapandian, S. A review of wind energy technologies. Renew. Sustain. Energy Rev. 2007, 11, 1117–1145. [Google Scholar] [CrossRef]
- Global Wind Report (GWEC). Available online: http://www.gwec.net/wp-content/uploads/vip/GWEC_PRstats2016_EN_WEB.pdf (accessed on 20 April 2018).
- BP Statistical Review of World Energy 2018. Available online: https://0-www-statista-com.brum.beds.ac.uk/statistics/265579/primary-energy-consumption-in-saudi-arabia/ (accessed on 3 August 2018).
- Rafique, M.M.; Rehman, S.; Lashin, A.; Al Arifi, N. Analysis of a solar cooling system for climatic conditions of five different cities of Saudi Arabia. Energies 2016, 9, 75. [Google Scholar] [CrossRef]
- World Resources Institute (WRI). Climate Analysis Indicators Tool (CAIT). World Resources Institute. Available online: http:// cait.wri.org (accessed on 6 April 2018).
- Pinson, P. Wind energy: Forecasting challenges for its operational management. Stat. Sci. 2013, 28, 564–585. [Google Scholar] [CrossRef]
- Zhang, Y.; Wang, J. K-nearest neighbors and a kernel density estimator for GEFCom2014 probabilistic wind power forecasting. Int. J. Forecast. 2016, 32, 1074–1080. [Google Scholar] [CrossRef]
- Pinson, P.; Chevallier, C.; Kariniotakis, G.N. Trading wind generation from short-term probabilistic forecasts of wind power. IEEE Trans. Power Syst. 2007, 22, 1148–1156. [Google Scholar] [CrossRef] [Green Version]
- Zhang, Y.; Wang, J.; Zeng, B.; Hu, Z. Chance-constrained two-stage unit commitment under uncertain load and wind power output using bilinear benders decomposition. IEEE Trans. Power Syst. 2017, 32, 3637–3647. [Google Scholar] [CrossRef]
- Rehman, S.; Alam, M.M.; Alhems, L.M.; Rafique, M.M. Horizontal Axis Wind Turbine Blade Design Methodologies for Efficiency Enhancement—A Review. Energies 2018, 11, 506. [Google Scholar] [CrossRef]
- Rehman, S.; Ali, S.; Khan, S. Wind Farm Layout Design Using Cuckoo Search Algorithms. Appl. Artif. Intell. 2016, 30, 899–922. [Google Scholar] [CrossRef]
- Shoaib, M.; Siddiqui, I.; Rehman, S.; Rehman, S.; Khan, S.; Lashin, A. Comparison of Wind Energy Generation Using the Maximum Entropy Principle and the Weibull Distribution Function. Energies 2016, 9, 842. [Google Scholar] [CrossRef]
- Mohandes, M.A.; Rehman, S. Short term wind speed estimation in Saudi Arabia. J. Wind Eng. Ind. Aerod. 2014, 128, 37–53. [Google Scholar] [CrossRef]
- Bagiorgas, H.S.; Mihalakakou, G.; Rehman, S.; Al-Hadhrami, L.M. Wind power potential assessment for three buoys data collection stations in the Ionian Sea using Weibull distribution function. Int. J. Green Energy 2016, 13, 703–714. [Google Scholar] [CrossRef]
- Himri, Y.; Rehman, S.; Himri, S.; Mohammadi, K.; Sahin, B.; Malik, A.S. Investigation of wind resources in Timimoun region, Algeria. Wind Eng. 2016, 40, 250–260. [Google Scholar] [CrossRef]
- Ramli, M.A.M.; Twaha, S.; ZakariyaAl-Hamouz, Z. Analyzing the potential and progress of distributed generation applications in Saudi Arabia: The case of solar and wind resources. Renew. Sustain. Energy Rev. 2017, 70, 287–297. [Google Scholar] [CrossRef]
- Eltamaly, A.M. Design and implementation of wind energy system in Saudi Arabi. Renew. Energy 2013, 60, 42–52. [Google Scholar] [CrossRef]
- Rehman, S.; Ahmad, A. Assessment of wind energy potential for coastal locations of the Kingdom of Saudi Arabia. Energy 2004, 29, 1105–1115. [Google Scholar] [CrossRef]
- Bassyouni, M.; Gutub, S.; Javaid, U.; Awais, M.; Rehman, S.; Abdel-Hamid, S.; Abdel-Aziz, M.; Abouel-Kasem, A.; Shafeek, H. Assessment and analysis of wind power resource using weibull parameters. Energy Explor. Exploit. 2015, 33, 105–122. [Google Scholar] [CrossRef]
- Baseer, M.A.; Meyer, J.P.; Alam, M.M.; Rehman, S. Wind speed and power characteristics for Jubail industrial city, Saudi Arabia. Renew. Sustain. Energy Rev. 2015, 52, 1193–1204. [Google Scholar] [CrossRef] [Green Version]
- Shaahid, S.M.; Al-Hadhrami, L.M.; Rahman, M.K. Economic feasibility of development of wind power plants in coastal locations of Saudi Arabia—A review. Renew. Sustain. Energy Rev. 2013, 19, 589–597. [Google Scholar] [CrossRef]
- Rehman, S.; Halawani, T.O.; Mohandes, M. Wind power cost assessment at twenty locations in the Kingdom of Saudi Arabia. Renew. Energy 2003, 28, 573–583. [Google Scholar] [CrossRef]
- Rehman, S. Wind energy resources assessment for Yanbo, Saudi Arabia. Energy Convers. Manag. 2004, 45, 2019–2032. [Google Scholar] [CrossRef]
- Mohandes, M.A.; Rehman, S.; Halawani, T.O. A neural networks approach for wind speed prediction. Renew. Energy 1998, 13, 345–354. [Google Scholar] [CrossRef]
- Zheng, Q.; Rehman, S.; Alam, M.; Alhems, L.M.; Lashin, A. Decomposition of wind speed fluctuations at different time scales. J. Earth Syst. Sci. 2017, 126. [Google Scholar] [CrossRef]
- Alam, M.M.; Rehman, S.; Al-Hadhrami, L.M.; Meyer, J.P. Extraction of the inherent nature of wind speed using wavelets and FFT. Energy Sustain. Dev. 2014, 22, 34–47. [Google Scholar] [CrossRef] [Green Version]
- Siddiqi, A.H.; Khan, S.; Rehman, S. Wind Speed Simulation Using Wavelets. Am. J. Appl. Sci. 2005, 2, 557–564. [Google Scholar] [CrossRef]
- Rehman, S.; Khan, S. Fuzzy Logic Based Multi-Criteria Wind Turbine Selection Strategy—A Case Study of Qassim, Saudi Arabia. Energies 2016, 9, 872. [Google Scholar] [CrossRef]
- Rehman, S.; Al-Abbadi, N.M. Wind power characteristics on the North West coast of Saudi Arabia. Energy Environ. 2009, 20–21, 1257. [Google Scholar] [CrossRef]
- Al-Abbadi, N.M.; Rehman, S. Wind speed and wind power characteristics for Gassim, Saudi Arabia. Int. J. Green Energy 2009, 6, 201–217. [Google Scholar] [CrossRef]
- Rehman, S.; Al-Abbadi, N.M. Wind shear coefficient, turbulence intensity and wind power potential assessment for Dhulom, Saudi Arabia. Renew. Energy 2008, 33, 2653–2660. [Google Scholar] [CrossRef] [Green Version]
- Rehman, S.; Al-Abbadi, N.M. Wind shear coefficients and energy yield for Dhahran, Saudi Arabia. Renew. Energy 2007, 32, 738–749. [Google Scholar] [CrossRef]
- Rehman, S.; Al-Abbadi, N.M. Wind shear coefficients and their effect on energy production. Energy Convers. Manag. 2005, 46, 2578–2591. [Google Scholar] [CrossRef]
- Rehman, S.; Halawani, T.O. Statistical characteristics of wind in Saudi Arabia. Renew. Energy 1994, 4, 949–956. [Google Scholar] [CrossRef]
- Rehman, S.; Halawani, T.O.; Husain, T. Weibull parameters for wind speed distribution in Saudi Arabia. Sol. Energy 1994, 53, 473–479. [Google Scholar] [CrossRef]
- Rehman, S.; Ahmed, M.A.; Mohand, H.M.; Al-Sulaiman, F.A. Feasibility study of the grid connected 10 MW installed capacity PV power plants in Saudi Arabia. Renew. Sustain. Energy Rev. 2017, 80, 319–329. [Google Scholar] [CrossRef]
Figure 1.
Cumulative global wind power installed capacity [7].
Figure 1.
Cumulative global wind power installed capacity [7].

Figure 2.
Annual global added wind power capacity [7].
Figure 2.
Annual global added wind power capacity [7].

Figure 3.
Growth of primary energy demand in KSA [8].
Figure 3.
Growth of primary energy demand in KSA [8].

Figure 4.
Carbon dioxide emission by country for year 2016. (Source: Germanwatch, the Climate Change Performance Index 2017).
Figure 4.
Carbon dioxide emission by country for year 2016. (Source: Germanwatch, the Climate Change Performance Index 2017).

Figure 5.
Carbon dioxide emission for Saudi Arabia: years 1970–2016. (Source: CO2 time series 1990-2015 per region/country, Netherlands Environmental Assessment Agency).
Figure 5.
Carbon dioxide emission for Saudi Arabia: years 1970–2016. (Source: CO2 time series 1990-2015 per region/country, Netherlands Environmental Assessment Agency).

Figure 6.
Emissions of greenhouse gases in Saudi Arabia by sector [10].
Figure 6.
Emissions of greenhouse gases in Saudi Arabia by sector [10].

Figure 7.
RETScreen model flow chart.

Figure 8.
Regional map of Saudi Arabia.

Figure 9.
Monthly wind speed for all sites (source: NASA).

Figure 10.
Wind turbine power and energy curve.

Figure 11.
Annual power exported to grid for all sites.

Figure 12.
Achieved capacity factor for all sites.

Figure 13.
Cumulative cash flow for all sites.


Figure 14.
Simple and equity payback for all sites.

Figure 15.
IRR assets and equity for all sites.

Figure 16.
Effect of incentives on payback period.

Figure 17.
Risk impact; (a) IRR (%), (b) payback (year).

Figure 18.
Risk distribution; (a) IRR (%), (b) payback (year).

Figure 19.
Policy interventions in support of wind power system.


Table 1.
Geographic data for all sites.
| Parameter | Dhahran | Riyadh | Jeddah | Guriat | Nejran |
|---|---|---|---|---|---|
| Latitude (°N) | 26.3 | 24.7 | 21.7 | 31.4 | 17.6 |
| Longitude (°E) | 50.2 | 46.7 | 39.2 | 37.3 | 44.4 |
| Elevation (m) | 17.0 | 620.0 | 17.0 | 504.0 | 1212.0 |
Table 2.
Specifications of wind turbine.
| Parameter | Unit | Value |
|---|---|---|
| Power capacity per turbine | kW | 1300 |
| Manufacturer | Siemens | - |
| Model | AN BONUS 1.3 MW-60 m | - |
| Number of turbines | - | 77 |
| Hub height | m | 60 |
| Rotor diameter per turbine | m | 62 |
| Swept area per turbine | m² | 3019.07 |
| Shape factor | - | 2 |
| Power coefficient | % | 45 |
| Array losses | % | 3 |
| Airfoil losses | % | 2 |
| Miscellaneous losses | % | 3 |
| Availability | % | 98 |
Table 3.
Monthly power exported to grid for all sites (MWh).
| Months | Dhahran | Riyadh | Jeddah | Guriat | Nejran |
|---|---|---|---|---|---|
| January | 21,842 | 20,452 | 20,258 | 20,635 | 18,981 |
| February | 19,591 | 18,271 | 18,275 | 18,475 | 16,936 |
| March | 21,368 | 19,884 | 20,067 | 20,155 | 18,515 |
| April | 20,234 | 18,840 | 19,196 | 19,110 | 17,730 |
| May | 20,420 | 19,029 | 19,655 | 19,407 | 18,107 |
| June | 19,449 | 18,182 | 18,913 | 18,559 | 17,385 |
| July | 19,963 | 18,668 | 19,429 | 19,031 | 17,840 |
| August | 20,040 | 18,705 | 19,437 | 19,049 | 17,883 |
| September | 19,690 | 18,386 | 18,918 | 18,661 | 17,552 |
| October | 20,746 | 19,429 | 19,736 | 19,665 | 18,525 |
| November | 20,562 | 19,295 | 19,300 | 19,538 | 18,195 |
| December | 21,679 | 20,335 | 20,143 | 20,568 | 18,957 |
| Annual Average | 20,465 | 19,123 | 19,444 | 19,405 | 18,051 |
Table 4.
Financial parameters.
| Factor | Unit | Value |
|---|---|---|
| Inflation rate | % | 3 |
| Discount rate | % | 0 |
| Project life | year | 25 |
| Debt ratio | % | 25 |
| Debt interest rate | % | 0 |
| Debt term | year | 20 |
Table 5.
Net annual reduction of GHG emissions for all sites.
| Cities | Net Annual Reduction of GHG Emissions (tCO2) | Cars and Light Trucks Not Used | Hectres of Forest Absorbing Carbon | Peoples Reducing Energy Use by 20% |
|---|---|---|---|---|
| Dhahran | 180,947 | 33,140 | 41,124 | 180,947 |
| Riyadh | 169,077 | 30,967 | 15,551 | 169,077 |
| Jeddah | 171,914 | 31,486 | 15,812 | 171,915 |
| Guriat | 171,567 | 31,423 | 15,780 | 171,568 |
| Nejran | 159,596 | 29,230 | 36,272 | 159,596 |
© 2018 by the authors. Licensee MDPI, Basel, Switzerland. This article is an open access article distributed under the terms and conditions of the Creative Commons Attribution (CC BY) license (http://creativecommons.org/licenses/by/4.0/).
Share and Cite
MDPI and ACS Style
Rafique, M.M.; Rehman, S.; Alam, M.M.; Alhems, L.M. Feasibility of a 100 MW Installed Capacity Wind Farm for Different Climatic Conditions. Energies 2018, 11, 2147. https://0-doi-org.brum.beds.ac.uk/10.3390/en11082147
AMA Style
Rafique MM, Rehman S, Alam MM, Alhems LM. Feasibility of a 100 MW Installed Capacity Wind Farm for Different Climatic Conditions. Energies. 2018; 11(8):2147. https://0-doi-org.brum.beds.ac.uk/10.3390/en11082147
Chicago/Turabian StyleRafique, M. Mujahid, Shafiqur Rehman, Md. Mahbub Alam, and Luai M. Alhems. 2018. "Feasibility of a 100 MW Installed Capacity Wind Farm for Different Climatic Conditions" Energies 11, no. 8: 2147. https://0-doi-org.brum.beds.ac.uk/10.3390/en11082147
Note that from the first issue of 2016, this journal uses article numbers instead of page numbers. See further details here.