Influencing Factors and Scenario Forecasts of Carbon Emissions of the Chinese Power Industry: Based on a Generalized Divisia Index Model and Monte Carlo Simulation

Abstract
:1. Introduction
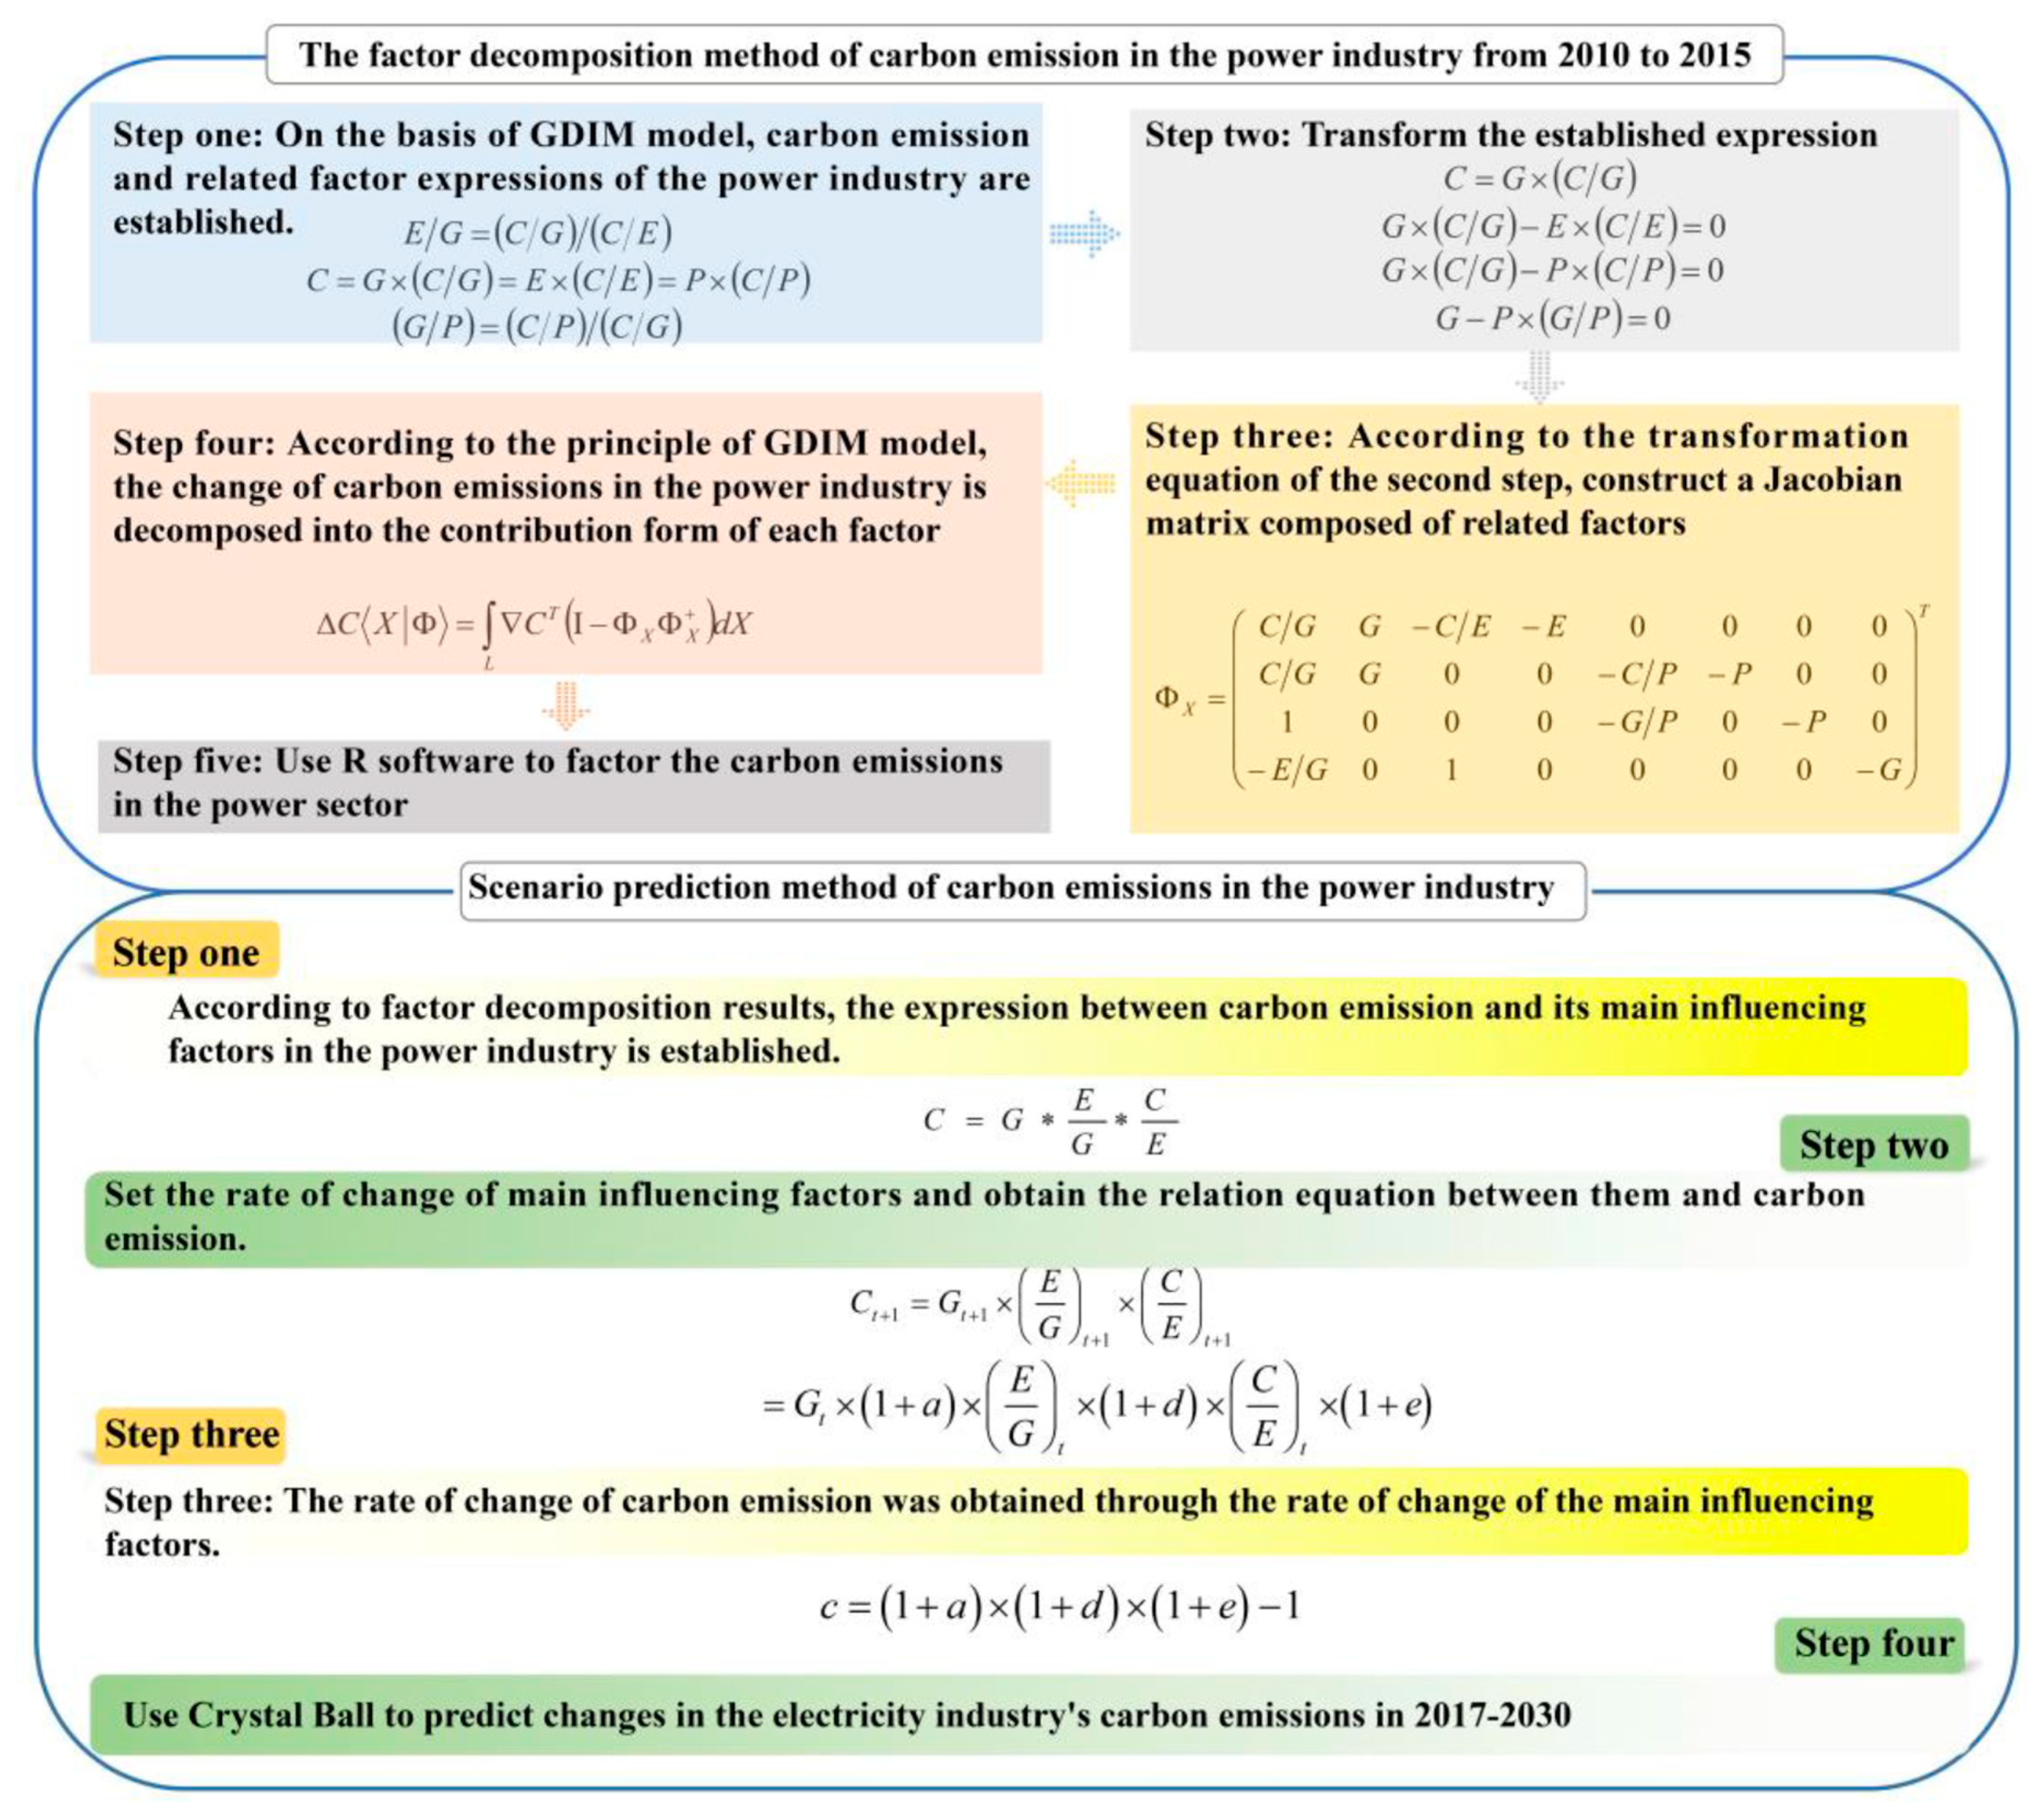
- In applying the factor decomposition method, this study is the first to apply the Generalized Divisia Index Model (GDIM) to factor decomposition of carbon emissions by the power industry. The GDIM model can not only make up the factor dependence of the existing exponential decomposition model, but also considers the potential factors in the decomposition process and investigates the effect of multiple absolute factors and relative indices on carbon emissions. This paper uses the GDIM model to decompose the change of carbon emissions in China’s power industry into absolute and relative value indices, which are not realized by other exponential decomposition methods. As the decomposition results reveal correlations among factors, no double-counting applies, which can make up for shortcomings of existing research methods while allowing a more complete and accurate analysis of the actual impacts of various factors on carbon emissions by the power industry.
- In the selection of factor decomposition variables, this paper gives full consideration to the influence of the economy, population, energy consumption factors, and relative factors produced by absolute factors on the change of carbon emissions in the power industry. The paper examines the three absolute factors of the economy, population size, and energy consumption in measuring carbon emissions by the power industry and identifies relevant relative factors derived from three absolute factors, which make up the insufficiency of the analysis of carbon emissions from the electric power production and industrial angle. In addition, absolute factors and relative factors are taken into consideration, rendering our analysis of carbon emissions by the power industry more complete.
- In the prediction of carbon emissions in the power industry, the first use of Monte Carlo simulation technology, and the uncertainty is considered in the scenario analysis. The Monte Carlo method is a dynamic simulation method that randomly applies and combines model variables on a probabilistic basis. The advantage of this method is that it can estimate the future change trend according to the assumption value of each use factor based on the relevant research. Because the uncertainty is considered, the pre-judgment results that are generated are more scientific and reasonable than those of other simulation methods. This paper combines China’s development planning with a Monte Carlo simulation to forecast the situation of China’s power industry, which can not only embody the inertial logic in a static scenario analysis, but also considers the uncertainty of the related influencing factors in the future evolution, such that the basic logic and scientific methods can be combined organically.
2. Literature Review
- Regarding research methods, at present, the exponential decomposition method used in power industry factor decomposition is based on a Kaya identity. Kaya identity is determined by multiplying factors such that they are interdependent in form, and thus, decomposition results are affected by the factors selected. When the same target variable is decomposed, the selection of different factors will lead to contradictory conclusions. In addition, the exponential decomposition method used in the prior studies can only be used to analyze the impacts of a change in the absolute number of factors, and it cannot take other related absolute and implicit factors into account, rendering the analysis unilateral.
- On the selection of research factors, the factor selected for the factor decomposition of the power industry presents a certain degree of one-sidedness. In the literature, two forms of factor selection are mainly used when factoring the power industry: (1) The first approach involves considering the impact of a single factor or policy on carbon emissions by the power industry, such that while research elements or policies can be studied through an accurate and in-depth analysis, the potential of carbon emissions by the power industry cannot be explored. (2) From an industrial point of view, they only consider the impact of production-side factors on carbon emissions by the power industry while neglecting the impact of output scales and population sizes, thus producing incomplete research results.
- Regarding carbon emissions projections, most scenario analyses of various factors apply a fixed rate of change. In fact, the future development of various factors is largely uncertain and the potential rate of change should fall within a range of values. Using a fixed rate of change for forecasting can generate large deviations in forecasted results from future developments.
3. Methods
3.1. Electricity Industry Carbon Emissions Calculations
3.2. Model Construction for the Decomposition of Carbon Emission Factors by the Power Industry
3.3. Scenario Forecast Model Construction and Scenario Setting for Carbon Emissions by the Power Industry
3.4. Summary of the Research Methods
4. Result Analysis
4.1. Result Analysis of the Factor Decomposition of Carbon Emissions by the Power Industry
4.2. Dynamic Predictions of the Evolution of Future Carbon Emissions by the Power Industry
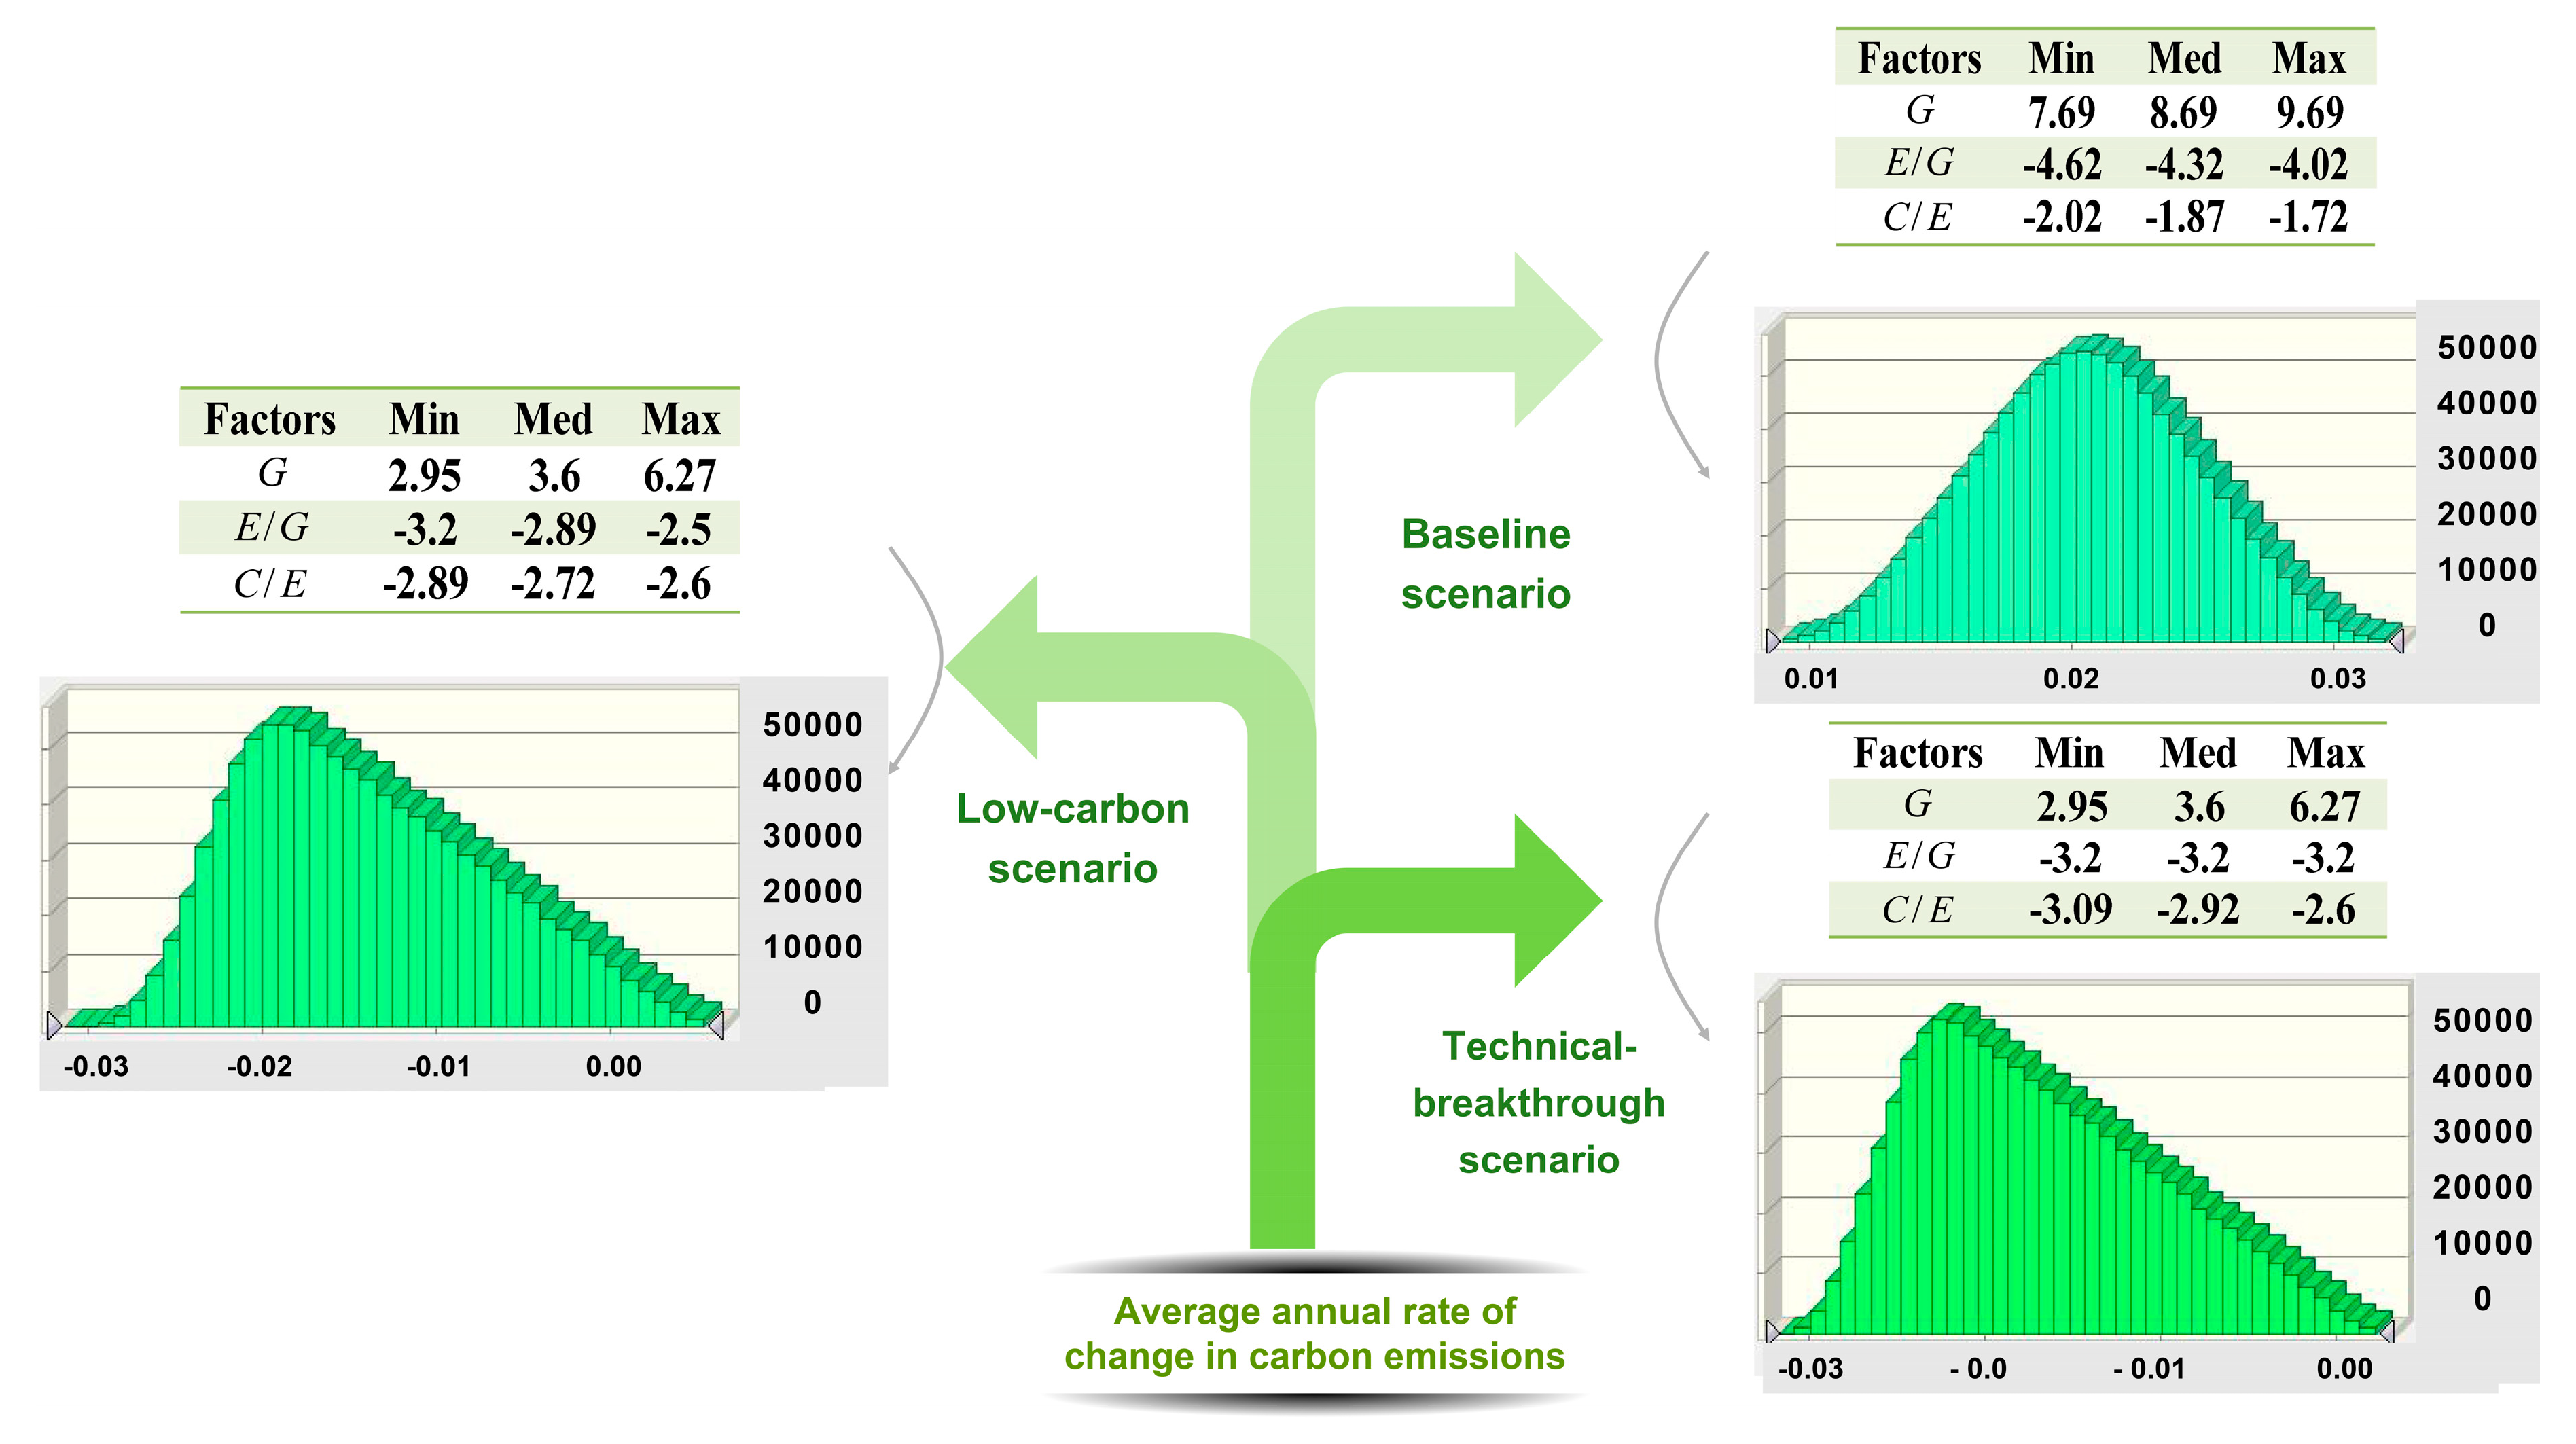
- Under the baseline scenario, the average yearly growth rate of the maximum probability of carbon emissions in China’s power industry for 2017 to 2030 is expected to range between 1.9% and 2.2%. The forecasted growth rate of carbon emissions under the baseline scenario shows that in the current development of economic and carbon emissions, the power industry is expected to have a rebound in carbon emissions, with an annual growth probability of 1.9–2.2% in 2017–2030. When calculated according to the minimum rate of increase, carbon emissions generated by the power sector in 2030 are expected to reach 4079.14 million tons under the baseline scenario.
- Under the low carbon scenario, the average annual growth rate of carbon emissions in China’s power industry for 2017 to 2030 is likely to range between −2.1% and −1.6%. Compared to the baseline scenario, carbon emissions will continue to decline in the low-carbon scenario. As the low-carbon scenario was based on a series of related goals set forth by the country’s current carbon emissions, this shows that the government’s green development plan for the future of the country is expected to have a catalytic effect in reducing carbon emissions generated by the power sector.
- With regard to technological breakthroughs, the average annual growth rate of the maximum probability in carbon emissions in China’s power industry for 2017 to 2030 is expected to range between −2.4% and −1.9%. Compared to those of the baseline and low-carbon scenarios, reductions in carbon emissions achieved under the technology breakthrough scenario are expected to be the greatest. At this time, carbon emissions reduction achieved in the power sector under this scenario are expected to be the best among the three scenarios.
5. Discussion and Analysis
5.1. The Results of This Paper Are Compared to Those of Previous Studies
5.2. The Significance of Research Results Presented in This Paper
5.3. Study Limitations and Avenues for Future Research
- Future research can estimate the responsibility for carbon emissions in the provincial power industry, and synthetically consider the responsibilities of producers and consumers. It is beneficial for all regions to undertake the responsibility of carbon emissions reduction fairly and achieve coordinated emissions reduction in all regions.
- Track and analyze the carbon intensity of demand-side power such that users can understand their carbon emissions responsibility and increase the enthusiasm of users for clean energy consumption.
- For the generator sets with different carbon emission factors, study the unit’s power generation, market electricity price, and carbon emissions, and establishing a carbon emission right allocation mechanism with strong emissions reduction incentives.
- Compare the international carbon emissions trading system with China’s carbon emissions trading system, and analyze the shortcomings and advantages of China’s carbon emissions trading system compared with other countries. Furthermore, draw lessons from countries and improving China’s carbon emissions trading system combined with China’s reality.
- Analyze the impact of the implementation of carbon tax policy on carbon emissions reduction in the power industry, demonstrate the feasibility of incorporating the carbon tax into the future carbon emissions reduction policy, and provide reference for the government to introduce a carbon tax policy.
6. Main Conclusions and Recommendations
6.1. Main Conclusions
6.2. Recommendations
- Promote green economics and reduce total energy consumption. Accelerate the transformation of economic development modes; focus on the quality of economic growth; and gradually adopt new economic models that limit energy consumption, pollution and emissions generation while upgrading industrial structures to change the structure of electricity consumption. In addition, change the traditional method of coal combustion, realize secondary processing of coal, and reduce end-use energy consumption, especially in energy intensive sectors, such as steel manufacturing.
- Improve public awareness of energy conservation issues and optimize energy consumption structures. Encourage energy conservation policies, formulate relevant energy efficiency standards and norms, enhance public awareness of energy saving and emissions reduction, and reduce electricity consumption. At the same time, limit thermal power production using coal and improve the ratio of natural gas to fossil energy use. To protect the environment, develop solar energy, hydropower, wind energy, and low-carbon energy generation options by encouraging low-carbon energy power generation and reduce carbon emissions by the power industry.
- Encourage the use of low-carbon equipment and boost technological innovation research and development. At present, the international investment in innovation and research and development continues to increase. In 2017, the European Union issued the third phase of “Horizon 2020” [73], which comprehensively proposed the goals of climate action and sustainable development, and invested 2.205 billion euros to support the research and innovation of energy technology. As the world’s largest carbon emitter, China should upgrade energy-saving and emissions-reduction equipment in the power industry, strengthen international exchanges and cooperation in environmental technologies, and increase investment in innovative technologies for emissions reduction on the basis of adhering to a series of low-carbon development measures. At the same time, the government must encourage enterprises to adopt incentives and invest more in continuous research and development in new energy savings and emissions-reducing technologies as well as production equipment. Low-carbon technologies must be developed to realize further reductions in electric carbon emissions by the power industry.
- Explore the market potential of biomass power generation. Based on Molina’s research [74,75,76], and combined with the current situation of China’s agriculture, biomass power generation should be vigorously developed. The utilization of agricultural and forestry wastes by biomass power generation not only eliminates methane emissions from biomass stacking or landfill fermentation, but also promotes the development of carbon emissions reduction in the power industry, which fully embodies the concept of a circular economy. The government should adopt an active incentive mechanism to enhance the enthusiasm and market activity of biomass power generation industry to a greater extent.
Author Contributions
Acknowledgments
Conflicts of Interest
References
- Global Warming. Available online: https://www.pishu.cn/psbk/psgd/zyhj/383725.shtml (accessed on 30 August 2018).
- Ge, Q.S.; Wang, F.; Wang, S.W.; Cheng, B.B. Determination and uncertainty of seven questions about global warming. China Popul. Resour. Environ. 2014, 24, 1–6. [Google Scholar]
- Blunden, J.; Arndt, D.S.; Baringer, M.O. State of the Climate in 2010. Bull. Am. Meteorol. Soc. 2011, 92, S1–S236. [Google Scholar] [CrossRef]
- Fu, Y. The causes and effects of global warming. J. Cap. Norm. Univ. 2007, 06, 11–21. [Google Scholar]
- Liu, Y.; Zheng, Y.Y.; Ge, Q.S.; Wang, F. China’s greenhouse gas emission changes under the background of low carbon development and its contribution to global emission reduction. Resour. Sci. 2017, 39, 2399–2407. [Google Scholar]
- Global Carbon Project Releases “Global Carbon Budget 2016”, Global Carbon Emissions Increase Continued to Decline for the Third Year. Available online: http://cnc-fe.cast.org.cn/ (accessed on 15 December 2017).
- “Global Carbon Budget Report”: Strong Global Carbon Emissions Rise 2017 | China Meteorological Administration. Available online: http://m.cma.gov.cn/2011xwzx/2011xqhbh/2011xdtxx/201711/t20171122_456610.html (accessed on 15 December 2017).
- Energy Bureau Released “The Eleventh Five-Year Plan” and “The Twelfth Five-Year Plan”. Available online: http://www.gov.cn/xinwen/2017-01/05/content_5156795.htm#1 (accessed on 20 November 2017).
- Du, X.W. Interpretation and reflection on China’s “Strategy of Energy Production and Consumption Revolution (2016–2030)”. China Econ. Trade Herit. 2017, 15, 44–45. [Google Scholar]
- Zhang, W. Sampling and Separation Performance of Coal Fly Ash in Power Plant. Master’s Thesis, Beijing Jiaotong University, Beijing, China, 2010. [Google Scholar]
- Yu, Y.H.; Lv, D.W. China’s power industry emissions reduction policy—An empirical analysis based on power demand function. Technol. Econ. 2017, 36, 110–118. [Google Scholar]
- Cheng, H.Z. China’s small hydropower and rural electrification. Small Hydro Power 2001, 17, 1–6. [Google Scholar]
- Han, D.; Zhao, Y. Talking about new energy power generation and its development prospects. Tech. Wind 2018, 30, 123. [Google Scholar]
- National Energy Administration. Available online: http://www.nea.gov.cn/ (accessed on 30 August 2018).
- Bhat, I.K.; Prakash, R. LCA of renewable energy for electricity generation systems—A review. Renew. Sustain. Energy Rev. 2009, 13, 1067–1073. [Google Scholar]
- Lenzen, M. Life cycle energy and greenhouse gas emissions of nuclear energy: A review. Energy Convers. Manag. 2008, 49, 2178–2199. [Google Scholar] [CrossRef]
- Quesada-Rubio, J.M.; Villar-Rubio, E.; Madrid-Salvador, V.; Molina-Moreno, V. The gap between CO2 emissions and allocation rights in the Spanish industry. Environ. Eng. Manag. J. 2010, 9, 1161–1164. [Google Scholar] [CrossRef]
- Quesada-Rubio, J.M.; Villar-Rubio, E.; Mondéjar-Jiménez, J.; Molina-Moreno, V. Carbon dioxide emissions vs. allocation rights: Spanish case analysis. Int. J. Environ. Res. 2011, 5, 469–474. [Google Scholar]
- Mikayilov, J.I.; Galeotti, M.; Hasanov, F.J. The impact of economic growth on CO2 emissions in Azerbaijan. J. Clean. Prod. 2018, 197, 1558–1572. [Google Scholar] [CrossRef]
- Bollen, J.C.; Toet, A.; Vries, H.D. Evaluating cost-effective strategies for meeting regional CO2 targets. Glob. Environ. Chang. 1996, 6, 359–373. [Google Scholar] [CrossRef]
- Remuzgo, L.; Sarabia, J.M. International inequality in CO2 emissions: A new factorial decomposition based on Kaya factors. Environ. Sci. Policy 2015, 54, 15–24. [Google Scholar] [CrossRef]
- Zhu, Q.; Peng, X.Z.; Lu, Z.M.; Wu, K.Y. Factor decomposition and empirical analysis of China’s carbon emissions from energy consumption. Resour. Sci. 2009, 31, 2072–2079. [Google Scholar]
- Xia, C.; Li, Y.; Ye, Y.; Shi, Z.; Liu, J. Decomposed driving factors of carbon emissions and scenario analyses of low-carbon transformation in 2020 and 2030 for Zhejiang province. Energies 2017, 10, 1747. [Google Scholar] [CrossRef]
- Kopidou, D.; Diakoulaki, D. Decomposing industrial CO2 emissions of southern European Countries into production- and consumption-based driving factors. J. Clean. Prod. 2017, 112, 4159–4172. [Google Scholar] [CrossRef]
- Mahony, T.O. Decomposition of Ireland’s carbon emissions from 1990 to 2010: An extended Kaya identity. Energy Policy 2013, 59, 573–581. [Google Scholar] [CrossRef]
- Wang, F.; Wu, L.H.; Yang, C. Study on the driving factors of the growth of carbon emissions in China’s economic development. J. Econ. Res. 2010, 45, 123–136. [Google Scholar]
- Wang, J.S.; He, C.F. Consumption of energy, economic growth and CO2 emissions in China: A decomposition analysis based on LMDI. Resour. Environ. Yangtze Basin 2010, 19, 18–23. [Google Scholar]
- Du, L.; Wei, C.; Cai, S. Economic development and carbon dioxide emissions in China: Provincial panel data analysis. China Econ. Rev. 2012, 23, 371–384. [Google Scholar] [CrossRef]
- Dong, F.; Yang, Q.L.; Long, R.Y.; Cheng, S.B. Chinese carbon decomposition and dynamic simulation. China Popul. Resour. Environ. 2015, 25, 1–8. [Google Scholar]
- Ali, H.; Sanjaya, S.; Suryadi, B.; Weller, S.R. Analysing CO2 emissions from Singapore’s electricity generation sector: Strategies for 2020 and beyond. Energy 2017, 124, 553–564. [Google Scholar] [CrossRef]
- Sun, W.; Meng, M.; He, Y.; Chang, H. CO2 emissions from china’s power industry: Scenarios and policies for 13th five-year plan. Energies 2016, 9, 825. [Google Scholar] [CrossRef]
- Wu, Q.; Peng, C. Scenario analysis of carbon emissions of china’s electric power industry up to 2030. Energies 2016, 9, 988. [Google Scholar] [CrossRef]
- Cai, W.; Wang, C.; Wang, K.; Zhang, Y.; Chen, J. Scenario analysis on CO2 emissions reduction potential in China’s electricity sector. Energy Policy 2007, 35, 6445–6456. [Google Scholar] [CrossRef]
- Ari, I.; Koksal, M.A. Carbon dioxide emission from the Turkish electricity sector and its mitigation options. Energy Policy 2011, 39, 6120–6135. [Google Scholar] [CrossRef]
- Hou, J.C.; Tan, Z.F. Decomposition of influencing factors on CO2 emissions from power production. Electr. Power 2011, 44, 39–42. [Google Scholar]
- Steenhof, P.A.; Weber, C.J. An assessment of factors impacting Canada’s electricity sector’s Ghg emissions. Energy Policy 2011, 39, 4089–4096. [Google Scholar] [CrossRef]
- Chen, X.K.; Zhou, T.R.; Li, X.; Kang, C.Q.; Chen, Q.X. Analysis on decomposition of carbon emission structure and contribution to low carbon in power system. Autom. Electr. Power Syst. 2012, 36, 18–25. [Google Scholar]
- Huo, M.L.; Han, X.Y.; Shan, B.G. An empirical analysis of the influencing factors of carbon emissions intensity in China’s power industry. Electr. Power 2013, 46, 122–126. [Google Scholar]
- Shrestha, R.M.; Anandarajah, G.; Liyanage, M.H. Factors affecting CO2 emission from the power sector of selected countries in Asia and the Pacific. Energy Policy 2009, 37, 2375–2384. [Google Scholar] [CrossRef]
- Malla, S. CO2 emissions from electricity generation in seven Asia-pacific and North American Countries: A decomposition analysis. Energy Policy 2009, 37, 1–9. [Google Scholar] [CrossRef]
- Zhang, N.; Zhou, P.; Choi, Y. Energy efficiency, CO2 emission performance and technology gaps in fossil fuel electricity generation in Korea: A Meta-Frontier Non-Radial Directional Distance Function analysis. Energy Policy 2013, 56, 653–662. [Google Scholar] [CrossRef]
- Hu, J.; Kahrl, F.; Yan, Q.; Wang, X. The impact of China’s differential electricity pricing policy on power sector CO2 emissions. Energy Policy 2012, 45, 412–419. [Google Scholar] [CrossRef]
- Özer, B.; Görgün, E.; İncecik, S. The scenario analysis on CO2 emission mitigation potential in the Turkish electricity sector: 2006–2030. Energy 2013, 49, 395–403. [Google Scholar] [CrossRef]
- Liu, Z.; Zhu, K.W.; Yan, J.M.; Shi, Y.R. Design and analysis of carbon emissions reduction scenarios in the power industry. Power Syst. Technol. 2012, 36, 1–7. [Google Scholar]
- Intergovernmental Panel on Climate Change (IPCC). 2006 IPCC Guidelines for National Greenhouse Gas Inventories. Available online: https://wenku.baidu.com/view/4eb6dad4195f312b3169a5a9.html (accessed on 8 November 2017).
- National Bureau of Statistics of People’s Republic of China. China Energy Statistical Yearbook. 2016. Available online: http://www.stats.gov.cn/tjsj/tjcbw/201706/t20170621_1505833.html (accessed on 10 November 2017).
- National Bureau of Statistics of People’s Republic of China. China Statistical Yearbook. 2011–2016. Available online: http://www.stats.gov.cn/tjsj/ndsj/ (accessed on 10 November 2017).
- Zheng, S.M. Political cycle, five years planning and environmental pollution—Taking industrial sulfur dioxide emission as an example. Cass J. Political Sci. 2016, 2, 80–94. [Google Scholar]
- Lin, B.Q.; Liu, X.Y. Carbon emissions in China’s urbanization: Influencing factors and emission reduction strategy. Econ. Res. J. 2010, 45, 66–78. [Google Scholar]
- IMF World Economic Outlook (WEO) update, January 2017: A Shifting Global Economic Landscape. Available online: http://www.imf.org/external/pubs/ft/weo/2017/update/01/ (accessed on 23 December 2017).
- Niu, J.M.; Dai, R.F.; Dong, W.J.; Ban, J.H.; Hu, C.Y. China’s future CO2 emissions scenarios under the US new deal background climate prediction. Adv. Clim. Chang. Res. 2018, 01, 95–105. [Google Scholar]
- Morgan Stanley: Avoid the Banking Crisis, We Are Optimistic about China! Available online: http://oversea.huanqiu.com/article/ (accessed on 25 December 2017).
- China’s Carbon Pricing Is Expected to Reach 10–25 Yuan/Ton in 2020–2030. Available online: http://www.tanpaifang.com/tanqiquan/2014/1115/40146.html (accessed on 26 December 2017).
- General Office of the State Council of the People’s Republic of China issued “Action Plan for Energy Development Strategy (2014–2020)”. Constr. Sci. Tech. 2014, 22, 6.
- Hou, J.C.; Shi, D. Study on the driving factors of carbon emissions changes in China’s power industry. China Ind. Econ. 2014, 06, 44–56. [Google Scholar]
- People’s Republic of China National Economic and Social Development Twelfth Five-Year Plan. People’s Daily 2011, 1, 1–56.
- Vaninsky, A. Factorial decomposition of CO2 emissions: A Generalized Divisia Index Approach. Energy Econ. 2014, 45, 389–400. [Google Scholar] [CrossRef]
- China Electricity Council. Condense together the past to create a new brilliant power industry—A Summary of China electricity council service industry development since 2010. China Power Enterp. Manag. 2016, 12–15. [Google Scholar]
- China Electricity Council. China’s Power Industry Annual Development Report 2016; China Electronic Production Equipment Industry Association: Beijing, China, 2016; pp. 18–23. [Google Scholar]
- Zeng, M.; Yao, J.; Zhao, X.L. Effects of carbon emissions trading on the power industry. China Power Enterp. Manag. 2014, 5, 23–26. [Google Scholar]
- Lin, B.; Wang, X. Promoting energy conservation in China’s Iron & Steel Sector. Energy 2014, 73, 465–474. [Google Scholar]
- Wu, Y.Z.; Shen, J.; Zhang, X. The Impact of urbanization on carbon emissions in developing countries: A Chinese study based on the U-kaya method. J. Clean. Prod. 2016, 135, 589–603. [Google Scholar] [CrossRef]
- Salakhutdinov, R.; Mnih, A. Bayesian probabilistic matrix factorization using Markov chain Monte Carlo. In Proceedings of the 25th International Conference on Machine Learning, Helsinki, Finland, 5–9 July 2008; pp. 880–887. [Google Scholar]
- Frieze, A.; Kannan, R.; Vempala, S. Fast Monte-Carlo algorithms for finding low-rank approximations. J. ACM 2004, 51, 1025–1041. [Google Scholar] [CrossRef]
- Veach, E. Optimally combining sampling techniques for Monte Carlo rendering. In Proceedings of the 22nd Annual Conference on Computer Graphics and Interactive Techniques, Los Angeles, CA, USA, 6–11 August 1995; pp. 419–428. [Google Scholar]
- Procopiuc, C.M.; Jones, M.; Agarwal, P.K.; Murali, T.M. A Monte Carlo algorithm for fast projective clustering. In Proceedings of the 2002 ACM SIGMOD International Conference on Management of Data, Madison, WI, USA, 2–6 June 2002; pp. 418–427. [Google Scholar]
- Shao, S.; Zhang, X.; Zhao, X.R. Empirical decomposition and peak path of carbon emissions in China’s manufacturing industry—Generalized Divisia Index decomposition and dynamic scenario analysis. China Ind. Econ. 2017, 34, 44–63. [Google Scholar]
- Ramírez, A.; Keizer, C.D.; Sluijs, J.P.V.D.; Olivier, J.; Brandes, L. Monte Carlo analysis of uncertainties in the netherlands greenhouse gas emission inventory for 1990–2004. Atmos. Environ. 2008, 42, 8263–8272. [Google Scholar] [CrossRef]
- Wang, C.K.; Cui, W.J. Construction, intensity, scale and electricity carbon emissions: A study based on LMDI decomposition method. Sci. Technol. Manag. 2015, 35, 220–241. [Google Scholar]
- Huh, J.H.; Seo, K. Hybrid advanced metering infrastructure design for micro grid using the game theory model. Int. J. Softw. Eng. Appl. 2015, 9, 257–268. [Google Scholar] [CrossRef]
- Huh, J.H.; Otgonchimeg, S.; Seo, K. Advanced metering infrastructure design and test bed experiment using intelligent agents: Focusing on the plc network base technology for smart grid system. J. Supercomput. 2016, 72, 1862–1877. [Google Scholar] [CrossRef]
- Huh, J.H. Smart Grid Test Bed Using OPNET and Power Line Communication. Available online: https://0-ieeexplore-ieee-org.brum.beds.ac.uk/document/7801748/ (accessed on 5 September 2018).
- Horizon 2020. Available online: http://ec.europa.eu/programmes/horizon2020/en/area/energy (accessed on 5 September 2018).
- Molina-Moreno, V.; Núñez-Cacho Utrilla, P.; Cortés-García, F.J.; Peña-García, A. The Use of Led Technology and Biomass to Power Public Lighting in a Local Context: The Case of Baeza (Spain). Energies 2018, 11, 1783. [Google Scholar] [CrossRef]
- Nuñez-Cacho, P.; Górecki, J.; Molina-Moreno, V.; Corpas-Iglesias, F.A. What Gets Measured, Gets Done: Development of a Circular Economy Measurement Scale for Building Industry. Sustainability 2018, 10, 2340. [Google Scholar] [CrossRef]
- Villar Rubio, E.; Quesada Rubio, J.M.; Molina Moreno, V. Convergence Analysis of Environmental Fiscal Pressure Acrosss EU-15 Countries. Energy Environ. 2015, 26, 789–802. [Google Scholar] [CrossRef]


| Low Carbon Energy Generation Technology | Advantage | Disadvantage | Application (Data in 2017) [14] | Carbon Emissions (g-CO2/kWh) [15,16] |
|---|---|---|---|---|
| Wind power generation | High environmental benefits; Renewable; Short construction period; Flexible application. | Large area occupied; Poor controllability; High cost. | Installed capacity is 164 million kW. The power generation capacity is 305.7 billion kWh, accounting for 4.8% of the total power generation. | ≈9.7–123.7 |
| Hydropower generation | High power generation efficiency; Low power generation cost; Base group starts fast; Easy to adjust. | Long construction period; Small installed capacity; High investment in infrastructure. | Installed capacity is 341 million kW. The power generation capacity is 1119.45 billion kWh, accounting for 18.6% of the total power generation. | ≈3.7–237 |
| Solar photovoltaics power generation | No resource distribution area restriction; High energy quality; Simple energy conversion process. | Low energy density; Large area occupied; Vulnerable to climate. | Installed capacity is 130 million kW. The power generation capacity is 118.2 billion kWh, accounting for 1.8% of the total power generation. | ≈53.4–250 |
| Biomass power generation | Low-sulfur; High efficiency of investment and utilization; Strong production adjustment. | High investment and power generation costs; Unstable fuel supply. | Installed capacity is 14.8 million kW. The power generation capacity is 79.5 billion kWh, accounting for 1.2% of the total power generation. | ≈35–178 |
| Nuclear power | Huge energy; No air pollution; Easy to transport and store. | Easy to produce radioactive waste; Serious heat pollution; High investment cost. | Installed capacity is 35.8 million kW. The power generation capacity is 247.469 billion kWh, accounting for 3.94% of the total power generation. | ≈10–130 |
| Author | Research Methods | Research Approach | Research Conclusions | Research Limitations |
|---|---|---|---|---|
| Shrestha et al. [39] | LMDI | This paper analyzes the carbon emissions of the power sector in 15 countries in Asia and the Pacific using the LMDI model from the perspectives of changes in economic output, electricity intensity of the economy, fuel intensity of power generation, and power generation structure. | The increasing electricity intensity of the economy was the main factor in Bangladesh, Indonesia, and Philippines. Structural changes in power generation were found to be the main contributor to changes in the CO2 emissions in the case of Sri Lanka and New Zealand. Economic growth was the dominant factor behind the increase in CO2 emissions in the other countries. | This paper uses the LMDI model to define each contributing factor as interdependent, and the results are found to be dependent on the choice of factors. Thus, different forms of factor decomposition may lead to the opposite conclusion, and potential impacts of the absolute quantity factor selected cannot be determined. |
| Malla et al. [40] | LMDI | This paper uses the LMDI of complete decomposition to examine the role of three factors (electricity production, electricity generation structure and energy intensity of electricity generation) affecting the evolution of CO2 emissions from electricity generation in seven Asia-Pacific and North American countries. | The production effect is the main factor of CO2 emissions increase during 1990–2005, and the energy intensity effect is the main factor to reduce the CO2 emissions. In 2005–2030, the structure effect of power generation plays a role in reducing carbon emissions. The impact of the factors varies by country. | This paper mainly analyzes carbon emissions by the power industry starting with the production of electric power enterprises, but it does not consider relevant factors such as economic growth or population size with one-sidedness. The LMDI model presents limitations. |
| Zhang et al. [41] | Meta-frontier non-radial directional distance function | After considering the non-uniformity, non-radial relaxation, and unwanted output of the power generation group, this paper estimates the changes in the energy use and CO2 emissions of the Korean power industry under different power generation assumptions. | The coal-fired power plant’s total factor energy efficiency and carbon dioxide emissions performance is higher than the fuel power plant, under the technical assumptions, the technical difference of coal-fired power plants is smaller than the fuel power plant. | N. Zhang et al. only consider the single factor’s impact on the carbon emissions in the power industry. Although it can well quantify the carbon emissions reduction potential brought by technology, it cannot grasp the carbon emissions of the power industry as a whole situation. |
| Hu et al. [42] | LMDI | This paper uses the LMDI exponential decomposition method to examine the effects of China’s differential pricing policy on carbon emissions by the power industry. Compare the effectiveness of different pricing policies in different industries. | Electricity consumption in China’s energy-intensive industries is still growing. Output effects make the largest contributions to carbon reduction outcomes while intensity effects represent the most adverse inverse factor. Policies have different impacts on different industries. | J. Hu et al. take the difference pricing policy as a starting point and only consider the potential of carbon emissions by the power industry based on the policy of differential electricity prices. The authors do not explore the potential of carbon emissions by the power industry. |
| Özer et al. [43] | LEAP model | This paper comprehensively considers the various policies of Turkey and analyzes the carbon emission reduction in Turkey’s power sector based on the scenario analysis of the Long-Range Energy Alternatives Planning system (LEAP) model. | Carbon dioxide (CO2) emissions will rise significantly under the baseline scenario. In the mitigation scenario, electricity-related CO2 emissions grew by 5.8% annually between 2006 and 2030, while electricity output grew at an average of 6.6% per annum in this period. | Scenario analysis does not consider the degree of impact of various factors affecting the carbon emissions of the power sector, which may lead to an increase in the bias of future scenario estimates. |
| Liu et al. [44] | Multivariable linear regression (MLR) model | Taking Chongqing as an example, this paper applies a multivariate linear analysis of factors (e.g., industrial structure optimization and power supply structure optimization) to design three scenarios to examine the potential for carbon emissions reduction in the power industry. | Optimization of industrial structures and promotion of emissions reduction technologies have considerable effects on carbon emissions reduction outcomes. Hydropower resources will limit the power structure optimization of carbon emissions reduction potential. | This paper uses multiple linear analysis to predict carbon emissions that will be generated by the power industry in the future. As the study does not consider various factors or uncertainties related to future changes, the results of the analysis are limited. |
| Factor | 2017–2030 | ||
|---|---|---|---|
| Min | Med | Max | |
| G | 7.69 | 8.69 | 9.69 |
| E/G | −4.62 | −4.32 | −4.02 |
| C/E | −2.02 | −1.87 | −1.72 |
| Factor | 2017–2020 | 2021–2025 | 2026–2030 | ||||||
|---|---|---|---|---|---|---|---|---|---|
| Min | Med | Max | Min | Med | Max | Min | Med | Max | |
| G | 5.27 | 6.27 | 7.27 | 2.6 | 3.6 | 4.6 | 1.95 | 2.95 | 3.95 |
| E/G | −3.5 | −3.2 | −2.9 | −2.8 | −2.5 | −2.2 | −2.99 | −2.89 | −2.39 |
| C/E | −2.75 | −2.6 | −2.45 | −2.87 | −2.72 | −2.57 | −3.04 | −2.89 | −2.74 |
| Factor | 2017–2020 | 2021–2025 | 2026–2030 | ||||||
|---|---|---|---|---|---|---|---|---|---|
| Min | Med | Max | Min | Med | Max | Min | Med | Max | |
| G | 5.27 | 6.27 | 7.27 | 2.6 | 3.6 | 4.6 | 1.95 | 2.95 | 3.95 |
| E/G | −3.5 | −3.2 | −2.9 | −3.5 | −3.2 | −2.9 | −3.5 | −3.2 | −2.9 |
| C/E | −2.75 | −2.6 | −2.45 | −3.07 | −2.92 | −2.77 | −3.24 | −3.09 | −2.94 |
| Common Factor | Wang et al. | Hou et al. | This Paper |
|---|---|---|---|
| Contribution of economic scale | 109.51 | 102.7 | |
| Contribution of population size | 7.92 | 8.1 | 3.03 |
| Contribution of energy structures | 0.51 | 3.9 | 7.8 |
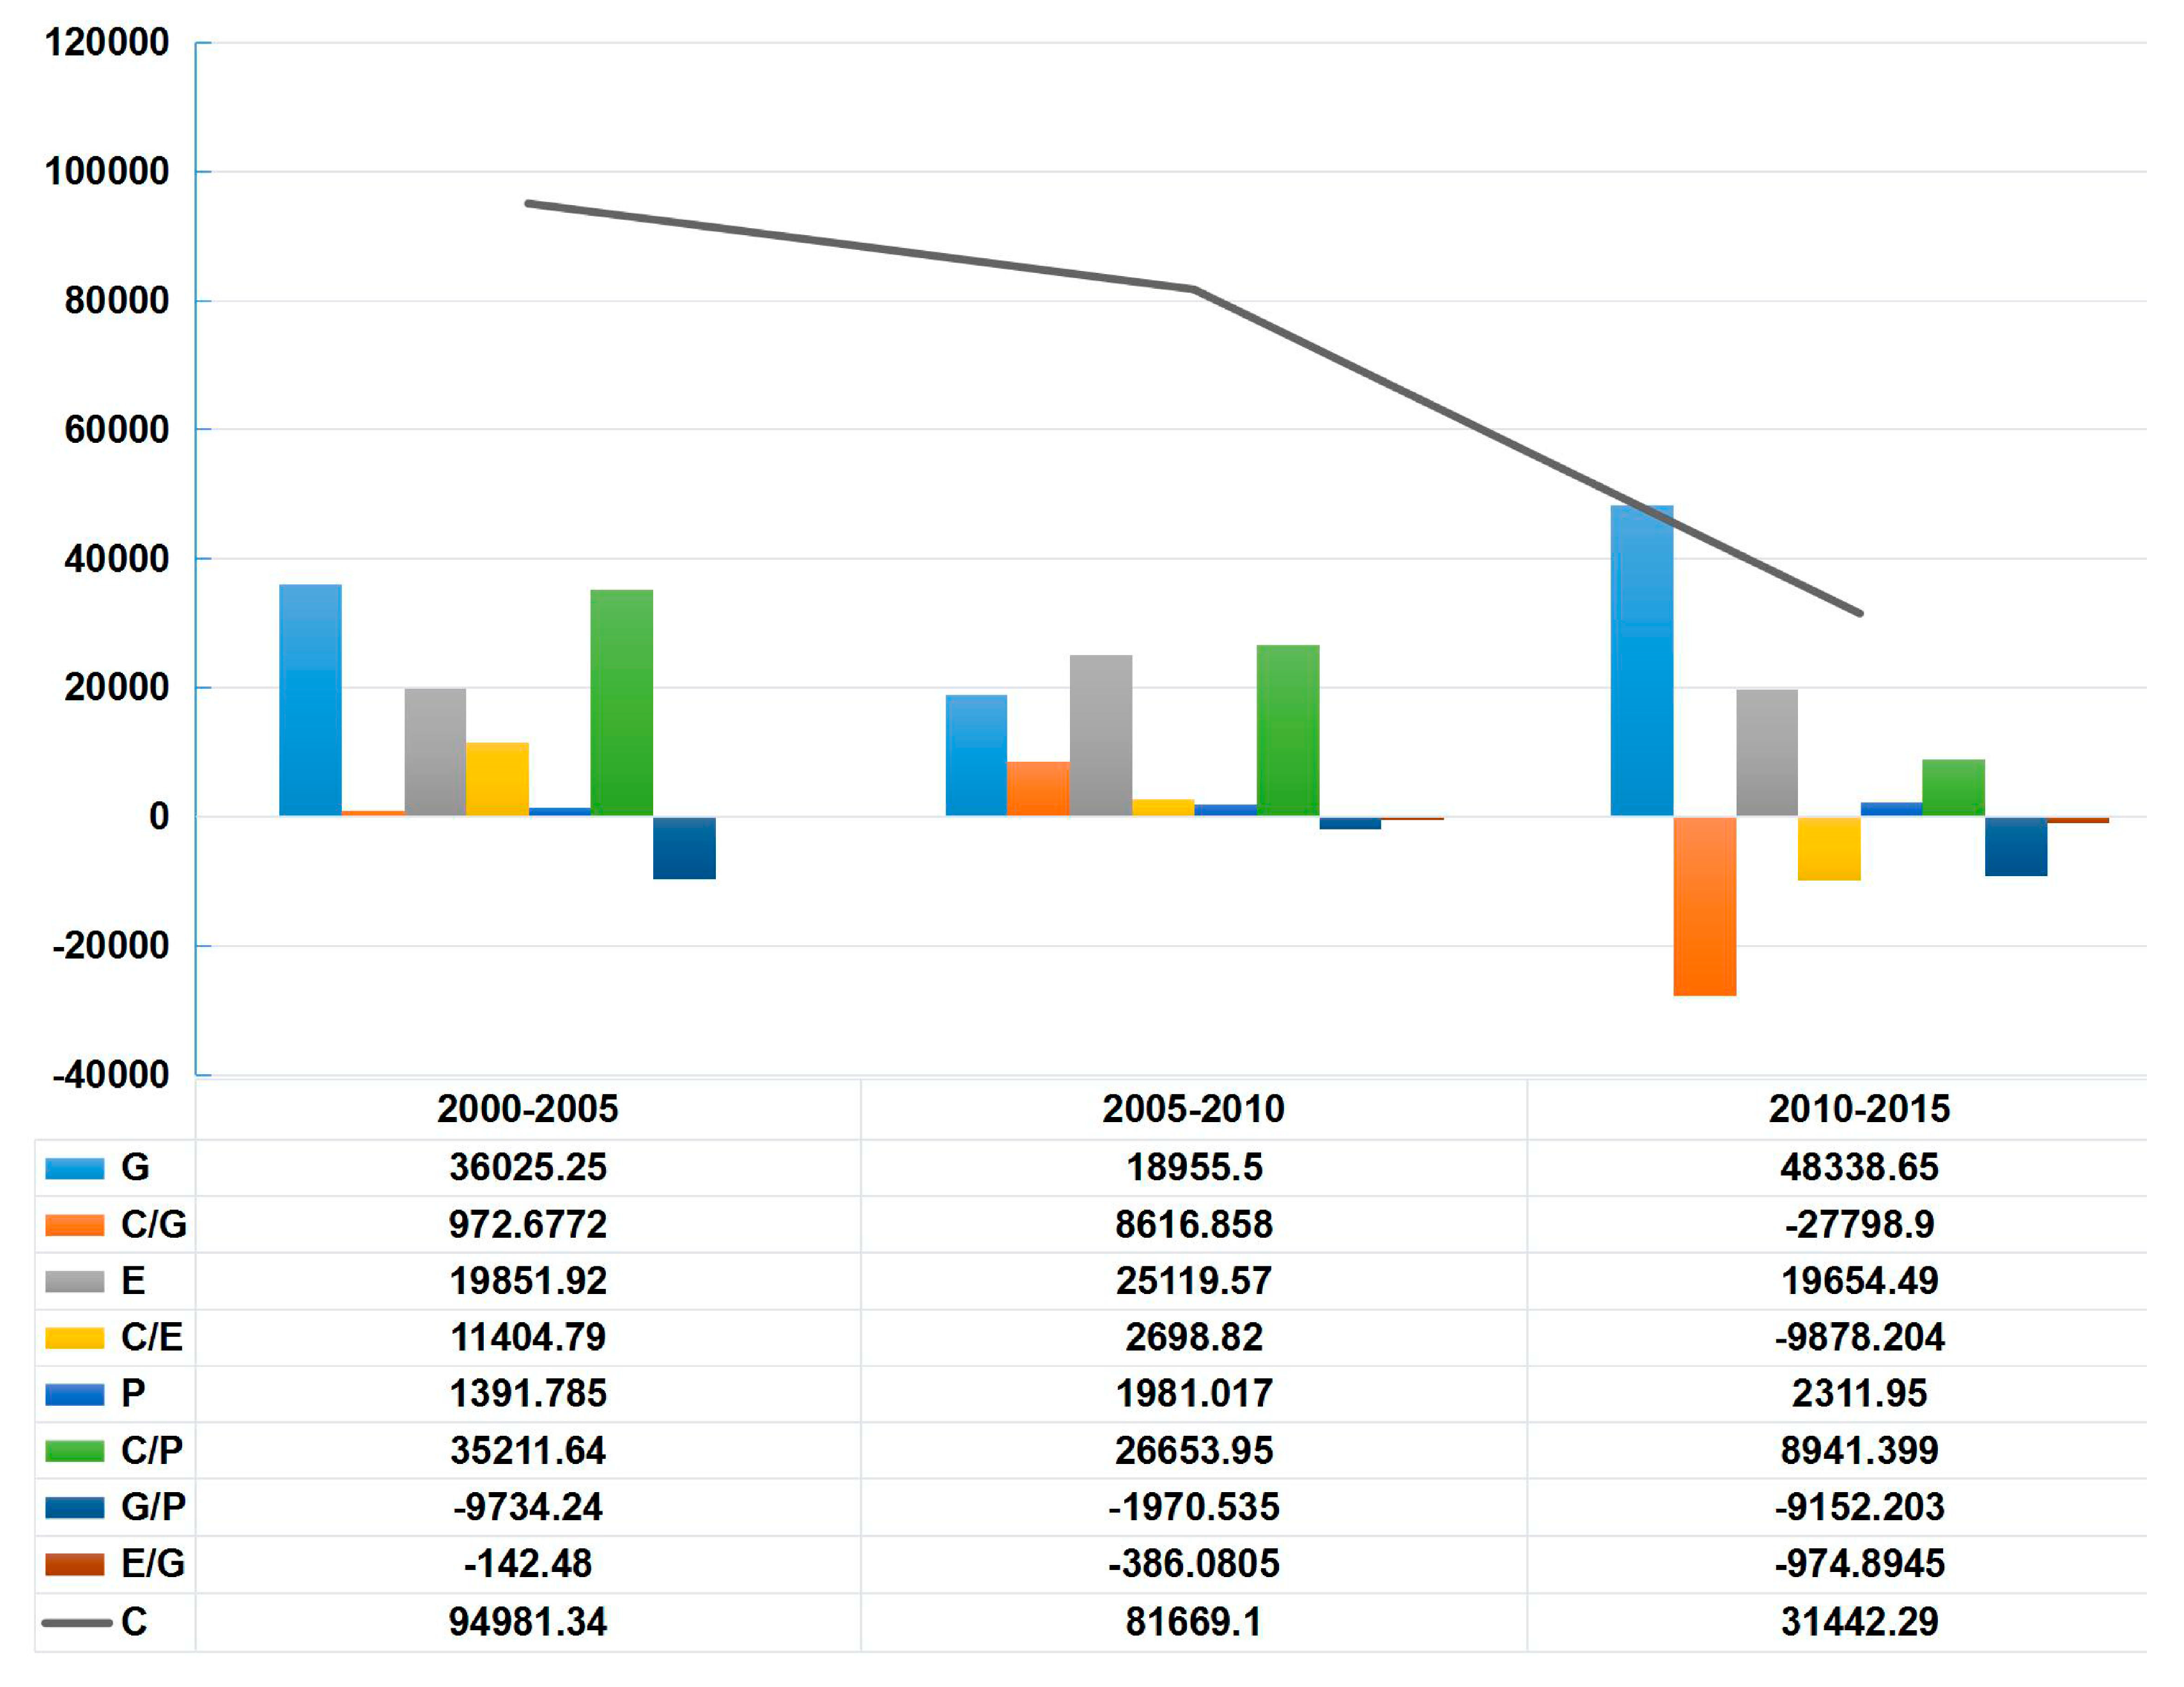
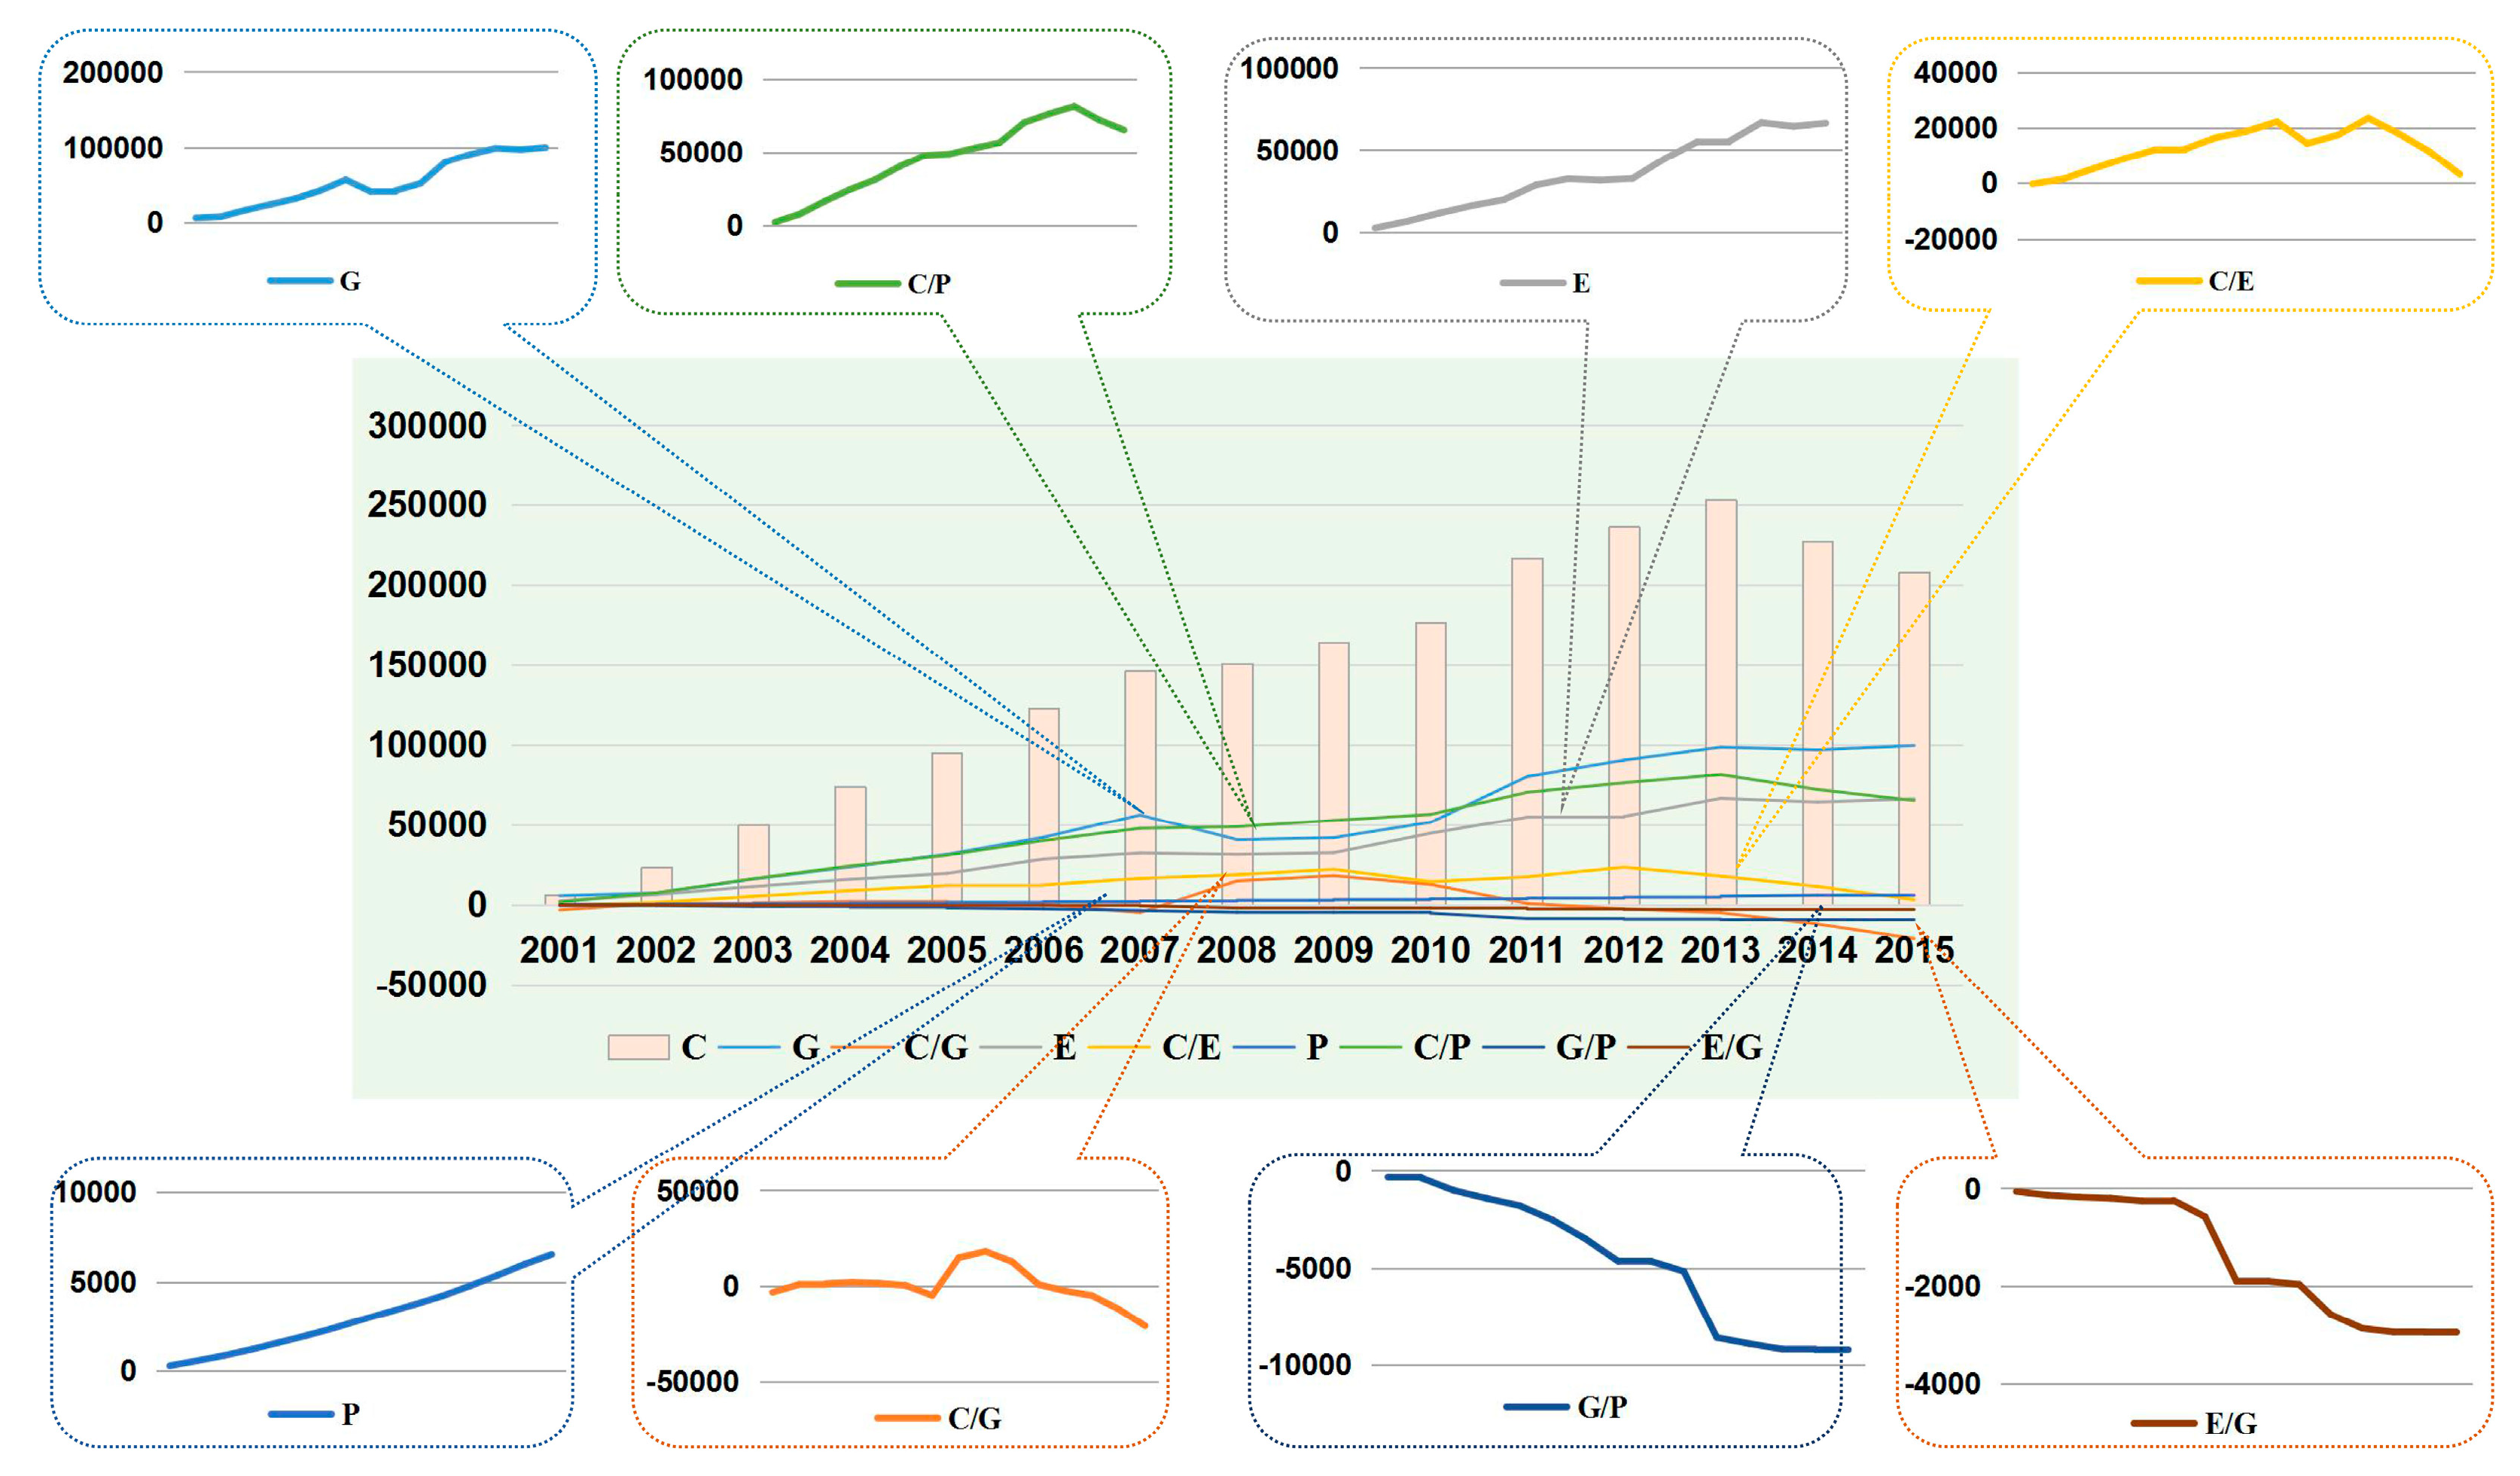
| Factor | The Contribution of Various Decomposition Factors to the Changes of Carbon Emissions in China’s Power Industry (104 Tons) | Effect | Degree of Influence | ||||
| Stage Contributions | Cumulative Contributions | ||||||
| 2000–2005 | 2005–2010 | 2010–2015 | |||||
| Output scale | 36,025.25 | 18,955.5 | 48,338.65 | 99,689.402 | Positive | Biggest | Factor decomposition |
| Energy consumption scale | 19,851.92 | 25,119.57 | 19,654.49 | 66,434.07 | Positive | Bigger | |
| Population size | 1391.785 | 1981.017 | 2311.95 | 6524.081 | Positive | Small | |
| Per capita carbon emissions | 35,211.64 | 26,653.95 | 8941.399 | 65,413.974 | Positive | Bigger | |
| Energy intensity | −142.48 | −386.081 | −974.895 | −2942.41 | Negative | Smaller | |
| Carbon intensity of output | 972.6772 | 8616.858 | −27,798.9 | −20,934.45 | Double-sided | Bigger | |
| Per capita GDP | −9734.24 | −1970.54 | −9152.2 | −9254.794 | Negative | Small | |
| Carbon intensity of energy consumption | 11,404.79 | 2698.82 | −9878.2 | 3171.344 | Double-sided | Bigger | |
| Simulation results of the average annual growth rate of carbon emissions in China’s power industry under different scenarios from 2017 to 2030 | |||||||
| Characteristics of the scenario | The most probable value | ||||||
| Baseline scenario | According to the current development trend | 1.9% to 2.2% | Scenario forecasts | ||||
| Low-carbon scenario | Follow the path of green development | −2.1% to −1.6% | |||||
| Technical breakthrough scenario | Strengthen technological R&D investment | −2.4% to −1.9% | |||||
© 2018 by the authors. Licensee MDPI, Basel, Switzerland. This article is an open access article distributed under the terms and conditions of the Creative Commons Attribution (CC BY) license (http://creativecommons.org/licenses/by/4.0/).
Share and Cite
Zhu, L.; He, L.; Shang, P.; Zhang, Y.; Ma, X. Influencing Factors and Scenario Forecasts of Carbon Emissions of the Chinese Power Industry: Based on a Generalized Divisia Index Model and Monte Carlo Simulation. Energies 2018, 11, 2398. https://0-doi-org.brum.beds.ac.uk/10.3390/en11092398
Zhu L, He L, Shang P, Zhang Y, Ma X. Influencing Factors and Scenario Forecasts of Carbon Emissions of the Chinese Power Industry: Based on a Generalized Divisia Index Model and Monte Carlo Simulation. Energies. 2018; 11(9):2398. https://0-doi-org.brum.beds.ac.uk/10.3390/en11092398
Chicago/Turabian StyleZhu, Lin, Lichun He, Peipei Shang, Yingchun Zhang, and Xiaojun Ma. 2018. "Influencing Factors and Scenario Forecasts of Carbon Emissions of the Chinese Power Industry: Based on a Generalized Divisia Index Model and Monte Carlo Simulation" Energies 11, no. 9: 2398. https://0-doi-org.brum.beds.ac.uk/10.3390/en11092398