Article

Optimal Decision-Making Strategy of an Electric Vehicle Aggregator in Short-Term Electricity Markets

by
Homa Rashidizadeh-Kermani
1,
Hamid Reza Najafi
1,
Amjad Anvari-Moghaddam
2,* and
Josep M. Guerrero
2
1
Department of Electrical & Computer Engineering, University of Birjand, Birjand 9856, Iran
2
Department of Energy Technology, Aalborg University, Aalborg East 9220, Denmark
*
Author to whom correspondence should be addressed.
Submission received: 11 August 2018 / Revised: 8 September 2018 / Accepted: 10 September 2018 / Published: 12 September 2018

Abstract

:
This paper proposes the problem of decision making of an electric vehicle (EV) aggregator in a competitive market in the presence of different uncertain resources. In the proposed model, a bi-level problem is formulated where, in the upper-level, the objective of the aggregator is to maximize its expected profit through its interactions and, in the lower-level, the EV owners minimize their payments. Therefore, the objectives of the upper and the lower-level are contrary. To solve the obtained nonlinear bi-level program, Karush-Kuhn-Tucker (KKT) optimality conditions and strong duality are applied to transform the initial problem into a linear single-level problem. Moreover, to deal with various uncertainties, including market prices, EVs charge/discharge demands and the prices offered by rivals, a risk measurement tool is incorporated into the problem. The proposed model is finally applied to a test system and its effectiveness is evaluated. Simulation results show that the proposed approach has the potential to offer significant benefits to the aggregator and EV owners for better decision-making in an uncertain environment. During different situations, it is observed that with increasing risk-aversion factor, as the aggregator tries to hedge against volatilities, its purchases from day-ahead and negative balancing markets decreases significantly. However, the participation of EV aggregator in the positive balancing market increases accordingly to make more profit.

1. Introduction

A massive penetration of electric vehicles (EVs) in the smart grid requires optimal scheduling of their participation in the electricity market [1]. In order to manage the interaction between EVs and the network, an EV aggregator acts as a middleman and schedules EV charge/discharge processes [2,3]. In the decision-making framework, an EV aggregator encounters uncertainties for EV management, including market prices and EV owners’ behavior, as well as the prices offered by the rival aggregators [4,5]. The problems of decision making of an EV aggregator in a trading floor have been presented in several research works [6,7,8,9,10,11]. For example, in [6] single supplier’s decision-making problem is solved by particle swarm optimization for both block bid and linear bid electricity market models. An integrated model of plug-in EVs and renewable distributed generators in a trading floor is proposed in [7], in which the EV owners can sell back the energy generated from their renewables or the energy stored in their EVs. Also, an optimal structure for participation of an EV aggregator in the day-ahead (DA) and ancillary services markets is presented in [8]. In [9], a multi-objective day-ahead market-clearing mechanism with demand response offers is developed in which energy and demand-side reserves are cleared through a co-optimization process. An interactive program for the charging process of EVs, as well as interruptible load pricing, is suggested in [10], in which the aggregator will reply to the commands from the network. Also, in [11], authors propose a probabilistic model for a bidding strategy of an aggregator in DA and regulating trading floors. In situations where a decision maker is confronted with uncertainties which are modeled as stochastic processes, a risk controlling measurement is normally suggested to control the risk of profit/cost variability. The proposed optimization model includes inevitable deviations between DA-cleared bids and actual real-time energy delivery. Energy deviations are characterized as “uninstructed” or “instructed”, depending on whether or not the responsibility is with the aggregator. Some research works that addressed the aggregator decision-making problem used risk measurement tools to avoid undesirable outcomes due to uncertainties. In [12], a stochastic programming structure for EV aggregators for participation in energy and reserve markets is proposed that considers conditional value at risk (CVaR). Moreover, in [13], value-at-risk is applied to a stochastic optimization problem for exchanging energy of EVs in the electricity trading floor. A methodology to maximize aggregator profits, based on making decisions in DA and balancing markets, is developed in [14]. Under uncertain market prices and fleet mobility, the proposed two-stage linear stochastic program finds optimal plug-in EV (PEV) charging schedules at the vehicle level. Moreover, a stochastic linear program with the application of a CVaR term as a risk-aversion tool is proposed for the participation of the aggregator in electricity markets.
Since the electricity industry is evolving into a distributed and competitive industry, some of the research works focused on a competitive environment to allow the EV owners to choose the proper aggregator [15,16,17]. In [15], the authors proposed an operational decision-making model for a distribution company (DisCo) in a competitive environment associated with distributed generation (DG) units and interruptible load options. The competition between DisCos is modelled using a bi-level optimization method. The DisCo’s objective is to minimize the cost of market purchases and DG unit dispatch while considering the responses of other DisCos. Also, competitive behavior of suppliers in an electricity trading floor is modeled in [16] using a Markov game approach. Likewise, in [17], a cooperative game model is proposed to obtain the exchanges between EV parking lots and utilities in a spinning reserve market to compensate the uncertainties due to the stochastic nature of renewables. A theoretical model of the competition between demand response (DR) aggregators for selling energy previously stored in an aggregation of storage devices given sufficient demand from other aggregators through an incomplete information game is proposed in [18].
Although the competitive environment is considered in some of the reviewed references, the preferences of the EV owners as lower level players in the electricity market are not addressed from the view point of EV aggregators. However, in a few recent studies, the decision-making framework of an EV aggregator is investigated as a stochastic bi-level problem. Also, a bi-level problem is addressed in [19] where the aggregator wants to maximize its expected profit while considering EVs’ preferences. The interactions of the PEV owners and the parking lots are also modeled as they impose restrictions on the parking’s behavior. Therefore, a bi-level problem is constructed where, in the upper-level, the objective of the aggregator is to maximize its profit through its interactions and, in the lower-level, the parking lot maximizes its own profit limited to the preferences of PEVs. Although the uncertainties of resources are considered in the same work, no mechanism is used to control uncertainties. In [20], a mathematical program with equilibrium constraints is presented to obtain optimal profit of an EV aggregator, as well as to minimize the payments paid by the EV owners. To this end, the formulation is proposed as a bi-level problem, in which the aggregator’s upper-level decisions on retail prices and optimal bidding in electricity markets are considered, and the lower-level client-side minimization of PEV-charging schedule cost, including an affine demand response to the retail prices, is also taken into account. In that study, although the scheduling for the EV aggregator is formulated as a bi-level problem, the competition between the aggregators is not considered. In [21], in contrast to the usual contracts, the aggregator is supposed to bid in such a way as to influence the market prices. Also, the impact of the aggregator’s bidding strategy on the prices is analyzed via a bi-level program; however, the effect of the prices offered by the rivals is not considered. In [22], a bi-level problem of offering prices by an EV aggregator in a competitive market is proposed. In this work, only grid to vehicle mode is considered for the decision-making process and the influence of EVs discharging modes was not addressed.
In the research to date, the investigation of simultaneous charging/discharging modes in the decision-making problem of an EV aggregator in a competitive market is very limited. Also, the influence of offering prices of rivals on the risk-aversion behavior of the aggregator, as well as consideration of the vehicle to grid mode, is not addressed. Therefore, in this paper, for scheduling of an EV aggregator, a stochastic bi-level model is proposed in a competitive trading floor. In the upper level, the aggregator tries to maximize its expected profit and, in the lower level, the EV owners aim at minimizing their payments. Then, by using Karush-Kuhn-Tucker (KKT) optimality conditions and duality theory, the equivalent single level form of the problem is obtained. The sources of uncertainties, such as DA and balancing prices, as well as EV charge/discharge demands, are modeled based on time series. Moreover, the prices offered by rivals are modeled with a probability density function (PDF). In addition, CVaR is used in the proposed decision-making problem. Therefore, the main contributions of this paper could be summarized as follows:
  • To develop a stochastic decision-making model for scheduling of an EV aggregator in a competitive trading floor, as well as to determine the optimal level of the aggregator’s involvement in DA and balancing markets.
  • To investigate the effects of a risk-aversion parameter on the decision-making of the aggregator. Also, the reaction of EV owners to the prices offered by the aggregators under different risk-aversion circumstances is assessed.
  • To effectively solve the stochastic optimization framework with sources of uncertainties, the proposed model is reformulated to be an expectation optimization problem with CVaR constraints to reduce the unfavorable effect of undesired scenarios.
The rest of this paper is structured as follows. Section 2 describes the problem of scheduling of an EV aggregator in an electricity market. Also, in this section, the mentioned problem is modelled as a bi-level stochastic programming structure. Section 3 presents numerical results and discussion. Finally, the conclusion is brought in Section 4.

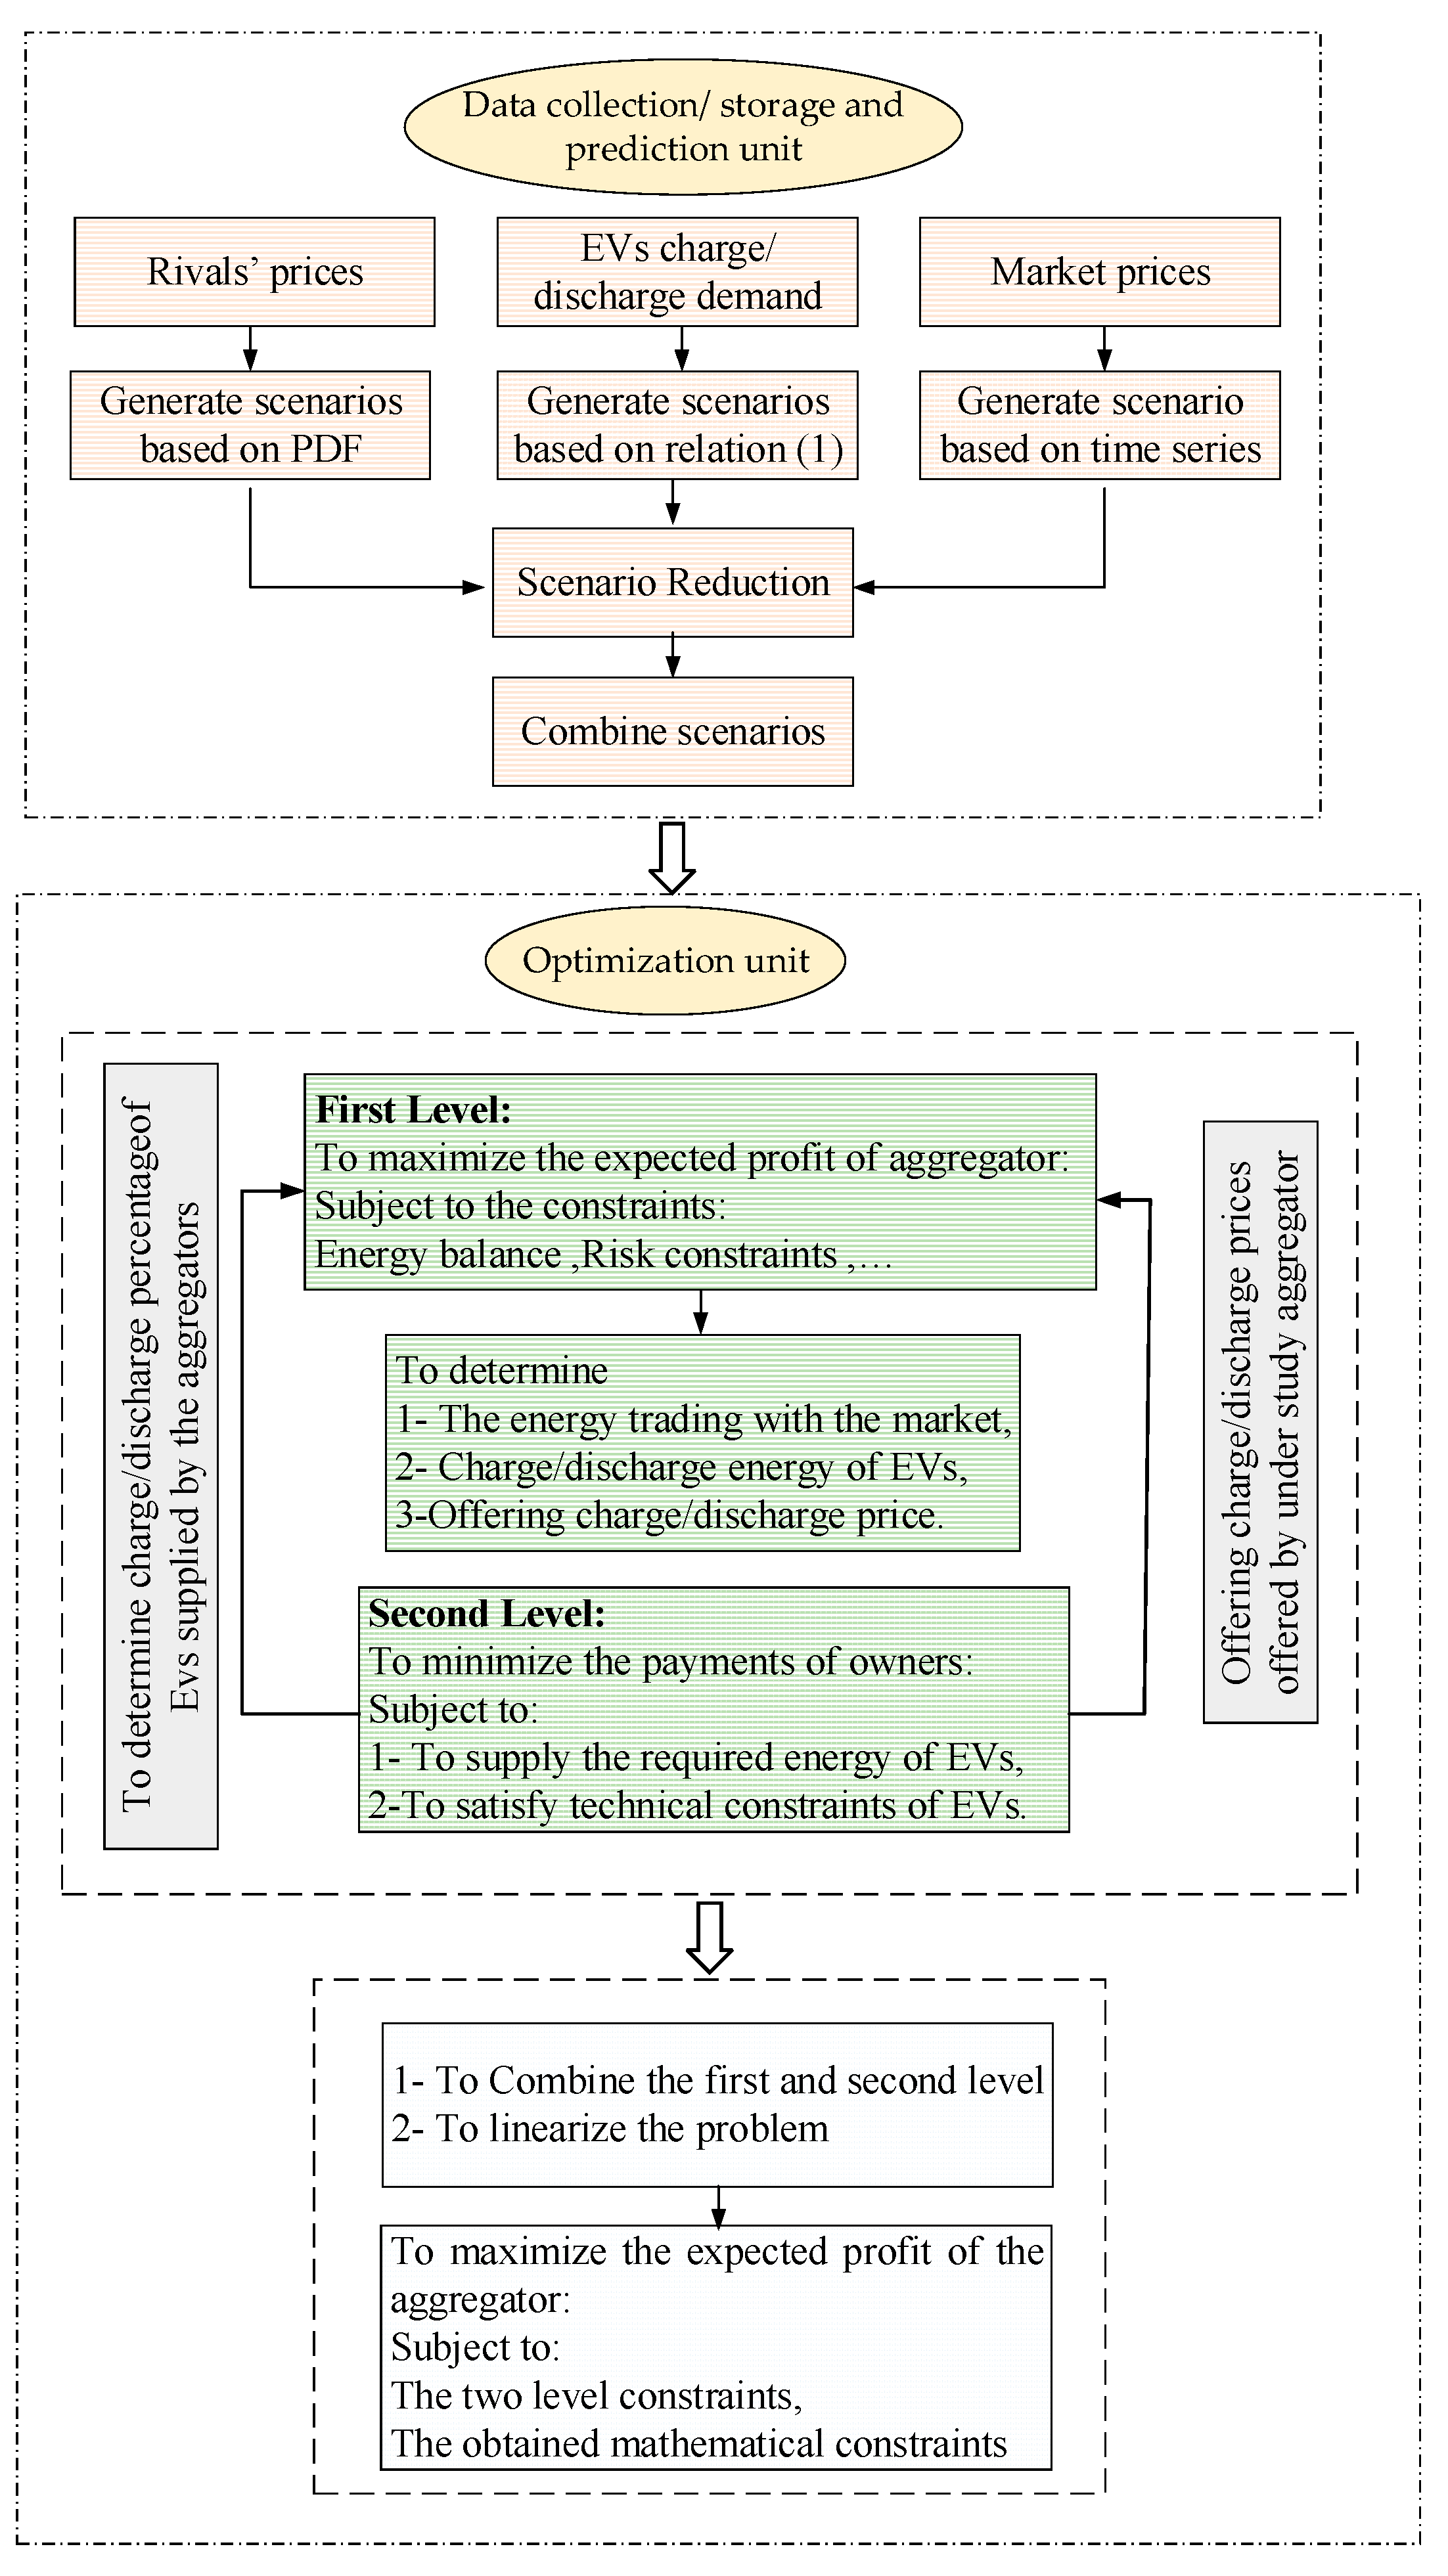
2. Materials and Methods

In a competitive market, the reaction of EV owners to the prices offered by the rival aggregators should be appropriately modelled. In this paper, a bi-level program for scheduling of an EV aggregator is presented in order to determine the selling prices offered to the EV owners in a short-term market. The bi-level optimization problem is used to maximize the expected profit of the aggregator while minimizing the payments of the owners. Therefore, the players of the bi-level problem are categorized into two main groups based on the benefit they receive. The first category includes the EV aggregators who try to take part in the electricity market. Here, it is assumed that the aggregators buy energy at volatile prices on the electricity market and resell it at fixed tariffs to the EV owners. The main challenge for the aggregators is the losses they incur due to the market price changes. To provide relief from this, the aggregator applies a proper offering strategy to maximize its profit considering the uncertainties as well as the behavior of rival aggregators. The second players are EV owners who want to minimize their payments. Figure 1 shows the bi-level structure of the mentioned problem.

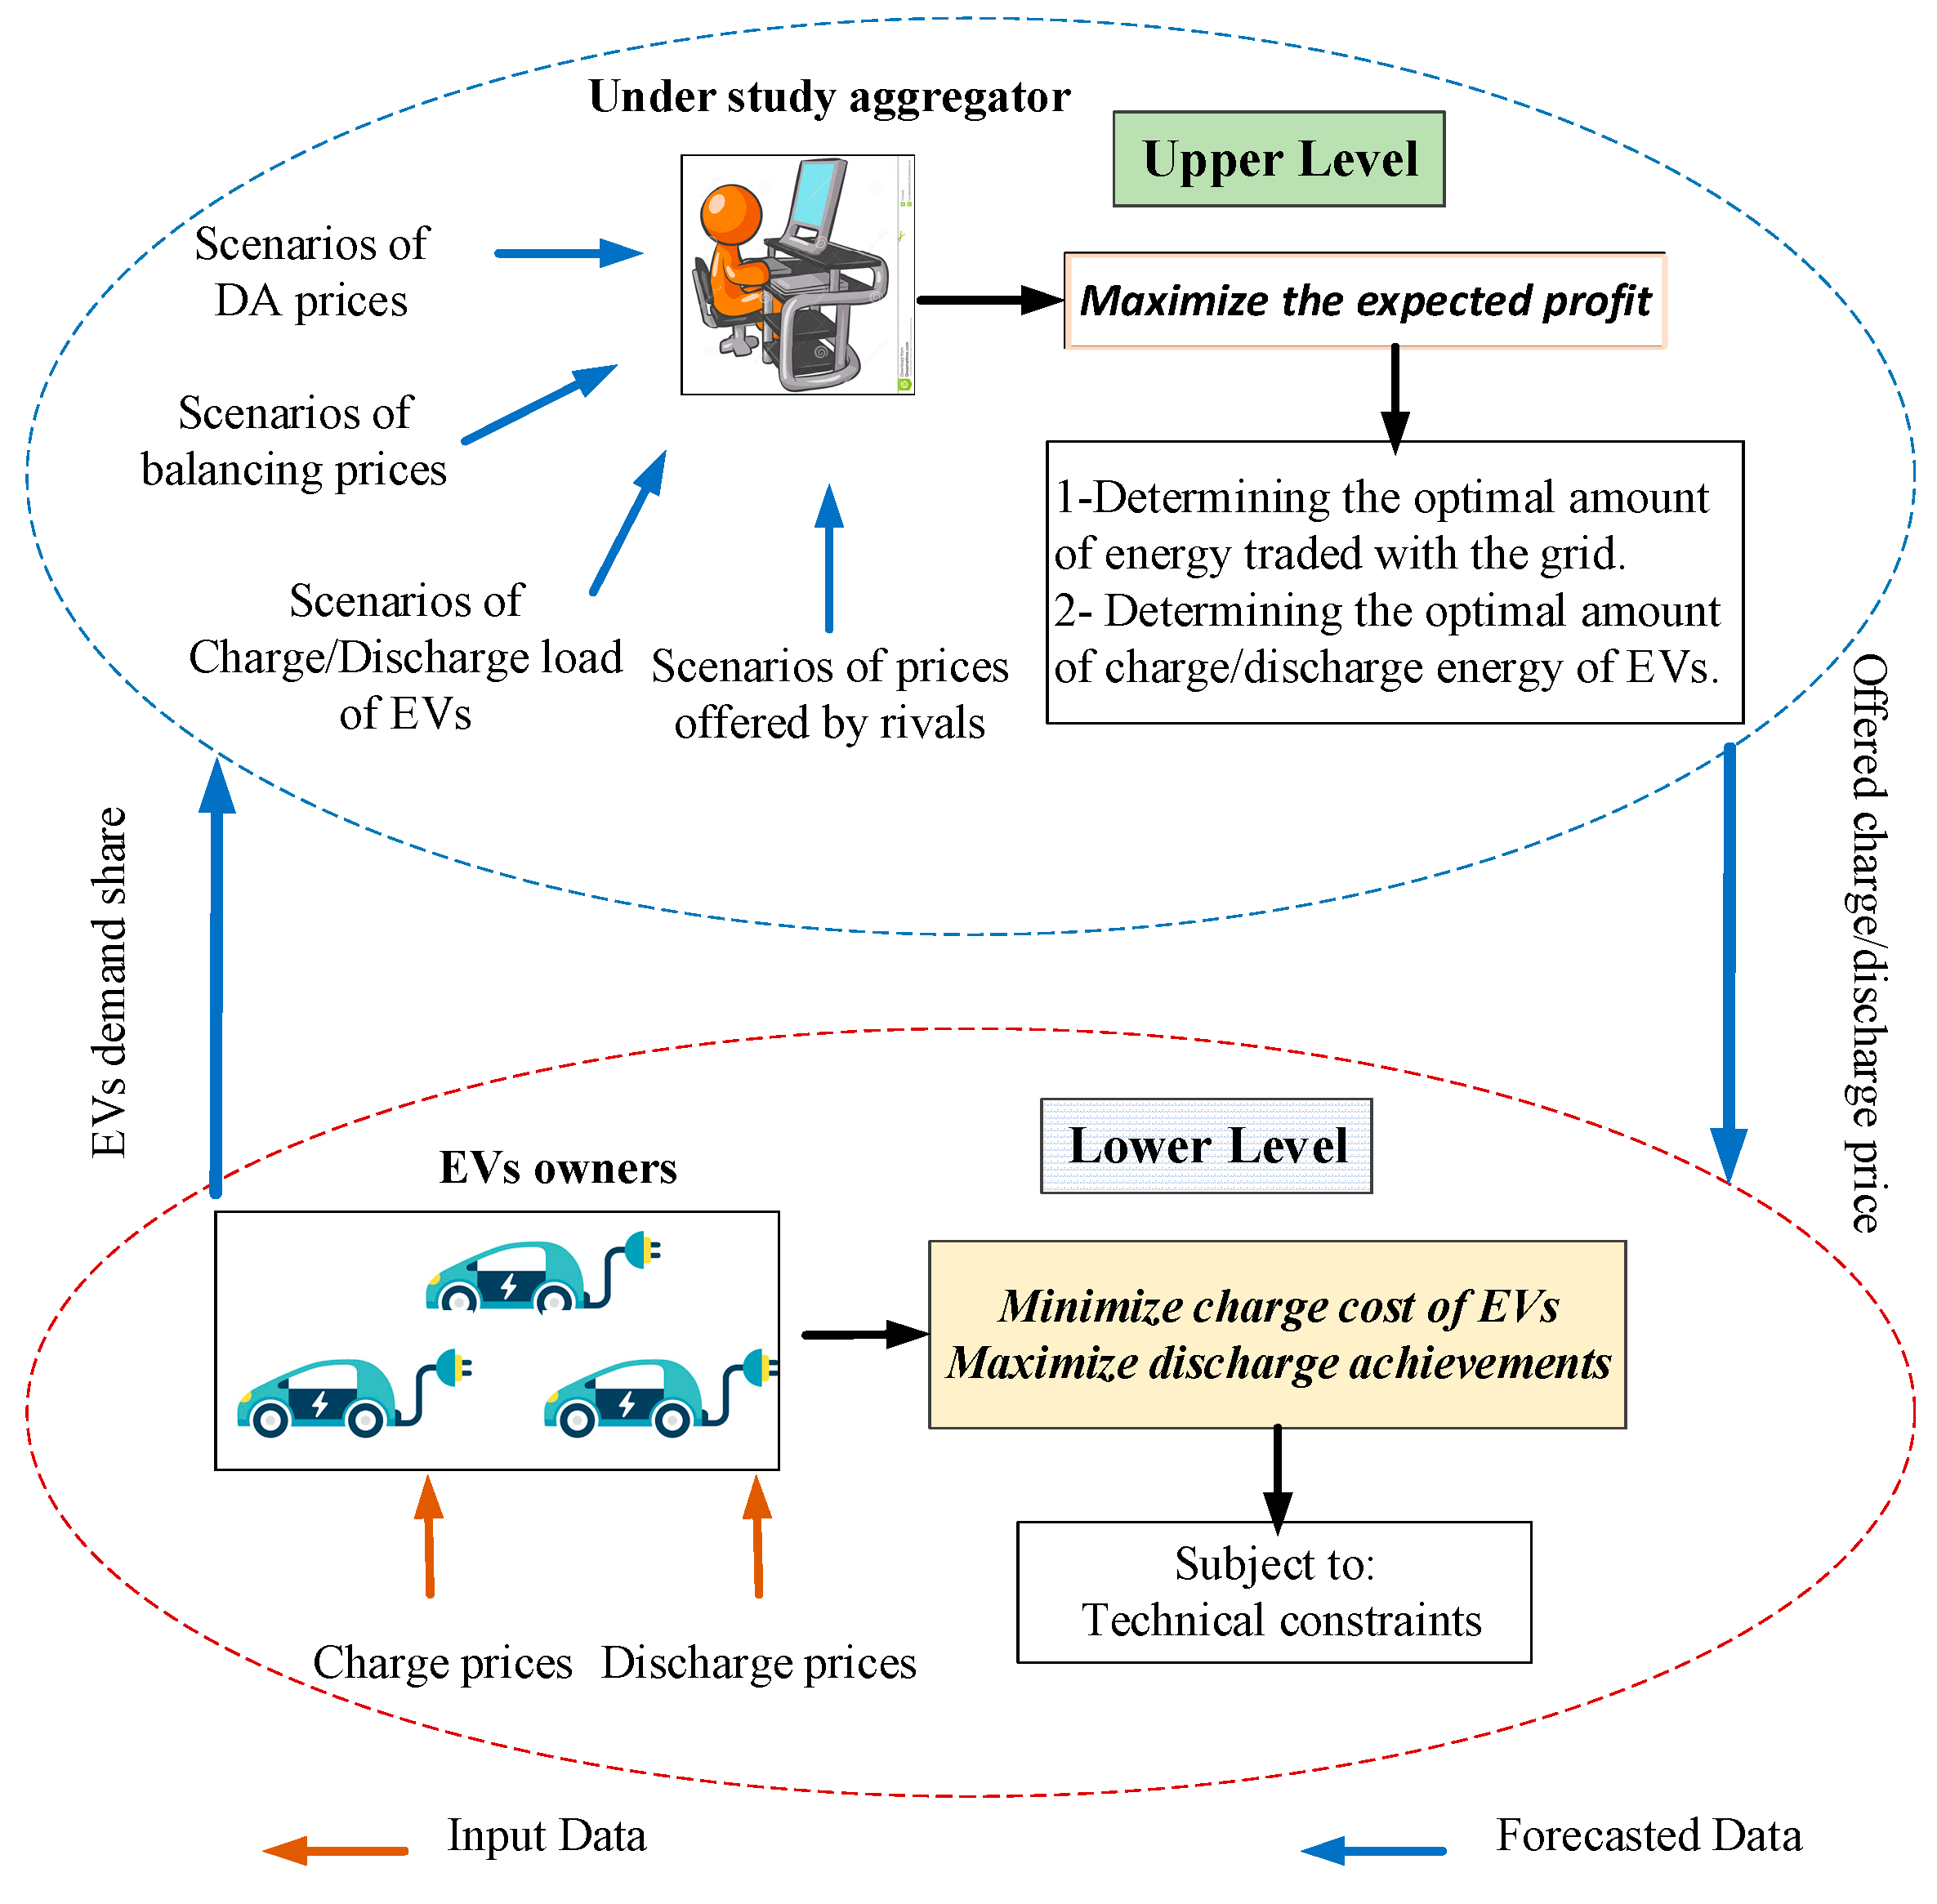
2.1. Problem Description

As shown in Figure 1, the bi-level problem has two optimization levels. In the upper level, the aggregator aims at maximizing its expected profit from participating in a pool-based short-term electricity trading floor, including DA and balancing markets. In this level, scheduled transactions for the next day are determined and then, the energy deviations are calculated and eliminated through actions taken in the balancing market. Moreover, the aggregator offers suitable charge/discharge prices to the EV owners to encourage them making interactive energy trading. Also, it is reasonable that the aggregator wants to purchase energy from the network with lower prices and to offer charge prices to the EV owners with the highest possible prices to make more profit. However, since the market environment is competitive, it should consider different price scenarios that the rival aggregators may offer to the EV owners since, in a competitive environment, the decision making of one aggregator will affect the others.
Figure 2 shows the suggested method to solve the problem. In the energy trading phase, the aggregator encounters different uncertainties, including prices of the DA market, positive/negative balancing markets and rival aggregators’ prices, as well as the required energy of EVs. These uncertainties can be modeled by using scenario generation and reduction techniques.
The proposed framework considers three main units: a data collection and storage unit, a prediction module, and an optimization unit. The data collection and storage unit governs the collection of information related to the demand of EVs and the prediction module provides accurate forecasts of future EV demand. The input to the prediction unit includes information about the market prices, rivals’ prices and required demand of EVs based on historical data collected by the data collection and storage unit. The output of the prediction unit is the predicted market prices, rivals’ prices and the demand of EVs with a probability of prediction error. Based on this information, the optimization unit should solve the bi-level optimization problem to maximize the expected profit of the aggregator while minimizing the payments of the owners. The output of the optimization unit is the optimal bidding in the electricity market and offering of proper prices to the EVs while satisfying system constraints.
In real-world situations, it is assumed that the EV charging stations are equipped with smart energy management controllers (SEMC) and the owners are able to respond to the charge/discharge prices. To this end, the SEMC of each charging station can choose a proper aggregator by monitoring real-time prices and can switch to the most competitive aggregator in short-term scheduling. This is feasible by developing a fast communication media with bidirectional data transfer between the aggregators and the EV charging stations. It should be noted that the owners will not be involved each day in the process; rather, this act is done by the SEMC system and therefore it is not difficult or burdensome in practice for the owners [11].
In the lower level of the problem, the EV owners prefer to charge/discharge their EVs through the most competitive aggregator. In other words, EV owners prefer to minimize the charging payments and maximize the discharge achievements. Here, the scenarios related to the charge/discharge prices offered by the rivals are generated with a normal PDF. The estimation errors of the rival prices are modeled with intervals as the standard deviation. In addition to charge/discharge prices offered by the rivals, there exist other uncertain resources in the problem, such as DA and positive/negative imbalance prices and the EVs’ charge/discharge requests. Here, an autoregressive integrated moving average (ARIMA) model [23] is used to generate the scenarios associated with DA and balancing prices. In this study, it is supposed that EVs demand is correlated to the DA prices such that each EV demand scenario is generated based on a DA price scenario as follows [23]:
E t , ω D c h = E ^ t D c h + E ^ t D c h Π [ ( C t , ω D A C ^ t D A ) / C ^ t D A ]
where C ^ t D A is the expected DA price in period t and the relationship between the DA price and the EV demand in each scenario, ω is represented by Π , which is considered to be 0.2 based on [24]. Also, the discharge load of EVs is supposed as a percentage of EVs demand. In total, each set of scenarios consists of DA and positive/negative balancing prices and EVs charge/discharge requests as follows:
S c e n a r i o ω = { C t , ω D A , C t , ω p o s , B , C t , ω n e g , B , E t , ω D c h , E t , ω D d c h }

2.2. Bi-Level Model

The proposed decision-making problem of the EV aggregator is formulated as two upper and lower levels.

2.2.1. Upper-Level Formulation

The EV aggregator takes part in DA and balancing markets in order to obtain maximum expected profit during the scheduling horizon. The aggregator profit consists of the revenue achieved from selling energy for the charge process and from load reduction in the negative balancing market, minus the payments due to the purchases from DA and positive markets, as well as buying energy from EVs discharging process. Therefore, the upper level problem is formulated as follows:
M a x i m i z e ω Ω π ( ω ) t T [ ( E t , ω c h C s 0 , t c h E t , ω d c h C s 0 , t d c h ) + ( E t , ω D A C t , ω D A E t , ω p o s , B C t , ω p o s , B + E t , ω n e g , B C t , ω n e g , B ) ] + β [ ζ 1 1 α ω Ω π ( ω ) ι ( ω ) ]
where α and ι ( ω ) represent the confidence level and auxiliary variable for risk calculations, respectively. Equation (3) represents the objective function from the aggregator’s viewpoint. The left expression of the first line of this equation denotes the charge revenue minus the discharge payments of the aggregator under study. The right expression expresses the payments in DA and positive balancing markets and, also, the negative balancing revenue. The second line demonstrates the risk-aversion term. The tradeoff between the objective function and risk-aversion term is provided by parameter β as the risk parameter [24]. This parameter models the tradeoff between the expected profit and risk, and therefore depends on the preferences of the aggregator. A risk averse aggregator prefers minimizing risk; thus, it chooses a large value of β to increase the weight of the risk measurement tool in the objective function. In contrast, when the aggregator displays less risk aversion, it chooses high values of β and, consequently, it obtains higher profit values. The related constraints of this level are provided as follows:
E t , ω c h E t , ω d c h = E t , ω D A + E t , ω p o s , B E t , ω n e g , B
t T [ E t , ω c h C s 0 , t c h E t , ω d c h C s 0 , t d c h E t , ω D A C t , ω D A E t , ω p o s , B C t , ω p o s , B + E t , ω n e g , B C t , ω n e g , B ] + ζ ι ( ω ) 0
ι ( ω ) 0
E t , ω c h = E t , ω D c h ξ Ξ ρ c h ( ξ ) X S 0 , t , ξ c h
E t , ω d c h = E t , ω D d c h ξ Ξ ρ d c h ( ξ ) X S 0 , t , ξ d c h
E t , ω D A = E t , ω D A
E t , ω p o s / n e g , B P ¯
Constraint (4) explains the balance for energy at each scenario and at each scheduling hour [14]. Constraints (5) and (6) are associated with the CVaR term [14]. Moreover, EVs’ charge/discharge demand that is supplied by the aggregator is obtained from constraints (7) and (8), respectively. Non-anticipativity is provided in (9) and imposes that identical DA bids have to be made in all scenarios with equal DA prices [20]. The energy traded in the positive and negative balancing market is limited based on (10).

2.2.2. Lower-Level Formulation

The lower level problem explains the preferences of EV owners and is formulated as in Equation (11). Based on this equation, the EV owners seek the cheapest charge and the highest discharge prices offered by the most competitive aggregator to minimize their payments.
M i n i m i z e { E t D c h [ C s 0 , t c h X s 0 , t , ξ c h + s N S s 0 C s , t , ξ c h X s , t , ξ c h ] + s N S s N S s s E t D c h W c h s , s Z c h , t , ξ S , S ' + s N S s N S s s E t D d c h W d c h s , s Z d c h , t , ξ S , S ' ) ( E t D d c h [ C s 0 , t d c h X s 0 , t , ξ d c h + s N S s 0 C s , t , ξ d c h X s , t , ξ d c h ] }
where s and sꞌ refer to the transfer of EV owners between the aggregators, and index s = 0 denotes the aggregator under study. Equation (11) investigates the objective function of the lower level problem, which expresses the cost of purchased energy from both the aggregator under study and rival aggregators. The first line of the equation represents the EV charge costs paid to the aggregator under study and rival aggregators, respectively. The second line denotes the costs due to the shift of charge and discharge of EVs between the aggregators, respectively. The last represents the revenue of EVs due to their discharging process to the aggregator under study and rival aggregators. The constraints are as follows:
X s , t , ξ c h = X s c h , t , ξ 0 + s N S s s Z c h , t , ξ S , S s N S s s Z c h , t , ξ S , S
X s , t , ξ d c h = X s d c h , t , ξ 0 + s N S s s Z d c h , t , ξ S , S s N S s s Z d c h , t , ξ S , S
E t D c h = ω Ω π ( ω ) E t , ω D c h
E t D d c h = ω Ω π ( ω ) E t , ω D d c h
s N S X s , t , ξ c h / d c h = 1
X s , t , ξ c h / d c h 0
Z c h / d c h , t , ξ s , s 0 , s , s S , s s
The share of each aggregator to supply EVs for the charge and discharge process is represented in constraints (12) and (13), respectively. Constraints (14) and (15) explain the total expected charge and discharge demand of EVs at each hour. Also, constraint (16) explains that all of the aggregators supply the charge/discharge process of EVs at each hour. Moreover, constraints (17) and (18) explain the limitation for the variables that show the percentage of demand to be supplied [25]. Finally, constraints (19)–(24) describe the technical constraints to keep state of charge (SOC) of EVs within its limitation and the amount of energy that they can obtain or inject from/to the network [17]. In the following equations, μ ¯ t , ω c h / d c h , μ ¯ t , ω c h / d c h , γ ¯ t , ω c h / d c h , γ ¯ t , ω c h / d c h , μ ¯ t , ω s and μ ¯ t , ω s represent the auxiliary variables that are used for KKT optimality conditions.
0 E t , ω c h P ¯ c h : μ ¯ t , ω c h , μ ¯ t , ω c h
0 E t , ω d c h P ¯ d c h : μ ¯ t , ω d c h , μ ¯ t , ω d c h
S o C t , ω S o C t 1 , ω η c h × E t , ω c h + 1 η d c h × E t , ω d c h = 0 : λ t , ω s
S o C ¯ × E C a p S o C t , ω S o C ¯ × E C a p : μ ¯ t , ω s , μ ¯ t , ω s
0 η c h × E t , ω c h ( S o C ¯ × E C a p ) S o C t 1 : γ ¯ t , ω c h , γ ¯ t , ω c h
0 1 η d c h × E t , ω d c h S o C t 1 , ω : γ ¯ t , ω d c h , γ ¯ t , ω d c h
The upper level problem gives the amount of energy purchased from DA and balancing markets and the charge/discharge price signals offered to the EV owners. In contrast, the lower level problem gives the percentage of EV charge/discharge load that will be supplied by the aggregators. It should be mentioned that the problem discussed above is nonlinear due to the inclusion of terms E t , ω c h C s 0 , t c h and E t , ω d c h C s 0 , t d c h in relations (3) and (5).
The equivalent single-level form of the problem is obtained with the application of KKT optimality conditions of the lower level problem. Then, the bilinear products of E t , ω c h C s 0 , t c h and E t , ω d c h C s 0 , t d c h are replaced with equivalent single-level expressions using the strong duality theorem [25]. Finally, the equivalent form of the bi-level problem explained in (3)–(24) is obtained as a single-level mixed-integer linear programming (MILP) problem, which can be efficiently solved by commercially available software. This equivalent problem includes the objective function of the upper level as represented in (25), the constraints of both levels, and the equivalent expression of the lower level objective function that is represented as follows:
M a x i m i z e ω Ω π ( ω ) t T [ Re v t , ω c h Re v t , ω d c h E t , ω D A C t , ω D A E t , ω p o s , B C t , ω p o s , B + P t , ω n e g , B C t , ω n e g , B ] + β [ ζ 1 1 α ω Ω π ( ω ) ι ( ω ) ]
The bi-level programming problem is transformed into its equivalent single-level nonlinear optimization problem using the KKT optimality conditions of each lower-level problem. KKT conditions apply here since the lower-level problems are convex. In Equation (25), Re v t , ω c h and Re v t , ω d c h represent the charge revenues and discharge payments for the aggregator under study, respectively. The other terms are as explained earlier. Equation (25) is obtained subject to the constraints (4)–(10), (12)–(24) and the constraints that obtained from KKT and duality theory, as given in Appendix A.

3. Numerical Results and Discussion

In order to evaluate the applicability and effectiveness of the presented bi-level model, a test case study with realistic market prices is used.

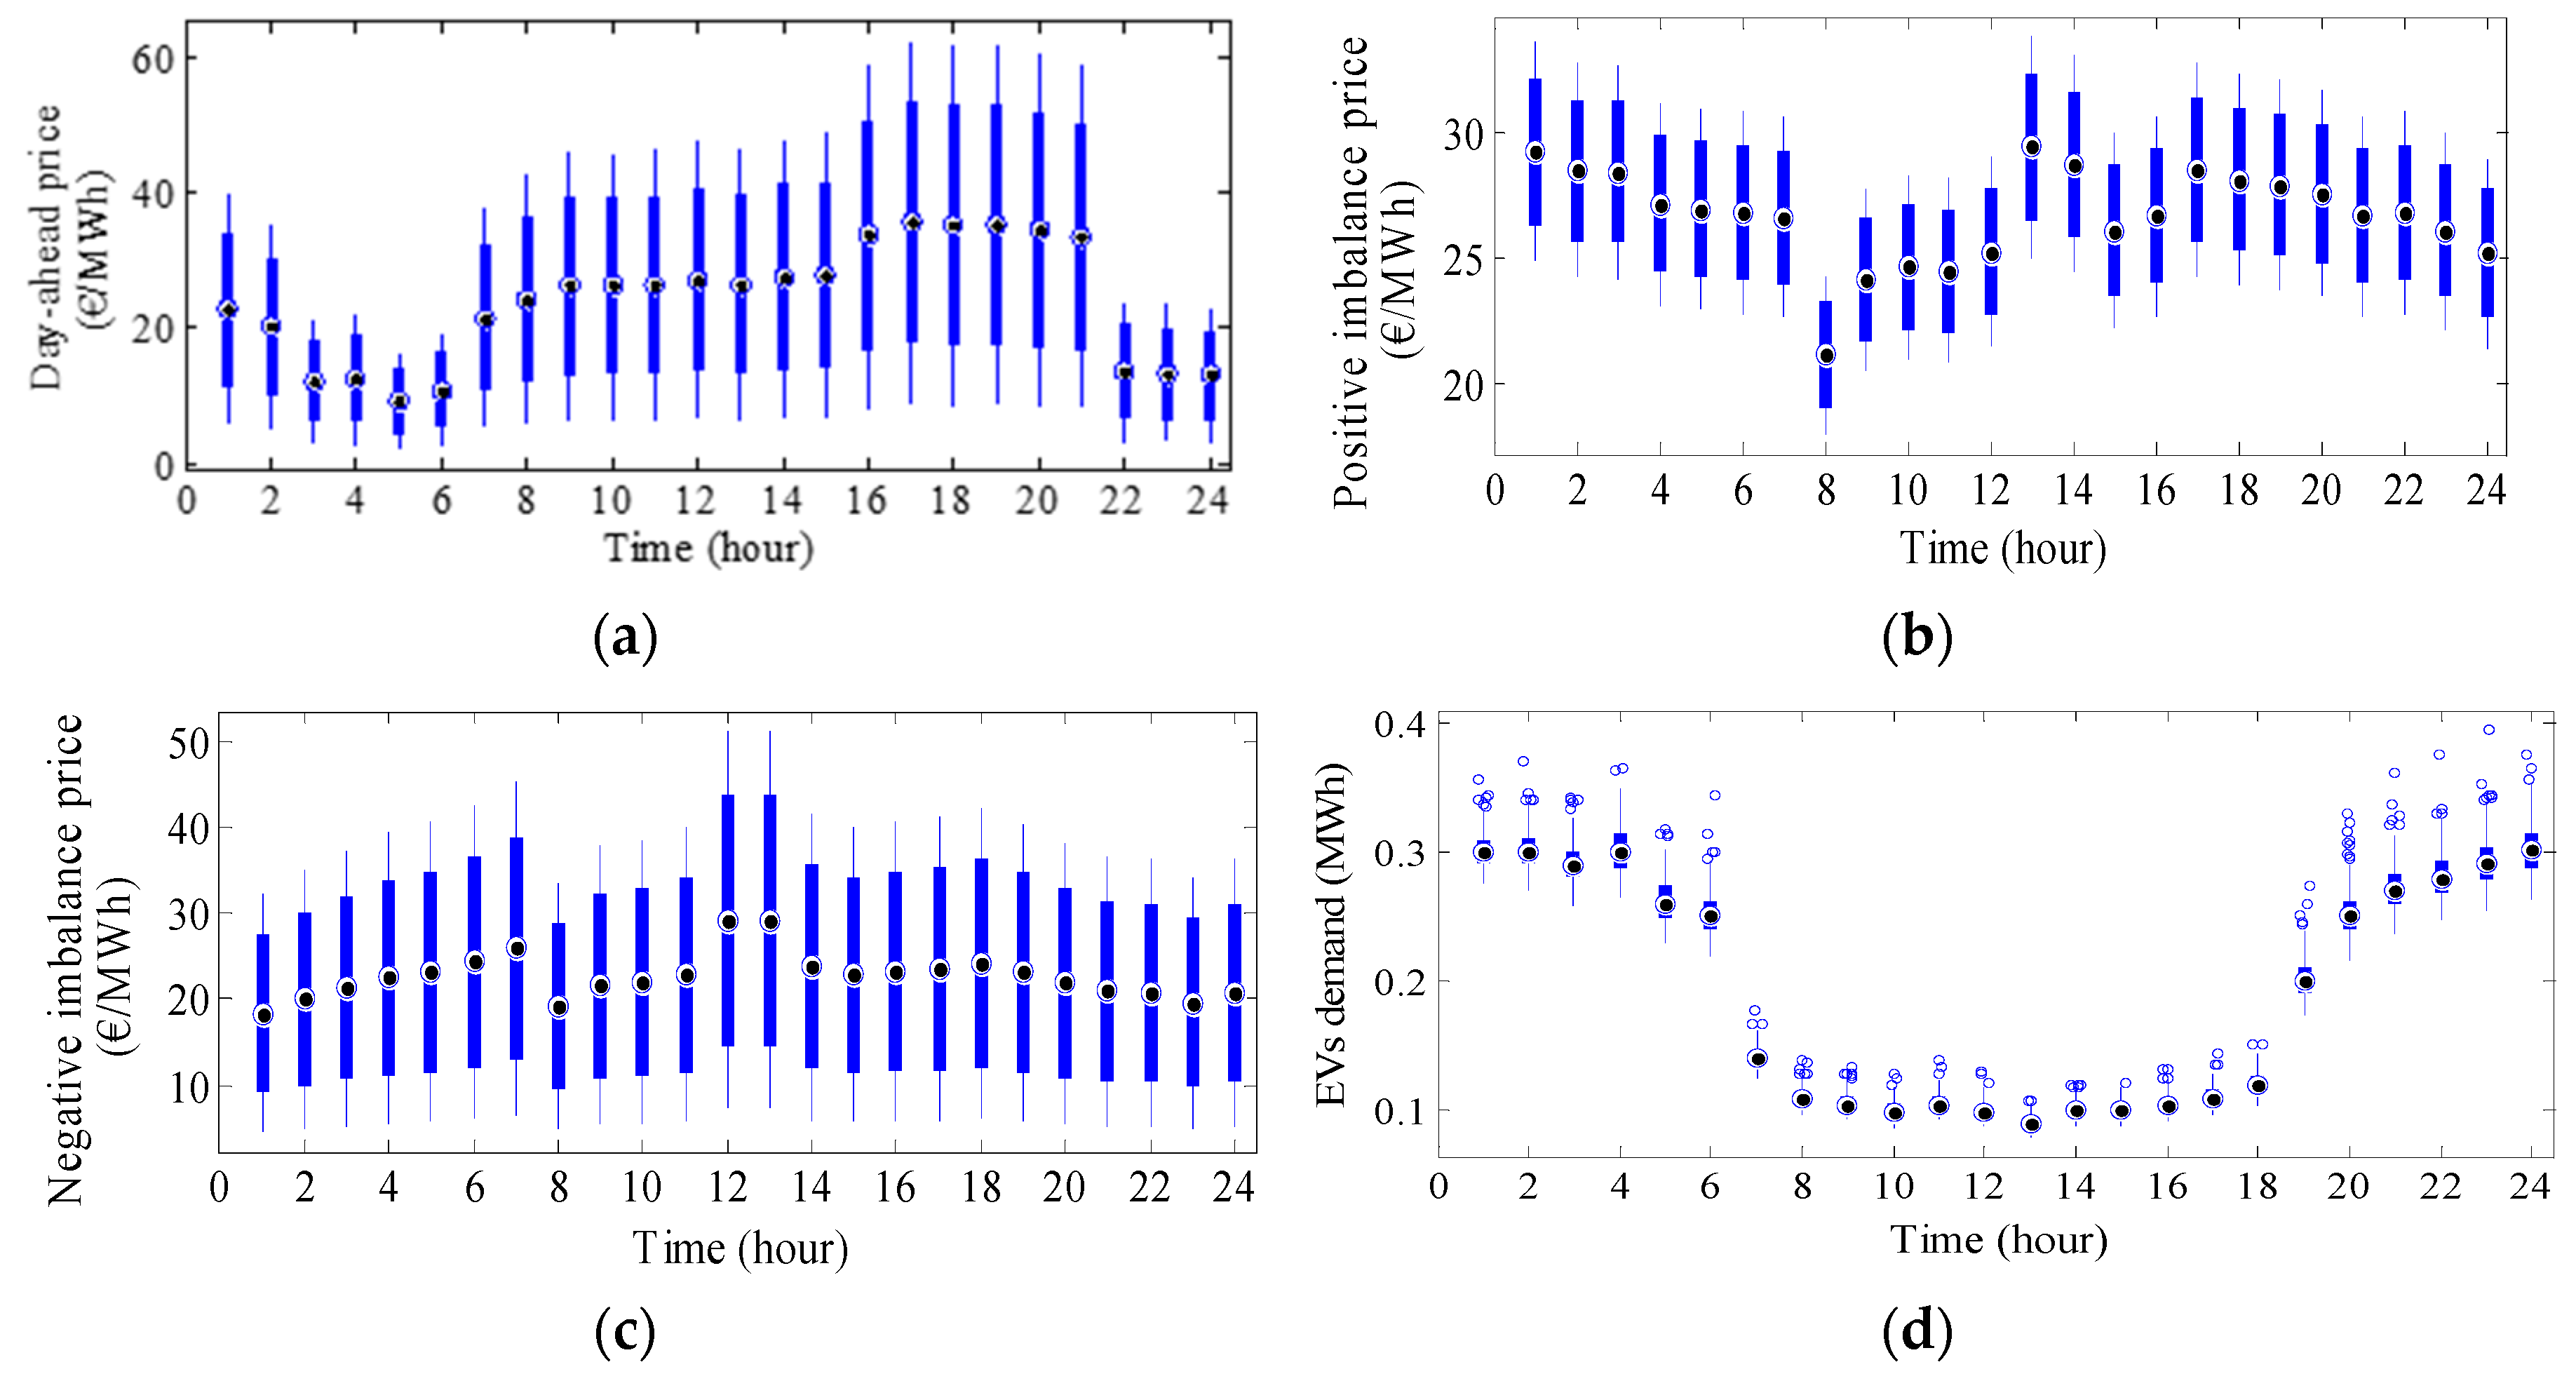
3.1. Test Case Study

In this study, to evaluate the proposed decision-making model, four aggregators are considered, in which one of them is considered to be the aggregator under study (S0) and the others are considered to be rivals (S1–S3). The DA and balancing electricity market prices for the model presented above are extracted from the Nordpool market [26]. In this study, for each stochastic parameter, 200 scenarios are generated using ARIMA models. The generated scenarios of each parameter are reduced to seven scenarios by using the method explained in [22]. The scenarios related to each parameter are shown in Figure 3. Moreover, in this study, 100 EVs with the same characteristics with the battery capacity of 16kWh are considered. The initial SOC of EVs at each scenario is randomly generated within its technical limitation. The forecasted charge/discharge prices offered by three rival aggregators are obtained from [27] and their associated scenarios are generated with a three-segment normal PDF [28]. The value of adopted is 0.95 based on [14] and the simulation time step is set to 1 h. The scheduling horizon is 24 h. Finally, the bi-level stochastic programming problem is formulated as an equivalent MILP program and solved with CPLEX in the GAMS software [29] on a computer with 4 GBs of RAM and Ci5 CPU.

3.2. Simulation

Regarding risk-aversion in the form of CVaR weights, Figure 4a shows the expected profit versus CVaR for different levels of β. It is observed that with increasing β the aggregator’s expected profit decreases. When the aggregator becomes very risk averse, the lowest (1-α)-quantile of profit scenarios are ignored. Also, it can be seen that in low risk-aversion factors, CVaR is negative, which means that the profit in some of the scenarios is negative, as explained in [14]. However, with an increasing risk-aversion factor, these negative scenarios would be omitted and as a result, CVaR moves toward positive values. Moreover, the expected profit versus the average of the standard deviation during the whole day for different values of β is illustrated in Figure 4b. As shown, with increasing β, the standard deviation of the profits decreases. In fact, when the aggregator tries to hedge against volatilities, the low probable profits in unfavorable scenarios are ignored. When it becomes less risk averse, however, the profits in scenarios become more dispersed, which leads to experiencing profits far from those expected. In other words, with increasing β, the profits with low probability are eliminated. Therefore, the standard deviation of the expected profit of the aggregator during the scheduling horizon would decrease.
Table 1 shows the expected DA, positive/negative energy exchanged between the aggregator and the network ( E D A , E P o s and E N e g ) during the whole day. As shown, with increasing β from 0.01 to 10, the aggregator’s participation in DA and negative balancing markets varies from 3.786 and 2.158 MWh to 3.199 and 1.880 MWh, which shows reductions of 15.5% and 12.7%, respectively. This is because when the aggregator becomes more risk averse, it purchases less blocks of energy from the more volatile markets. Moreover, with increasing β from 0.01 to 10, the aggregator’s purchases from the positive balancing market increases from 0.529 to 0.729 MWh (36.5%), which is because the positive market is more stable and the aggregator can hedge against volatilities by increasing the purchases from this market. Table 2 is also given to compare the obtained results with those reported in [14]. It can be seen from the two tables that the findings in this paper have the same trend for energy transactions with increasing risk-aversion factors.
For more elaboration, the DA and positive/negative imbalance energy procurements by the aggregator under study in the lowest and highest β (β = 0.01 and 10) are depicted in Figure 5. In order to avoid data crowding, the energy procurement in other risk-aversion factors is not illustrated. From Figure 5a,c, it can be seen that the trend of DA and negative balancing energy purchases follows the shape of EV demand in Figure 3d. Also, when the EVs are not satisfied with the purchased energy from the DA market, the aggregator will procure deviations in the positive market (Figure 5b). It is conceived from Figure 3d that during the night and early in the morning, the EV owners try to charge their EVs to be ready for daily use. Consequently, the aggregator tries to buy more energy for those hours to supply EVs from the DA market, which has lower prices than the positive balancing market.
Moreover, when the EV owners reach home at noon, some may charge their EVs for leisure hours in the evening. Therefore, the aggregator supplies them with the energy it buys from the DA market and covers the energy deviations from the positive market. Moreover, as can be seen from Figure 5c, the aggregator bids for load decrement in the negative market to make more profit based on the prices in Figure 3c. Here, the aggregator tries to participate in the negative balancing market during the period that EVs are connected. In fact, when the EVs are connected during night and early in the morning, they may decrease their load or even discharge their batteries. But, with increasing β, the aggregator usually purchases more energy from the positive balancing market, although, in some hours, the opposite occurs. For example, from 08:00 to 11:00, when the positive balancing prices are a little less than the DA prices based on Figure 3a and b, the aggregator purchases more energy from the positive balancing market, although it also participates in the DA market. During other hours, when the DA prices are less than the positive prices, the aggregator participates more in the positive balancing market when it becomes more risk averse.
Charge and discharge prices offered by the aggregator under study for two risk-aversion factors, as well as the expected prices offered by the rivals, are shown in Figure 6a,b, respectively. As can be seen, with increasing β, the aggregator offers higher charge prices in some hours to compensate for the payments incurred in the positive balancing market as a costly trading floor and suggests lower prices to attract the EV owners. However, it does not increase the prices in all hours because it might lose its EV clients due to the competitive environment of the trading floor. Therefore, in most hours, the aggregator keeps the prices the same as those offered for β = 0.01. Moreover, the price increments are not more than those offered by the rivals; else, the EV owners might become demotivated and move to the rivals. Based on the previous explanation, from 08:00 to 10:00, for β = 10, the aggregator buys more energy from the positive balancing market with lower prices. Also, it bids for more load decrement in the negative balancing market and could achieve more profits in these hours with increasing β. In fact, since the aggregator buys energy with lower prices for β = 10, and achieves revenue from the negative balancing market, it offers cheap charge prices. At 19:00, the aggregator decreases its offered charge price for β=10; this is because, if it increases the suggested price at this hour for β = 10, this price might be more than that offered by all rivals and the aggregator may lose most of its EV clients due to the competitive nature of the market. Overall, for β = 10, the aggregator increases the price of those hours that have low values for β = 0.01, but not those with high values, because it might lose its clients. Also, it is observed from Figure 6b that the aggregator sometimes offers lower discharge prices with increasing β. In fact, since for high values of risk-aversion it participates in the expensive positive balancing market more than the DA one, it offers low discharge prices to compensate for its payments in the costly positive trading floor. However, during some hours, such as 22:00, the opposite occurs, since the charge price increases for β = 10 and consequently EVs go to the rivals; thus, the aggregator offers high discharge prices to stay in the game. At 08:00 and 19:00, when the discharge price offered by the rivals has a peak, the aggregator under study also offers high discharge prices to compete with rivals.
Figure 7a,b illustrates the share of the aggregator under study in supplying EVs charge and discharge demand. It is conceived that when the aggregator behaves competitively, it attracts the EV owners. For example, at 05:00 when the offered charge price is lower than the one offered by the rivals, it supplies most EV demand. However, at 19:00, the charge price in both risk-aversion factors is high, so the amount of supplied EVs is low. Also, at midnight and early in the morning, when EVs are connected to the network, the aggregator under study offers the lowest price among all the aggregators to motivate the owners. For the middle hours of the day, the aggregator offers fair price signals to supply EV owners in both risk-aversion factors. Also, the aggregator offers discharge prices such that it buys the stored energy in the EVs batteries. Moreover, it tries to compete with other rivals to offer discharge prices such that it remains in the game. On the other hand, EV owners try to discharge their EVs with high discharge prices. For example, at 01:00, 02:00 and 04:00, there are other aggregators who offer higher discharge prices. Therefore, the owners leave the aggregator under study. At 21:00, when the offered price by the aggregator is higher than that of its rivals, it could purchase high discharge demand.
Although the findings in Figure 4 are consistent with those in [14,25], it should be noted that with increasing β, while the standard deviation of the profits decreases during the whole day, this might not happen at some hours. Here, Figure 8 shows the expected profit and its standard deviation for the aggregator under study at each hour of the scheduling horizon. It is observed that with an increasing risk-aversion factor, although both the expected profit and standard deviation of the whole day decreases (see Figure 4), they might not reduce in some hours, as seen in Figure 8. For example, at 19:00, with increasing β, both expected profit and standard deviation increase. As shown in Figure 6a, at 19:00, when the aggregator becomes more risk averse, it suggests a lower charge price than the one for β = 0.01. Thus, based on Figure 7a, it supplies 0.0064 MWh for β = 0.01 and 0.0256 MWh for β = 10. Therefore, it attracts more charge demand when it becomes more risk averse. Moreover, the aggregator proposes lower discharge prices and could buy 0.00128 MWh of the stored energy in the EVs batteries for β = 10. Thus, the aggregator obtains more revenue from the charging process and pays less due to the discharge process. Therefore, for β = 10, at hour 19:00, the aggregator obtains more revenue and consequently its expected profit increases. Also, at this hour, with an increasing risk-aversion factor and offering a lower charge price, the EVs are motivated to request their demand from the aggregator under study. Therefore, the aggregator participates in both the DA and positive balancing markets to supply them. Also, it participates more in the negative balancing trading floor. Thus, its purchases from both volatile DA and negative balancing markets increases. As a result, the standard deviation of its expected profit increases.
The cumulative probability function of the expected profit at 19:00 is depicted in Figure 9b. The profit cumulative line for β = 0.01 has a severe slope, which reaches one sooner than that for β = 10. This is because the profits for a low risk-aversion factor deviate less. Also, it shows that the profits for β = 0.01 are negative. Likewise, the expected profit and the relative cumulative function at 22:00 are depicted in Figure 9c,d, respectively. For β = 0.01, the profit in all scenarios is more dispersed, but for β = 10, it is the opposite.
At this hour, the aggregator’s participation in the DA and negative balancing markets is less than that in the positive market. Therefore, it encounters less volatility for β = 10. With increasing β at this hour, the standard deviation of the profits reduces due to the purchases from a more stable trading floor. Moreover, at 22:00, when the aggregator hedges more against volatilities, it suggests high charge prices which results in the loss of its EV clients and, consequently, implies financial losses. The probability cumulative function of the profits at this hour is also shown in Figure 9d. As observed, the cumulative probability of the profits for β = 10 reaches one with a substantial slope before that for β = 0.01, which implies the lower standard deviation of profits for β = 10. Also, negative profits are seen for β = 10, which means that the aggregator experiences losses; this might be due to higher discharge prices and lower participation in the negative balancing market.
In order to make a comparison between the method explained in this paper and those from the literature, the methodology that has been developed in [14] is discussed here. In [14], authors propose an approach to maximize aggregator’s profit-taking decisions in the DA and balancing markets while considering risk-aversion. Although in the referred paper the aggregator tries to maximize its profit, the preferences of the owners are not considered. Also, the effect of the competitive environment of the decision making of the aggregator is not a focus in that work. However, due to the competitive environment of the trading floor, if the aggregator does not solve the problem from the perspective of EV owners, it might lose its clients if it does not offer fair prices. It is mentioned here that as the aggregator becomes more risk-averse, it might lose its EV demand due to more expensive prices. Table 3 shows the share of each aggregator in supplying the EV charge and discharge demand for different values of β during the scheduling horizon. It is observed that with the presence of rivals, the risk-averse decisions of the aggregator affect the percentage of demand that it supplies. As shown, for low values of β (β = 0), the aggregator supplies 43% of EV demand. With increasing β, it loses its clients. The same analysis is also true for the discharge process. In fact, when the aggregator becomes more risk-averse, it offers cheaper discharge prices and, as a result, it loses its demand. Therefore, in this work, it is shown that competition among all aggregators affects the decision making of the aggregator, despite being ignored in [14].

3.3. Discussion

In this work, the authors presented a bi-level programming approach to solve the short-term decision-making problem faced by the aggregator. It was shown through computer simulations that the proposed strategy has the potential to offer significant benefits to the aggregator and EV owners. However, there are several challenges, such as uncertainties and the competitive environment, that must be addressed. In order to cope with uncertainties, CVaR as a risk-aversion measurement was used. In this regard, by increasing the risk-aversion parameter, the aggregator offered more expensive prices to the owners to avoid the profit losses; however, due to the competitive environment, it should offer fair prices to stay in the game. Moreover, with an increasing risk-aversion parameter from 0.01 to 10, the aggregator’s participation in DA and negative balancing markets was reduced 15.5% and 12.7%, respectively, while its purchases from the positive balancing market increased significantly (around 37%). The trend of decrement and increment participation of the aggregator in the DA and balancing markets based on risk-averse behavior of the aggregator was also consistent with the findings of previous works in the literature. However, one of the major contributions of this work compared to the other studies was that the market participation of the EVs in both the charge and discharge processes was considered.
Regarding the solution methodology, in this work, the selling price offered by the aggregator under study was obtained based on the proposed bi-level stochastic optimization framework. By doing this, the aggregator could optimally compute its selling prices and offer them to EV owners. Within this framework, a competitive market environment was considered in which the reaction of EV owners to the charging and discharging prices offered by the rival aggregators, as well as the market prices and EV demand, were also modelled. Moreover, owners’ response to retail prices and competition among rival aggregators were both explicitly considered in the proposed bi-level model. As a result, the effect of risk-aversion behavior of the aggregator on the offering charge and discharge prices to the EV owners was assessed. Also, the effect of the risk-aversion factor on the share of the aggregator to supply EVs was evaluated. Consequently, it was shown that the aggregator should decide not only to consider the risk-aversion, but also the profit share in a competitive environment. Therefore, a proper risk-aversion factor should be chosen by the aggregator.
Future efforts will be mainly focused on the application of other competitive game theoretical modelling and the investigation of risk-aversion factors on the decision-making problem of the aggregators.

4. Conclusions

This paper proposed a bi-level structure for decision-making of an EV aggregator in a competitive trading floor. In the upper level, the aggregator tried to maximize its expected profit, and, in the lower level, the EV owners aimed at minimizing their payments. Subsequently, the bi-level stochastic nonlinear structure was transformed to a linear single level problem with the application of KKT optimality conditions and the strong duality theory. With the presence of uncertain resources, CVaR was used to assess the influence of the undesired scenarios. The proposed decision-making problem was applied to a test case and the following results are obtained:
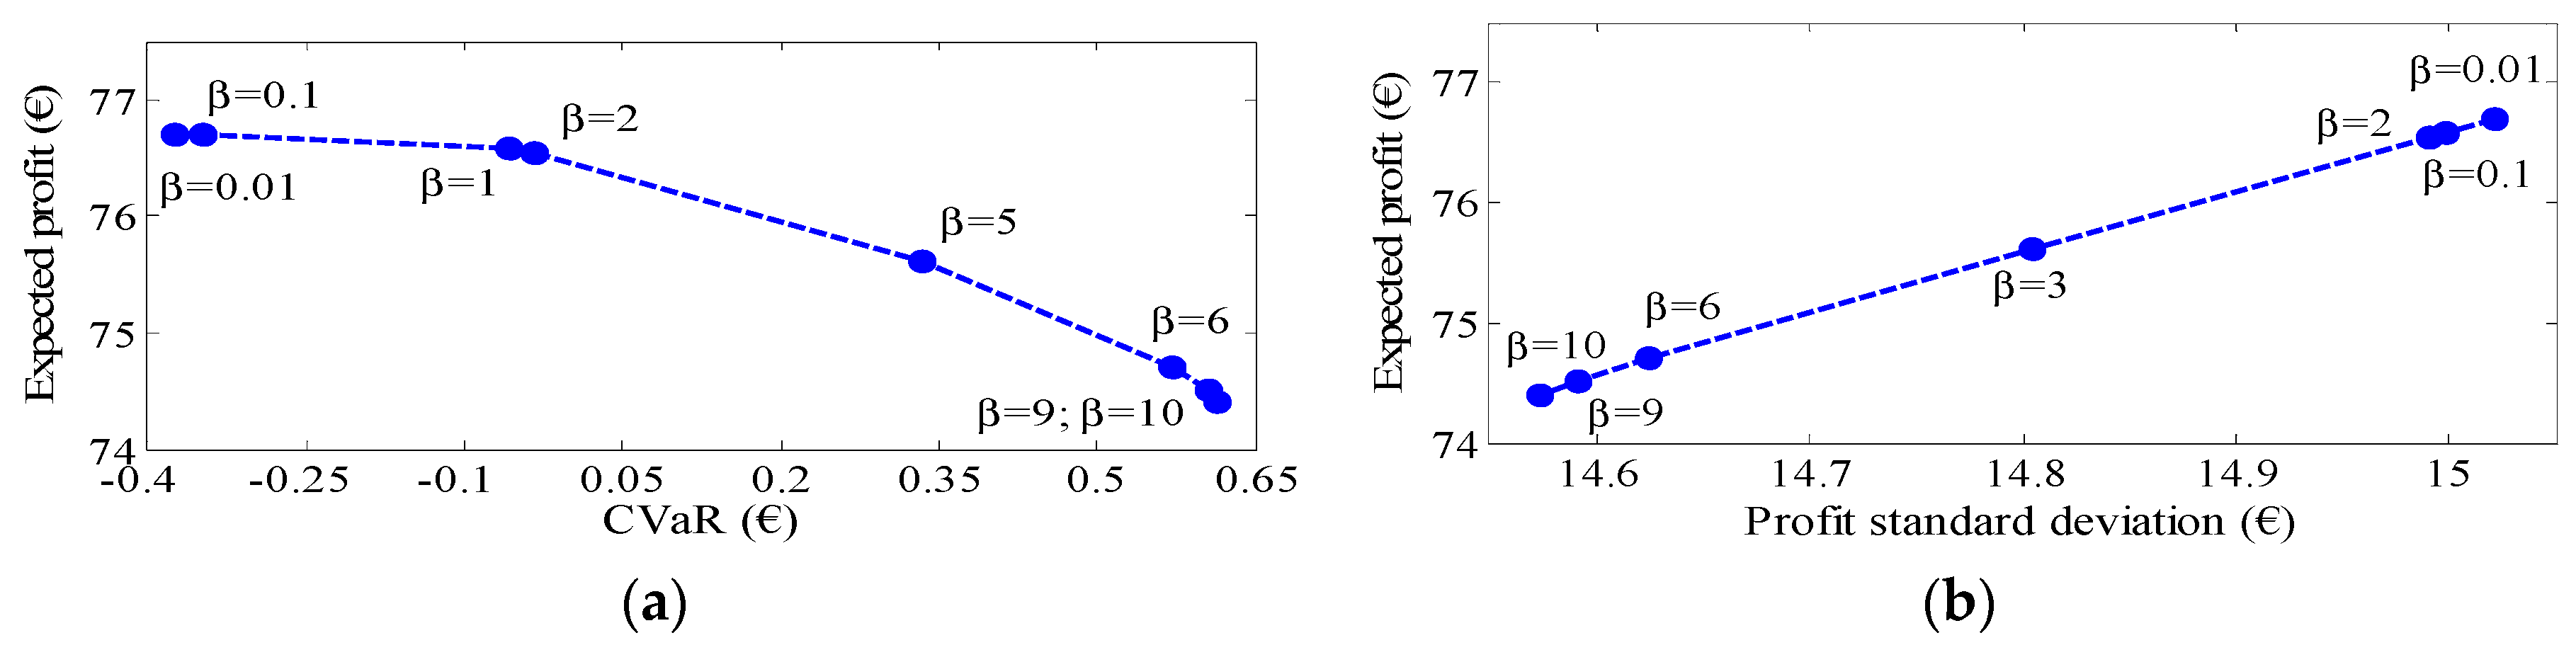
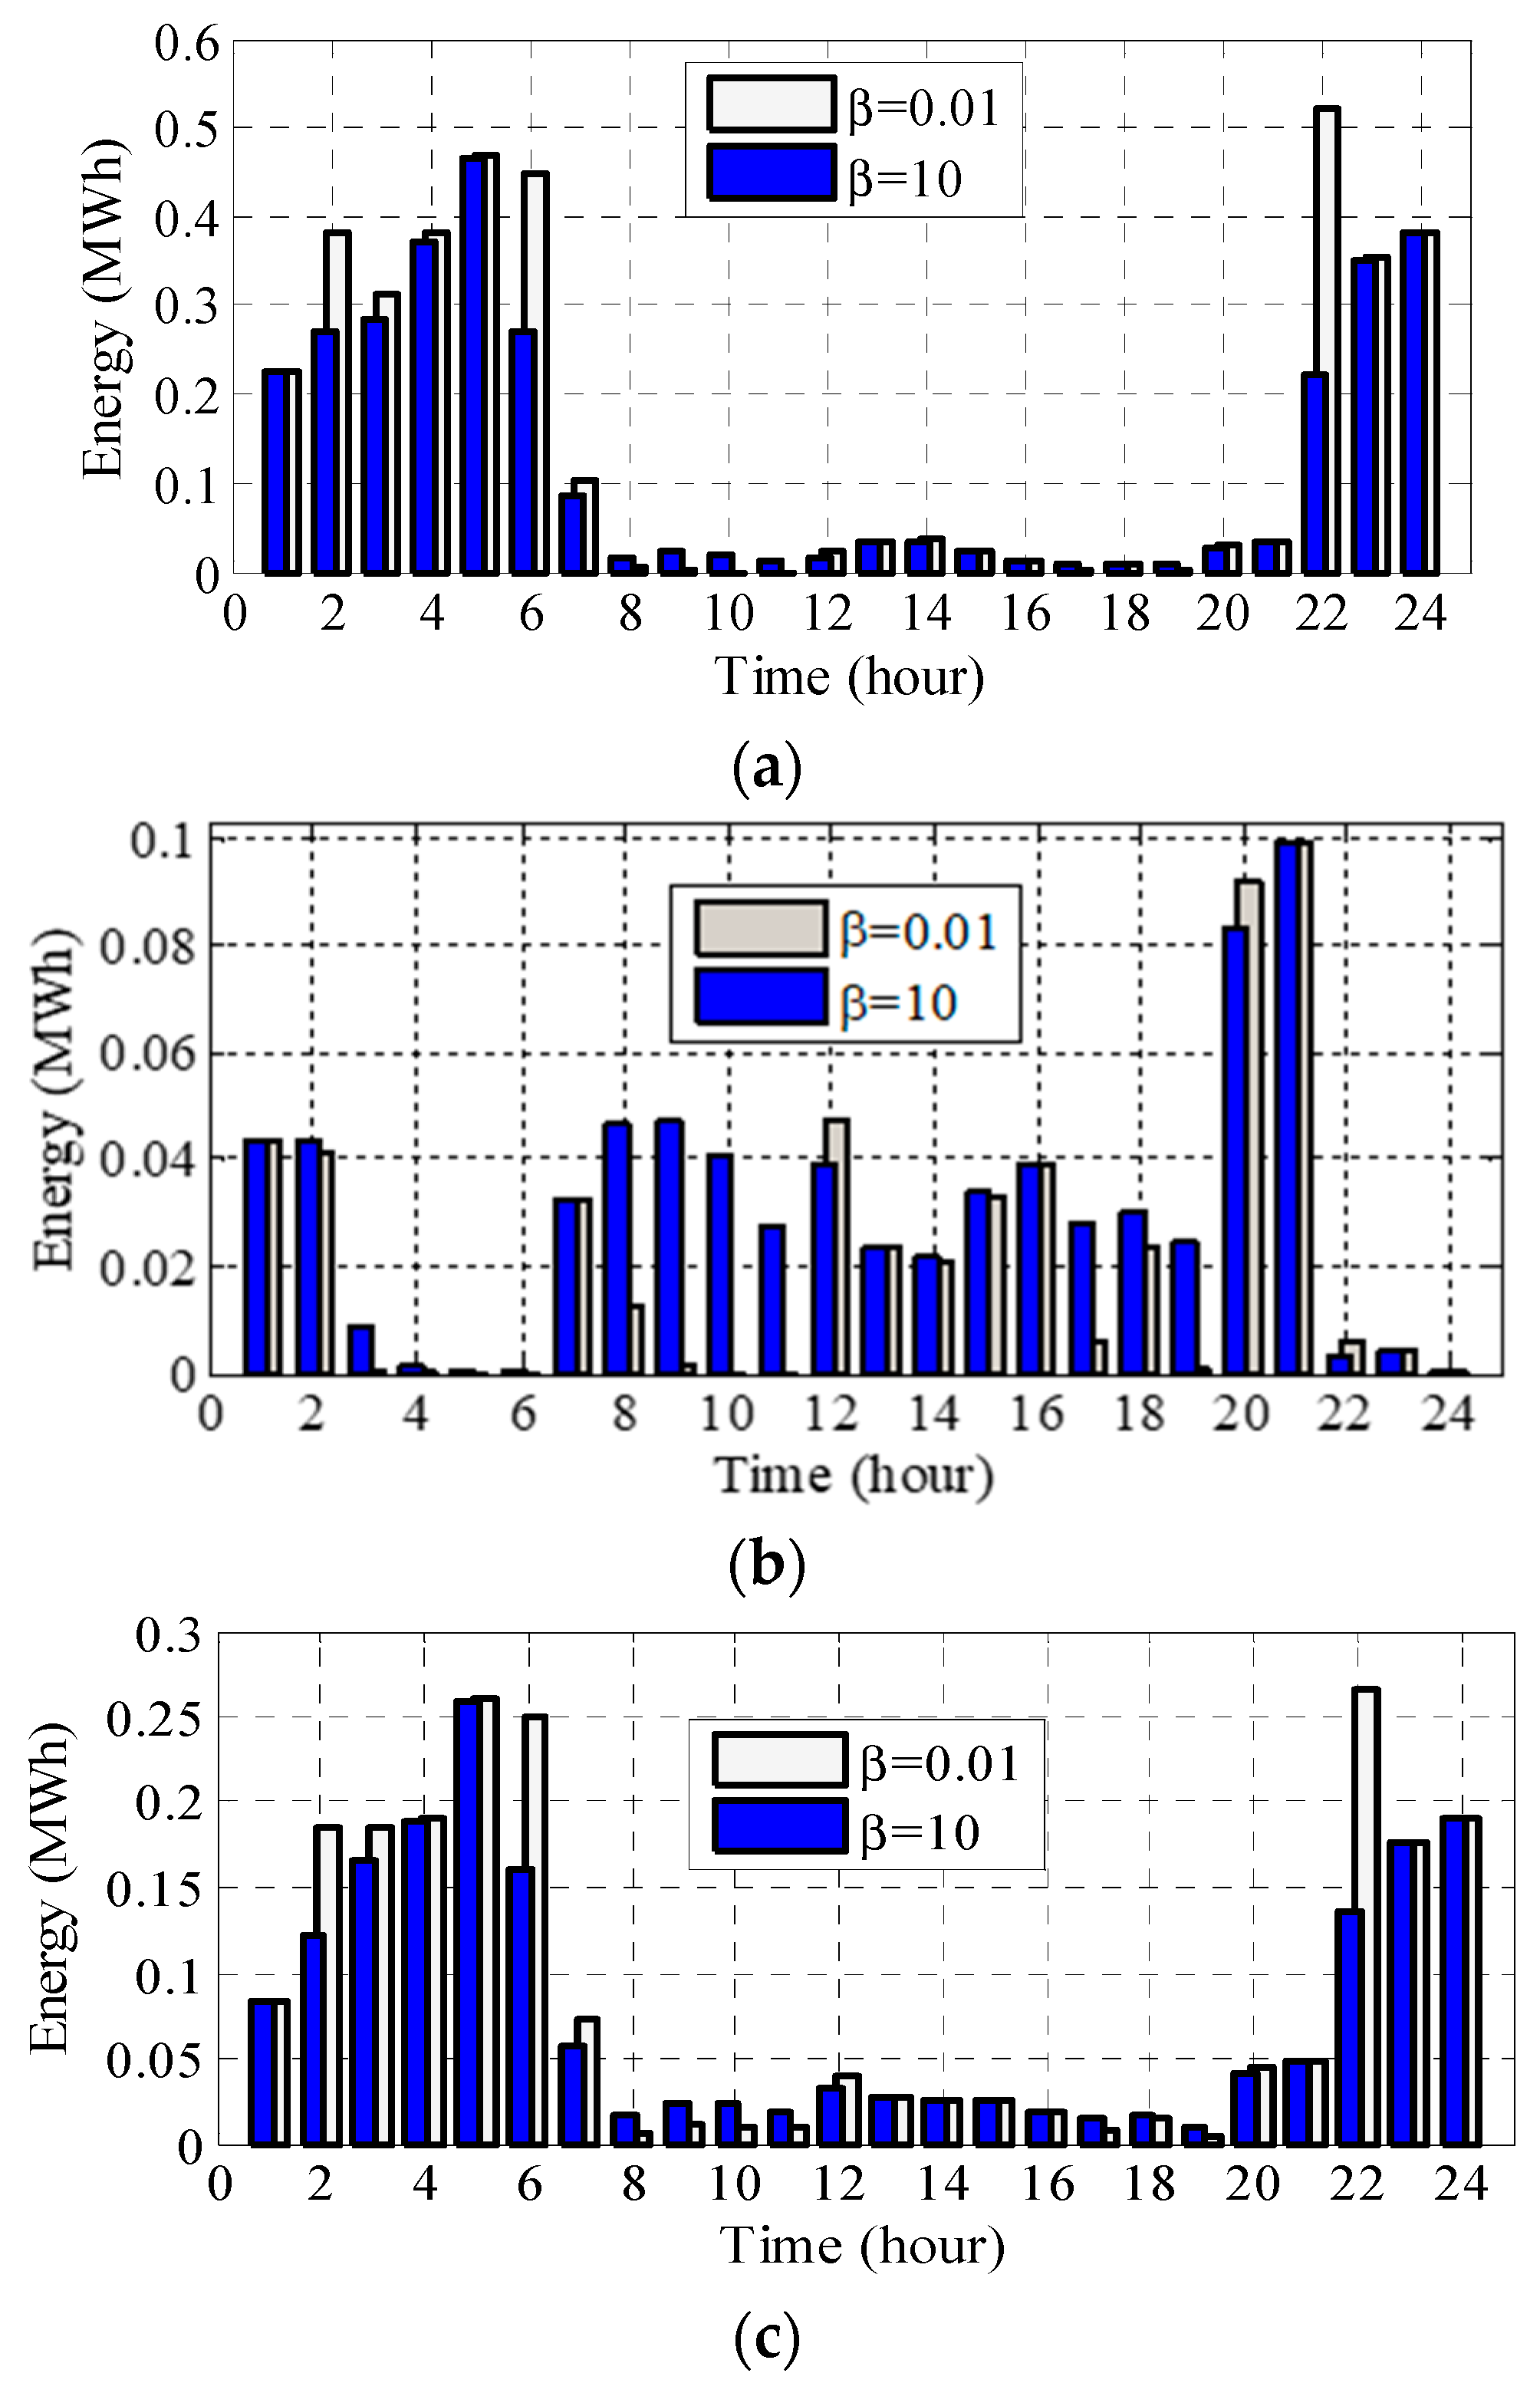
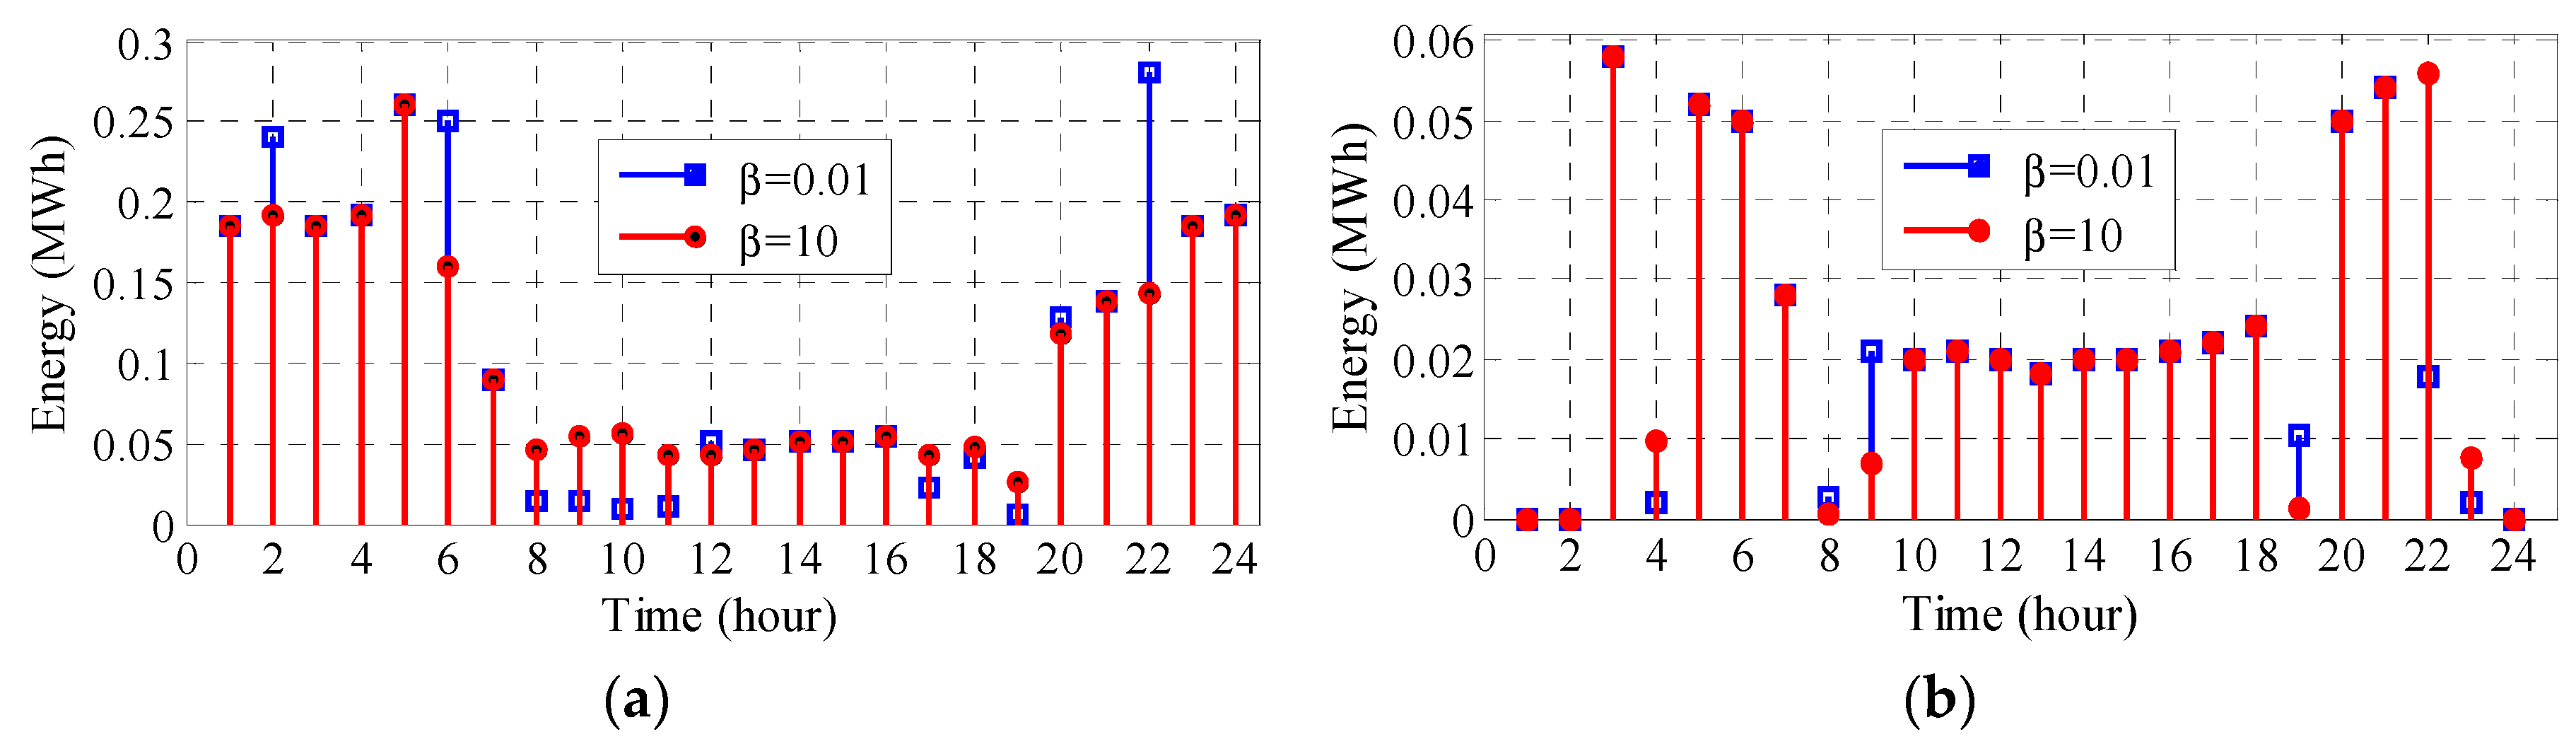
  • With an increasing risk-aversion parameter, the aggregator’s participation in DA and negative balancing markets is reduced due to more volatile prices of these markets, but its purchases from the positive balancing market increases due to more stable prices, which consequently helps the aggregator to hedge against profit volatility.
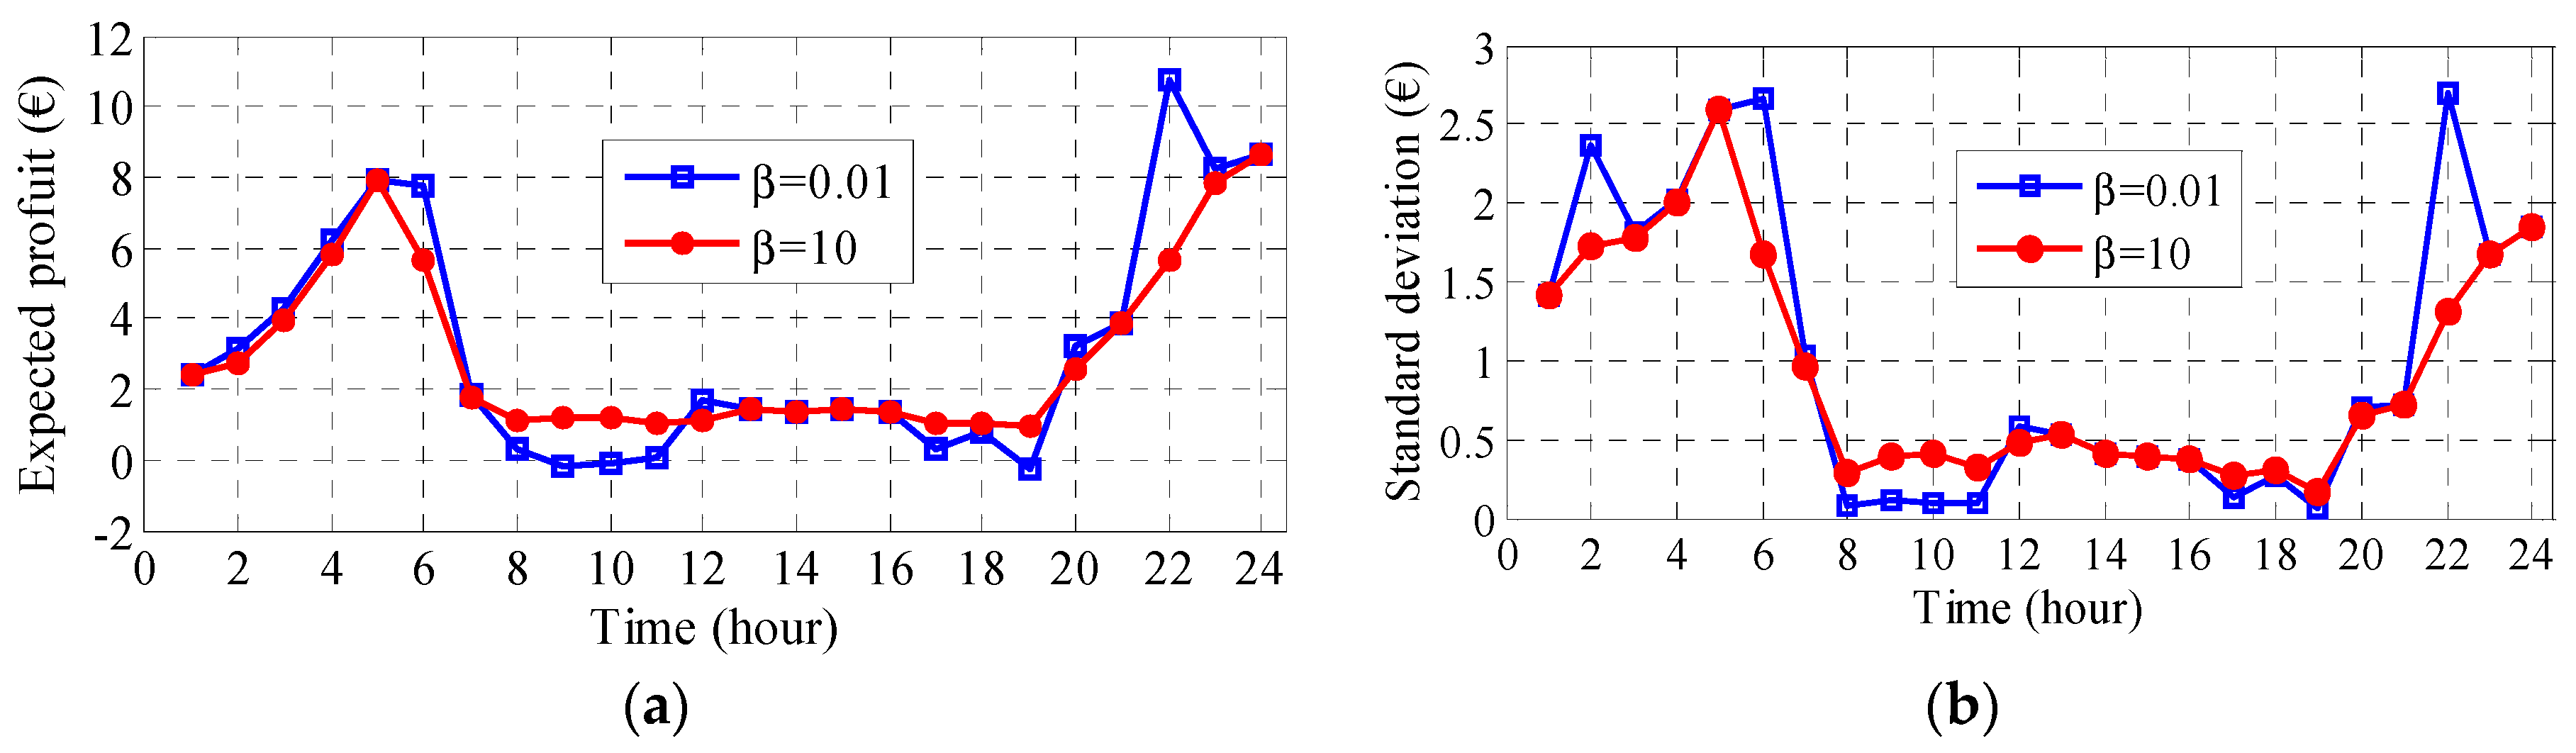
  • With an increasing risk-aversion factor, the average standard deviation of the aggregator’s profit during the whole scheduling horizon decreases, while CVaR increases, which accordingly denotes that the aggregator makes less profits but in a more reliable way; at some hours, however, the opposite might happen.
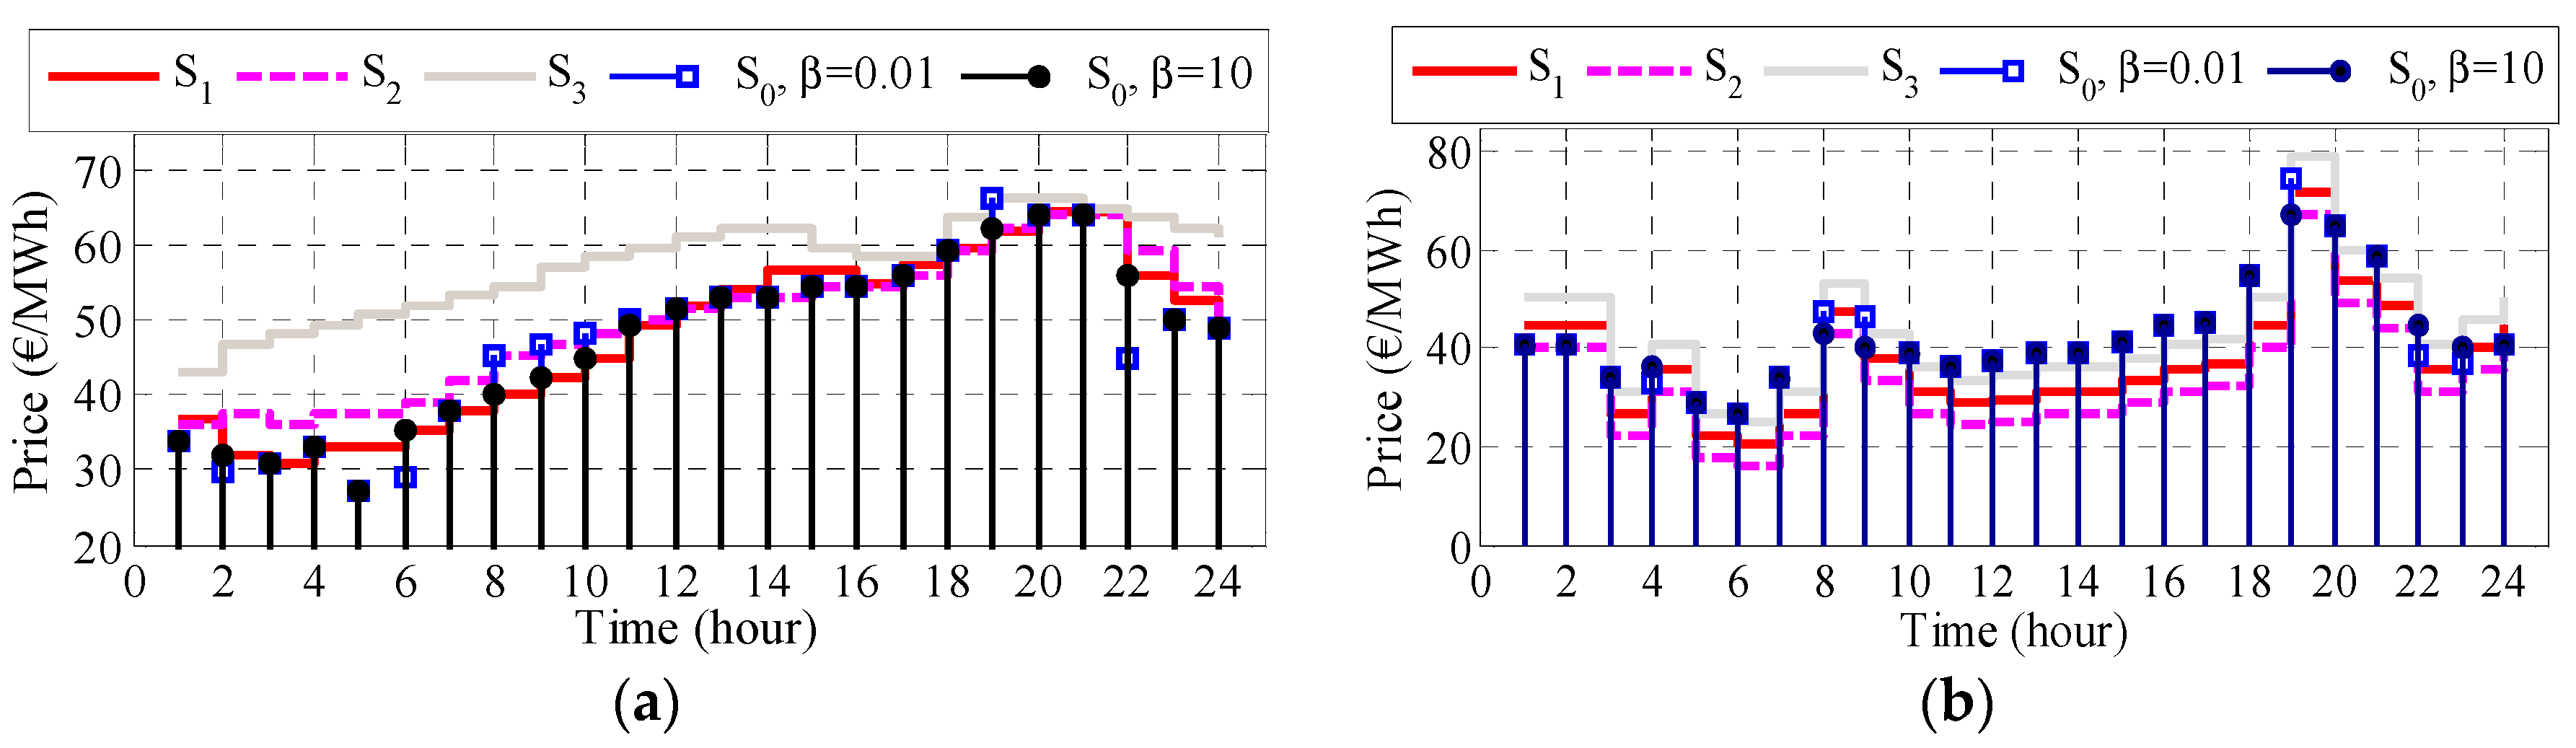
  • When the aggregator is more risk-averse, the retailer changes its bidding strategy to increase charge prices and decrease discharge prices to make more profit. However, this action is normally followed by lower participation in the market, which, in turn, affects the aggregator’s profit negatively. Therefore, in a competitive environment, considering risk exposure can have significant influence on the decision-making of the aggregator.
One remaining aspect to reflect upon is the application of the proposed model in larger competitive test systems with different boundedly rational players, as well as investigating the effects of the proposed decision-making framework on the system’s security and reliability.

Author Contributions

H.R.-K. did the research work, wrote and revised the paper; H.R.N., A.A.-M. and J.M.G. revised the paper, edited language and supervised the research.

Funding

This research received no external funding.

Conflicts of Interest

The authors declare no conflict of interest.

Nomenclature

Sets and indices
( ) t , ω At time t and scenario ω .
( ) t , ξ At time t and scenario ξ .
Pos (neg)Positive (negative) balancing market.
DADA market.
ch (dch)Charge (Discharge) process.
s , s Indices of aggregators.
NSSet of aggregators.
ξ ( Ξ )Scenario index (set) for rival aggregators’ prices.
t (T)Index (set) of time periods.
ω (Ω)Scenario index (set) of market prices and charge/discharge of EVs.
The sign which represents that the production of two vectors is zero.
Variables
u s X ( u s Z ) Auxiliary binary variable used in complementary slackness conditions.
E The amount of energy supplied by the under-study aggregator (MWh).
E p o s , B ( E n e g , B ) Energy exchanged in positive (negative) balancing markets (MWh).
E t , ω D A Energy purchased from DA market (MWh).
W The cost modeling the reluctance of EV owners to transfer between aggregator s and aggregator s’(€).
Re v The revenue of the aggregator under study (€).
X s Percentage of EVs supplied by rival aggregators.
X s 0 Percentage of EVs supplied by the aggregator under study.
Z s , s Percentage of EVs transferred between the aggregators.
ε s ( φ ) Lagrange multipliers.
S O C State of charge of EV.
μ ¯ ¯ t , ω c h / d c h / s
γ ¯ ¯ t , ω c h / d c h
Auxiliary variables to obtain KKT optimality conditions
Parameters
E D Total demand of EVs (MWh).
E t D Total expected demand of EVs (MWh).
X s 0 Initial percentage of EVs supplied by each aggregator.
π ( ω ) Probability of scenario ω .
C p o s , B ( C n e g , B ) Positive (negative) balancing market prices (€/MWh).
C D A Price of DA market (€/MWh).
C ^ t D A Expected DA price (€/MWh).
C s ( C s 0 ) Price signals offered by rival (under study) aggregator (€/MWh).
M 1 , 2 c h / d c h Large constants.
ρ Probability of scenario ξ .
α Confidence level for calculation of CVaR.
β Risk-aversion factor.
ι ( ω ) Auxiliary variable to control CVaR.
Π Parameter indicating the relationship between the EVs demand and DA prices.
η C h ( η D i s ) Coefficient of charge (discharge) efficiency.
S o C ¯ ( S o C ¯ )Minimum (maximum) of SoC.
E C a p Energy capacity of EV (MWh).
P ¯ Limitation of maximum energy traded with the network (MWh).

Appendix A

By using strong duality theorem and KKT conditions, the lower-level objective is obtained as follows [22]:
Re v t , ω c h = E t , ω D c h E t D c h ξ Ξ ρ c h ( ξ ) [ s N S s 0 E ^ t D c h C s , t , ξ c h X s , t , ξ c h s N S s N S s s E ^ t D c h W c h s , s Z c h , t , ξ s , s + s N S X s c h , t , ξ 0 ε s c h , ξ + φ c h , ξ ]
Re v t , ω d c h = E t , ω D d c h E t D d c h ξ Ξ ρ d c h ( ξ ) [ s N S s 0 E ^ t D d c h C s , t , ξ d c h X s , t , ξ d c h s N S s N S s s E ^ t D d c h W d c h s , s Z d c h , t , ξ s , s + s N S X s d c h , t , ξ 0 ε s d c h , ξ + φ d c h , ξ ]
E ^ t D c h C s 0 , t , ω c h ε s c h 0 , ξ φ c h , ξ 0
E ^ t D d c h C s 0 , t , ω d c h ε s d c h 0 , ξ φ d c h , ξ 0
E ^ t D c h C s , t , ξ c h ε s c h , ξ φ c h , ξ 0
E ^ t D d c h C s , t , ξ d c h ε s d c h , ξ φ d c h , ξ 0
E ^ t D c h W c h s , s + ε s c h , ξ ε s c h , ξ 0
E ^ t D d c h W d c h s , s + ε s d c h , ξ ε s d c h , ξ 0
E ^ t D c h C s 0 , t , ω c h ε s c h 0 , ξ φ c h , ξ M 1 c h u 0 , ξ X c h
E ^ t D d c h C s 0 , t , ω d c h ε s d c h 0 , ξ φ d c h , ξ M 1 d c h u 0 , ξ X d c h
E ^ t D c h C s , t , ξ c h ε s c h , ξ φ c h , ξ M 1 c h u s , ξ X c h
E ^ t D d c h C s , t , ξ d c h ε s d c h , ξ φ d c h , ξ M 1 d c h u s , ξ X d c h
X t , ξ c h M 2 c h [ 1 u s , ξ X c h ]
X t , ξ d c h M 2 d c h [ 1 u s , t , ξ X d c h ]
E ^ t D c h W c h s , s + ε s c h , t , ξ ε s c h , t , ξ M 1 c h u s , s , t , ξ Z c h
E ^ t D d c h W d c h s , s + ε s d c h , ξ ε s d c h , ξ M 1 d c h u s , s , ξ Z d c h
Z c h , t , ξ s , s M 2 c h [ 1 u s , s , t , ξ Z c h ]
Z d c h , t , ξ s , s M 2 d c h [ 1 u s , s , ξ Z d c h ]
u s , ξ X c h / d c h { 0 , 1 }
u s , s , ξ Z c h / d c h { 0 , 1 }
For the remainder, only contraction forms of the conditions are provided:
λ t , ω S λ t + 1 , ω S + μ ¯ t , ω s μ ¯ t , ω s γ ¯ t + 1 , ω d c h + γ ¯ t + 1 , ω d c h + γ ¯ t + 1 , ω c h γ ¯ t + 1 , ω c h = 0
0 μ ¯ t , ω c h ( E t , ω c h ) 0
0 μ ¯ t , ω c h ( P ¯ c h E t , ω c h ) 0
0 μ ¯ t , ω d c h ( E t , ω d c h ) 0
0 μ ¯ t , ω d c h ( P ¯ d c h E t , ω d c h ) 0
0 μ ¯ t , ω s ( S o C t , ω S o C ¯ × E C a p ) 0
0 μ ¯ t , ω s ( S o C ¯ × E C a p S o C t , ω ) 0
0 γ ¯ t , ω c h [ η c h × ( E t , ω c h ) × Δ t ] 0
0 γ ¯ t , ω c h [ S o C ¯ × E C a p S o C t 1 , ω η c h × E t , ω c h ] 0
0 γ ¯ t , ω d c h [ 1 η d c h × E t , ω d c h × Δ t ] 0
0 γ ¯ t , ω d c h [ S o C t 1 , ω 1 η d c h × E t , ω d c h × Δ t ] 0
where M 1 c h / d c h and M 2 c h / d c h are chosen to be sufficiently large such that the optimality of the problem would be preserved. μ ¯ t , ω c h / d c h , μ ¯ t , ω c h / d c h , γ ¯ t , ω c h / d c h , γ ¯ t , ω c h / d c h , μ ¯ t , ω s and μ ¯ t , ω s are auxiliary variables to obtain KKT optimality conditions.

References

  1. Porkar, S.; Abbaspour-Tehrani-fard, A.; Poure, P.; Saadate, S. Distribution system planning considering integration of distributed generation and load curtailment options in a competitive electricity market. Electr. Eng. 2010, 93, 23–32. [Google Scholar] [CrossRef]
  2. Vahedipour-Dahraie, M.; Rashidizadeh-Kermani, H.; Najafi, H.R.; Anvari-Moghaddam, A.; Guerrero, J.M. Coordination of EVs Participation for Load Frequency Control in Isolated Microgrids. Appl. Sci. 2017, 7, 539. [Google Scholar] [CrossRef]
  3. Bioki, M.M.H.; Jahromi, M.Z.; Rashidinejad, M. A combinatorial artificial intelligence real-time solution to the unit commitment problem incorporating v2g. Electr. Eng. 2012, 95, 341–355. [Google Scholar] [CrossRef]
  4. Shafie-khah, M.; Heydarian-Forushani, E.; Golshan, M.E.H.; Siano, P.; Moghaddam, M.P.; Sheikh-El-Eslami, M.K.; Catalão, J.P.S. Optimal trading of plug-in electric vehicle aggregation agents in a market environment for sustainability. Appl. Energy 2016, 162, 601–612. [Google Scholar] [CrossRef]
  5. Vahedipour-Dahraie, M.; Najafi, H.R.; Anvari-Moghaddam, A.; Guerrero, J.M. Study of the Effect of Time-Based Rate Demand Response Programs on Stochastic Day-Ahead Energy and Reserve Scheduling in Islanded Residential Microgrids. Appl. Sci. 2017, 7, 378. [Google Scholar] [CrossRef]
  6. Bajpai, P.; Punna, S.K.; Singh, S.N. Swarm intelligence-based strategic bidding in competitive electricity markets. IET Gener. Transm. Distrib. 2008, 2, 175. [Google Scholar] [CrossRef]
  7. Tan, Z.; Yang, P.; Nehorai, A. An optimal and distributed demand response strategy with electric vehicles in the smart grid. IEEE Trans. Smart Grid 2014, 5, 861–869. [Google Scholar] [CrossRef]
  8. Wu, H.; Shahidehpour, M.; Alabdulwahab, A.; Abusorrah, A. A game theoretic approach to risk-based optimal bidding strategies for electric vehicle aggregators in electricity markets with variable wind energy resources. IEEE Trans. Sustain. Energy 2016, 7, 374–385. [Google Scholar] [CrossRef]
  9. Reddy, S.S. Optimizing energy and demand response programs using multi-objective optimization. Electr. Eng. 2016, 99, 397–406. [Google Scholar] [CrossRef]
  10. Xia, M.; Lai, Q.; Zhong, Y.; Li, C.; Chiang, H.D. Aggregator-Based Interactive Charging Management System for Electric Vehicle Charging. Energies 2016, 9, 159. [Google Scholar] [CrossRef]
  11. Vagropoulos, S.I.; Bakirtzis, A.G. Optimal bidding strategy for electric vehicle aggregators in electricity markets. IEEE Trans. Power Syst. 2013, 28, 4031–4041. [Google Scholar] [CrossRef]
  12. Alipour, M.; Mohammadi-Ivatloo, B.; Moradi-Dalvand, M.; Zare, K. Stochastic scheduling of aggregators of plug-in electric vehicles for participation in energy and ancillary service markets. Energy 2017, 118, 1168–1179. [Google Scholar] [CrossRef]
  13. Pantos, M. Exploitation of electric-drive vehicles in electricity markets. IEEE Trans. Power Syst. 2012, 27, 682–694. [Google Scholar] [CrossRef]
  14. Momber, I.; Siddiqui, A.; Roman, T.G.S.; Soder, L. Risk averse scheduling by a pev aggregator under uncertainty. IEEE Trans. Power Syst. 2015, 30, 882–891. [Google Scholar] [CrossRef]
  15. Haghighat, H.; Kennedy, S.W. A Bilevel Approach to Operational Decision Making of a Distribution Company in Competitive Environments. IEEE Trans. Power Syst. 2012, 27, 1797–1807. [Google Scholar] [CrossRef]
  16. Rashedi, N.; Tajeddini, M.A.; Kebriaei, H. Markov game approach for multi-agent competitive bidding strategies in electricity market. IET Gener. Transm. Distrib. 2016, 10, 3756–3763. [Google Scholar] [CrossRef]
  17. Aghajani, S.; Kalantar, M. A cooperative game theoretic analysis of electric vehicles parking lot in smart grid. Energy 2017, 137, 129–139. [Google Scholar] [CrossRef]
  18. Motalleb, M.; Ghorbani, R. Non-cooperative game-theoretic model of demand response aggregator competition for selling stored energy in storage devices. Appl. Energy 2017, 202, 581–596. [Google Scholar] [CrossRef]
  19. Neyestani, N.; Yazdani Damavandi, M.; Shafie-khah, M.; Catalã, J.P.S. Plug-In Electric Vehicles Parking Lot Equilibria with Energy and Reserve Markets. IEEE Trans. Power Syst. 2017, 32, 2001–2016. [Google Scholar] [CrossRef]
  20. Momber, I.; Wogrin, S.; Gomez San Roman, T. Retail pricing: A bilevel program for pev aggregator decisions using indirect load control. IEEE Trans. Power Syst. 2016, 31, 464–473. [Google Scholar] [CrossRef]
  21. Vayá, M.G.; Andersson, G. Optimal Bidding Strategy of a Plug-In Electric Vehicle Aggregator in Day-Ahead Electricity Markets Under Uncertainty. IEEE Trans. Power Syst. 2015, 30, 2375–2385. [Google Scholar] [CrossRef]
  22. Rashidizadeh-Kermani, H.; Vahedipour-Dahraie, M.; Najafi, H.R.; Anvari-Moghaddam, A.; Guerrero, J.M. A Stochastic Bi-level Scheduling Approach for Participation of EV Aggregators in Competitive Electricity Markets. Appl. Sci. 2017, 7, 1100. [Google Scholar] [CrossRef]
  23. Box, G.E.P.; Jenkins, G.M.; Reinsel, G.C. Time Series Analysis: Forecasting and Control, 4th ed.; John Wiley & Sons: Hoboken, NJ, USA, 2008; pp. 305–325. ISBN 978-1-118-67502-1. [Google Scholar]
  24. Vahedipour-Dahraie, M.; Rashidizadeh-Kermani, H.; Najafi, H.R.; Anvari-Moghaddam, A.; Guerrero, J.M. Stochastic Security and Risk-Constrained Scheduling for an Autonomous Microgrid with Demand Response and Renewable Energy Resources. IET Renew. Power Gener. 2017, 11, 1812–1821. [Google Scholar] [CrossRef]
  25. Carrión, M.; Arroyo, J.M.; Conejo, A.J. A bilevel stochastic programming approach for retailer futures market trading. IEEE Trans. Power Syst. 2009, 24, 1446–1456. [Google Scholar] [CrossRef]
  26. Relevant Information on the Market Pertaining to Nordpool. 2016. Available online: http://www.nordpool.com (accessed on 5 September 2016).
  27. Conejo, A.J.; Carrión, M.; Morales, J.M. Decision Making Under Uncertainty in Electricity Markets, 1st ed.; Springer: New York, NY, USA, 2010; pp. 80–84. ISBN 978-1-4419-7421-1. [Google Scholar]
  28. Rashidizadeh-Kermani, H.; Vahedipour-Dahraie, M.; Shafie-khah, M.; Catalão, J.P.S. A bi-level risk-constrained offering strategy of a wind power producer considering demand side resources. Int. J. Electr. Power Energy Syst. 2019, 104, 562–574. [Google Scholar] [CrossRef]
  29. The General Algebraic Modeling System (GAMS) Software. 2018. Available online: http://www.gams.com (accessed on 7 February 2018).
Figure 1. Bi-level structure of the proposed decision making for the electric vehicle (EV) aggregator in a competitive environment.
Energies 11 02413 g001
Figure 2. Flowchart of the solution methodology.
Energies 11 02413 g002
Figure 3. Scenarios of (a) day-ahead prices; (b) positive balancing prices; (c) negative balancing prices; (d) EV demand.
Energies 11 02413 g003
Figure 4. Expected profit versus (a) CVaR; (b) average of standard deviation of the profit for different values of β.
Energies 11 02413 g004
Figure 5. The expected energy procurement from (a) day-ahead; (b) positive; (c) negative balancing markets for two risk-aversion factors, β = 0.01 and 10.
Energies 11 02413 g005
Figure 6. The price signal offered by aggregators (a) in charge process; (b) in discharge process.
Energies 11 02413 g006
Figure 7. Share of aggregator under study supply to EVs in (a) charge process; (b) discharge process for β = 0.01 and β = 10.
Energies 11 02413 g007
Figure 8. (a) The expected profit; (b) standard deviation of profits during scheduling horizon.
Energies 11 02413 g008
Figure 9. (a) The probability of profit scenarios at 19:00; (b) the cumulative probability function at 19:00; (c) the probability of profit scenarios at 22:00; (d) the cumulative probability function at 22:00.
Energies 11 02413 g009
Table 1. Expected energy exchanged (MWh) for different values of β.
β E ^ D A E ^ P o s E ^ N e g
0.013.7860.5292.153
0.13.7850.5292.152
13.7470.5302.118
23.7320.5352.108
33.4660.6152.007
53.220.7161.897
63.200.7211.882
103.1990.7221.880
Table 2. Expected energy exchanged (MWh) for different values of β adopted from [14].
β E ^ D A E ^ P o s E ^ N e g
0.012.6551.2760.653
0.082.5751.3390.636
0.131.7732.0310.525
0.311.6042.1660.492
0.471.3102.3610.393
3.891.1812.4570.360
Table 3. Share of all aggregators in different βs in this paper.
AggregatorS0S1S2S3S0S1S2S3
Charge ProcessDischarge Process
β = 0433215103322738
β = 138371693223639
β = 1033441583024640

