Demand Bidding Optimization for an Aggregator with a Genetic Algorithm
by
 , , and
Leehter Yao
1,* ,
,
Wei Hong Lim
2, 
Sew Sun Tiang
2 ,
,
Teng Hwang Tan
2,
Chin Hong Wong
3 and
Jia Yew Pang
4 1
Department of Electrical Engineering, National Taipei University of Technology, Taipei 10608, Taiwan
2
Faculty of Engineering, Technology and Built Environment, UCSI University, Kuala Lumpur 56000, Malaysia
3
Department of Engineering and Information Technology, UCSI College, Kuala Lumpur 56000, Malaysia
4
School of Engineering and Physical Sciences, Heriot Watt University, Putrajaya 62200, Malaysia
*
Author to whom correspondence should be addressed.
Energies 2018, 11(10), 2498; https://0-doi-org.brum.beds.ac.uk/10.3390/en11102498
Submission received: 8 August 2018
/
Revised: 11 September 2018
/
Accepted: 18 September 2018
/
Published: 20 September 2018
(This article belongs to the Special Issue Optimization Methods Applied to Power Systems)
Abstract
:Demand response (DR) is an effective solution used to maintain the reliability of power systems. Although numerous demand bidding models were designed to balance the demand and supply of electricity, these works focused on optimizing the DR supply curve of aggregator and the associated clearing prices. Limited researches were done to investigate the interaction between each aggregator and its customers to ensure the delivery of promised load curtailments. In this paper, a closed demand bidding model is envisioned to bridge the aforementioned gap by facilitating the internal DR trading between the aggregator and its large contract customers. The customers can submit their own bid as a pairs of bidding price and quantity of load curtailment in hourly basis when demand bidding is needed. A purchase optimization scheme is then designed to minimize the total bidding purchase cost. Given the presence of various load curtailment constraints, the demand bidding model considered is highly nonlinear. A modified genetic algorithm incorporated with efficient encoding scheme and adaptive bid declination strategy is therefore proposed to solve this problem effectively. Extensive simulation shows that the proposed purchase optimization scheme can minimize the total cost of demand bidding and it is computationally feasible for real applications.
1. Introduction
The electricity market is evolving towards an open-access environment by restructuring the vertically integrated utilities into multiple independent market players including: generator, transmission system operator (TSO), distributor, retailer and aggregator. Under the restructured market, economics and profitability become the main concerns of all market players. Proper implementation of deregulation policy in electricity industry can enhance energy efficiency by incorporating competition between generation and retailing. In addition, the operating costs of electricity customers can be reduced by having more options in purchasing energy [1].
Despite the benefits offered by the deregulated electricity market, some challenges that tend to degrade the reliability of power supply have been encountered by different market players. For instance, network security risk is the main concern for both TSO and distributor because these market players need to prevent the violation of safe operating parameters in the transmission and distribution networks during the contingencies. Retailers and load service entity (LSE) are vulnerable to financial risk because they need to buy electricity from the wholesale market with volatile prices and then resell it to their customers with fixed tariff [2,3,4,5,6]. The sudden increase of peak load or unexpected declination of generation reserve can produce extreme price spikes and incur high energy cost to the retailer and LSE, at some point might lead to the bankruptcy issue [7].
Given the flexibility of customers in consuming electricity, demand response (DR) is recently deployed as a low cost and yet environmentally friendly solution to tackle the abovementioned issues. In general, two types of DR are available in the electricity market. This includes the incentive-based DR and price-based DR that encourage the customers to curtail or delay the usage of electricity by referring to the incentive and market price, respectively [8]. Successful implementation of DR is expected to benefit individual market player and ultimately the entire electricity market [9,10,11,12]. For instance, both of TSO and distributor can benefit from DR by using it to relieve the network congestion and enhance the quality of power supply at transmission and distribution levels, respectively. DR can also help the retailer and LSE to cover financial risk caused by spot price volatility by rewarding their customer to curtail energy consumption at the time periods with extreme price spikes. In [13,14,15], the equivalency between DR at demand side and energy supply at supply side was established and the importance of DR resource to be compensated equally as electricity market price was emphasized.
Considerable efforts were devoted to develop various demand bidding optimization strategies from the perspectives of various deregulated electricity market players by leveraging the flexibility of electricity customers in contributing their DR resources. A distributed DR bidding algorithm was designed in [16] to submit the limit order bids of electrical vehicle (EV) fleet to a day-ahead market in order to minimize the peak demand profiles without affecting the commuting performance of EVs. A multistage stochastic optimization framework was proposed in [17] to help LSE to reduce the energy procurement costs by coordinating the demand bids of flexible loads. A Monte Carlo method was used in [18] to coordinate the coalition of energy consumers that are sensitive to DR programs by optimizing the purchase bidding offers in day-ahead market. The presence of price-sensitive demand was proven to reduce the volatility of electricity prices in peak hours. In [19], an optimal bidding strategy was formulated from the perspective of electricity retailer to minimize the energy procurement costs from different sources by considering the boundary limits of pool prices in electricity market. Procurement strategy obtained using mixed-integer linear programming (MILP) revealed that it is more cost effective for a retailer to procure electricity from the sources with lower price uncertainties. A DR-integrated network-constrained unit commitment model was used in [20] to analyze the impacts of price-based DR on market clearing and location marginal prices (LMP) of power system. It was found that the higher DR participation rate can lead to better payment for DR loads. An optimal bidding strategy of a microgrid in day-ahead market was formulated in [21] using MILP, aiming to minimize its operating cost by considering the uncertainties of renewable sources, storage systems and price-sensitive demands. In [22], both of residential DR and network on-load tap charger were integrated to solve the unbalanced issue in low voltage distribution network with minimum cost without violating the comfort level of users. The over-generation issue of renewable source was mitigated in [23] by designing the reward and penalty functions for DR programs.
While the abovementioned studies modelled DR as a price responsive load, some recent works envisioned DR as a commodity to be traded in energy market. In [24], a market clearing strategy in day-ahead market was solved by MILP to minimize the variability of wind power via the optimal load reduction dispatched by DR resources. A comprehensive framework consisting of four DR bidding strategies was solved in [25] using MILP to decide the optimal DR contribution of aggregator in wholesale market. A demand response exchange (DRX) market that considered DR as a tradable resource between buyers (e.g., TSO, distributor and retailer) and sellers (retailer and aggregator) was proposed in [26]. Under this DRX framework, an aggregator can represent its customers to bargain with the retailers for buying electricity with lower prices. Furthermore, the aggregator can combine the flexible DR loads from its customers so that it can negotiate for more profitable DR selling prices with TSO and distributor. A clearing strategy for pool-based electricity market was developed in [27] using microeconomic theory from the viewpoint of DRX operator, aiming to maximize the overall benefits of DR for all market players. A decentralization concept was adopted by the market clearing strategy proposed in [28]. It was assumed that the market operator can broadcast the price signal to each self-interested market player so that the latter can adjust the DR iteratively through Walrasian auction. A hierarchical market model was proposed in [29] to implement the residential DR mechanism by connecting the upper level of utility operator and lower level of electricity customers through a group of aggregators. All involved entities were considered self-interested because the aggregator aimed for profit maximization while both of utility operator and customers emphasized on cost minimization. Blockchain technology was envisioned in [30] to formulate a peer-to-peer decentralized energy trading mechanism without the presence of any intermediary agent in order to reduce the transaction cost of DR programs. In [31], an optimal purchase strategy was formulated using MILP to facilitate the demand bidding between aggregator and electricity customers, aiming to minimize the total purchase cost required to deliver the promised load curtailment. Extensive efforts were needed in [31] to transform the nonlinear load curtailment constraints into the linear form before the demand bidding optimization problem can be solved using MILP. A decentralized DR framework was developed in [32] from the perspective of an independent system operator (ISO), aiming to minimize the suppliers’ generation cost and the customers’ discomfort cost simultaneously without violating the confidentiality. The control signals broadcasted by ISO were used to incentivize both supplier and customers to modify their respective generation and demand profiles, hence optimizing their objectives independently.
Given the restriction of minimum power rating imposed in electricity markets [33], small-scale electricity customers are not eligible to directly participate in DR trading. They are unable to produce any noticeable impacts in electricity market and obtain the promising clearing prices. One of the solutions is to allow an aggregator to combine the overall potential of load curtailment offered by all small-scale electricity customers under its service regions and submit an aggregated DR supply curve on behalf of them to market operator. The DR bidding curve submitted by an aggregator for trading in each time slot is represented as a pair of quantity-price bid to indicate the quantity of load curtailment to be offered and the associated selling price. If the DR biddings offered by an aggregator are chosen during the market clearing process, it needs to deliver the promised load curtailments during the demand bidding event which might be scheduled in day, month or year ahead. Although numerous market clearing strategies were proposed in [16,17,18,19,20,21,22,23,24,25,26,27,28,29,30,31,32] to address the demand bidding optimization problems, majority of these studies emphasized at the upper level that involves interaction between the aggregators and different entities of electricity market (e.g., TSO, distributor and retailer) in order to determine the optimal combination of quantity and clearing price of load curtailment. Despite of its importance in practical scenario, limited researches were done at the lower level to investigate the interaction between an aggregator and all customers under its service regions to ensure the delivery of all promised load curtailment bids for market operation.
In this paper, a new insight is proposed to bridge the aforementioned gap by designing a closed bidding process that enables an aggregator to procure load curtailments from all customers under its service regions. Once the market clearing results are announced, the aggregator needs to broadcast a target profile that indicates the total load curtailment to be achieved in each bidding slot and the maximum bidding price per unit of load curtailment to all of its customers. Based on the given information, interested customers can participate in the bidding process by submitting their load curtailment bids and the selling price in each bidding slot to the aggregator. A purchase optimization scheme is then developed from a modified genetic algorithm (MGA) to ensure the mutual interests of both aggregators and its customers are preserved throughout the demand bidding event. From the perspective of an aggregator, the proposed purchase strategy is crucial in searching for the optimal combination of load curtailment bids that can minimize the total bidding cost while satisfying the target load curtailment profiles. For customers, they can perform load curtailment at their preferred time with minimum disruption of comfort levels and be rewarded based on their expected prices. Nevertheless, it is nontrivial to determine the best combination of load curtailment bids given that each customer has a unique load shedding pattern. The inclusion of customers with different load curtailment patterns leads to the formulation of a nonlinear demand bidding optimization problem that requires high computational overhead to solve. A numbers of modifications have been incorporated into MGA to enhance its search efficiency during the demand bidding optimization process.
In general, the technical novelty and contribution of this paper can be presented as follows:
- A closed demand bidding model is adopted between an aggregator and all customers under its service regions to facilitate the internal trading of load curtailment at lower level so that the aggregator is able to deliver the promised load curtailment for market operation. To the best of authors’ knowledge, the proposed work is different with the majority of works in [16,17,18,19,20,21,22,23,24,25,26,27,28,29,30,31,32] because the latter focused on upper level that involves the demand bidding between different entities in electricity market (e.g., TSO, distributor and retailer) with aggregators.
- A purchase optimization scheme is designed for aggregator to determine the best combination of aggregated load curtailment bids and optimal purchase price, aiming to minimize the total bidding cost while satisfying all load curtailment constraints. Given the unique load shedding patterns of different customers, the demand bidding model formulated is highly nonlinear and difficult to solve. A modified genetic algorithm (MGA) incorporated with a delicate gene encoding scheme and an adaptive search mechanism is designed to solve the nonlinear demand bidding optimization efficiently without having to transform the objective function or constraints into linear forms such as those reported in [19,21,25,31].
- Simulation results show that the optimal purchase price per unit load curtailment obtained by the proposed method in every bidding slot is different and at least 20% lower than the average bidding price offered by the customers, implying its excellent cost minimization capability. The proposed MGA is also efficient and suitable for practical applications because it incurs low computational times in solving the demand bidding optimization problem.
The remaining parts of this paper are presented in the following sequences. The mathematical formulation of closed demand bidding is explained in Section 2. Section 3 describes the purchase optimization scheme developed using MGA for demand bidding. The detailed descriptions of MGA including its gene encoding scheme and adaptive search mechanism are also provided. Section 4 presents the computer simulation results and the conclusions are drawn in Section 5.
2. Problem Formulation
After the market clearing process has determined the DR capacity to be sold for market operation, a demand trading between customers with large contract capacity and aggregator is conducted in order to fulfill the target load curtailment profile generated. The examples of customers with large contract capacity are the electricity users from commercial and industrial sectors and the load service entities with contract capacity higher than 0.5 MW. All customers that are willing to contribute their DR capacity in the upcoming demand bidding event are encouraged to register with the aggregator so that it can find the best load shedding patterns for customers. Assume that a total of N customers have registered to participate in a demand bidding event and the characteristics of load shedding are unique for all of the N participants. For example, the load of air conditioning systems are the main load for commercial customers, while the main load of industrial customers could be contributed from manufacturing process. Aggregator can suggest the suitable load shedding patterns for every n-th customer after reviewing their track records and load characteristics. The information contained in these recommended load shedding patterns include the most suitable maximum load shedding capacity and the least load shedding period , n = 1,...,N.
Assume that the proposed demand bidding model focuses on day-ahead operation. An online platform is established to facilitate the broadcasting of upcoming demand bidding event from the aggregator and the submission of bidding from customers through the Internet. The information provided by the aggregator in its bidding request include: (a) the beginning and completion times of the next demand bidding event represented by ts and te, respectively; (b) the maximum purchase price per kWh of load curtailment represented by ; and (c) the deadline for customers to respond their participation in next demand bidding event represented by td. For the sake of convenience in indexing, the beginning and completion times of demand bidding are designated in hours. Similarly, the time periods of each customer to submit their load curtailment bid are also expressed in hours. Consider M as the number of time slots available for demand bidding, therefore .
If the customers do not reply by the deadline td, the aggregator assumes that they are not interested to contribute in next demand bidding event. Each of the n-th customer that is interested to contribute for current demand bidding needs to reply to the online platform by submitting the bids containing the information of: (a) the start and end times suitable for load shedding in the upcoming demand bidding represented by and , respectively; (b) the quantity of load shedding offered at each m-th time slot, m = 1…M ; and (c) the selling price per kWh of load shedding at each m-th time slot. Notably, the bidding interval submitted by each n-th customer, denoted as , is within the interval allowed for demand biding as stipulated by aggregator, i.e.,
Define as the maximum purchase price broadcasted by aggregator to all customers. The purchase price bid by every n-th customer in each m-th time slot of demand bidding cannot exceed the threshold , i.e.,
For the convenience of notation, let and be the integer indices transformed from customer’s submitted start time and end time allowed for load curtailment, respectively, where and . It is not compulsory for customers to submit their bids in all time slots because and can be set as null values at the time slots where no demand bids are offered by the customers, i.e.,
Furthermore, the amount of load curtailment offered by each n-th customer on the online platform at any m-th bidding slot is constrained by the predefined maximum load shedding capacity , i.e.,
After receiving the load demand bids from all interested customers, the aggregator needs to decide an optimal combinations of bids at every m-th time slot in order to satisfy the target load shedding profile at the m-th time slot with minimum total purchase cost. Although the proposed purchase optimization strategy is formulated from the viewpoint of an aggregator, the best interest of customers are secured by considering their offers in terms of capacity and selling price per kWh of load curtailment at all bidding slots.
Let be the purchase status of the bid offered by the n-th customer at the m-th time slot, where hnm = 1 shows that the offered bid is purchased by the aggregator, while hnm = 0 implies that the bid is rejected. Denote as the load reduction offered by the n-th customer at the m-th time slot, while as the selling price per kWh of load reduction offered. In this paper, a purchase optimization strategy is to be developed to find the best combination of purchase status , n = 1…N, m = 1…M, so that the total bidding cost can be minimized. Define the overall optimal purchase status as a set , then
Please note that
It is noteworthy that the amount of demand purchased from the customer and the price paid to the customer needs to be same as the bid offered by the customer, i.e.,
The number of time slots for the n-th customer to perform load shedding continuously are restricted by the minimum load curtailment periods denoted as . The value of is determined by aggregator based on the load characteristic of each n-th customer. Therefore,
Given that the load shedding for the customer with capacity greater than 5000 kW usually requires certain period of process, it takes time and effort to reduce the load to a large enough value. Aggregator usually promises to customer that the load shed request only conducts once in every demand bidding event. Therefore, the optimization in (5) is also constrained by the condition that the duration of load shed cannot be separated. Define as an operator that returns true if the operand is 1 and false if the operand is 0, while is an operator that returns 1 if the operand is true and 0 if the operand is false. Then, the constraint specifies that load curtailment can only be conducted once for every customer is formulated as shown below:
where ⊕ denotes the Boolean operator exclusive OR.
The optimization of objective function defined in (5) bounded by the constraint functions of (6)–(9) is a non-convex binary optimization problem. A purchase optimization scheme based on modified genetic algorithm will be proposed in the next section to find an optimal bidding purchase solution that can minimize the total biding cost without violating all load curtailment constraints.
3. Proposed Purchase Optimization Scheme
The binary optimization problem to be solved in (5) involves with N customers submitting their bids in M time slots. A total of solutions are to be searched if binary search approach is to be used in the optimization. Apparently, binary search is unrealistic because the number of customers N tends to be a large value. Since the demand bidding optimization considered in this paper does not need to be an on-line calculation, a modified genetic algorithm (MGA) is designed as the purchase optimization scheme to solve the demand bidding optimization problem with better efficiency.
3.1. Chromosome Design
The combination of binary purchase status hnm in every m-th time slot for every n-th customer is an intuitive choice of forming a gene. All N genes could be cascaded as a chromosome with N × M binary values. Nevertheless, this simple and intuitive chromosome design not only suffers from the computational inefficiency due to its excessive length, but it also cannot guarantee to satisfy the constraints in both (9) and (10). For this reason, a unique encoding scheme for chromosome design is proposed in this paper. To include all possible bid purchase status for all participated customers, a table of all possible combinations of 0, 1, 2, …, M connected time slots are shown in Table 1 where ts and te are assumed to be 13:00 and 17:00, respectively, for illustration. Denote L as the total number of combinations among M time slots, then
Every possible combination in Table 1 is represented by an index denoted as where .
For every pair of submitted start time and end time allowed for load shedding from the n-th customer, there are time slots for potential load curtailment. Among those time slots, let be a set containing the indices of all possible combinations 0, 1, 2, …, connected time slots within the interval between and . Then, there are Ln possible combinations, where
Denote Tra(u) as an operator that transforms the interval u into a set containing indices of time slots in the look-up table such as the one in Table 1. Therefore, Tra([1, M]) = and Tra([,]) = , where . For instance, if and are set to be 14:00 and 16:00, respectively, there are in total of 7 possible combinations among L combinations in Table 1 with color blocks located within the interval [,]. Table 1 shows that . Similarly, if and are set to be 16:00 and 17:00, respectively, there are totally 4 possible combinations among L combinations in Table 1 with color blocks located within the interval [,]. Table 1 shows that . As soon as every n-th customer makes his or her bid, the set is generated and stored in the database in aggregator’s main computer. To find the best combination of subintervals within every n-th customer’s submitted interval allowed for curtailment, the chromosome is designed to be a string of genes , n = 1…N. If the j-th chromosome in the k-th generation is denoted as , then
where , n = 1…N.
Without loss of generality, the index j numbering the chromosome in a gene pool and the index k numbering the generation are omitted if it is appropriate for the convenience of notations. The purchase status represented by is obtained by referring to the look-up table such as in Table 1. Let Dec() be an operator to decode the gene into a set containing purchase status of the n-th customer. For instance, if in , then whereas if = 9 in , then based on the look-up table in Table 1.
3.2. Fitness Function
Referring to (5)–(7), the proposed MGA is used to find the optimal bid purchase strategy so that the cost due to bid purchasing can be minimized while fulfulling the target load curtailment committed at every m-th time slot. Let F be the fitness function of MGA and be a penalty factor, F is then defined as:
where
The fitness function F is to be minimized by MGA. The penalty factor is designed to penalize the associated fitness value if the constraint for target load curtailment in every time slot is not fulfilled. However, the first term in (14) is the cost needs to be paid by the aggregator for demand bidding while the second term is the load difference. A guideline for tuning the penalty factor is thus needed.
Let be the average price offered by all participated customers, i.e.,
The first term in (14),
Referring to (15), if , assume
where is a constant to be adjusted and . The penalty factor is designed to make both of the first and second terms in (14) roughly have the same weighting despite that both terms have different characteristics. Substituting (15), (17) and (18) into (14), yields
Therefore,
The penalty factor can thus be adjusted according to (20).
3.3. Crossover, Regenaration and Mutation
From (13), every gene in the j-th chromosome of the k-th generation represents the submitted interval for curtailment from the n-th customer. It is suitable for applying chromosome crossover operation gene to gene so that every gene has a chance being replaced with a new value as the chromosome evolves. However, the new value obtained by crossover also needs to be an element of . All chromosomes are rearranged in the gene pool by sorting corresponding fitness values from small to large. A percentage q of all sorted chromosomes is taken as the parent chromosomes for crossover to generate child chromosomes in the next generation. A pair of chromosomes is randomly selected from the gene pool of parent chromosomes. Assume that both -th and -th chromosomes in the k-th generation are selected as parent chromosomes for crossover, i.e., the crossover is applied to the genes and .
To make sure that the crossover result is still contained in , the sequence number of and in are used in crossover. Denote the as an operator to return the sequence number in based on the operand . For instance, if = 7 in , then = 5. Let Round(x) be an operator rounding the number x ∊ R and returns the result as an integer, i.e., Round(x) ∊ I. The n-th gene of the child chromosomes in the next (k + 1)-th generation are regenerated by applying crossover to the same n-th gene of both parent chromosomes in the current k-th generation as follows.
where is a random number with uniform distribution and n = 1…N. Although the crossover result is the sequence number , the gene associated with this sequence number is actually the one to be achieved.
Referring to Table 1, there is always an element listed in Ln elements of corresponding to the situation that this n-th customer is not selected for curtailment. This is especially true when the total amount of demand reduction promised by all customers is much more than the target load curtailment to be achieved. However, it is difficult to have the crossover result of that leads to with the crossover operation defined as in (21)–(22). Define the use rate α as the ratio of the target load curtailment through the period of demand bidding event to the total amount demand reduction promised by all participated customers, i.e.,
Therefore, the probability of directly assigning can be designed as proportional to the use rate α. The smaller α is, the more demands are available to choose in order to fulfill the target load curtailment. Let ν be the probability assigning , while and be the maximum and minimum probability values corresponding to the minimum and maximum use rates of and , respectively. Then,
Therefore, the crossover is defined as the operation generating with probability ν and generating both and as defined in (21) and (22), respectively, with probability (1 − ν), n = 1…N.
Mutation is a scheme randomly perturbing crossover result. It is conducted on the crossover result for every gene with probability . Denote as the size of . Mutation adds a random number to the crossover result . However, it is possible that the addition result is greater than . A cycling operation is designed as follows to update in order to resolve this difficulty.
3.4. Extinction and Immigration Mechanisms
One of the common drawbacks frequently encountered by the GA is the loss of population diversity during the search process. It is especially true when the probability of directly assigning is high due to low use rate . As the chromosomes in gene pool tend to be homogeneous, a premature convergence occurs. An extinction and immigration approach is introduced in MGA by reinitializing the gene pool except leaving the best chromosome. The gene pool is then replaced by randomly generated chromosomes.
The extinction and immigration mechanism is applied in MGA when the convergence of fitness value stagnates. Let and be the minimum and maximum fitness value in the k-th generation. The extinction and immigration mechanism is applied if ( − ) for continuous generations.
3.5. Overall Framework
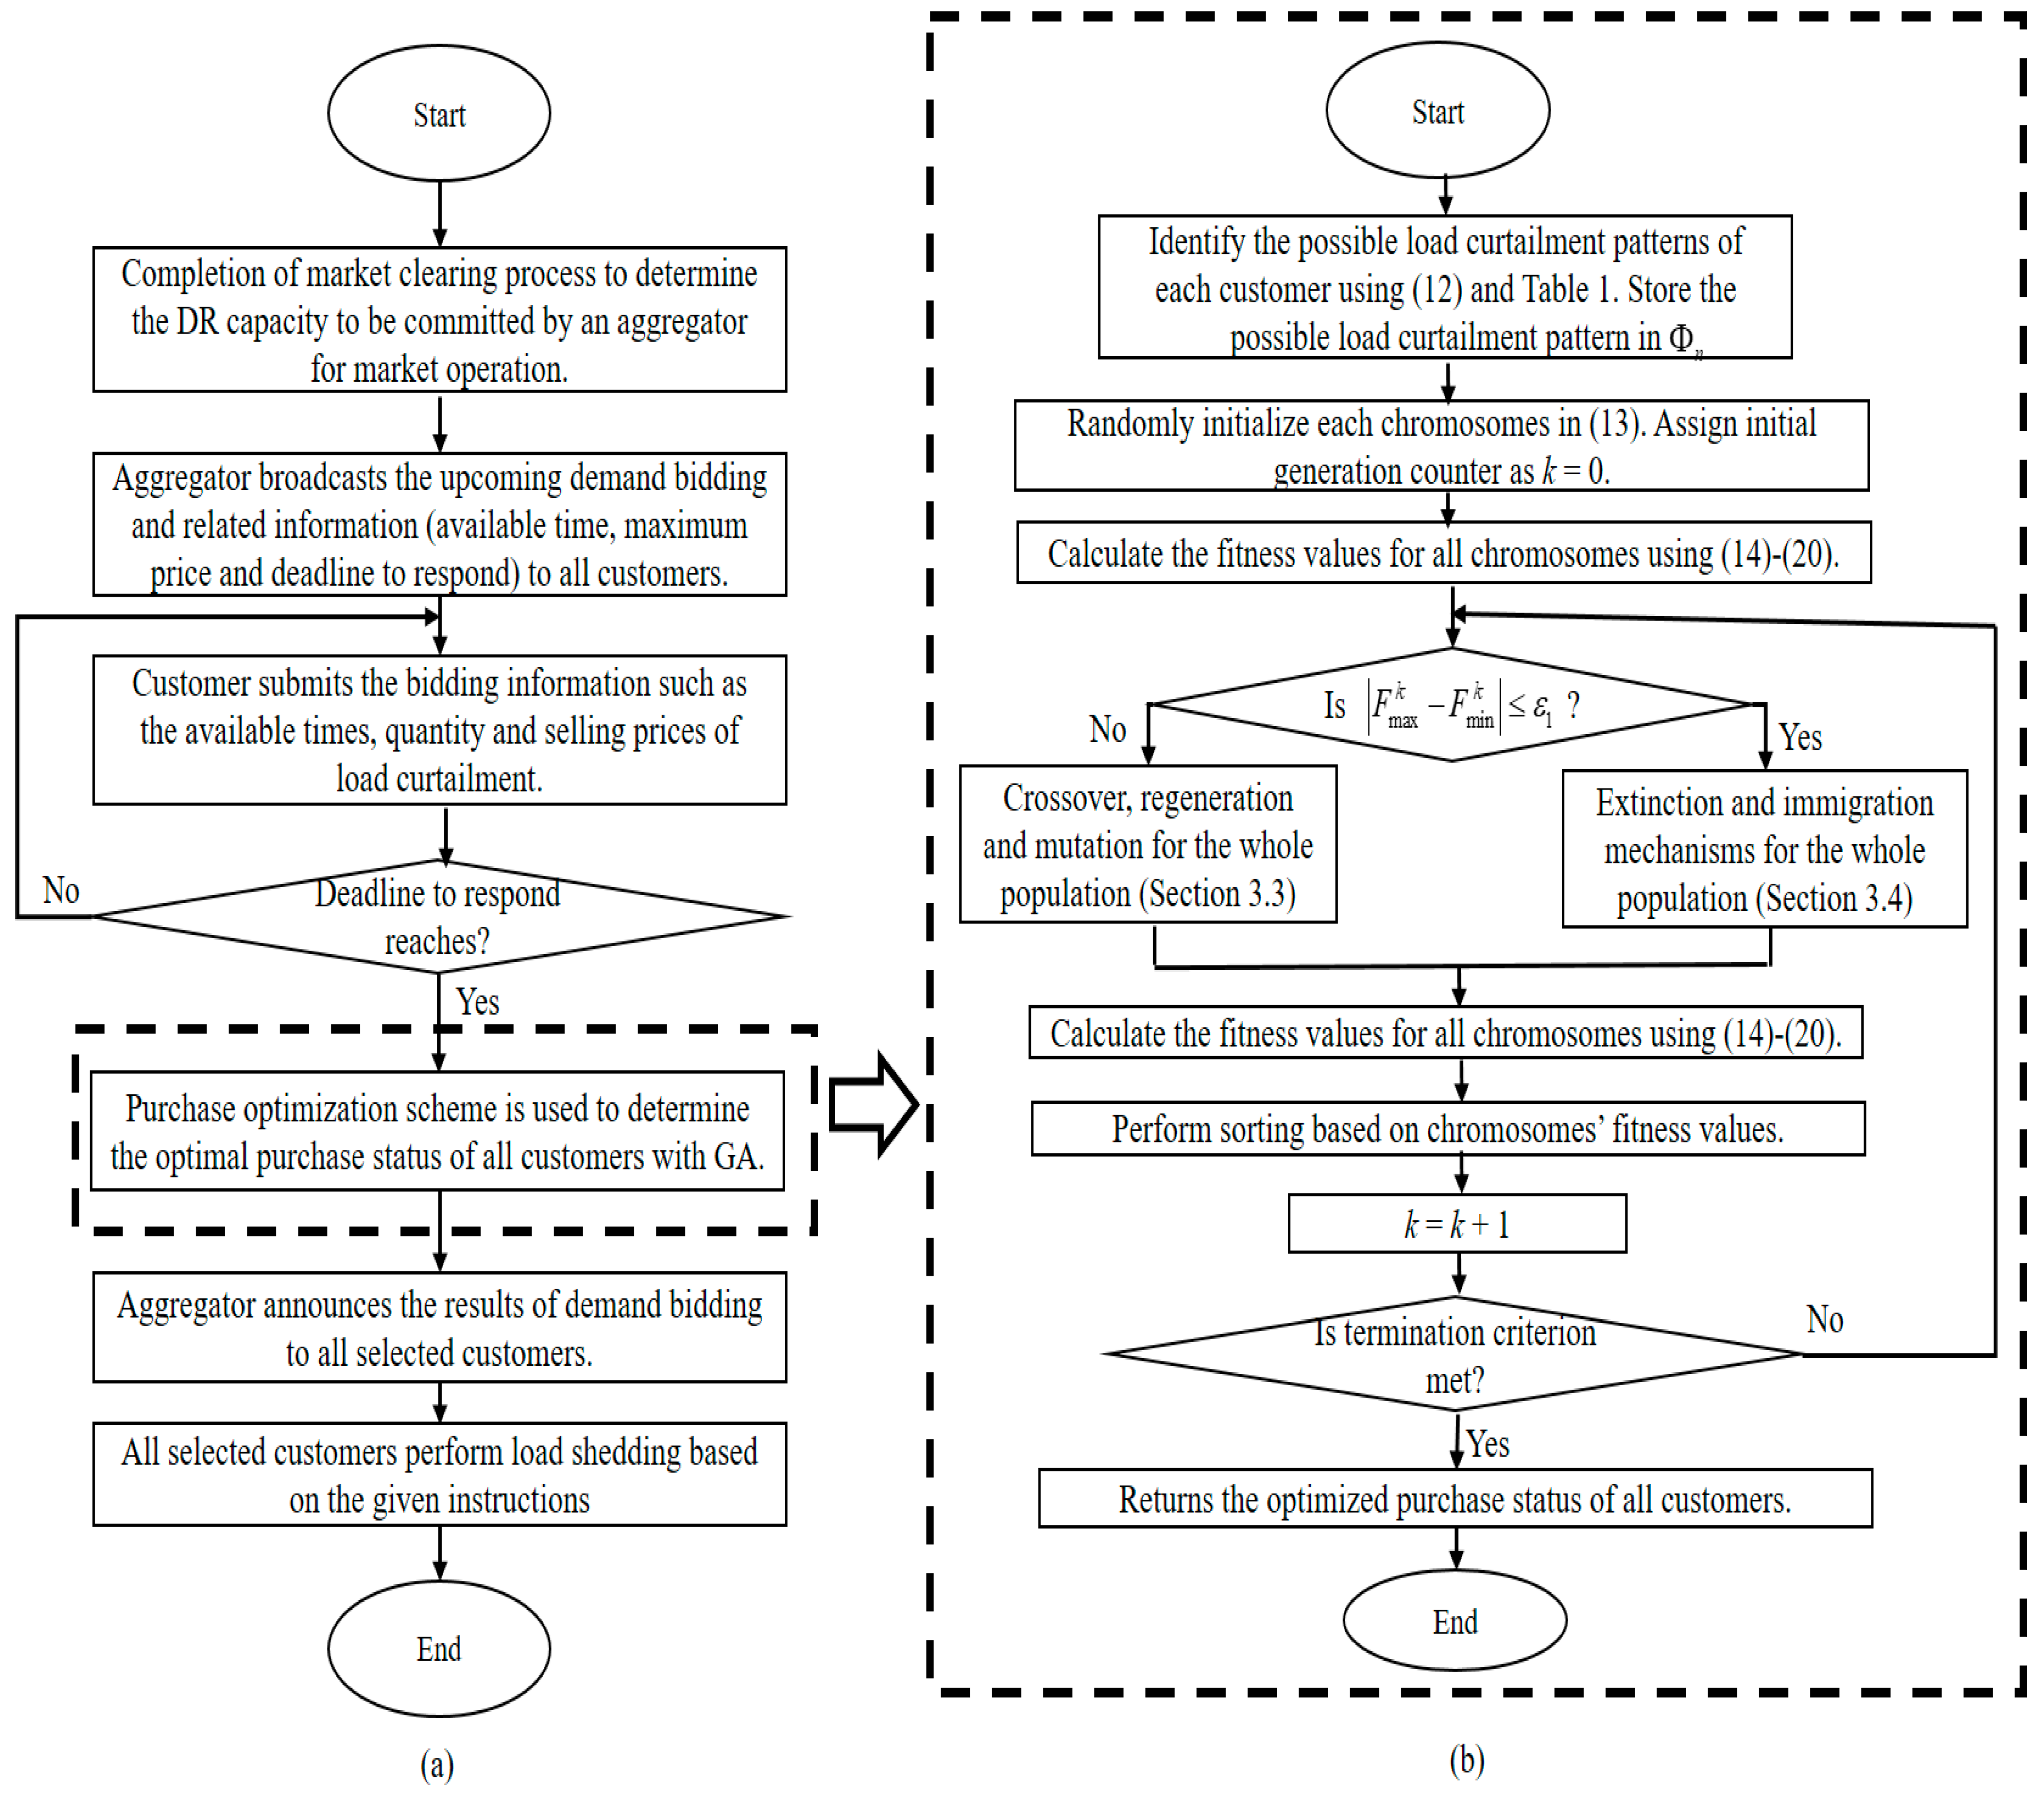
For the sake of clarity, the flowchart used to describe the mechanism of demand bidding between an aggregator and all customers under its service regions is illustrated in Figure 1a. Meanwhile, the GA-based purchase optimization scheme used to determine the best combination of purchase status for all customers in order to minimize the total bidding cost while fulfilling all load curtailment constraints is summarized using the flowchart presented in Figure 1b. Elitism is used in the proposed MGA. The best chromosome with smallest fitness value is passed to the next generation. If no improvement of the minimum fitness value for certain number of generations, the MGA might have achieved near optimal solution and can be stopped. The stopping criterion for the proposed MGA is set as for continuous generations.
4. Simulation Settings and Results
4.1. Simulation Settings
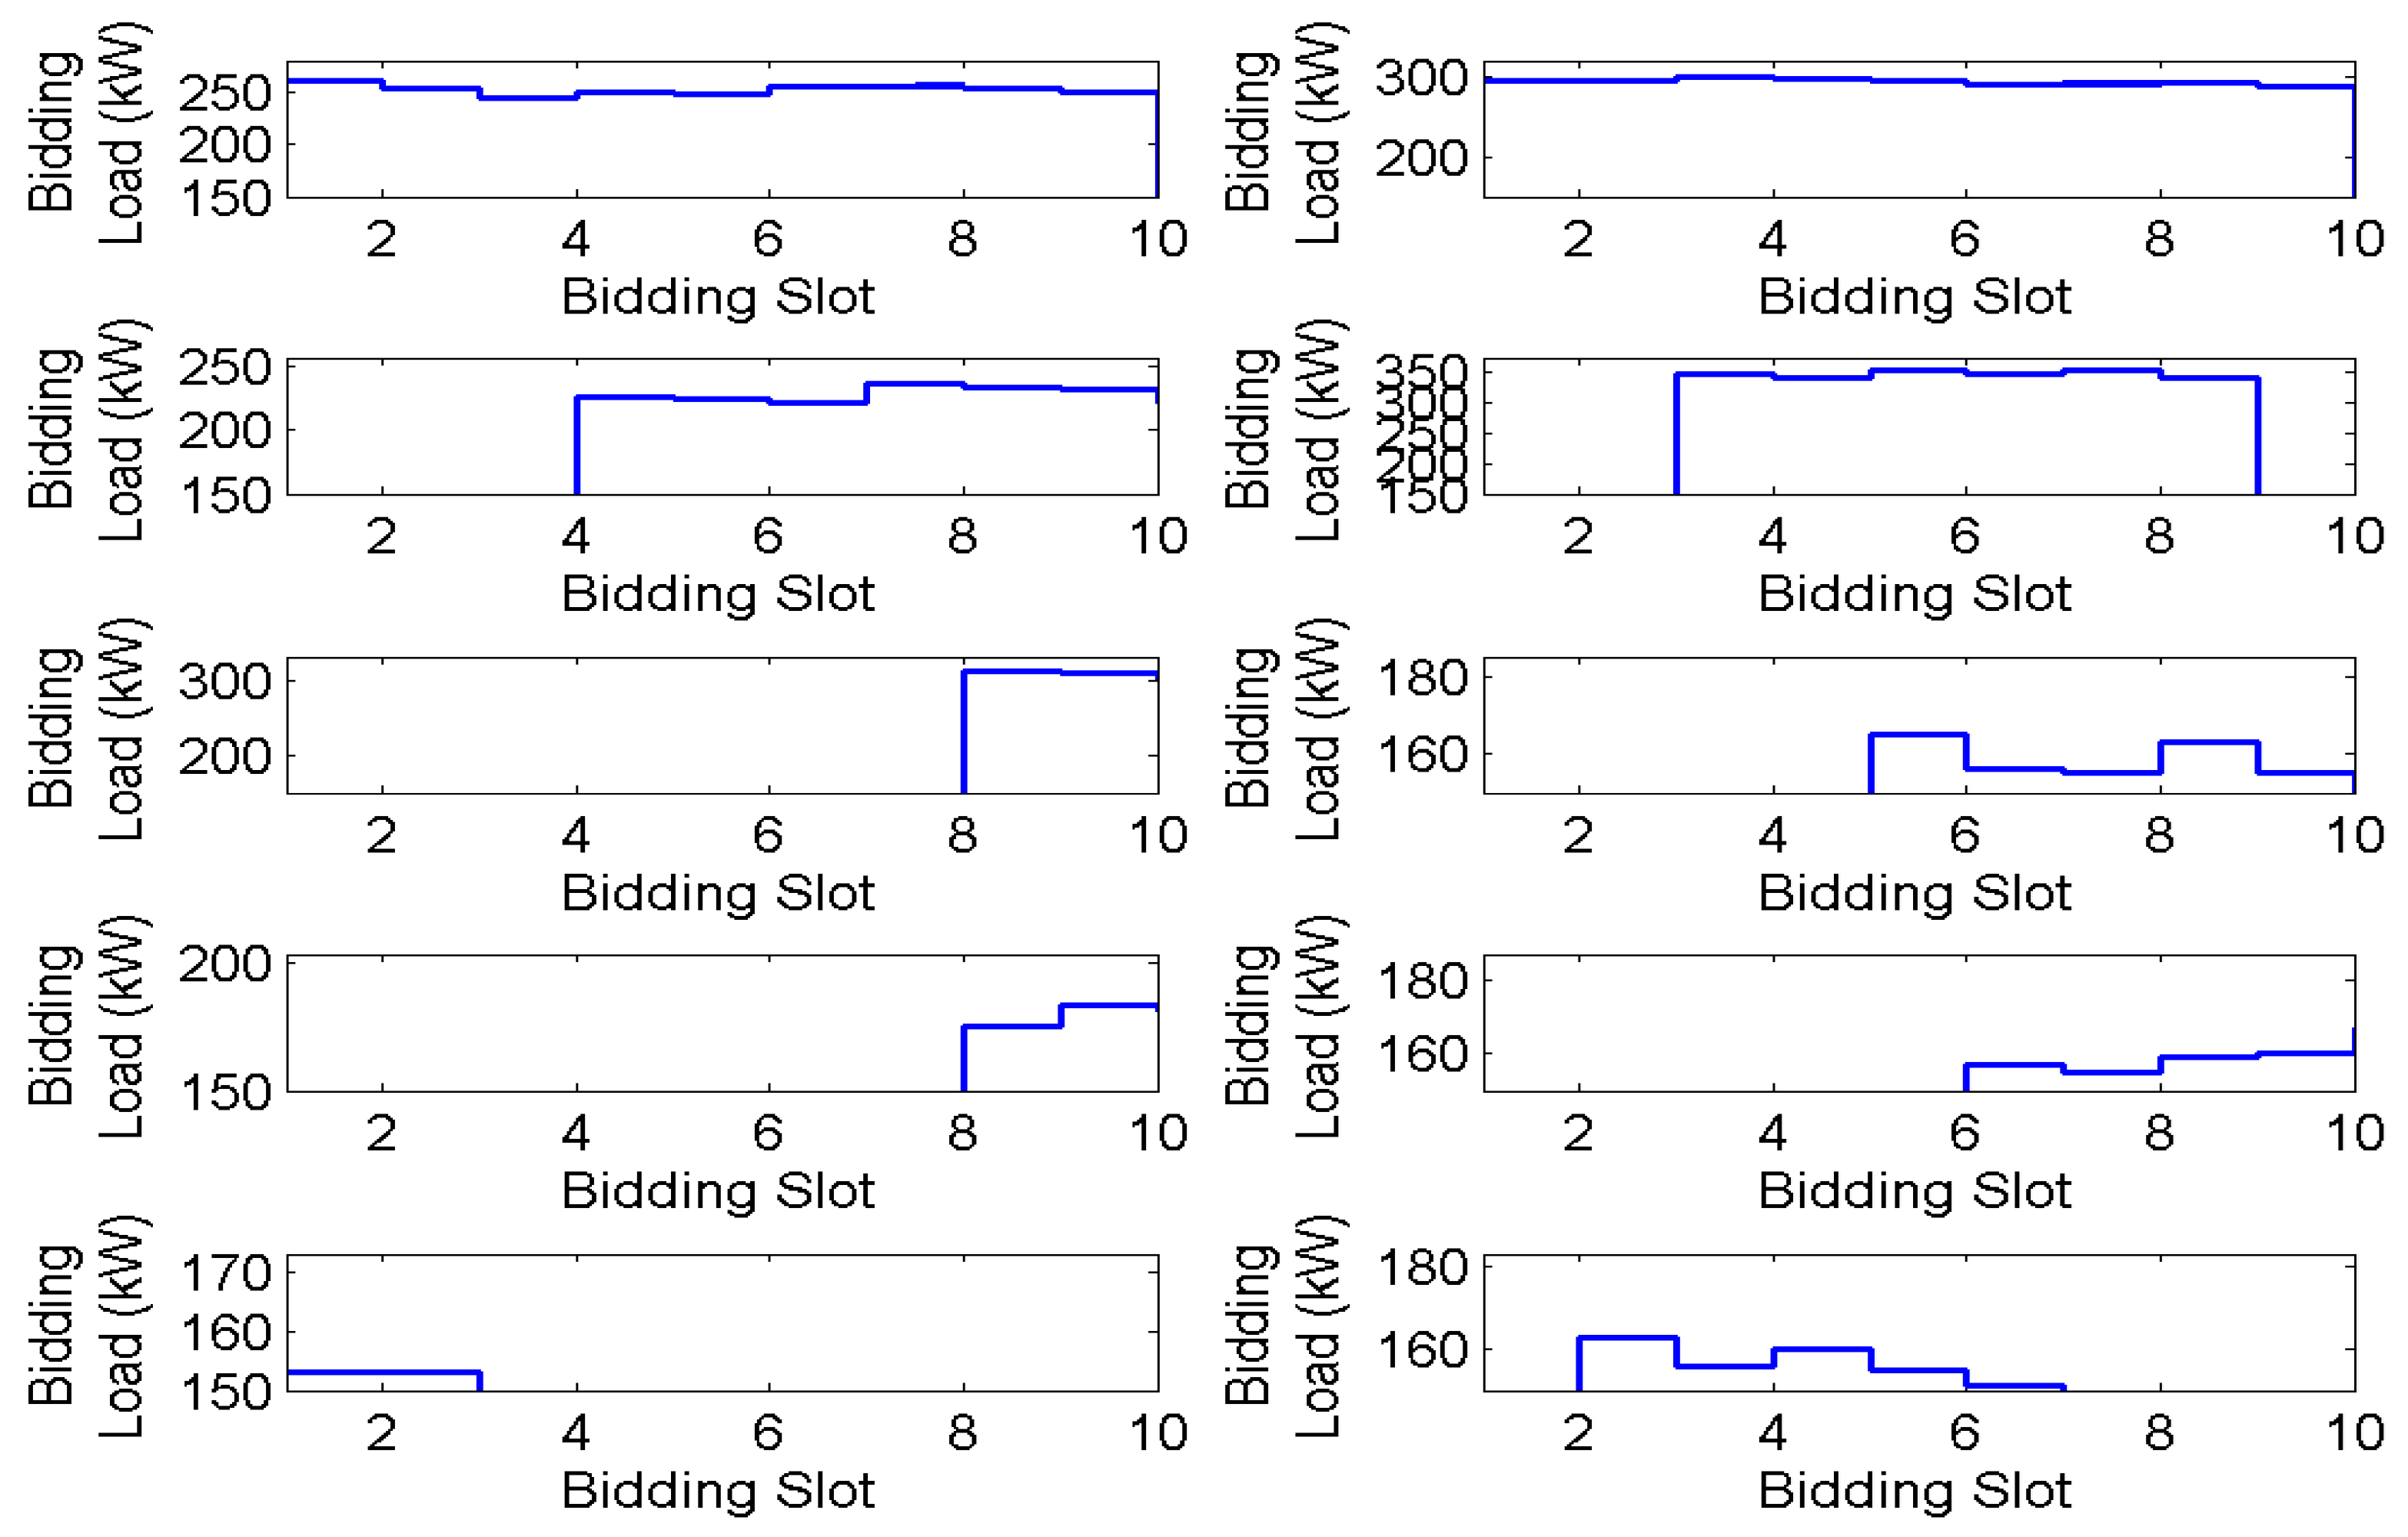
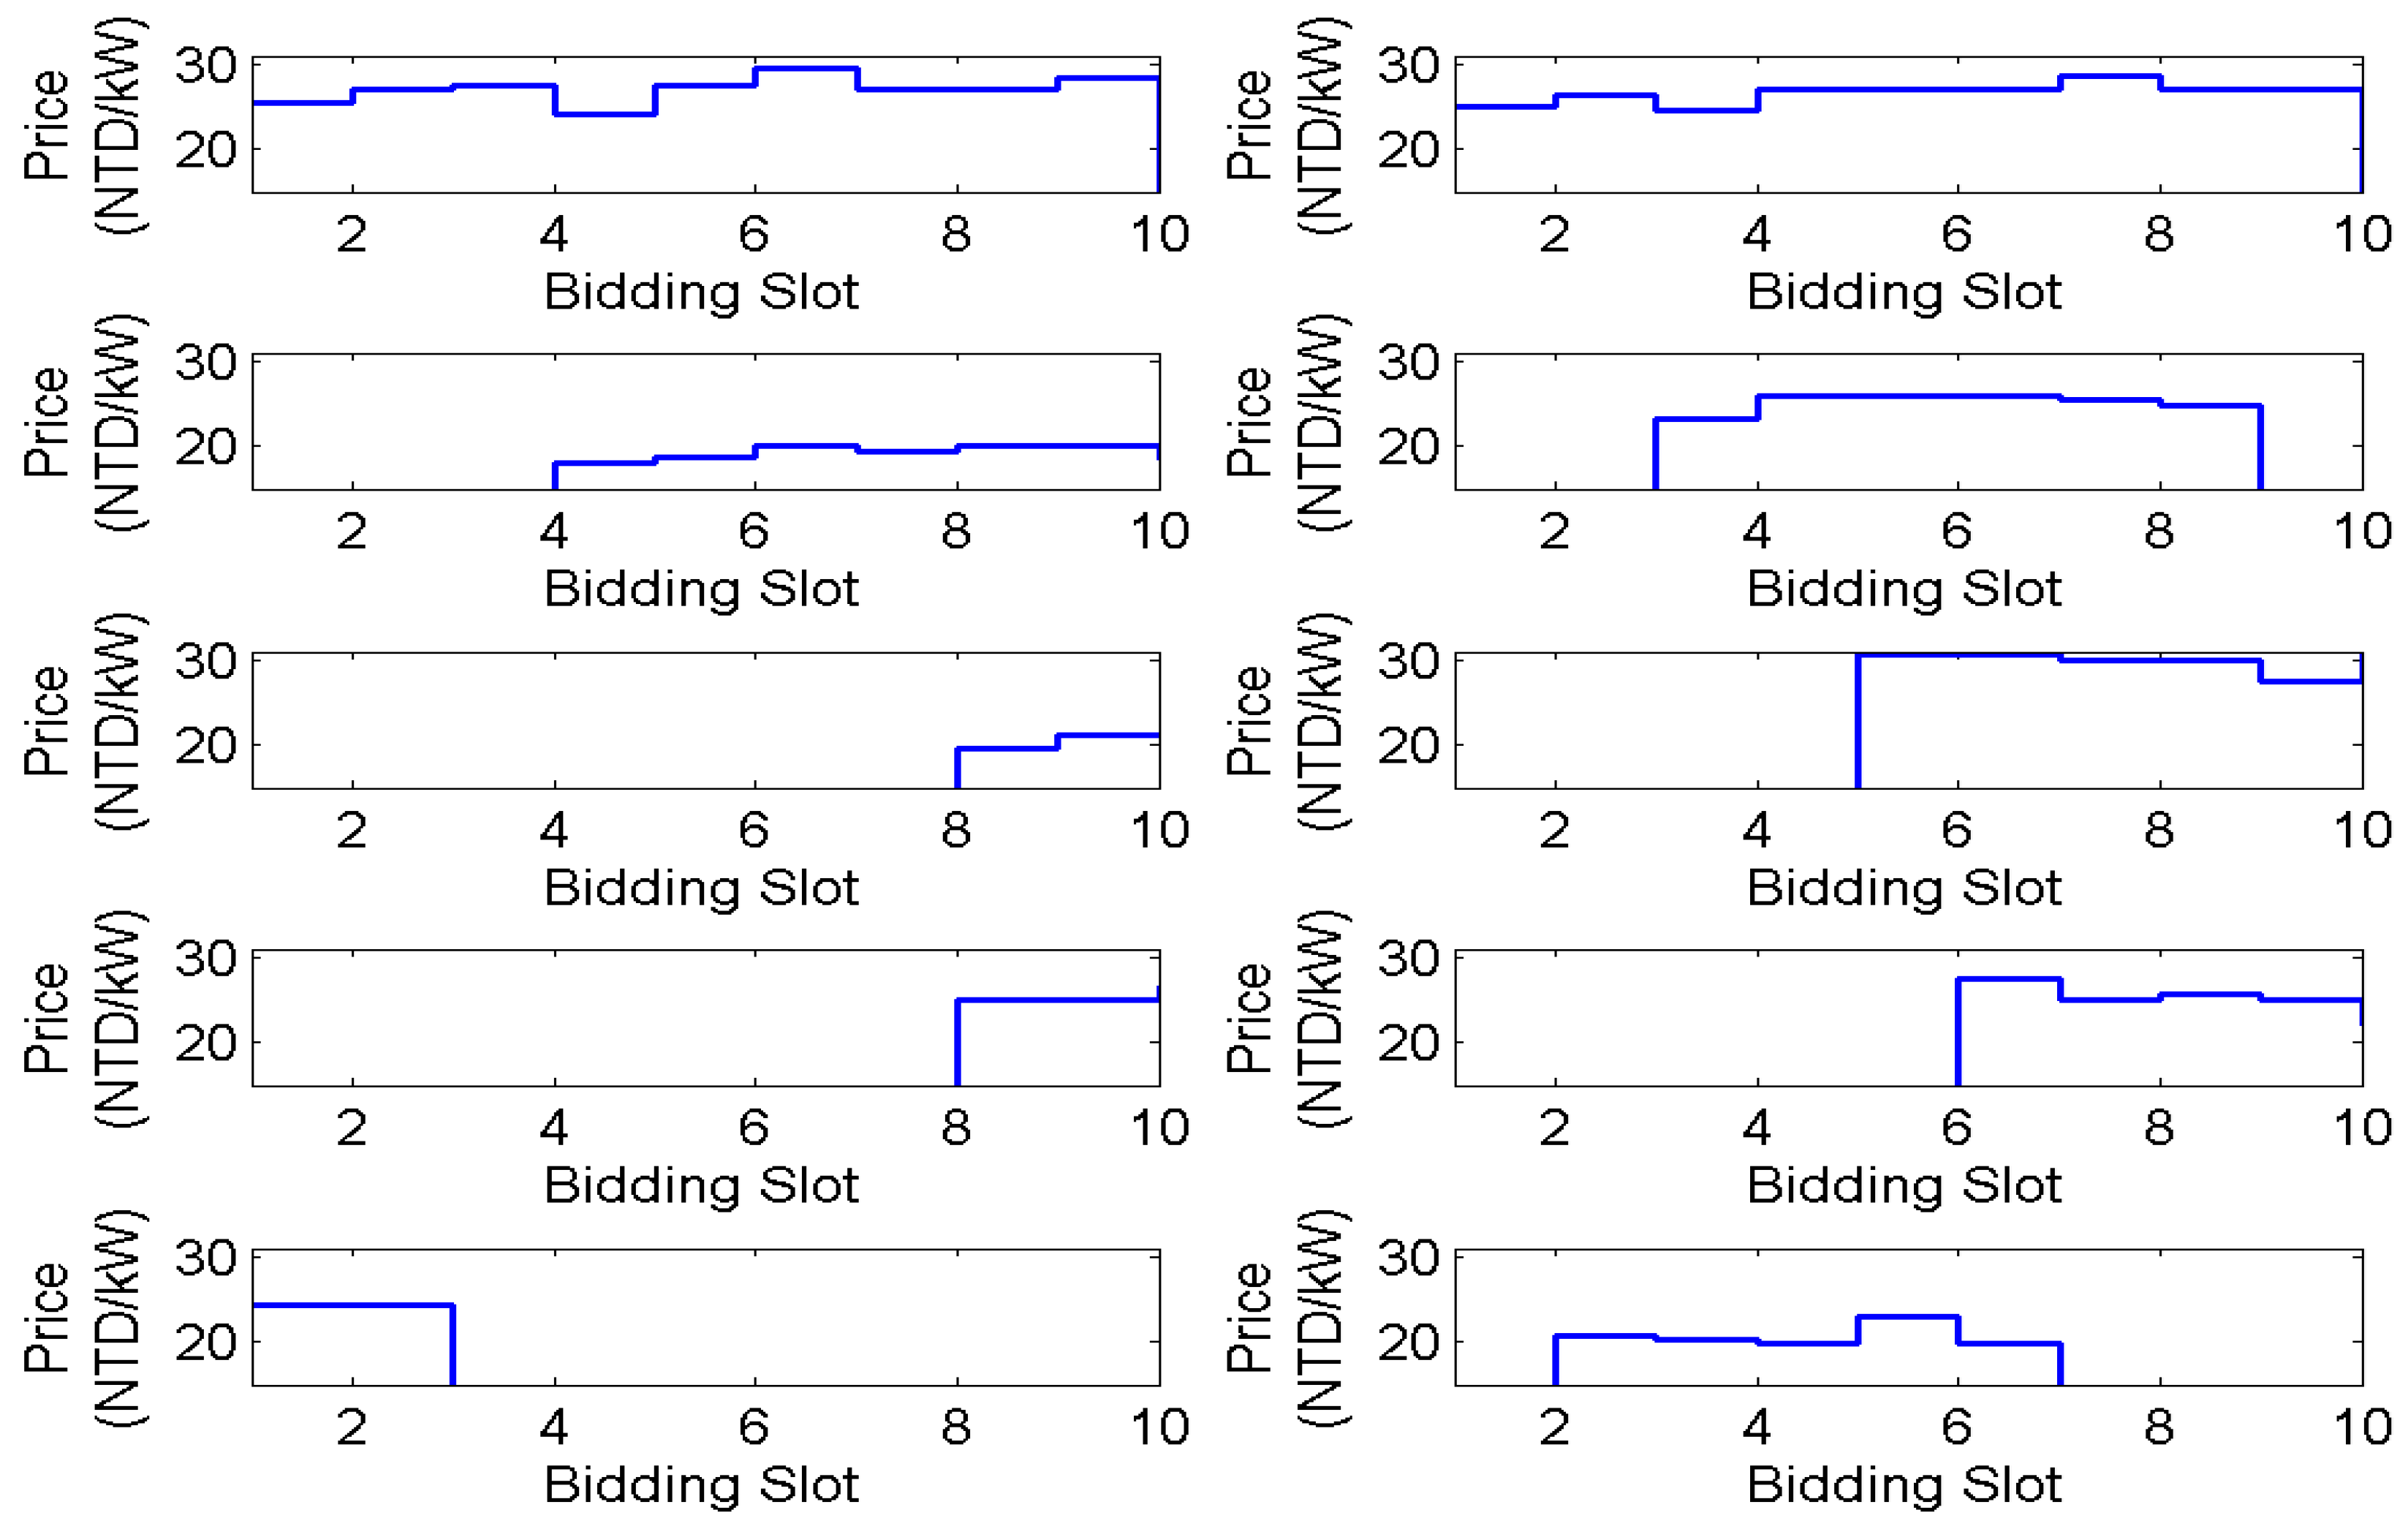
The target load curtailment denoted as to be committed at every m-th bidding slots in two case scenarios of demand bidding are summarized in Table 2. Case 1 consists of M = 5 bidding slots with N = 500 customers are registered as the candidates for demand bidding, while a total of N = 1000 customers are considered in the case 2 with M = 10 bidding slots. The quantity of load curtailment and bidding price per kWh submitted by ten randomly selected customers at each time slot for case 2 are presented in Figure 2 and Figure 3, respectively, to illustrate the characteristic of bidding information. In this paper, it is assumed that the total DR capacity offered by all customers in every bidding slot is much greater than the target load curtailment profile to be achieved. This ensures the aggregator to have greater flexibility in searching for the optimal bidding purchase solution at every bidding slot, hence guaranteeing the feasibility of the demand bidding model. Furthermore, the actual load curtailment delivered by all selected customers during demand bidding cannot be much lesser or much greater than the tolerance ranges of their promised amounts as stipulated by the aggregator in practical scenarios. For the convenience of analysis, the actual amount of load curtailment produced by all selected customers is assumed to be exactly the same as promised.
The proposed purchase optimization scheme designed using MGA is compared with that of developed using regular genetic algorithm (RGA) that did not incorporated with the adaptive bid declination scheme defined in (23)–(24). For the cases 1 and 2 of demand bidding, the population sizes of algorithms are set as 500 and 1000 respectively. The remaining parameters of both MGA and RGA are set to be:
In order not to be misled by a single simulation, the simulations results of both compared methods are the average values produced from ten independent simulations. All simulations are run on an Intel ® Core i5-4570 CPU @3.40 GHz, 4.00 GB RAM, and Microsoft Visual Studio 2010.
4.2. Simulation Results
Denote as the minimum load curtailment period of each n-th customer, while represents the actual number of bidding slots purchased by the aggregator from the n-th customer. Let be the optimal purchase status of each n-th customer at the m-th bidding slot as determined by the proposed purchase optimization scheme. Then, is calculated as:
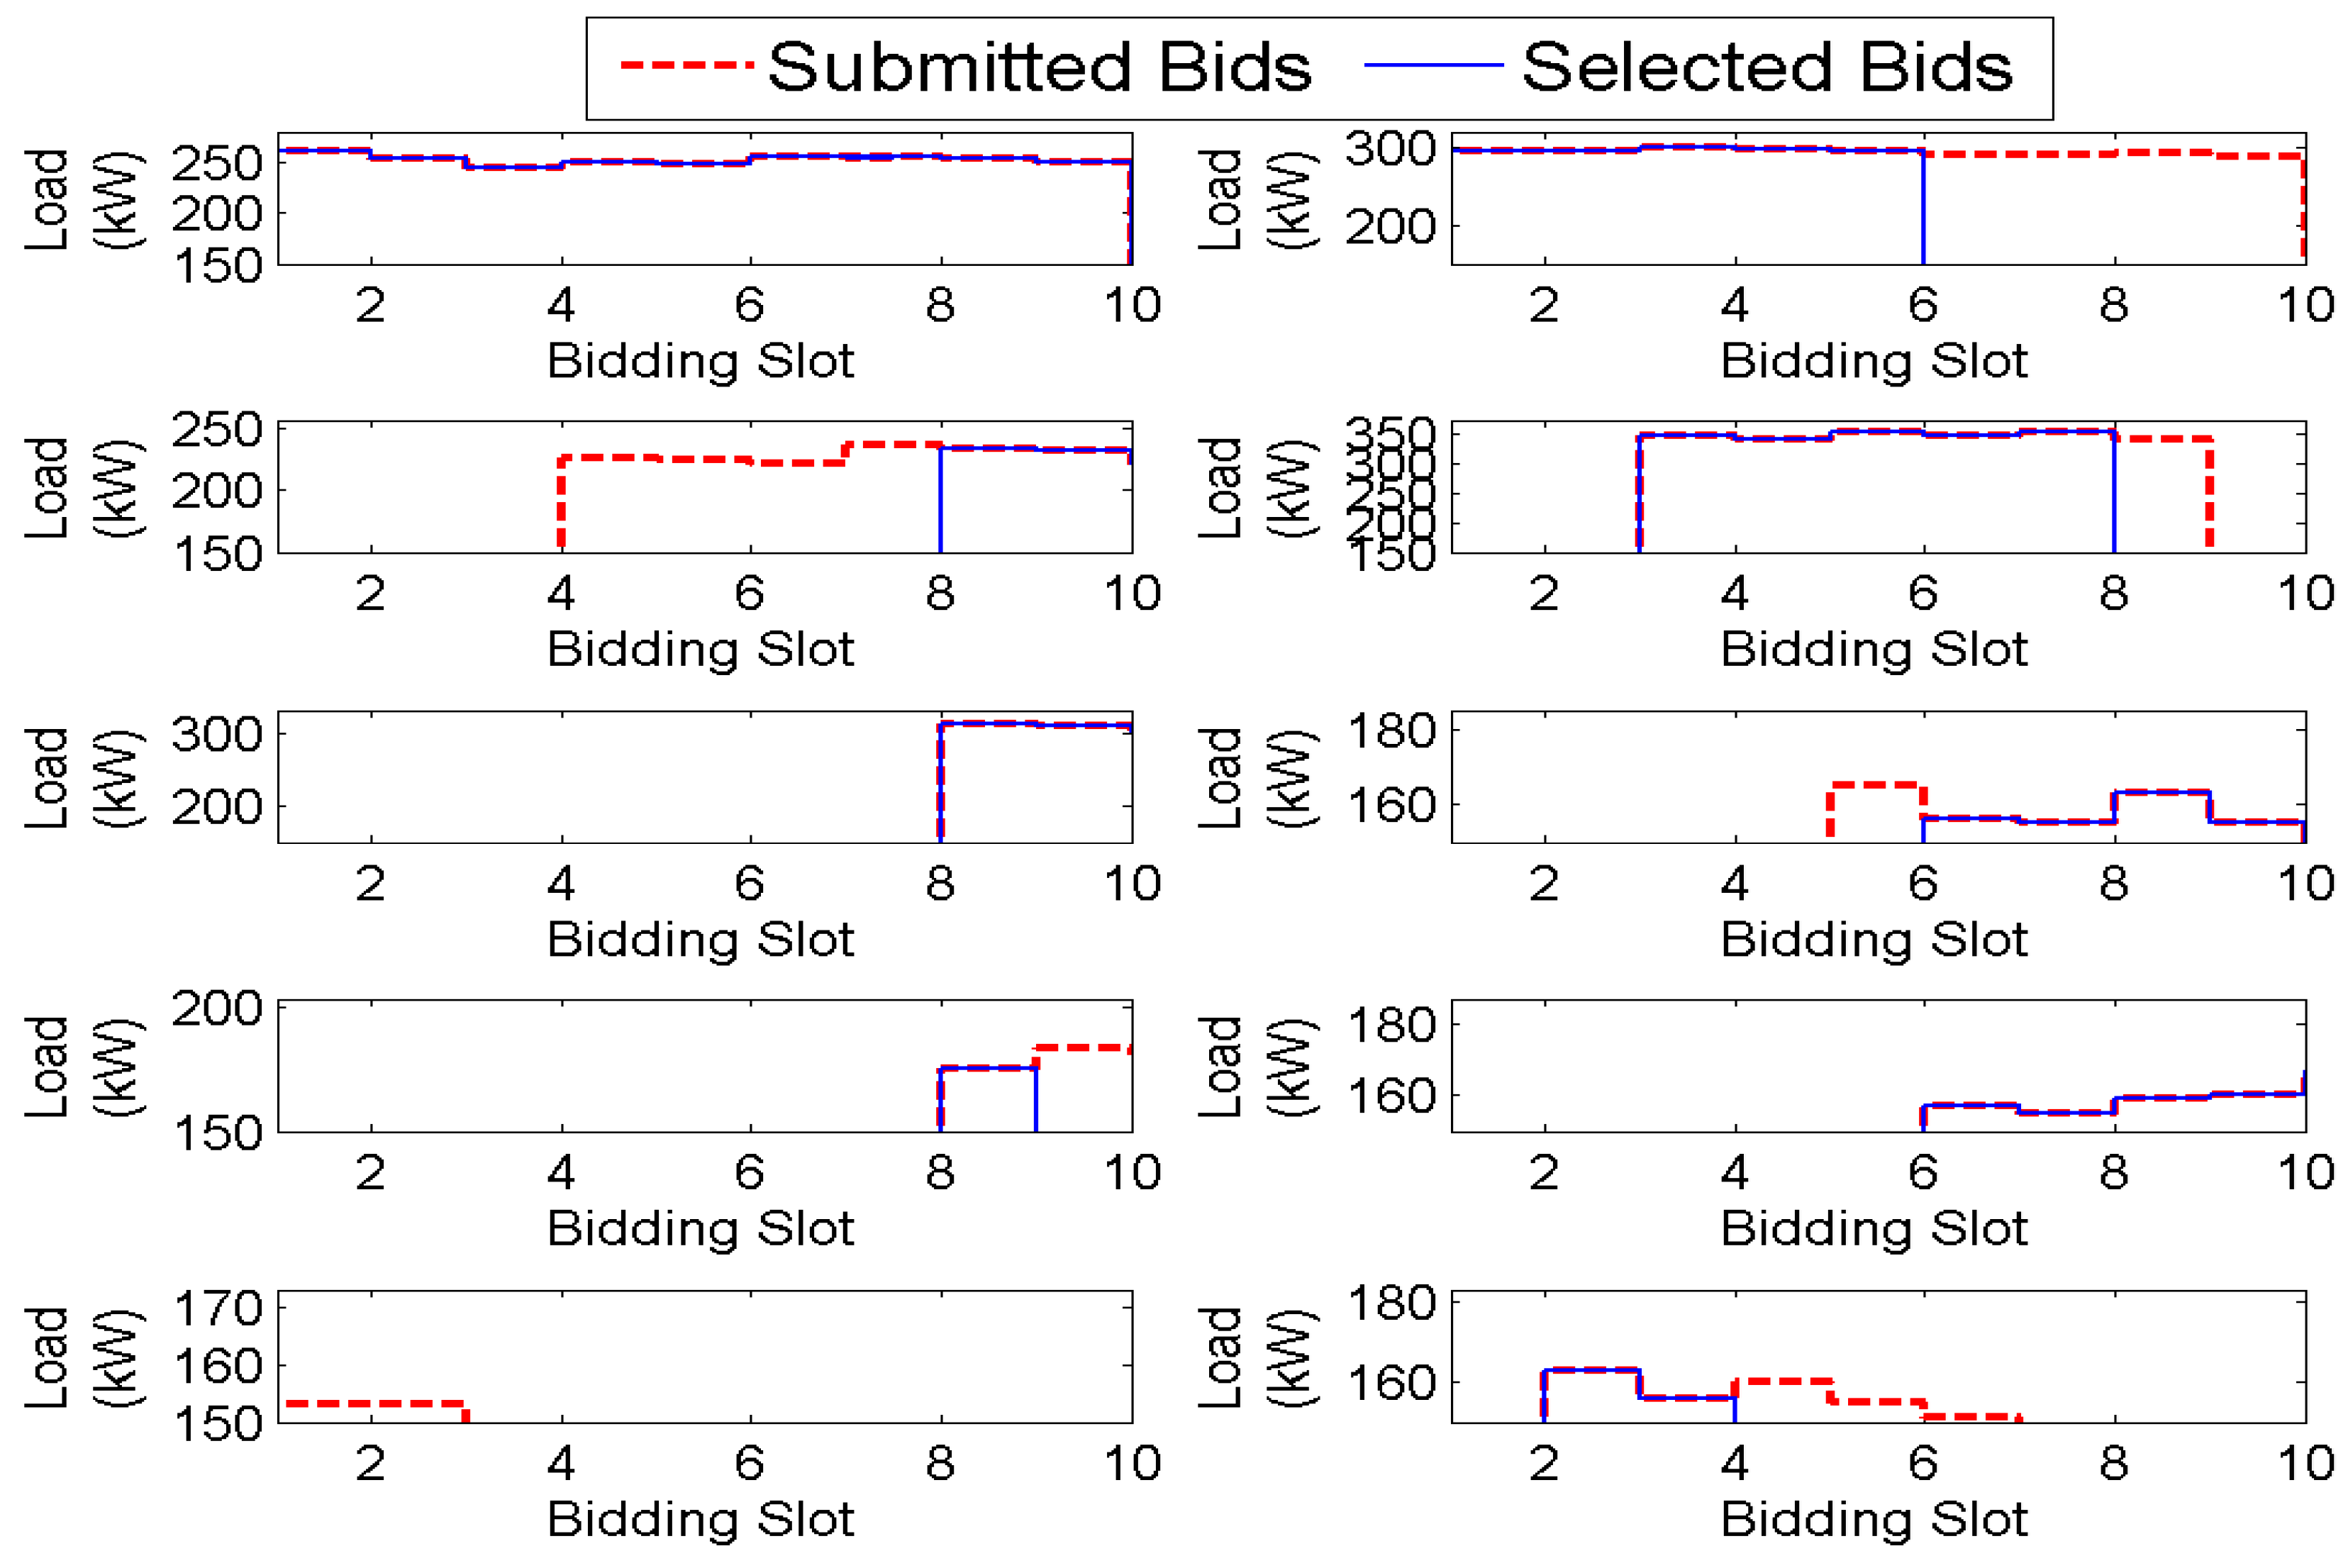
The input load curtailment bids submitted by ten randomly selected customers and the actual demand purchased from these customers determined using the proposed method are shown in Figure 4. The minimum load curtailment period of these ten customers are set as 1 h. From Figure 4, it is observed that three of these ten randomly selected customers have all of their input load curtailment bids purchased by the aggregator. The demand bids submitted by another six customers are partially selected, while one customer is completely declined for load curtailment. The simulation results in Figure 4 verify that the purchased status of each customer as computed by the proposed work indeed satisfies the constraints (8)–(10) that only if .
Define as the actual load shedding produced by all selected customers at the m-th bidding slot. The absolute deviation between the actual load shedding and the target load curtailment profile at every m-th bidding slot is represented as , i.e.,
Let be a metric used to quantify the average load curtailment difference between the actual quantity of load shedding delivered by the compared methods and the target of load curtailment during demand bidding, that is:
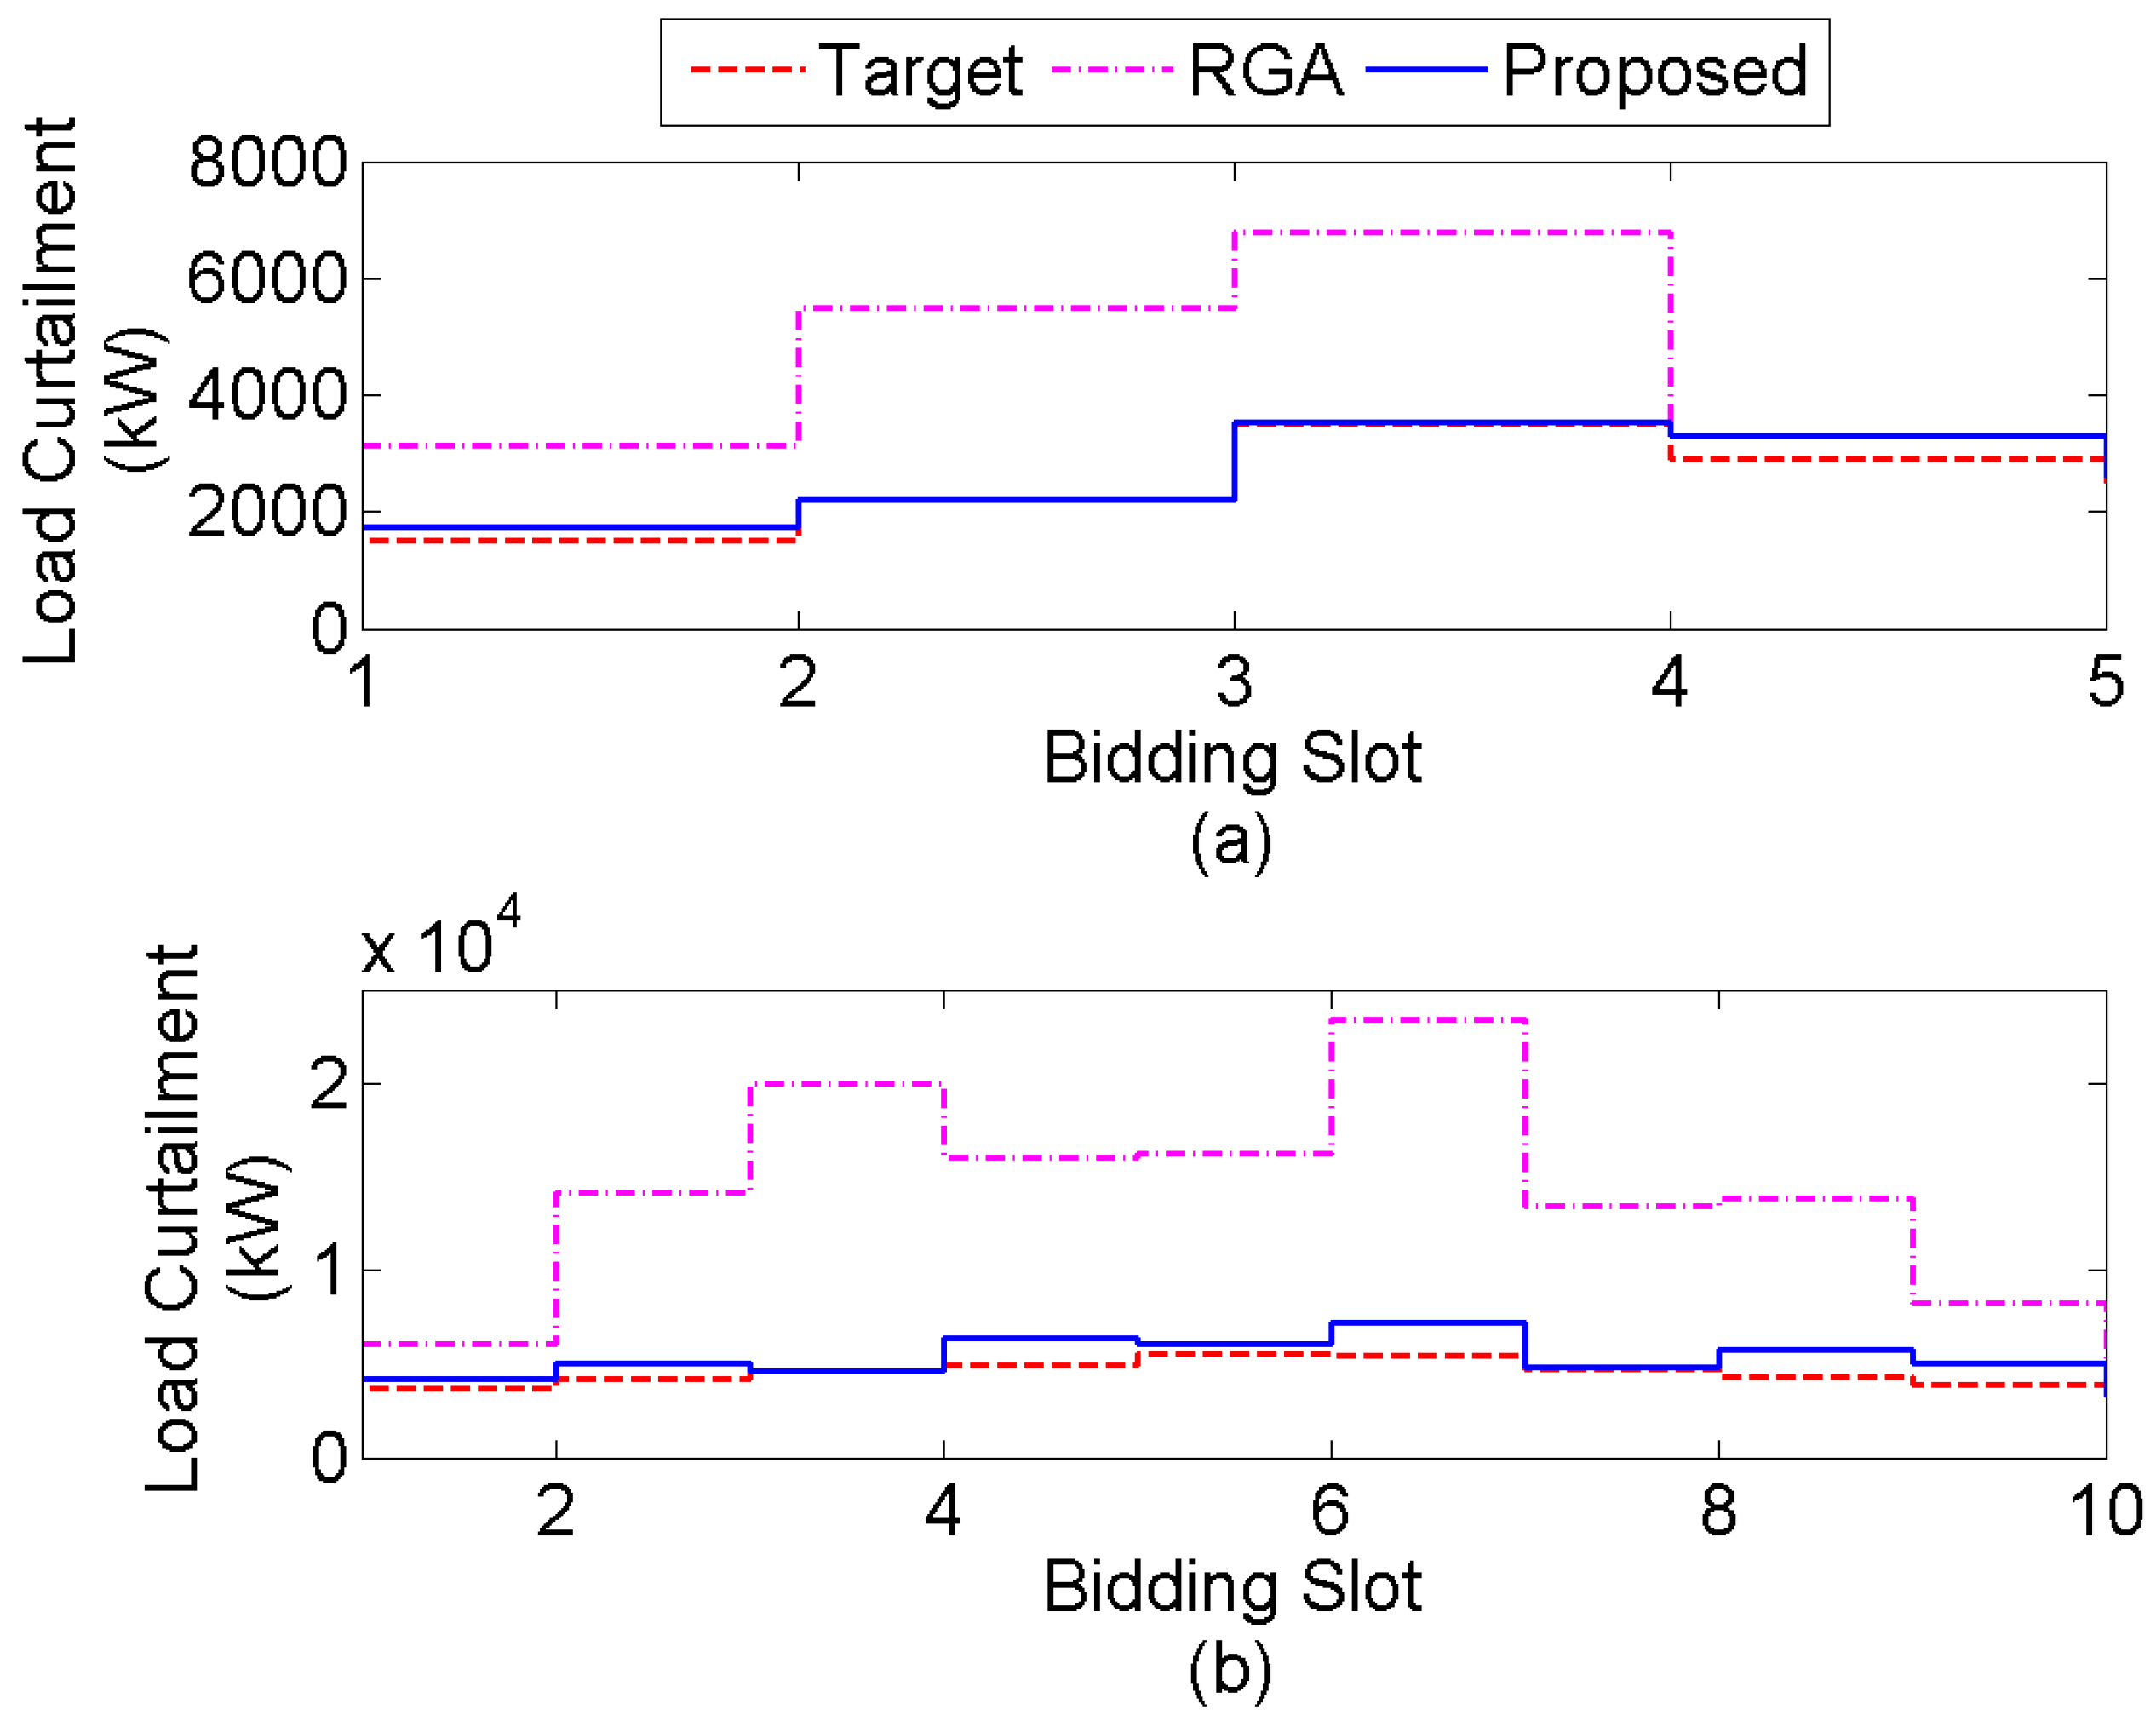
The target load curtailment profile a nd the actual load curtailment profile produced by both of the RGA and proposed work for cases 1 and 2 of demand bidding are presented in Figure 5. It is observed that actual load curtailment profiles produced by the proposed method is significantly closer to the target profiles as compared with those of RGA for both cases of demand bidding. The qualitative results shown in Figure 5 are validated by the quantitative results presented in Table 3 because the average load curtailment deviations produced by the proposed work in both cases of demand bidding are at least 10 times lower than those of RGA. The smaller values produced by the proposed work implies its excellent capability in preventing the excessive load curtailment that will lead to the revenue loss of aggregator during demand bidding.
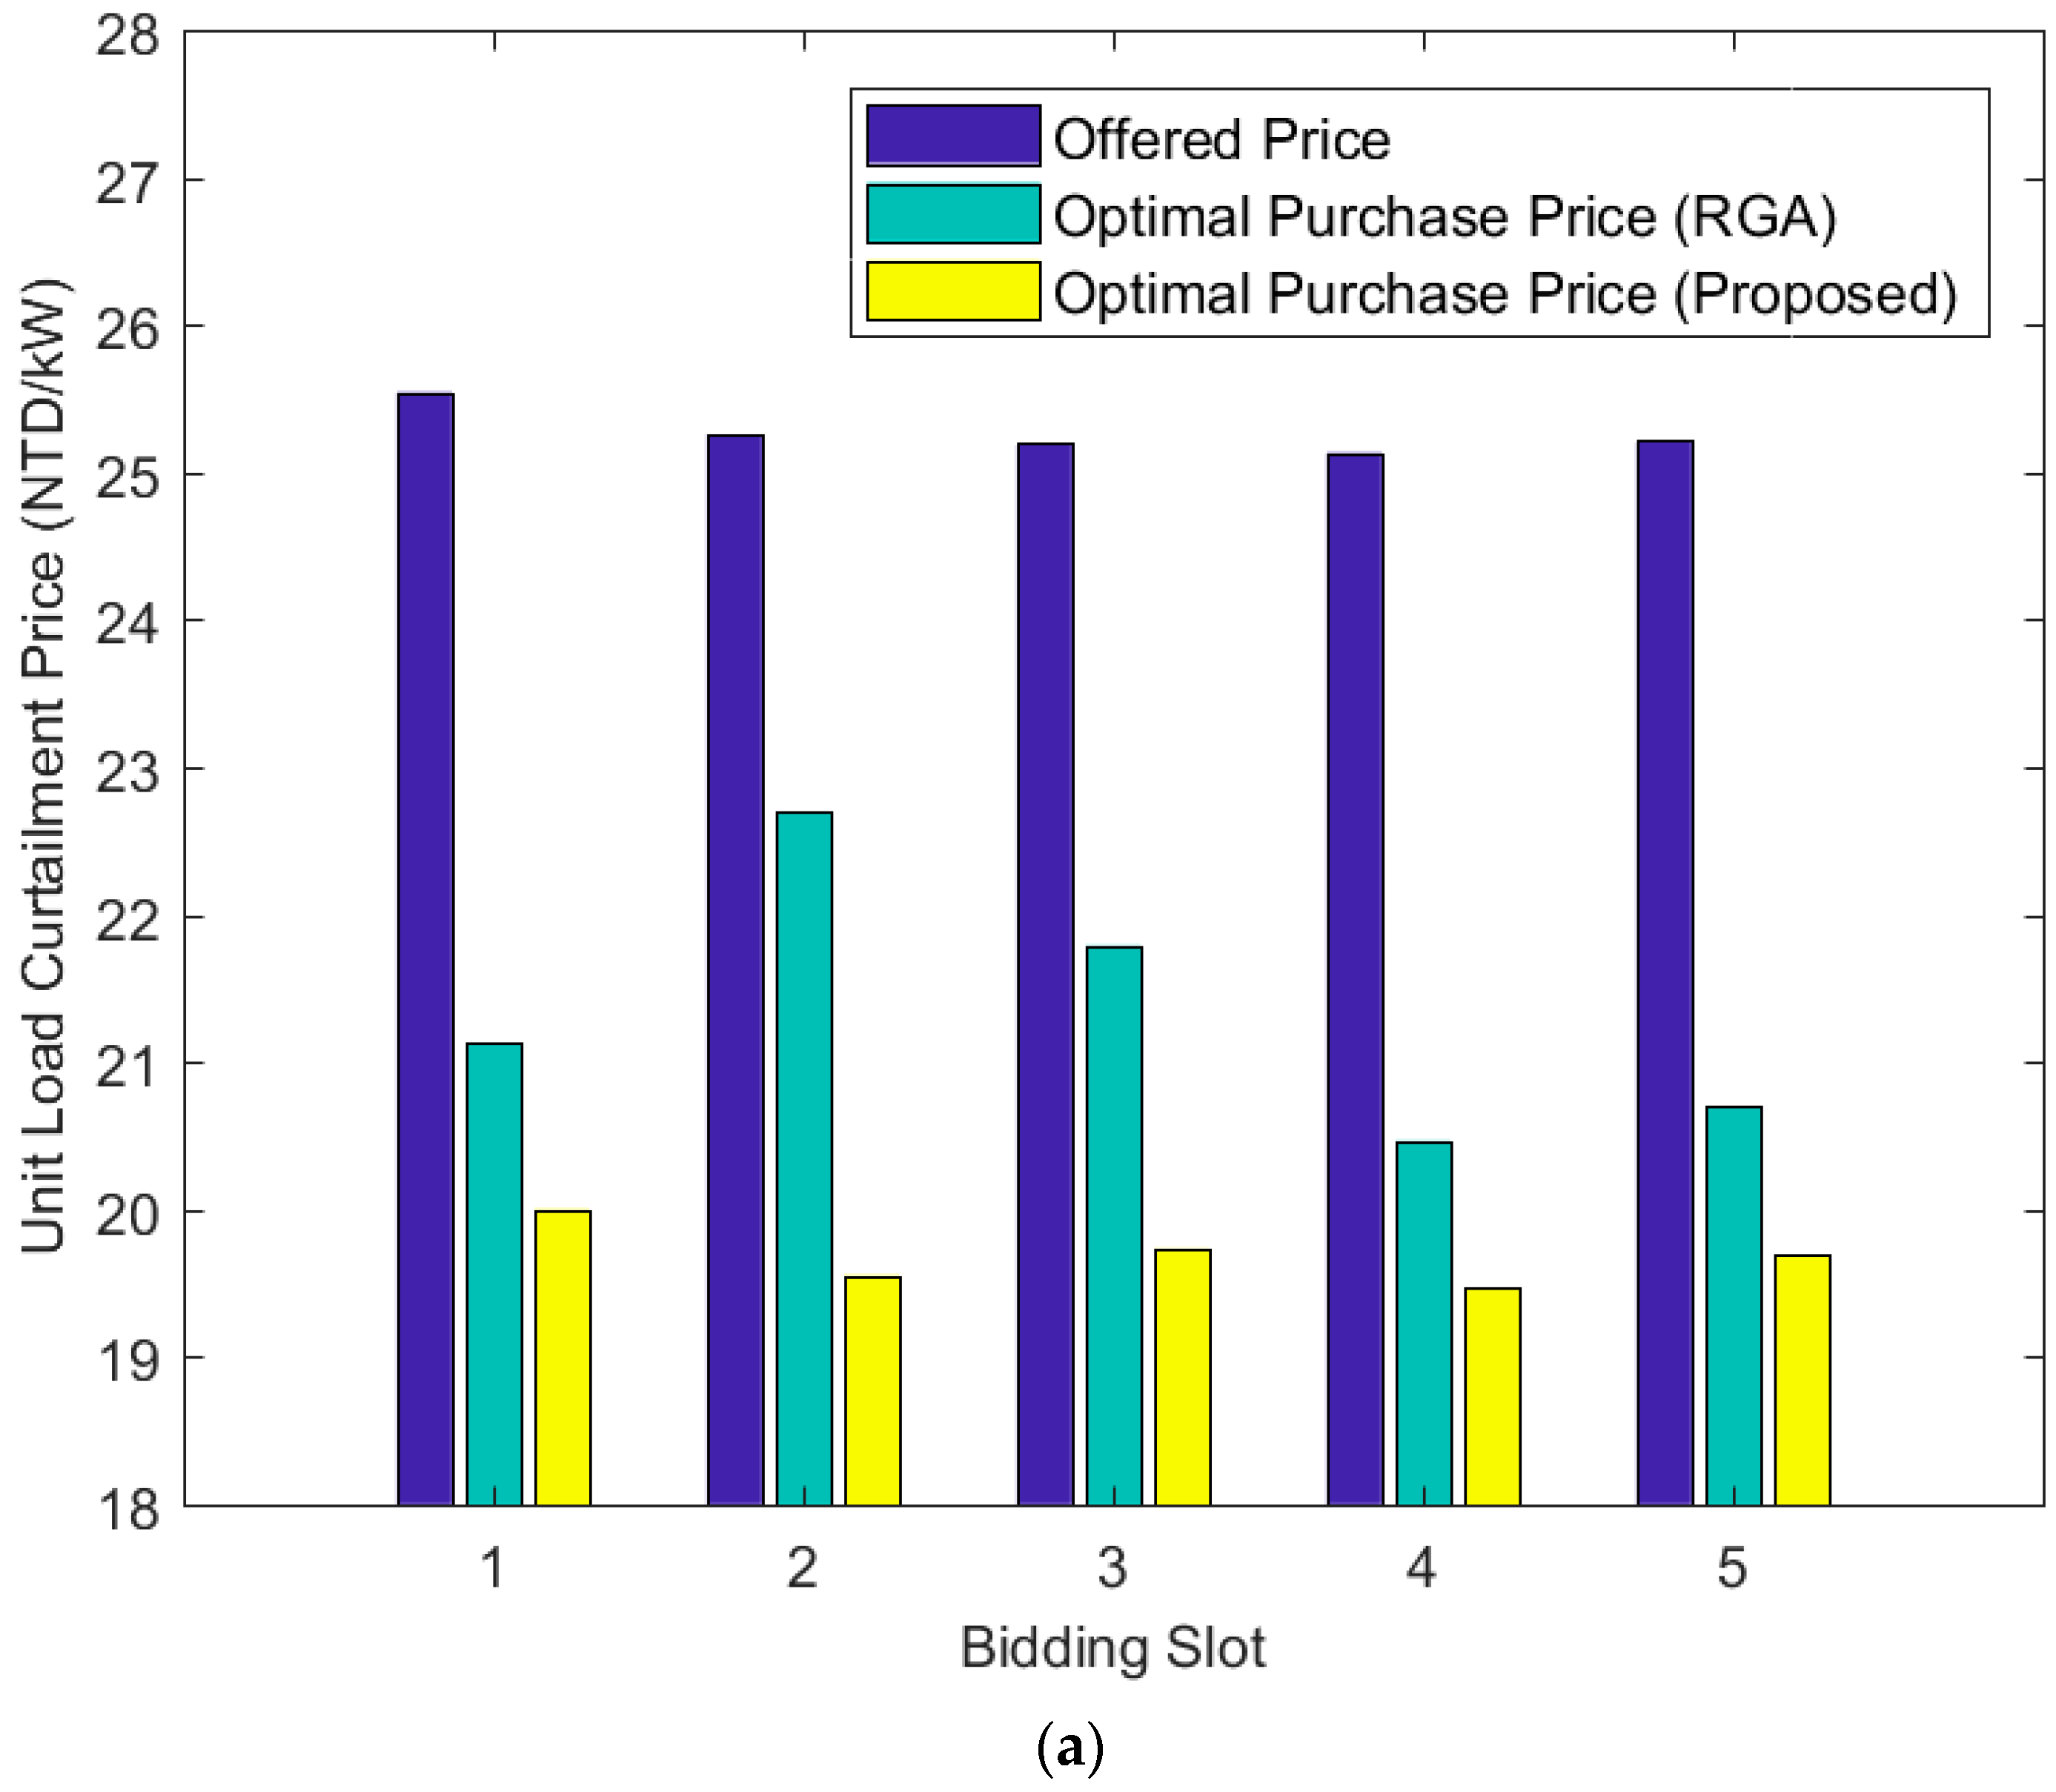
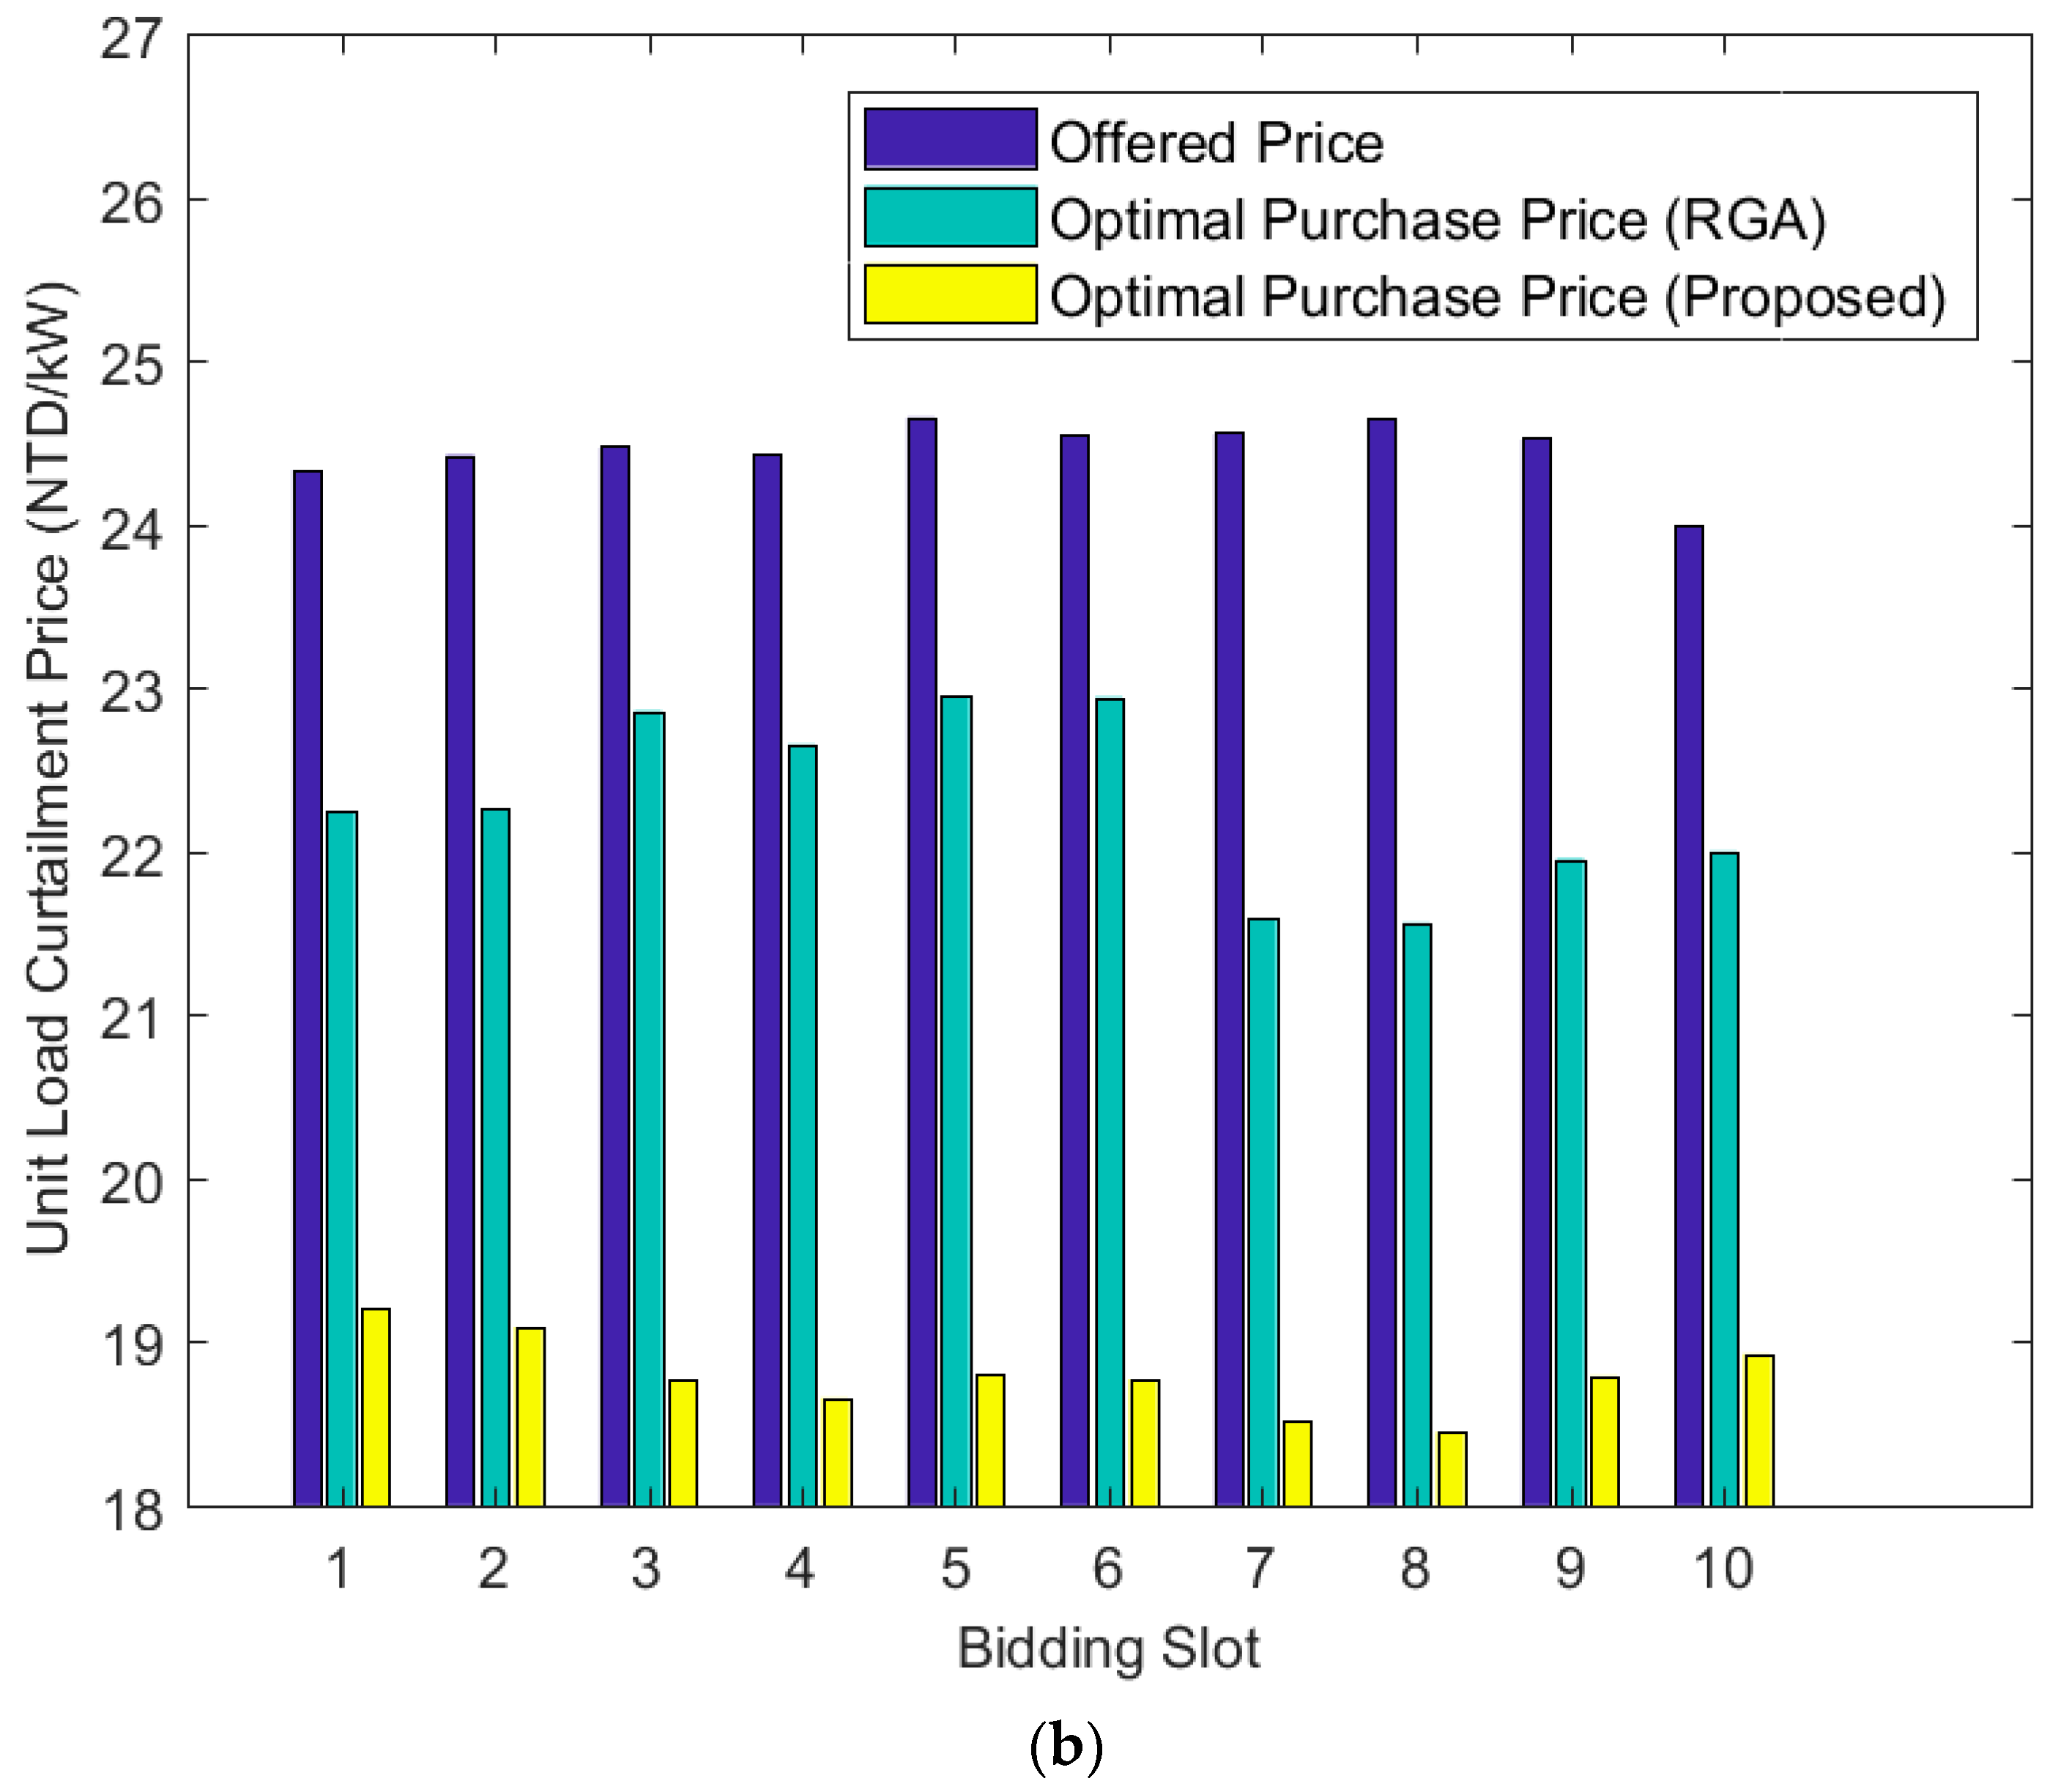
Denote and as the average bidding price per unit load curtailment submitted by all customers during demand bidding and the optimal purchase price per unit load curtailment as determined by the compared methods, respectively, at the m-th bidding slot. Mathematically,
Comparisons between and for cases 1 and 2 of demand bidding are illustrated in Figure 6. It is shown in both Figure 6a,b that the optimal purchase prices produced by both compared methods are different and lower than the average offered price at every bidding slot for both cases 1 and 2. This observation implies the cost minimization capabilities of the proposed purchase optimization scheme in fulfilling the target load curtailment profiles. Furthermore, the optimal purchase prices produced by the proposed work in all bidding slots are consistently lower than those of RGA because the latter approach tends to purchase more load curtailment than necessary from the customers as shown in Table 3 and Figure 5. This undesirable behavior leads to the increasing of bidding cost of aggregator in purchasing the load curtailment from customers. Let be the total bidding cost incurred by the compared methods in order to satisfy the target load curtailment throughout the demand bidding event, i.e.,
The values produced by RGA and proposed work in both cases of demand bidding are presented in Table 4 to further evaluate the cost minimization capabilities of both compared methods. The proposed work is reported to be more cost effective than RGA in both cases because the optimization results produced by the former method enable the aggregator to deliver the promised load curtailment for market operation with lower financial costs.
Table 5 compares the computation time required by both compared methods to solve the demand bidding problems described in cases 1 and 2. The proposed method is reported to incur slightly greater computation times than RGA in both cases. This is because the proposed method is incorporated with an additional adaptive bid declination scheme as described in (23)–(24) to prevent the excessive load curtailment that can lead to the revenue loss of aggregator. It is also observed that case 2 with greater problem complexity has incurred longer computation times for both compared methods. Although the computation times of both compared methods tend to increase with problem complexity, the values obtained for both cases are acceptable because the optimal purchase solutions are computed one day ahead before demand bidding starts. It is also noteworthy that the target load curtailment profiles presented in Table 2 are intentionally made more fluctuating than the practical scenarios with the purpose to evaluate the computational efficiency of the proposed purchase optimization scheme with an additional complexity. The target load curtailment profiles assigned for the practical scenarios are usually constant or less fluctuating than those simulated in this paper. Therefore, the actual computation times incurred can be reasonably shorter that those observed from simulations despite the latter values are short enough for real applications.
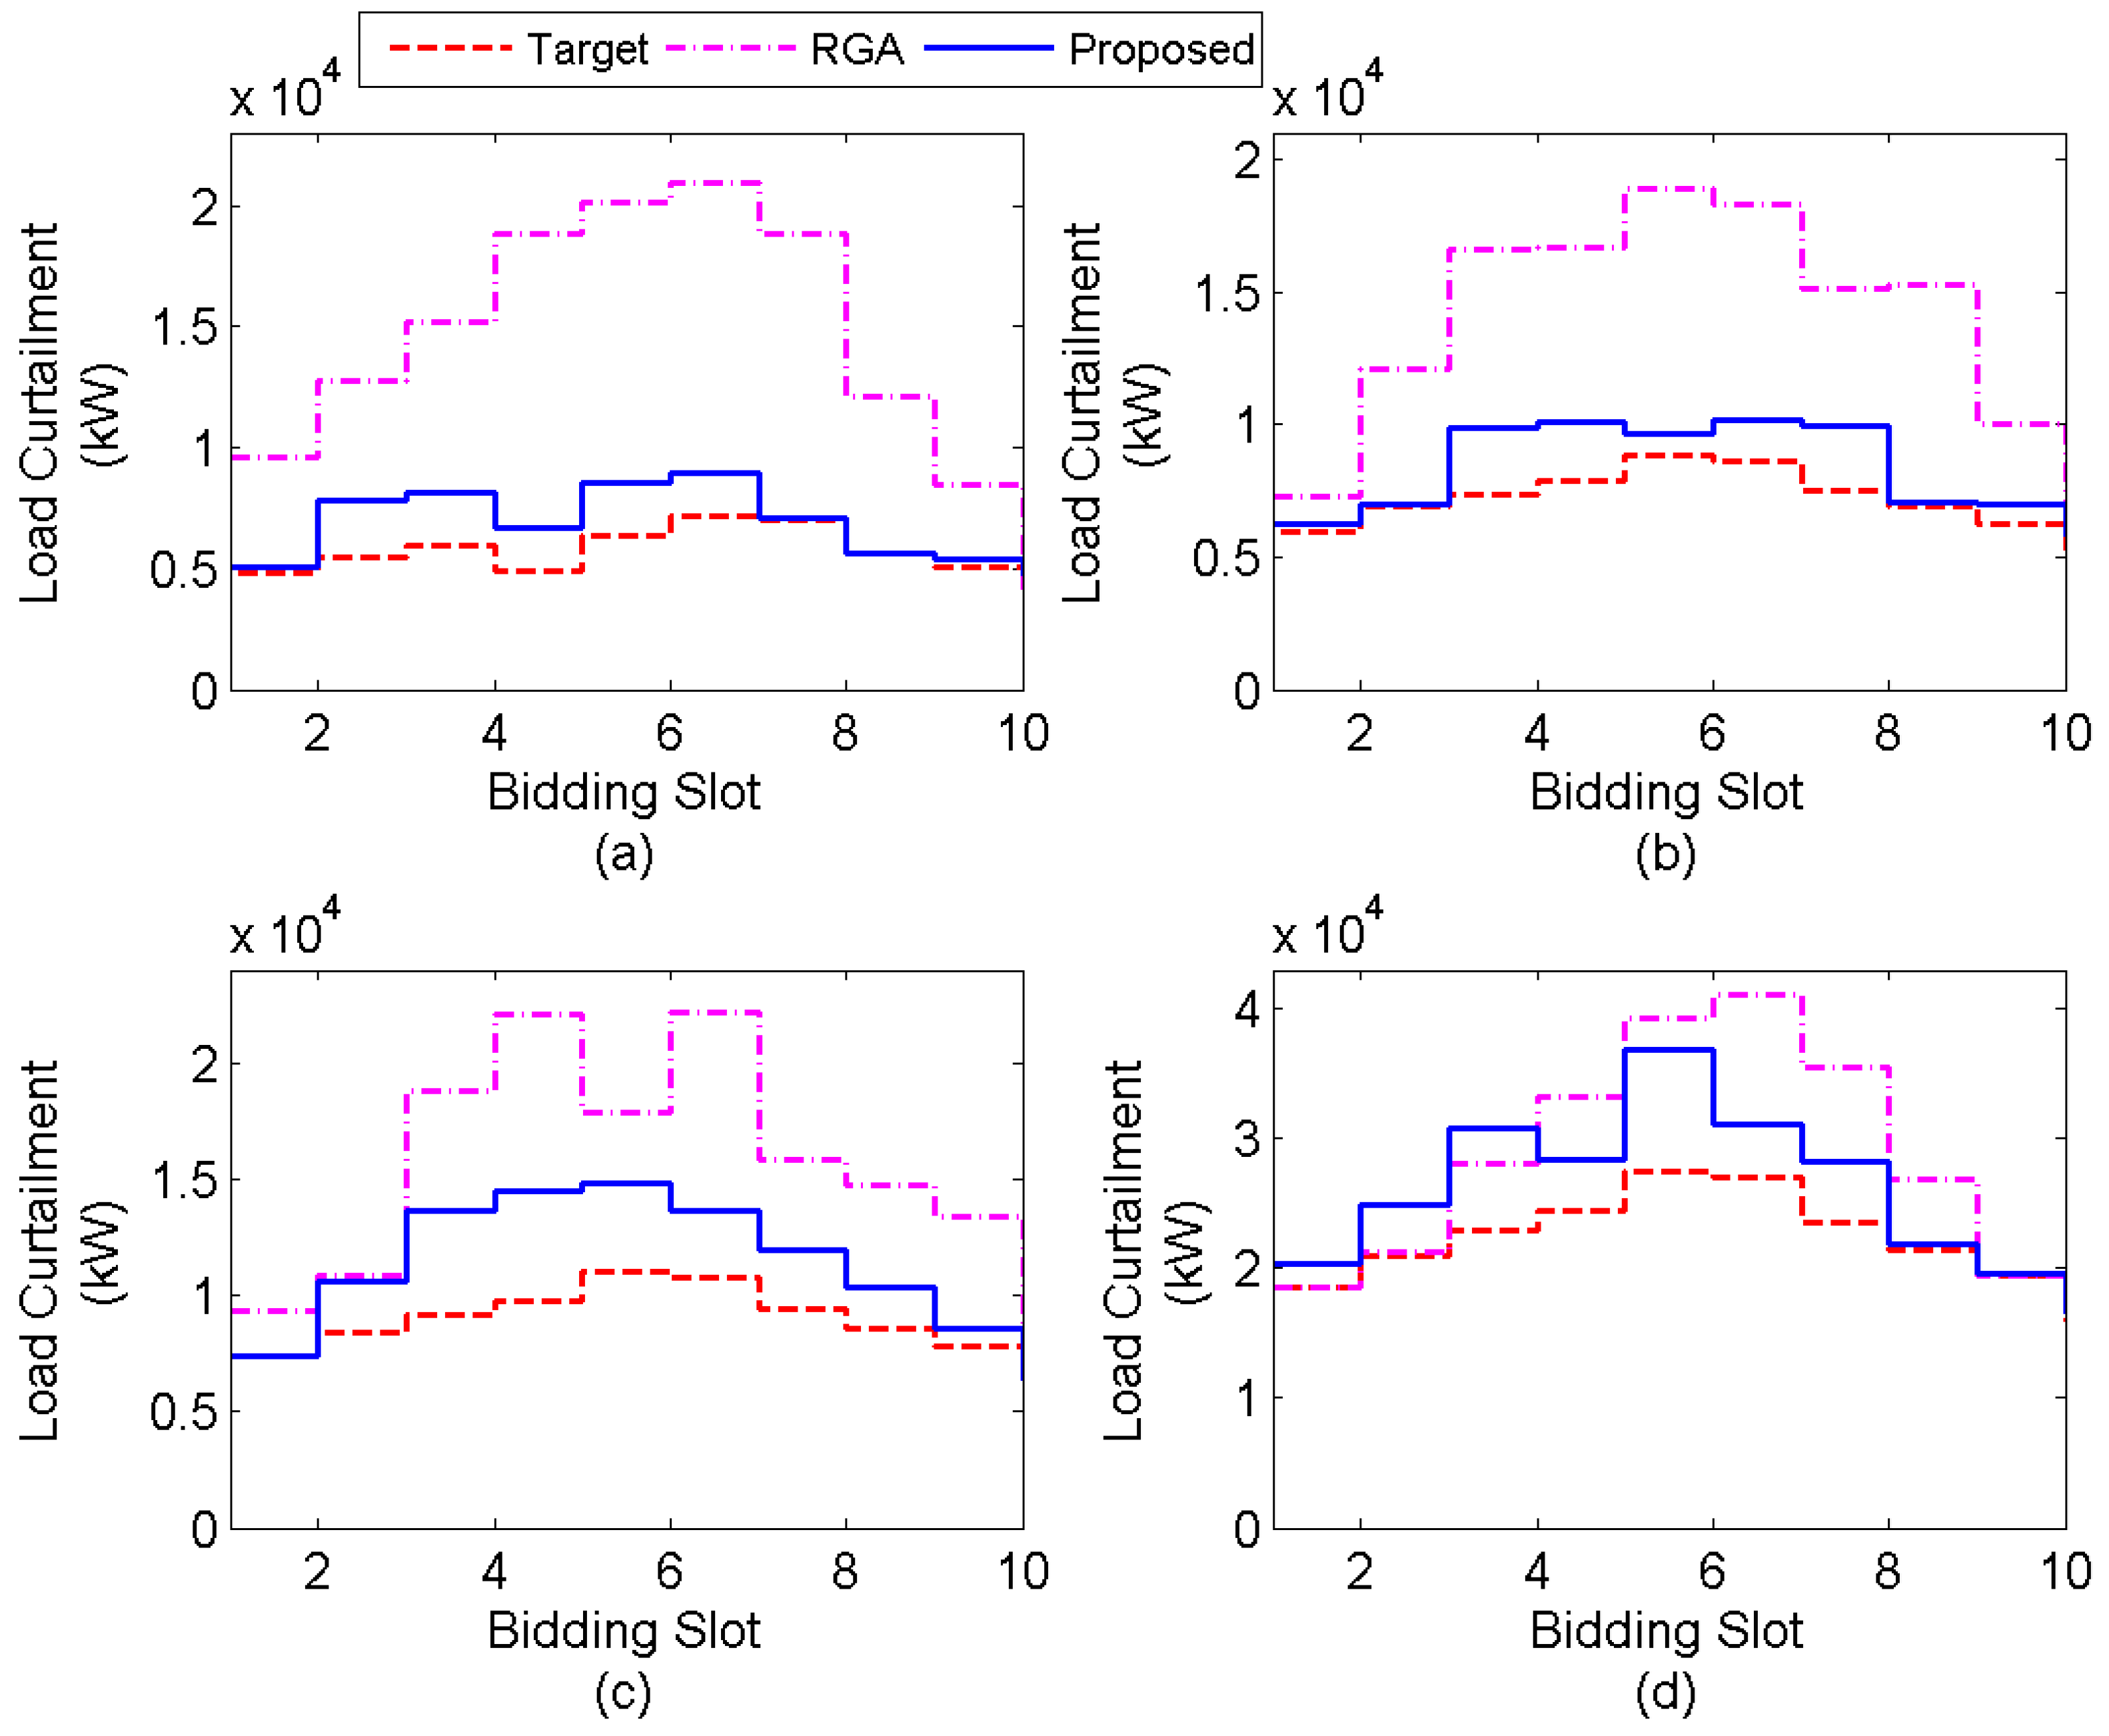
The proposed purchase optimization scheme is evaluated further under different use rates. Let be the use rate considered when the target load curtailment profile in Table 2 is used for demand bidding. Please note that this use rate can be increased further by multiplying in Table 2 with different factors. The simulation results in Table 6 shows that the proposed method outperforms RGA by consistently producing the lower values of and for different use rates. The actual target load curtailment profiles produced by the proposed method in Figure 7 are also closer to the target profiles than those of RGA at majority of the bidding slots, suggesting that the proposed work is less susceptible to the excessive load curtailment issue under different scenarios of use rate.
Some observations can be highlighted from the simulation results obtained in Table 6 and Figure 7. A significant performance deviation between the proposed method and RGA can be observed when the use rates are relatively low (e.g.,, , and ). The aggregated demand reduction promised by all participated customers in these scenarios is much higher than that of target load curtailment, implying that majority of the submitted input load curtailments bids needs to be declined in order to avoid excessive load curtailment. For RGA that are not equipped with the adaptive bid declination scheme as described in (23)–(24), it is difficult to achieve the crossover results of leading to via the crossover operation defined in (21)–(22). On the other hand, the proposed method is able to decline the input bids of the customers with a relatively high probability of v under the low use rate scenarios according to (24). This explains the significant outperformance of the proposed method against the RGA (in terms of and ) at the use rates of , , and . When the use rate is increased further to , smaller performance differences between the proposed method and RGA are observed. In this higher use rate scenario, the probability v assigned to the proposed method becomes much smaller according to (23)–(24). In other words, the adaptive bid declination scheme designed in the proposed method has smaller influence because most of the total demand reduction promised by the customers need to be accepted in order to satisfy the target load curtailment. This justifies the relatively similar performance delivered by both of the proposed method and RGA under the higher use rate scenarios.
5. Conclusions
A closed demand bidding model is considered in this paper to facilitate the internal trading of load curtailment between an aggregator and its customers. The proposed work is different with most existing demand bidding models because the latter focused on the interaction between the aggregator and different entities of electricity market (e.g., TSO, distributor and retailer) at upper level to optimize the DR supply curve and market clearing prices. By considering the unique load curtailment patterns of different customers, a purchase optimization scheme is designed to determine the optimal combination of aggregated load curtailment bids and optimal purchase price, aiming to minimize the total bidding cost. A modified genetic algorithm (MGA) incorporated with a delicate gene encoding scheme and an adaptive search mechanism is then proposed to solve the highly nonlinear demand bidding problem efficiently without requiring to linearize the objective function or constraints. Extensive simulations show that the optimal purchase price determined by the proposed purchase optimization scheme via MGA is different in every bidding slot and at least 20% lower than the average bidding prices offered by the customers. This implies the promising performance of proposed method in minimizing the total bidding cost. Furthermore, the computational overhead incurred by the proposed method is low and hence it is suitable for real applications.
Some notable values of the work proposed in this paper are explained as follows. First, it provides an immediate solution for aggregator to deliver its promised load curtailment by establishing a platform to interact with its customers at lower level after the aggregator receives the target load curtailment profiles and clearing prices from the electricity market at upper level. Second, the closed demand bidding model and the information exchange mechanism between seller (i.e., customers) and buyer (i.e., aggregator) are designed to be straightforward and can be easily provided so that the proposed model can be easily deployed for the real application in the field. Third, the proposed purchase optimization scheme is also suitable to be implemented for the utility companies operate in the regulated electricity market in order to maintain the reliability of power system when significant stress conditions are foreseen. For future works, more practical constraints such as regional dispatch constraints can be incorporated between the aggregator and its customers to produce a more realistic demand bidding model that can simulate the practical scenarios better. The penalty mechanisms to be imposed when customers deliver significantly lesser or significantly greater load curtailment than they have promised is another promising direction to extend the current work. Finally, a more comprehensive demand bidding framework can be developed by formulating the purchase optimization scheme as a multi-objective optimization problem. Different objective functions such as comfort level of customers in performing load curtailment can be explored in the multi-objective optimization framework.
Author Contributions
Conceptualization, L.Y.; Methodology, L.Y. and W.H.L.; Software, W.H.L. and S.S.T.; Validation, T.H.T. and C.H.W.; Formal Analysis, T.H.T., C.H.W. and J.W.P.; Writing-Original Draft Preparation, L.Y. and W.H.L.; Writing-Review & Editing, S.S.T., C.H.W. and T.H.T.; Visualization, J.W.P. Supervision, L.Y.
Funding
This work was funded by the Ministry of Science and Technology, Taiwan, R.O.C, under Grant MOST 106-2221-E-027-089.
Conflicts of Interest
The authors declare no conflict of interest.
Nomenclature
| Acronyms | |
| DR | Demand response |
| DRX | Demand response exchange |
| EV | Electric vehicle |
| ISO | Independent system operator |
| LMP | Locational marginal prices |
| LSE | Load service entity |
| MGA | Modified genetic algorithm |
| MILP | Mixed-integer linear programming |
| RGA | Regular genetic algorithm |
| TSO | Transmission system operator |
| Indices and Sets | |
| n | Index of a customer participates in a demand bidding event |
| l | Index of each possible combination of load shedding pattern |
| j | Index of chromosome |
| k | Index of generation |
| Set containing the overall optimal purchase status in a demand bidding event | |
| Set containing the indices of all possible combinations of load shedding patterns in a demand bidding event | |
| Set containing the indices of all possible combinations of load shedding patterns for the n-th customer | |
| Operators | |
| An operator that returns true if the operand is 1 and false if the operand is 0 | |
| An operator that returns 1 if the operand is true and 0 is the operand is false | |
| An operator that returns the sequence number of load shedding pattern based on gene value | |
| An operator that returns a set containing the possible load shedding patterns of customer based on their available time to perform load shedding | |
| An operator that returns a set containing the purchase status of a customer based on the load shedding pattern encoded in the gene | |
| An rounding operator that returns the result an as integer | |
| Parameters and Variables | |
| N | Number of customers participate in a demand bidding event |
| Maximum load shedding capacity of the n-th customer | |
| Minimum load shedding period of the n-th customer | |
| Beginning time of a demand bidding event | |
| Completion time of a demand bidding event | |
| Maximum purchase price per kWh of load curtailment | |
| Deadline for customer to respond their participation in a demand bidding event | |
| M | Number of time slots available for demand bidding |
| Suitable time for the n-th customer to start load shedding | |
| Suitable time for the n-th customer to end load shedding | |
| , | Quantity of load shedding offered by the n-th customer at each m-th time slot |
| , | Selling price per kWh of load shedding offered by the n-th customer at each m-th time slot |
| Integer index to indicate the start time of n-th customer for load shedding | |
| Integer index to indicate the end time of n-th customer for load shedding | |
| Purchase status for the bids offered by the n-th customer at the m-th time slot | |
| Target load curtailment profile at the m-th time slot | |
| Optimized purchase status for the bids offered by the n-th customer at the m-th time slot | |
| L | Total number of possible combination of load shedding among M time slots |
| Time slots for potential load curtailment of n-th customer | |
| Total number of possible combination of load shedding for the n-th customer among time slot | |
| Gene used to encode the possible load shedding patterns of n-th customer | |
| A chromosome used to encode the possible load shedding patterns of all customer | |
| F | Fitness function value |
| Minimum fitness value at the k-th generation | |
| Maximum fitness value at the k-th generation | |
| Penalty factor | |
| Violation of target load curtailment produced at the m-th time slot | |
| Average price offered by all participated customers | |
| A constant with value greater than 1 | |
| q | Percentage of fittest chromosomes to be selected as parent chromosomes |
| Use rate of total demand reduction promised by all customers | |
| Maximum use rate | |
| Minimum use rate | |
| b | A random number with uniform distribution between 0 and 1 |
| Probability of not selecting customers for load curtailment | |
| Maximum probability of not selecting customer for load curtailment | |
| Minimum probability of not selecting customer for load curtailment | |
| Mutation probability | |
| A random number used to perturb the crossover result of n-th gene | |
| Threshold value used to trigger the extinction and immigration mechanism | |
| Threshold value used to terminate the search process of genetic algorithm | |
| Maximum generation number to allow for no improvement in population diversity before triggering the extinction and immigration mechanism | |
| Maximum generation number to allow for no fitness improvement of best chromosome before terminating the search process of genetic algorithm | |
| Actual number of bidding slots purchased by the aggregator from each n-th customer | |
| Actual load shedding produced by all selected customers at the m-th time slot | |
| Absolute deviation between the target and actual load shedding produced at the m-th time slot | |
| Average load curtailment difference between the actual quantity of load shedding and the target load curtailment during demand bidding | |
| Average bidding price per unit load curtailment submitted by all customer at the m-th time slot | |
| Optimal purchase price per unit load curtailment determined at the m-th time slot | |
| Total bidding cost incurred by the aggregator to satisfy the target load curtailment in demand bidding | |
| Computation time required to solve the demand bidding optimization problem | |
References
- Lai, L.L. Power System Restructuring and Deregulation: Trading, Performance and Information Technology; Wiley: New York, NY, USA, 2002. [Google Scholar]
- Deng, S.; Oren, S.S. Electricity derivatives and risk management. Energy 2006, 31, 940–953. [Google Scholar] [CrossRef]
- Fleten, S.S.; Pettersen, E. Constructing bidding curves for a price-taking retailer in the Norwegian electricity market. IEEE Trans. Power Syst. 2005, 20, 701–708. [Google Scholar] [CrossRef]
- Philpott, A.B.; Pettersen, E. Optimizing demand-side bids in day-ahead electricity markets. IEEE Trans. Power Syst. 2006, 21, 488–498. [Google Scholar] [CrossRef]
- Herranz, R.; Roque, A.M.S.; Campos, F.A. Optimal demand-side bidding strategies in electricity spot markets. IEEE Trans. Power Syst. 2012, 27, 1204–1213. [Google Scholar] [CrossRef]
- Ramachandra, B.; Srivastava, S.K.; Edrington, C.S.; Cartes, D.A. An intelligent auction scheme for smart grid market using a hybrid immune algorithm. IEEE Trans. Ind. Electron. 2011, 58, 4603–4612. [Google Scholar] [CrossRef]
- Weare, C. The California Electricity Crisis: Causes and Policy Options; Public Policy Institute of California: San Francisco, CA, USA, 2003. [Google Scholar]
- Benefits of Demand Response in Electricity Markets and Recommendations for Achieving Them. Available online: https://emp.lbl.gov/sites/all/files/report-lbnl-1252d.pdf (accessed on 1 June 2018).
- Sezgen, O.; Goldman, C.A.; Krishnarao, P. Option value of electricity demand response. Energy 2007, 32, 108–119. [Google Scholar] [CrossRef] [Green Version]
- Kirschen, D.S. Demand-side view of electricity markets. IEEE Trans. Power Syst. 2003, 18, 520–527. [Google Scholar] [CrossRef]
- Yao, L.; Yao, L.; Lim, W.H. A soft curtailment of wide-area central air conditioning load. Energies 2018, 11, 492. [Google Scholar] [CrossRef]
- Yao, L.; Chou, Y.C.; Lin, C.C. Scheduling of direct load control using genetic programming. Int. J. Innov. Comput. I 2011, 7, 2515–2528. [Google Scholar]
- Rahimi, F.; Ipakchi, A. Demand response as a market resource under the smart grid paradigm. IEEE Trans. Smart Grid 2010, 1, 82–88. [Google Scholar] [CrossRef]
- Demand Response Compensation in Organized Wholesale Energy Markets. Available online: https://www.ferc.gov/EventCalendar/Files/20110315105757-RM10-17-000.pdf (accessed on 1 June 2018).
- Wholesale Competition in Regions with Organized Electric Markets. Available online: https://www.ferc.gov/whats-new/comm-meet/2008/101608/E-1.pdf (accessed on 1 June 2018).
- Vaya, M.G.; Andersson, G. Optimal bidding strategy of a plug-in electric vehicle aggregator in day-ahead electricity markets under uncertainty. IEEE Trans. Power Syst. 2015, 30, 2375–2385. [Google Scholar] [CrossRef]
- Mohsenian-Rad, H. Optimal demand bidding for time-shiftable loads. IEEE Trans. Power Syst. 2015, 30, 939–951. [Google Scholar] [CrossRef]
- Menniti, D.; Costanzo, F.; Scordino, N.; Sorrentino, N. Purchase-bidding strategies of an energy coalition with demand-response capabilities. IEEE Trans. Power Syst. 2009, 24, 1241–1255. [Google Scholar] [CrossRef]
- Nojayan, S.; Mohammadi-Ivatloo, B.; Zare, K. Optimal bidding strategy of electricity retailers using robust optimization approach considering time-of-use rate demand response programs under market price uncertainties. IET Gener. Transm. Distrib. 2015, 9, 328–338. [Google Scholar] [CrossRef]
- Wu, L. Impact of price-based demand response on market clearing and locational marginal prices. IET Gener. Transm. Distrib. 2013, 7, 1087–1095. [Google Scholar] [CrossRef]
- Liu, G.; Xu, Lu.; Tomsovic, K. Bidding strategy for microgrid in day-ahead market based on hybrid stochastic/robust optimization. IEEE Trans. Smart Grid. 2016, 7, 227–237. [Google Scholar] [CrossRef]
- Rahman, M.N.; Arefi, A.; Shafiullah, G.; Hettiwatte, S. A new approach to voltage management in unbalanced low voltage using demand response and OLTC considering consumer preference. Int. J. Electr. Power 2018, 99, 11–27. [Google Scholar] [CrossRef]
- Russell, M.; Sun, Z.; Dagli, C.H. Reward/penalty design in demand response for mitigating overgeneration considering the benefits from both manufacturers and utility company. Procedia Comput. Sci. 2017, 114, 425–432. [Google Scholar]
- Parvania, M.; Fotuhi-Firuzabad, M. Integrating load reduction into wholesale energy market with application to wind power integration. IEEE Syst. J. 2012, 6, 35–45. [Google Scholar] [CrossRef]
- Parvania, M.; Fotuhi-Firuzabad, M.; Shahidehpour, M. ISO’s optimal strategies for scheduling the hourly demand response in day-ahead markets. IEEE Trans. Power Syst. 2014, 29, 2636–2645. [Google Scholar] [CrossRef]
- Nguyen, D.T. Demand response for domestic and small business consumers: A new challenge. In Proceedings of the 2010 IEEE PES Transmission and Distribution Conference and Exposition, New Orleans, LA, USA, 19–22 April 2010. [Google Scholar]
- Nguyen, D.T.; Negnevitsky, M.; Groot, M.D. Pool-based demand response exchange-concept and modeling. IEEE Trans. Power Syst. 2011, 26, 1677–1685. [Google Scholar] [CrossRef]
- Nguyen, D.T.; Negnevitsky, M.; Groot, M.D. Walrasian market clearing for demand response exchange. IEEE Trans. Power Syst. 2012, 27, 535–544. [Google Scholar] [CrossRef]
- Gkatzikis, L.; Koutsopoulos, I.; Salonidis, T. The role of aggregators in smart grid demand response markets. IEEE J. Sel. Areas Commun. 2013, 31, 1247–1257. [Google Scholar] [CrossRef]
- Pop, C.; Ciora, T.; Antal, M.; Angel, I.; Salomie, I.; Bertoncini, M. Bloackchain based decentralized management of demand response programs in smart energy grids. Sens. 2018, 18, 162. [Google Scholar] [CrossRef] [PubMed]
- Yao, L.; Lim, W.H. Optimal purchase strategy for demand bidding. IEEE Trans. Power Syst. 2018, 33, 2754–2762. [Google Scholar] [CrossRef]
- Bahrami, S.; Hadi Amini, A.; Shafie-khah, M.; Catalão, J.P.S. A decentralized electricity market scheme enabling demand response deployment. IEEE Trans. Power Syst. 2018, 33, 4218–4227. [Google Scholar] [CrossRef]
- Energy & Ancillary Services Market Operations. Available online: http://www.pjm.com/-/media/documents/manuals/archive/m11/m11v87-energy-and-ancillary-services-market-operations-03-23-2017.ashx (accessed on 10 June 2018).
Figure 1.
Flowcharts used to describe (a) the mechanisms of demand bidding between an aggregator and all customers under its service regions and (b) the GA-based purchase optimization scheme used to determine the optimal purchase status of all customers.
Figure 1.
Flowcharts used to describe (a) the mechanisms of demand bidding between an aggregator and all customers under its service regions and (b) the GA-based purchase optimization scheme used to determine the optimal purchase status of all customers.

Figure 2.
The amount of load curtailment bid by ten randomly selected customers at each bidding slot for case 2 of demand bidding with M = 10.
Figure 2.
The amount of load curtailment bid by ten randomly selected customers at each bidding slot for case 2 of demand bidding with M = 10.

Figure 3.
The bidding price per kWh offered by ten randomly selected customers at each bidding slot for case 2 of demand bidding with M = 10.
Figure 3.
The bidding price per kWh offered by ten randomly selected customers at each bidding slot for case 2 of demand bidding with M = 10.

Figure 4.
The input load curtailment bids submitted by ten randomly selected customers and the output purchase status computed by the proposed method.
Figure 4.
The input load curtailment bids submitted by ten randomly selected customers and the output purchase status computed by the proposed method.

Figure 5.
The actual load curtailment profiles produced by both compared methods with respect to the target profile in (a) case 1 and (b) case 2 of demand bidding.
Figure 5.
The actual load curtailment profiles produced by both compared methods with respect to the target profile in (a) case 1 and (b) case 2 of demand bidding.

Figure 6.
Comparison between the averages offered price per unit load curtailment and optimal purchase prices per unit load curtailment at every bidding slot in the (a) case 1 and (b) case 2 of demand bidding.
Figure 6.
Comparison between the averages offered price per unit load curtailment and optimal purchase prices per unit load curtailment at every bidding slot in the (a) case 1 and (b) case 2 of demand bidding.


Figure 7.
The actual load curtailment profiles produced by both compared methods with respect to the target profile under the use rates of (a) 1.3, (b) 1.6, (c) 2.0, and (d) 5.0.
Figure 7.
The actual load curtailment profiles produced by both compared methods with respect to the target profile under the use rates of (a) 1.3, (b) 1.6, (c) 2.0, and (d) 5.0.


Table 1.
Possible combinations of 0, 1, 2, …, M connected time slots for M = 5.
| Index | Slot 1 (13:00) | Slot 2 (14:00) | Slot 3 (15:00) | Slot 4 (16:00) | Slot 5 (17:00) |
|---|---|---|---|---|---|
| 0 | hi1 = 0 | hi2 = 0 | hi3 = 0 | hi4 = 0 | hi5 = 0 |
| 1 | hi1 = 1 | hi2 = 0 | hi3 = 0 | hi4 = 0 | hi5 = 0 |
| 2 | hi1 = 0 | hi2 = 1 | hi3 = 0 | hi4 = 0 | hi5 = 0 |
| 3 | hi1 = 0 | hi2 = 0 | hi3 = 1 | hi4 = 0 | hi5 = 0 |
| 4 | hi1 = 0 | hi2 = 0 | hi3 = 0 | hi4 = 1 | hi5 = 0 |
| 5 | hi1 = 0 | hi2 = 0 | hi3 = 0 | hi4 = 0 | hi5 = 1 |
| 6 | hi1 = 1 | hi2 = 1 | hi3 = 0 | hi4 = 0 | hi5 = 0 |
| 7 | hi1 = 0 | hi2 = 1 | hi3 = 1 | hi4 = 0 | hi5 = 0 |
| 8 | hi1 = 0 | hi2 = 0 | hi3 = 1 | hi4 = 1 | hi5 = 0 |
| 9 | hi1 = 0 | hi2 = 0 | hi3 = 0 | hi4 = 1 | hi5 = 1 |
| 10 | hi1 = 1 | hi2 = 1 | hi3 = 1 | hi4 = 0 | hi5 = 0 |
| 11 | hi1 = 0 | hi2 = 1 | hi3 = 1 | hi4 = 1 | hi5 = 0 |
| 12 | hi1 = 0 | hi2 = 0 | hi3 = 1 | hi4 = 1 | hi5 = 1 |
| 13 | hi1 = 1 | hi2 = 1 | hi3 = 1 | hi4 = 1 | hi5 = 0 |
| 14 | hi1 = 0 | hi2 = 1 | hi3 = 1 | hi4 = 1 | hi5 = 1 |
| 15 | hi1 = 1 | hi2 = 1 | hi3 = 1 | hi4 = 1 | hi5 = 1 |
Coloring in Table 1 denotes the possible continuous time intervals selected for load curtailment.
Table 2.
Target load curtailment profiles for two cases of demand bidding.
| Bidding Slot | Target Load Curtailment | |
|---|---|---|
| Case 1 | Case 2 | |
| 1 | 1500 | 3700 |
| 2 | 2200 | 4200 |
| 3 | 3500 | 4600 |
| 4 | 2900 | 4900 |
| 5 | 2500 | 5500 |
| 6 | - | 5400 |
| 7 | - | 4700 |
| 8 | - | 4300 |
| 9 | - | 3900 |
| 10 | - | 3200 |
Table 3.
Comparison of the average load difference produced by all compared methods.
| Average Load Curtailment Difference, (kW) | ||
|---|---|---|
| RGA | Proposed | |
| Case 1 | 1814.5 | 163.0 |
| Case 2 | 9067.9 | 810.8 |
Table 4.
Comparison of the total bidding cost produced by all compared methods.
| Total Bidding Cost, (NTD’000) | ||
|---|---|---|
| RGA | Proposed | |
| Case 1 | 1253 | 330 |
| Case 2 | 3294 | 520 |
Table 5.
Comparison of the computational time incurred by all compared methods.
| Computational Time, (s) | ||
|---|---|---|
| RGA | Proposed | |
| Case 1 | 23.44 | 24.93 |
| Case 2 | 63.49 | 68.96 |
Table 6.
Performance comparisons of all compared methods under different use rates for case 2 of demand bidding.
Table 6.
Performance comparisons of all compared methods under different use rates for case 2 of demand bidding.
| Use Rate | RGA | Proposed | ||
|---|---|---|---|---|
| (kW) | (NTD’000) | (kW) | (NTD’000) | |
| 8128.2 | 3389 | 1179.6 | 1681 | |
| 6530.1 | 3323 | 1158.8 | 2043 | |
| 6275.8 | 3711 | 2311.5 | 2767 | |
| 6023.4 | 4209 | 3535.8 | 3562 | |
| 5772.1 | 6941 | 3662.4 | 6412 | |
© 2018 by the authors. Licensee MDPI, Basel, Switzerland. This article is an open access article distributed under the terms and conditions of the Creative Commons Attribution (CC BY) license (http://creativecommons.org/licenses/by/4.0/).
Share and Cite
MDPI and ACS Style
Yao, L.; Lim, W.H.; Tiang, S.S.; Tan, T.H.; Wong, C.H.; Pang, J.Y. Demand Bidding Optimization for an Aggregator with a Genetic Algorithm. Energies 2018, 11, 2498. https://0-doi-org.brum.beds.ac.uk/10.3390/en11102498
AMA Style
Yao L, Lim WH, Tiang SS, Tan TH, Wong CH, Pang JY. Demand Bidding Optimization for an Aggregator with a Genetic Algorithm. Energies. 2018; 11(10):2498. https://0-doi-org.brum.beds.ac.uk/10.3390/en11102498
Chicago/Turabian StyleYao, Leehter, Wei Hong Lim, Sew Sun Tiang, Teng Hwang Tan, Chin Hong Wong, and Jia Yew Pang. 2018. "Demand Bidding Optimization for an Aggregator with a Genetic Algorithm" Energies 11, no. 10: 2498. https://0-doi-org.brum.beds.ac.uk/10.3390/en11102498
Note that from the first issue of 2016, this journal uses article numbers instead of page numbers. See further details here.