Article

Short-Term Electric Power Forecasting Using Dual-Stage Hierarchical Wavelet- Particle Swarm Optimization- Adaptive Neuro-Fuzzy Inference System PSO-ANFIS Approach Based On Climate Change

1
Center for Modern Information Management, School of Management, Huazhong University of Science and Technology, Wuhan 430074, China
2
Center for Big Data Analytics, Jiangxi University of Engineering, Xinyu 338000, China
3
Department of Geomatic Engineering, University of Mines and Technology, Tarkwa 00233, Ghana
4
Faculty of Earth Resources, China University of Geosciences, Wuhan 430074, China
5
Central China Branch, State Grid Corporation of China, Wuhan 430077, China
*
Author to whom correspondence should be addressed.
Submission received: 15 September 2018 / Revised: 5 October 2018 / Accepted: 17 October 2018 / Published: 19 October 2018

Abstract

:
Analyzing electrical power generation for a wind turbine has associated inaccuracies due to fluctuations in environmental factors, mechanical alterations of wind turbines, and natural disaster. Thus, development of a highly reliable prediction model based on climatic conditions is crucial in forecasting electrical power for proper management of energy demand and supply. This is essential because early forecasting systems will enable an energy supplier to schedule and manage resources efficiently. In this research, we have put forward a novel electrical power prediction model using wavelet and particle swarm optimization based dual-stage adaptive neuro-fuzzy inference system (dual-stage Wavelet-PSO-ANFIS) for precise estimation of electrical power generation based on climatic factors. The first stage is used to project wind speed based on meteorological data available, while the second stage took the output wind speed prediction to predict electrical power based on actual supervisory control and data acquisition (SCADA). Furthermore, influence of data dependence on the forecasting accuracy for both stages is analyzed using a subset of data as input to predict the wind power which was also compared with other existing electrical power forecasting techniques. This paper defines the basic framework and the performance evaluation of a dual-stage Wavelet-PSO-ANFIS based electrical power forecasting system using a practical implementation.

1. Introduction

The use of green energy sources has grown since the realization of environmental concerns and subsequently the Kyoto protocol and its commitments have further encouraged the use of green energy sources. Wind energy is among the leading alternate clean energy sources after hydropower source. However, accurate forecasting of wind energy for electrical power generation farm is very complex because of continuous fluctuations in climatic conditions such as wind speed, humidity, temperature and so forth, thus making electrical power generation a stochastic process [1]. Such fluctuations in output power may cause financial and operational risks for energy suppliers as any estimation error in power generation ultimately affects the bottom line of an energy provider. Hence, there is always a need for an efficient and reliable electrical power prediction system that has the capability to predict short-term fluctuations in power using pre-existing or historical data. Such a system will be helpful in providing a tool to wind energy producers for prediction of electrical power, proper planning and management for any implications ahead. Moreover, the wind energy prediction system will help in demand based metering where smart grids may interact with the wind-farms and their forecasted data may be used for estimating energy prices.
Because of the significance of predicting the wind electrical power and wind speed, several models have been proposed in literature over the last decade. For example, the existing prediction approaches include but is not limited to physical, statistical and time series models [2,3,4,5,6], Fuzzy inference systems [6,7], artificial intelligence techniques such as artificial neural network (ANN) and support vector machines (SVMs) [8,9,10,11,12,13,14], Gaussian Process Regression [15], Kalman Filter models [16] and hybrid optimization models [17,18,19]. Review of these research works revealed that the models were formulated on the basis of experience gained and historical data compiled from wind energy farms to determine the functional non-linear relationship between the wind energy generated and the influencing climatic factors. However, due to uncertainties (e.g., errors, data scarcity, human interference and subjective judgment) in the model fit and volatility of the data, scholars have resorted to the use of denoising techniques. Authors, for example, Catalão et al. [13] applied wavelet transform in combination with ANN to predict wind power. Similarly, Sideratos [15] and Louka et al. [16] applied Gaussian process and Kalman filter to forecast wind power. These denoising techniques have the ability to model to a greater extent the volatility in the data thereby reducing the noise component exhibited in the data. Hence, non-stationarity in the data which could lead to wrong model coefficients leading to inaccurate predictions can be made stationary to improve the prediction accuracy of the model. Additionally, the hybrid models such as PSO-ANFIS [17] which has been applied to predict electrical power with satisfactory results does not take into account the filtering of the data to eliminate any outliers. The objective of such techniques only minimizes the human interference in the model formulation. In the case of Wavelet-ANN [13], only the denoising aspect of the data was considered. The limitations in the ANN (e.g., slower computation speed due to gradient algorithms, manual setting of parameters, local minima realization) model formulation steps were not. These limit the predictive strength of the hybrid models that suggest its enhancement. In continuance of that, although extensive research works have been accomplished over the past few years, accurate monitoring and prediction of short-term wind energy power still threatens electrical energy generation operations all around the world. The explanation of this situation is based on empirical analysis and results reported in literature which still requires the need to improve the model to fit correctly to the pre-existing data.
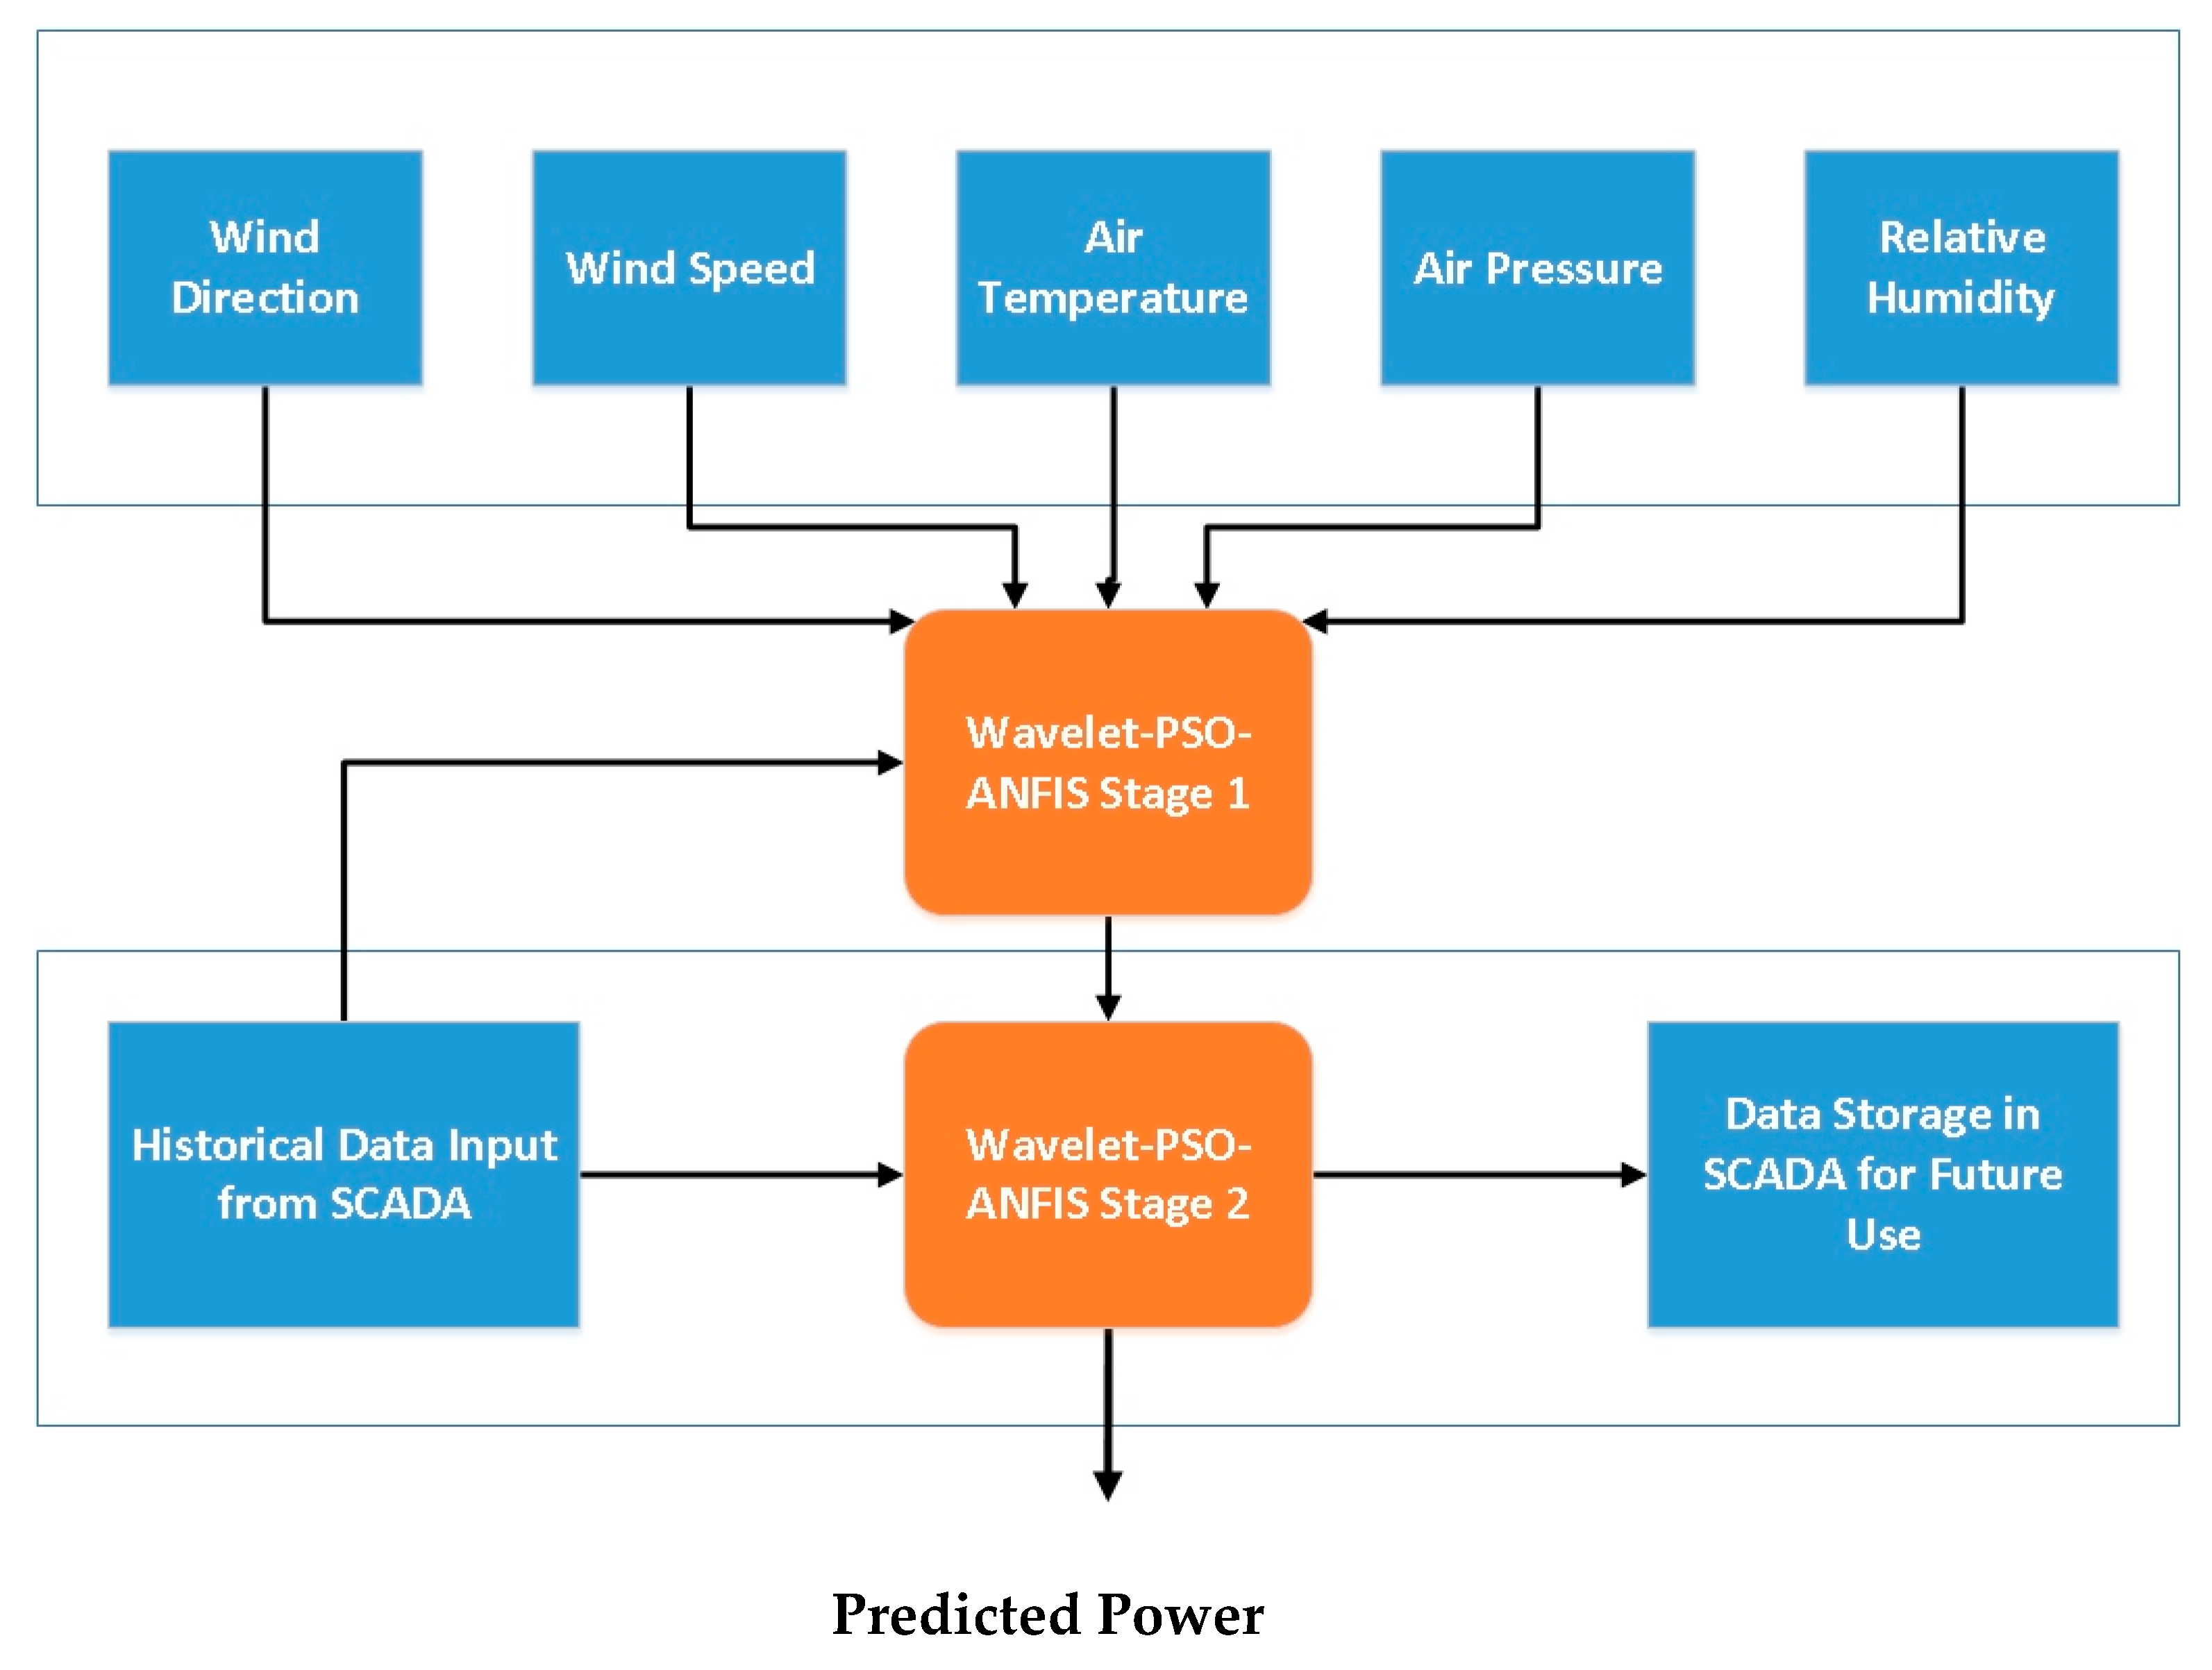
In the light of the foregoing discussions, we propose a hybrid Wavelet based PSO-ANFIS method for forecasting wind electrical power. The proposed model is a two-staged sequential mode prediction technique based on ANFIS in combination with wavelet transform-PSO as cost optimizer. The basic concept is to use PSO to improve the input constraints of the membership functions in the fuzzy domain while achieving a low error rate at the same time. Here, the wavelet transform was introduced as a pre-processing decomposition technology that was used to decompose the data into time and frequency domain thereby reducing the noise in the data as well as achieving stationarity. This stationarity is important because of the time series nature of the data used in the modelling. Another essence of using the wavelet was motivated by the fact that over the years, wavelet transform has shown a very good effect on data preprocessing than the Fourier transform. This is because the Fourier transform is most suitable for stationary data and can only provide zero frequency and high frequency resolution. Hence, for wavelet transform, there is little to no loss of information in the data used.
With regards to the above, the first stage used the wind direction, temperature, humidity and air pressure as the input data to predict the wind speed (output). At the second stage, the output predicted results (wind speed) from the first stage was used as the input data here to predict the actual electrical power from the SCADA. That is, actual historical electrical power measurements taken from SCADA and forecasted wind speed from stage one is used to train Wavelet-PSO-ANFIS model thus predicting a 24h electrical power. It must be noted that the SCADA measurements are taken as actual wind speed to wind power conversion and thus the prediction error is minimized by using actual wind speed to power data for a particular wind farm.
In view of this, the accuracy analysis was performed by analyzing the results using the mean absolute percentage error (MAPE) criterion of the five existing algorithms including, Double-stage ANFIS (DSA), DSHGN (double-stage hybrid neural network combined with genetic algorithm), DSHGA (double-stage hybrid genetic algorithm with ANFIS), DSHPN (double-stage PSO and neural network), and DSN (double-stage neural network) with the developed algorithm in this paper, that is, DSHWPA (Dual-stage hybrid wavelet PSO ANFIS).
The results indicate that the proposed approach is more efficient, accurate, less computational time and low computational power requirements. Furthermore, the results suggest that the implemented Wavelet-PSO-ANFIS model can be helpful in managing wind power in energy supply industries using site specific data and therefore, capturing the volatility in the data in a more efficient way than the other methods reported in literature.
The paper unfolds as follows in a standard format where the first section is an introduction and background of the research. The development and description of the proposed method and various implications involved in the development of this model are presented in Section 2. Section 3 and Section 4 summarizes the evaluation methods that are currently used to establish the basic parameters of a short-term wind electric power prediction model while Section 5 shows the actual implementation of the proposed dual stage hybrid Wavelet-PSO-ANFIS model in a case study where sample data was available for various days of a wind farm. Section 6 shows the accuracy analysis performed by analyzing the results in comparison with five other techniques such as Double-stage ANFIS (DSA), DSHGN (double-stage hybrid neural network combined with genetic algorithm), DSHGA (double-stage hybrid genetic algorithm with ANFIS), DSHPN (double-stage PSO and neural network), and DSN (double-stage neural network) with the developed algorithm in this paper, that is, DSHWPA (Dual-stage hybrid wavelet PSO ANFIS). Section 7 summarizes our research and provides an overview of the prediction method, results and future recommendations. Reference section enlists a detailed list of cited sources in this research while raw data from the analysis are shown in appendices.

2. Forecasting Model

This section describes the proposed hybrid Wavelet-PSO based ANFIS forecasting model and its basic development requirements in the sub-sections below.

2.1. Proposed Strategy for Forecasting

In this paper, a wind electric power forecasting model based on 2-stage Wavelet-PSO-ANFIS approach is outlined. The input parameters of the forecasting systems are from real-time SCADA and forecasted meteorological data which is used to train the Wavelet-PSO-ANFIS model using historical data and later a full day wind electric power forecast is obtained using the model. For the purpose of testing the model actual Numerical Weather Prediction (NWP) forecasted data location and altitude of the wind farm were used to train the first stage while SCADA based real-time data of wind speed was used to train the second stage of the model. As implemented by Catalao, Pousinho, and Mendes [13,18,19], our model firstly takes the meteorological data and actual wind speed data from SCADA for previous days as a training dataset while the trained model is used to predict one-day wind speed forecast. Simultaneously the second stage is trained using the wind speed to actual electric power conversion data from SCADA and this stage uses stage 1 wind speed estimation output to forecast one-day wind electric power forecasts. This estimated output is stored and compared with the actual output of the farm and both stages are trained in a continuous loop for highly precise predictions of a given wind farm.
This paper highlights the scheme and its implementation using hybrid multi stage Wavelet-PSO-ANFIS based algorithm for wind electrical power forecasting. For the purpose of modeling one-year data using SCADA controller physical data and meteorological data was used as historical data for the training of the model thus generating a predicted wind speed using stage 1. While stage two is a simple adaptive transfer function type algorithm which maps the predicted wind speed to the electrical power based on the training input from SCADA. The whole process runs for the preset number of iterations or when a threshold value of error is reached.

2.2. Requirement for a Real-Time SCADA System

A real-time SCADA system is of immense importance for any power generation system as it functions as a control and monitoring system and is also used for the overall management of the system. Real-time SCADA systems also present an excellent opportunity to log the wind speed, direction, and electrical generated power data which is a cornerstone in building an accurate forecasting system. The training of the hybrid prediction model as proposed in the paper is also dependent upon the data recorded by the SCADA system as the wind to electrical power generation transfer function is updated continuously based on the actual output recorded by SCADA systems.

2.3. Development of a Numerical Weather Prediction (NWP) Model

Accurate climatic data, especially historical wind data for a particular wind farm is important in developing a reliable forecasting system, there are numerous ways to get wind speed/direction data among them some important ones are, direct physical sensor based measurements, indirect online measurement/forecasts, and numerical methods based weather simulations with high spatial accuracy. For highly reliable measurements, a direct method is the best, but this requires resources and the installation of a control and monitoring system which most of the wind farm operators are not willing to install because of the higher installation and maintenance costs. Using on-line data without any validation is risky because of its integrity while the numerical simulations can be performed in an exact geographic location, and these algorithms have evolved essentially to provide fair accuracy, thus NWP based wind speed and direction measurements are also essential for proper functionality of this model.
NWP based measurements are used by many researchers because of its reliability and availability. Various studies use methods like Regional Atmospheric Modeling Systems (RAMS), Weather Research and Forecasting (WRF), Mesoscale Meteorological Model Version 5 (MM5) RAMS, WRF, MM5, and so forth, as explained in References [20,21,22,23]. Another technique involves the use of simulation models in combination with actual wind turbine height based wind data to simulate and predict wind patterns using data collected from numerous methods at an altitude of 10m above the ground [24]. Other algorithms like the energy optimization technique used in Reference [25] where the mapping algorithm was used based on energy optimization similarly the optimization of physical input to Wavelet-PSO-ANFIS model could be achieved using these models.

3. Proposed PSO-ANFIS Method

The proposed method for short-term accurate prediction of electrical power is graphically represented in Figure 1 below. In this section details of the major components of the system are discussed along with their requirement and process of implementation.

3.1. Wavelet Transform

Wavelet transform (WT) is used to extend localize a continuous stream of data both in time and frequency domain, thus this tool is very useful in analyzing data with abrupt changes and unlike Fourier transform this transform results in a localized set of wavelets which represent the data for further processing. The prediction process based on wavelet data is more accurate because the wavelet transform has a filtering effect on input data [26]. Based on the type of signals this transform can be of 2 types, a continuous wavelet transform (CWT) and a discrete wavelet transform (DWT). As per [27] the CWT W (a, b) of signal f(x) in the relationship with the mother wavelet ϕ ( x ) is defined by Equation (1) as:
W ( a , b ) = 1 a + f ( x ) ϕ ( x b a ) d x
where the center position of the wavelet is determined by the parameter b and the spread in time domain is represented by a. For signal processing, especially in case of time series, discrete signal analysis is performed using DWT, which can be as efficient as CWT [28] and is represented by Equation (2) as:
W ( m , n ) = 2 ( m / 2 ) t = 0 T 1 f ( t ) ϕ ( t n 2 m 2 m )
where T represents the total length of given signal f (t). The transition and scaling factors of the resulting wavelets are represented as functions of m and n (a = 2m, b = n2m); the discrete time index for this transform is denoted by t. Mallat [29] devised an efficient four filter. This process required less computational time as it was least complex process of calculating the DWT but this process was time-variant and historical changes in any converted signal may get lost due to this issue. Such losses may trigger false forecasting results and in case of wind electrical power generation forecasting such random changes can affect the whole system [30]. For resolving this issue, a non-decimated wavelet transform (WT) function provided by MATLAB(The MathWorks Natick, MA, USA)software can be used as the computational complexity and data storage is not as critical as it was when this model was proposed in Reference [30].

3.2. Particle Swarm Optimization (PSO) Algorithm

PSO algorithm is easier to implement and it required a low number of variables for proper implementation in MATLAB (The MathWorks Natick, MA, USA). Many researchers have previously used PSO for optimization of various real-life problems. A simple outline for implementation of PSO in the prediction of electrical power systems is given in Reference [31]. Del Valle et al. [31] also compared various other optimization methods to PSO. For any decision vector x ℜ∈ n which contains the primary variables, the design space may be defined as:
Ω = [ x 1 L , x 1 U ] × [ x 2 L , x 2 U ] × × [ x n L , x n U ] n
where x j L and x j U are basically the lower and upper bounds of the search space for the dimension of j (where, j = 1, 2, 3… n).
While the position of any given particle (ith particle) in the iteration number k is given by:
x i ( k ) = x i ( k 1 ) + v i ( k ) ;   i   =   1 , 2 ,     n
where swarm size is given by n, and vi(k) depicts the velocity of any given ith particle in the iteration k which basically shows the rate of change of position of the particle in the design space, and this is given by:
v i ( k ) = w ( k ) v i ( k 1 ) + c 1 r 1 ( P b e s t , i x i ( k 1 ) ) + c 2 r 2 ( G b e s t x i ( k 1 ) )
where, ω(k) shows the dynamic inertial weight coefficient, which is set to gradually decay to simulate the decrease in velocities in as the iteration are increased which further enables the swarm to converge to a suitable point in the search space, and this is given by:
ω ( k ) = ω max ( ω max ω min k max ) . k  
Here, ω max and ω min are initial and final weights after the swarm has converged; k max is the total number of iterations utilized in the search; c 1 and c 2 represent the social and cognitive learning rates in Equation (5); and whiles r 1 and r 2 are random numbers generated in the range of 0–1.
c 1 and c 2 depict the significance of the position of a particle in a given swarm; P b e s t is the best position achieved by a particle after i counts while G b e s t is the overall global best position of all the particles in the space for a given swarm. Graphical representation of PSO algorithm is shown in Figure 2.

3.3. Adaptive Neuro-Fuzzy Inference System (ANFIS) Model

Fuzzy logic is a system which is vastly used to map variables which have no apparent linear relationship, this is achieved by taking vectors as input and relating it to a scalar output. Moreover, a fuzzy system can take input data in the form of numerical values, and qualitative data as well. A simple fuzzy logic system comprises of four components, including, fuzzifier, fuzzy rules, inference engine and a de-fuzzifier. Fuzzifier is a conversion process which converts raw input data into a fuzzy representation, this process also assigns attributes to variables based on the membership functions and their relationship with the variables. Fuzzy rules are simply defined as an if-then type structure where the relationship and the resulting behavior is modelled as rules. Inference engines are used to infer the rules and reach to a fuzzy output by following fuzzy rules, two main kinds are Sugeno and Mamdani inference engines [18].
A Mamdani engine uses fuzzy rules to map the fuzzy sets to the relevant fuzzy output, then finally a de-fuzzifier is used to obtain scalar output from the fuzzy sets while a Sugeno type engine uses a direct relationship of fuzzy input to scalar output using output membership function known as singleton spikes. In any case, the de-fuzzifier is used to get the final output using the integration of areas using methods like mean of maxima, area bisector, maximum criteria or centroid of an area.
Artificial Neural Networks (ANNs) are superior to a simple fuzzy inference system as these systems use continuous training, thus updating the weights between neurons, a simple disadvantage is the fact that this advantage can only be exploited within the system while fuzzy systems can be interlinked using the set of fuzzy rules this gives a unique requirement of using ANN with fuzzy logic [32]. A combination of ANN and fuzzy network is called ANFIS which is an adaptive feed forward algorithm and it uses the strengths of both approaches while creating relationship matrices [33]. This method is usually used to train a network based on historical data and later the forecasted data and actual output are further stored to further train the model thus ANFIS is a self-learning method which combines the capability of neural network with the membership functions of a fuzzy inference system [34].
A Takagi-Sugeno based fuzzy inference engine is shown in Figure 3 where the system uses five-layer structure to map the input and output variables.
Each layer comprises of numerous nodes, which are characterized by a mathematical node function. The node functions and layer functions are further discussed below.
Let us assume that the output is represented by Oi for an ith node in any layer j. Layer 1 contains adaptive nodes as shown in Equations (7) and (8).
o 1 , i = μ A i ( x ) , i = 1 , 2 ,  
or:
o 1 , i = μ B i 2 ( y ) , i = 3 , 4  
Variable x and y are inputs to the given i th node while Ai (also Bi-2) is a semantic label associated with this node in layer 1. Thus, o 1 , i is actually a membership function of a fuzzy set A ( A 1 , A 2 , B 1 or B 2 ) and this is the indicator of the relationship of x or y to the quantifier A. A generalized bell function may be used to further define the membership functions A and B as given by Equation (9).
μ A i ( x ) = 1 1 + | x r i p i | 2 q i  
where, pi, qi, and ri are the input parameters of the membership functions and changing these parameters define a new membership function accordingly. This gives flexibility to define various membership functions for a given label Ai. In an actual scenario, any mathematical function which can be integrated piecewise is used as a node function in this layer as suggested by [35] and these parameters are also known as premise parameters.
Layer 2 is a simple fixed node which uses the product of the input signals for rule firing as shown in Equation (10).
o 2 , i = w i = Π j μ j = μ A i ( x ) . μ B ( x ) ,   i = 1 , 2
Layer 3 is used for every N node to estimate the ratio of the firing of an ith rule in the fuzzy domain to the total sum of rules which is also called normalization as given by Equation (11).
o 3 , i = w ¯ i = w j w j = w i w i + w 2 ,   i = 1 , 2
After this layer, the fourth layer uses adaptive nodes to determine the role of every ith rule in determination of the overall output of the ANFIS as given by Equation (12).
o 4 , i = w ¯ i f i = w ¯ i ( a i x + b i + c i )
Here, w i ¯ is the output as given by layer 3, while a i , b i and c i are collectively known as a parameter set. After this a fifth layer uses a single node to calculate the final stage output by adding up all the input signals as shown in Equation (13).
o 5 , i = i w ¯ i f i = i w i f i i w i
This section describes that an adaptive weight ANFIS system is basically a Sugeno inference engine.

3.4. ANFIS Membership Function Parameter Optimization Method

The aim of this research is to develop a dual-stage hybrid Wavelet-PSO-ANFIS based technique which uses PSO for optimization of the parameters while the membership functions are developed using ANFIS. This technique combines the simplicity of PSO algorithm with the mathematical simplicity of the ANFIS network. For the purpose of this research the fuzzy membership functions that are used to map the input/outputs are triangular shaped.
Back propagation (BP) algorithms are used to create an input, output relationship using ANFIS by using historical data from the actual wind farm. Thus, a tuned network will properly forecast wind electrical power for a day using training based adaptive fuzzy relationships. The BP algorithms use gradual decay in the weights of vectors to converge to a minimum error for any optimization problem. The disadvantage of BP algorithms is the ability to get struck at local minimas, thus ignoring the actual global minima which is an optimum solution. Thus, the BP algorithm is replaced with the PSO to search for global optimum values in the space. Another advantage of the PSO algorithm is that this algorithm is independent from the structuring of the ANFIS. A mean square error is used as a cost function to optimize the membership functions using PSO and thus a hybrid scheme using wavelet for the initial formation of wavelets, then PSO in combination with ANFIS is used to generate forecasting model using a dual-stage hierarchy as depicted in Figure 4.

4. Performance Evaluation

Performance evaluation of any forecasting model is very crucial for benchmarking the model with already existing models. Thus, evaluating the accuracy and precision of our proposed hybrid dual-stage Wavelet-PSO-ANFIS (DSHWPA) model for the prediction of wind speed and wind electrical power using error measurement criteria like, mean absolute percentage error (MAPE), root mean square error (RMSE), standard deviation of errors and sum-squared error (SSE) is essential. Error analysis criteria were computed using the relationships defined in this section of research study. MAPE was calculated using the relationship as defined in Equations (14) and (15) below:
MAPE = 100 N h = 1 N | E h a E h f E h a ¯ |
E h a ¯ = 1 N h = 1 N E h a
where, E h a and E h f are the actual and forecasted wind electrical power in kW at a given hour in a day while E h a ¯ is the average value of actual electrical power produced by a wind farm and N is the prediction horizon.
SSE was calculated using the Equation (16) as shown below:
SSE = h = 1 N ( E h a E h f ) 2
Similarly, the RMSE for the forecasting model was calculated using the relation as defined in Equation (17) below:
RMSE = 1 N h = 1 N ( E h a E h f ) 2
Finally, the SDE of error was calculated using relationships as shown in Equations (18)–(20):
RMSE = 1 N h = 1 N ( e h e ¯ ) 2
e h = E h a E h f
e ¯ = 1 N h = 1 N e h
where, e h is the forecasting error at any given hour h and e ¯ is the mean prediction error for the forecasting model. The variance in the observed errors shows the reliability of the prediction model, a high variance value shows the model is unstable and wide range errors were observed while forecasting electrical power [18,26]. From Equation (14), a daily variance in prediction errors can be calculated using the relationship shown in Equations (21) and (22) below:
  σ e , d a y 2 = 1 N h = 1 N ( | E h a E h f E h a ¯ | e d a y ) 2  
  e d a y = 1 N h = 1 N | E h a E h f E h a ¯ |  

5. Practical Implementation and Numerical Results

The proposed algorithm of dual-stage hybrid Wavelet-PSO-ANFIS was applied for short-term electrical power prediction in a small wind electrical powered grid station using a single wind turbine having max. wind speed (15 km/h) rated power of 2800 kW. The major inputs for the first stage include the environmental variables from NWP meteorological forecasts for the purpose of training and forecasting future wind speed. Furthermore, in this section data dependency was also analyzed using distributed data sets to test the algorithm and results are discussed. The target prediction timeline for the selected model was 1 day while the data for training was gathered from NWP and SCADA systems for a year as a large data set ensures proper development of member functions in fuzzy domain. The results of the forecast of 4 days (each corresponding to one season) are discussed and analyzed for error and prediction accuracy analysis. The forecasted results along with the actual results are plotted to show the accuracy and preciseness of the model. The Figure 5, Figure 6, Figure 7, Figure 8, Figure 9, Figure 10, Figure 11 and Figure 12 show the results of stage 1 and 2 along with the actual observed data for comparison. Also,
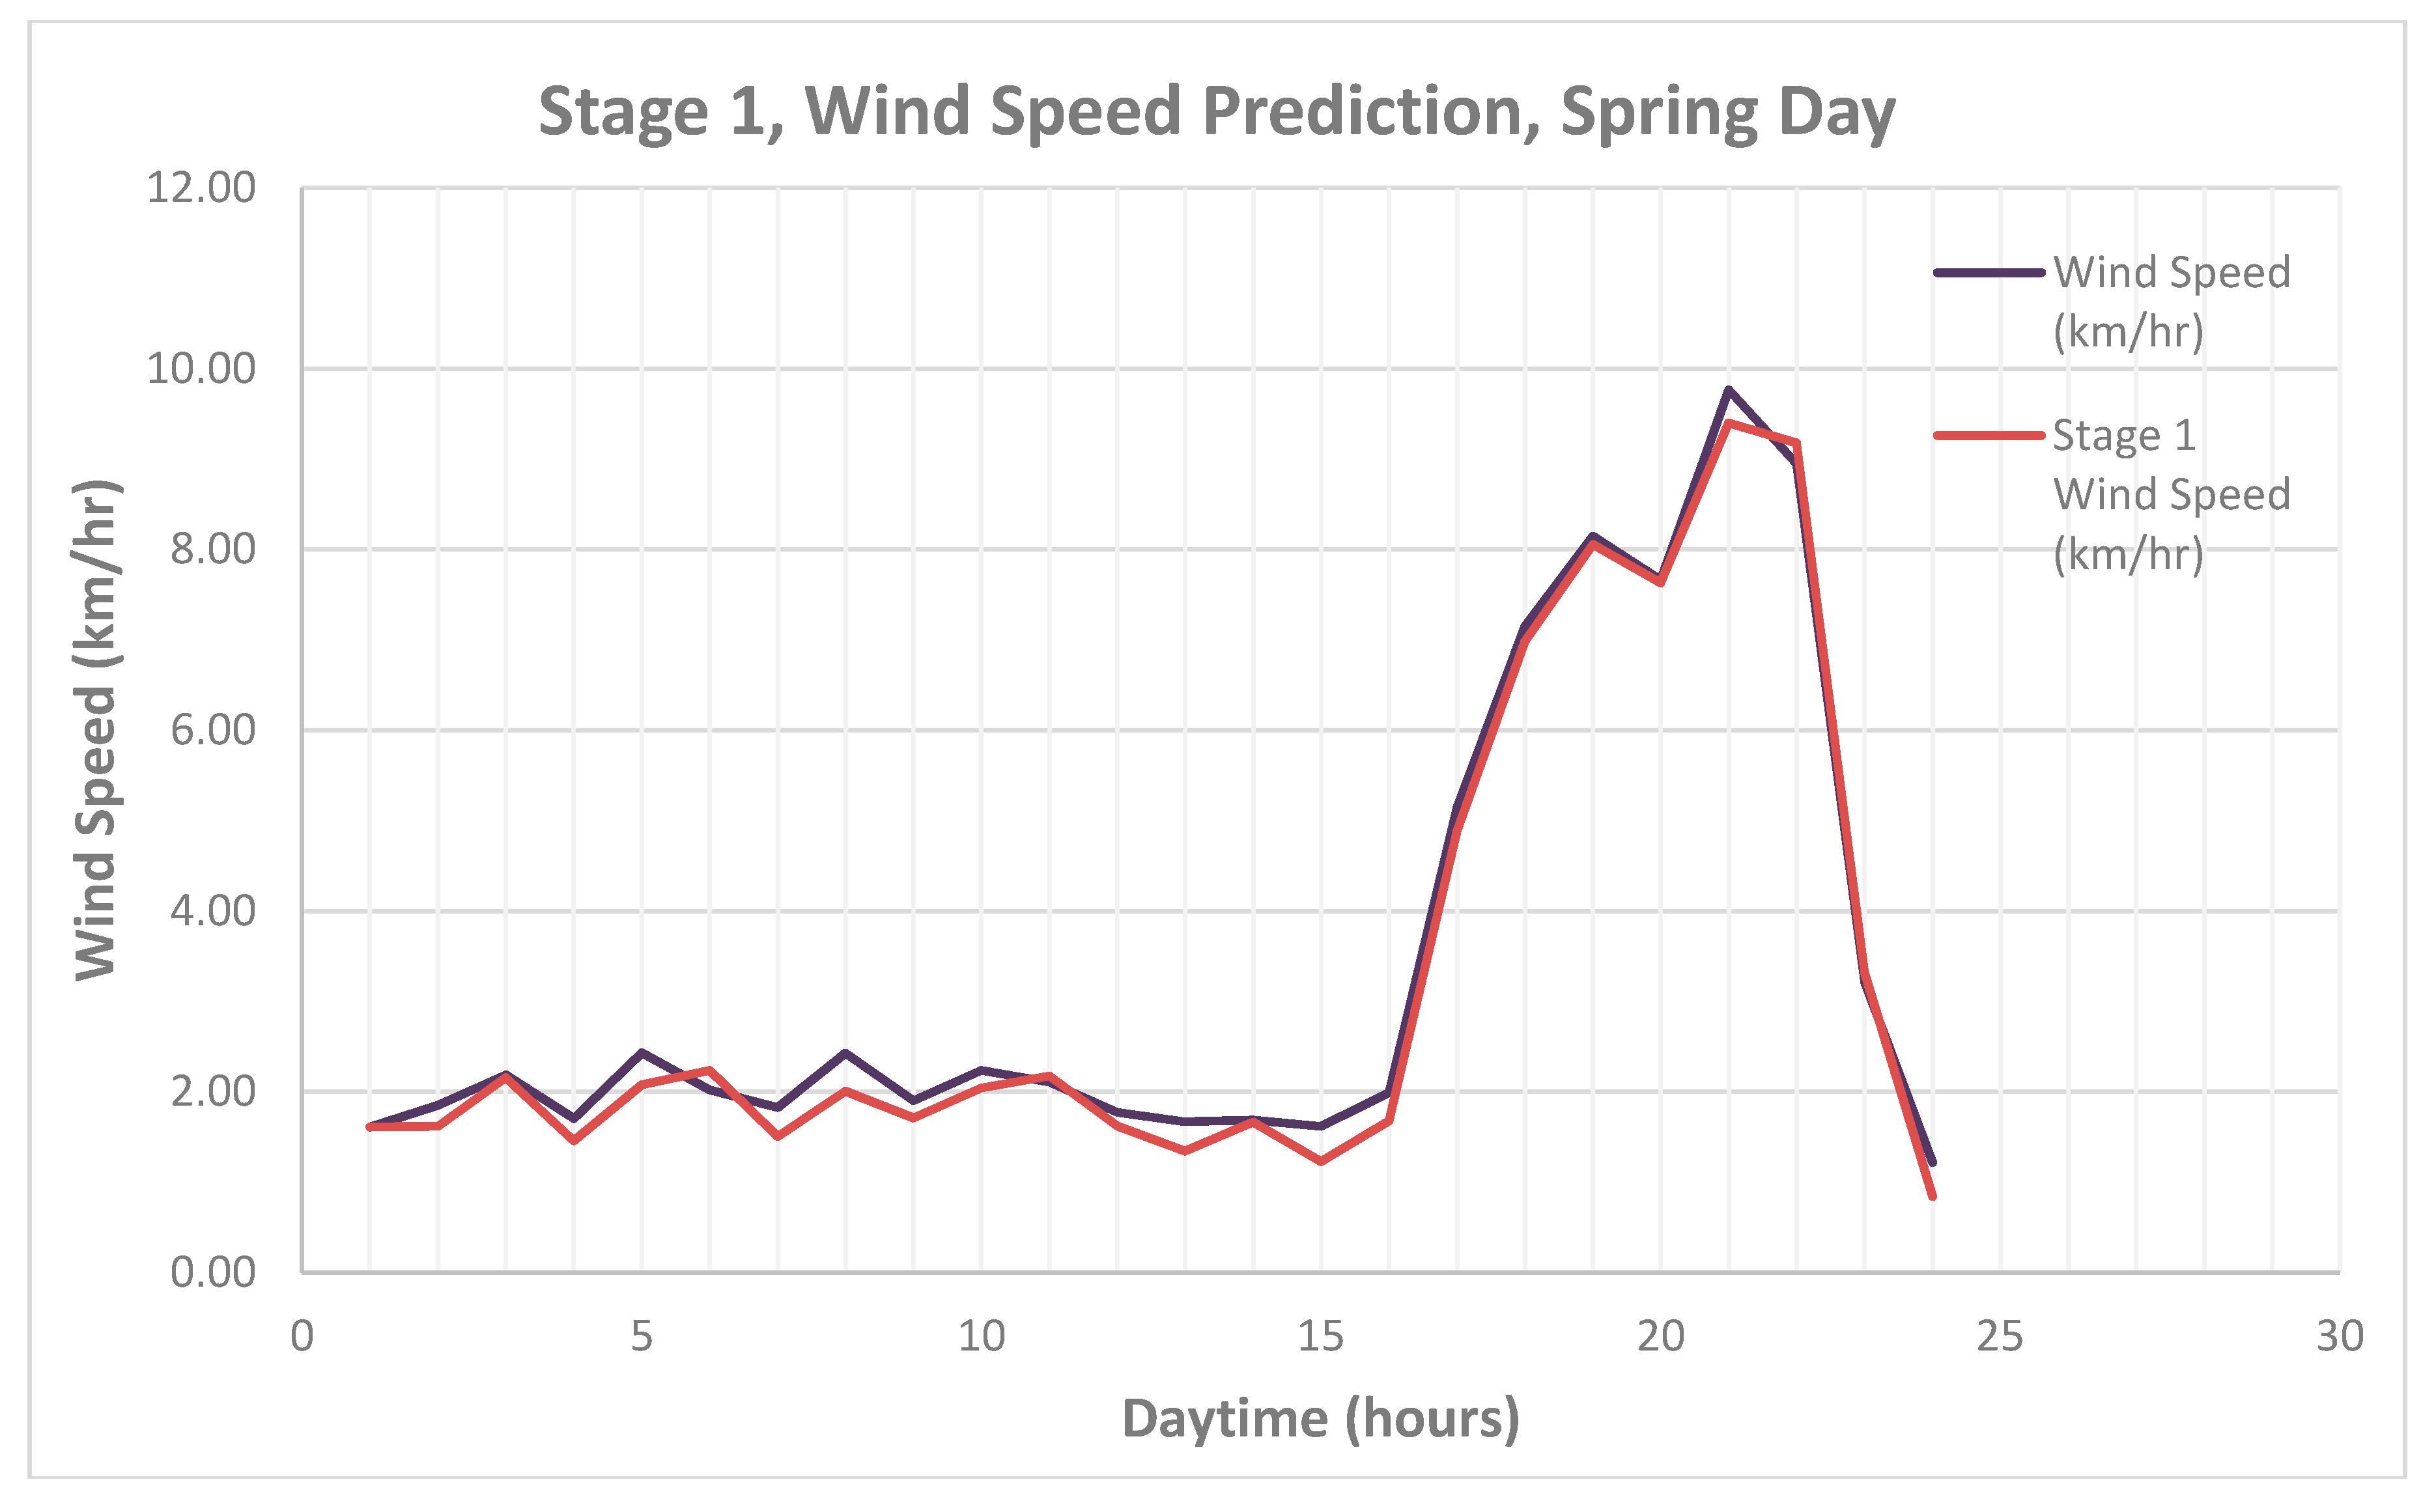
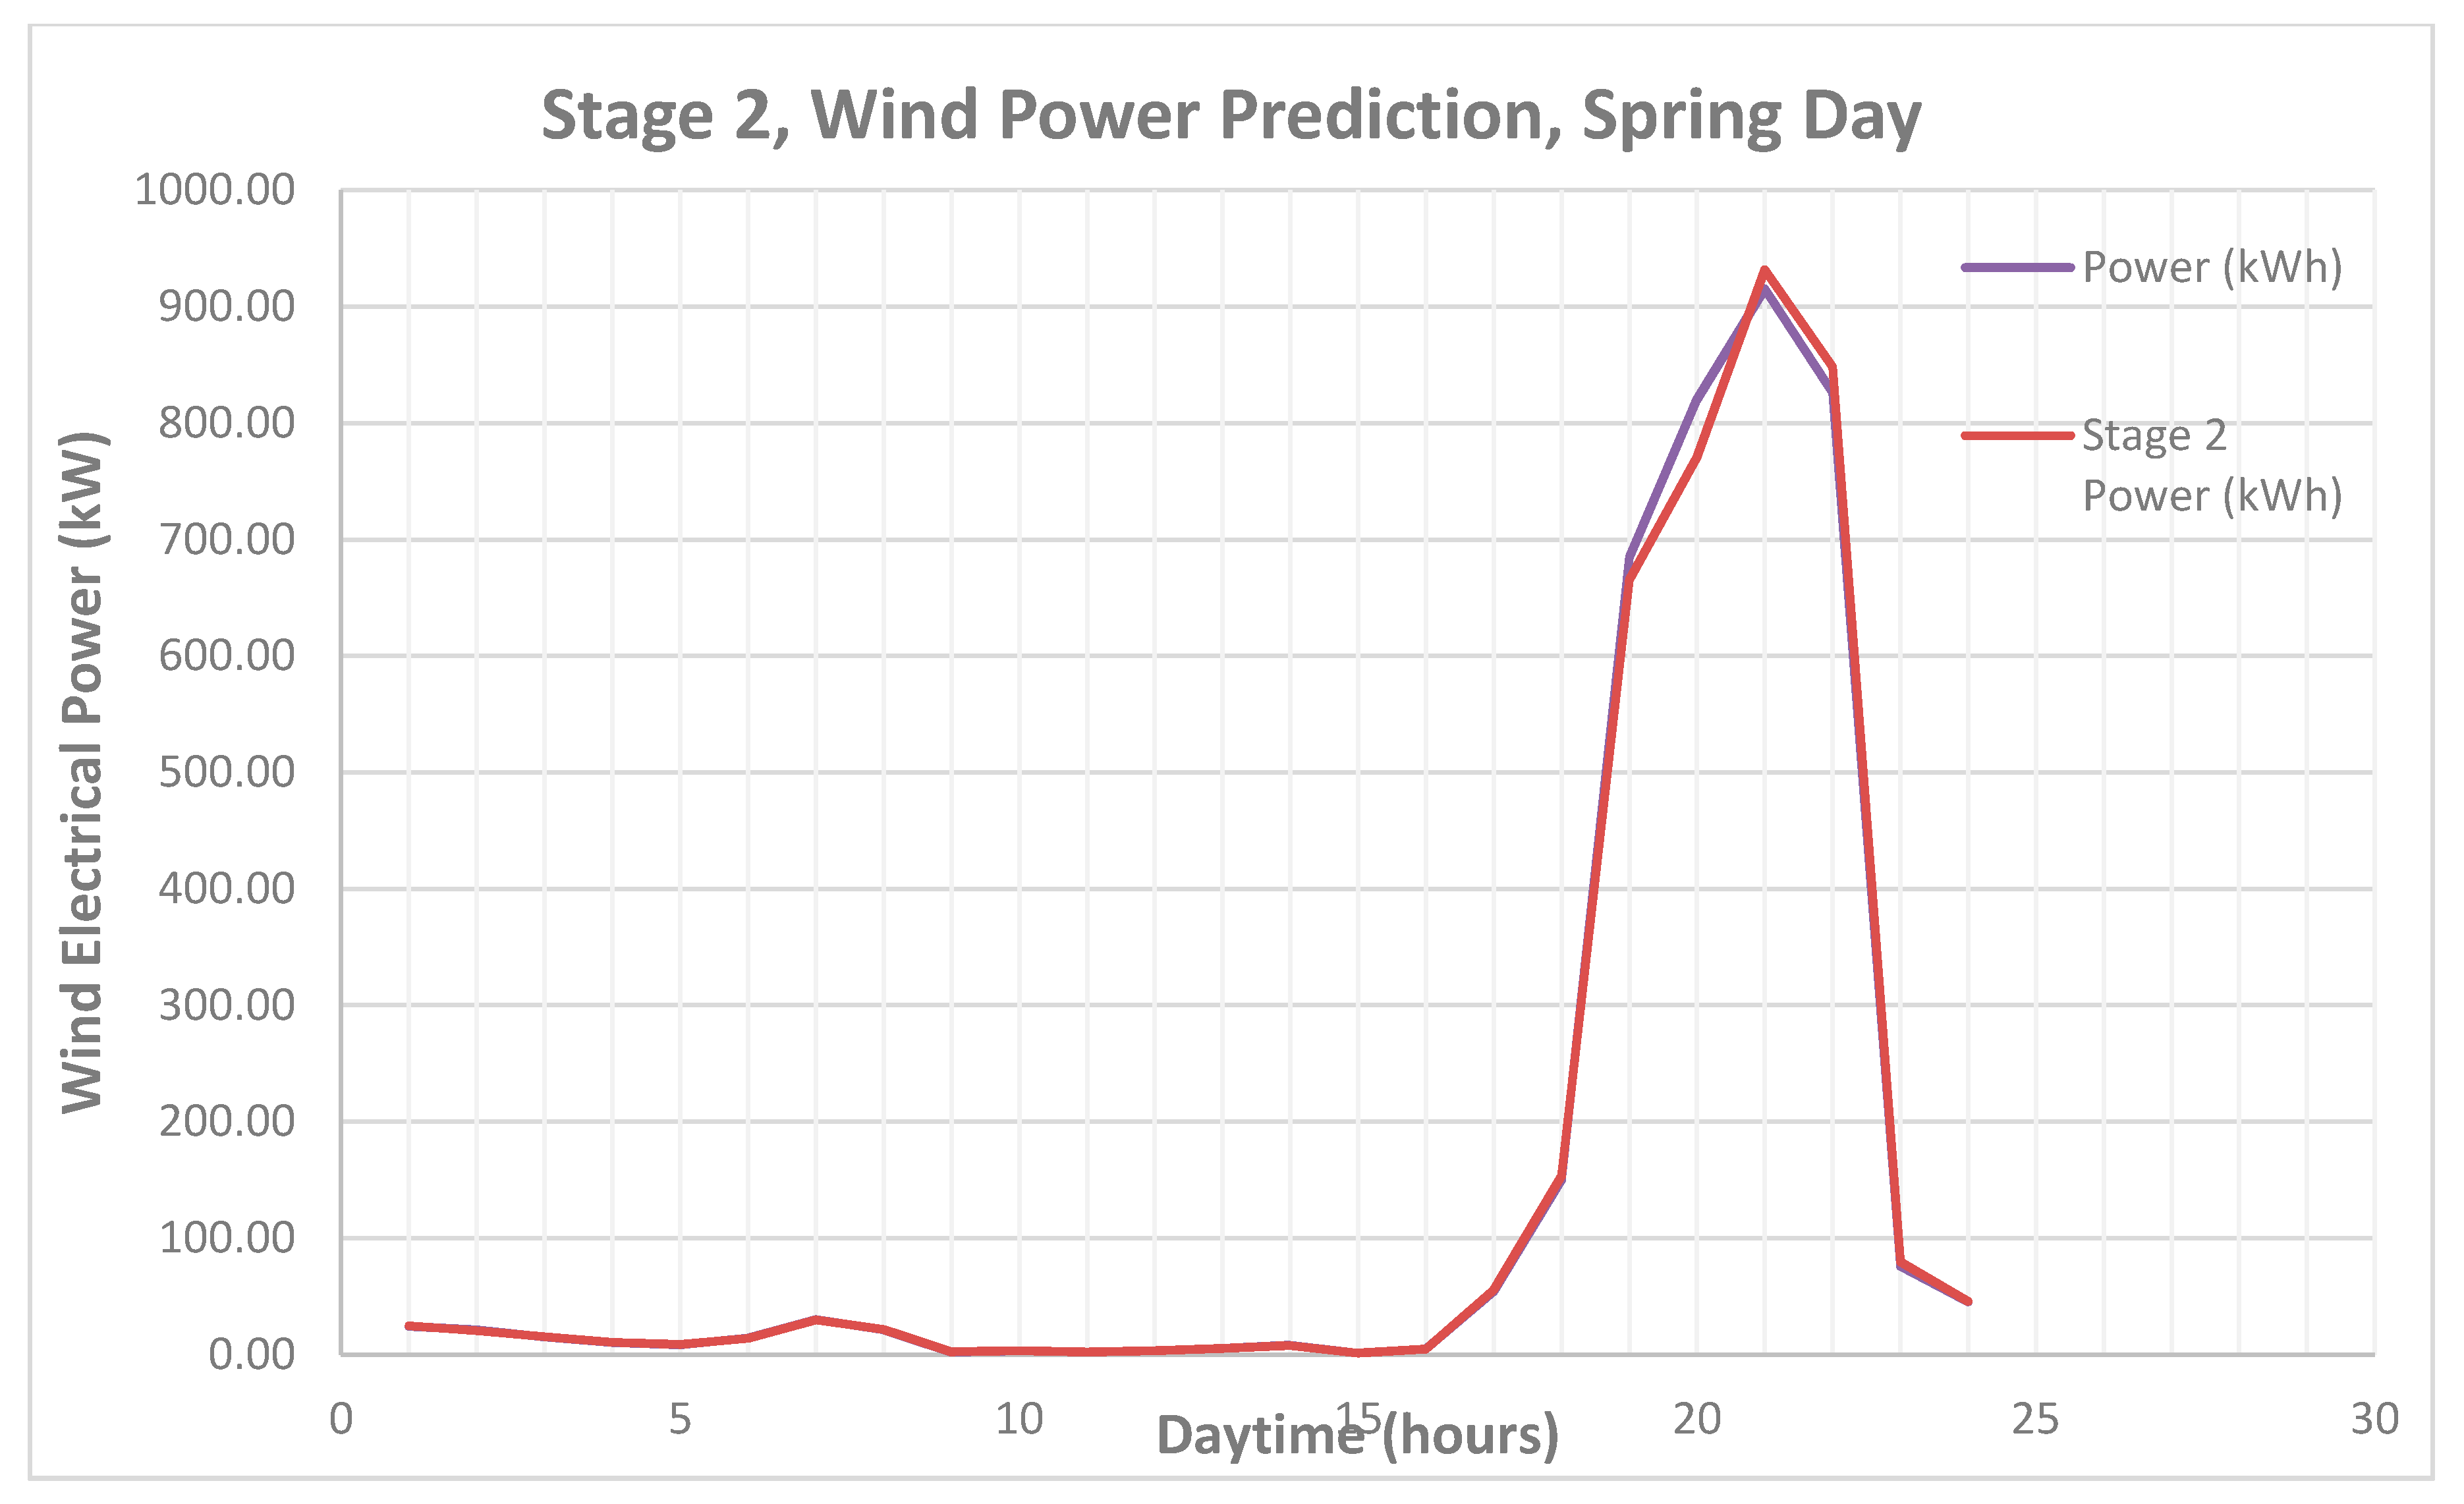
 Figure 5 and Figure 6 show the predicted results for wind speed and wind electrical power for a spring day. There were strong winds from hour 16 to hour 23 thus creating high electrical power of up to 900 kW in that region. The forecasted and actual data are almost aligned and the shape is also in correlation to each other which shows the accuracy of the model. Similarly,
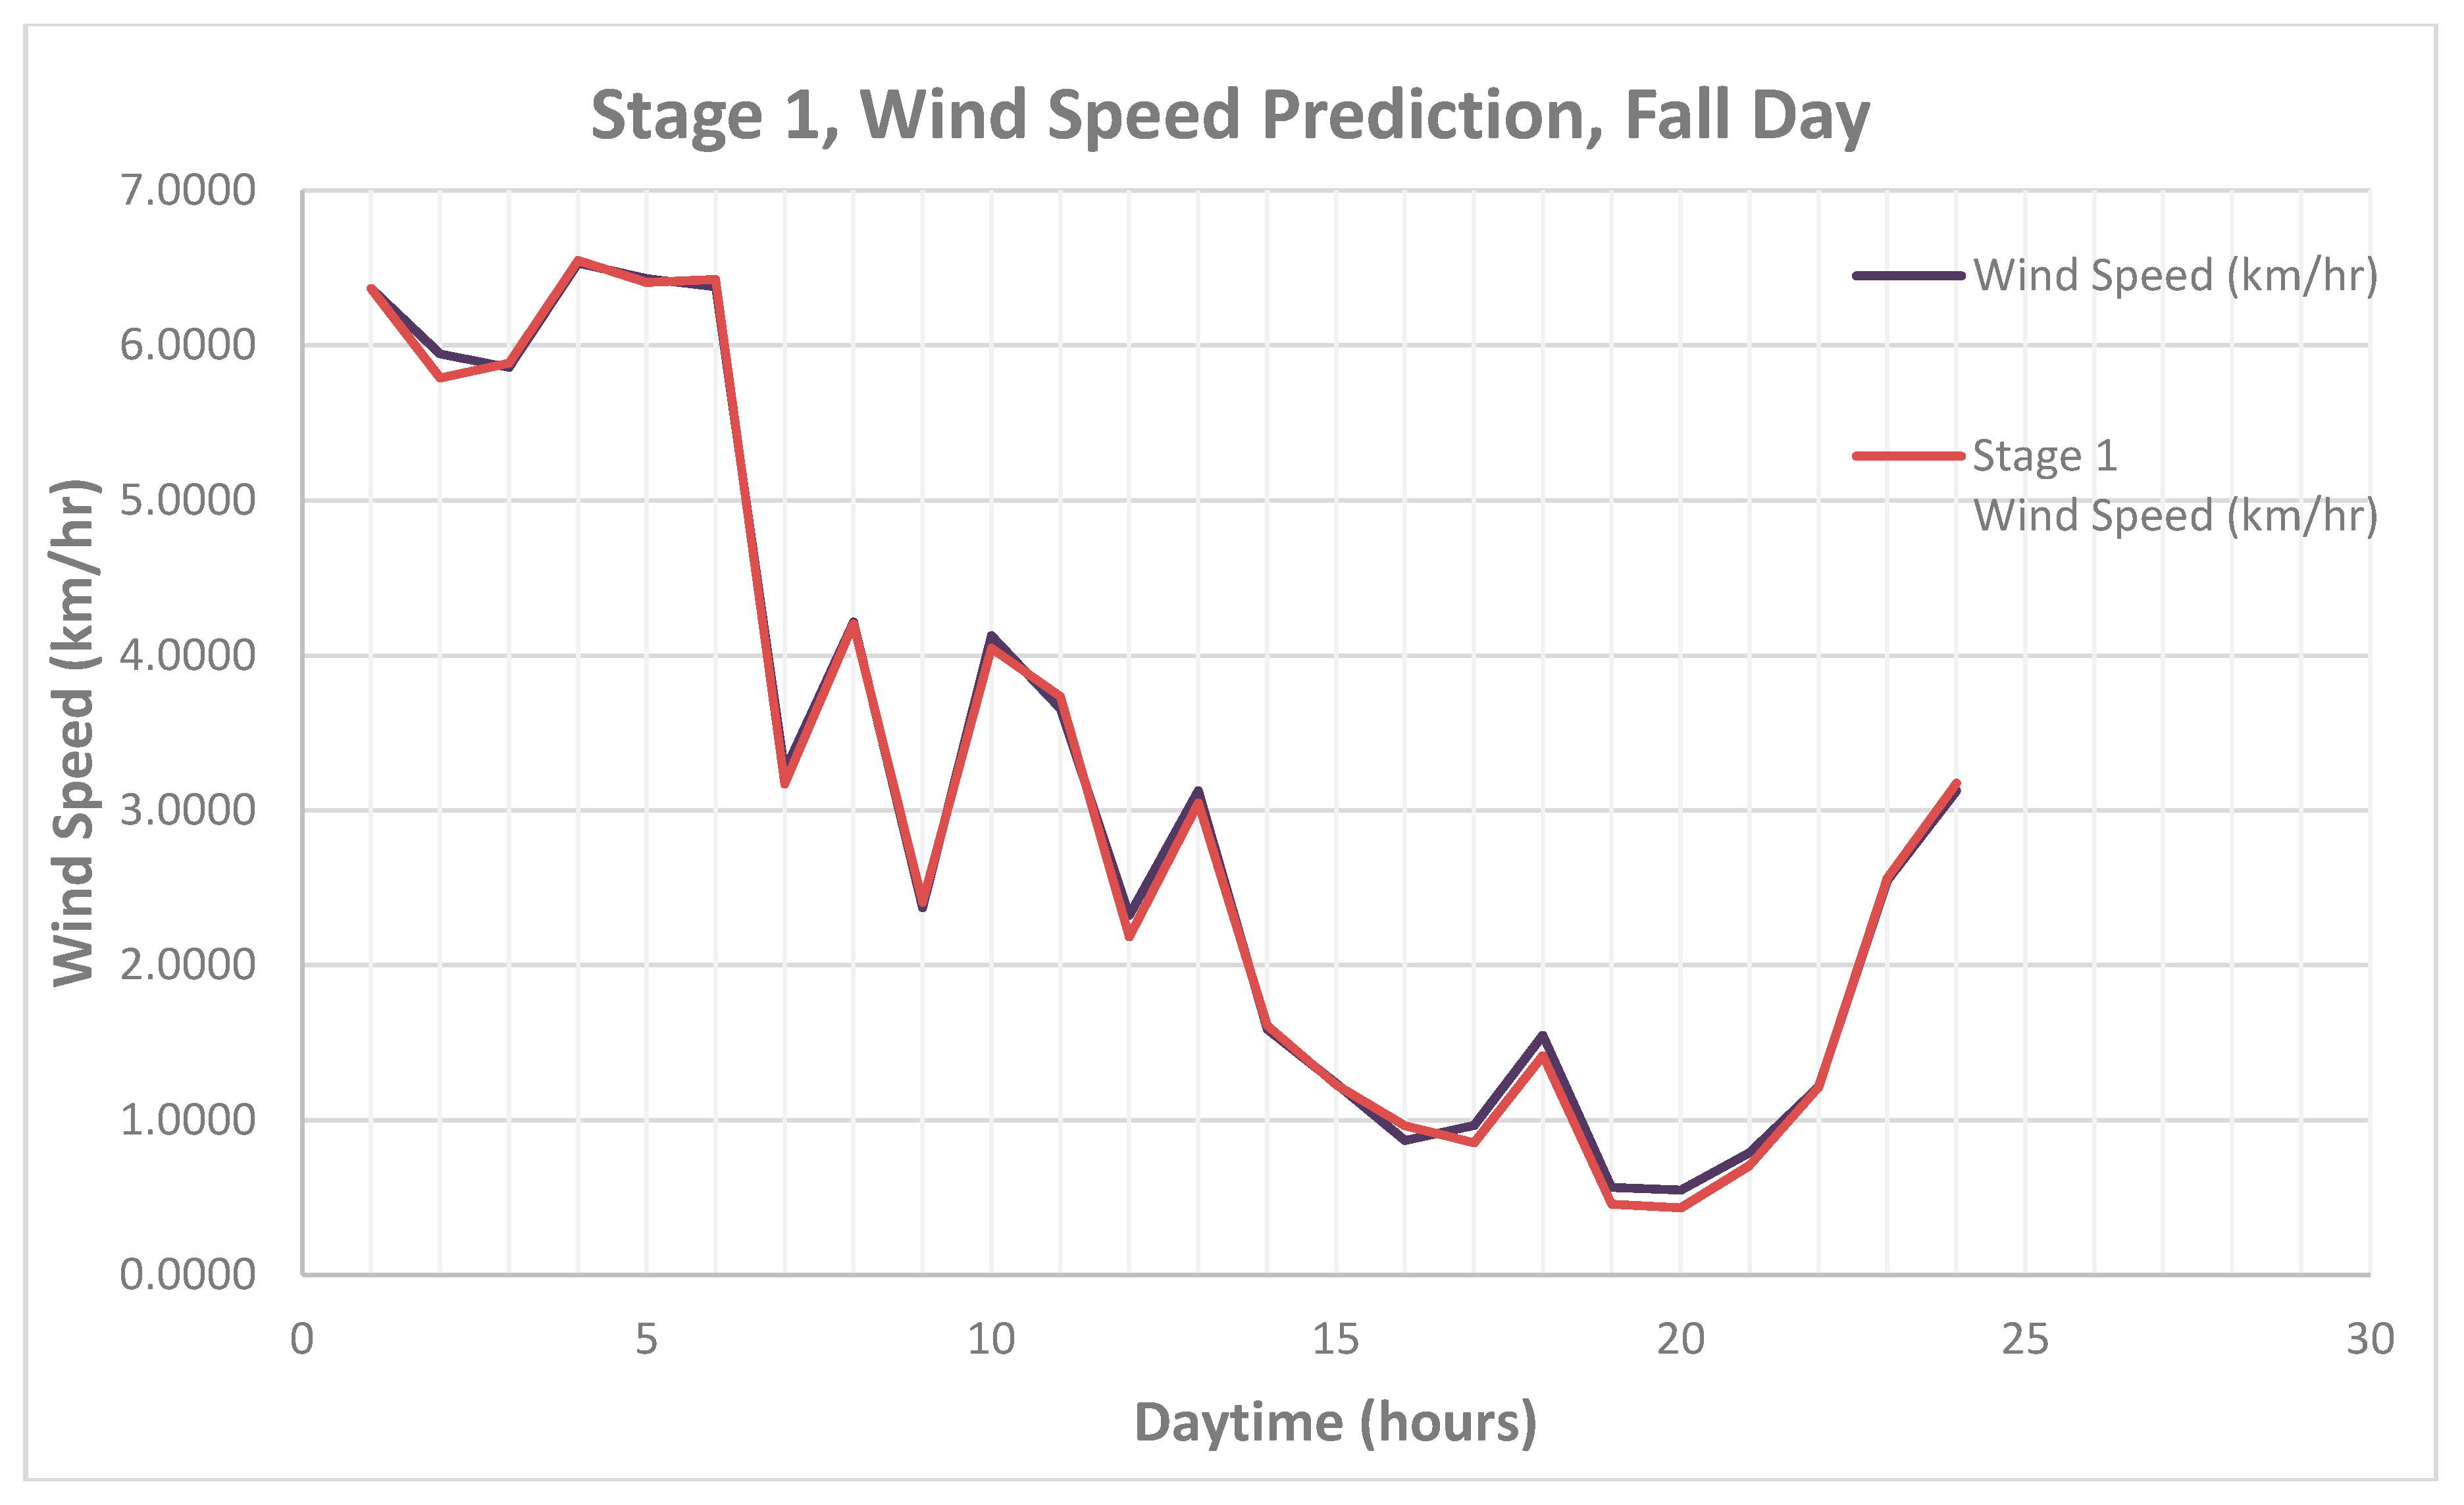
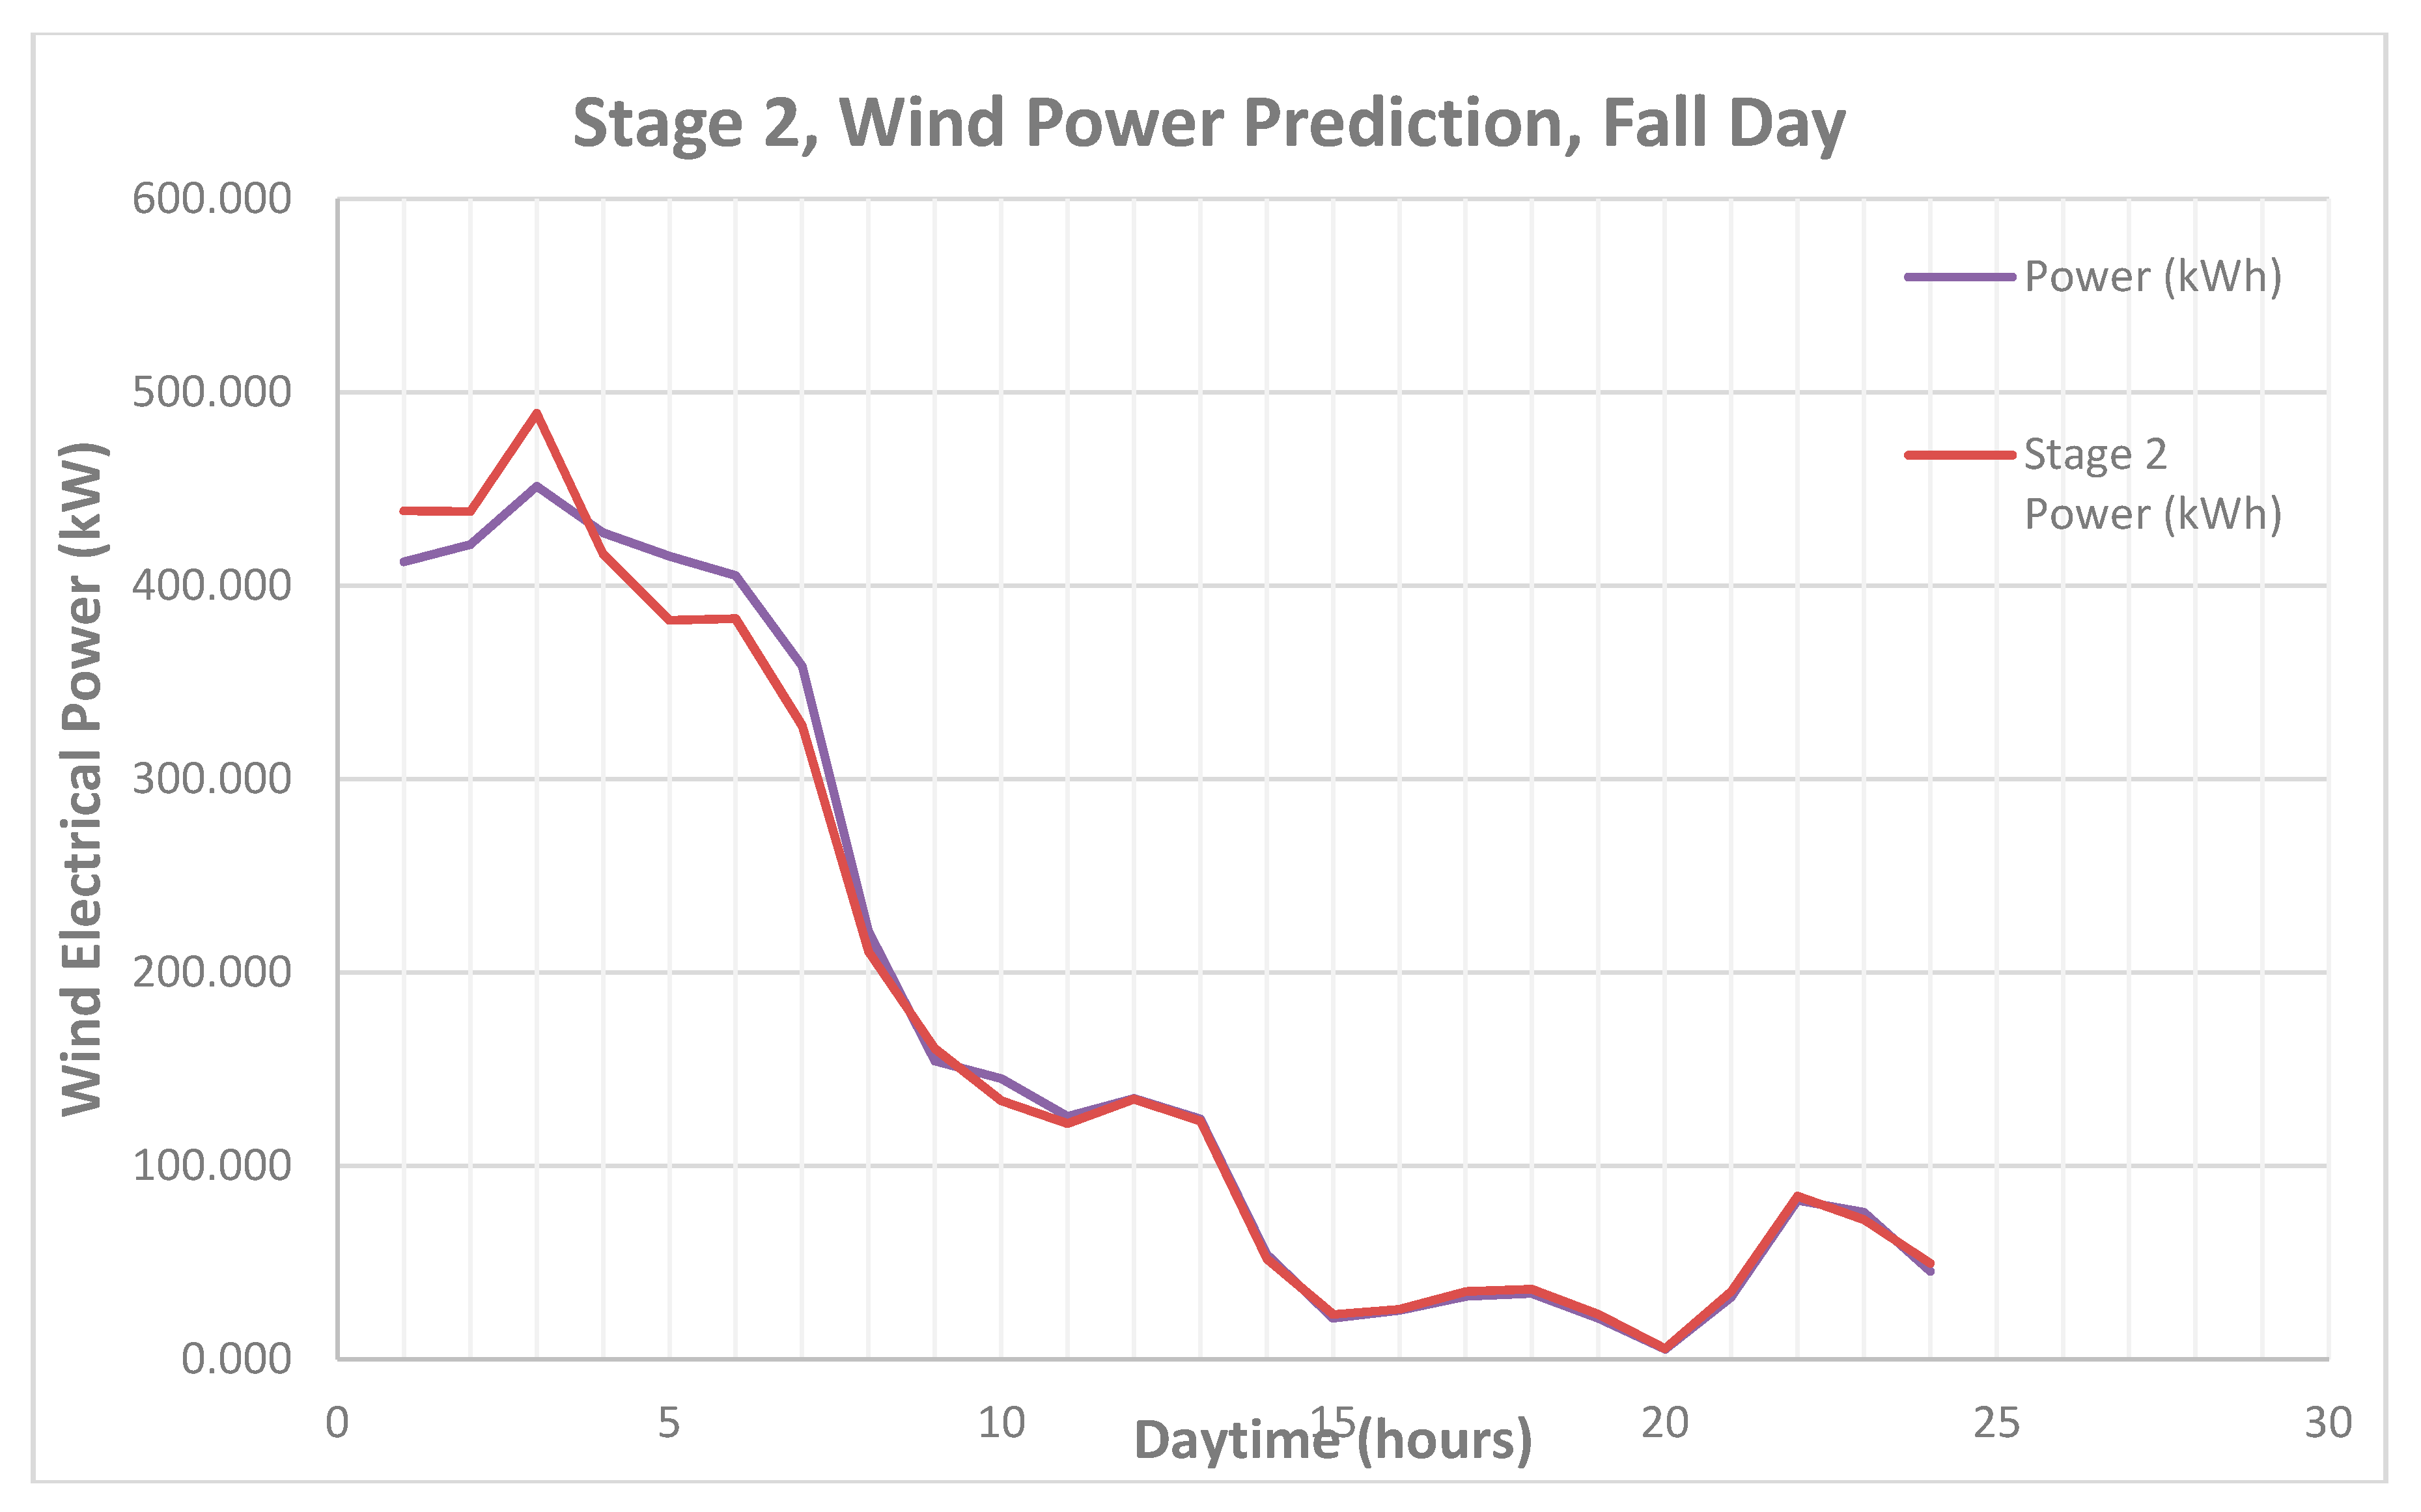
 Figure 7 and Figure 8 show the predicted results for wind speed and wind electrical power for a fall day. There were strong winds in the initial hours while random wind speeds were observed in the latter part of the day. The forecasted and actual data are shown for the purpose of comparison.
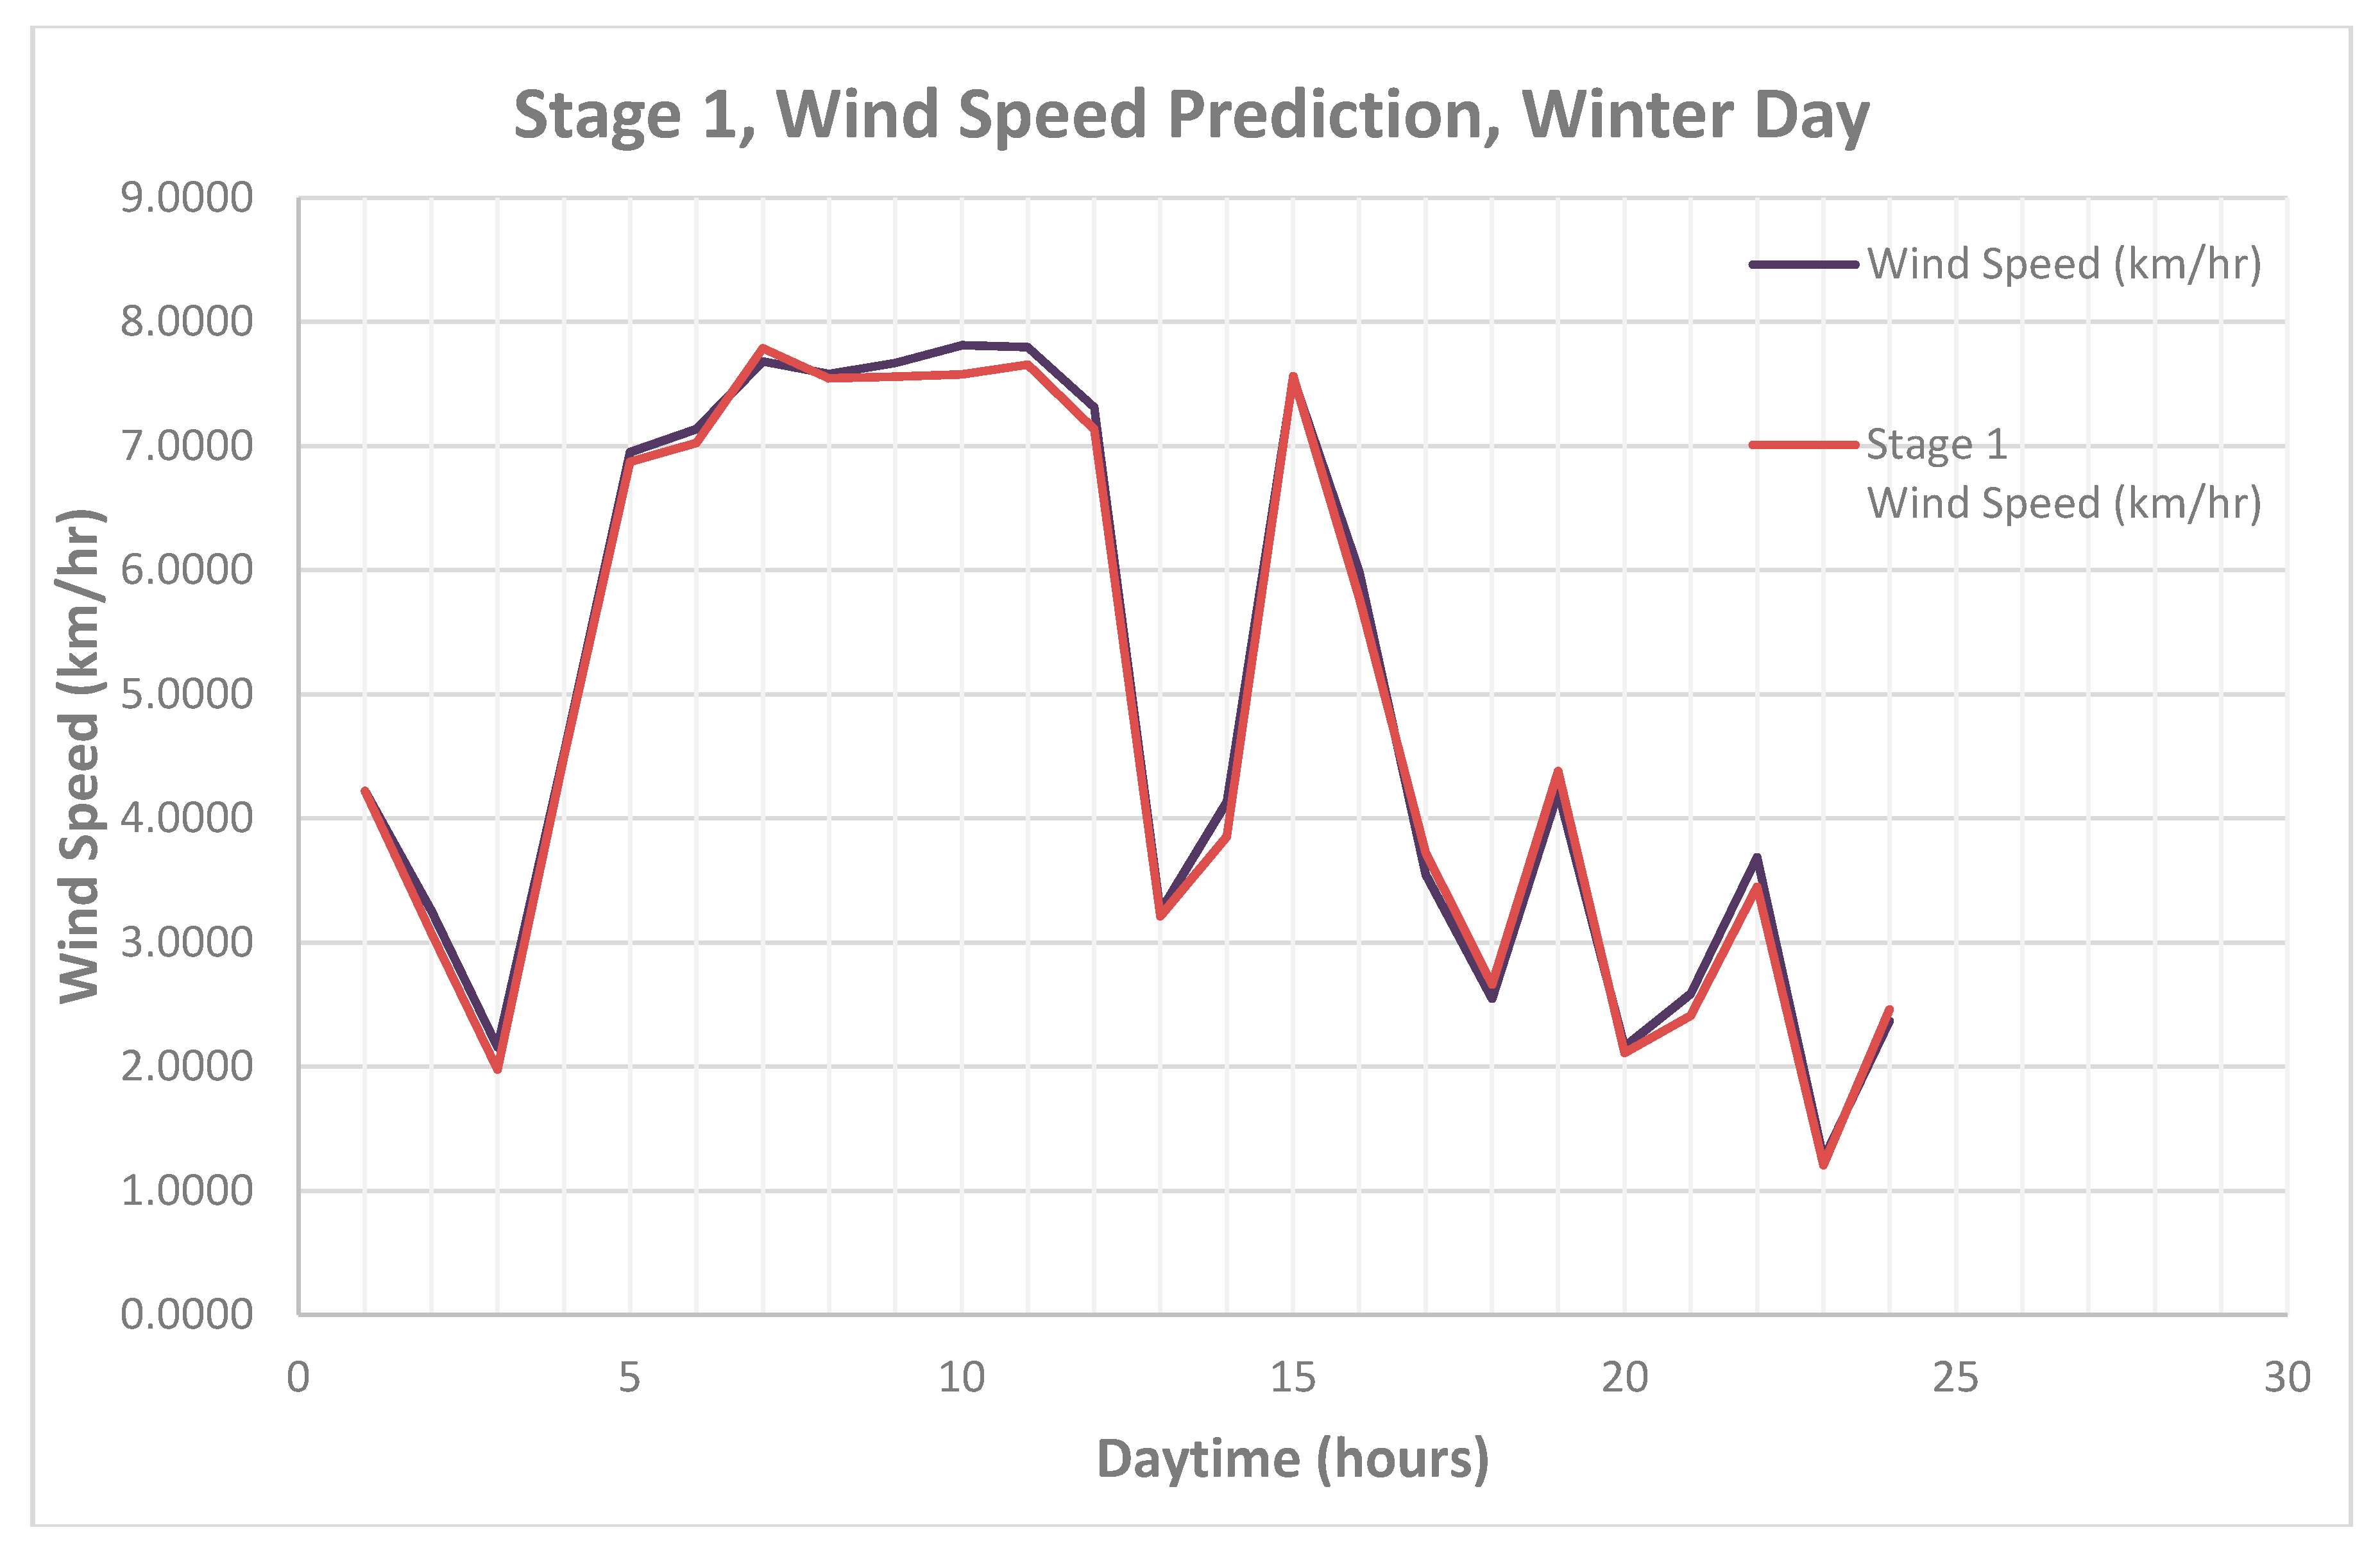
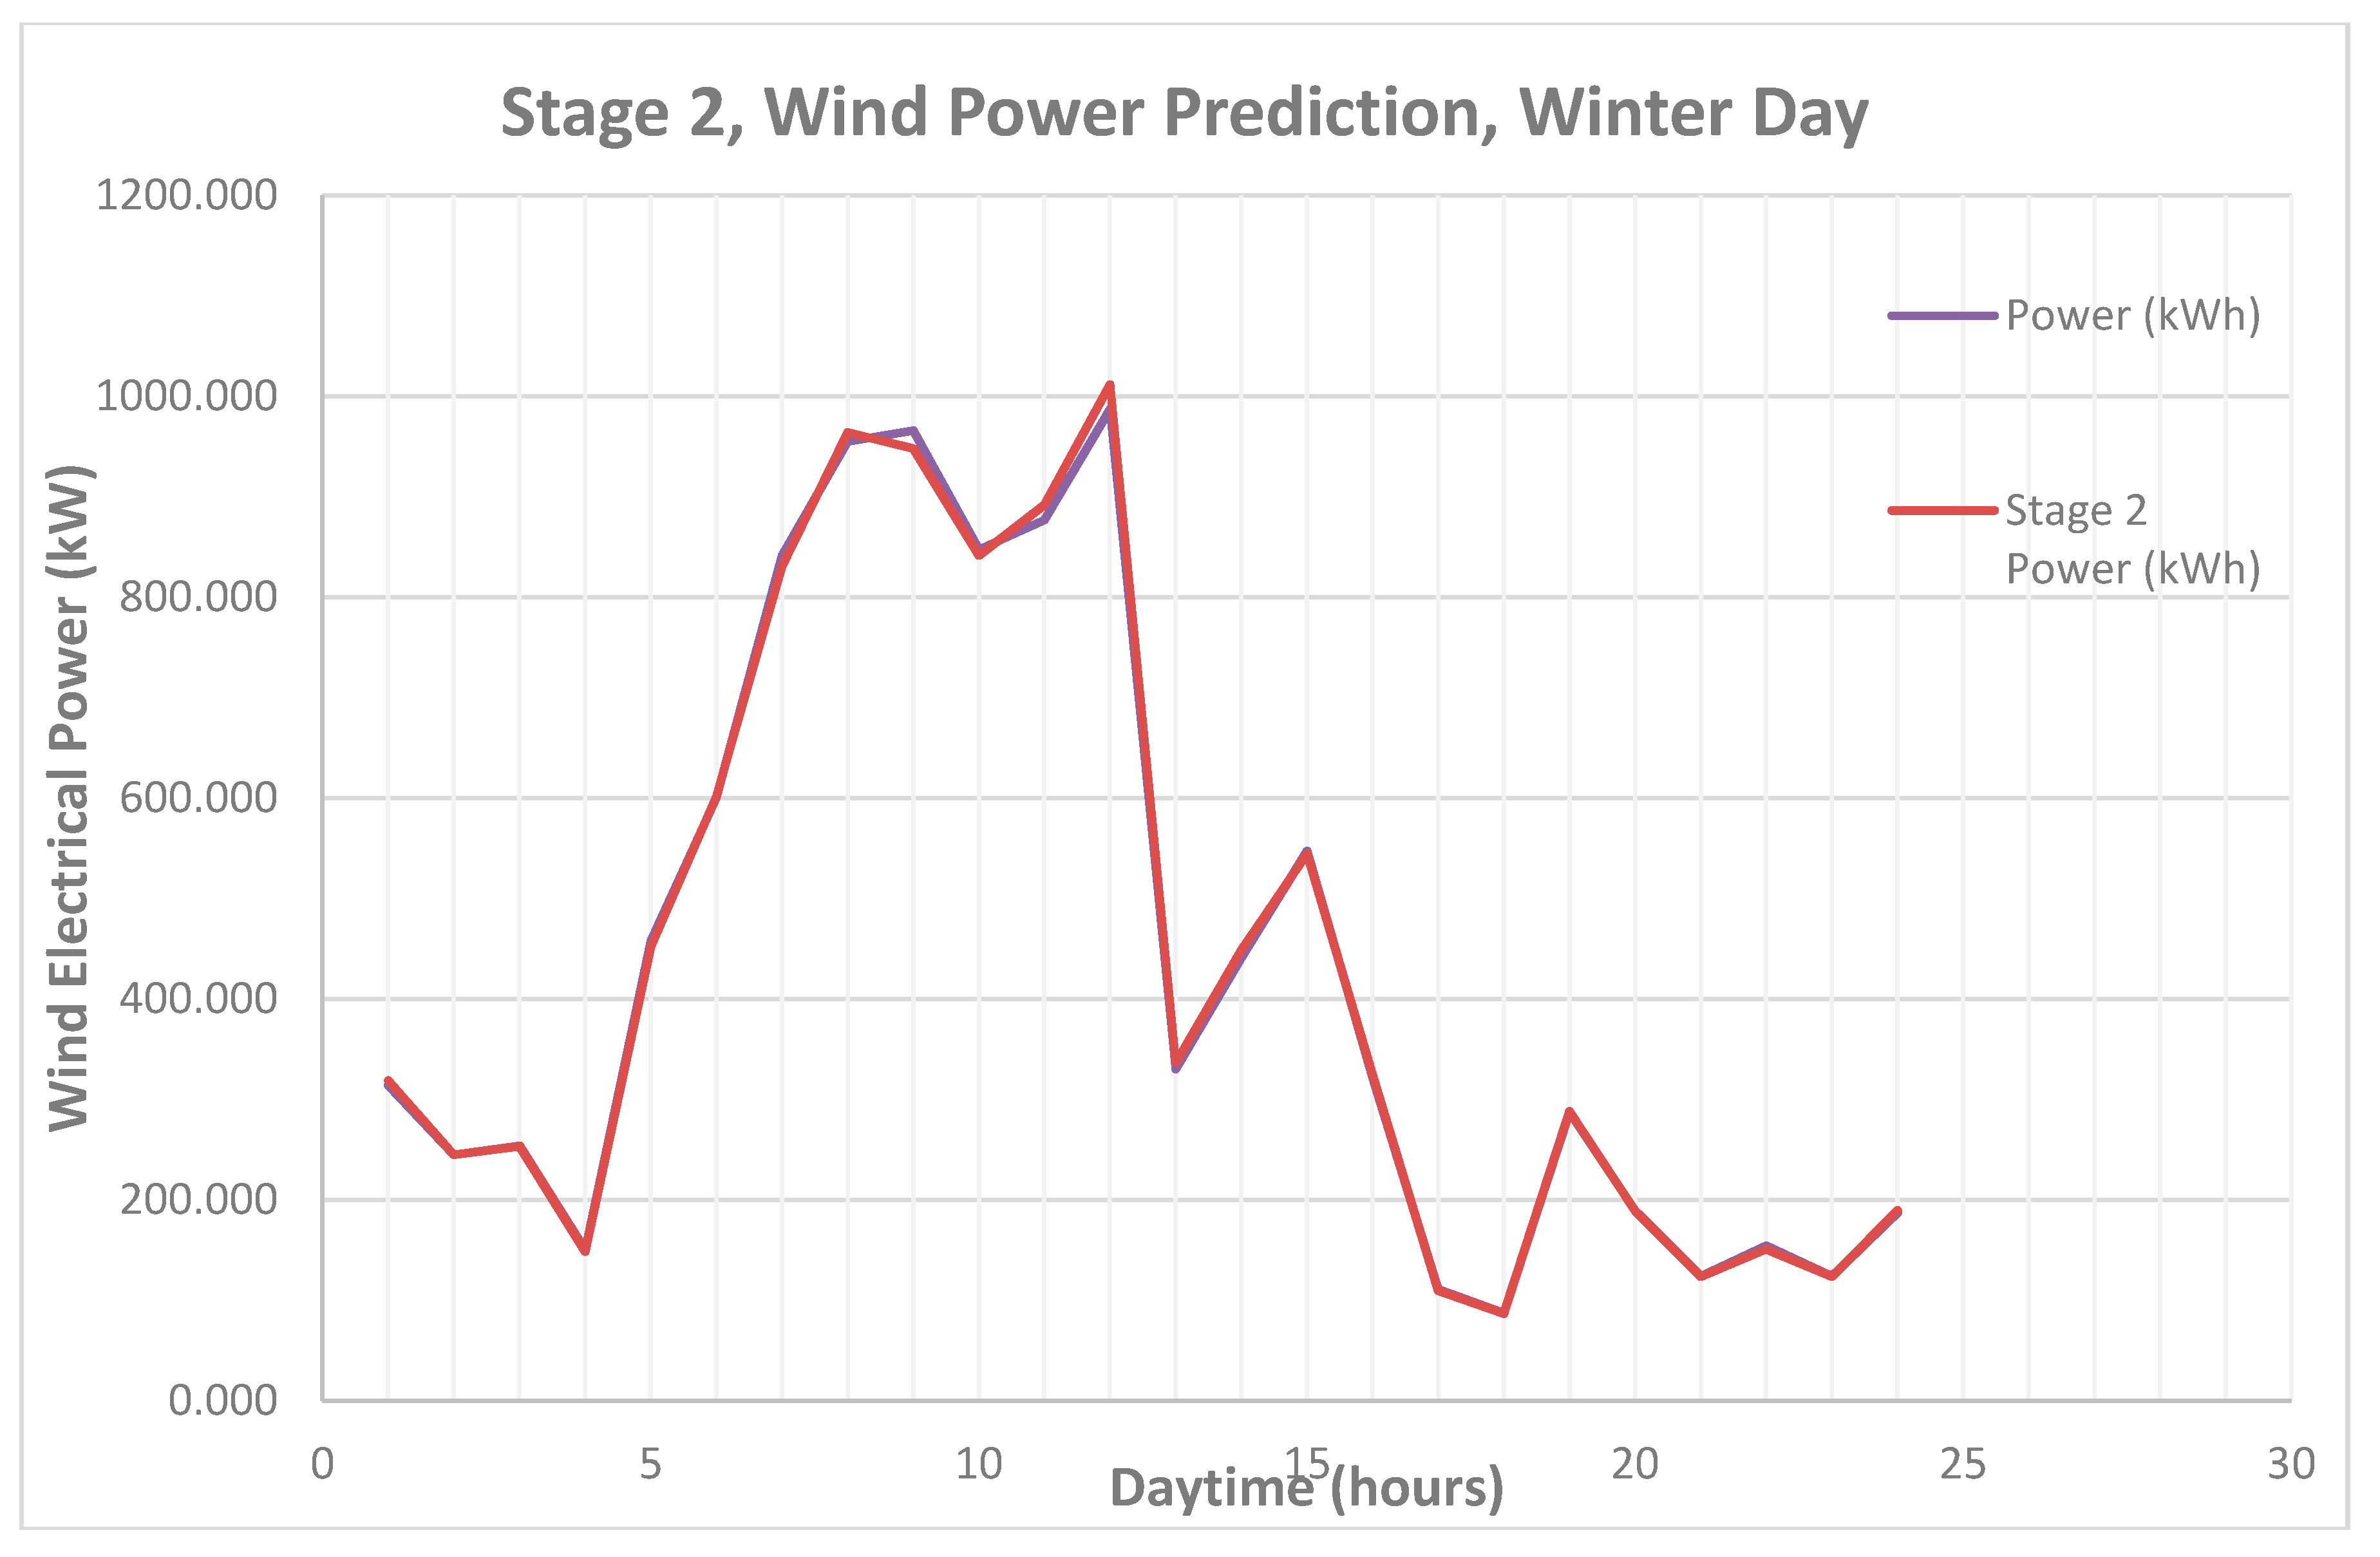
Figure 9 and Figure 10 depict the forecasting results for a winter day. There were strong winds throughout the day, which were predicted by the forecasted model and a mean electrical power of 700 kW was generated as a result of continuous winds. Similarly,
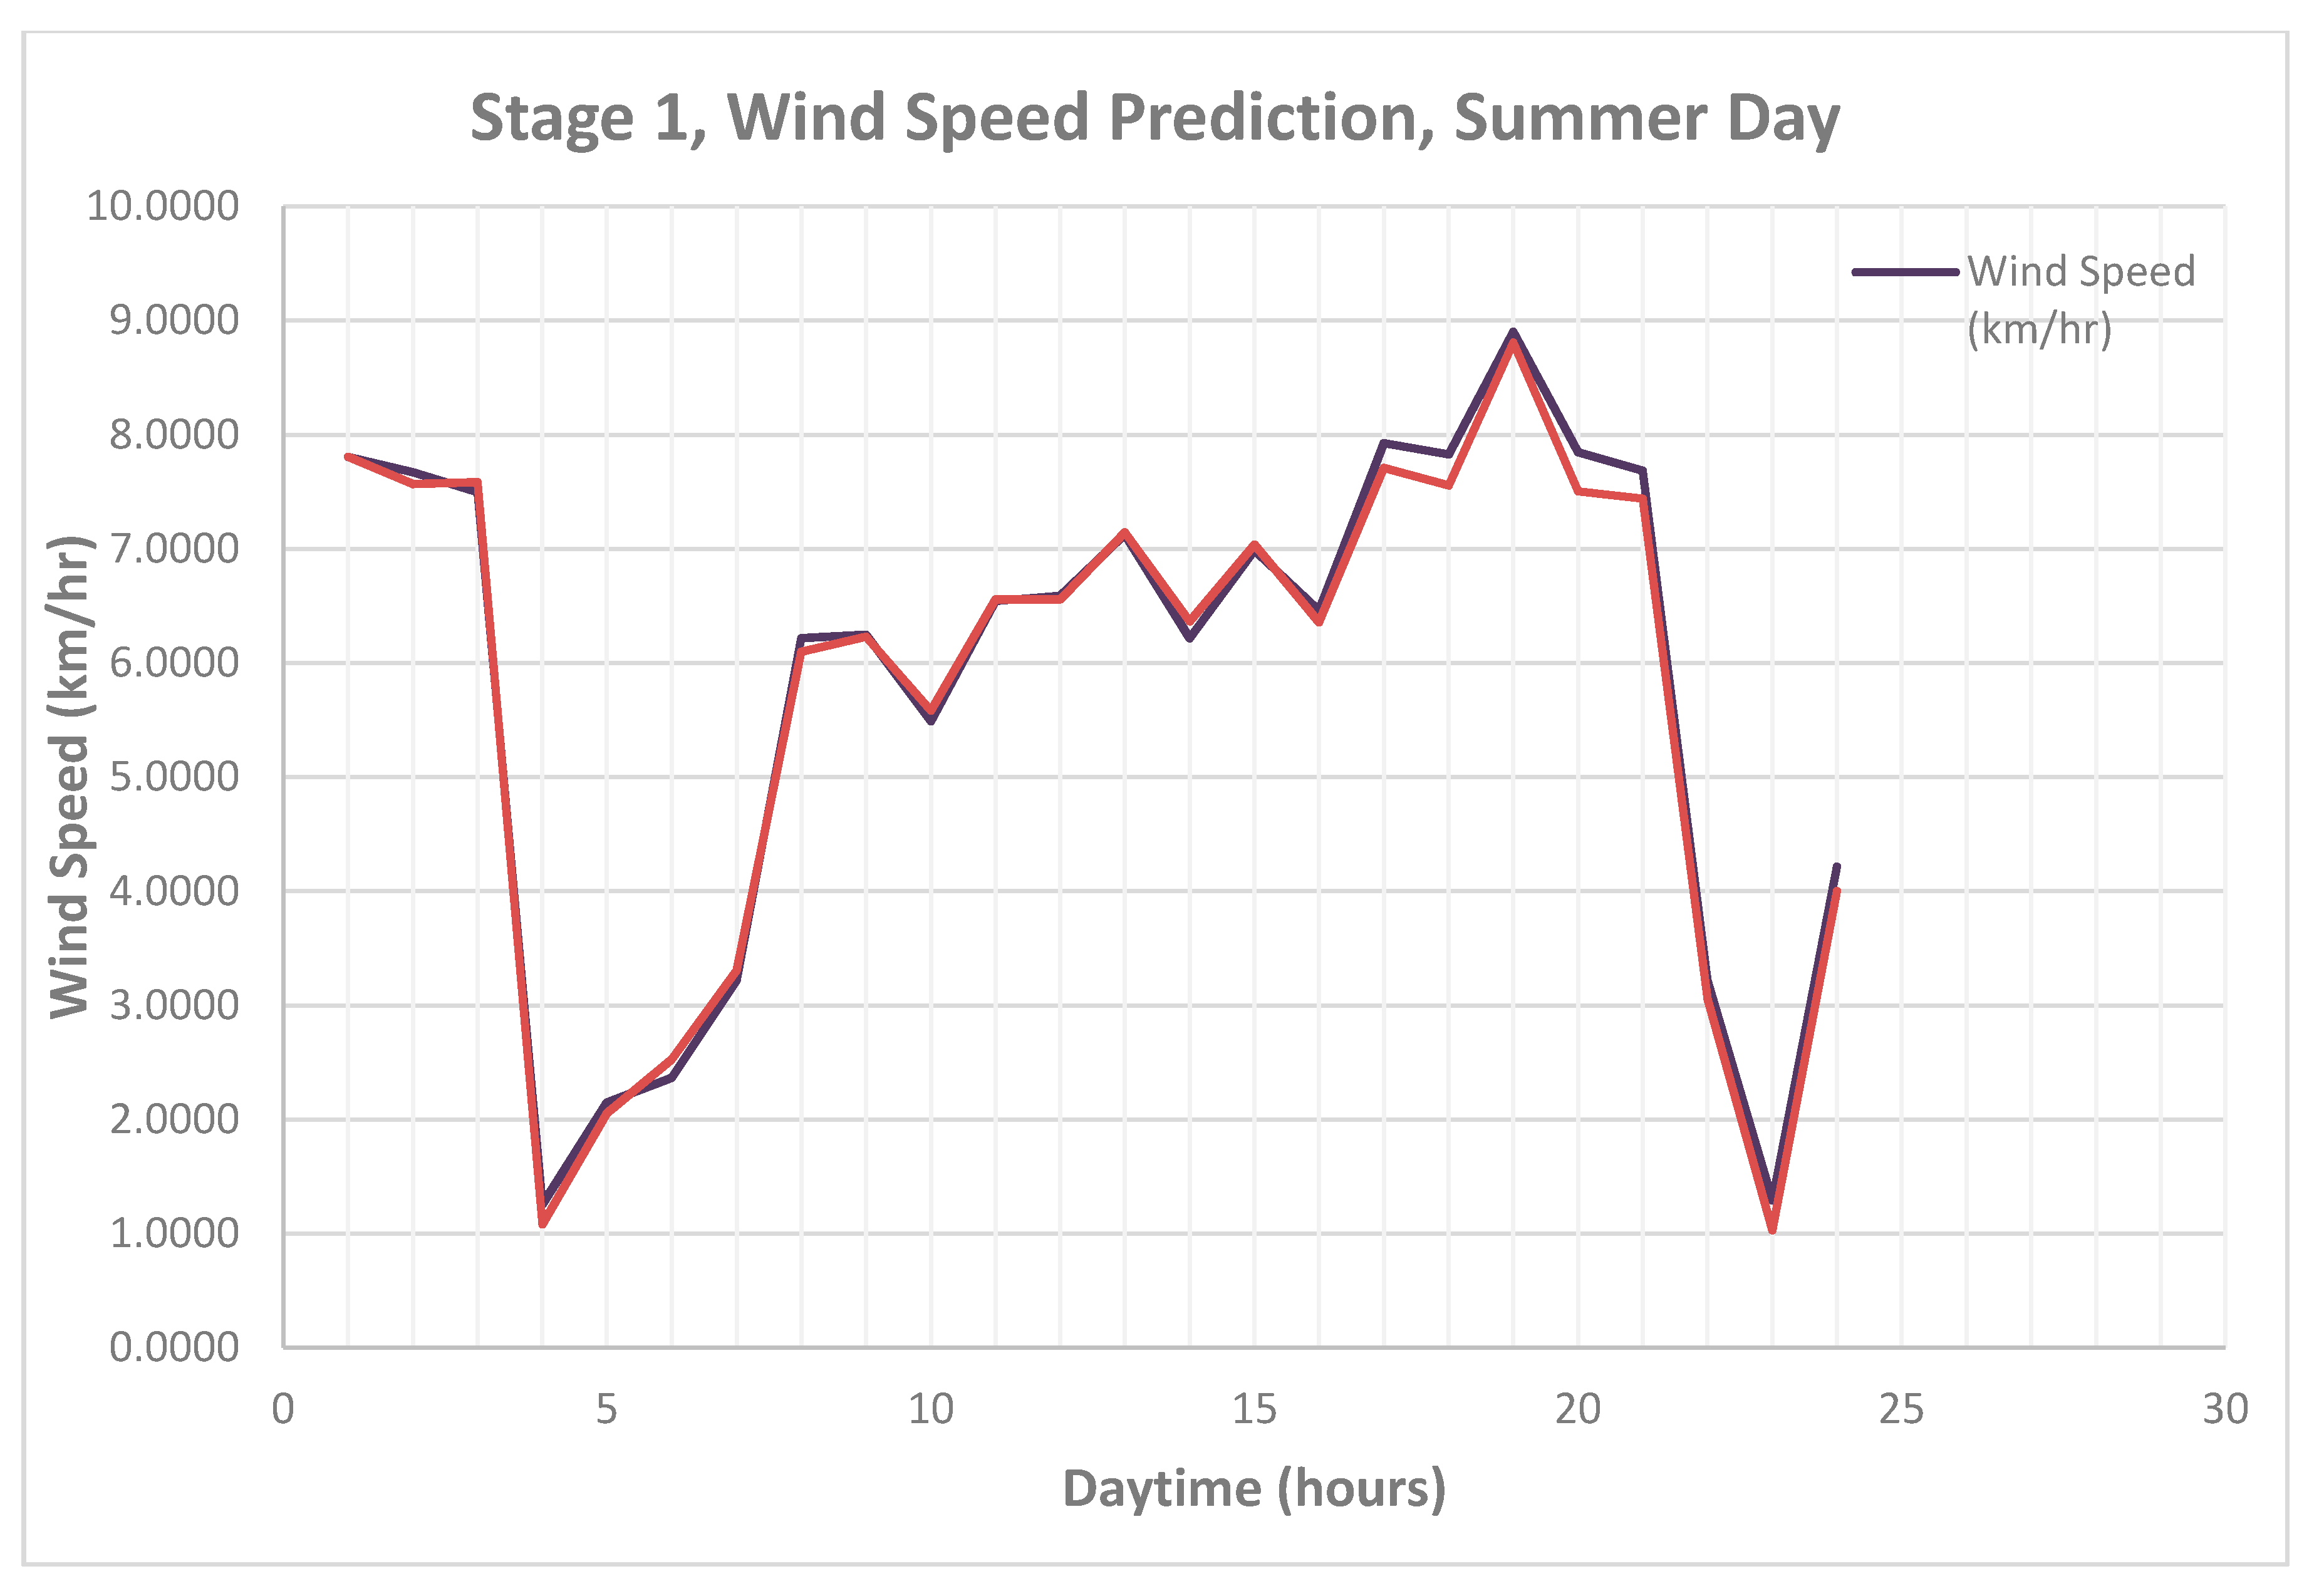
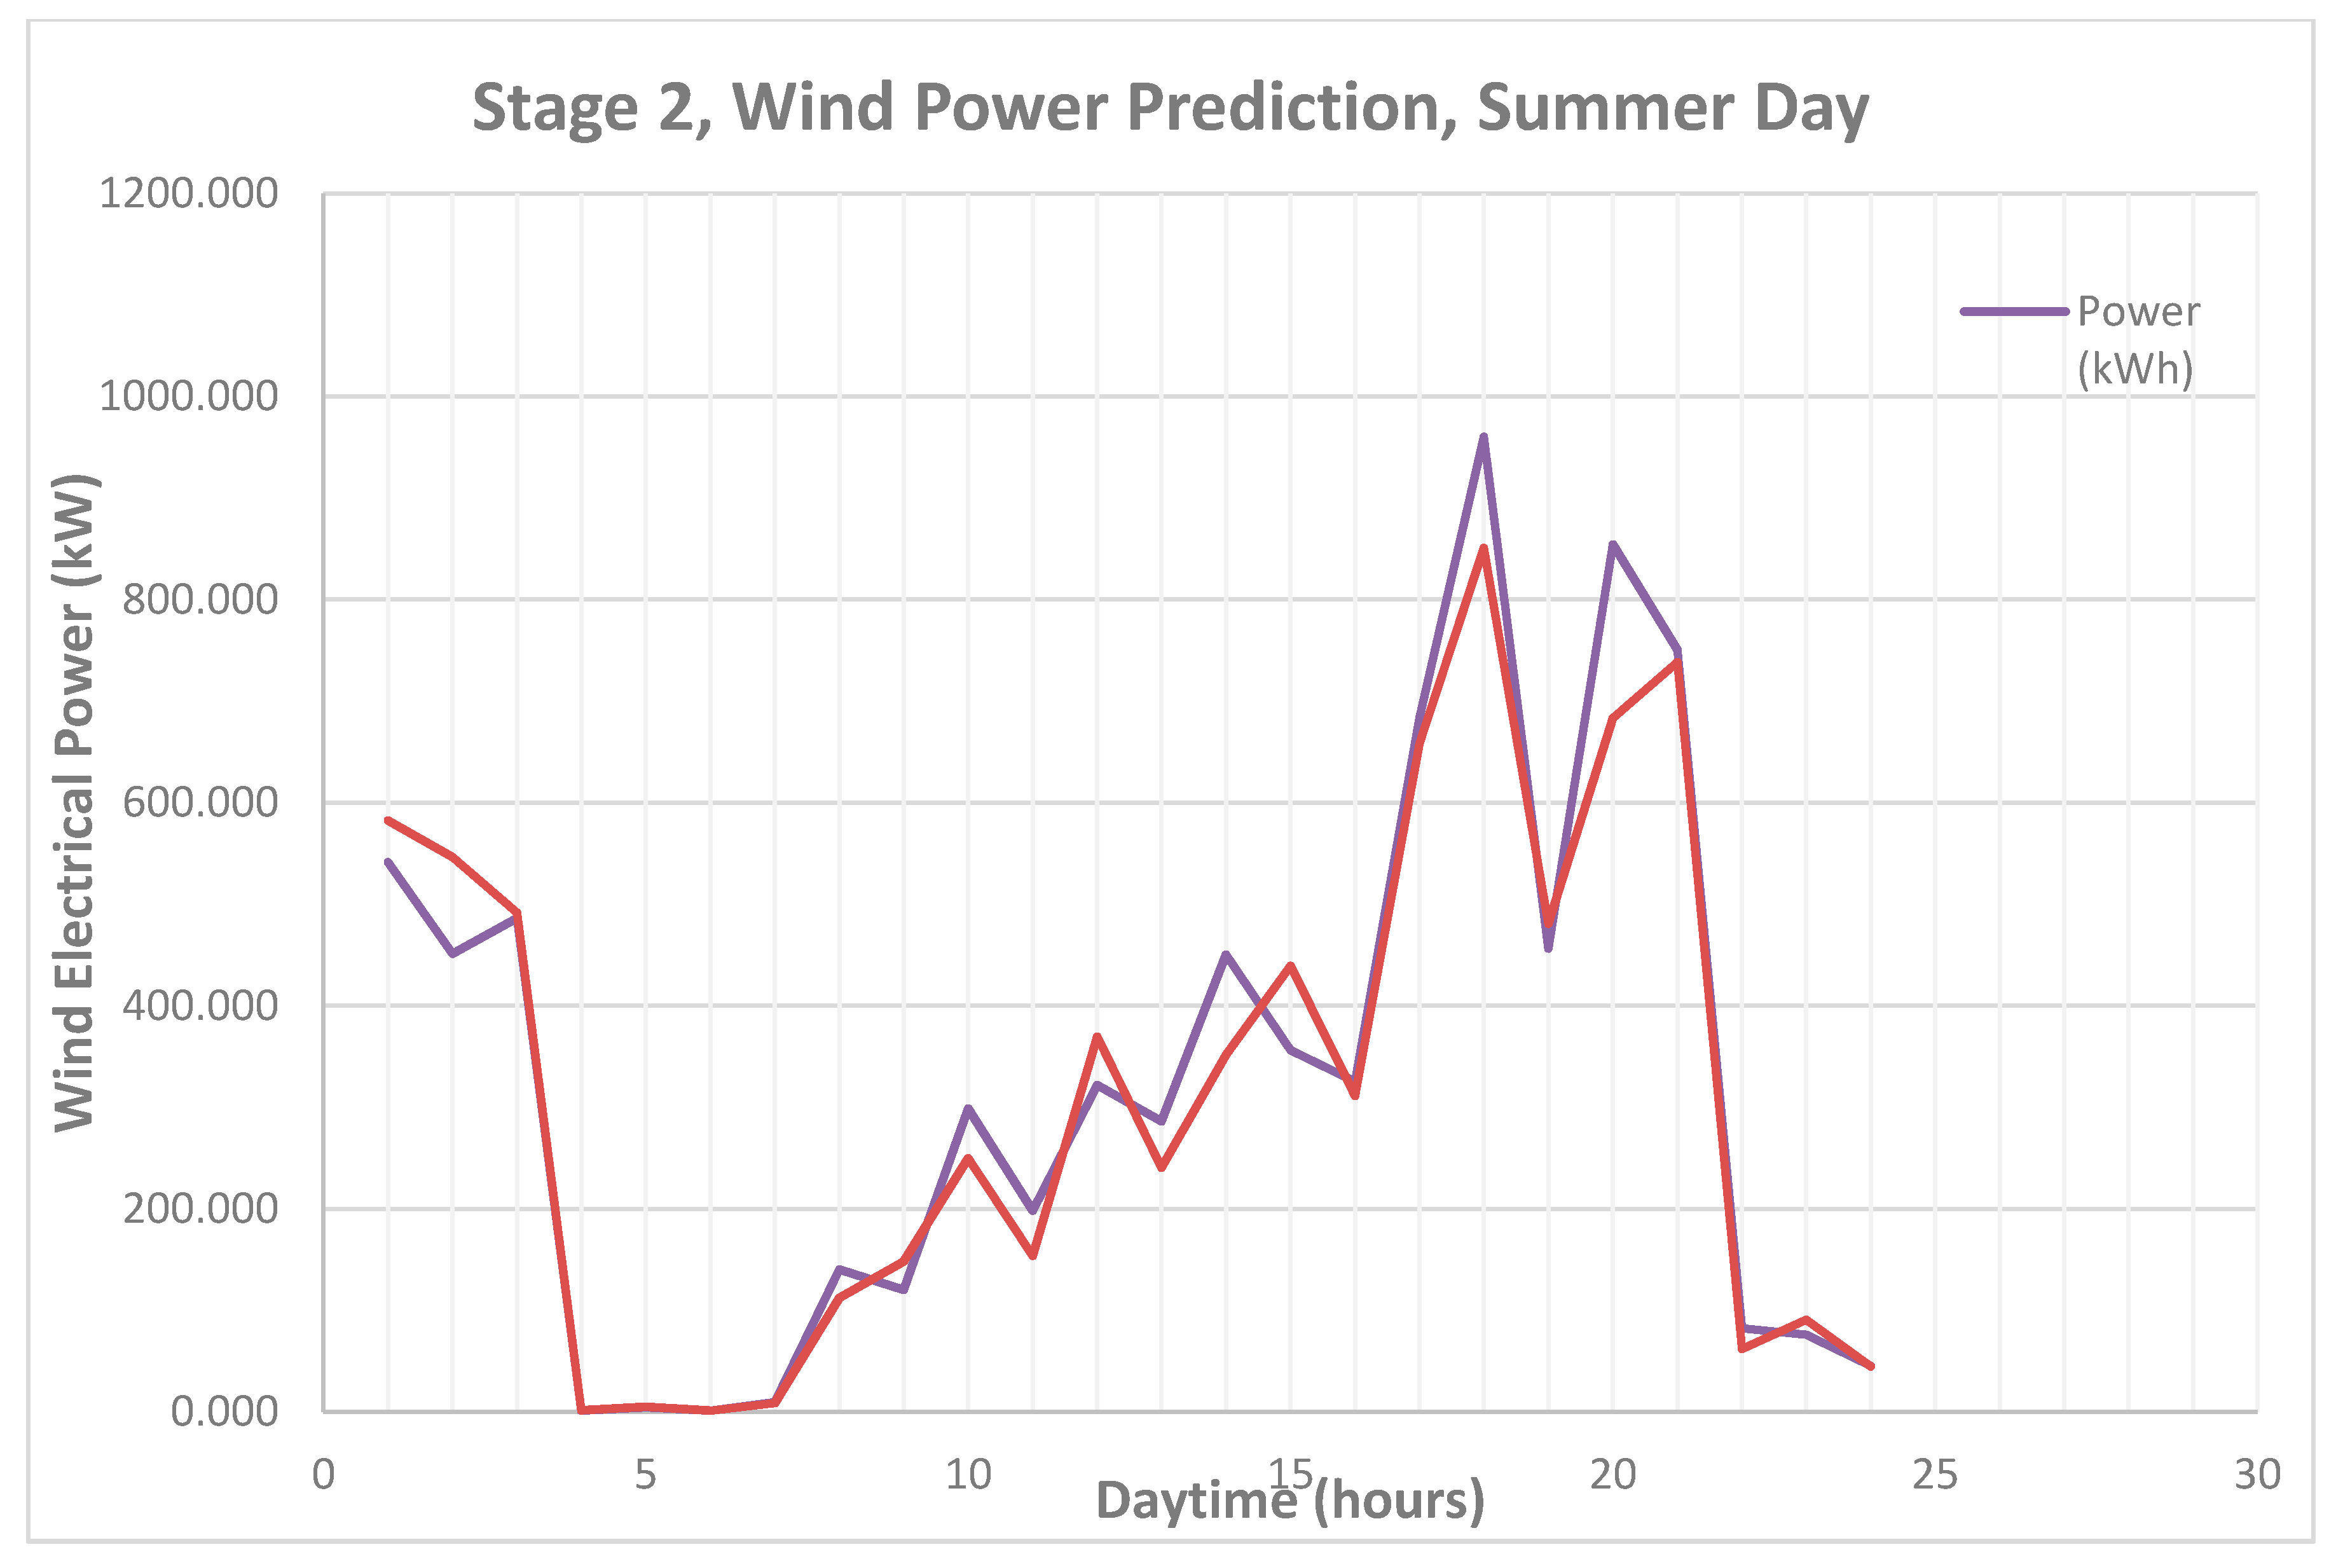
 Figure 11 and Figure 12 shows the predicted results for wind speed and wind electrical power for a summer day. There were strong winds from hour 15 to hour 20 thus the electrical power generation is the maximum for that duration. The forecasted and actual data are shown for the purpose of comparison.
Table 1, Table 2, Table 3 and Table 4 show the calculated accuracy criteria for the proposed model for 4 days. The first stage has comparatively a high error rate in comparison to the second stage.
In the case of spring day, the mean absolute percentage error value of 9.52% was observed in Stage 1 while this error was minimized by the use of a second stage and actual MAPE of 2.70% was observed in the prediction of wind electrical power.
As seen in Table 2, in the case of fall day, the mean absolute percentage error value of 4.49% was observed in Stage 1 while this error was increased at the second stage and actual MAPE of 5.64% was observed in the prediction of wind electrical power. Similarly, as seen in Table 3, in case of a winter day, the mean absolute percentage error value of 3.18% was observed in Stage 1 while this error was decreased at the second stage and actual MAPE of 1.03% was observed in the prediction of wind electrical power.
As seen in Table 4, in case of a summer day, the mean absolute percentage error value of 3.54% was observed in Stage 1 while this error was amplified at the second stage and actual MAPE of 13.75% was observed in the prediction of wind electrical power.
The summary analysis of errors is shown for each stage as Table 5 and Table 6. As seen in Table 5, the total average MAPE of 5.18% is observed in Stage 1 which is a good MAPE value for the first stage. Similarly, average SDE, RMSE and SSE values of 3.51, 0.16, 0.77 km/hour were observed in the prediction of wind speed.
As seen in Table 6, the total average MAPE of 5.78% was observed in prediction of electrical power. Compared to total power of 2800 kW these error values are very low, thus prediction accuracy is high.
Eseye, Zhang, and Zheng [36] reported the accuracy of DSN, DSHGN, DSHPN, DSA and DSHGA prediction model in the form of MAPE as 50.4%, 49.04%, 43.3%, 31.6% and 19.2%, respectively. Compared to our approach this MAPE value of 5.78% is superior and this shows the significance of the forecasting model proposed in this research. Input data dependency is another criterion for any forecasting model; for testing the input dependency of our model, the data set was distributed into 4 subsets containing unique input variables. These subsets were used to train our algorithm and subsequently case study based forecasting was performed to estimate the relationship of data towards the prediction accuracy of the model. Subset 1 contained information about the wind speed and direction only while subset 2 contained information about the wind speed, direction and air temperature. Subset 3 contained information on wind speed, direction, air temperature, and air pressure while subset 4 comprised of all the variables including wind speed, direction, air temperature, air pressure, and humidity.
The data dependency results for both stages can be seen in Table 7 and Table 8 where all the subsets are compared to MAPE errors for one day of each season. The data subset 4 has the best MAPE while subset 1 has the worst highest MAPE for both stages. Using only Subset 1 as input data led to an average MAPE of 5.67% and 6.57% in stage 1 and stage 2 respectively, while average MAPE was improved to 5.40% and 6.20% for stage 1 and 2 respectively in case of subset 2. Similarly, subset 3 and subset 4 led to mean MAPE of (5.39% & 5.92%) and (5.18% & 5.78%) respectively for subset 3 and subset 4. The average computation time for a full 5 input based prediction model using MATLAB on windows based computer having specification Intel Corei7-4510U 2.6 GHz (4 CPUs), 8 GB RAM was around 12 s, thus the proposed model is reliable, accurate, precise and requires less computational time.

6. Comparison of Developed Code DSHWPA with Five Other Forecasting Methods

The accuracy analysis was performed by analyzing the results using the MAPE criterion of the five existing algorithms including, Double-stage ANFIS (DSA), DSHGN (double-stage hybrid neural network combined with genetic algorithm), DSHGA (double-stage hybrid genetic algorithm with ANFIS), DSHPN (double-stage PSO and neural network), and DSN (double-stage neural network) with the developed algorithm in this paper, that is, DSHWPA (Dual-stage hybrid wavelet PSO ANFIS).
The algorithms were replicated in Matlab to analyze the forecasting prediction accuracy of the method developed in this research. For comparison, the MAPE criterion was selected, as this is the relevant criterion selected by various researchers in the field of Wind Power prediction. The results of analysis are summarized in Table 9 as shown below.
The accuracy analysis show that the MAPE of the DSHWPA technique developed in this study had an average value of 5.78% after second stage. As depicted in Table 9 using similar dataset and similar hardware the average value of MAPE for DSA, DSN, DSHGN, DSHGA, DSHPN were 7.18%, 11.82%, 10.62%, 6.75%, and 8.91%. The analysis revealed that the MAPE for the five techniques was improved by 19.50%, 51.10%, 45.56%, 14.31% and 35.11%. Based on the MAPE technique the developed technique resulted in at least 19.50% improvement from DSA method which is a significant for short-term wind power prediction thus our technique has significant edge over the highlighted five techniques based on the MAPE criterion.

7. Conclusions

This paper describes an approach to modelling and predicting short-term electric power generation of a wind farm using a dual-stage hybrid Wavelet-PSO-ANFIS model. The developed model takes input in the form of statistical and physical measurements, performs Wavelet transform of inputs and the model is run in a 2-stage form using training data for both models and based on the output of the first stage the output of the second stage is generated. An average MAPE value of 5.78% was observed with a low computational time of 12s, which was compared against preexisting prediction techniques. Discussion regarding the prediction accuracy and input data dependency was also performed and the model performed very well, even when the input data were divided into subsets. Future work requires the implementation of this model for forecasting of a medium sized wind farm and accuracy measurements for longer durations using actual data and implementation of this model in short-term prediction of other high-frequency phenomenon like oil prices, electricity prices, stock prices and so forth.

Author Contributions

Conceptualization, S.A. and Y.B.; Methodology, S.A., Y.B., Y.Y.Z. and P.S.G.; Software, S.A., Y.Y.Z. and P.S.G.; Validation, S.A., Y.Y.Z., P.S.G. and F.L.; Formal Analysis, S.A. and Y.B.; Investigation, Y.Y.Z. and P.S.G.; Resources, Y.B., Y.Y.Z. and P.S.G.; Data Curation, Y.Y.Z., P.S.G. and F.L.; Writing-Original Draft Preparation, S.A. and Y.B.; Writing-Review & Editing, Y.B. and F.L.; Visualization, S.A.; Supervision, Y.B.; Project Administration, Y.B. and F.L.; Funding Acquisition, Y.B. and F.L.

Funding

This research was funded by Natural Science Foundation of China (No.71871011) and State Grid Management Consulting Project (2018) of Safe and Green Dispatch Management Innovation in Central China Branch of State Grid of China.

Conflicts of Interest

The authors declare no conflict of interest.

References

  1. Abbey, C.; Joós, G. A Stochastic Optimization Approach to Rating of Energy Storage Systems in Wind-Diesel Isolated Grids. IEEE Trans Power Syst. 2009, 24, 418–426. [Google Scholar] [CrossRef]
  2. Juban, J.; Siebert, N.; Kariniotakis, G.N. Probabilistic Short-Term Wind Power Forecasting for the Optimal Management of Wind Generation. In Proceedings of the 2007 IEEE Lausanne Power Tech, Lausanne, Switzerland, 1–5 July 2007; pp. 683–688. [Google Scholar]
  3. Costa, A.; Crespo, A.; Navarro, J.; Lizcano, G.; Madsen, H.; Feitosa, E. A Review on the Young History of the Wind Power Short-Term Prediction. Renew. Sustain. Energy Rev. 2008, 12, 1725–1744. [Google Scholar] [CrossRef] [Green Version]
  4. Giebel, G.; Brownsword, R.; Kariniotakis, G.; Denhard, M.; Draxl, C. The State-of-the-Art in Short-Term Prediction of Wind Power: A Literature Overview. 2011. Available online: https://www.researchgate.net/publication/37628356_Neural_Network_Models_for_Electricity_Market_Forecasting (accessed on 2 June 2018).
  5. Landberg, L. Short-Term Prediction of the Power Production from Wind Farms. J. Wind Eng. Ind. Aerodyn. 1999, 80, 207–220. [Google Scholar] [CrossRef]
  6. Damousis, I.G.; Alexiadis, M.C.; Theocharis, J.B.; Dokopoulos, P.S. A Fuzzy Model for WIND Speed Prediction and Power Generation in Wind Parks Using Spatial Correlation. IEEE Trans. Energy Convers. 2004, 19, 352–361. [Google Scholar] [CrossRef]
  7. Barbounis, T.G.; Theocharis, J.B. A locally Recurrent Fuzzy Neural Network with Application to the Wind Speed Prediction Using Spatial Correlation. Neurocomputing 2007, 70, 1525–1542. [Google Scholar] [CrossRef]
  8. Kariniotakis, G.N.; Stavrakakis, G.S.; Nogaret, E.F. Wind Power Forecasting Using Advanced Neural Networks Models. IEEE Trans. Energy Convers. 1996, 11, 762–767. [Google Scholar] [CrossRef]
  9. Hu, Z.; Bao, Y.; Chiong, R.; Xiong, T. Mid-term Interval Load Forecasting using Multi-output Support Vector Regression with a Memetic Algorithm for Feature Selection. Energy 2015, 84, 419–431. [Google Scholar] [CrossRef]
  10. Hu, Z.; Bao, Y.; Xiong, T.; Chiong, R. Hybrid Filter–Wrapper Feature Selection for Short-term Load Forecasting. Eng. Appl. Artif. Intell. 2015, 40, 17–27. [Google Scholar] [CrossRef]
  11. Li, G.; Shi, J. On Comparing Three Artificial Neural Networks for Wind Speed Forecasting. Appl. Energy 2010, 87, 2313–2320. [Google Scholar] [CrossRef]
  12. Blonbou, R. Very Short-Term Wind Power Forecasting with Neural Networks and Adaptive Bayesian Learning. Renew. Energy 2011, 36, 1118–1124. [Google Scholar] [CrossRef]
  13. Catalao, J.P.D.S.; Pousinho, H.M.I.; Mendes, V.M.F. Short-term Wind Power Forecasting in Portugal by Neural Networks and Wavelet Transform. Renew. Energy 2011, 36, 1245–1251. [Google Scholar] [CrossRef]
  14. Xiong, T.; Bao, Y.; Hu, Z. Interval Forecasting of Electricity Demand: A Novel Bivariate EMD-based Support Vector Regression Modeling Framework. Int. J. Electr. Power Energy Syst. 2014, 63, 353–362. [Google Scholar] [CrossRef]
  15. Sideratos, G.; Hatziargyriou, N. Using Radial Basis Neural Networks to Estimate Wind Power Production. In Proceedings of the Power Engineering Society General Meeting, Tampa, FL, USA, 24–28 June 2007; pp. 1–7. [Google Scholar]
  16. Louka, P.; Galanis, G.; Siebert, N.; Kariniotakis, G.; Katsafados, P.; Pytharoulis, I.; Kallos, G. Improvements in Wind Speed Forecasts for Wind Power Prediction Purposes Using Kalman Filtering. J. Wind Eng. Ind. Aerodynamics 2008, 96, 2348–2362. [Google Scholar] [CrossRef] [Green Version]
  17. Pousinho, H.M.I.; Mendes, V.M.F.; Catalão, J.P.S. Neuro-fuzzy Approach to Forecast Wind Power in Portugal. In Proceedings of the International Conference on Renewable Energies and Power Quality (ICREPQ’10), Granada, Spain, 23–25 March 2010. [Google Scholar]
  18. Pousinho, H.M.I.; Mendes, V.M.F.; Catalão, J.P.D.S. A Hybrid PSO–ANFIS Approach for Short-Term Wind Power Prediction in Portugal. Energy Convers. Manag. 2011, 52, 397–402. [Google Scholar] [CrossRef]
  19. Catalao, J.P.S.; Pousinho, H.M.I.; Mendes, V.M.F. Hybrid Wavelet-PSO-ANFIS Approach for Short-Term Wind Power Forecasting in Portugal. IEEE Trans. Sustain. Energy 2011, 2, 50–59. [Google Scholar]
  20. Sanchez, I. Short-Term Prediction of Wind Energy Production. Int. J. Forecast. 2006, 22, 43–56. [Google Scholar] [CrossRef]
  21. Negnevitsky, M.; Johnson, P.L.; Santoso, S. Short Term Wind Power Forecasting Using Hybrid Intelligent Systems. In Proceedings of the 2007 IEEE Power Engineering Society General Meeting, Tampa, FL, USA, 24–28 June 2007. [Google Scholar]
  22. Jursa, R. Wind power prediction with different artificial intelligence models. In Proceedings of the 2007 European Wind Energy Conference and Exhibition, Milan, Italy, 7–10 May 2007; pp. 1–10. [Google Scholar]
  23. Fan, S.; Liao, J.R.; Yokoyama, R.; Chen, L.; Lee, W.J. Forecasting the Wind Generation Using a Two-Stage Network Based on Meteorological Information. IEEE Trans. Energy Convers. 2009, 24, 474–482. [Google Scholar] [CrossRef]
  24. Charabi, Y. Arabian Summer Monsoon Variability: Teleconexion to ENSO and IOD. Atmos. Res. 2009, 91, 105–117. [Google Scholar] [CrossRef]
  25. Bashir, S.M.A.; Ghouri, F.A.K. Perspective Texture Synthesis Based on Improved Energy Optimization. PLoS ONE 2014, 9, e110622. [Google Scholar] [CrossRef] [PubMed]
  26. Conejo, A.J.; Plazas, M.A.; Espinola, R.; Molina, A.B. Day-ahead Electricity Price Forecasting Using the Wavelet Transform and ARIMA Models. IEEE Trans. Power Syst. 2005, 20, 1035–1042. [Google Scholar] [CrossRef]
  27. Giebel Amjady, N.; Keynia, F. Short-Term Load Forecasting of Power Systems by Combination of Wavelet Transform and Neuro-Evolutionary Algorithm. Energy 2009, 34, 46–57. [Google Scholar] [CrossRef]
  28. Reis, A.R.; Da Silva, A.A. Feature Extraction Via Multiresolution Analysis for Short-Term Load Forecasting. IEEE Trans. Power Syst. 2005, 20, 189–198. [Google Scholar]
  29. Mallat, S.G. A Theory for Multiresolution Signal Decomposition: The Wavelet Representation. IEEE Trans. Pattern Anal. Mach. Intell. 1989, 11, 674–693. [Google Scholar] [CrossRef]
  30. Xu, Z.; Dong, Z.Y.; Liu, W.Q. Neural Network Models for Electricity Market Forecasting. Neural Netw. Appl. Inf. Tech. Web Eng. 2005, 1, 233–245. [Google Scholar]
  31. Del Valle, Y.; Venayagamoorthy, G.K.; Mohagheghi, S.; Hernandez, J.C.; Harley, R.G. Particle Swarm Optimization: Basic Concepts, Variants and Applications in Power Systems. IEEE Trans. Evol. Comput. 2008, 12, 171–195. [Google Scholar] [CrossRef]
  32. Rodriguez, C.P.; Anders, G.J. Energy price forecasting in the Ontario competitive power system market. IEEE Trans. Power Syst. 2004, 19, 366–374. [Google Scholar] [CrossRef]
  33. Ying, L.C.; Pan, M.C. Using adaptive network based fuzzy inference system to forecast regional electricity loads. Energy Convers. Manag. 2008, 49, 205–211. [Google Scholar] [CrossRef]
  34. Yun, Z.; Quan, Z.; Caixin, S.; Shaolan, L.; Yuming, L.; Yang, S. RBF neural network and ANFIS-based short-term load forecasting approach in real-time price environment. IEEE Trans. Power Syst. 2008, 23, 853–858. [Google Scholar]
  35. Jang, J.S. ANFIS: Adaptive-network-based fuzzy inference system. IEEE Trans. Syst. Man. Cybern. 1993, 23, 665–685. [Google Scholar] [CrossRef]
  36. Li, H.; Eseye, A.T.; Zhang, J.; Zheng, D. A Double-Stage Hierarchical Hybrid PSO-ANFIS Model for Short-Term Wind Power Forecasting. In Proceedings of the 2017 Ninth Annual IEEE Green Technologies Conference (GreenTech), Denver, CO, USA, 29–31 March 2017; pp. 342–349. [Google Scholar]
Figure 1. Proposed Double Staged Wavelet-PSO-ANFIS Forecasting Model.
Energies 11 02822 g001
Figure 2. Updating Position using PSO [19].
Energies 11 02822 g002
Figure 3. Basic ANFIS Structure.
Energies 11 02822 g003
Figure 4. Proposed Double Staged Wavelet-PSO-ANFIS Flowchart.
Energies 11 02822 g004
Figure 5. Wind Speed forecasting results from Stage 1, Spring Day.
Energies 11 02822 g005
Figure 6. Wind Electrical Power forecasting results from Stage 2, Spring Day.
Energies 11 02822 g006
Figure 7. Wind Speed forecasting results from Stage 1, Fall Day.
Energies 11 02822 g007
Figure 8. Wind Electrical Power forecasting results from Stage 2, Fall Day.
Energies 11 02822 g008
Figure 9. Wind Speed forecasting results from Stage 1, Winter Day.
Energies 11 02822 g009
Figure 10. Wind Electrical Power forecasting results from Stage 2, Winter Day.
Energies 11 02822 g010
Figure 11. Wind Speed forecasting results from Stage 1, Summer Day.
Energies 11 02822 g011
Figure 12. Wind Electrical Power forecasting results from Stage 2, Summer Day.
Energies 11 02822 g012
Table 1. Accuracy Analysis of the Proposed Method—Spring Day.
CriteriaStage 1Stage 2
MAPE9.52%2.70%
RMSE0.2512.20
SSE1.2159.78
SDE0.7212.17
Table 2. Accuracy Analysis of the Proposed Method—Fall Day.
CriteriaStage 1Stage 2
MAPE4.49%5.64%
RMSE0.0815.06
SSE0.3973.79
SDE0.9615.03
Table 3. Accuracy Analysis of the Proposed Method—Winter Day.
CriteriaStage 1Stage 2
MAPE3.18%1.03%
RMSE0.158.13
SSE0.7239.84
SDE1.038.07
Table 4. Accuracy Analysis of the Proposed Method—Summer Day.
CriteriaStage 1Stage 2
MAPE3.54%13.75%
RMSE0.1658.17
SSE0.77284.97
SDE11.3256.99
Table 5. Accuracy Analysis Summary—Stage 1.
DaySSERMSESDEMAPE
Spring1.210.250.729.52%
Fall0.390.080.964.49%
Winter0.720.151.033.18%
Summer0.770.1611.323.54%
Average0.770.163.515.18%
Table 6. Accuracy Analysis Summary—Stage 2.
DaySSERMSESDEMAPE
Spring59.7812.2012.172.70%
Fall73.7915.0615.035.64%
Winter39.848.138.071.03%
Summer284.9758.1756.9913.75%
Average114.5923.3923.075.78%
Table 7. Input Data Dependency Results—Stage 1.
DaySet 1Set 2Set 3Set 4
Spring10.17%9.87%9.94%9.52%
Fall5.11%4.61%4.52%4.49%
Winter3.76%3.52%3.47%3.18%
Summer3.65%3.59%3.61%3.54%
Average5.67%5.40%5.39%5.18%
Table 8. Input Data Dependency Results—Stage 2.
DaySet 1Set 2Set 3Set 4
Spring3.15%3.11%2.78%2.70%
Fall6.47%5.68%5.85%5.64%
Winter2.14%1.83%1.15%1.03%
Summer14.51%14.18%13.89%13.75%
Average6.57%6.20%5.92%5.78%
Table 9. Comparison of Results of DSHWPA with DSA, DSN, DSHGN, DSHGA, DSHPN.
SpringFallWinterSummerAverage
DSA11.51%4.98%5.88%6.36%7.18%
DSN14.54%8.86%11.41%12.48%11.82%
DSHGN13.54%7.76%9.91%11.27%10.62%
DSHGA6.15%3.15%5.54%12.15%6.75%
DSHPN12.41%5.14%7.15%10.94%8.91%
DSHWPA2.70%5.64%1.03%13.75%5.78%

