The target building for this case study is a real building called LUCIA, designed to be nZEB and near zero CO
2 emissions using renewable energies (
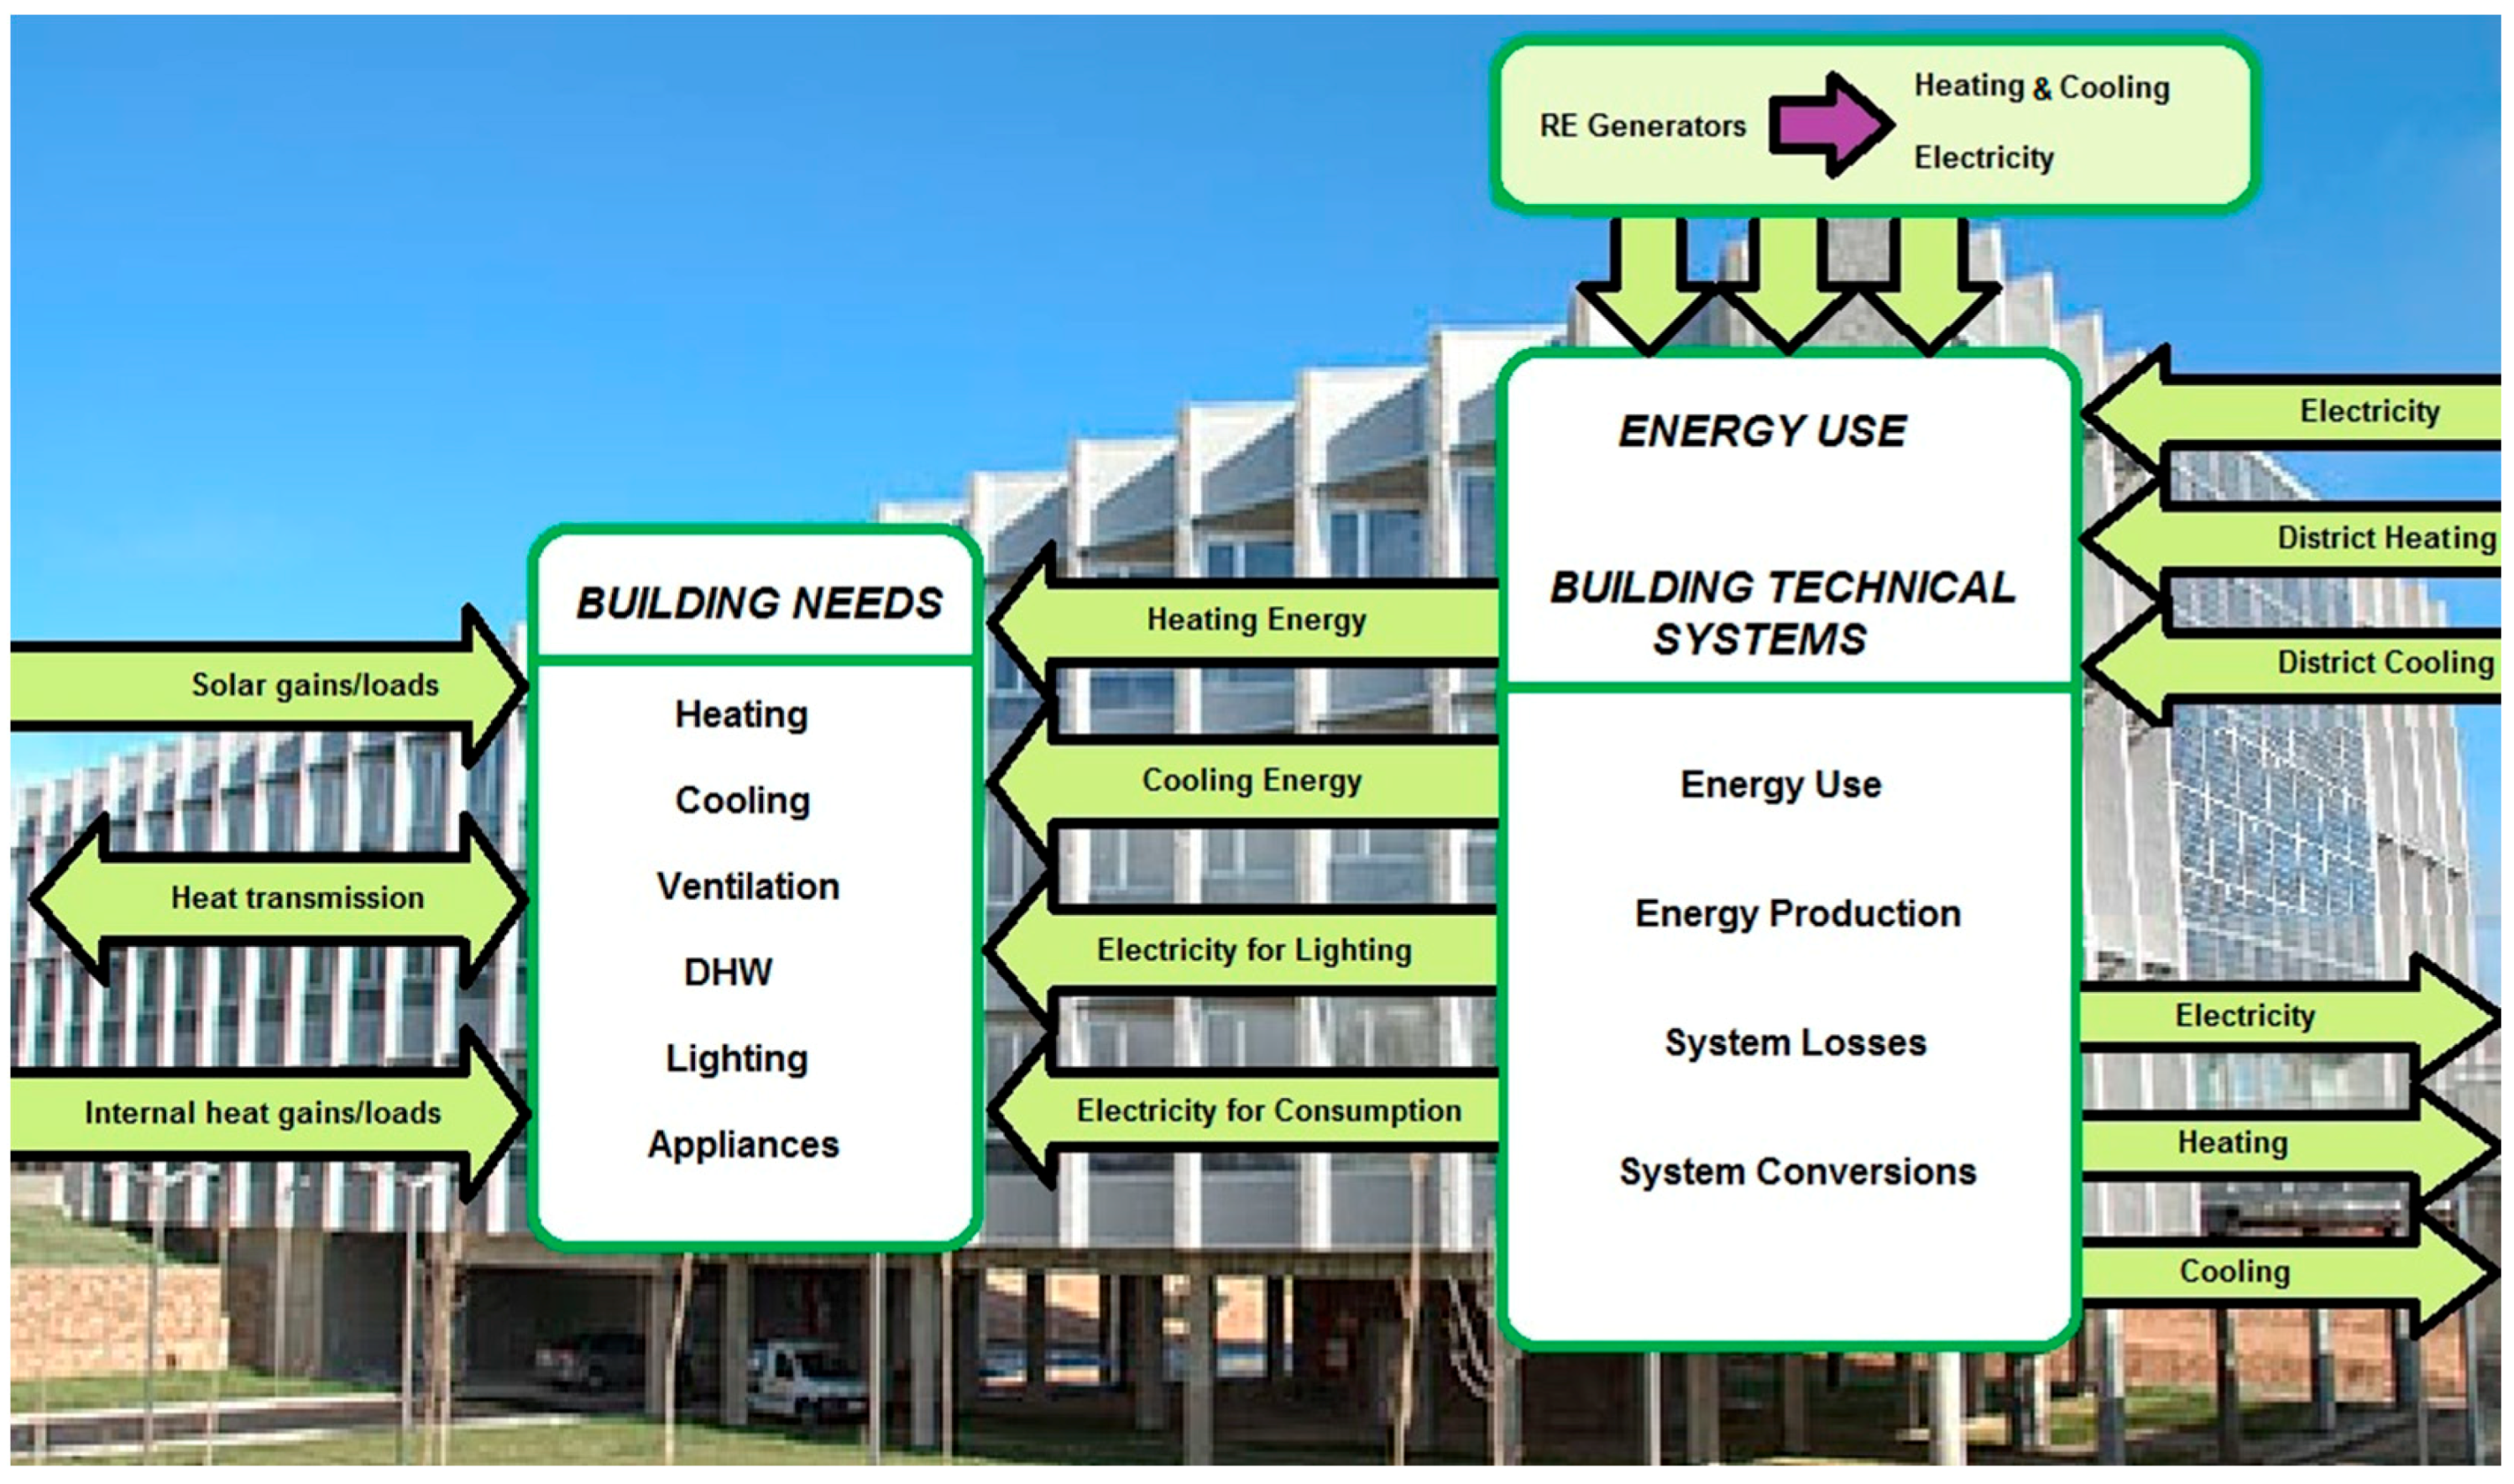
Table 1). The building, which belongs to the University of Valladolid, was indeed intended as an “on-field” laboratory for the application of innovative and renewable energy technologies. The energy model of a nZEB shown in
Figure 1 was followed at a design stage and quality checks were also carried out during the construction to ensure that the provided model and the actual building characteristics match, as recommended [
23,
24].
According to the latest Köppen–Geiger classification, the typical climate of the location is Csb, hence a temperate climate with dry, warm summers [
25]. Regarding some of the climate parameters [
6], radiation available is relevant during most of the year. Despite being considered as a “temperate” climate at a World scale, outdoor temperatures during winter are low enough to make heat recovery quite interesting. During summer days, large variations of temperature occur, which favors free-cooling [
26].
The building under study is considered one of the leading nZEBs in the world, qualified with the second highest Leadership in Energy and Environmental Design LEED score in the world [
27], among other certifications [
6,
28]. Its bioclimatic design, increased insulation, passive ventilation and other strategies allow a reduction in building thermal energy requirements by more than 50%. The main constructive peculiarity is the zigzag shaped façade to reorient the windows to the south, all equipped with carefully designed shadowing. Indoor thermal loads are minimized through double-glazing argon-filled windows and an optimally thermal insulated envelope. The large glazed façade, covering 46% of the total vertical wall area, together with light tubes and high efficiency luminaries, whose intensity is controlled by occupancy and lux level, enable 45% savings in lighting. One further design consideration was the Life Cycle Analysis of materials. Construction elements and materials are partly recycled and they are all certified for their low emissions and energy consumption during their manufacture. Finally, this building provides new water saving systems through the reuse of rainwater, from the parking and the roof, and gray water with separation networks in the laboratories, which allow treatment prior to discharge; taps with integrated electronic technology, with the capacity to supply a reduced and optimal flow. A green roof with local vegetation, which does not need additional irrigation, helps to counteract the urban-heat-island effect [
6,
28].The renewable energy technologies designed, implemented and monitored in the LUCIA building are described next.
2.1. Renewable Energies Implemented in the LUCIA nZEB
The design RER of the LUCIA building is 0.66 [
6]. It was planned to reduce the use of non-renewable resources by 31%, compared to the primary energy of a standard building, and the building's impact on climate change by more than 90%.
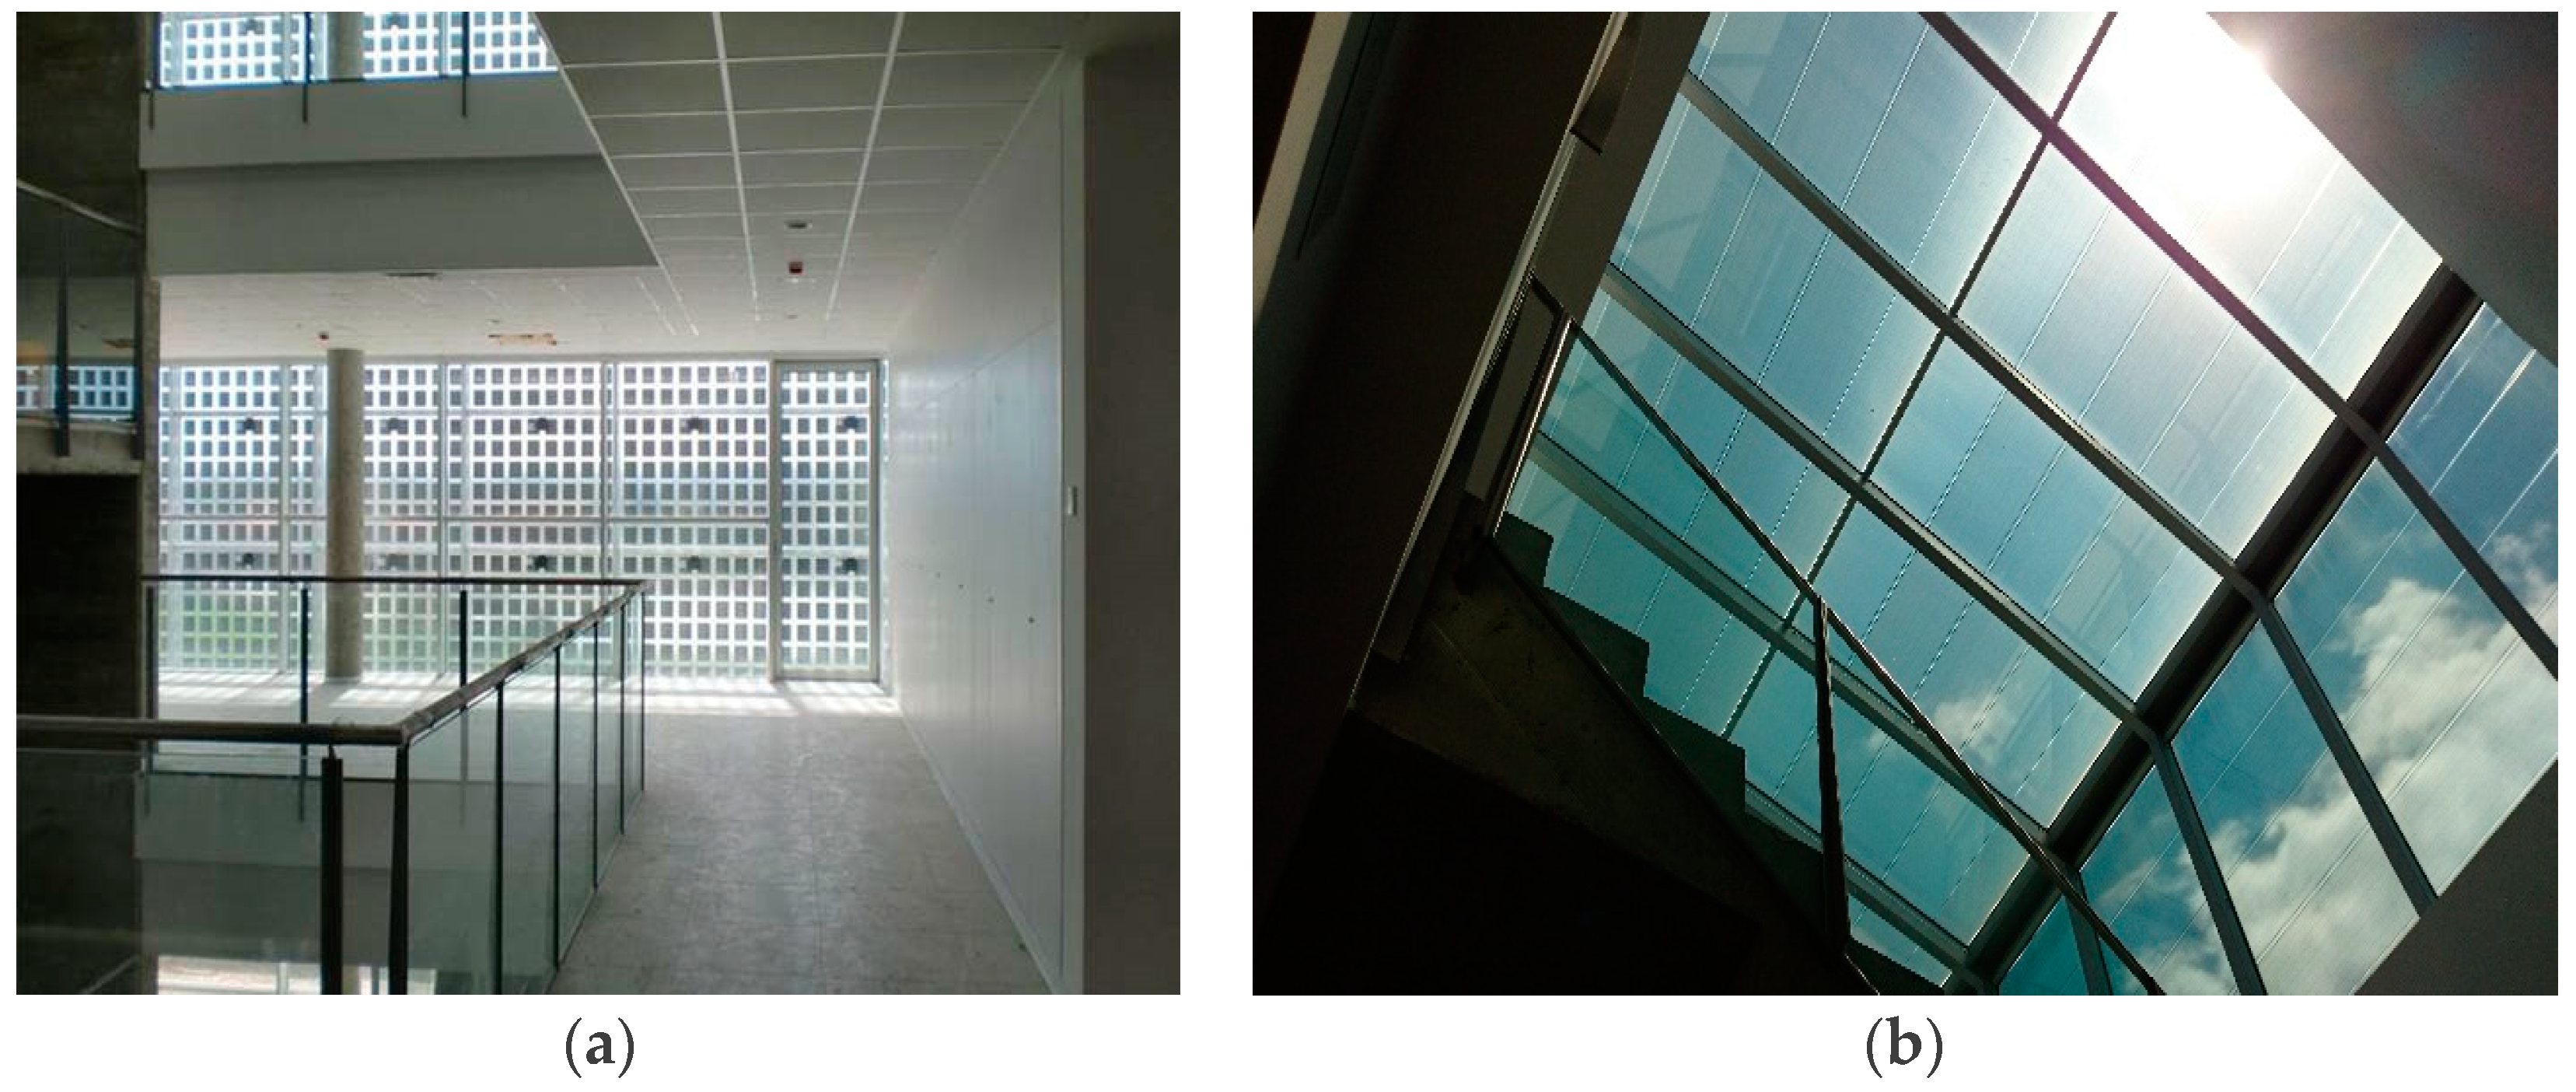
The building provides simple solutions for the architectural integration of solar energy PV. The modules are integrated within the glazing to permit PV generation without hindering natural lighting. One set of PV modules are installed on the southeast façade, integrated as a ventilated facade system (
Figure 2a), and three further systems in the skylights (
Figure 2b).
Façade PV modules (hereinafter referred as “PV 1”) consist of 6”polycrystalline cells, with dimensions 1730 × 1015 × 35 mm. The other three PV modules (PV 2, PV 3 and PV 4) on the roof are amorphous silicon. Each pane of the skylights has dimensions of 2120 × 1245 mm.
Table 2 gathers the characteristics of the photovoltaic panels installed in each zone. The analysis registers the data of the largest system separately from the remaining three.
High efficient HVAC systems meet the remaining thermal demand that cannot be met by the passive strategies described before. An air-water HVAC system was chosen instead of an all air system, to supply heating and cooling independently from the required ventilation rate. Heating and cooling to the different indoor spaces are supplied by 4-tube fancoil systems that permit simultaneous cooling and heating and control of individual demand.
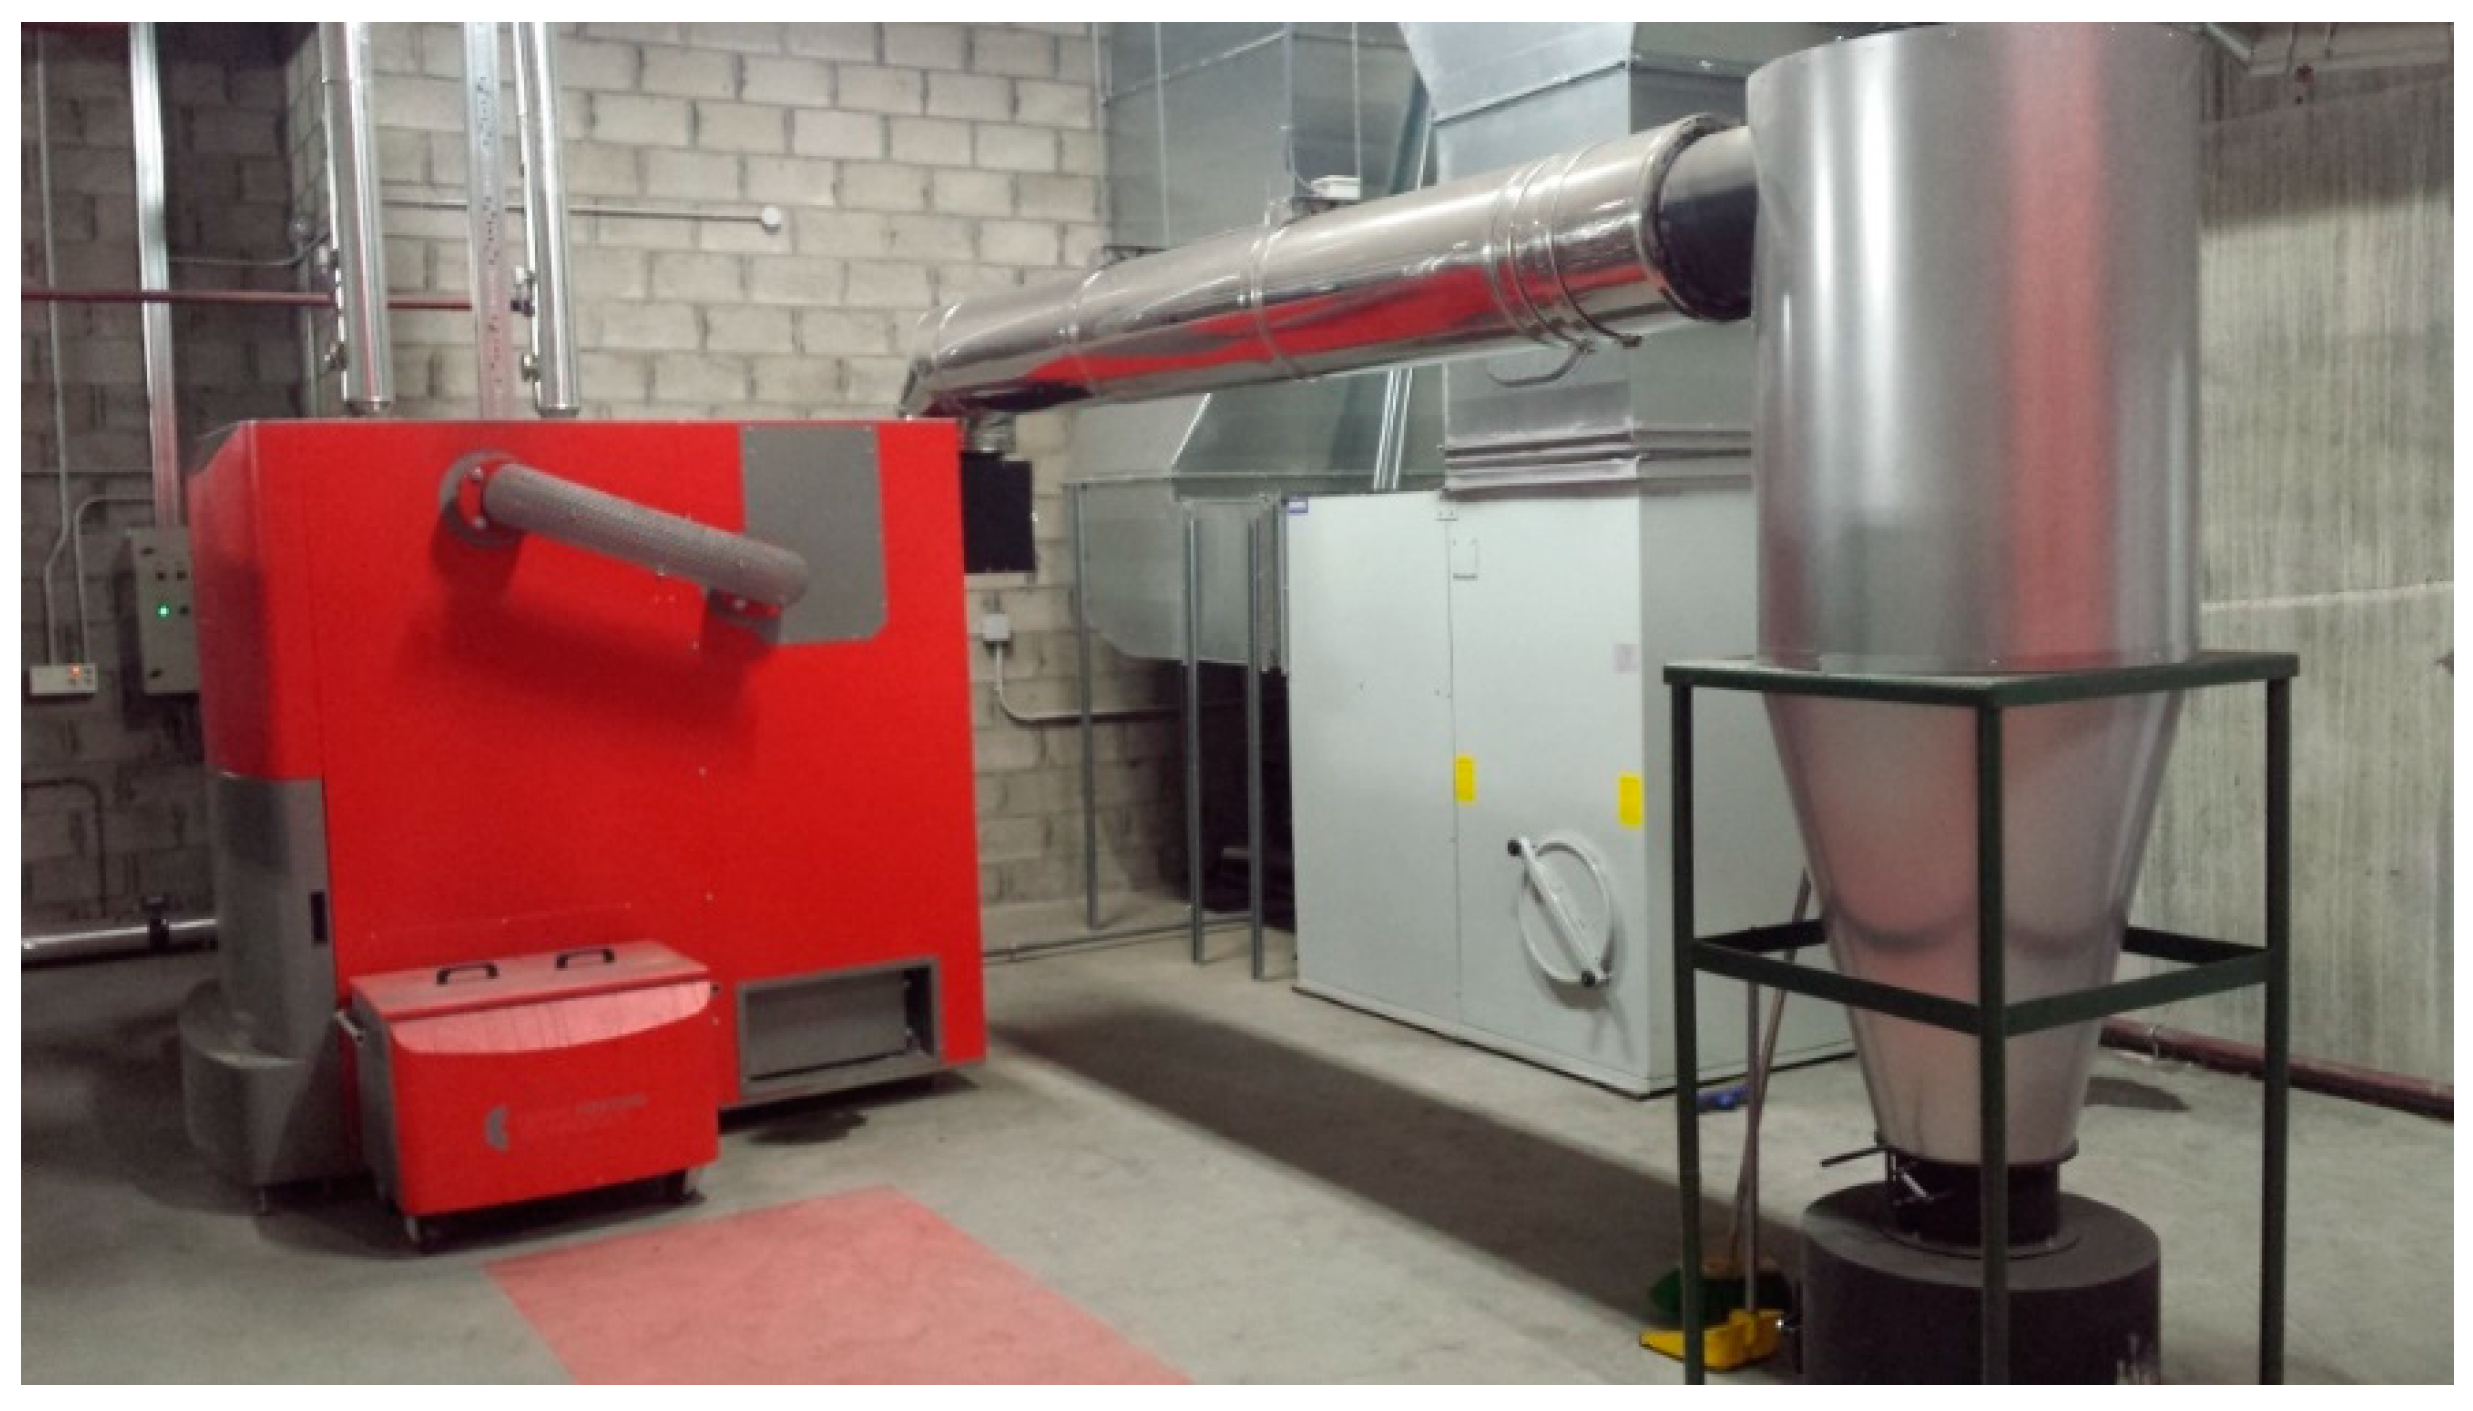
The biomass boiler was designed to provide the heating and partial cooling demand of the building by single effect absorption system. The biomass boiler (
Figure 3), whose nominal power is 329 kW and its performance factor 0.88, supplies heating. It is fueled with wood chips, widely available in the region where the building is located, being G30 H20 forest biomass chips in accordance with the Austrian standards (Önorm M7 133) [
29], with a Low Heating Value (LHV) of 3.6 kWh/kg.
An absorption cycle of 176 kW and Energy Efficiency Ratio (EER) 0.7 and an auxiliary conventional chiller of 232.7 kW and EER 3.3 provide the refrigeration demand. A cooling tower enables the removal of the residual heat produced by the absorption system.
The building’s Air Handling Unit (AHU) provides 100% outdoor air ventilation, which reaches 15,000 m3/h. The AHU is equipped with a plate-type heat recovery economizer and permits operation in free-cooling mode. When free-cooling is not enough to reach indoor comfort, an EAHX system is used. When neither the former nor the latter are enough to achieve thermal comfort/supply the ventilation loads, the heat recovery starts operating. The biomass heating and the absorption cooling supply the remaining loads that the combined ventilation system cannot meet.
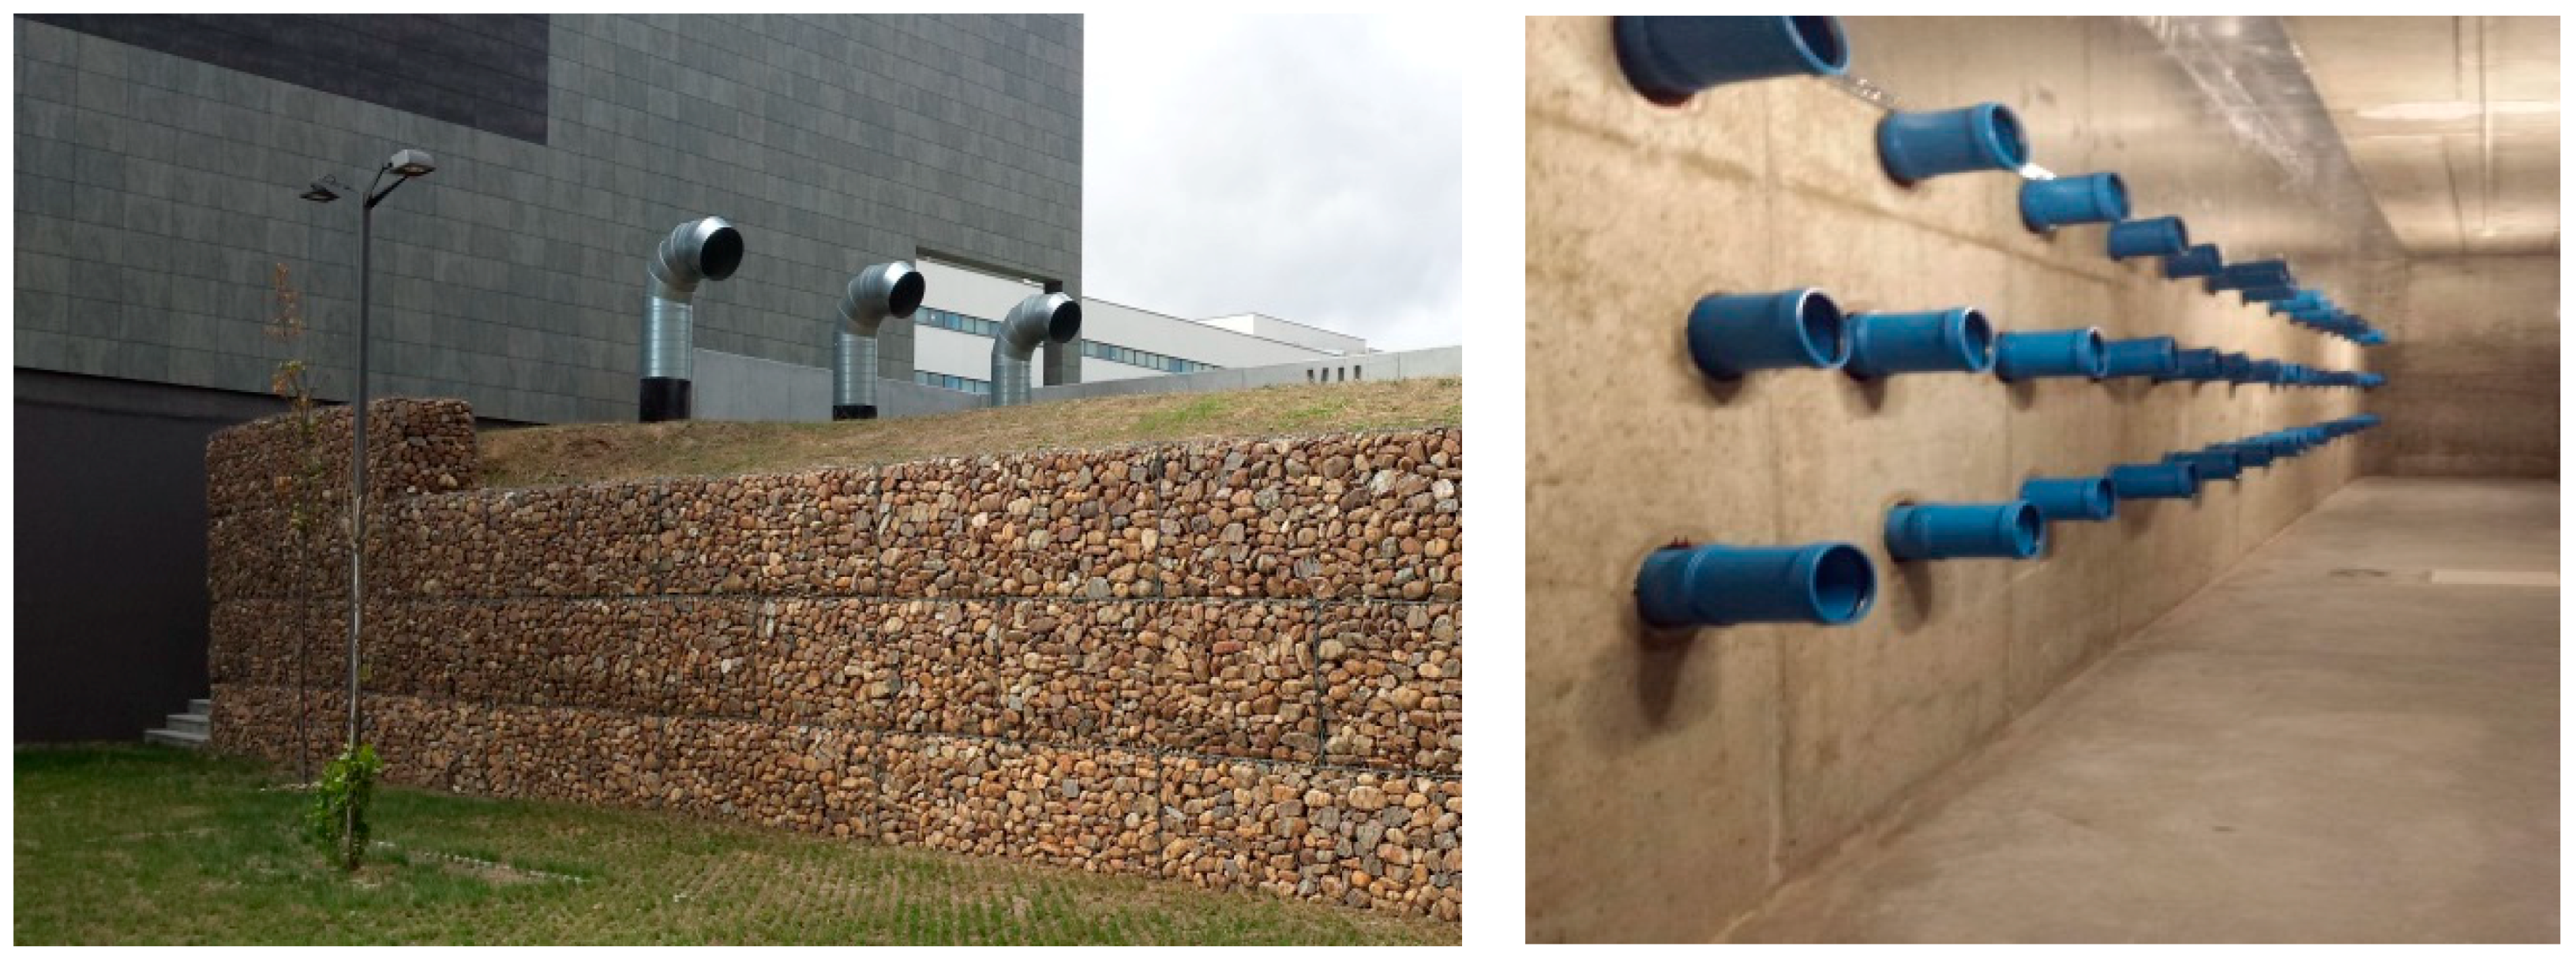
The Earth Air Heat Exchanger (EAHX), also known as Canadian wells, has 52 wells of 16 m length with a diameter of 200 mm (
Figure 4). The EAHX is integrated in the LUCIA nZEB under clay soil with a calorific value of 0.8 kJ/(kg·°C), density 2700 kg/m
3 and thermal conductivity 2.9 W/(m·°C). The ground volume is large enough to expect achieving important reductions in the energy demand during the operating periods, without risk of thermal saturation of the ground.
The enthalpy-based control system of the AHU aims for the optimal set points, taking into account the consumption of the auxiliary elements involved in the operation of the different technologies. It establishes four modes of operation: With EAHX, no EAHX and with the option of working with or without free-cooling, and with the possibility of adding the heat recovery option. To sum up, the management modalities could be: with EAHX and heat recovery, no EAHX and heat recovery, or just free-cooling, where neither the EAHX nor the heat recovery systems are working.
The control system implemented in the energy systems dedicated to the pre-treatment of ventilation air, aims to reach the set points through the cheapest energy system due to an enthalpy control, taking into account the consumption of the auxiliary elements involved in the use of the different technologies.
First of all a free-cooling System would be implemented. When free-cooling is not enough to reach the comfort values, the EAHX system is used. When the use of the two previous ones is not enough to approach the desired comfort, the Heat Recovery Exchanger will be used. Finally, when none of the above are sufficient to reach the set points, the absorption and cooling system must be used.
However, not all technologies can always be used. The conditions for the use of the different technologies depend on the values of the environmental conditions. For instance, during most daytimes in summer, free cooling cannot be used because the outside air has a higher temperature than the room temperature. However in winter, the external conditions will usually be more unfavourable than those of the air from the Heat Recovery Exchanger or the EAHX. Therefore, free cooling will not be used when the external conditions are more unfavourable than the conditions of the ventilation air provided by the other available technologies.
Despite their high efficiency, not every technology is always interesting. Therefore, the conditions for the combined operation of the different strategies depend on the climate conditions. This fact incurs in one of the reasons for the gap between the predicted behaviour of a nZEB at the design stage and the real performance once built [
30]. Monitoring of the actual behaviour of the LUCIA building facilitates decision making towards more energy efficient operating modes, evaluate the gap between predicted and measured data, as well as to evaluate the convenience of the strategies selected for nZEBs located in a particular climate.
2.2. Monitoring Data
The LUCIA building is controlled by an advanced control and management system called DESIGO™, created by SIEMENS and based on Supervisory Control and Data Acquisition (SCADA) technology software [
31].
Figure 5 shows a view of the interface. This system ensures optimal management of the HVAC, electricity, fires, alarms, registrations, comfort, Indoor Air Quality (IAQ), etc., guaranteeing that the energy supplied is always as minimal and efficient as possible. It allows a predictive control of the building, of use for maintenance and forecasting of the facilities energy demand. All variables measured are registered and analysed by the building's control system for subsequent consumption and maintenance reports.
The whole building and in particular the renewable energy facilities are being fully monitored with the aid of energy meters through the ModBus protocol [
32]. Pulse counters enable the monitoring of the energy consumption from HVAC systems. There are almost 100 main analyzers throughout the building to measure the active energy, reactive energy, frequency of the zone and phase voltage through the ModBus protocol. They allow the possibility of a better control of the energy consumption and comfort level of each zone.
All energy parameters, such as energy consumption or operating temperatures, are accounted for and recorded with a pre-established period of time by the central building control and surveillance system.
Through this system, the data obtained due to its previous records is stored and with them, reports are generated regularly, with the aim of visualizing a continuous analysis of the consumption produced in the building.
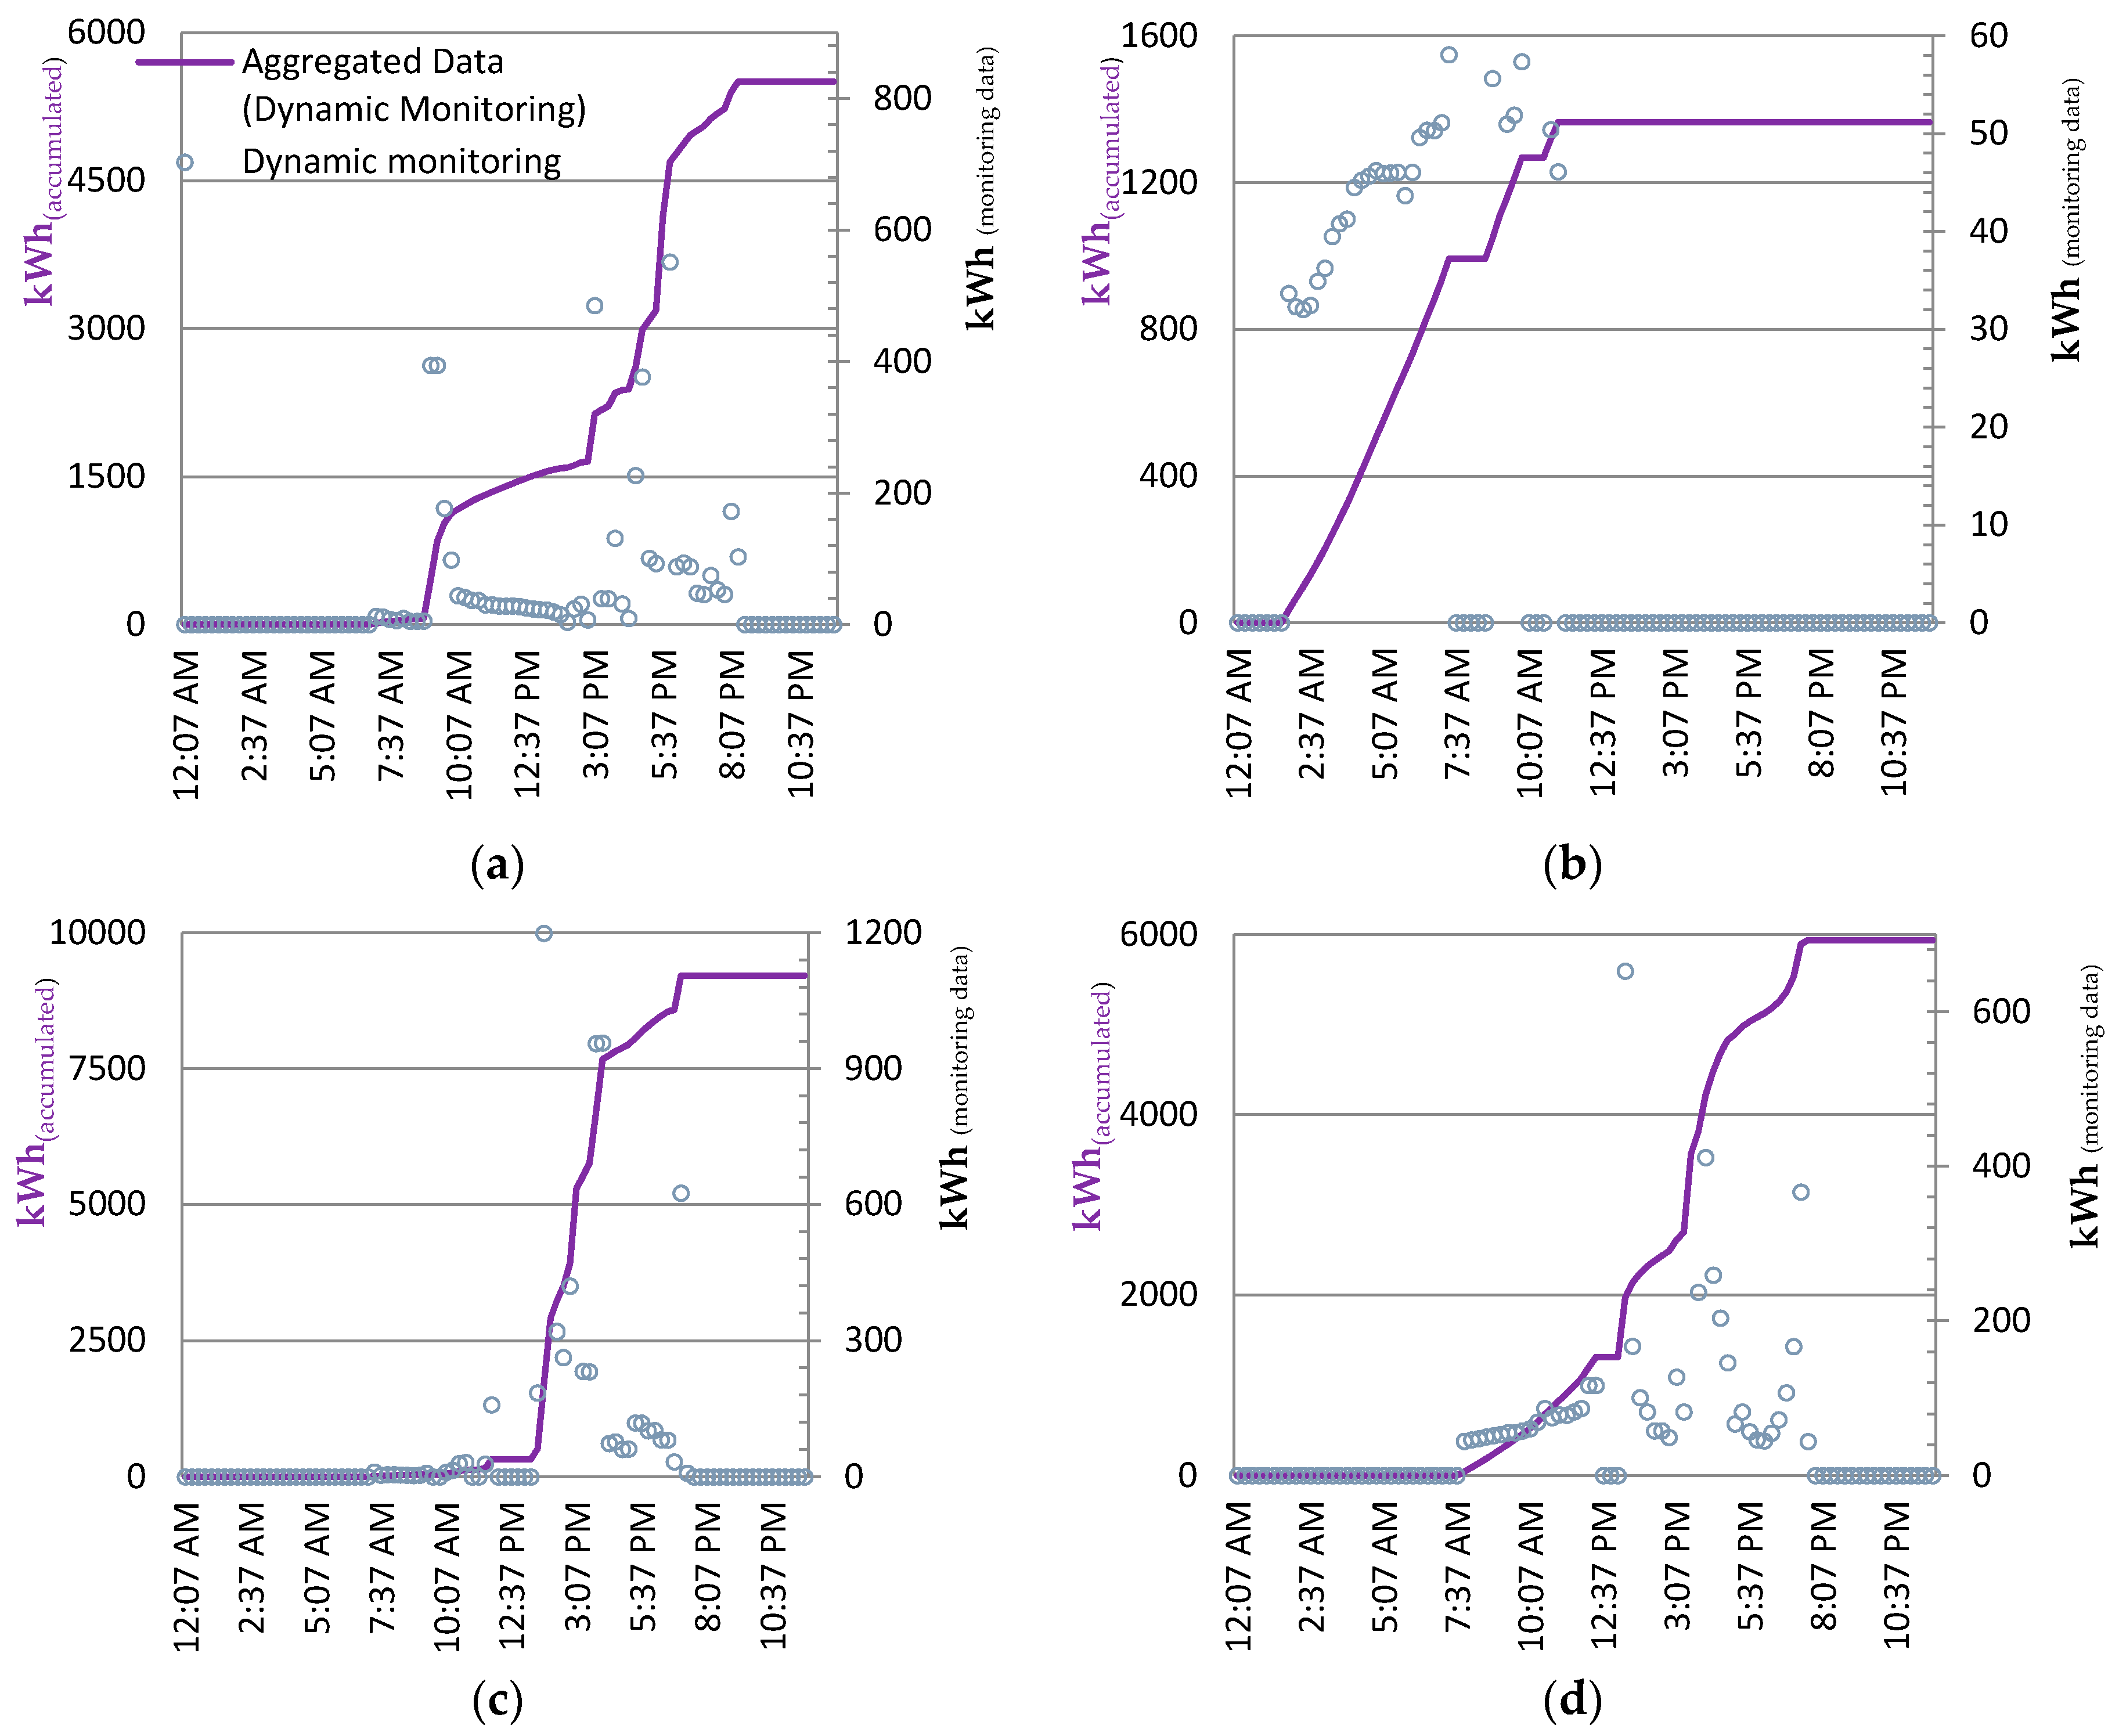
Figure 6,
Figure 7 and
Figure 8 are examples of how the dynamic monitoring is going on in the three renewable energy systems studied for different days during the year 2017.
Figure 6,
Figure 7 and
Figure 8 show how the dynamic monitoring of the different energy systems is being carried out, and some random days are presented. In these figures, several dots are plotted as real-time dynamic monitoring (secondary
y-axes), and the baseline of all aggregated data from the represented dynamic monitoring (primary
y-axes).

 ,
, 


