1. Introduction
Recent trends in modern economies are focused on greenhouse gas emissions reduction and mitigation of climate change effects. Countries around the world have begun to shift their energy production to renewable energy sources (RES). Energy from renewable sources may help mitigate emissions from traditional fossil fuel energy generation [
1]. Implementation of EU energy policy requires investment in power technologies based on RES. The dynamics of RES development and application can be traced to the basis of its installed capacity. According to data from 2016 [
2], the highest increase of installed power was observed for wind farms (i.e., 12,490 MW, or 51% of all new installed capacity in EU) and solar energy power plants (i.e., 6700 MW, or 27.4% of all new installed capacity in EU). By 2040, RES-based EU technologies will constitute 80% of new installed power, while after 2030, wind energy is predicted to become the leading electrical energy source [
3]. Wind energy, with significant growth in the RES share it represents, will cause problems associated with an uneven generation of electrical energy, resulting from variable atmospheric conditions [
4]. Frequently, high electricity generation is possible during periods of low demand for electrical energy (e.g., days off), whereas during periods of higher demand (evening peak), production is much lower. Moreover, the use of renewable energy from solar and wind farms is connected with power transmission system problems because of the irregularity and instability of energy supply [
5,
6].
Accordingly, a significant development in energy storage technology is required to increase application of RES in electrical energy generation sector. Power-to-Gas is an example of such technology. By using this technology, electrical energy can be converted to gaseous fuel (hydrogen). Hydrogen as an energy carrier can store the largest quantities of energy and has high energy content per mass unit [
4]. This makes hydrogen technology very advantageous from a technological point of view [
7]. Hydrogen has great importance as a promising green energy carrier, but practically does not occur in nature freely, hence it is not the primary source of energy. Hydrogen is usually generated as a secondary energy carrier from primary sources such as natural gas or wind energy. Hydrogen will play an important role in the world energy mix in the future [
8].
Requirements regarding the proportion of renewable energy sources in national electricity systems have been described in Directive 2009/28/EC. The general objective of achieving a 20% content of RES usage by 2020 in the European Union was included in this statement [
7,
9]. Most of the power generated in the field of renewable energy sources was comprised of onshore and offshore wind farms. Therefore, for the further development of renewable energy usage in the power generation sector, it will be necessary to make progress in the use of energy storage technologies. The use of hydrogen as an energy storage technology allows the largest amount of energy storage and is distinguished by having the highest power output. Thus, this technology is very beneficial in technical terms [
10,
11,
12]. In the near future, the natural gas system will be used for transmission of the growing volume of alternative fuels (e.g., hydrogen and biomethane), which will be added to traditional natural gas mixtures.
Recently, projects and concepts for the construction of energy storage sites in salt caverns have been the main focus related to the development of renewable energy sources. Hydrogen obtained during the withdrawal of salt caverns has to be transported to the place of its utilization. Pipeline transmission of hydrogen and the possibility of hydrogen addition to the natural gas transmission system are still new solutions requiring further research, and have been confirmed by real applications in a small number of cases. Specific thermodynamic analysis of methane–hydrogen mixtures is a main novelty of this research, in particular the use of hydrogen to improve natural gas flow parameters in the pipeline while maintaining quality requirements.
2. Basics of Hydrogen Transmission
Hydrogen is presented as an effective energy carrier which can be used efficiently with minimum greenhouse gas emissions in the processes in which it is involved [
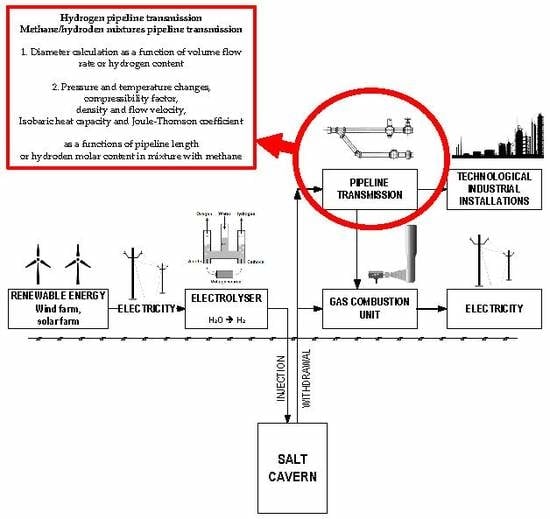
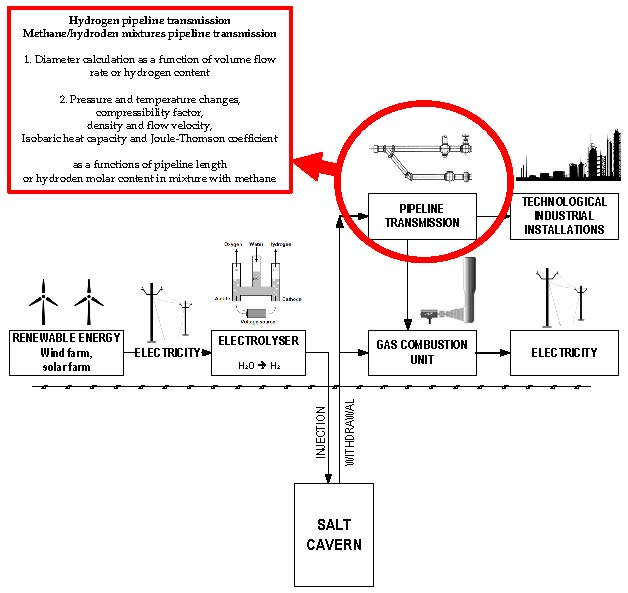
13]. The use of hydrogen in the long term for the purpose of balancing energy production with the demand of the electrical energy market is a real solution to the problem of excessive amounts and shortages of energy on the market. Hydrogen is used for storing surplus electrical energy. Salt caverns, as an efficient source of hydrogen storage, provide good conditions for injection and production [
14,
15,
16,
17]. Salt caverns are located in sites which have specific geological conditions; therefore, in many cases hydrogen must be transported across long distances from the storage site. The idea of energy storage in salt caverns with the use of hydrogen is presented in
Figure 1. Over recent years the pipeline transport of hydrogen has been considered mainly as an integral and significant element of the renewable energy system [
18]. On the other hand, the industrial use of hydrogen is widespread, where the production of hydrogen is closely associated with specific technological processes. Hydrogen is transmitted through pipelines of various diameters and lengths, depending on the way in which hydrogen will be used. Pipeline transmission is one of the cheapest methods for transporting large quantities of hydrogen [
19,
20]. Pipelines for the transmission of hydrogen at long distances exist in a few places worldwide, with a total length of 4500 km.
Hydrogen is commonly considered a gas similar to methane (i.e., the main component of natural gas). Therefore, most technological requirements for hydrogen transmission pipelines are identical to those of natural gas pipelines, with certain modifications regarding safety, infrastructure, and materials. These conditions must be met before the transmission of hydrogen is initiated through a pipeline network. Hydrogen has its specific set of physical and chemical properties which makes the pipeline transmission of this gas significantly different from that of natural gas. Due to physicochemical properties, hydrogen pipeline transmission is much more difficult than natural gas. Even compressed hydrogen can provide only about a third of the energy when compared to methane per unit of volume [
21].
Natural gas transport and distribution networks are very well developed; therefore, the hydrogen pipeline system is directly compared to the natural gas transmission system [
22]. The natural gas system consists of gas compression stations, pipelines, gas stations and gas storage facilities, including caverns [
23]. The gas compression station provides the energy needed to generate gas flow at a given rate and pressure. In the case of natural gas, gas networks are divided into high pressure transmission pipelines and medium or low-pressure distribution pipelines. In the case of hydrogen transmission, the distribution to smaller receiving centers worldwide is quite rare, excepting some locations, such as the Leuna industrial district in Germany. In most cases, hydrogen transportation is considered as a transmission from point A to point B, for a technologically justified purpose. Selected issues related to hydrogen pipeline transmission have been presented recently in a number of papers [
24,
25,
26,
27,
28,
29].
3. Model Development
3.1. Basic Assumptions
The hydraulic analysis of hydrogen transmission through the pipelines was based on a number of technological assumptions (e.g., mass flow rate from 0.3 to 3.0 kg/s, which corresponds to volume flow rate from 12,000 Nm3/h to 120,000 Nm3/h). The recommended outlet pressure for an exemplary technological installation was assumed to be 24 bar (g). In the presented exemplary case, the medium inlet temperature was set at 5 °C and the ambient temperature was 15 °C. For heat flow analysis, the pipeline was located one meter deep. The length of the exemplary pipeline chosen for analysis was 100 km.
3.2. Hydraulic Friction Factor
The zone of turbulent flow in rough pipes consists of a transient flow zone and developed roughness zone. In the transient flow zone, the linear friction coefficient (
λ) depends on the Reynolds number (
Re) and relative roughness (
ε):
λ = f(
Re, ε). Colebrook and White presented the following formula for the linear friction coefficient
λ in this zone [
30]:
The Colebrook-White Equation (1) was systematically analyzed from a theoretical and experimental point of view and, as a result, considered to be the most accurate of all relationships determining
λ coefficient in the transient flow zone. For the zone with a full roughness impact
λ = f(
ε)
, the linear friction coefficient is analyzed with the Prandtl-Nikuradse Equation (2) [
31]:
Equation (2) was established by Prandtl, based on experiments conducted by Nikuradse on pipes with artificial sand roughness. The Prandtl–Nikuradse equation could be used on the following assumed criterion:
3.3. Pressure Drop Analysis
The pressure drop in gas pipelines can be determined with one of the hydraulic equations commonly applied for high pressure gas pipelines (e.g., Renouard equation, Panhandle equation). In this paper, authors applied the General Flow Equation (4), directly derived from the Bernoulli equation [
32]:
where
p1, p2—pressure at respectively inlet and outlet of pipeline,
Z—compressibility factor,
Tin—temperature in pipeline,
L—length of pipeline,
d—relative density,
Qn—volume flow rate,
D—inner diameter.
The difference of levels on a given pipeline section has a significant impact on the flow hydraulics. In pressure drop equations, the influence of terrain elevation change is accounted for with the use of an equivalent length of the pipeline
Le, which is the pipeline length corrected for the impact of terrain elevation with respect to the level of initial point of the pipeline or pipeline section [
32].
where
s—dimensionless parameter which determines the influence of terrain elevation, which depends on temperature (
T), compressibility factor (
Z), relative density (
d) and elevation level difference (Δ
h).
Dimensionless parameter which describes the terrain elevation impact is defined as:
If a pipeline of length
L is divided into a number of sections (i.e.,
L1, L2, L3, etc.) in which the terrain level significantly changes, then the parameter
j should be introduced in such a way that the impact of the terrain elevation could be determined for each segment of the pipeline.
In this case, the pipeline equivalent length
Le accounts for the effect of the terrain elevation for each pipeline section with the dependence:
3.4. Temperature Changes along the Pipeline
The temperature change basic model as a function of pipeline length was determined with the dependence combining the total heat transfer coefficient (
U), mass flow rate (
) and isobaric heat capacity (
Cp) [
32]:
For a pipeline with length
L and diameter
D, with the Joule–Thomson effect (
μJT) change of temperature of the transmitted medium from
T1 to
T2 can be described with the equation [
33]:
3.5. Heat Transfer Analysis
The basic principles of heat transfer analysis were formulated with heat flow laws based on conduction (Fourier law), convection (Newton law), and radiation (Stefan–Boltzman law) in association with the first law of thermodynamics. Conduction and convection are most the most important parameters for the heat flow transferred to the pipeline. Conduction, described with the Fourier law (according to cylindrical coordinates) for a pipeline in dynamic conditions, has the following form [
34]:
where
r—radius,
k—thermal conductivity,
ρ—density,
τ—time,
Cp—isobaric heat capacity.
Under static conditions, the right side of Equation (11) equals zero; therefore, the total heat flow per unit of length of the pipeline between the medium within the pipeline and the environment is
After integration of Equation (12), we have
The most important parameter which determines the ability of a particular cylindrical obstacle to heat transfer is the heat transfer coefficient (
U). Taking into account convection and conductivity effects for a pipeline with complex parameters, the heat transfer coefficient equals [
34,
35]
In order to determine the heat transfer in the presented case (
Figure 2), the thermal conductivity coefficient was analyzed for the pipeline wall (
kp), thermal insulation (
kiso), and ground in which the pipeline was buried (
kground).
Rin and
Rout represent the inner and outer radius of the pipeline, respectively.
riso is the radius including thermal insulation, and
zx is the depth of pipeline deposition in the ground. Convection effects are described by
αin—inner coefficient of heat penetration (assumed or determined with, for example, the Dittus–Boelter formula) and
αout—outer coefficient of heat penetration defined with Equation (15) for a pipeline seated in the ground at a depth
zx [
35]:
where
Dtot is the total diameter of pipeline with thermal insulation.
Calculations of the overall heat transfer coefficient for pure hydrogen and pure methane as a function of the pipeline diameter are presented in
Figure 3. Other parameters, for example, thermal insulation or burial depth of the gas pipeline, have remained unchanged. Calculations were made for the same volume flow rates in three variants specified in the presented case (12,000 Nm
3/h, 40,000 Nm
3/h, 120,000 Nm
3/h). Obtained results are similar for methane and hydrogen for assumed volume flow rates.
The final equation for total heat flux has the following form:
3.6. Real Gas Behavior and Thermodynamic Parameters Description
Thermodynamic parameters of transmitted hydrogen and methane/hydrogen mixtures as real gas are calculated with the Peng–Robinson equation of state commonly applied in the oil and gas industry [
36]:
The parameters of the equation of state
am and
bm are based on classic mixing rules. They depend on the critical parameters of the analyzed gas. Compressibility factor
Z is determined on the basis of a polynomial form of the Peng–Robinson equation of state:
where
A and
B are dimensionless parameters of equation of state, depending on the present temperature and pressure conditions:
The compressibility factor is a key parameter while determining the pressure drop in the pipeline, and changes in most of the thermodynamic parameters of the analyzed gas as well as changes in temperature is a function of the pipeline length. Another important parameter is the density of the transmitted gas, which is determined with the general form of the equation of state:
Equation (10) also makes use of specific heat capacity at a constant pressure (
Cp) and the Joule–Thomson coefficient (
μJT), which have a significant impact on temperature changes of the transmitted hydrogen [
37,
38]:
where
Cpid—isobaric heat capacity for ideal gas,
Cpr—residual part of isobaric heat capacity.
The Joule–Thomson coefficient can be expressed with specific heat capacity at constant pressure:
Using the real gas Law (18), Equation (22) can be written as
where
In the case of hydrogen, the description of the Joule–Thomson effect has a special meaning. Unlike for natural gas, the Joule–Thomson coefficient for hydrogen is negative, which means that hydrogen temperature increases with isenthalpic expansion.
3.7. Pipeline Diameter Selection
Prior to the hydraulic analysis of the pipeline, the optimum diameter of the pipeline should be determined for parameters such as assumed working pressure, length of the pipeline, roughness, etc. The selection of the diameter is also important for determination of the inlet pressure to the pipeline (includes associated costs) and possibility to compress the medium. In the analyzed case, the diameter was determined with a function of inlet pressure at the beginning of the pipeline for the assumed outlet pressure at the end of the pipeline of 24 bar (g). Calculations were based on the General Flow Equation (4), which directly stems from the Bernoulli law. The presented equation also contains an element (Δ
h) referring to the change of the elevation of the pipeline with respect to the assumed reference level [
32,
39]:
Calculations were performed for pure hydrogen (
Figure 4) and methane/hydrogen mixtures with a maximum hydrogen content of 15% mol (
Figure 5).
It should be noted that from the perspective of mass flow rate, the recommended diameters for the pure hydrogen are much smaller than for methane/hydrogen mixtures, which results from the low mass of hydrogen (
Figure 4 and
Figure 5).
The recommended diameters for the methane/hydrogen mixture are much larger, as the density of pure hydrogen under normal conditions equals 0.0898 kg/m3, while the density of a mixture of methane and 15% hydrogen is 0.6223 kg/m3.
Recommended pipeline diameters for the assumed flow rates of pure hydrogen and methane/(15%)hydrogen mixtures are presented in
Table 1. Evidently, transmission of the same volume of methane in a mixture with 15% hydrogen content required much larger diameters.
4. Calculation Results
Flow modeling in a hydrogen transmission pipeline covers the analysis of changes in pressure and temperature as a function of length of the pipeline. The changes of compressibility factor, density, specific heat, and the Joule–Thomson effect as parameters especially important for hydrogen pipeline transmission were presented for one of the variants. A comparative analysis was also performed for the methane/hydrogen mixture and mass flow rate of 40,000 Nm3/h.
4.1. Pressure Drop
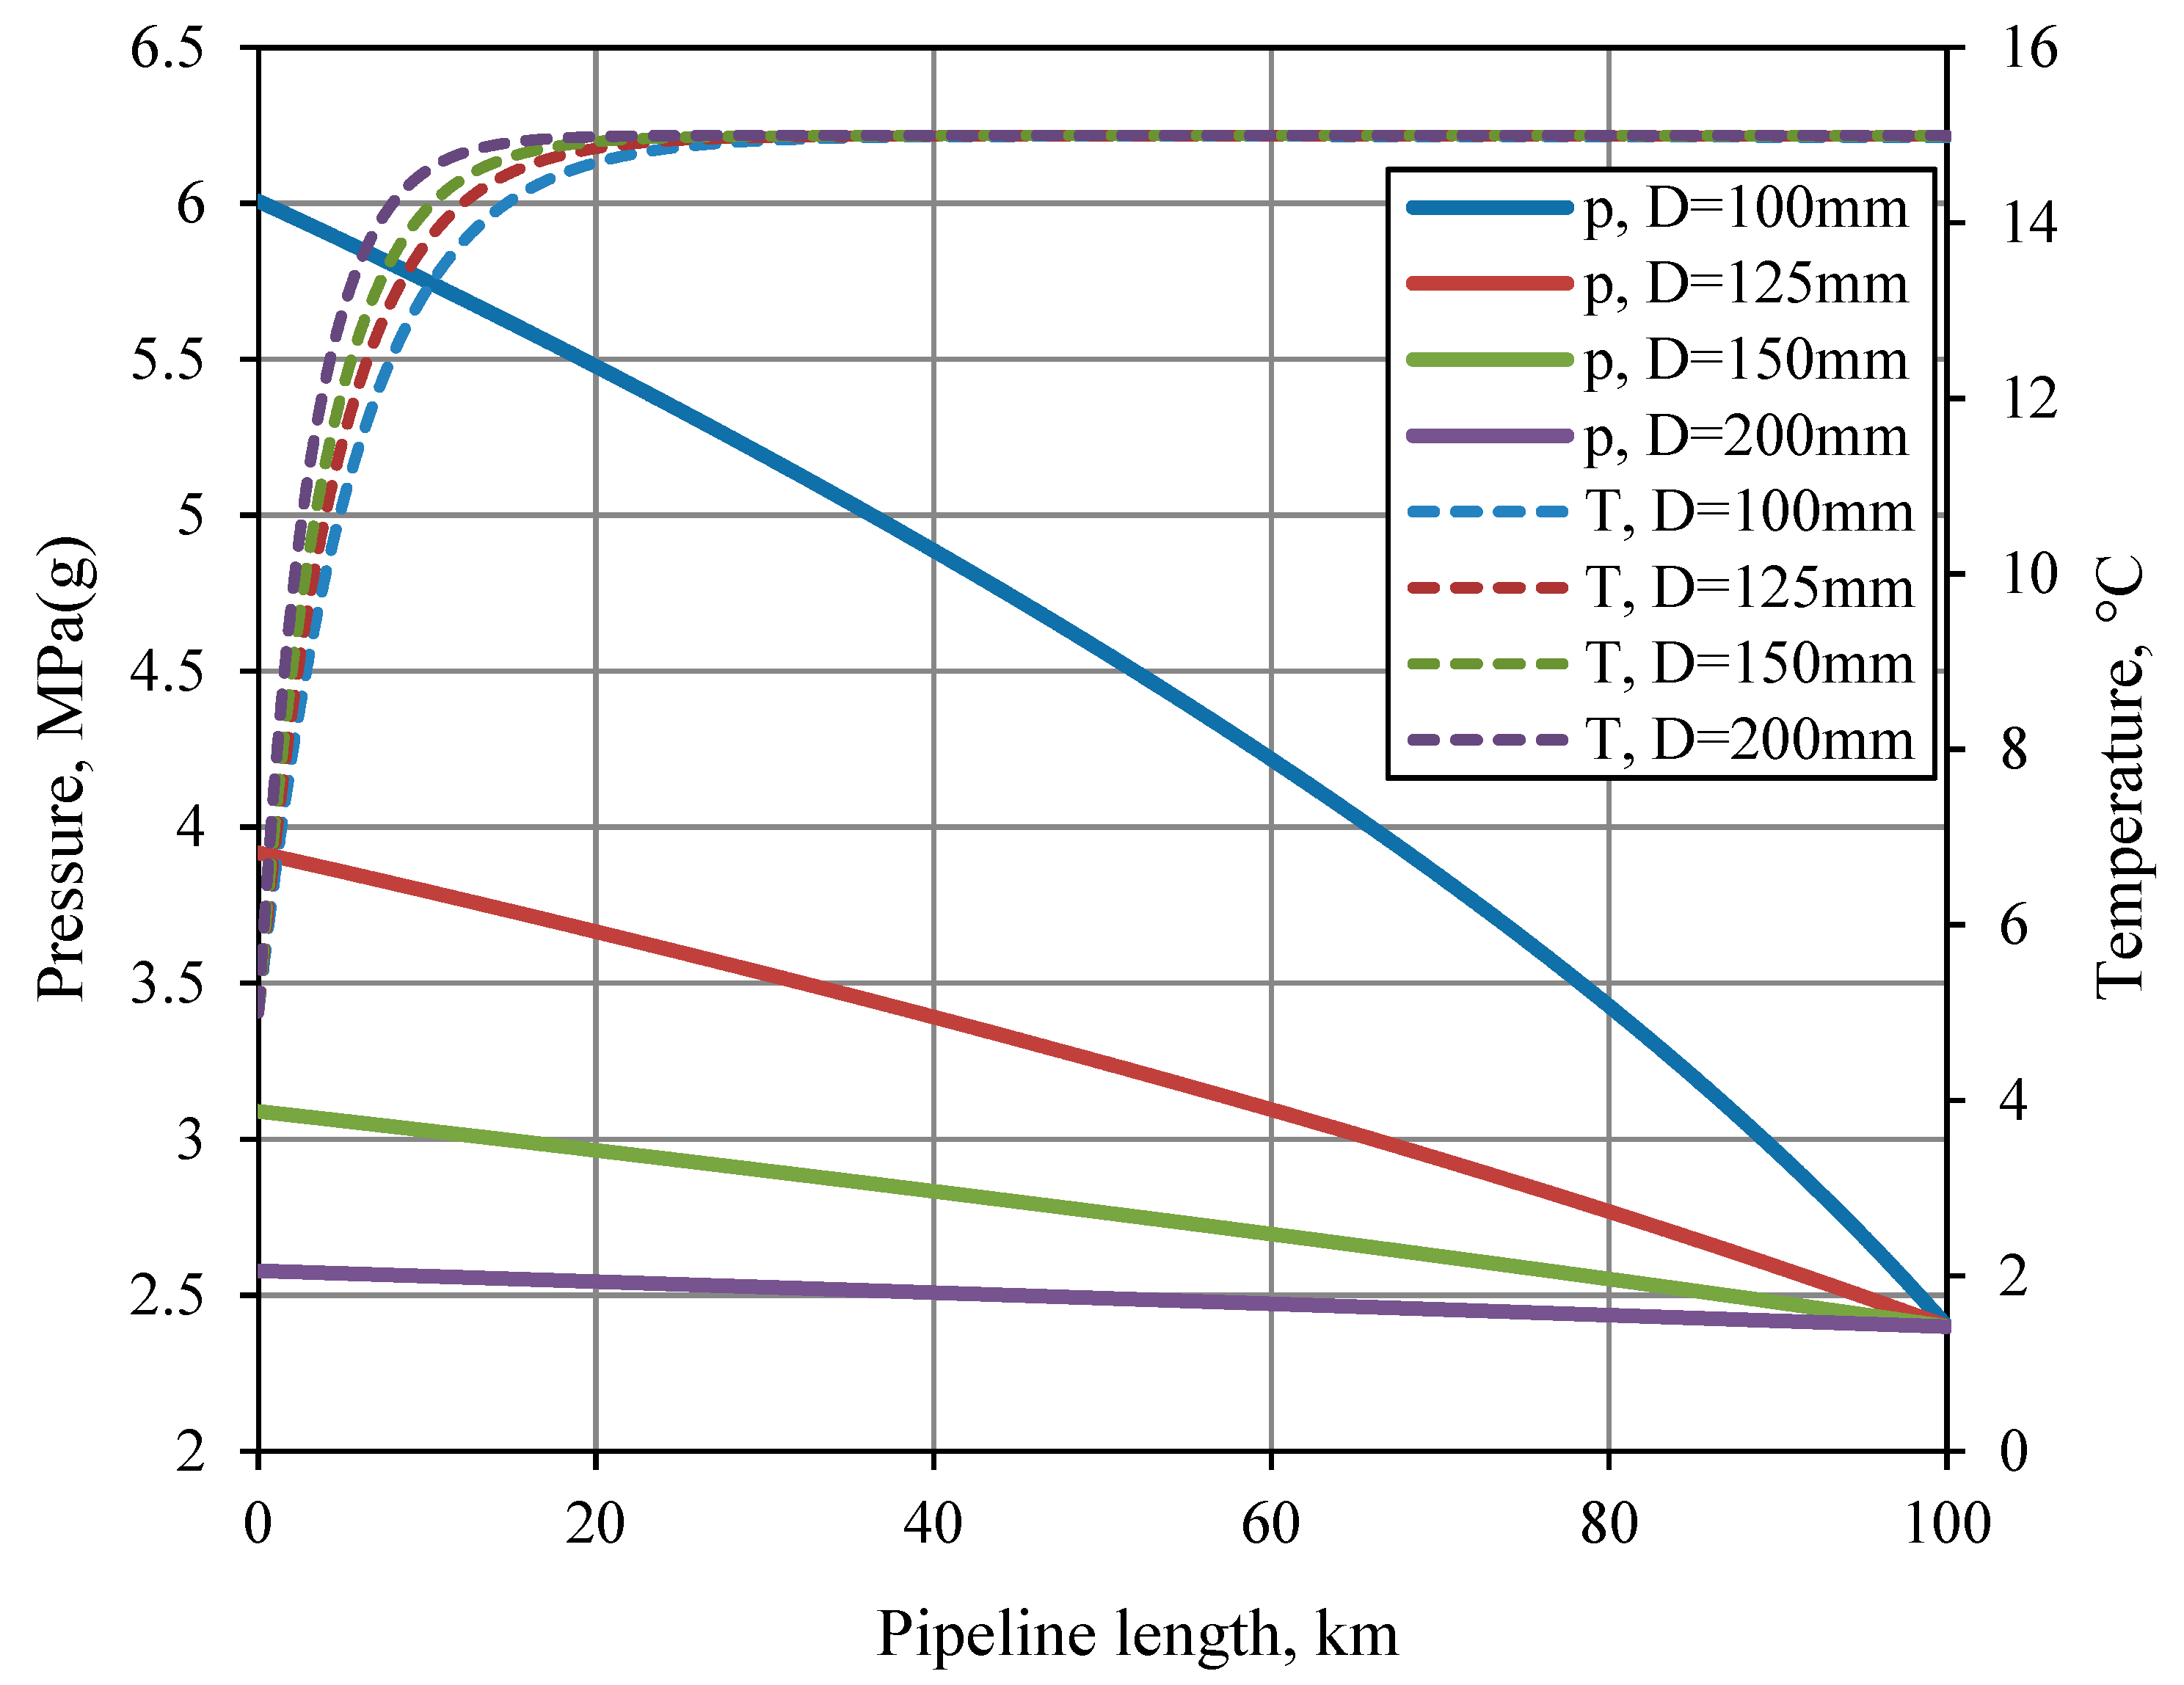
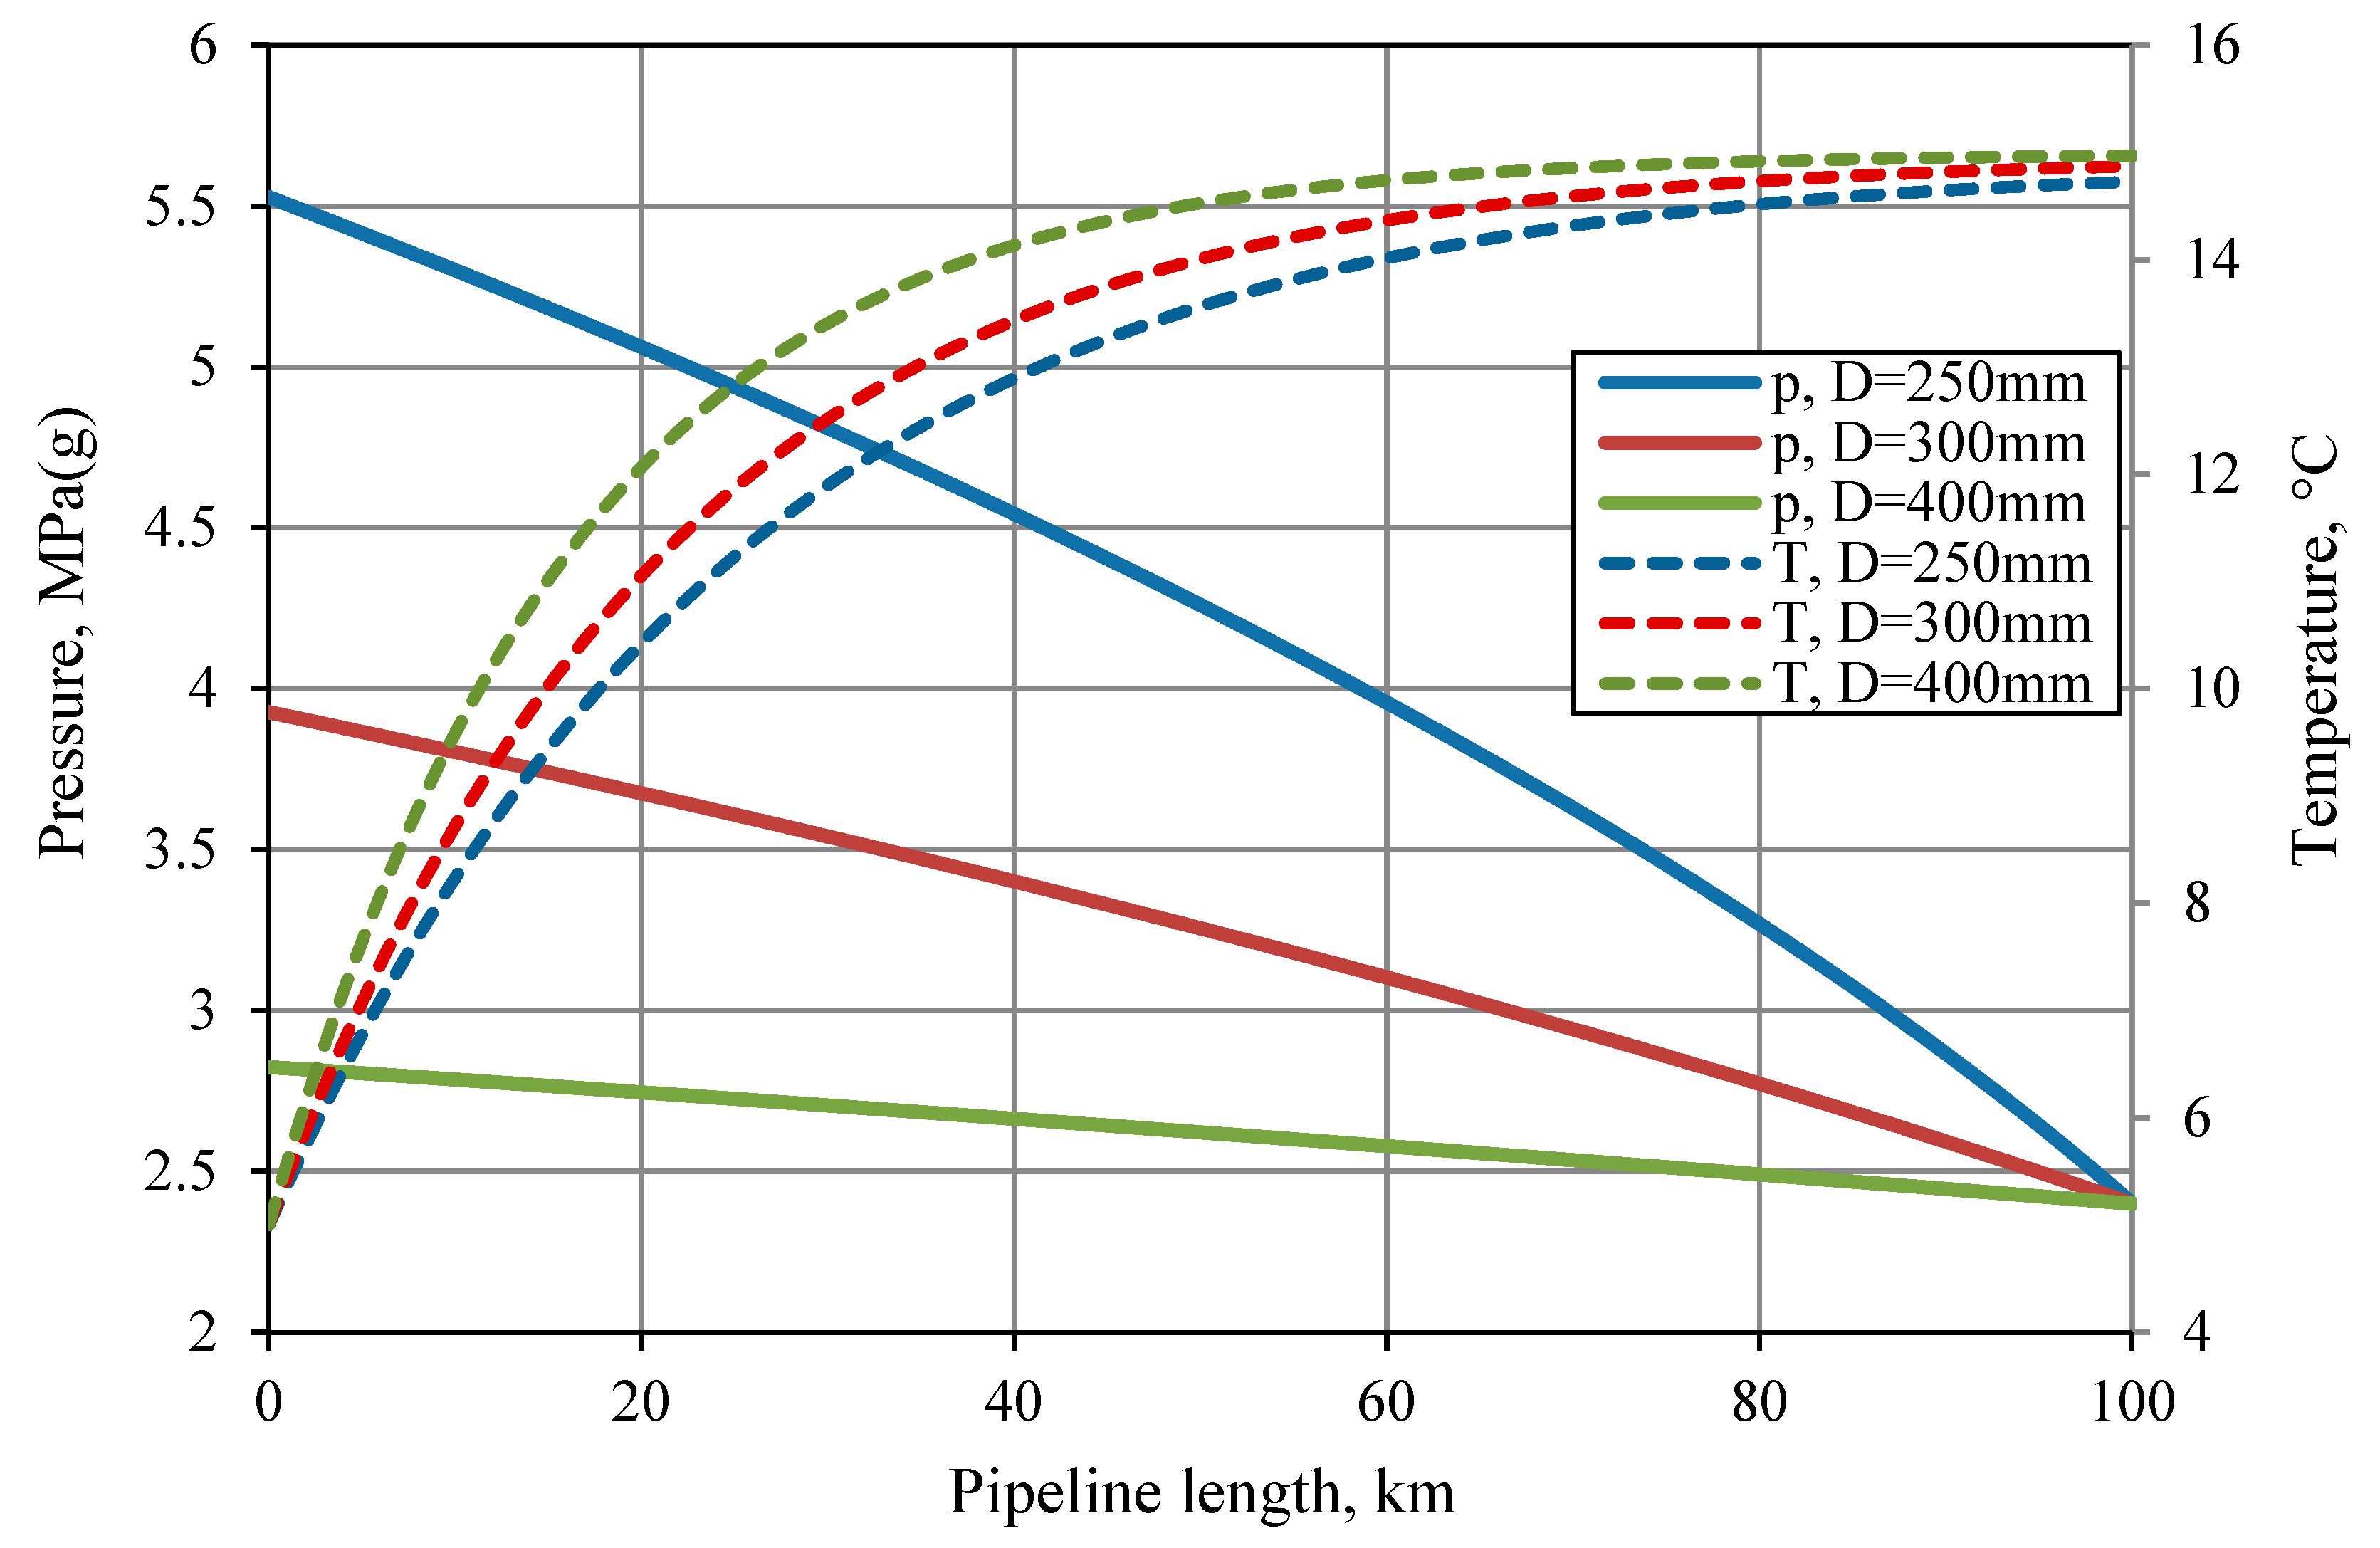
The profiles of pressure and temperature changes for recommended pipeline diameters, assumed mass flow rates of 0.3, 1.0, 2.0 and 3.0 kg/s, (volume flow rates: 12,000 Nm
3/h, 40,000 Nm
3/h, 80,000 Nm
3/h and 120,000 Nm
3/h) and hydrogen inlet temperature of 5 °C are presented in
Figure 6,
Figure 7,
Figure 8 and
Figure 9. Results of modelling the pressure drop profiles confirmed the preliminary calculations of the pipeline diameter. For the smallest recommended diameters for a selected flow rate, the inlet pressure in the pipeline was from 6.01 to 6.76 MPa (
Figure 6,
Figure 7,
Figure 8 and
Figure 9), while for the largest recommended diameters the inlet pressure ranged from 2.91 to 3.2 MPa (
Figure 6,
Figure 7,
Figure 8 and
Figure 9). The analysis of temperature changes revealed that the transmitted hydrogen warms up more slowly for smaller diameters and higher flow rates.
4.2. Thermodynamic Parameters Analysis
The analysis of selected thermodynamic parameters, such as density, flow rate, compressibility factor, isobaric heat capacity and Joule–Thomson coefficient were presented for hydrogen transmission at a flow rate of 40,000 Nm
3/h (1.0 kg/s).
Figure 10 illustrates the changes in hydrogen density and its flow rate as a function of pipeline length for selected pipeline diameters.
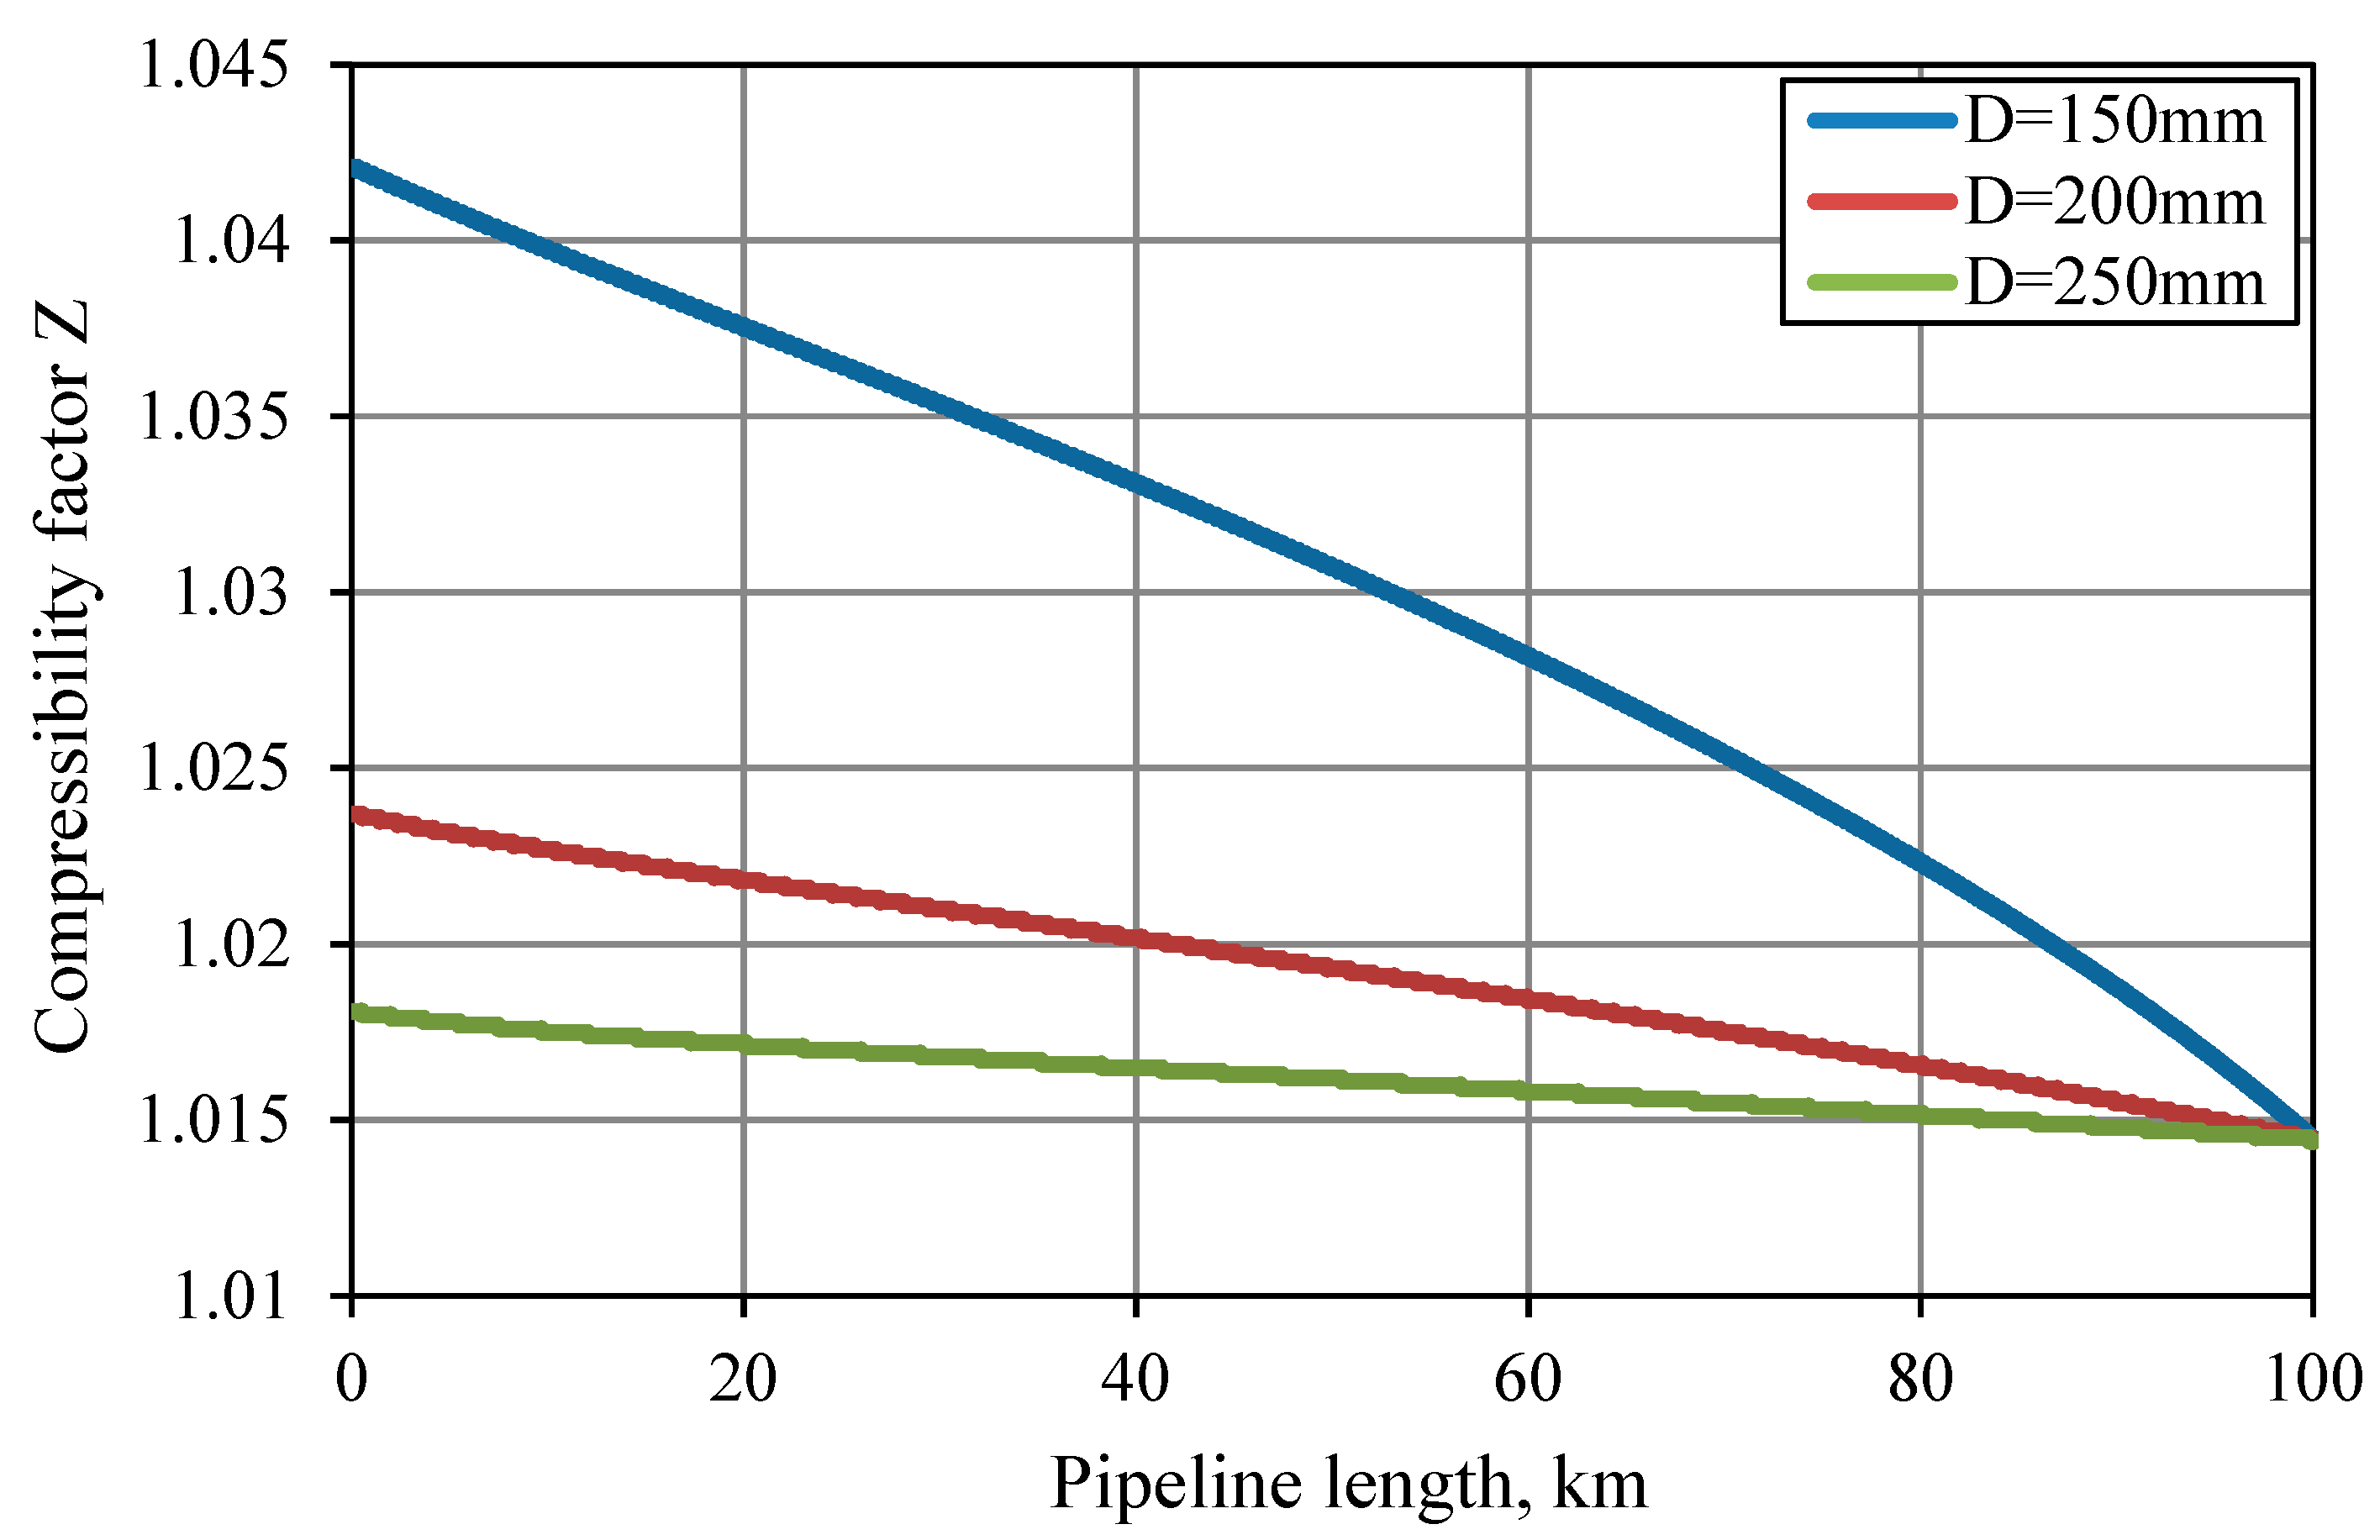
The density change is directly connected to compressibility factor
Z change, as presented in
Figure 11. Compressibility factor
Z for hydrogen is higher than unity even for relatively low pressure values. This is one of the most characteristic properties of hydrogen, which distinguishes it from most of the real gases. For instance, compressibility factor
Z > 1 for natural gas is usually only at pressures equal or greater than 40 MPa.
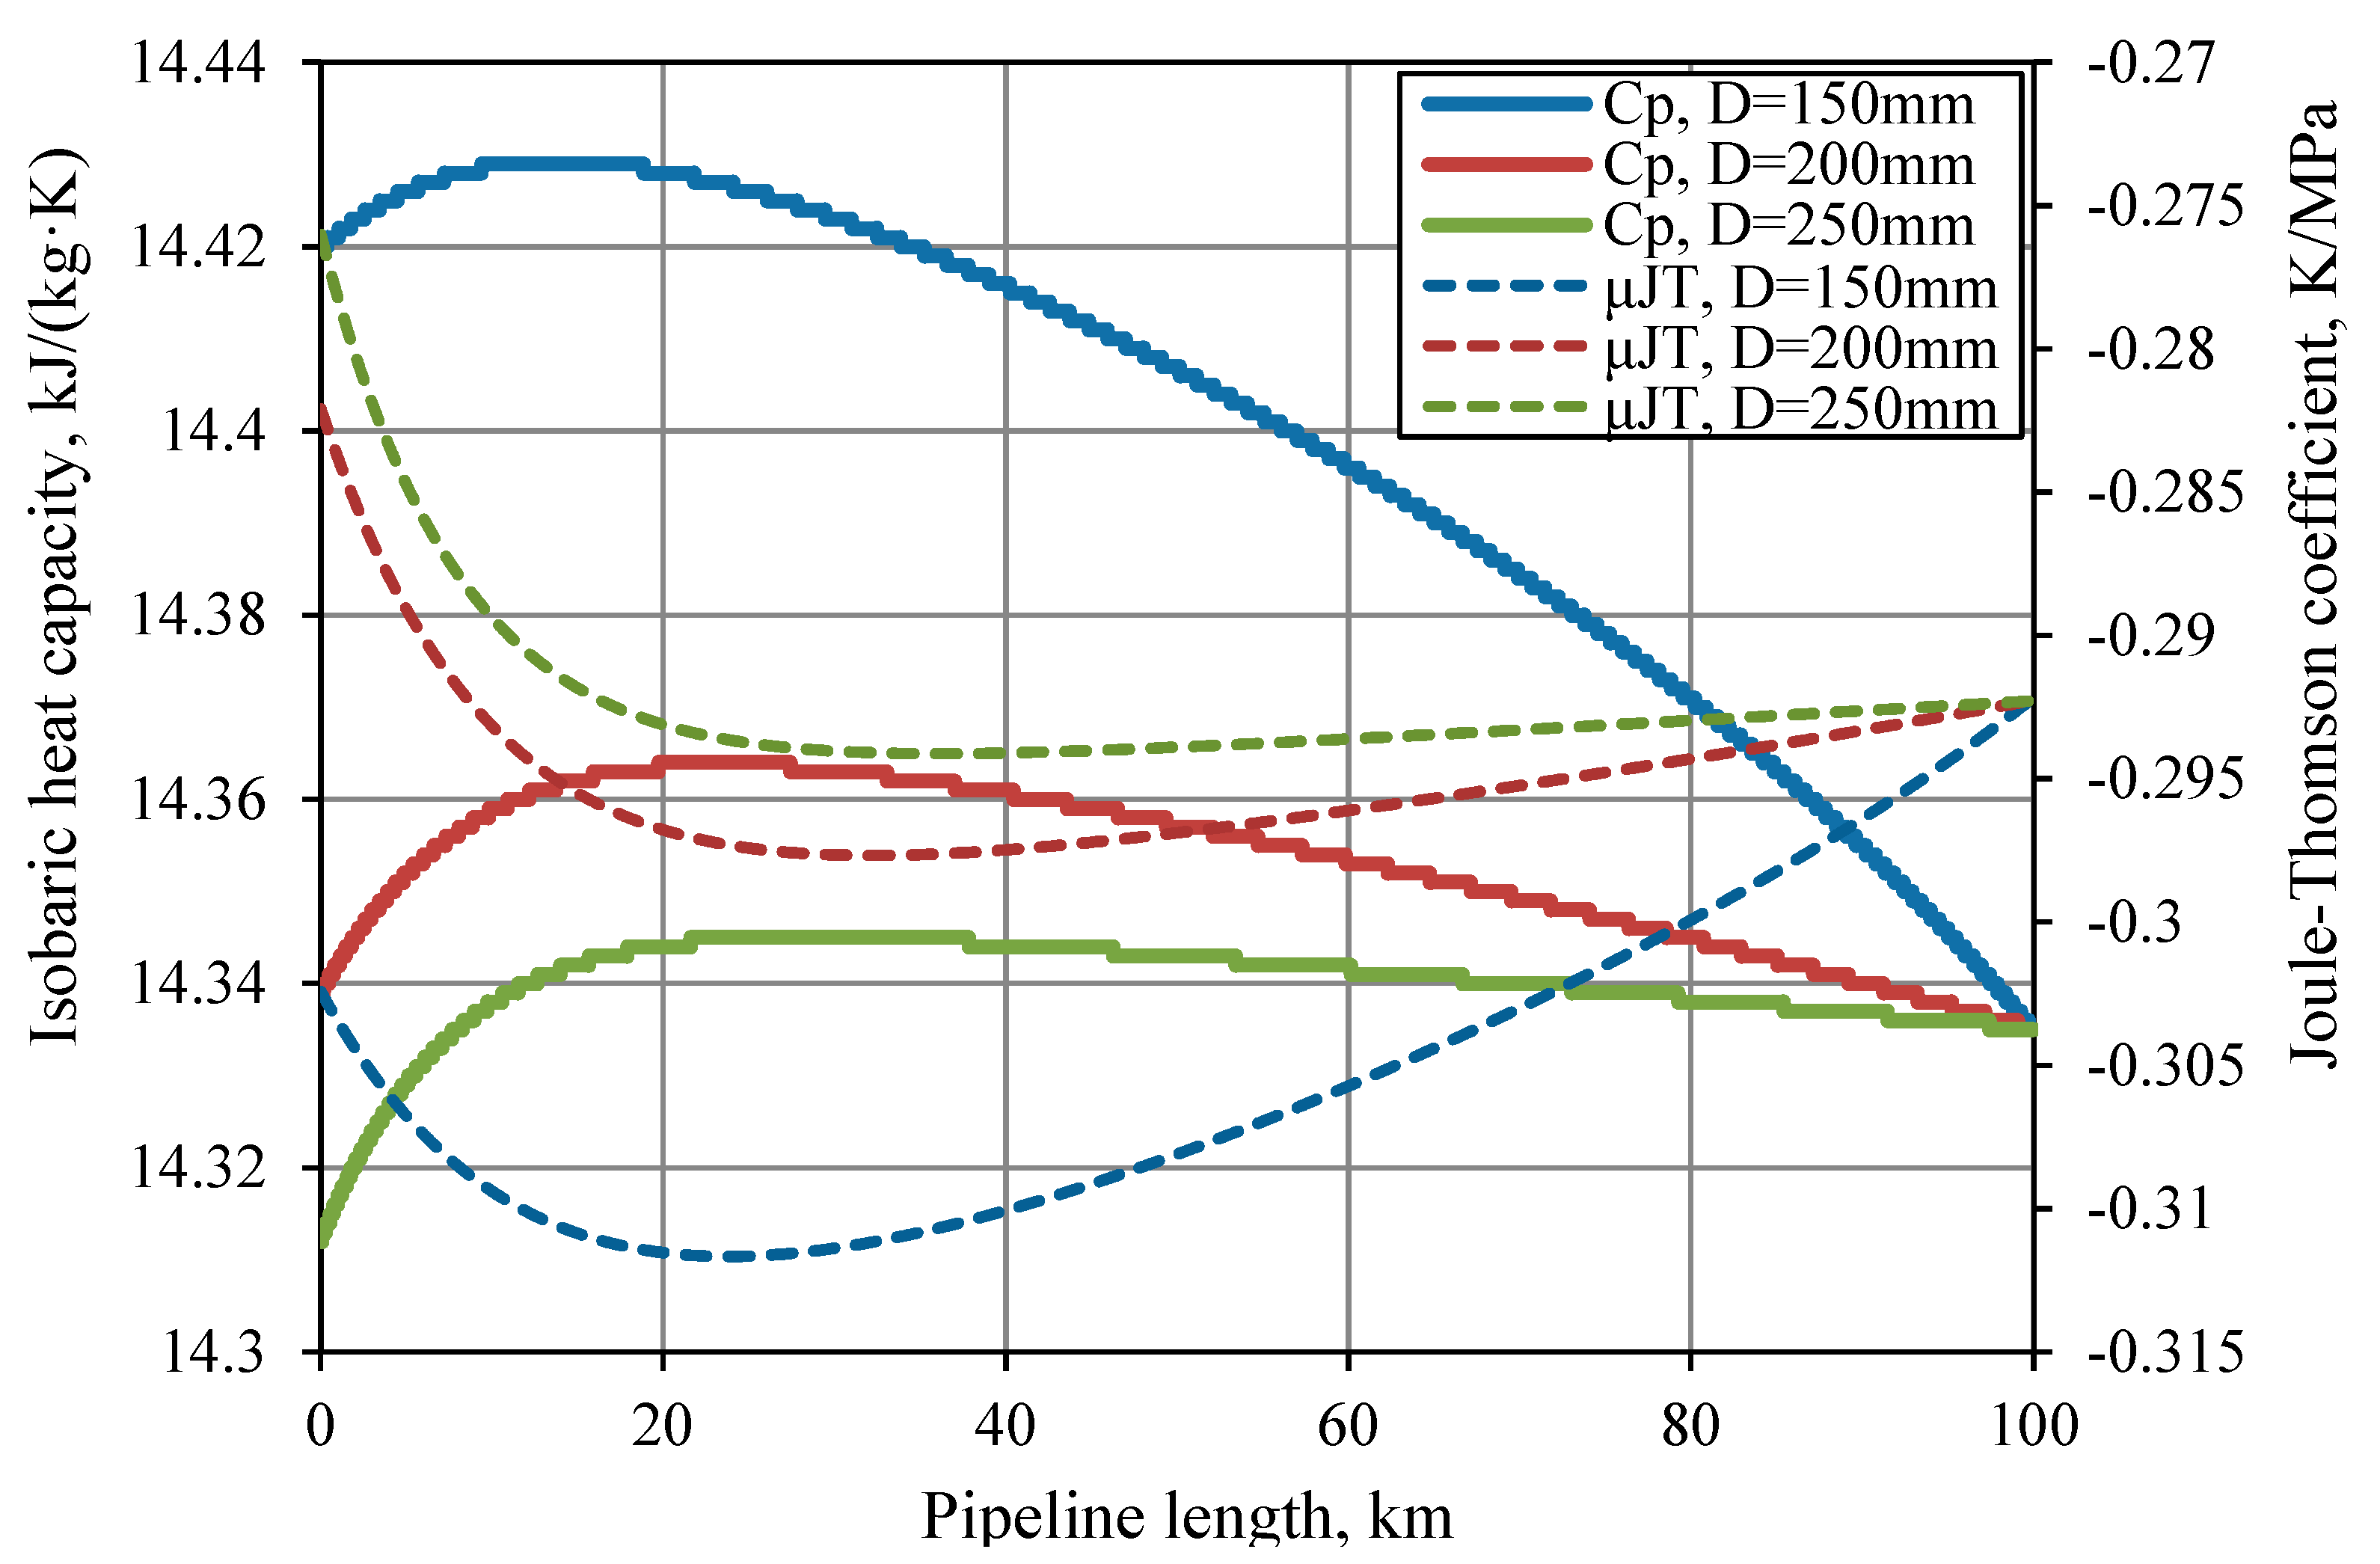
Another characteristic parameter of hydrogen is the Joule–Thomson coefficient. The Joule–Thomson effect occurs in temperature change of the gas during isenthalpic pressure drop. For most real gases, the Joule–Thomson effect is positive (i.e., gas temperature decreases with pressure reduction). In the case of hydrogen (
Figure 12), the opposite effect occurs (i.e., the Joule–Thomson coefficient is negative): with a rapid change in pressure, the hydrogen temperature increases. This is theoretically possible for the hydrogen transmission pipelines, with considerable pressure drops per unit of pipeline length (e.g., with pipeline diameters which are too small or very high flow rates).
4.3. Methane-Hydrogen Mixtures
Hydrogen can also be transmitted through natural gas pipelines as an additive to natural gas. This is one of the alternative methods of hydrogen transportation. Numerous analyses and studies devoted to this issue have been performed recently [
21,
29,
40]. Hydrogen has different thermodynamic parameters compared to methane, which is the main component of natural gas. This causes significant changes in the flow conditions of natural gas that contains hydrogen. Industrial practice and scientific publications indicate that the maximum admissible molar fraction of hydrogen in a mixture with natural gas should not exceed 15%. The maximum hydrogen content in the natural gas transmission system suggested in the United States should be in the range of 5%–15%. Several European countries have introduced limits on the content of hydrogen in natural gas pipeline systems from 0.1% to 12% by volume. The maximum hydrogen content usually depends on the technical conditions for a given pipeline [
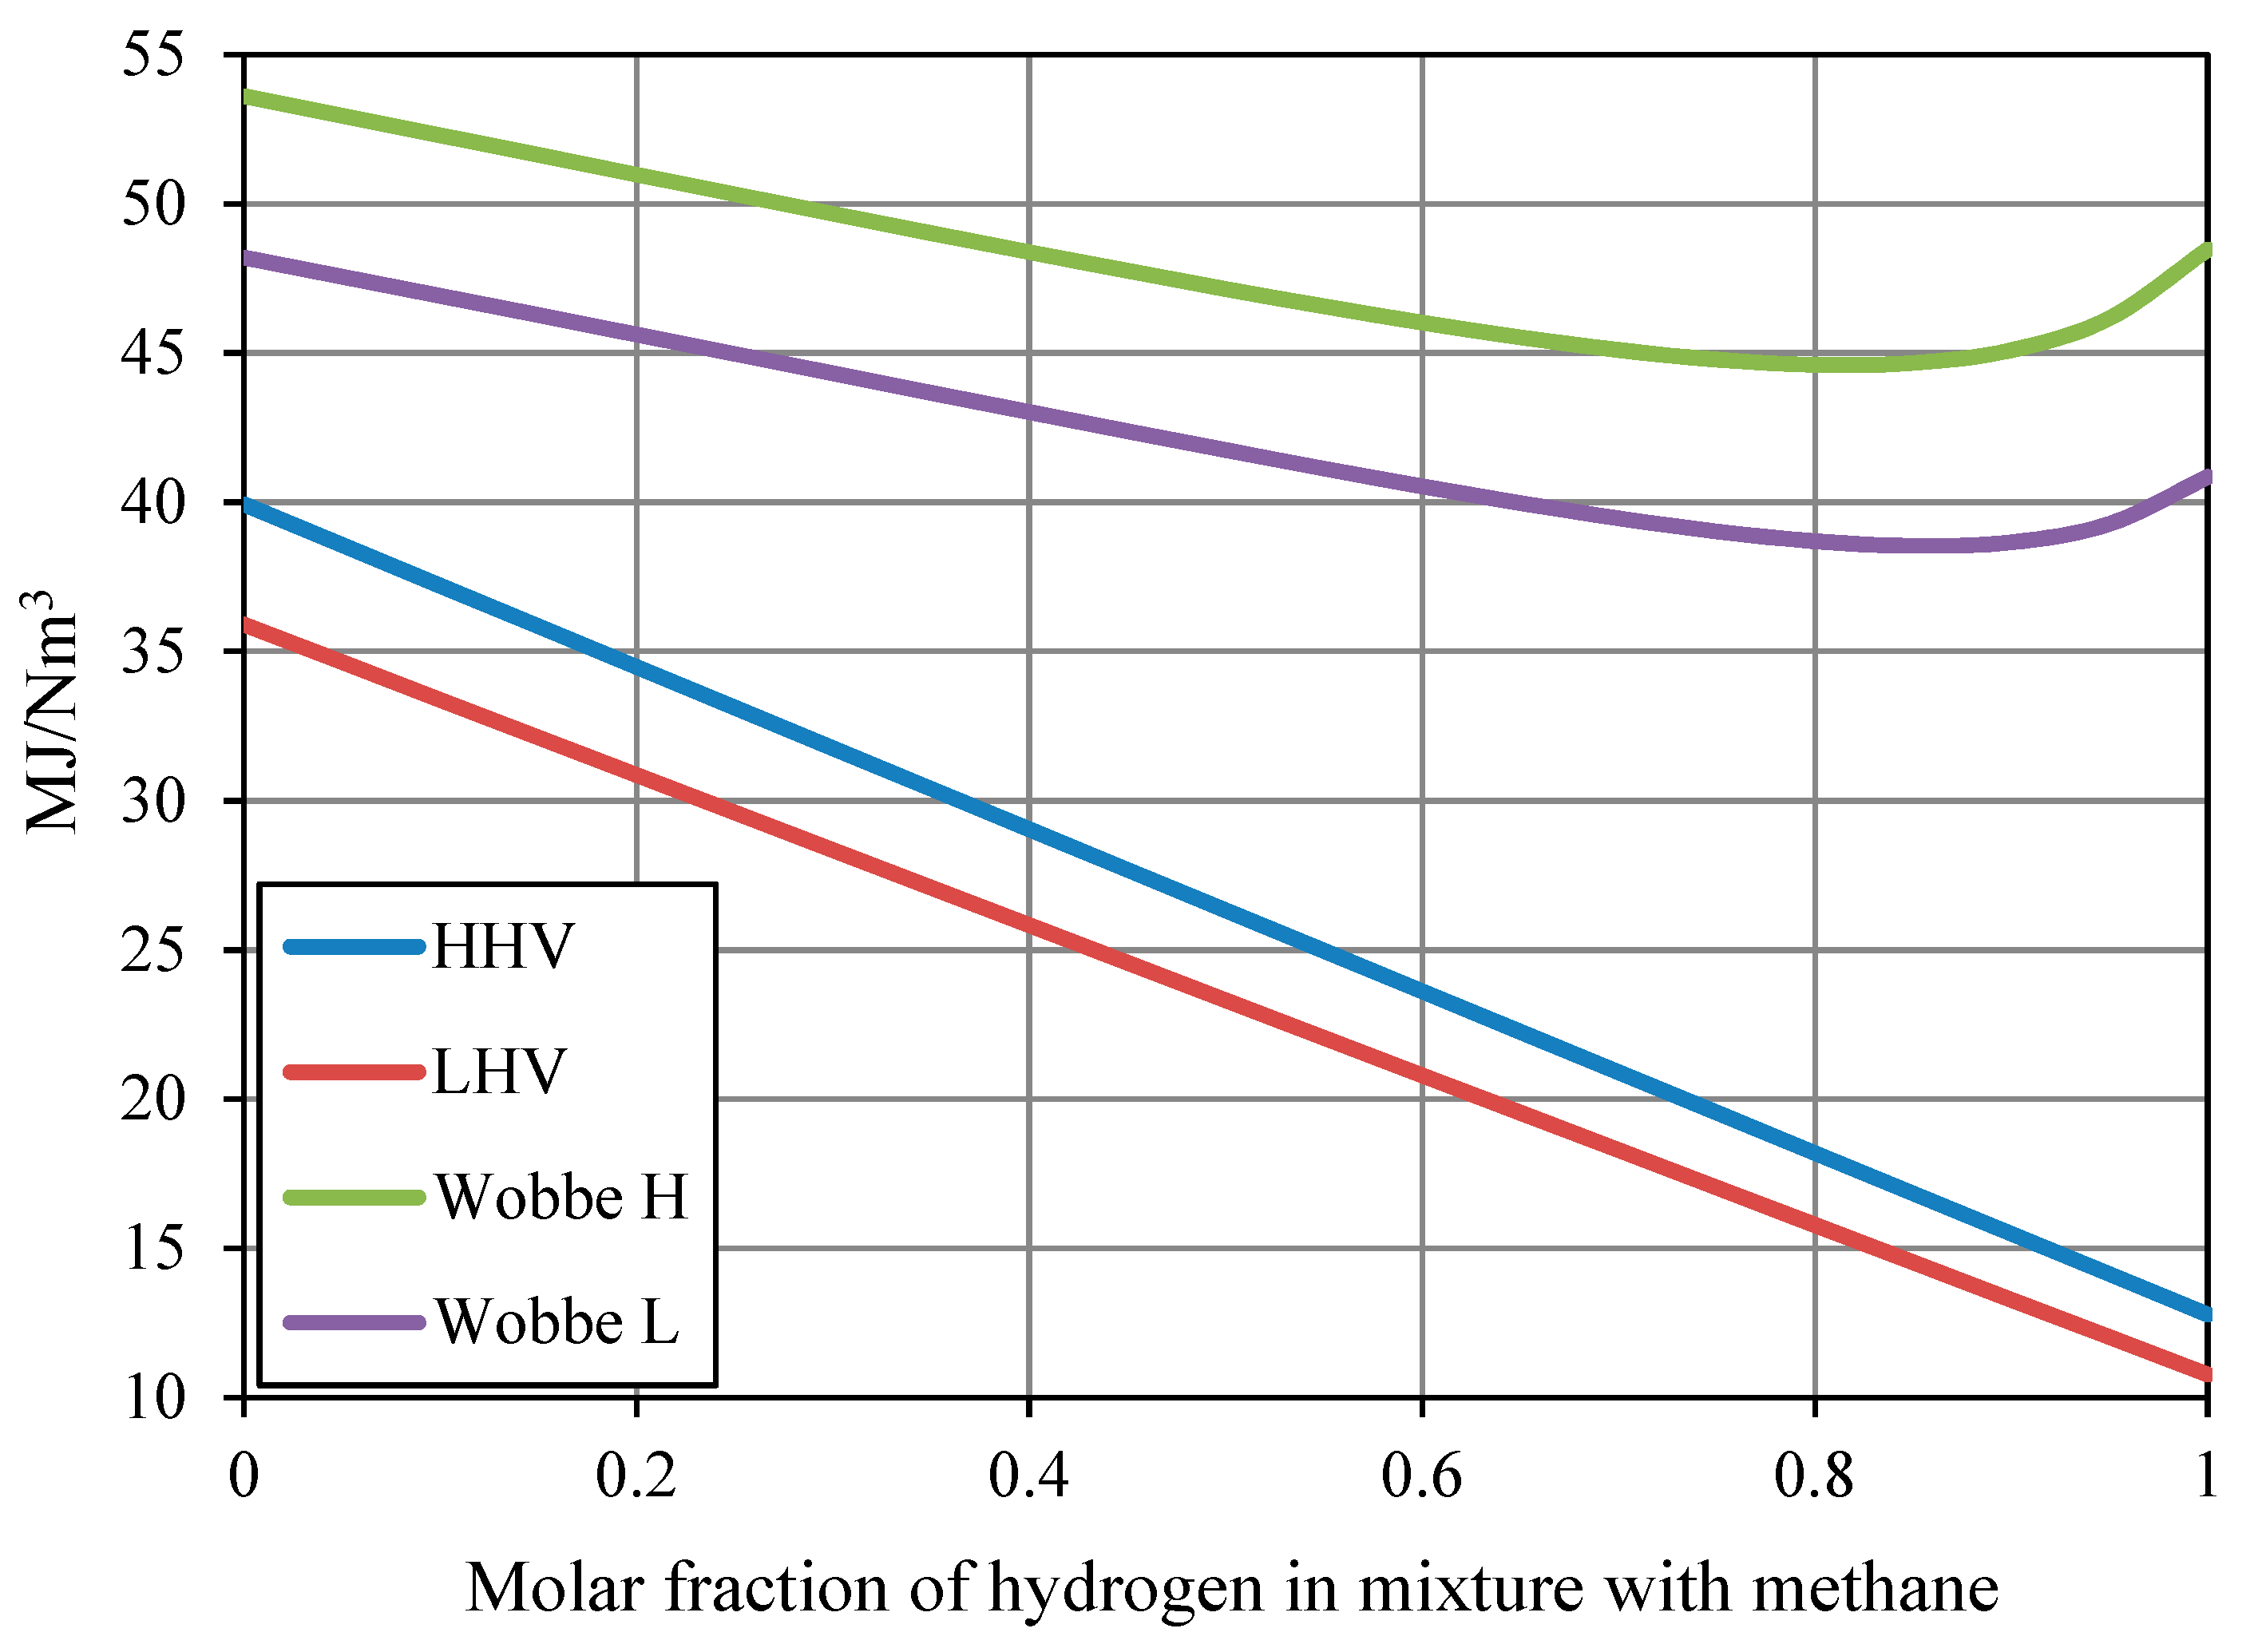
41]. Hydrogen significantly influences natural gas transmission conditions. The basic advantage is lowering the pressure drop of natural gas transmitted with a hydrogen admixture, and possibility to transmit natural gas across longer distances without additional gas compression stations. Unfortunately, the hydrogen content in natural gas significantly deteriorates the energy parameters and calorific value of natural gas. The changes in higher heating value (HHV) and lower heating value (LHV), calorific value of the mixture, and Wobbe index as a function of hydrogen content in the methane mixture are presented in
Figure 13.
The pressure and temperature changes as a function of pipeline length for a mixture of methane and 15% hydrogen transmitted at a flow rate of 40,000 Nm
3/h are presented in
Figure 14 for three recommended pipeline diameters. The change in thermodynamic parameters was also analyzed as a function of molar fraction of hydrogen in the mixture for a 250 mm diameter.
This analysis of the hydrogen molar fraction in the hydrogen/methane mixture confirms the effect of pressure drop in the analyzed pipeline. The required inlet pipeline pressure, for a 15% hydrogen content in the gas mixture, is approximately 10% lower when compared to pure methane (
Figure 15). An increase in hydrogen molar content caused the temperature of the analyzed gas mixture to more rapidly approach the ambient temperature. On the other hand, the Joule–Thomson effect for methane caused slight cooling of the analyzed mixtures, and for pure hydrogen this effect did not take place.
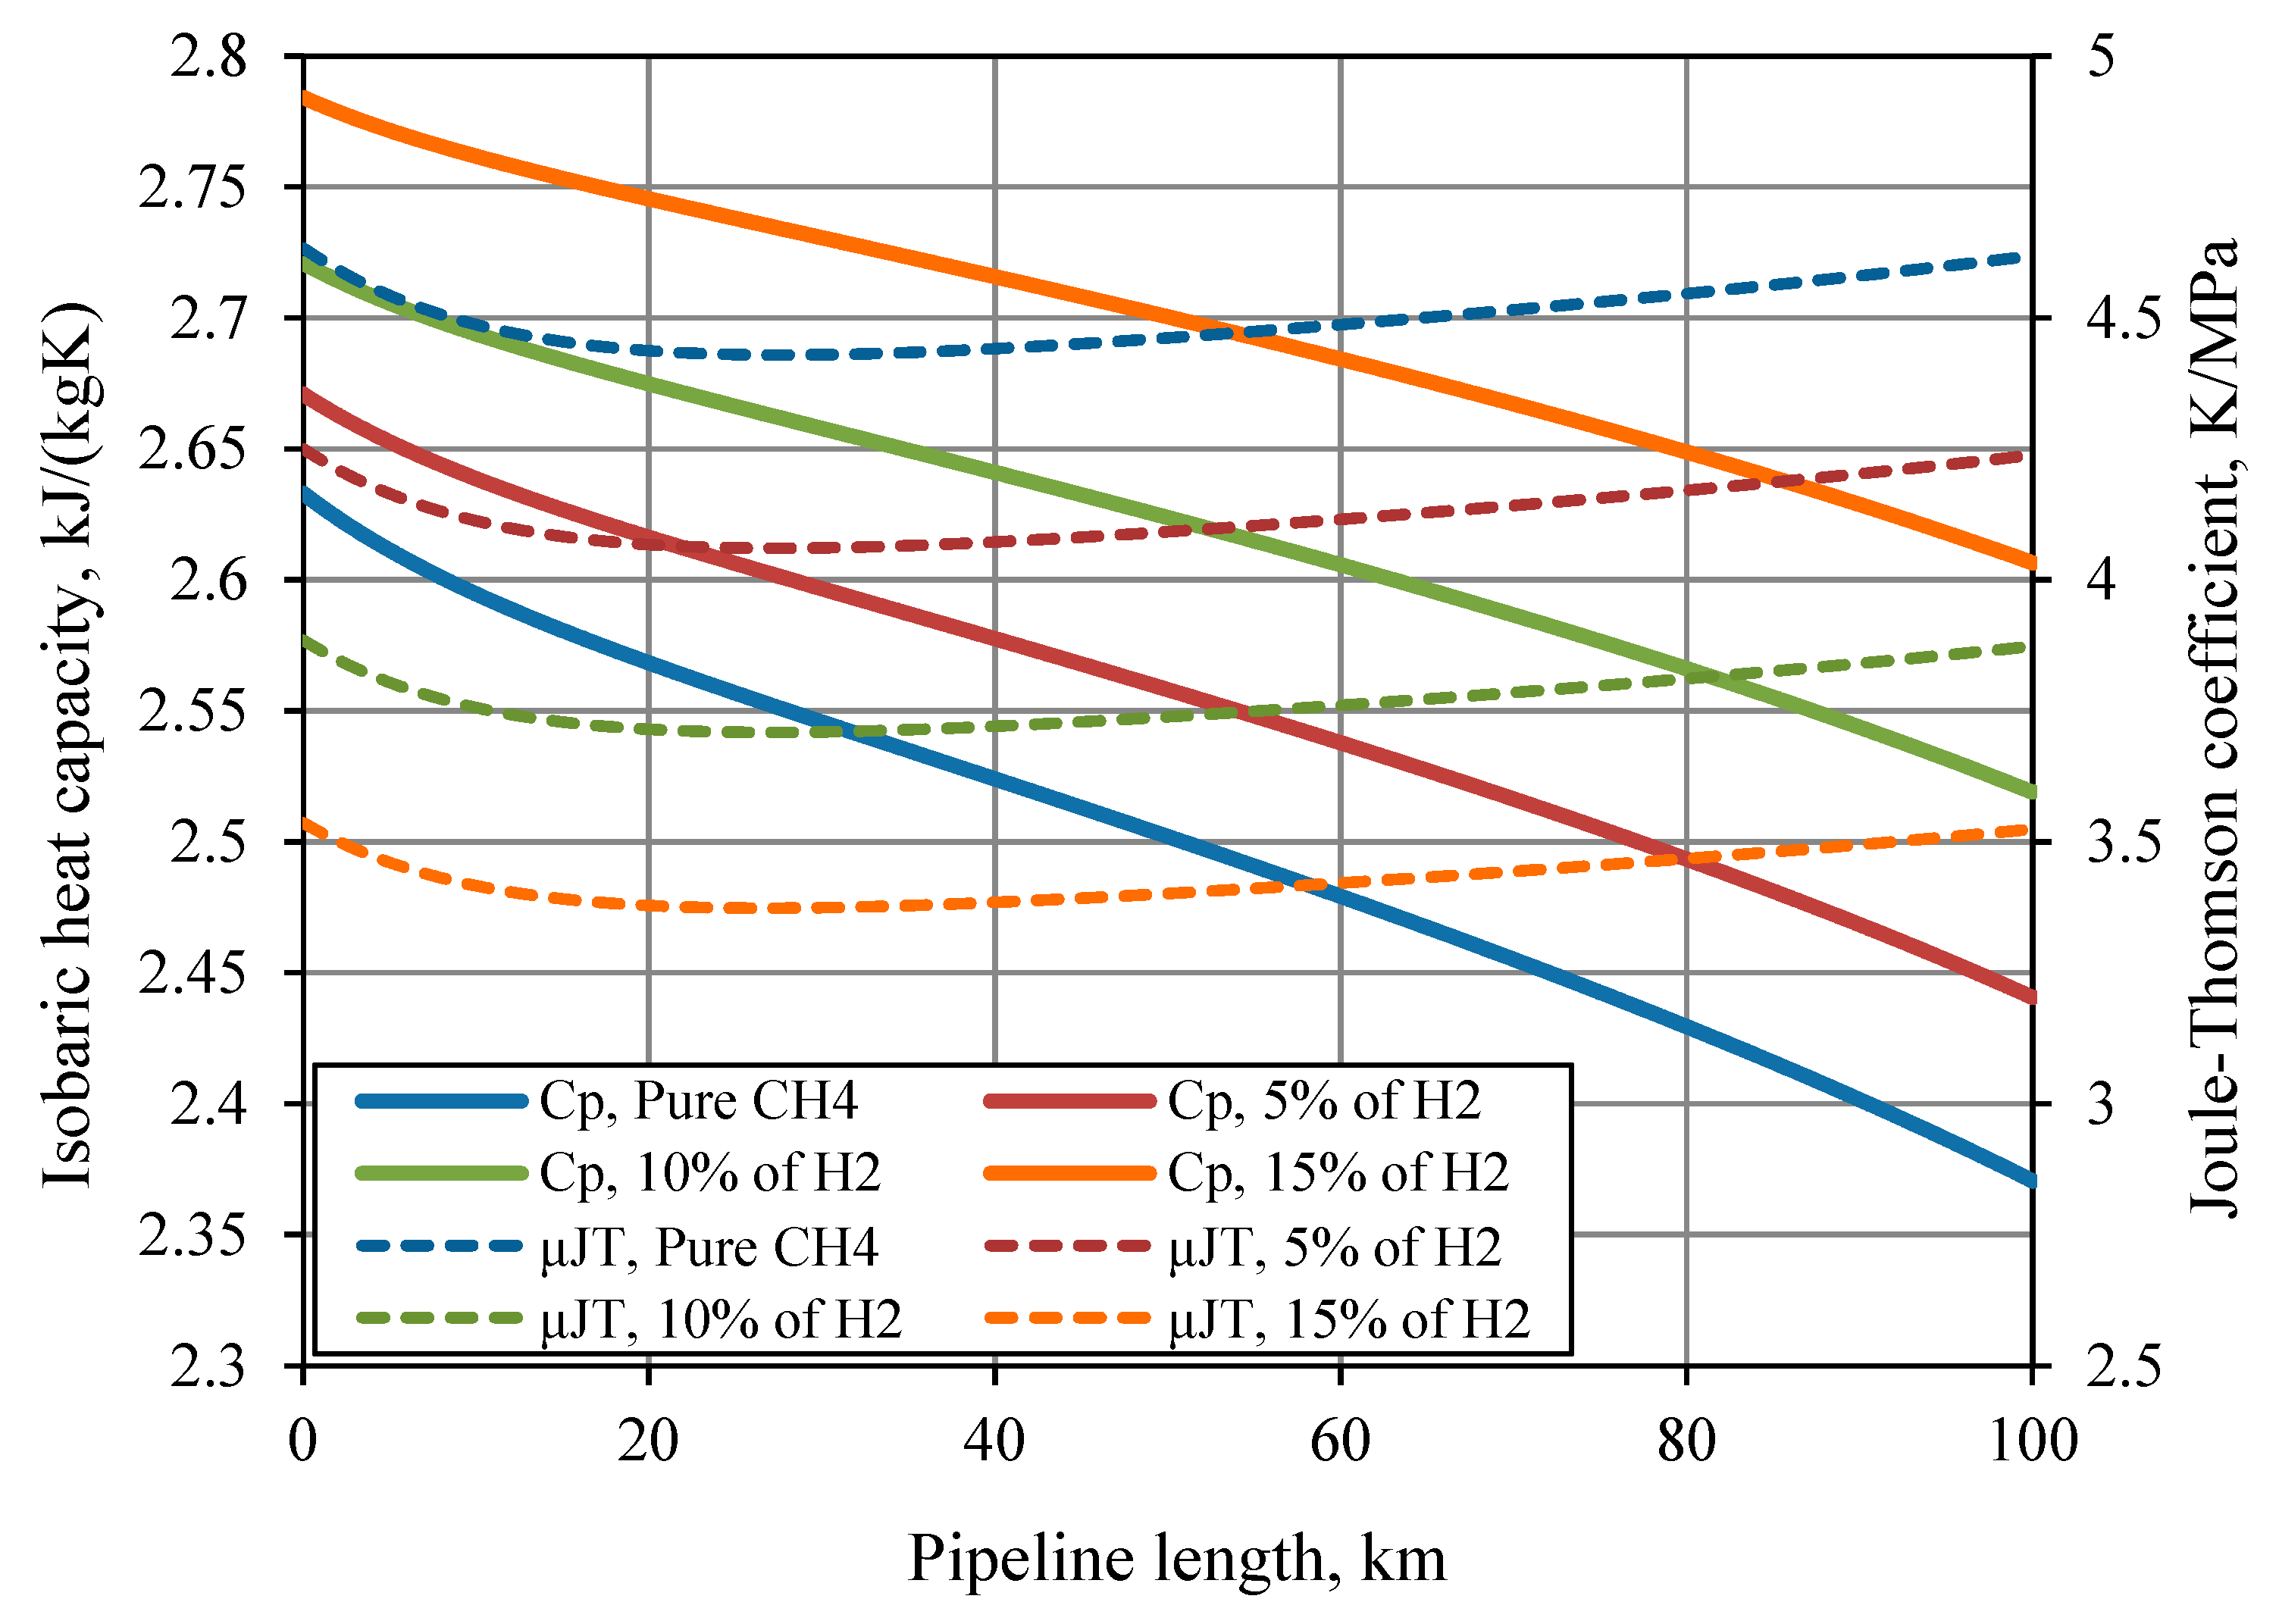
The variability of analyzed thermodynamic parameters of a methane/hydrogen mixture as a function of hydrogen molar fraction is shown in
Figure 16,
Figure 17 and
Figure 18. The analyzed mixtures contained a maximum 15% of hydrogen; studies and practice have shown that this amount of hydrogen in the methane or natural gas mixture does not significantly affect the transmission parameters of the pipeline. However, it should be noted that a change in density is important: it can be altered by up to 20% for a 15% content of hydrogen in the mixture when compared to pure methane. Apart from a considerable lowering of density, the Joule–Thomson effect is also lowered with an increase in hydrogen content. With increased hydrogen content, its specific heat also increases for a unit of mass due to the high calorific value of hydrogen per unit of mass. The compressibility factor has been also observed to grow significantly. The addition of hydrogen improves to some extent the natural gas transmission conditions by pressure drop reduction in the pipeline. However, hydrogen content above 15%–20% in the gas mixture significantly influences the calorific value of natural gas. The change in thermodynamic conditions with an increased hydrogen content may also affect the natural gas transmission system (i.e., gas compression stations or gas reduction stations). Another important issue is selection of the material for pipeline construction in light of the hydrogen corrosion case [
42], which affects the cost of its construction [
20,
43].
5. Discussion
Hydrogen pipeline transmission analysis discussed an example of 100 km long pipeline and the required outlet pressure of 24 bar (g). Pressure drop and temperature change profiles were determined for selected pipeline diameters and mass flow rates from 0.3 to 3.0 kg/s, which corresponds to volume flow rates from 12,000 to 120,000 Nm3/h of hydrogen. An analogous analysis has been performed for a mixture of methane and hydrogen with a maximum hydrogen content of 15%. Due to the fact that hydrogen has a significantly lower mass than methane, the pipeline transmission of methane and hydrogen mixtures requires larger pipeline diameters for similar volume flow rates. On the basis of the determined profiles of pressure and temperature changes in the pipeline, a detailed analysis of thermodynamic parameters was performed. This analysis was important from a hydrogen and methane–hydrogen mixture pipeline transmission perspective. In particular, the analysis included density, flow velocity, isobaric heat capacity, the compressibility factor, and Joule-Thomson coefficient. The last two parameters, which significantly affect the conditions of transport, are specific to hydrogen. Hydrogen has negative values of Joule-Thomson coefficient and the compressibility factor value exceeds 1.0 in the range of relatively low pressures. Due to different thermodynamic parameters, the hydrogen content in a mixture with methane causes significant changes in natural gas pipeline transport conditions. The most important change is the reduction of pressure drop, which allows an increase in the distance at which it is possible to transport the assumed volume of natural gas. Significant differences also occur in the temperature change profiles in the pipeline, as the hydrogen content reduces the positive Joule-Thomson effect for natural gas. It should be noted that in the simulation it was assumed that full heat transfer between the transported gas and the ambient environment may occur. The molar fraction of hydrogen in a mixture with natural gas may have a beneficial influence on the conditions of its transmission. However, hydrogen content should not exceed 15%–20% in the mixture. With a hydrogen content above 20% in the mixture with methane, the higher heating value (HHV) drops below 35 MJ/Nm3; thus, natural gas loses its calorific value (below values described by norms and standards), even though the upper Wobbe index remains within accepted norms.
6. Conclusions
The main objective of this paper was to analyze the possibilities of pipeline transmission of hydrogen and methane/hydrogen mixtures. This analysis has been performed to determine the impact of hydrogen content on the conditions of natural gas transmission, the main component of which is methane. It should be emphasized that hydrogen will play an increasingly important role as an energy carrier in the global economy, particularly for energy storage. The economic environment for the use of hydrogen should be favorable in the coming years. A steady increase of renewable energy content in the total energy balance in all regions of the world, and the growing irregularities in power generation and usage, will have an important role in the field of hydrogen utilization. Hydrogen pipeline transmission is the most effective method for transporting significant amounts of hydrogen over long distances, in particular for its storage, when the appropriate storage site for hydrogen is located at a considerable distance from the source of its generation due to geological conditions (suitable locations for salt cavern). In addition, technological and technical issues related to pipeline transmission of natural gas with an increased hydrogen content should be considered, where a significant change in thermodynamic parameters may also affect the operational conditions of installations associated with the transmission system. An additional problem is the impact of the increased molar fraction of hydrogen on the pipe material.
Author Contributions
Conceptualization, T.W. and M.Ł.; formal analysis, T.W.; funding acquisition, M.Ł. and A.S.; investigation, T.W. and S.K.; methodology, T.W.; supervision, M.Ł. and A.S.; validation, T.W. and A.O.; visualization, T.W.; writing—original draft, T.W.; writing—review and editing, S.K. and T.W.
Funding
This work received funding from the Statutory Research of Natural Gas Department at Drilling Oil & Gas Faculty, no. 11.11.190.555.
Conflicts of Interest
The authors declare no conflict of interest.
Nomenclature
| am | Peng Robinson EOS parameter, N·m4/mol2 |
| bm | Peng Robinson EOS parameter (co-volume), m3/mol |
| A, B | Dimensionless Peng Robinson EOS parameters |
| Cp | Isobaric heat capacity, J/(kg·K) or J/(mol·K) |
| Cpid | Ideal gas isobaric heat capacity, J/(kg·K) or J/(mol·K) |
| Cpr | Real gas (residual) isobaric heat capacity, J/(kg·K) or J/(mol·K) |
| d | Relative density of gas |
| D | Pipeline inner diameter, m |
| g | Gravity constant, m/s2 |
| Δh | Elevation level difference, m |
| k | Thermal conductivity, W/(m·K) |
| L | Pipeline segment length, m |
| Le | Equivalent pipeline segment length, m |
| Mass flow rate, kg/s |
| P | Pressure, Pa |
| p1 | Pipeline inlet pressure, Pa |
| p2 | Pipeline outlet pressure, Pa |
| pav | Pipeline average pressure, Pa |
| pb | Base pressure, Pa |
| Qn | Volume flow rate under normal conditions, Nm3/s |
| R | Pipeline inner radius, m |
| R | Gas constant, J/(mol·K) |
| Re | Reynolds number |
| T | Fluid temperature, K |
| Tb | Base temperature, K |
| Tin | Temperature in pipeline, K |
| Tout | Ambient temperature, K |
| U | Overall heat transfer coefficient, W/(m2·K) |
| V | Molar volume, m3/mol |
| Z | Compressibility factor, |
| zx | Depth of pipeline burial, m |
| Α | Convective heat transfer coefficient, W/(m2·K) |
| Ε | Relative pipeline roughness |
| Λ | Linear friction factor |
| μJT | Joule–Thomson coefficient, K/Pa |
| Ρ | Fluid density, kg/m3 |
| Abbreviations | |
| RES | Renewable energy sources |
| HHV | Higher heating value |
| LHV | Lower heating value |
| J–T | Joule–Thomson |
References
- Kharel, S.; Shabani, B. Hydrogen as a long-term large-scale energy storage solution to support renewables. Energies 2018, 11, 2825. [Google Scholar] [CrossRef]
- Wind EUROPE 2017, Wind in Power. 2016 European statistics. Available online: http://windeurope.org (accessed on 20 December 2017).
- International Energy Agency. World Energy Outlook 2017; International Energy Agency: Paris, France, 2017. [Google Scholar]
- Kuczyński, S.; Łaciak, M.; Oliinyk, A.; Szurlej, A.; Włodek, T. Thermodynamic and technical issues of hydrogen and methane-hydrogen mixtures high-pressure pipeline transmission. In Proceedings of the 1st Latin American Conference on Sustainable Development of Energy Water and Environmental Systems-LA SDEWES, Rio de Janeiro, Brazil, 28–31 January 2018. [Google Scholar]
- Fu, Z.; Lu, K.; Zhu, Y. Thermal system analysis and optimization of large-scale compressed air energy storage (CAES). Energies 2015, 8, 8873–8886. [Google Scholar] [CrossRef]
- Abbaspour, M.; Satkin, M.; Mohammadi-Ivatloo, B.; Lotfi, F.H.; Noorollahi, Y. Optimal operation scheduling of wind power integrated with compressed air energy storage (CAES). Renew. Energy 2013, 51, 53–59. [Google Scholar] [CrossRef]
- Blew, W.; Foltynowicz, M.; Kowalczyk, A. Projekt HESTOR. Innowacyjne metody magazynowania i wykorzystania energii z OZE. Pol. Chem. 2016, 2, 10–14. [Google Scholar]
- Hosseini, S.F.; Wahid, M.A. Hydrogen production from renewable and sustainable energy resources: Promising green energy carrier for clean development. Renew. Sustain. Energy Rev. 2016, 57, 850–866. [Google Scholar] [CrossRef]
- Union, E. Directive 2009/28/EC of The European Parliament and of The Council of 23 April 2009 on the promotion of the use of energy from renewable sources. Off. J. Eur. Union 2009, OJL 140, 16–62. [Google Scholar]
- Blacharski, T.; Kogut, K.; Szurlej, A. The perspectives for the use of hydrogen for electricity storage considering the foreign experience. E3S Web of Conf. 2017, 14, 1–10. [Google Scholar] [CrossRef]
- Ball, M.; Basile, A.; Veziroglu, T.N. Compendium of Hydrogen Energy: Hydrogen Use, Safety and the Hydrogen Economy; Woodhead Publishing: Cambridge, UK, 2015. [Google Scholar]
- Włodek, T.; Kuczyński, S.; Łaciak, M.; Szurlej, A. Possibilities and Selected Aspects of Hydrogen Energy Storage. 2nd World Congress on Petroleum and Refinery. J. Environ. Biotechnol. 2017, 8, 48. [Google Scholar]
- Simon, J.; Ferriz, A.M.; Correas, L.C. HyUnder–hydrogen underground storage at large scale: Case study Spain. Energy Procedia 2015, 73, 136–144. [Google Scholar] [CrossRef]
- Tarkowski, R. Perspectives of using the geological subsurface for hydrogen storage in Poland. Int. J. Hydrog. Energy 2017, 42, 347–355. [Google Scholar] [CrossRef]
- Ślizowski, J.; Smulski, R.; Nagy, S.; Burliga, S.; Polański, K. Tightness of hydrogen storage caverns in salt deposits. AGH Drill. Oil Gas 2017, 34, 397–409. [Google Scholar] [CrossRef]
- Lankof, L.; Polański, K.; Ślizowski, J.; Tomaszewska, B. Possibility of energy storage in salt caverns. AGH Drill. Oil Gas 2016, 33, 405–415. [Google Scholar] [CrossRef]
- Ślizowski, J.; Urbańczyk, K.; Łaciak, M.; Lankof, L.; Serbin, K. Efektywność magazynowania gazu ziemnego i wodoru w kawernach solnych. Przemysł Chemiczny Chem. Ind. 2017, 96, 994–998. [Google Scholar]
- Witkowski, A.; Rusin, A.; Majkut, M.; Stolecka, K. Comprehensive analysis of hydrogen compression and pipeline transportation from thermodynamics and safety aspects. Energy 2017, 141, 2508–2518. [Google Scholar] [CrossRef]
- Lins, P.; Almeida, A. Multidimensional risk analysis of hydrogen pipelines. Int. J. Hydrog. Energy 2012, 37, 13545–13554. [Google Scholar] [CrossRef]
- Gupta, R.; Basile, A.; Veziroglu, T.N. Compendium of Hydrogen Energy: Hydrogen Storage, Distribution and Infrastructure; Woodhead Publishing: Cambridge, UK, 2016. [Google Scholar]
- Haeseldonckx, D.; D’haeseleer, W. The use of the natural-gas pipeline infrastructure for hydrogen transport in a changing market structure. Int. J. Hydrog. Energy 2007, 32, 1381–1386. [Google Scholar] [CrossRef]
- Blacharski, T.; Janusz, P.; Kaliski, M.; Zabrzeski, Ł. The effect of hydrogen transported through gas pipelines on the performance of natural gas grid AGH Drill. Oil Gas 2016, 33, 515–529. [Google Scholar]
- Serbin, K.; Ślizowski, J.; Urbańczyk, K.; Nagy, S. The influence of thermodynamic effects on gas storage cavern convergence. Int. J. Rock Mech. Min. Sci. 2015, 79, 166–171. [Google Scholar] [CrossRef]
- De Vries, H.; Florisson, O.; Thiekstra, G.C. Safe operation of natural gas appliances fueled with hydrogen/natural gas mixtures (progress obtained in the NaturalHy-project). In Proceedings of the International Conference on Hydrogen Safety, San Sebastian, Spain, 11–13 September 2007. [Google Scholar]
- Wurm, J.; Pasteris, R.F. The transmission of gaseous hydrogen. In Proceedings of the Fall Meeting of the Society of Petroleum Engineers of AIME, Las Vegas, NV, USA, 30 September–3 October 1973; p. 4526. [Google Scholar]
- Peet, Y.; Saguut, P.; Charron, Y. Pressure loss reduction in hydrogen pipeline by surface restructuring. Int. J. Hydrog. Energy 2009, 34, 8964–8973. [Google Scholar] [CrossRef]
- Takahashi, K. Transportation of Hydrogen by pipeline. In Energy Carriers and Conversion Systems, 2nd ed.; Ohta, T., Ed.; EOLSS: Paris, France, 2004. [Google Scholar]
- Włodek, T.; Łaciak, M.; Kurowska, K.; Węgrzyn, Ł. Thermodynamic analysis of hydrogen pipeline transportation—Selected aspects. AGH Drill. Oil Gas 2016, 33, 379–396. [Google Scholar] [CrossRef]
- Dodds, P.E.; Demoullin, S. Conversion of the UK gas system to transport hydrogen. Int. J. Hydrog. Energy 2013, 38, 7189–7200. [Google Scholar] [CrossRef] [Green Version]
- Colebrook, C.F.; White, C.M. Experiments with fluid friction in roughened pipes. Proc. R. Soc. 1937, 161, 367–381. [Google Scholar] [Green Version]
- Nagy, S. Vademecum Gazownika—Vademecum of the Gasifier; SITPNIG: Krakow, Poland, 2014; Volume 1. [Google Scholar]
- Shashi Menon, E. Gas Pipeline Hydraulics; CRC PRESS: Boca Raton, FL, USA, 2005. [Google Scholar]
- Duan, J.; Wang, W.; Zhang, Y.; Liu, H.; Lin, B.; Gong, J. Calculation on inner wall temperature in oil-gas pipe flow. J. Cent. South Univ. 2012, 19, 1932–1937. [Google Scholar] [CrossRef]
- Incropera, F.P.; DeWitt, D.P. Introduction to Heat Transfer, 3rd ed.; John Wiley & Sons Inc.: New York, NY, USA, 1966. [Google Scholar]
- Bai, Y.; Bai, Q. Subsea Pipelines and Risers; Elsevier: Cambridge, UK, 2005. [Google Scholar]
- Peng, D.Y.; Robinson, D.B. A new two-constant equation of state. Ind. Eng. Chem. Fundam. 1976, 15, 59–64. [Google Scholar] [CrossRef]
- Pratt, M.R. Thermodynamic properties involving derivatives: Using the Peng-Robinson equation of state. Chem. Eng. Educ. 2001, 35, 112–115. [Google Scholar]
- Tarom, N.; Hossain, M.M. A practical method for the evaluation of the Joule Thomson effects to predict flowing temperature profile in gas producing wells. J. Nat. Gas Sci. Eng. 2015, 26, 1080–1090. [Google Scholar] [CrossRef]
- Nagy, S.; Łaciak, M.; Włodek, T. Analiza możliwości bezpiecznego rurociągowego transportu wodoru. Report from Work Package 7, Project GEKON-HESTOR. Unpublished work. 2016. [Google Scholar]
- Bedel, L.; Junker, M. Natural gas pipelines for hydrogen transportation. In Proceedings of the WHEC Conference Session, Lyon, France, 13–16 June 2006. [Google Scholar]
- Odgen, J.; Myers Ja, A.; Scheitrum, D.; McDonald, Z.; Miller, M. Natural gas as a bridge to hydrogen transportation fuel: Insights from the literature. Energy Policy 2018, 115, 317–329. [Google Scholar]
- Meng, B.; Gu, C.; Zhang, L.; Zhou, C.; Li, X.; Zhao, Y.; Zheng, J.; Chen, X.; Han, Y. Hydrogen effects on X80 pipeline steel in high-pressure natural gas/hydrogen mixtures. Int. J. Hydrog. Energy 2017, 42, 7404–7412. [Google Scholar] [CrossRef]
- Fekete, J.R.; Sowards, J.W.; Amaro, R.L. Economic impact of applying high strength steels in hydrogen gas pipelines. Int. J. Hydrog. Energy 2015, 40, 10547–10558. [Google Scholar] [CrossRef] [Green Version]
Figure 1.
Scheme of hydrogen energy storage processes.
Figure 1.
Scheme of hydrogen energy storage processes.
Figure 2.
Cross section of an exemplary pipeline.
Figure 2.
Cross section of an exemplary pipeline.
Figure 3.
Overall heat transfer coefficient as a function of pipeline inner diameter for different flow rates of pure methane and pure hydrogen.
Figure 3.
Overall heat transfer coefficient as a function of pipeline inner diameter for different flow rates of pure methane and pure hydrogen.
Figure 4.
Diameter calculation for pure hydrogen pipeline as a function of pipeline inlet pressure.
Figure 4.
Diameter calculation for pure hydrogen pipeline as a function of pipeline inlet pressure.
Figure 5.
Diameter calculation for methane–hydrogen (15%) mixture pipeline as a function of pipeline inlet pressure.
Figure 5.
Diameter calculation for methane–hydrogen (15%) mixture pipeline as a function of pipeline inlet pressure.
Figure 6.
Pressure (p) (continuous lines) and temperature (T) (dashed lines) changes for hydrogen mass flow rate of 0.3 kg/s (12,000 Nm3/h) and different diameters.
Figure 6.
Pressure (p) (continuous lines) and temperature (T) (dashed lines) changes for hydrogen mass flow rate of 0.3 kg/s (12,000 Nm3/h) and different diameters.
Figure 7.
Pressure (p) (continuous lines) and temperature (T) (dashed lines) changes for hydrogen mass flow rate of 1.0 kg/s (40,000 Nm3/h) for different diameters.
Figure 7.
Pressure (p) (continuous lines) and temperature (T) (dashed lines) changes for hydrogen mass flow rate of 1.0 kg/s (40,000 Nm3/h) for different diameters.
Figure 8.
Pressure (p) (continuous lines) and temperature (T) (dashed lines) changes for hydrogen mass flow rate of 2.0 kg/s (80,000 Nm3/h) for different diameters.
Figure 8.
Pressure (p) (continuous lines) and temperature (T) (dashed lines) changes for hydrogen mass flow rate of 2.0 kg/s (80,000 Nm3/h) for different diameters.
Figure 9.
Pressure (p) (continuous lines) and temperature (T) (dashed lines) changes for hydrogen mass flow rate of 3.0 kg/s (120,000 Nm3/h) for different diameters.
Figure 9.
Pressure (p) (continuous lines) and temperature (T) (dashed lines) changes for hydrogen mass flow rate of 3.0 kg/s (120,000 Nm3/h) for different diameters.
Figure 10.
Density (ρ) (continuous lines) and flow velocity (w) (dashed lines) changes for hydrogen mass flow rate 1.0 kg/s (40,000 Nm3/h).
Figure 10.
Density (ρ) (continuous lines) and flow velocity (w) (dashed lines) changes for hydrogen mass flow rate 1.0 kg/s (40,000 Nm3/h).
Figure 11.
Compressibility factor changes for hydrogen mass flow rate 1.0 kg/s (40,000 Nm3/h).
Figure 11.
Compressibility factor changes for hydrogen mass flow rate 1.0 kg/s (40,000 Nm3/h).
Figure 12.
Isobaric heat capacity (Cp) (continuous lines) and Joule–Thomson coefficient (μJT) (dashed lines) changes for hydrogen mass flow rate 1.0 kg/s (40,000 Nm3/h).
Figure 12.
Isobaric heat capacity (Cp) (continuous lines) and Joule–Thomson coefficient (μJT) (dashed lines) changes for hydrogen mass flow rate 1.0 kg/s (40,000 Nm3/h).
Figure 13.
Changes of higher heating value (HHV), lower heating value (LHV) and Wobbe indexes as a function of hydrogen molar fraction in mixture with methane.
Figure 13.
Changes of higher heating value (HHV), lower heating value (LHV) and Wobbe indexes as a function of hydrogen molar fraction in mixture with methane.
Figure 14.
Pressure (p) (continuous lines) and temperature (T) (dashed lines) changes for methane–15% hydrogen mixture mass flow rate of 6.93 kg/s (40,000 Nm3/h) for different diameters.
Figure 14.
Pressure (p) (continuous lines) and temperature (T) (dashed lines) changes for methane–15% hydrogen mixture mass flow rate of 6.93 kg/s (40,000 Nm3/h) for different diameters.
Figure 15.
Pressure (p) (continuous line) and temperature (T) (dashed line) changes as a function of hydrogen content in mixture with methane and pipeline length.
Figure 15.
Pressure (p) (continuous line) and temperature (T) (dashed line) changes as a function of hydrogen content in mixture with methane and pipeline length.
Figure 16.
Density (ρ) (continuous lines) and flow velocity (w) (dashed lines) changes as a function of hydrogen content and pipeline length.
Figure 16.
Density (ρ) (continuous lines) and flow velocity (w) (dashed lines) changes as a function of hydrogen content and pipeline length.
Figure 17.
Isobaric heat capacity (Cp) (continuous lines) and Joule–Thomson coefficient (μJT) (dashed lines) changes as a function of hydrogen content and pipeline length.
Figure 17.
Isobaric heat capacity (Cp) (continuous lines) and Joule–Thomson coefficient (μJT) (dashed lines) changes as a function of hydrogen content and pipeline length.
Figure 18.
Compressibility factor changes as a function of hydrogen content and pipeline length.
Figure 18.
Compressibility factor changes as a function of hydrogen content and pipeline length.
Table 1.
Recommended pipeline diameters for pure hydrogen and methane/hydrogen mixture transmission.
Table 1.
Recommended pipeline diameters for pure hydrogen and methane/hydrogen mixture transmission.
| Volume Flow Rate, Nm3/h | Pure Hydrogen | Methane (85%) Hydrogen (15%) |
|---|
| Diameter, mm | Diameter, mm |
|---|
| 12,000 | 100–150 | 125–200 |
| 40,000 | 150–250 | 250–300 |
| 80,000 | 200–300 | 300–400 |
| 120,000 | 250–400 | 350–500 |
© 2019 by the authors. Licensee MDPI, Basel, Switzerland. This article is an open access article distributed under the terms and conditions of the Creative Commons Attribution (CC BY) license (http://creativecommons.org/licenses/by/4.0/).


