Experimental Study and Mechanism Analysis of the Effect of Oil Viscosity and Asphaltene on Foamy Oil

College of Petroleum Engineering, China University of Petroleum (East China), Qingdao 266580, China
*
Authors to whom correspondence should be addressed.
Energies 2019, 12(4), 761; https://0-doi-org.brum.beds.ac.uk/10.3390/en12040761
Submission received: 8 January 2019
/
Revised: 14 February 2019
/
Accepted: 20 February 2019
/
Published: 25 February 2019
(This article belongs to the Special Issue Enhanced Oil Recovery 2019)
Abstract
:Foamy oil is considered an important reason for the anomalous performance in depletion development for some heavy oil reservoirs, but its influence factors remain to be fully investigated. In order to determine the effect of oil viscosity and asphaltene on foamy oil, ten oil samples including two types (deasphalted oil and asphaltenic oil) and five viscosities were used in the work. On this basis, depletion experiments were conducted in a sandpack and microscopic visualization model. Then, viscoelastic moduli of the oil–gas interface were measured to analyze the mechanisms of viscosity and asphaltene of foamy oil from the perspective of interfacial viscoelasticity. Results show that, with the decrease of the oil viscosity, the foamy oil performance in depletion development worsened, including a rapider decline in average pressure, earlier appearance of gas channeling, shorter period of foamy oil, and lower contribution of foamy oil to recovery. Asphaltene had an influence on foamy oil only in the viscosity range between 870 mPa∙s and 2270 mPa∙s for this study. The effect of viscosity and asphaltene on foamy oil can be explained by the viscoelasticity of bubble film. With the increase of oil viscosity, the interfacial viscous modulus increases significantly, indicating the bubble film becomes stronger and more rigid. Asphaltene, like armor on the bubble film, can improve the viscoelastic modulus, especially at lower viscosity. This can inhibit the coalescence of micro-bubbles and increase the possibility of splitting. This work identifies the effects of oil viscosity and asphaltene on foamy oil systematically and provides theoretical support for foamy oil production.
1. Introduction
Heavy oil resources are rich and widespread across the world. Reserves account for 70% of total petroleum resources [1]. With the increase in energy demand and the reduction of conventional oil resources, heavy oil is drawing increasing attention for future oil exploitation. Thermal recovery (i.e., cycle steam stimulation, steam flooding, SAGD) is the main development method for heavy oil reservoirs. However, the cost of thermal recovery is extremely high, which is uneconomic in the current situation of low oil prices. Moreover, there are some technical issues during thermal production such as low heat utilization and severe pipeline corrosion. Greenhouse gas emissions are also a disadvantage of thermal recovery. In addition, due to limited space on the ocean platform, thermal recovery is not applicable for offshore heavy oil reservoirs. Although cold production has the advantages of low investment and simple operation, it is not widely applied in heavy oil reservoir development because of its extremely low recovery (usually less than 5%). However, solution gas drive in some heavy oil reservoirs in Venezuela, Canada, and China showed unexpectedly good performance, including high primary recovery, low production gas–oil ratio, and slow reservoir pressure decline, which aroused people’s attention [2,3,4,5,6]. If the anomalous cold production method can be popularized and applied, it will promote the development of heavy oil reservoirs.
Smith first studied the anomalous behavior and thought that solution gas liberated from the oil was dispersed in the oil as a micro-bubble rather than forming a continuous gas phase with the decrease in reservoir pressure [7]. Maini et al. first referred to this gas-in-oil dispersion system as foamy oil [8]. Since then, lots of investigations were conducted, and foamy oil is widely believed to be the reason for the anomalous performance [9,10,11]. The mechanism for foamy oil to improve cold production performance for heavy oil reservoirs can be summarized in several points. Firstly, the formation of foamy oil can trap solution gas and decrease the gas mobility dramatically, resulting in low gas relative permeability and high oil relative permeability. Secondly, the retention of solution gas helps in maintaining the reservoir pressure and increasing drawdown pressure. In addition, some researchers thought the formation of a micro-bubble in heavy oil can reduce its apparent viscosity [7,12]. In order to take full advantage of foamy oil to improve the performance of cold production for heavy oil reservoirs, it is necessary to determine how and why foamy oil forms in these special heavy oil reservoirs; however, the formation conditions of foamy oil are yet to be clarified, and the effect of oil viscosity and asphaltene on foamy oil remains controversial.
Researches show that the formation of foamy oil is closely associated with pressure depletion rate, solution gas–oil ratio, temperature, oil viscosity, and oil components (especially asphaltene) [13,14,15,16,17,18,19]. Pressure depletion rate determines the performance of solution gas drive for heavy oil reservoirs. Depletion sandpack experiments with high recovery occur only at fast pressure depletion rates, indicating that foamy oil forms at fast pressure depletion rates [18,19,20,21,22]. Foamy oil stability evaluation tests also show that the pressure depletion rate must be large enough for the formation of foamy oil [14]. It is believed that a large pressure depletion rate can increase the super-saturation and the pressure gradient, which helps in producing more micro-bubbles and bubble splitting. Researches on solution gas–oil ratio (GOR) show that a higher solution gas–oil ratio means higher saturation pressure and a larger displacement pressure difference; thus, oil recovery increased with solution GOR [23,24,25]. Li et al. found that there was a minimum solution gas–oil ratio for the formation of foamy oil through sandpack depletion experiments [23]. The stability test showed that as the amount of solution gas dissolved in oil increased, the stability of foamy oil improved.
The effects of reservoir temperature and oil viscosity on foamy oil were also investigated [26,27,28]. There exists an optimum temperature for depletion development. Stability evaluation tests also show that a too high temperature is unfavorable to the stability of foamy oil. With the increase of temperature, oil viscosity declines significantly. It is believed that the effect of temperature on foamy oil mainly results from the change in oil viscosity. The high viscosity of heavy oil is considered to be a key condition for the formation of foamy oil [29,30]. In heavy oil, a large viscous force can stably disperse micro-bubbles liberated from oil and reduce the possibility of coalescing. Field and experimental results showed that there is seldom foamy oil appearing in solution gas drives for light oil reservoirs.
However, some researchers found viscosity not to be the intrinsic reason for foamy oil through comparing mineral oil and crude oil results [16]. Asphaltene is well known to cause an increase in viscosity for heavy oil, and, as a surface-active substance, it can be adsorbed onto the oil–gas interface and improve the stability of the micro-bubble. Thus, it is considered that the formation of foamy oil in high-viscosity oil is probably due to asphaltene [31,32,33,34]. However, there are some conflicting results indicating that asphaltene does not make a remarkable contribution to foamy oil [35]. No consensus on the effect of asphaltene on foamy oil is obtained at present. The mechanisms of oil viscosity and asphaltene on foamy oil need to be investigated sufficiently.
Foamy oil is a special foam system, and its interfacial properties are a determining factor for its formation and stability [36,37]. Interfacial technology is widely used in water-based foam, but very little research was done from the perspective of viscoelasticity. The viscoelasticity of bubble film can be characterized by the parameter of viscoelastic modulus (also known as dilatational modulus). The viscoelastic modulus consists of two parts: elastic modulus and viscous modulus. The elastic modulus represents the elasticity of bubble film, and the larger the elastic modulus is, the stronger the ability of bubble film to bounce back or return to its original position will be. The viscous modulus characterizes the strength of the film, and the larger the viscous modulus is, the stronger the ability to resist external disturbance will be. The stability and flow behavior of foam are related to the viscoelasticity [38,39]. Therefore, it is necessary for an understanding of foamy oil to analyze the viscoelasticity of bubble film.
In this study, in order to determine the effect of oil viscosity and asphaltene on foamy oil, ten oil samples including two types (deasphalted oil and asphaltenic oil) and five viscosities were used. On this basis, ten depletion experiments were conducted in a sandpack and micromodel. The effects of oil viscosity and asphaltene on the performance and flow characteristic were studied. Then, viscoelastic moduli of oil–gas interfaces for the ten oil samples were measured, and the mechanisms of viscosity and asphaltene on foamy oil were analyzed from the perspective of viscoelasticity.
2. Materials and Methods
2.1. Materials
Five dead oils (A, B, C, D, and E) were used in this work. Their properties are displayed in Table 1. Oil B was sampled from the MPE3 block in Venezuela, which is famous for foamy oil. Oils A, C, and E were sampled from Shengli oilfield, China. Oil D was sampled from Liaohe oilfield, China. Each dead oil sample was divided into two parts; one part was used to prepare deasphalted oil by removing asphaltene, and the other part was diluted with kerosene to prepare asphaltenic oil. In order to identify the effects of asphaltene and viscosity, the deasphalted oil and its corresponding asphaltenic oil had similar viscosity. The obtained ten oil samples were numbered as shown in Table 2. The live oil used in this work was prepared with dead oil and solution gas. The solution gas was a mixture of CH4 and CO2 with a molar fraction of 87% and 13%. The purity of CH4 and CO2 was 99.9%, produced by Tianyuan Inc. China. Distilled water was used in the experiments to saturate the sandpack.
2.2. Methods
2.2.1. Depletion Experiment
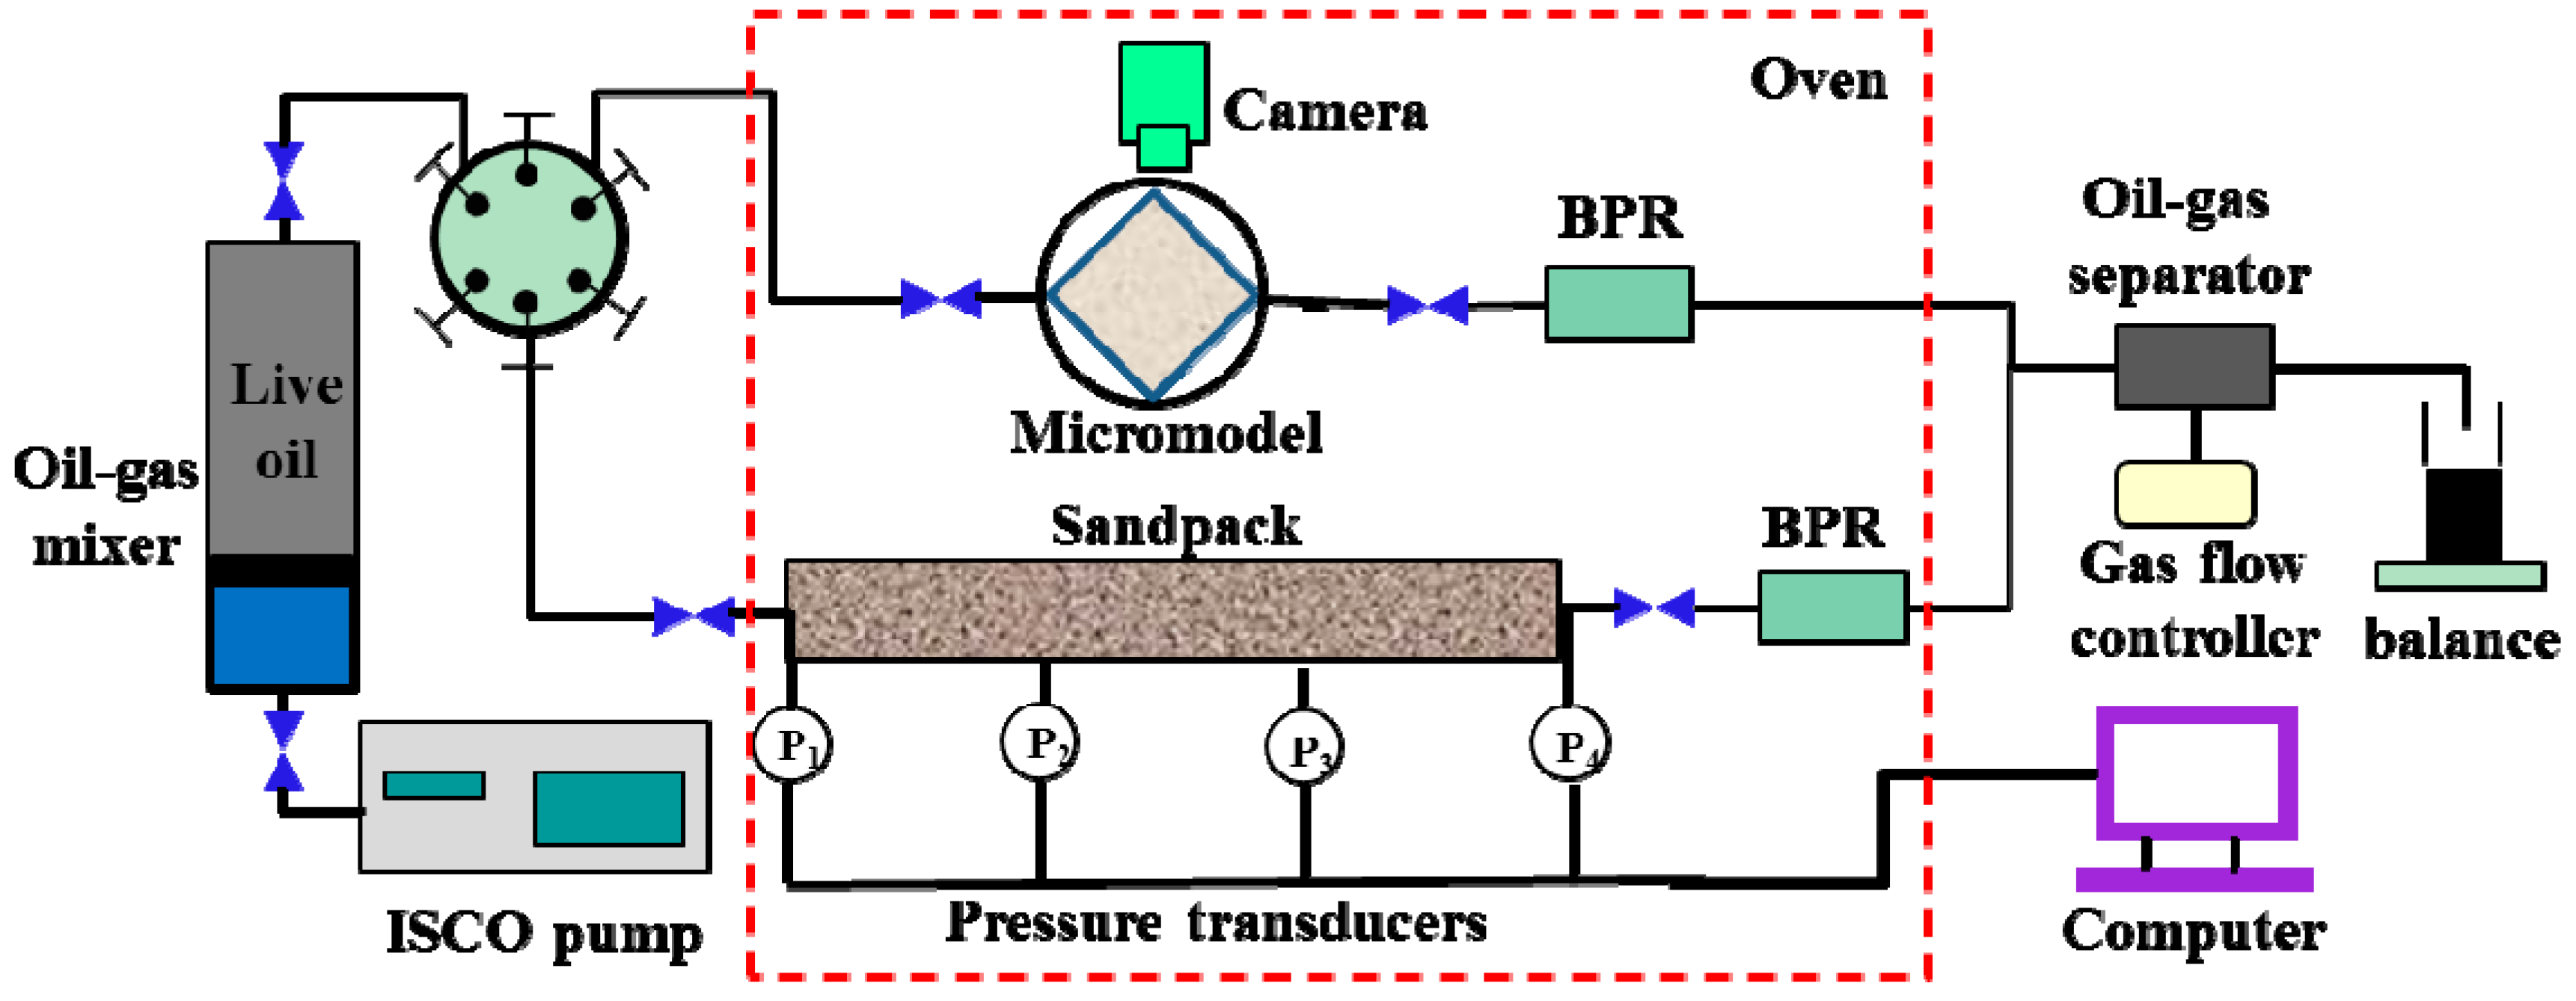
A schematic diagram of the experimental set-up is shown in Figure 1. Live oil was prepared in the oil–gas mixer and then was injected into the sandpack and micromodel using the ISCO pump (Model 100DX, Teledyne Technologies). The oil–gas mixer was wrapped in an electric heating jacket. The sandpack model had a length of 60.00 cm and an inner diameter of 2.54 cm. Four pressure transducers (Model 3210PD, Haian group) were distributed evenly on the sandpack. The microscopic visualization model made of glass via an ultraviolet (UV) photolithography and wet etching technique was placed in a high-pressure holder. The net size of the glass-etched micromodel was 4.0 cm × 4.0 cm, and the width and the depth of the pore network in the micromodel were approximately 40 μm. The flow image in the micromodel was recorded using a digital camera (Nikon Model L110). A back-pressure regulator (BPR) was used to control the pressure of the sandpack and the micromodel. The sandpack, the micromodel holder, and the BPRs were located in a thermostatic convection oven. The produced fluid was separated into the oil phase and gas phase in the oil–gas separator, and then oil and gas were measured by the balance (Model PL 2002, Mettle Toledo) and gas mass flow meter (Model SLA5850S, Brooks), respectively.
The procedure for the sandpack depletion experiment constituted six steps. Firstly, rhe dead oil was recombined with the solution gas in the oil–gas mixer to prepare live oil by pressurization. The solution gas–oil ratio and the temperature were set to 16 Sm2/m2 and 54 °C in all tests. The pressure was set to 8.5 MPa to dissolve all the solution gas in the oil. Secondly, the sandpack model was packed with refined silica sand. Then, the sandpack was saturated with distilled water after being evacuated for 4 hours. The porosity and the permeability of the sandpack are shown in Table 3. Thirdly, the sandpack was saturated with the live oil at the rate of 0.1 mL/min until no water was produced. The oil injection rate for micromodel saturation was 0.02 mL/min. The back pressure was set to 8.5 MPa to prevent solution gas from liberating. The initial oil saturation of sandpack was calculated according to the volume of the produced water. Fourthly, the saturated sandpack and micromodel were placed in the thermostatic convection oven for at least 12 hours for phase equilibrium. The temperature of the thermostatic convection oven was set to 54 °C. Fifthly, the back pressure was reduced gradually at a constant pressure depletion rate of 100 kPa/min. The production rates of oil and gas were recorded. The flow behavior in the micromodel was also recorded. Finally, when no gas and oil were produced, the experiment was stopped.
2.2.2. Measurement of Interfacial Viscoelastic Modulus
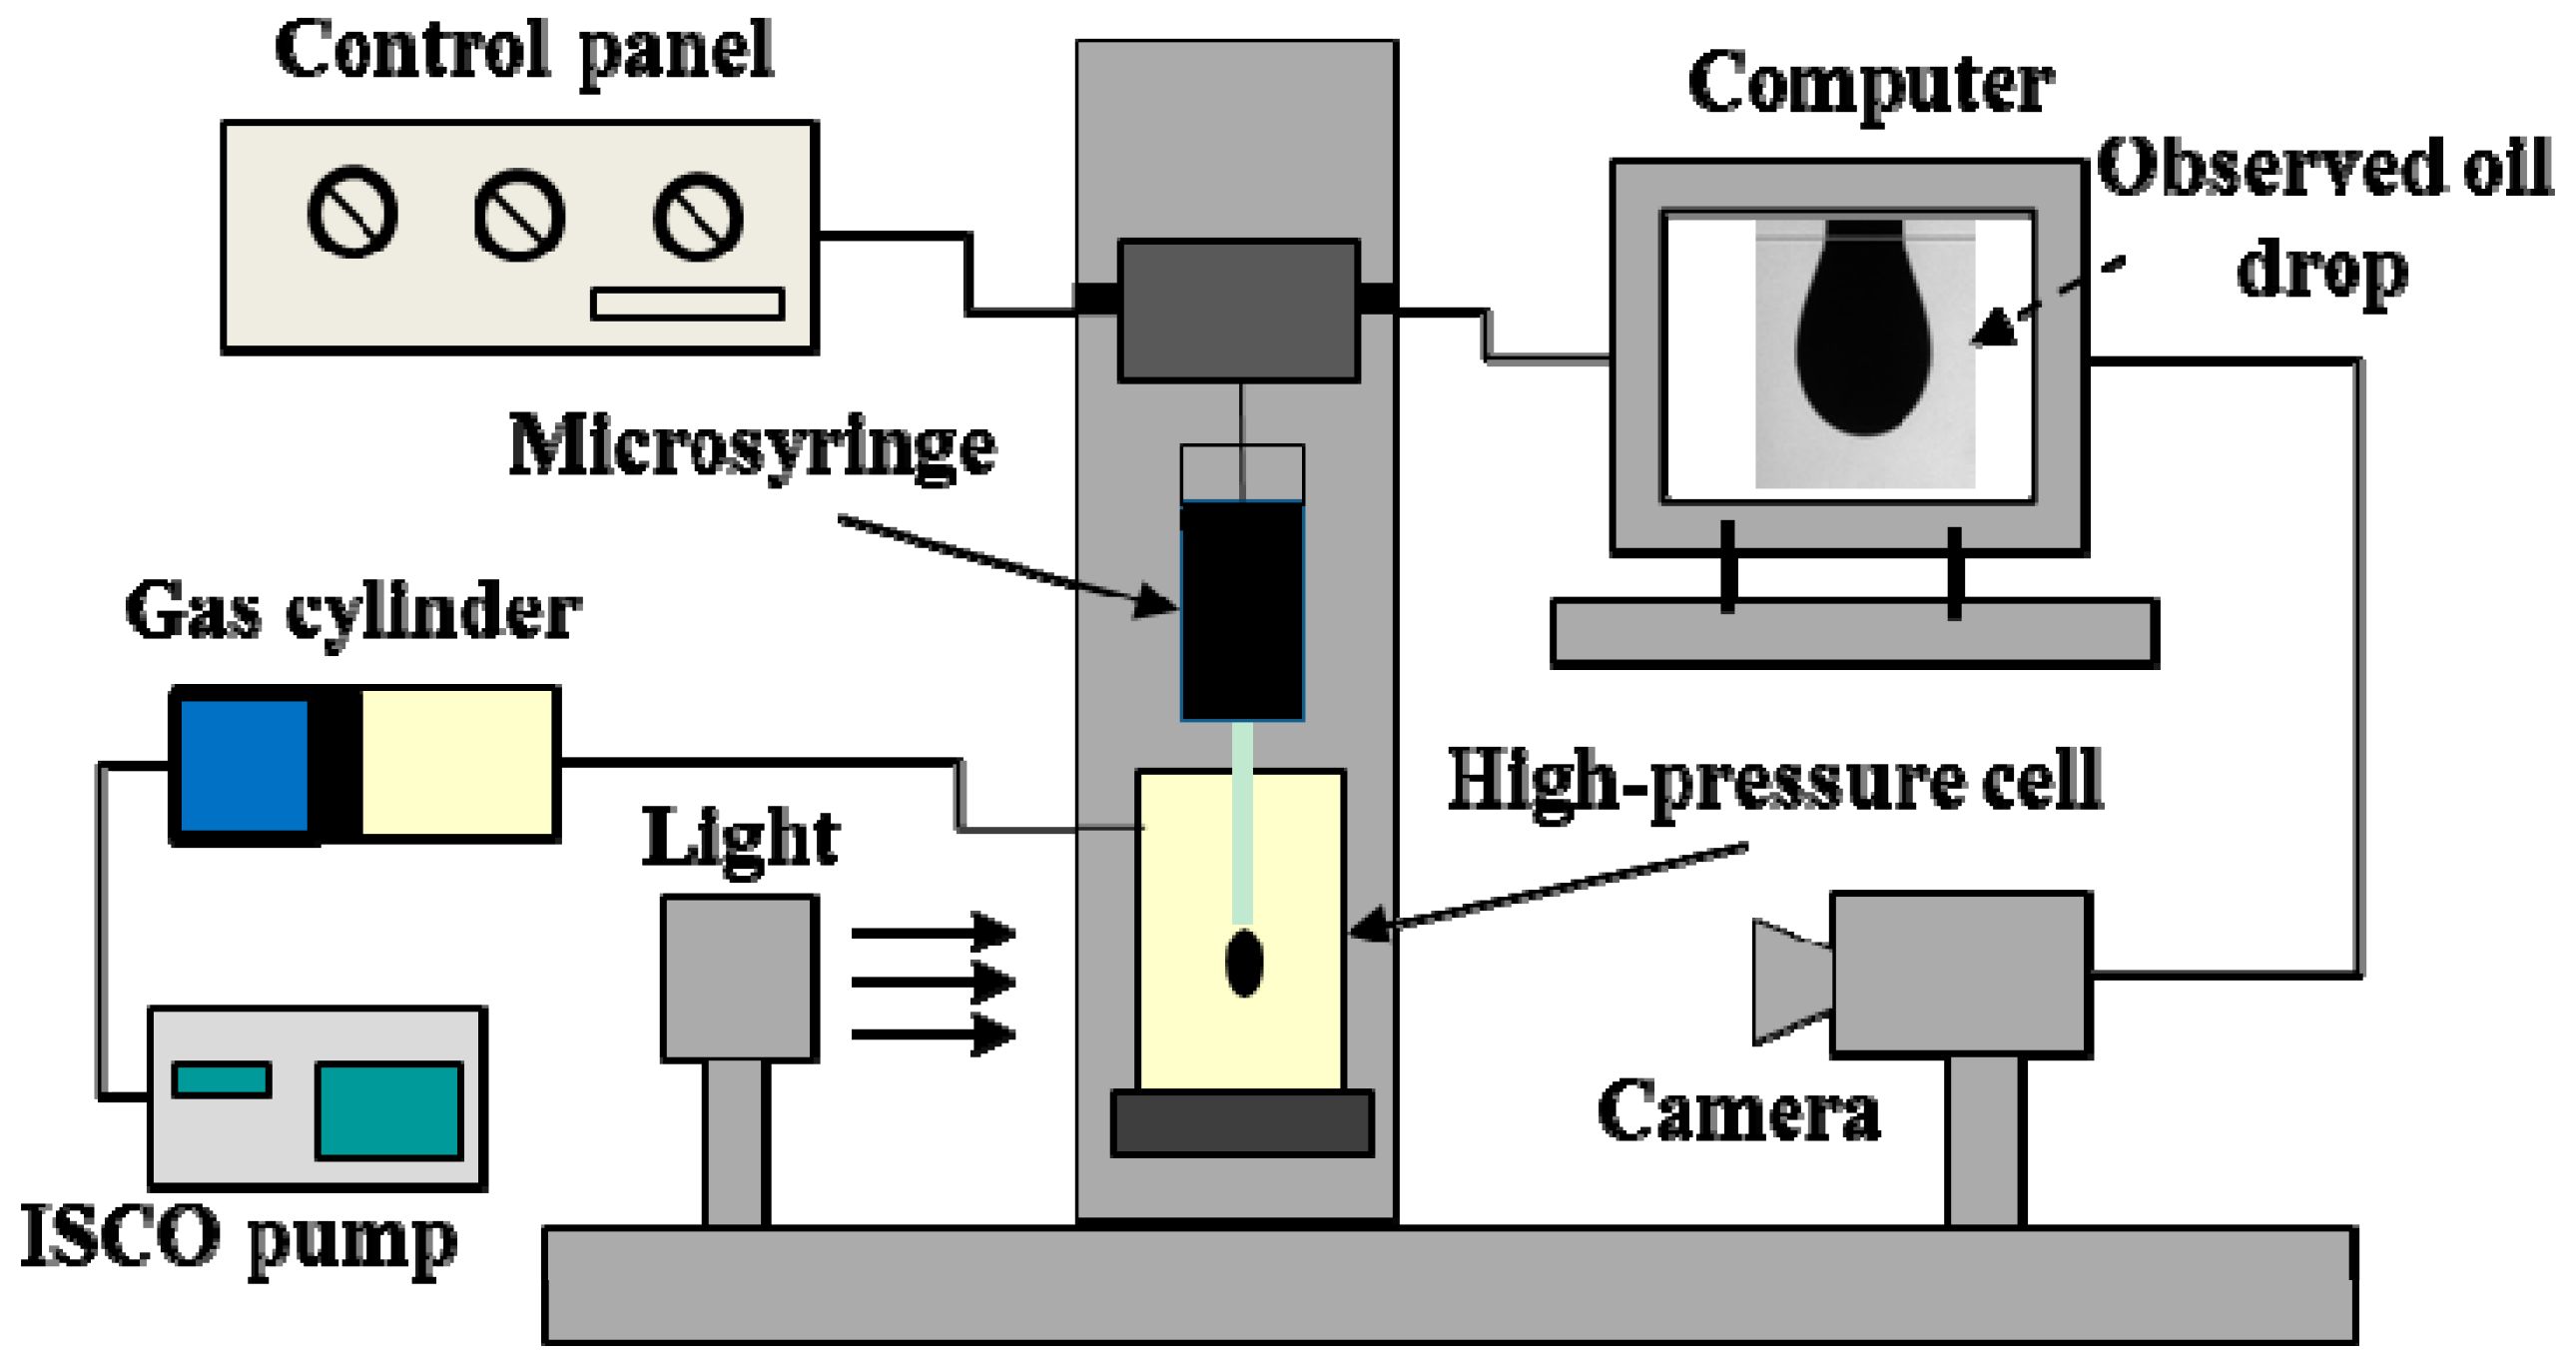
The viscoelastic modulus was measured through the pendant drop tensiometer (Tracker-H, TECLIS), as shown in Figure 2. The core component was a high-pressure cell with an observation window. The high-pressure cell was connected to a gas cylinder to form a gas circumstance in the cell. A liquid drop formed in the high-pressure cell through a microsyringe. The built-in heating system controlled the temperature inside the cell. The image of the liquid drop was recorded by a camera through the observation window and analyzed by the computer. The measurement procedure constituted six steps. Firstly, after connecting all parts, the high-pressure cell was pressurized to check for leaks. Secondly, after the temperature inside the cell reached the required temperature, the pressure cell was flushed with solution gas and then filled to the required pressure. In the experiments, the pressure and the temperature were set to 3.5 MPa and 54 °C. Thirdly, dead oil was injected into the high-pressure cell slowly to form a pendant oil drop. Fourthly, an oscillation frequency was set to allow the oil drop to expand and contract automatically. The oscillation frequencies in the experiments were all 1 Hz. Fifthly, the image of the oil drop was recorded by the camera and stored automatically in the computer. Finally, each oil sample was measured three times to ensure the accuracy of the result.
3. Results
3.1. Sandpack Depletion Experiments
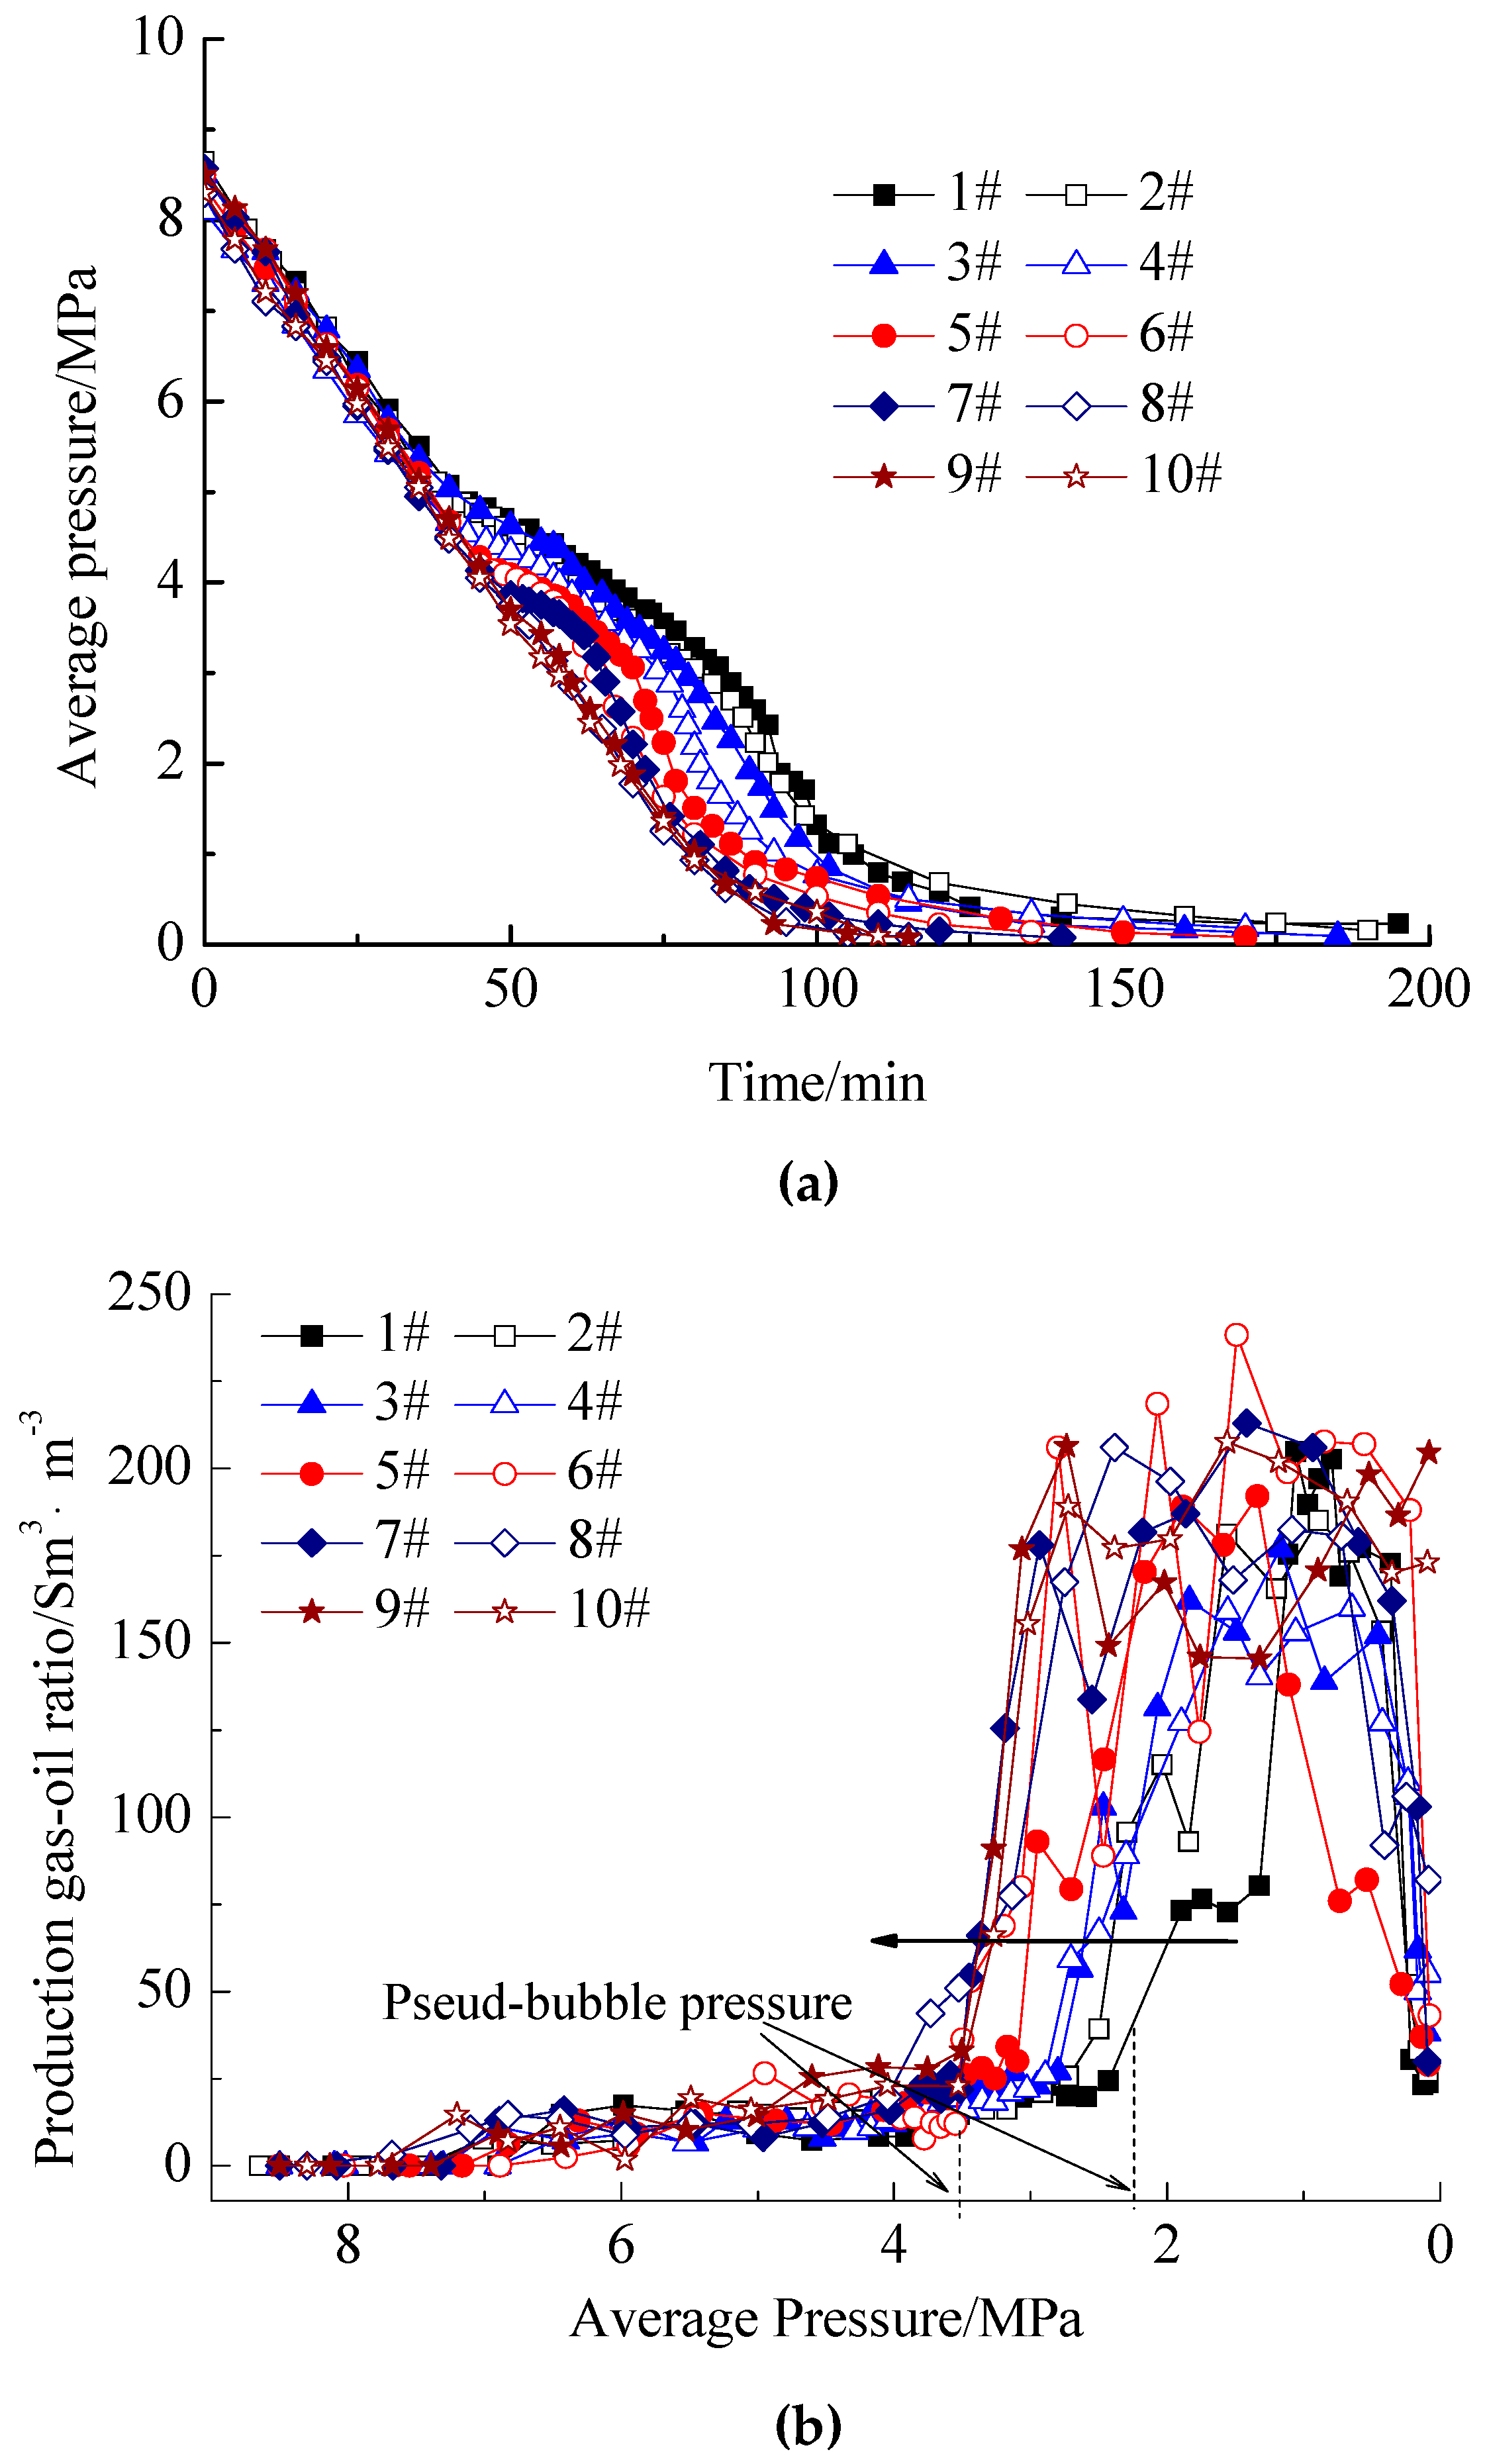
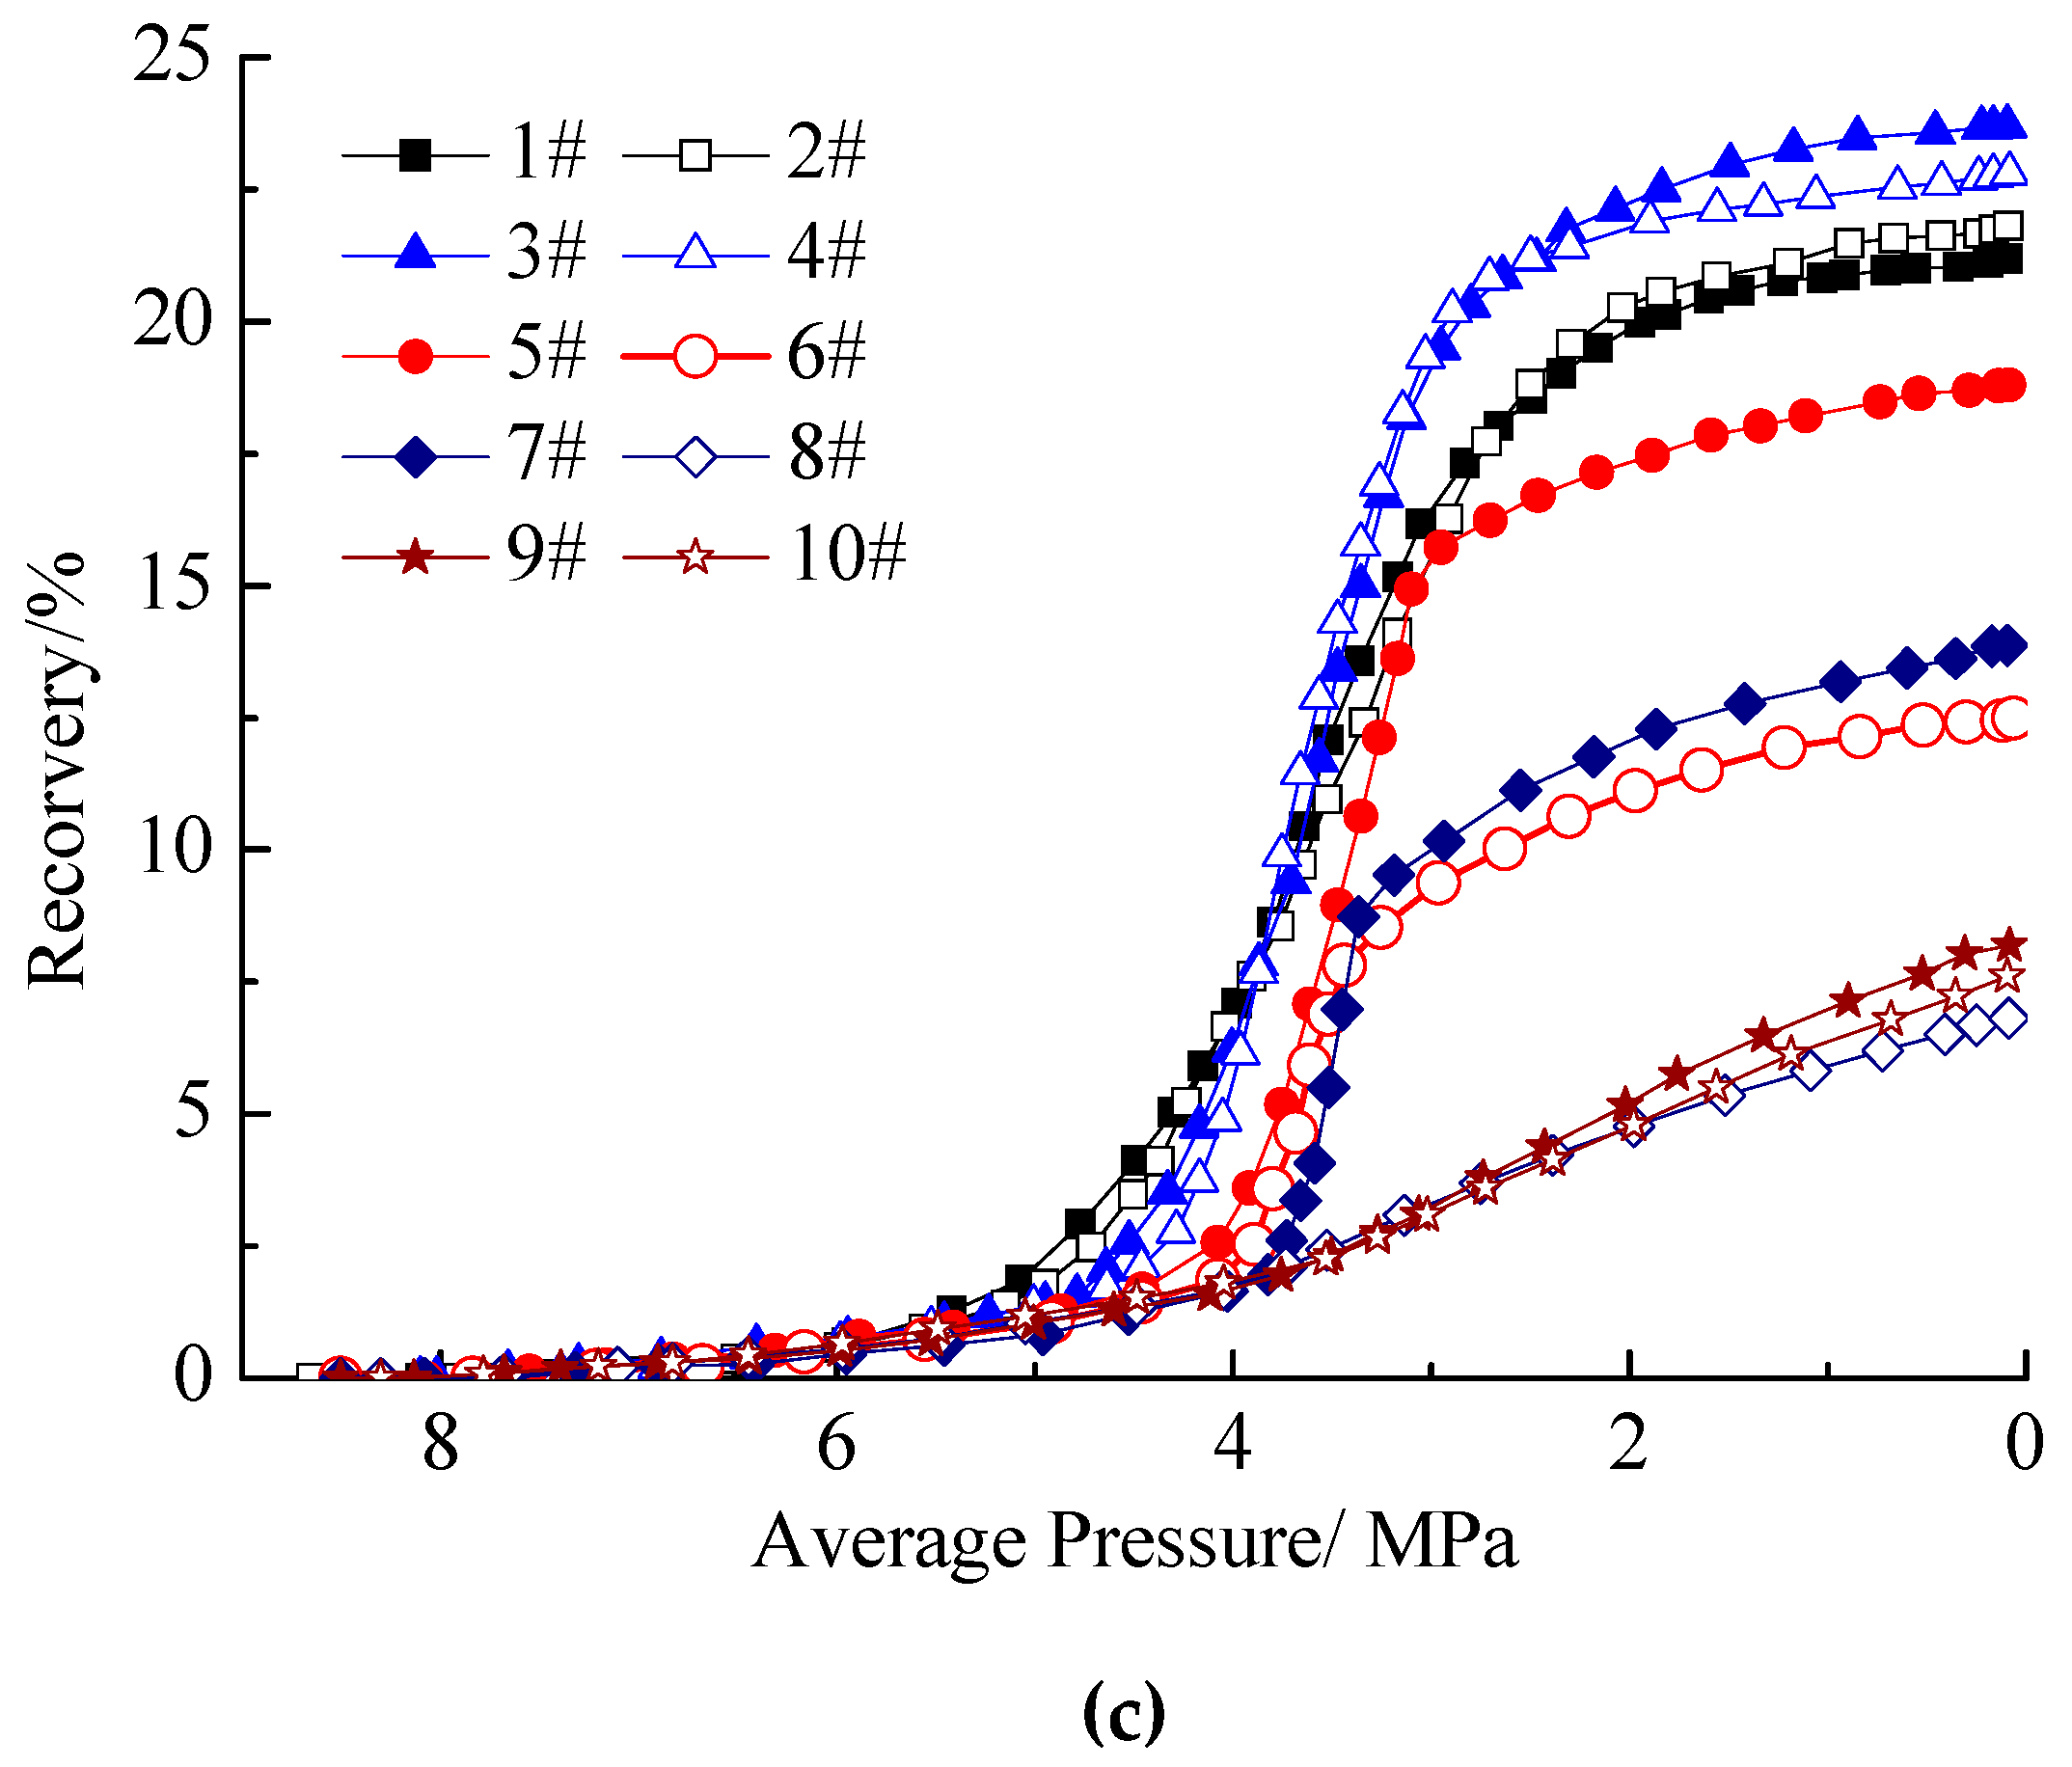
In depletion development, average pressure, production oil–gas ratio, and recovery are key criteria for determining whether or not foamy oil forms. The depletion development with foamy oil generally has a low average pressure decline rate, low production gas–oil ratio, and unexpectedly high recovery. The changes in average pressure, production gas–oil ratio, and oil recovery for the ten tests are shown in Figure 3a–c.
In Figure 3a, the x-axis is time and the y-axis is the average pressure, which gives the one-to-one corresponding relationship between the average pressure and the production time. With the increase in production time, the average pressure declined linearly at first before the decline rate slowed down. The pressure at which the average pressure no longer decreased linearly was the bubble pressure. This indicated that once the solution gas was released, the pressure depletion rate decreased. In general, the greater the oil viscosity is, the more slowly the average pressure will decrease.
From Figure 3b, we can see that, with the decrease in average pressure, the production gas–oil ratio was low at first, before increasing rapidly, and then decreased to a low level eventually. This indicated that there was only a small amount of solution gas released at first. As the average pressure decreased, the solution gas was gradually liberated and became a continuous gas phase; thus, the production gas–oil ratio increased rapidly. The pressure at which the production gas–oil ratio started increasing obviously was the pseudo-bubble pressure. Obviously, with the decrease in oil viscosity, the pseudo-bubble pressure increased gradually, suggesting that the gas channeling occurred earlier in depletion process. At the end of depletion development, solution gas was no longer produced; thus, the production gas–oil ratio decreased.
Figure 3c shows that the oil recovery varied greatly under different conditions, which indicated that the variables (i.e., oil viscosity and asphaltene content) indeed had a significant influence on the depletion development. Furthermore, according to the recoveries, the ten experiments could be divided into three groups. Tests 1–5 had a relatively high recovery, while tests 6 and 7 had a moderate recovery, and tests 8–10 had a relatively low recovery.
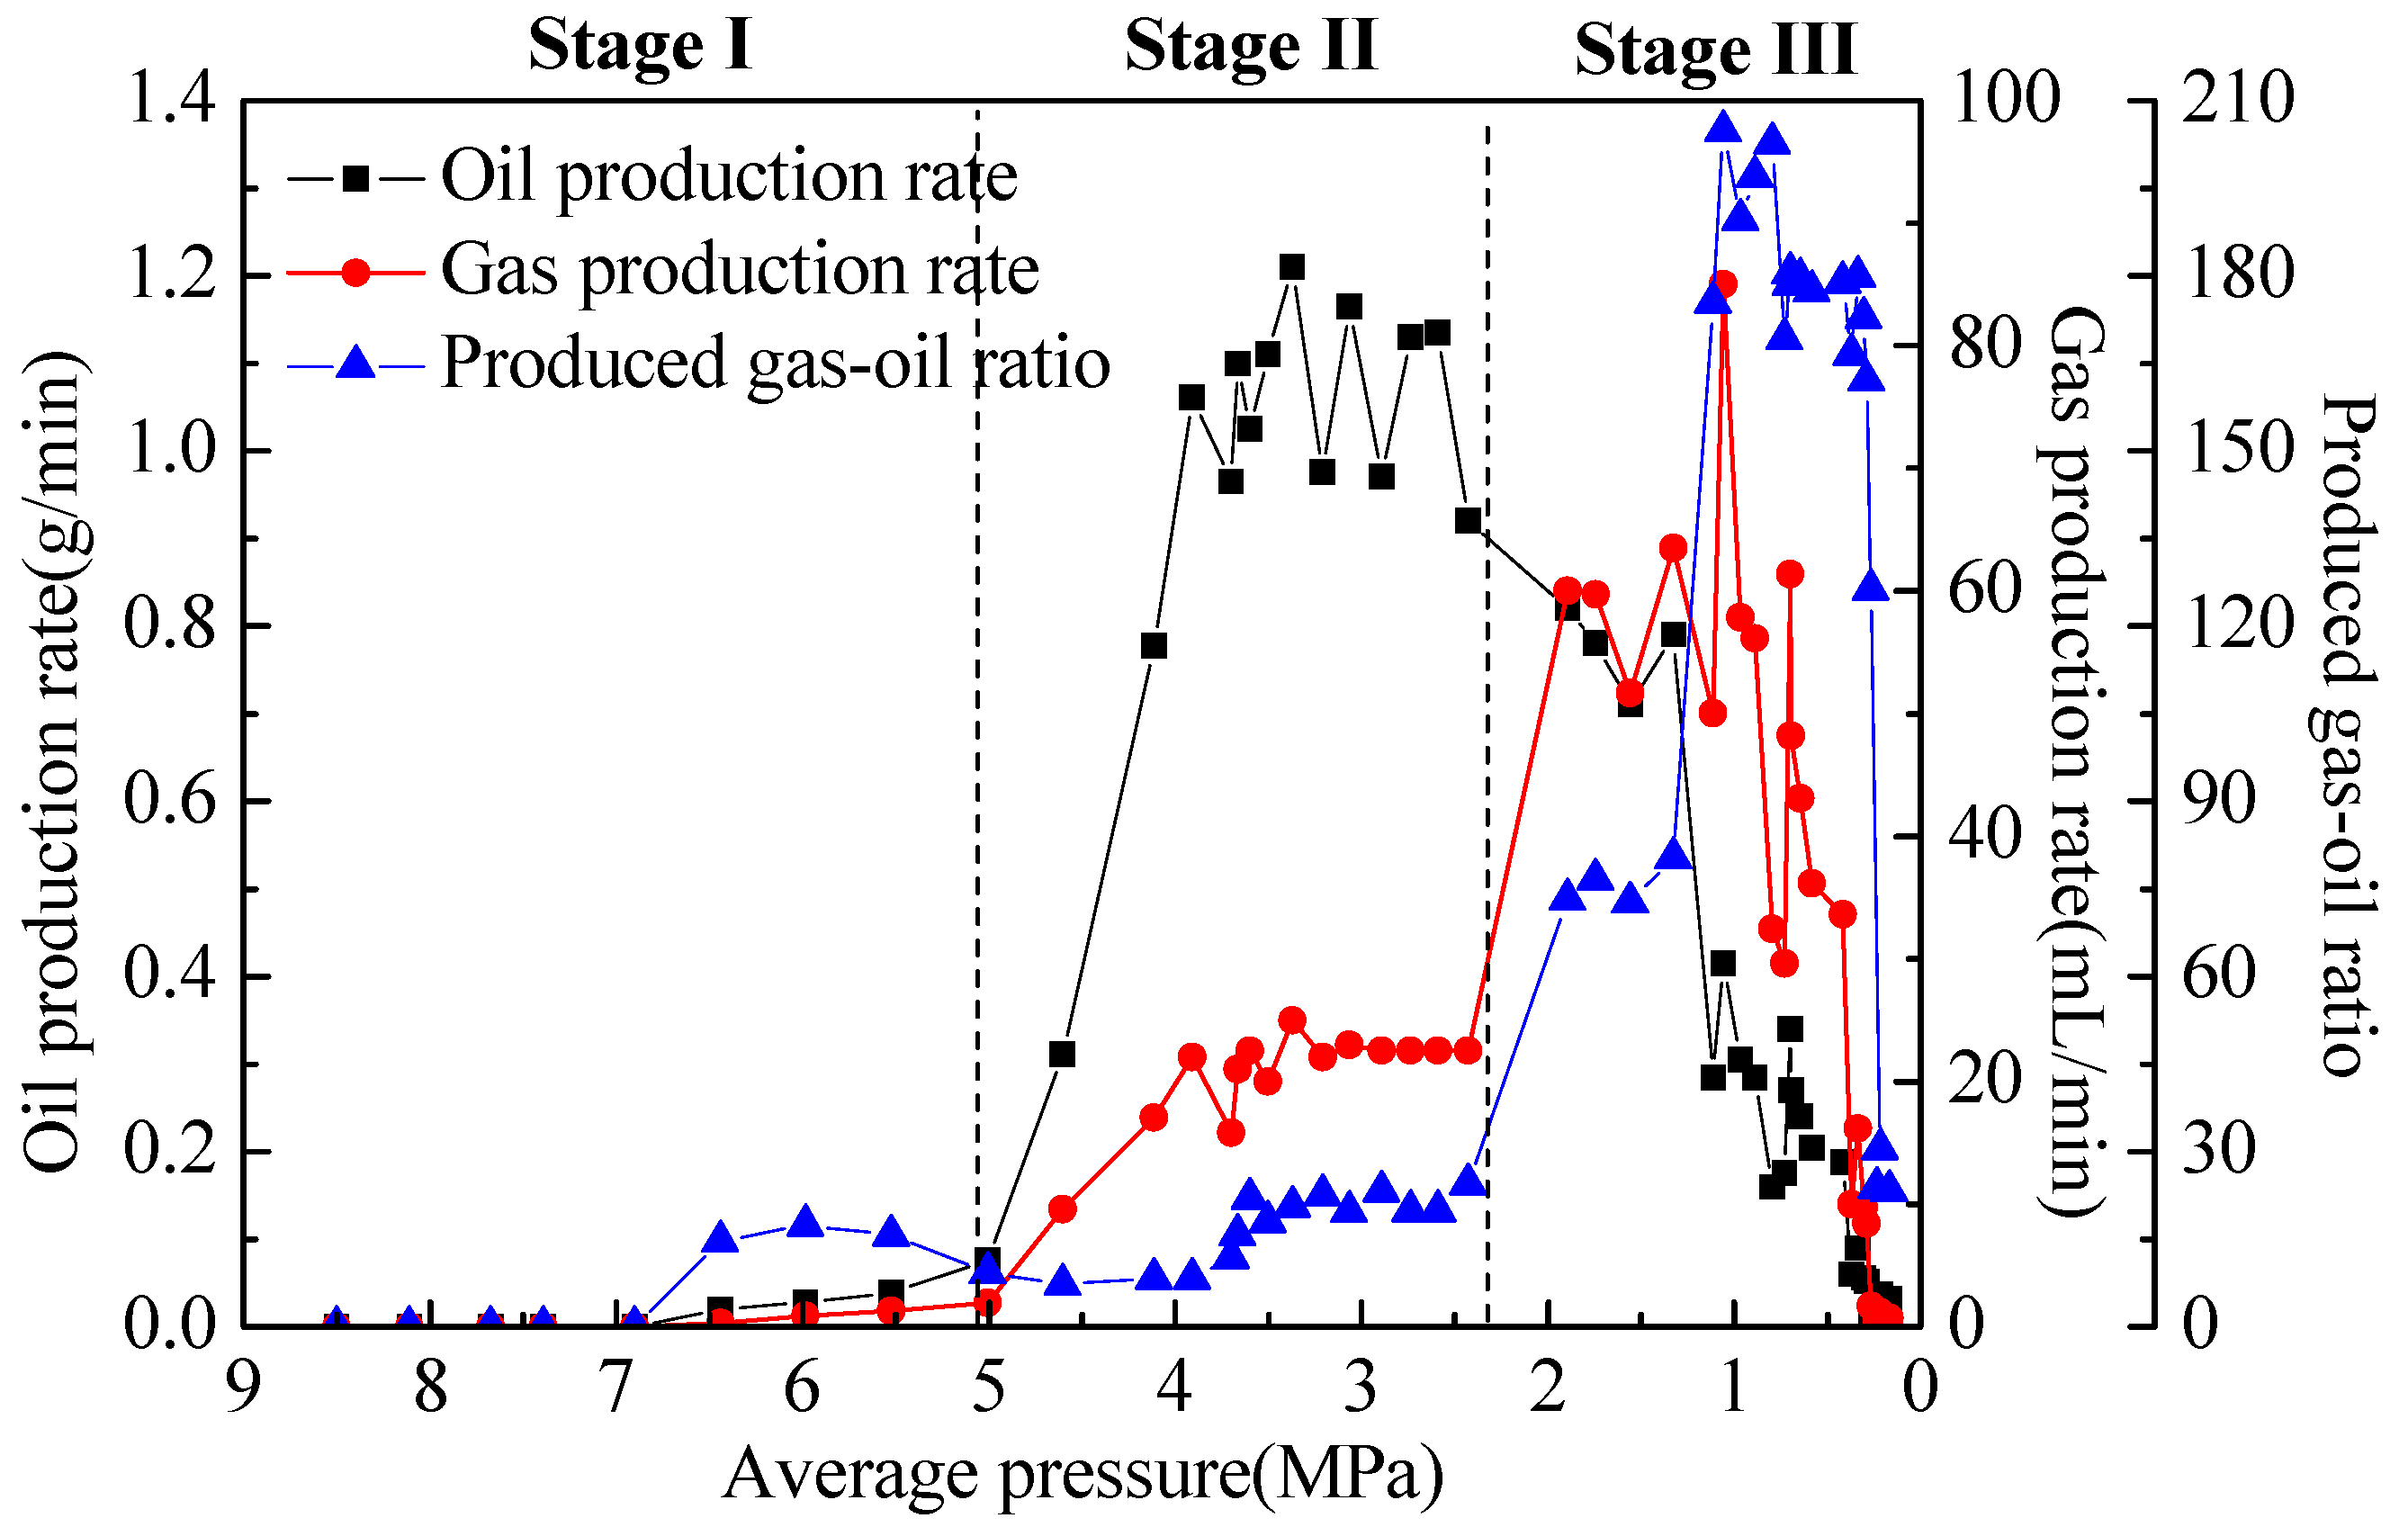
According to the obtained development characteristics, the ten depletion experiments could be roughly divided into three types. The first type was foamy oil depletion development, including tests 1–5. Because the development characteristics for the five tests were similar, we describe only the result for test 1, as shown in Figure 4. It can be seen that the depletion process could be divided into three stages clearly. The first stage was from the initial pressure (8.5 MPa) to about 5.1 MPa, in which the oil production rate and the gas production rate were very low. Because the solution gas was not released and the development depended on the natural elastic energy, the stage can be called the elastic expansion stage. The second stage was from about 5.1 MPa to about 2.5 MPa, in which the oil production rate increased dramatically, while the production gas–oil ratio maintained a low level. In this stage, the solution gas was released, and the driving energy increased, resulting in a surge in oil production rate. The released gas, however, did not form a continuous gas phase, but dispersed in the heavy oil as a micro-bubble; thus, the production oil–gas ratio did not increase significantly. This stage can be called the foamy oil stage, which was the main oil production period. At about 2.5 MPa, the gas production rate suddenly rocketed upward, and a gas channel occurred. The depletion development moved into the third stage, namely the oil–gas two-phase flow stage. In this stage, the oil production rate decreased rapidly and the production gas–oil ratio was very high. Because the solution gas was released at about 5.1 MPa and became a continuous phase at about 2.5 MPa, the two pressures were regarded as bubble pressure and pseudo-bubble pressure.
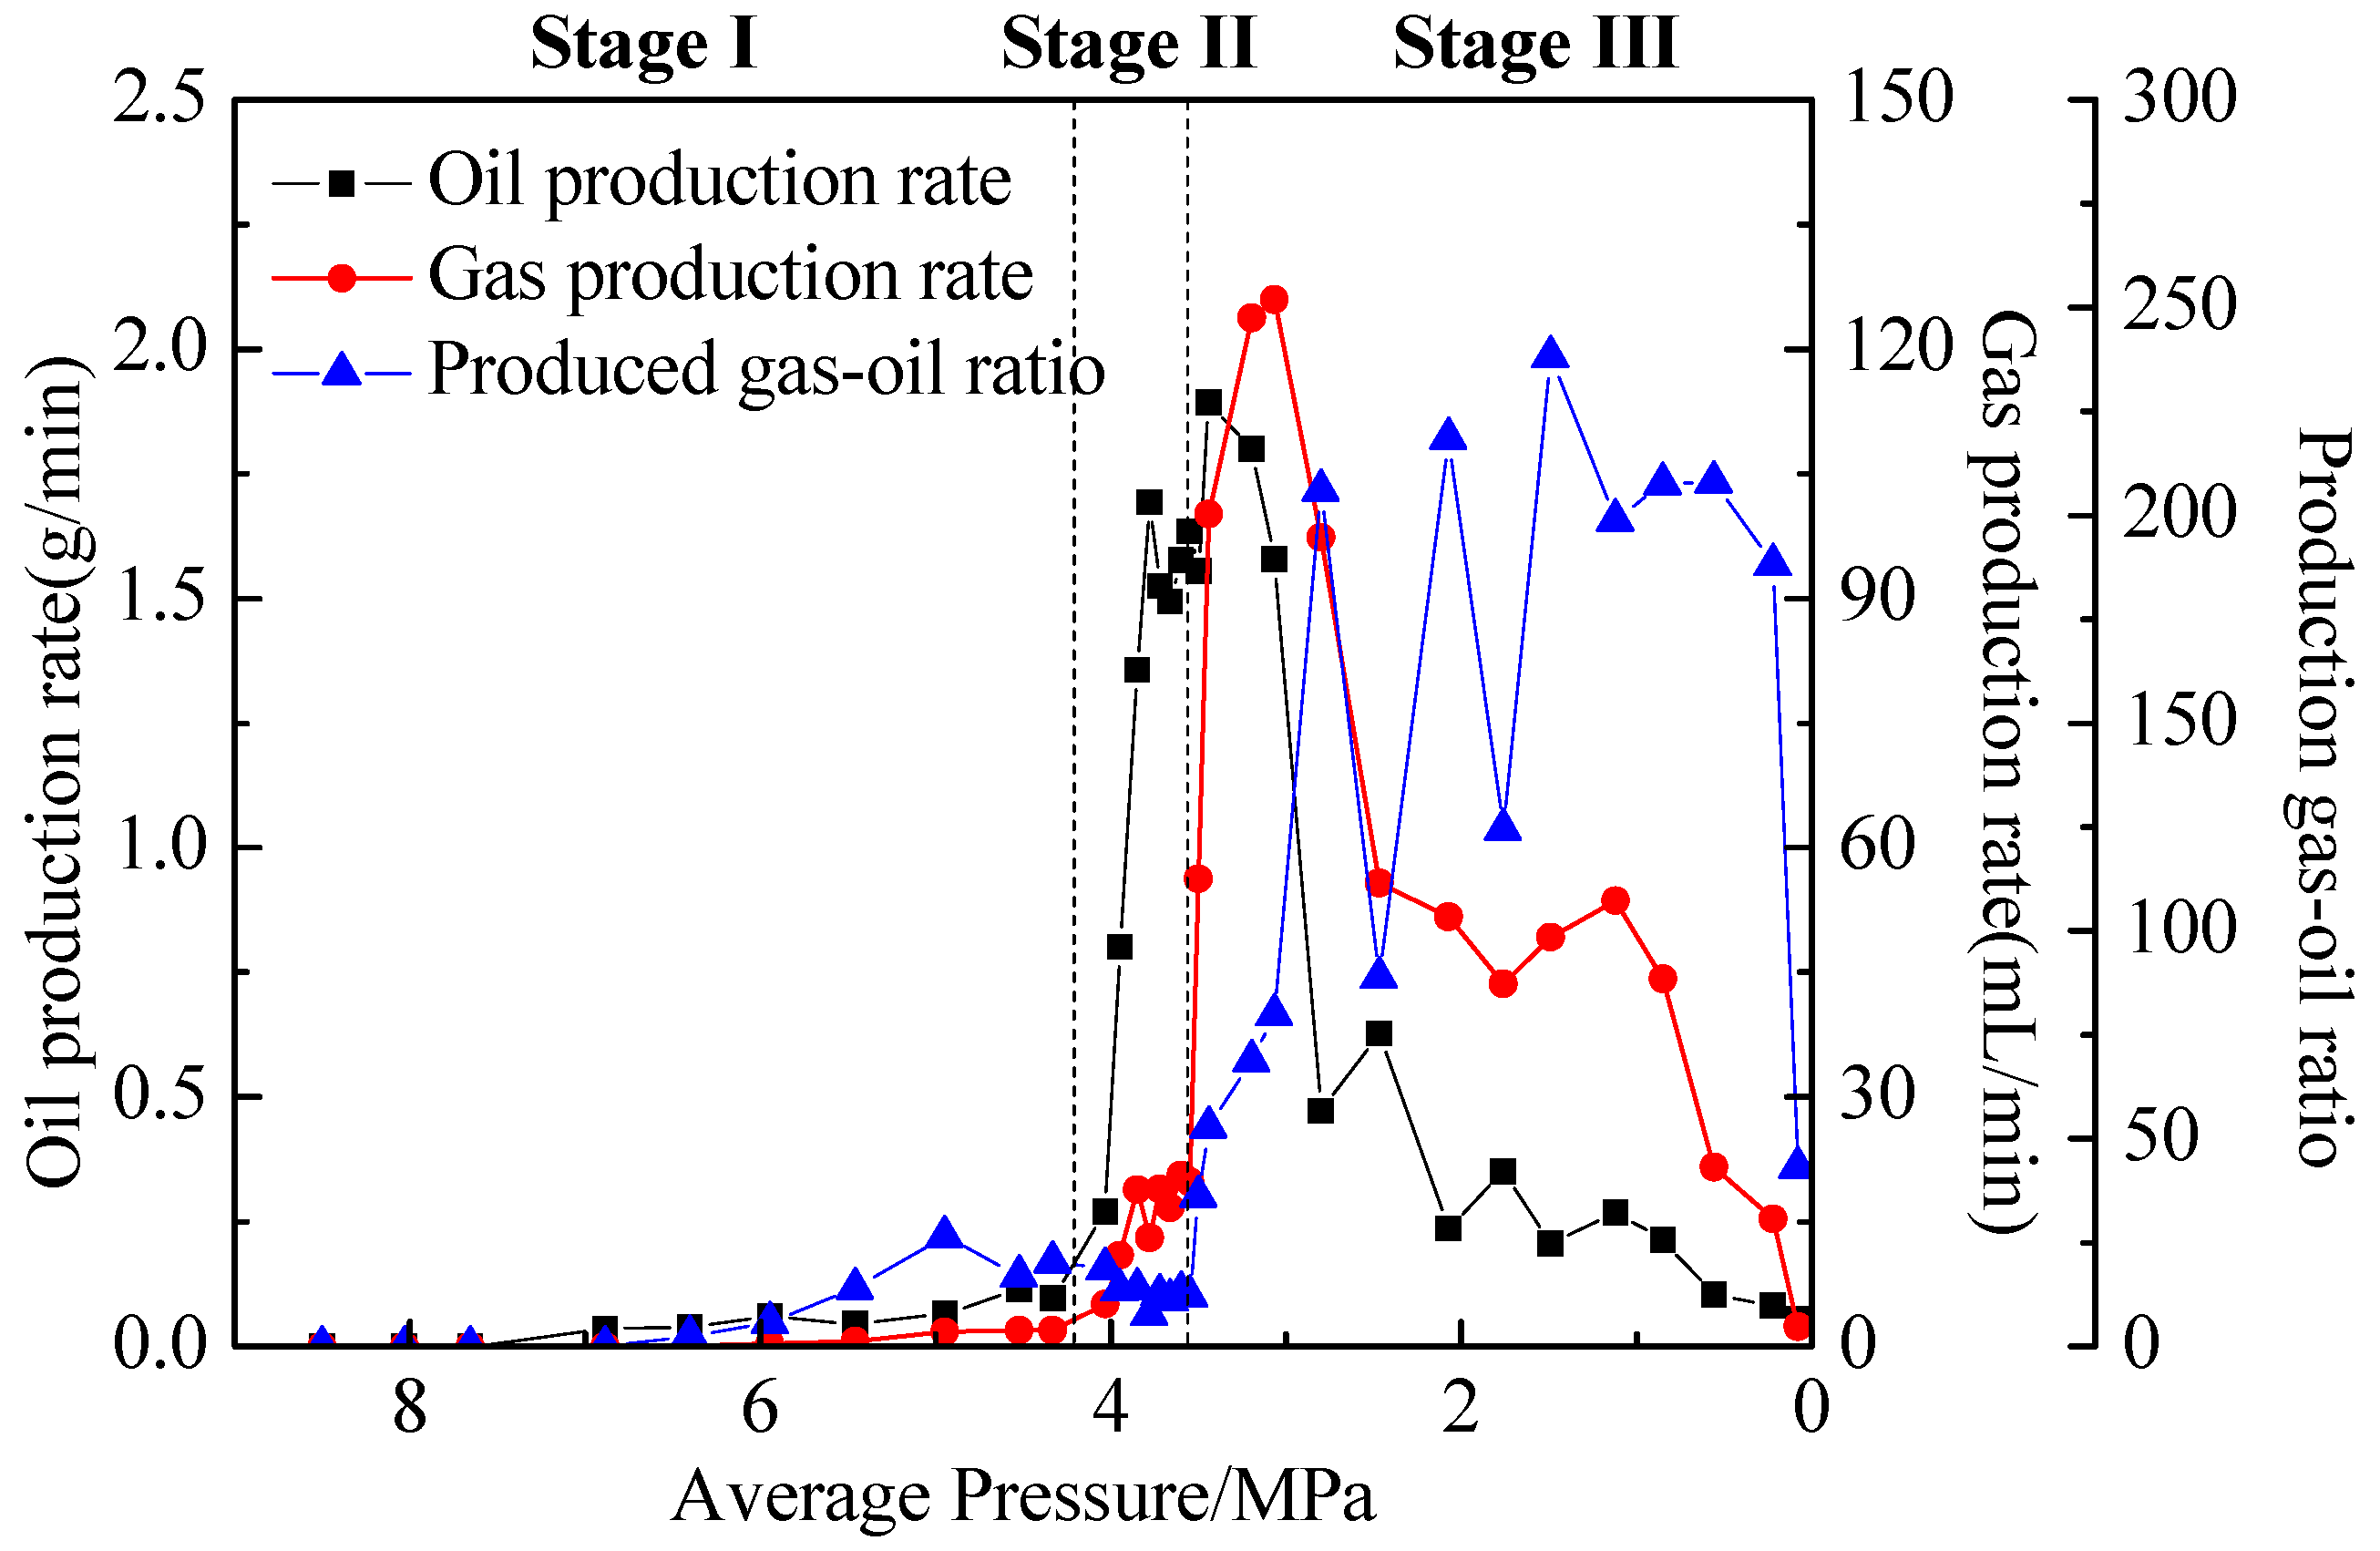
The second type can be called weak foamy oil depletion development, including tests 6 and 7. Because there were many similarities in the development characteristics, we describe only the results for test 7, as shown in Figure 5. We can see that, like the foamy oil depletion development, this type also went through the same three stages. In the elastic expansion stage and oil–gas two-phase flow stage, the two types had similar development characteristics. However, the foamy oil stage for the weak foamy oil depletion development was much shorter than that for the foamy oil type. In this experiment, the bubble pressure and the pseudo-bubble pressure were 4.1 MPa and 3.5 MPa, respectively. The foamy oil flow soon turned into the oil–gas two-phase flow, resulting in a much lower recovery; thus, this type of depletion development can be called weak foamy oil development.
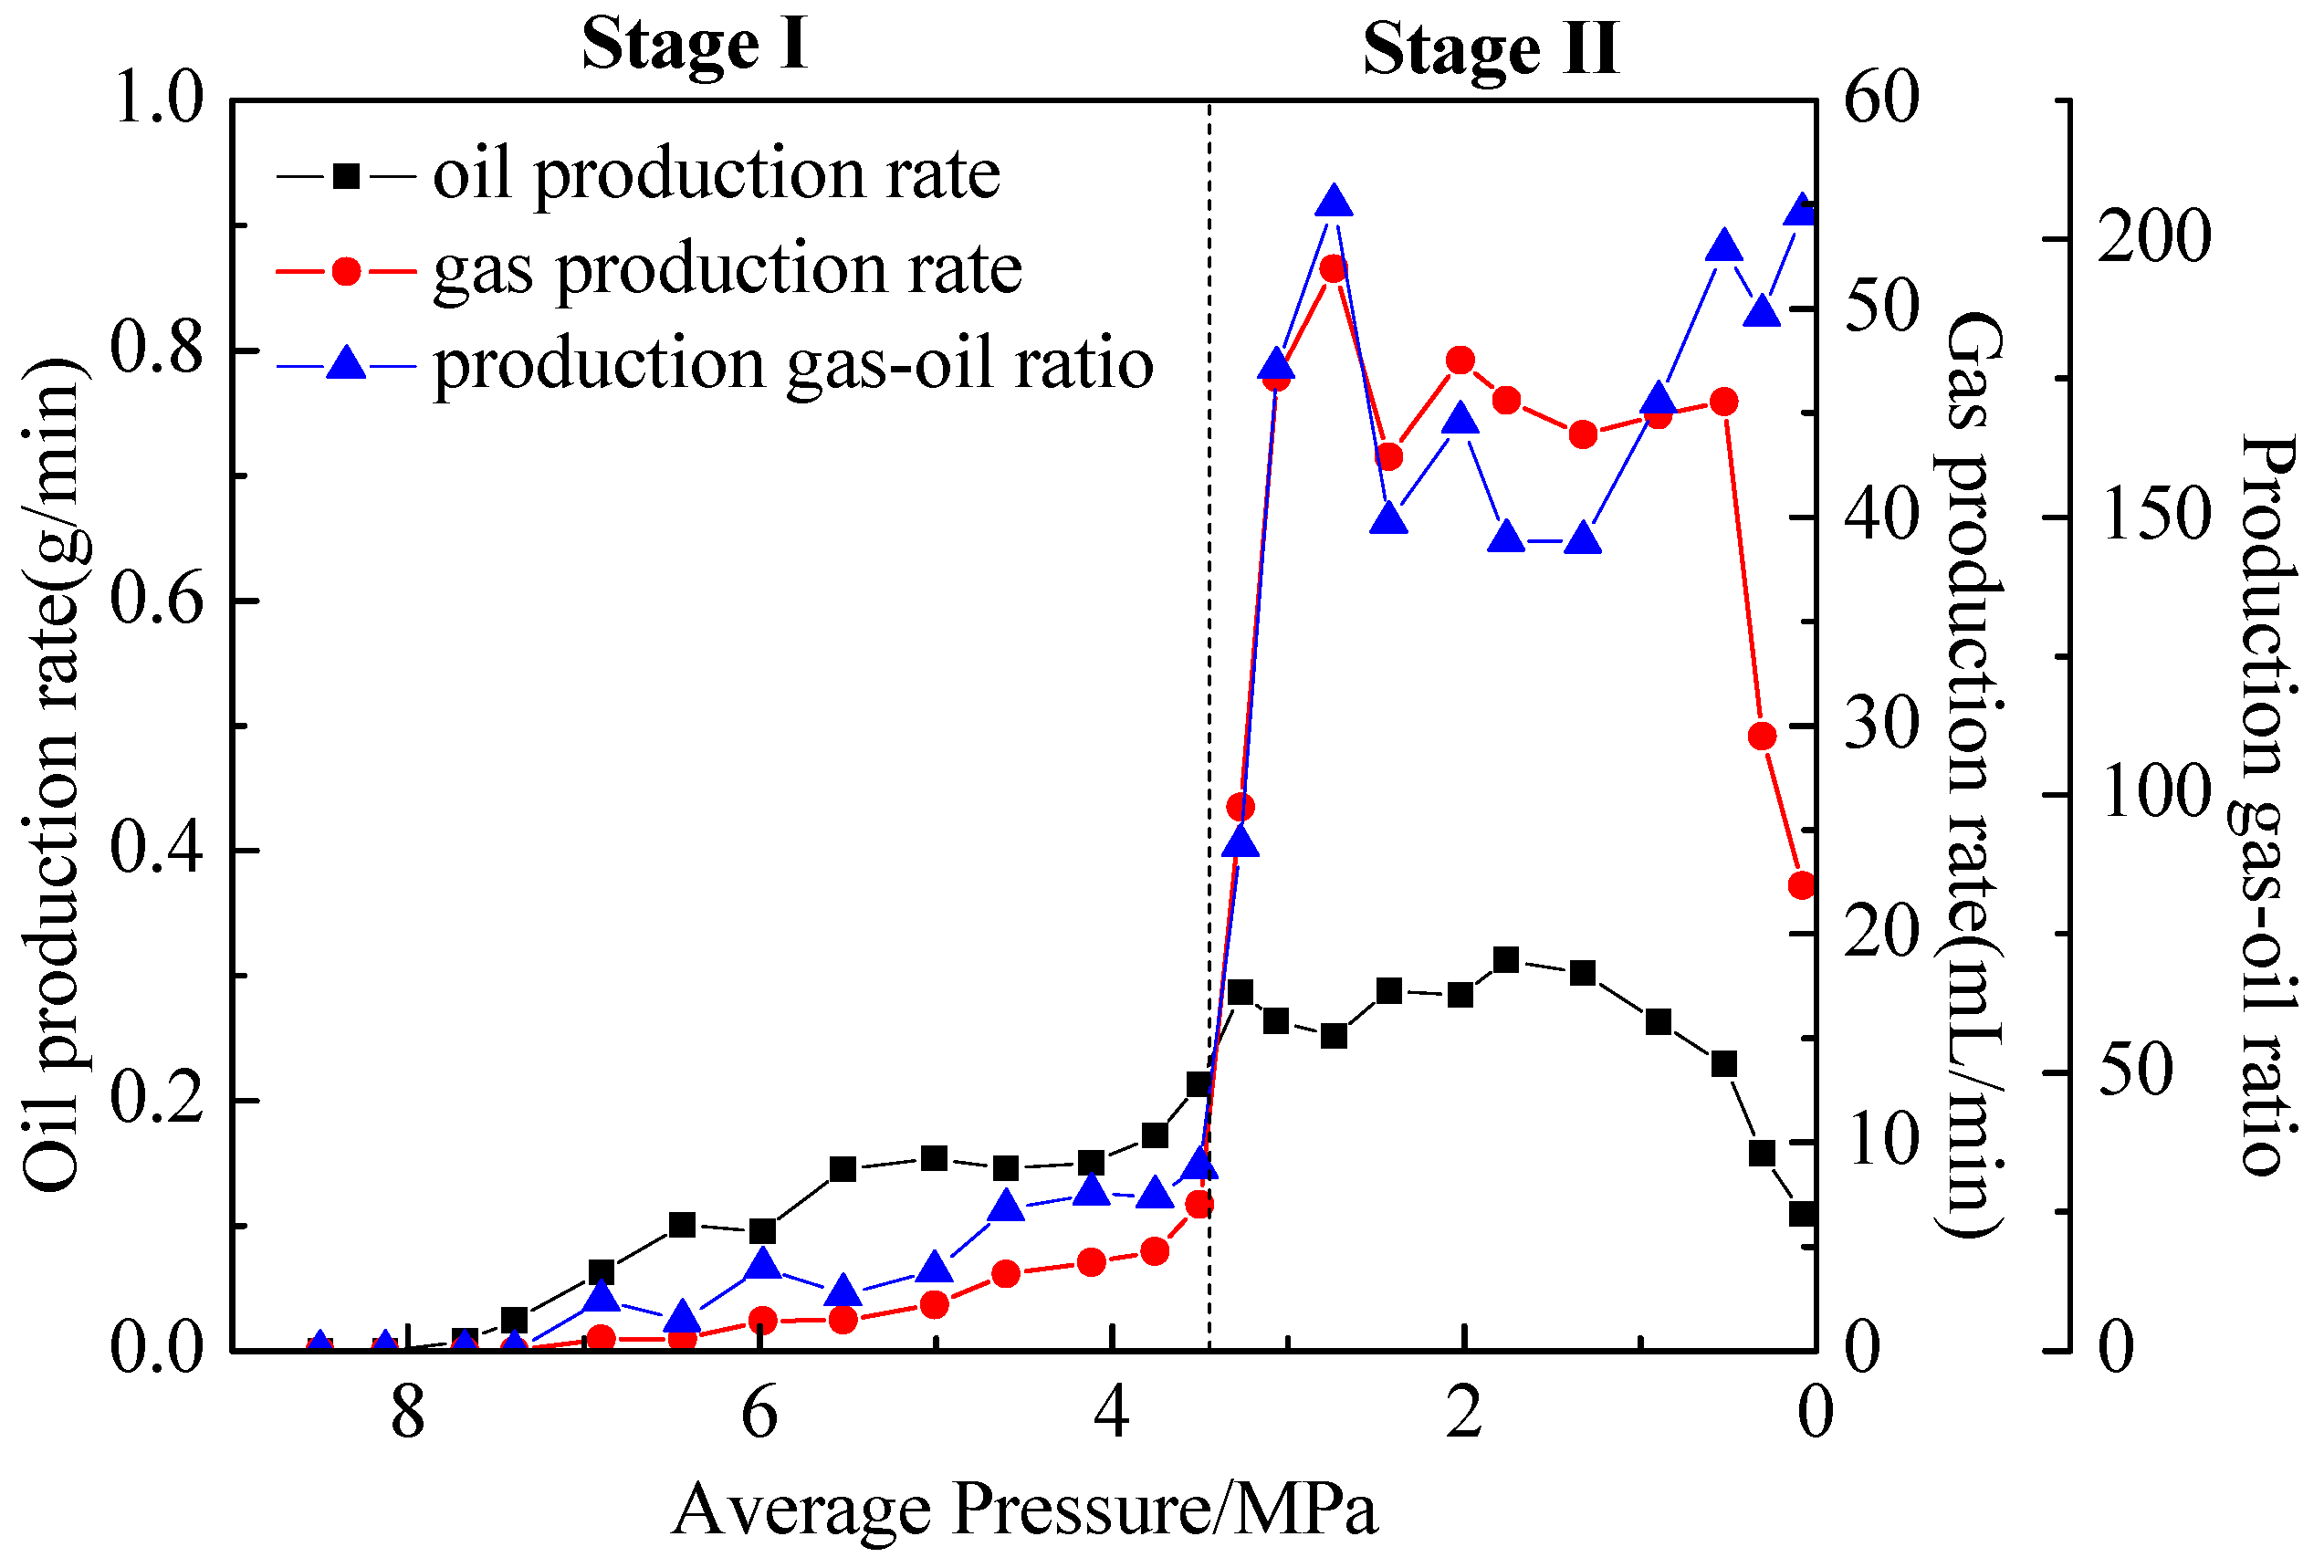
Tests 8–10 can be regarded as the conventional solution gas drive. The result of test 8 was taken as an example to illustrate the development characteristics in Figure 6. We can see that, as the average pressure decreased, the depletion process firstly went through the elastic expansion stage, just like the first two types. However, after the elastic expansion stage, gas production rate soared rapidly, while oil production rate still kept low. The liberated solution gas was directly produced in the continuous phase. We can assume that the depletion process skipped the foamy oil stage and went straight to the oil–gas two-phase flow stage. There was no pseudo-bubble pressure in the conventional solution gas drive; in other words, the pseudo-bubble pressure was equal to the bubble pressure. Due to the lack of foamy oil in the depletion process, the recovery was very low.
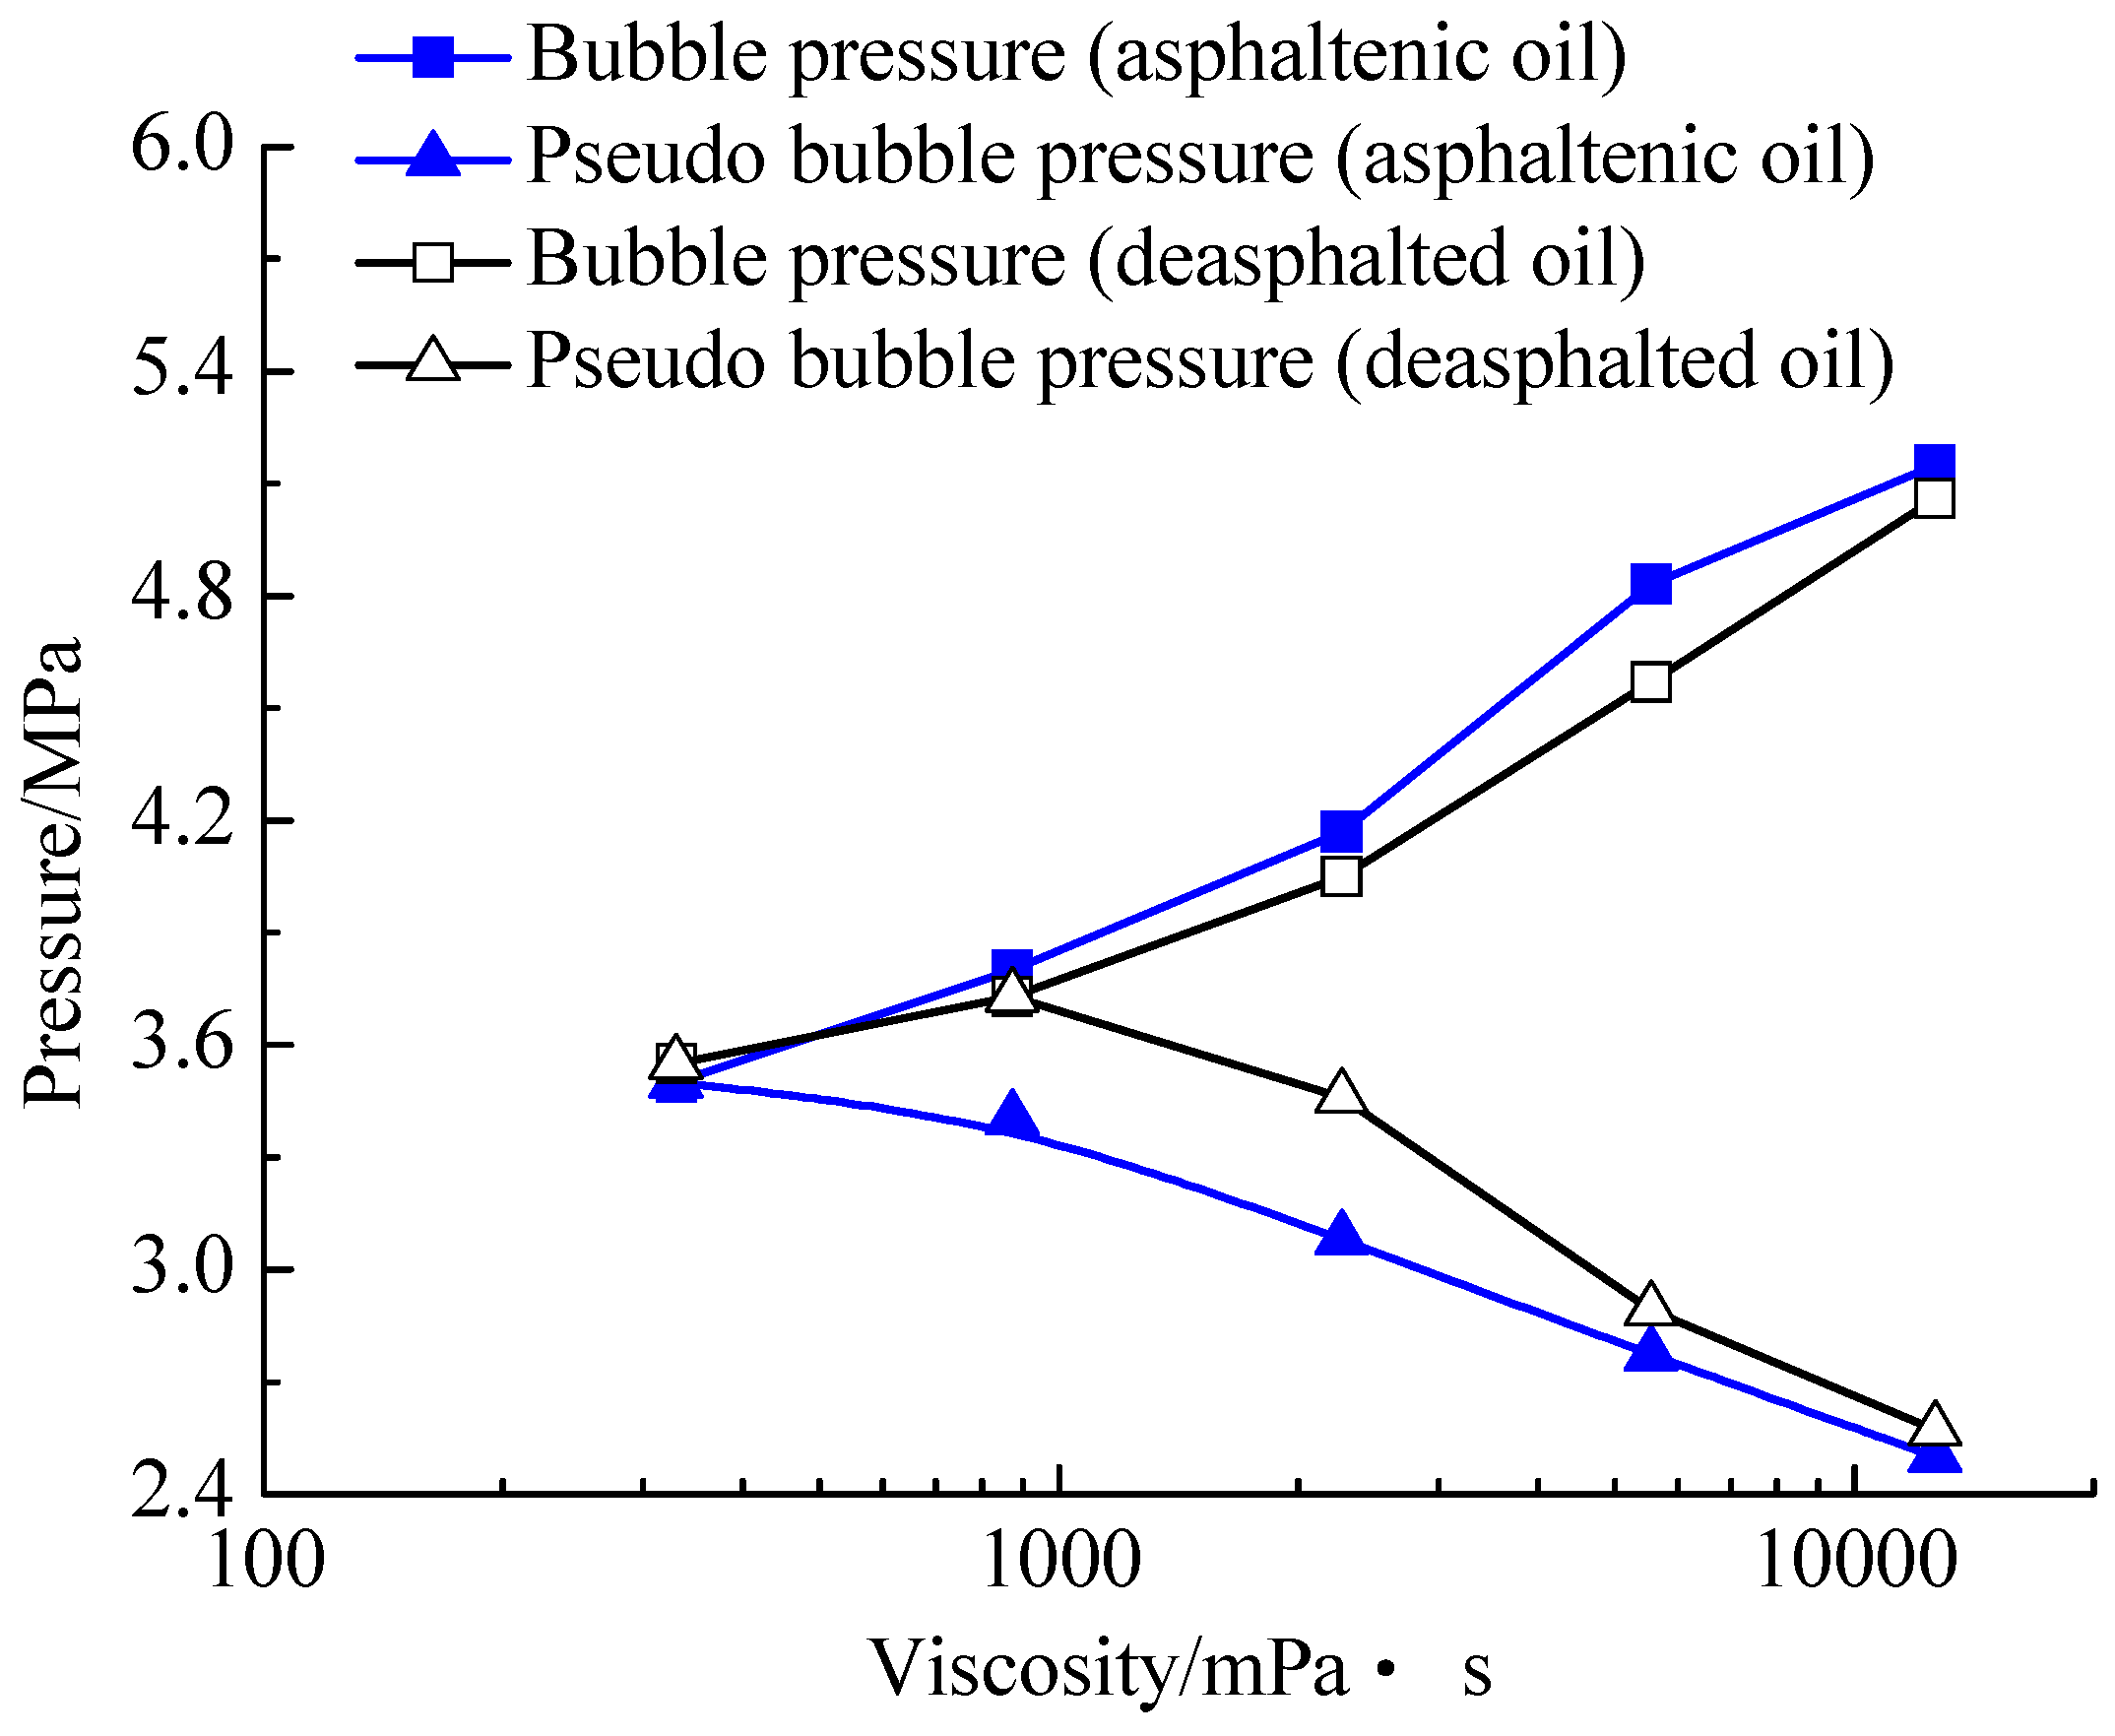
From the above analysis, it can be determined that the foamy oil stage starts at the bubble pressure and ends at the pseudo-bubble pressure. The larger the difference between the two characteristic pressures is, the more remarkable the effect of foam oil on depletion development will be. When the bubble pressure is equal to the pseudo-bubble pressure, there is no foamy oil formed. The effects of the oil viscosity and asphaltene on the bubble pressure and pseudo-bubble pressure are shown in Figure 7. It can be seen that, with the increase in viscosity, the bubble pressure increased, and the pseudo-bubble pressure generally decreased, regardless of the type of oil used. The difference between the bubble pressure and the pseudo-bubble pressure decreased gradually as the viscosity decreased, suggesting that the foamy oil stage shortened. At the lower viscosity (373 mPa∙s) and higher viscosity (5560 mPa∙s and 11,650 mPa∙s), asphaltene had little impact on the two characteristic pressures. However, at the viscosity of 2270 mPa∙s and 875 mPa∙s for the deasphalted oil, the pseudo-bubble pressure increased, and the pressure range of the foamy oil stage narrowed. This indicated that, for the oil within a certain viscosity range, asphaltene had an influence on the foamy oil.
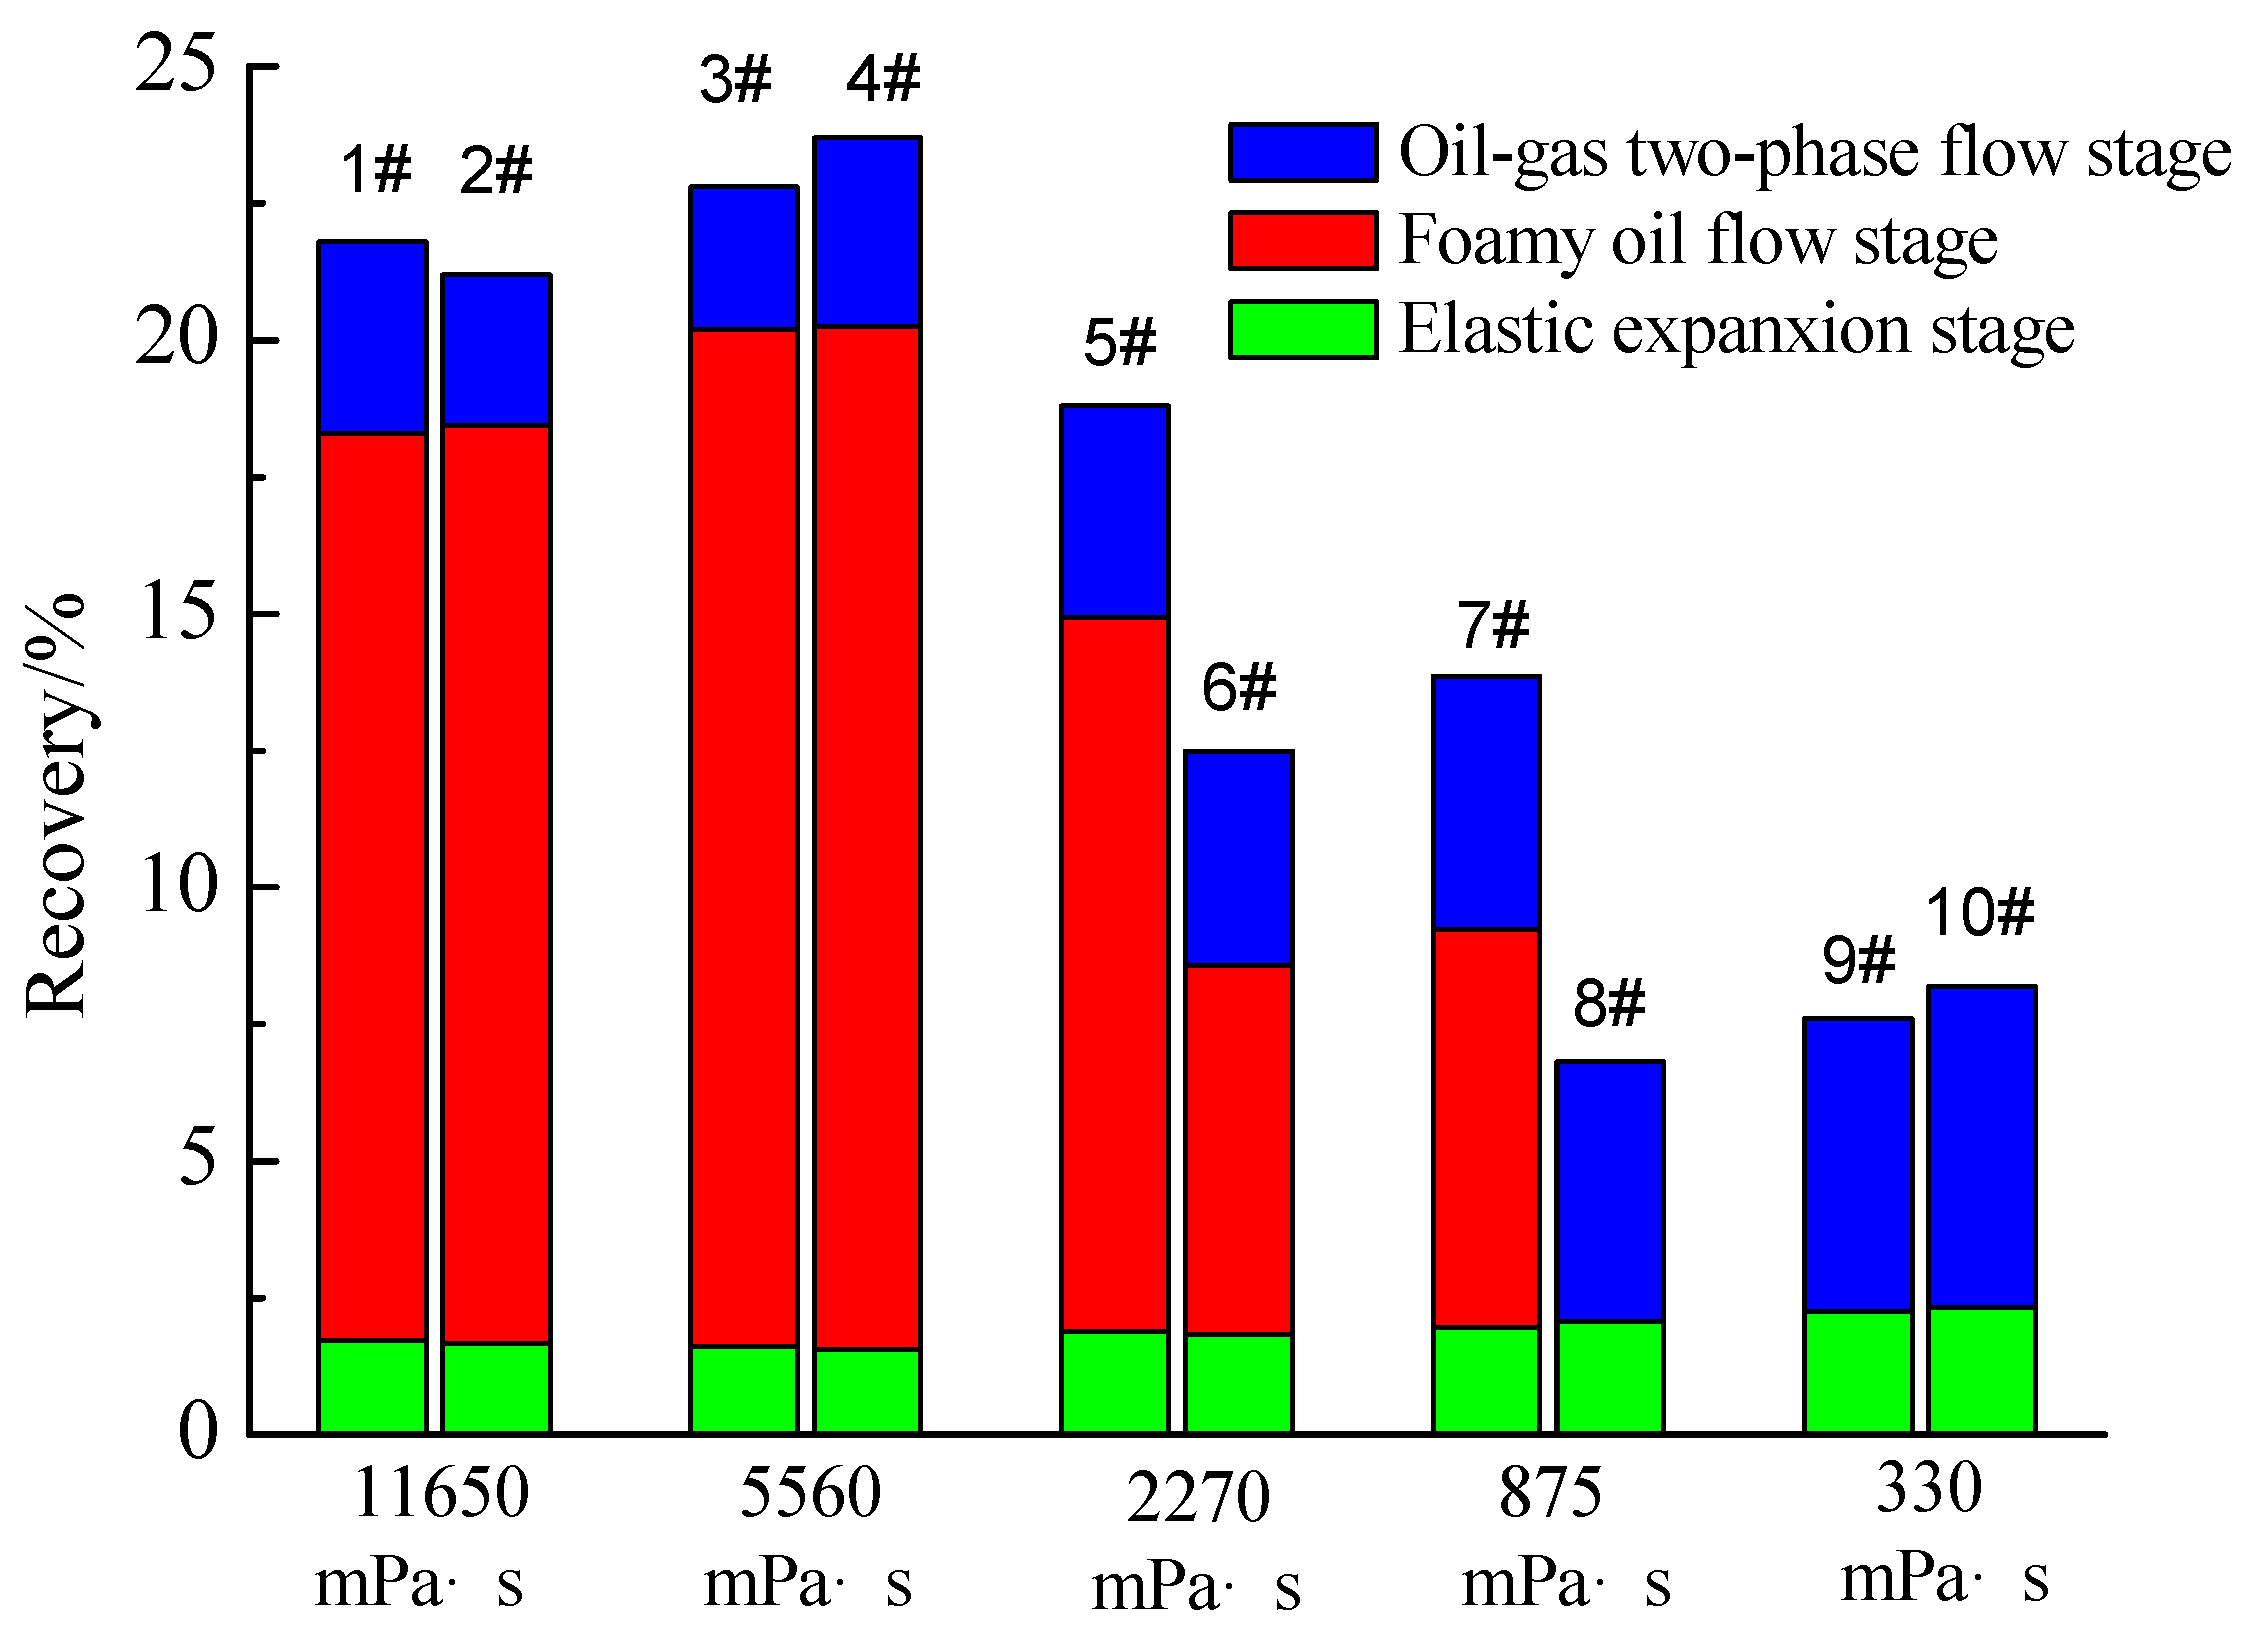
The effects of viscosity and asphaltene on the total recovery and the recovery of each stage are shown in Figure 8. The recoveries of the elastic expansion stage and the oil–gas two-phase flow stage for all tests were very low. The foamy oil stage was the main oil production period. At the viscosity of 11,650 mPa∙s and 5560 mPa∙s, the recovery was obviously higher than that at lower viscosity and oil type had little influence on the recovery. At the viscosity of 2270 mPa∙s and 875 mPa∙s, the recovery for asphaltenic oil was remarkably higher than that for deasphalted oil. At the viscosity of 330 mPa∙s, foamy oil did not form, regardless of oil type, which was the reason for low recovery. From the sandpack depletion experiment, we can conclude that foamy oil tends to form in high-viscosity oil. With the decrease in oil viscosity, the foamy oil stage shortens until no foamy oil forms. Asphaltene plays a role in the formation of foamy oil only in a certain viscosity range (between 870 mPa∙s and 2270 mPa∙s for this work).
3.2. Microscopic Visualization Experiments
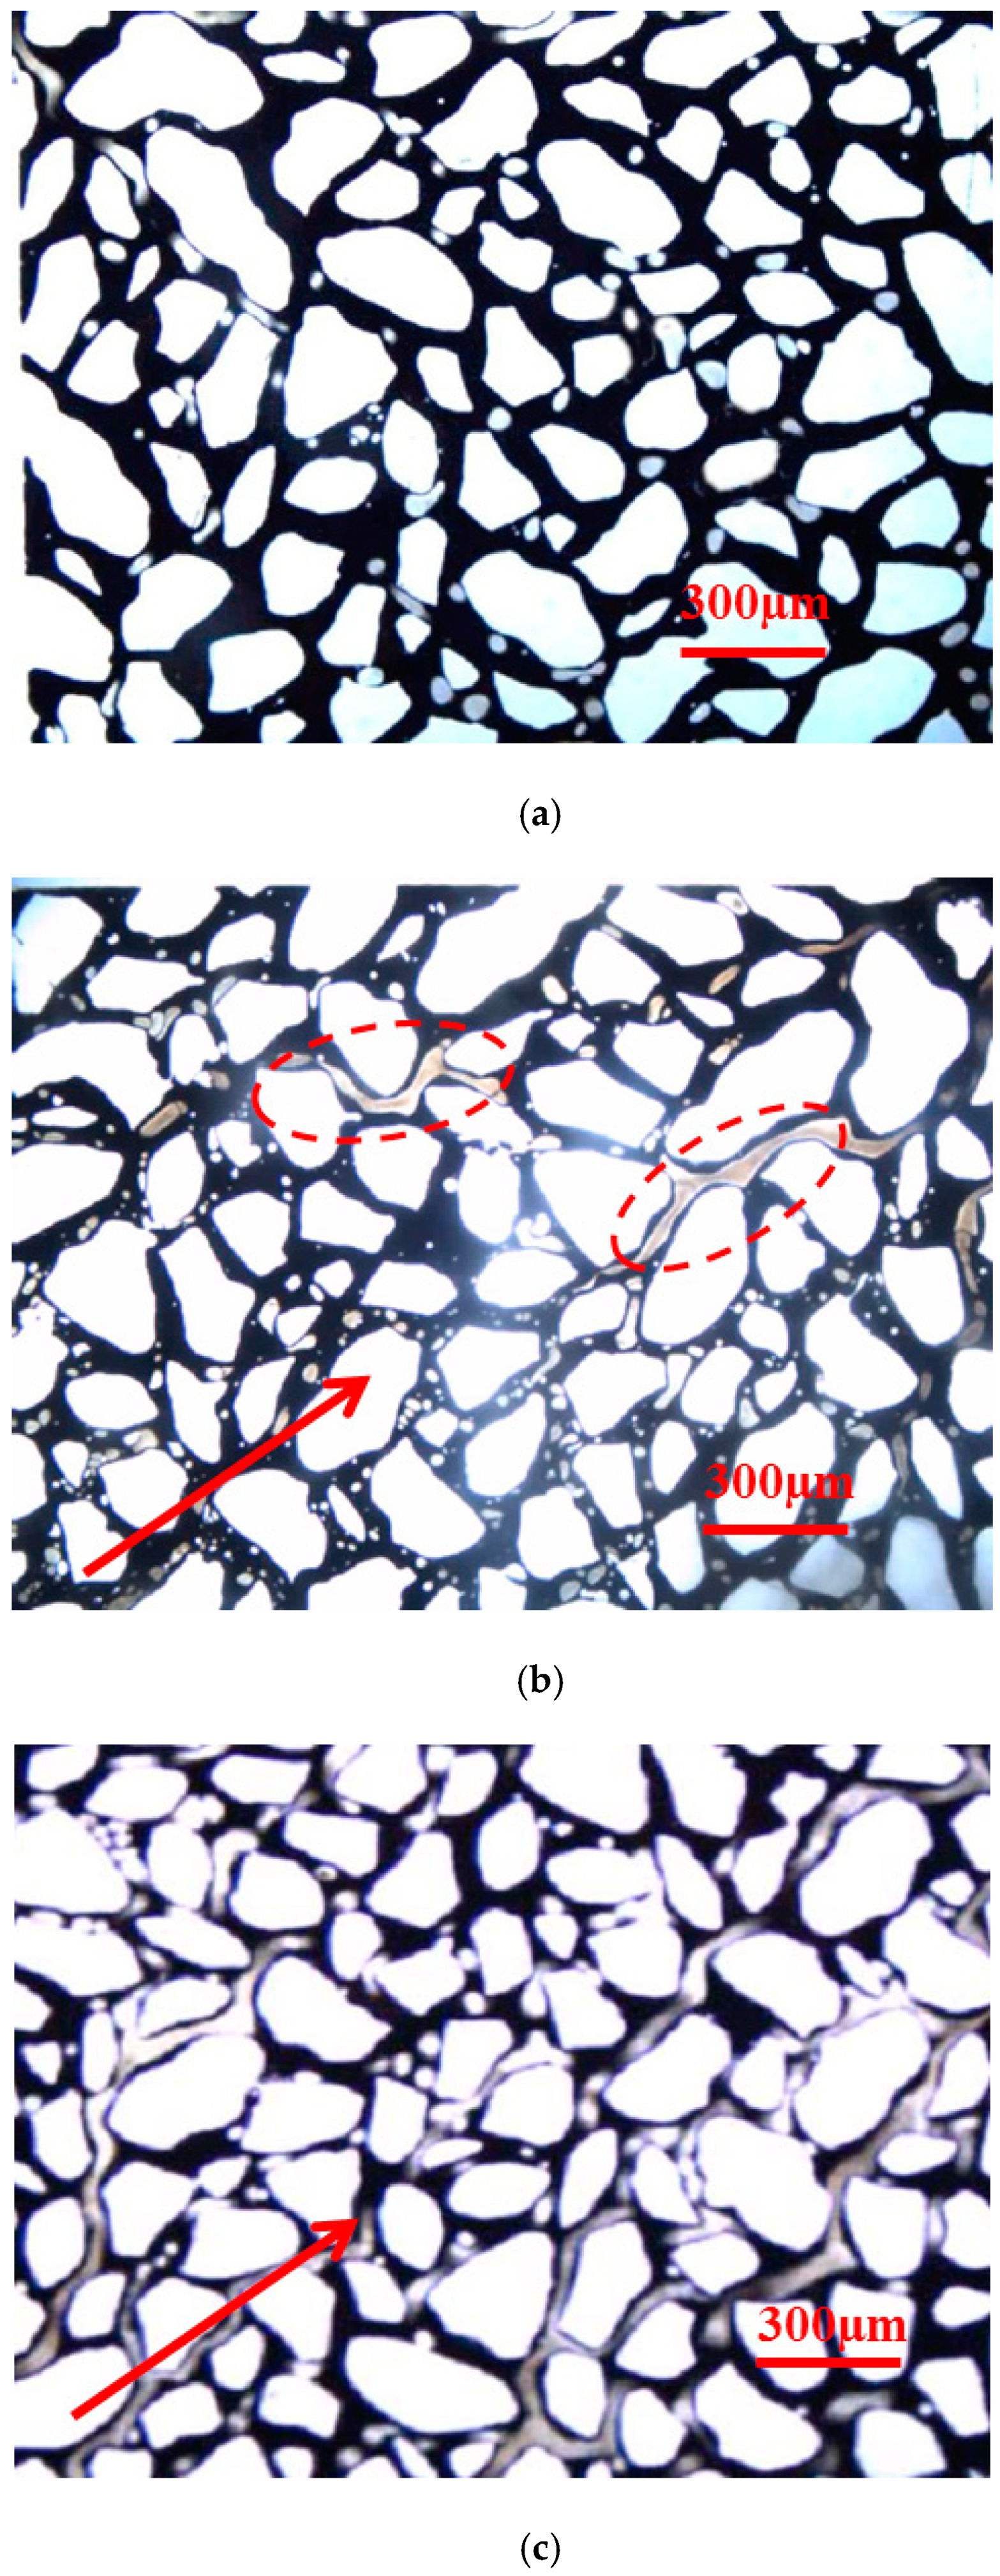
The flow characteristics of the three types of depletion development were observed in the microscopic visualization model. The flow characteristic for foamy oil depletion development is shown in Figure 9a, taking test 1 as an example. In the figure, the bright-white zone with an irregular shape represents the matrix of porous media. The continuous black zone represents the oil. The small and rounded white zone in the black oil is the micro-bubble. We can see that the scattered micro-bubbles steadily flowed with the oil. There was no relative slippage between oil and micro-bubbles. The bubbles expanded very slowly and coalesced rarely. The stable gas-in-oil dispersion system explains why the gas relative permeability was very low in the foamy oil stage.
The flow characteristic for the weak foamy oil depletion development is illustrated in Figure 9b, taking test 7 as an example. The red arrow represents the flow direction. It can be seen that lots of micro-bubbles were dispersed in the oil at the upstream location, indicating the existence of foamy oil. However, the number of the micro-bubbles was much higher than that in Figure 9a. Continuous gas channels appeared at the downstream location, as shown in the red dotted box. This indicated that dispersed micro-bubbles turn into continuous gas early in the flow process. This corresponds to the short foamy oil stage in the sandpack experiment.
Figure 9c displays the result of test 9, which reflects the flow characteristic of the conventional solution gas drive. We can see that, although gas channels ran through the whole micromodel, there still existed a few micro-bubbles. However, the micro-bubbles were soon merged into the gas channel shortly after forming; thus, the characteristics of foamy oil did not show. By contrasting the three types of depletion development, it could be determined that solution gas was released as a dispersed micro-bubble; however, the growth rate and coalescence frequency of the micro-bubble were different because of the oil viscosity. At high viscosity, the micro-bubbles grew very slowly, and it was very hard for them to coalesce; thus, stable foamy oil tended to form. On the other hand, the micro-bubbles coalesced easily due to low viscous resistance in the low-viscosity oil, resulting in dispersed micro-bubbles quickly turning into a continuous gas phase.
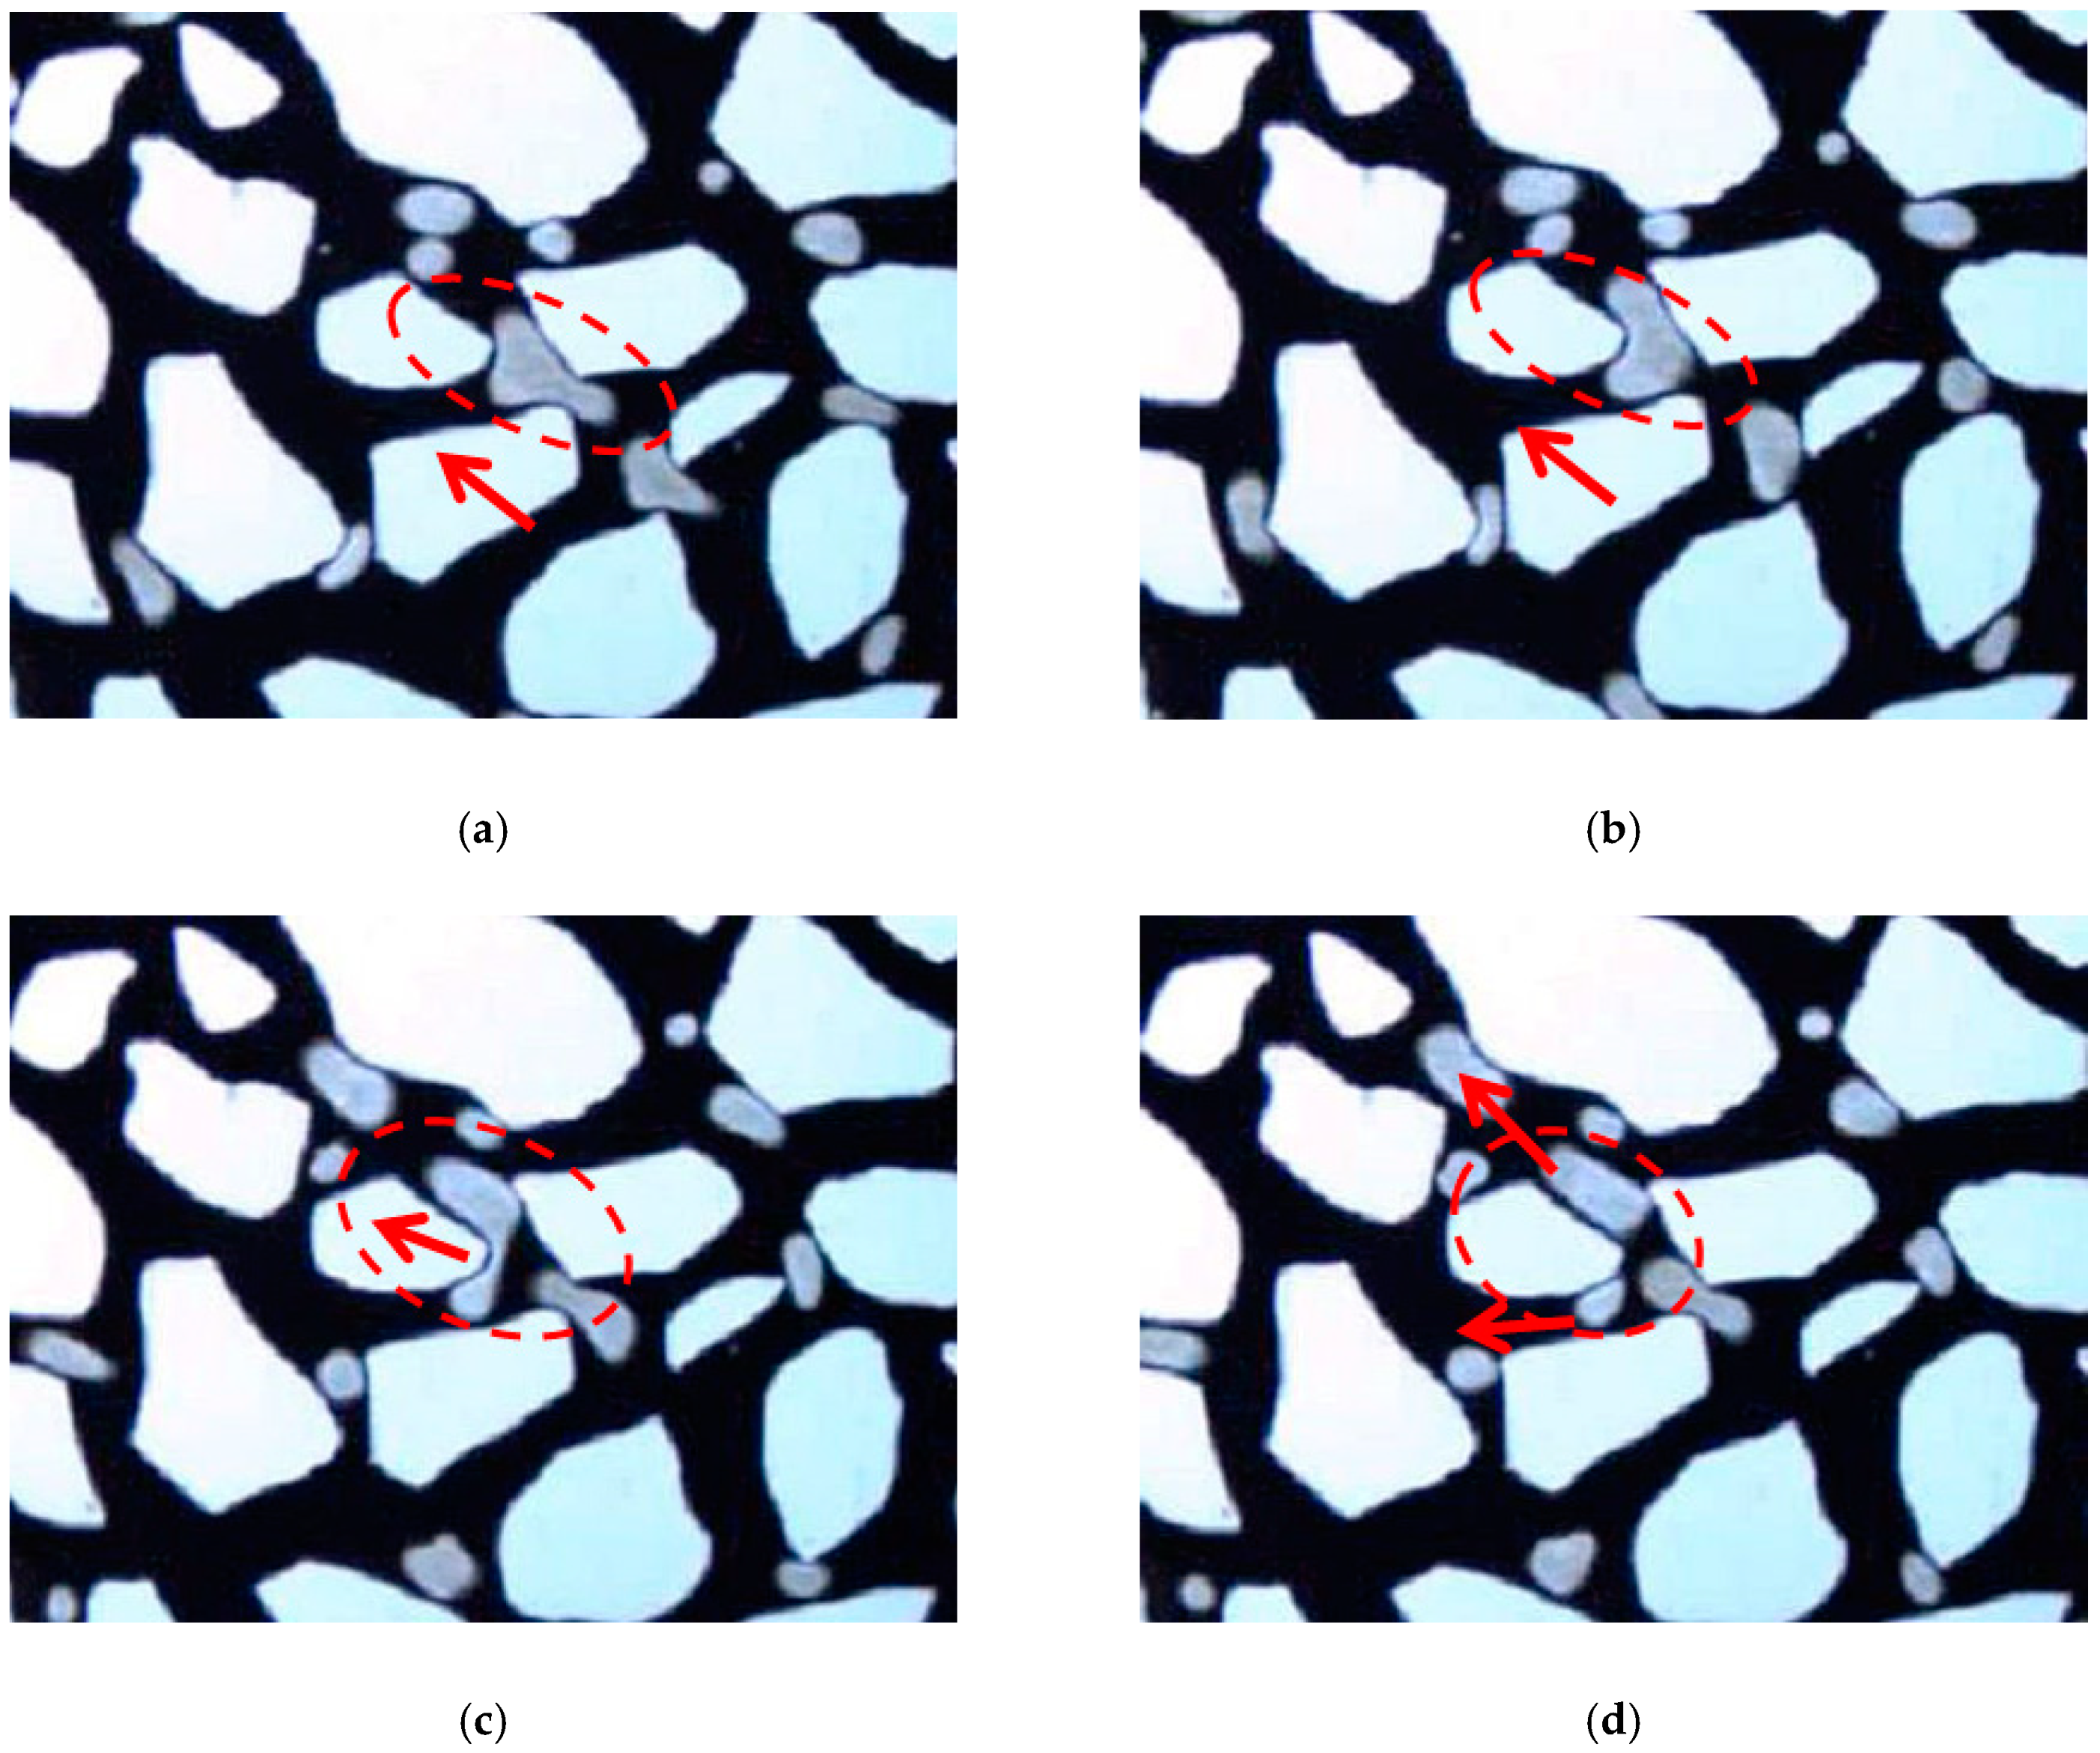
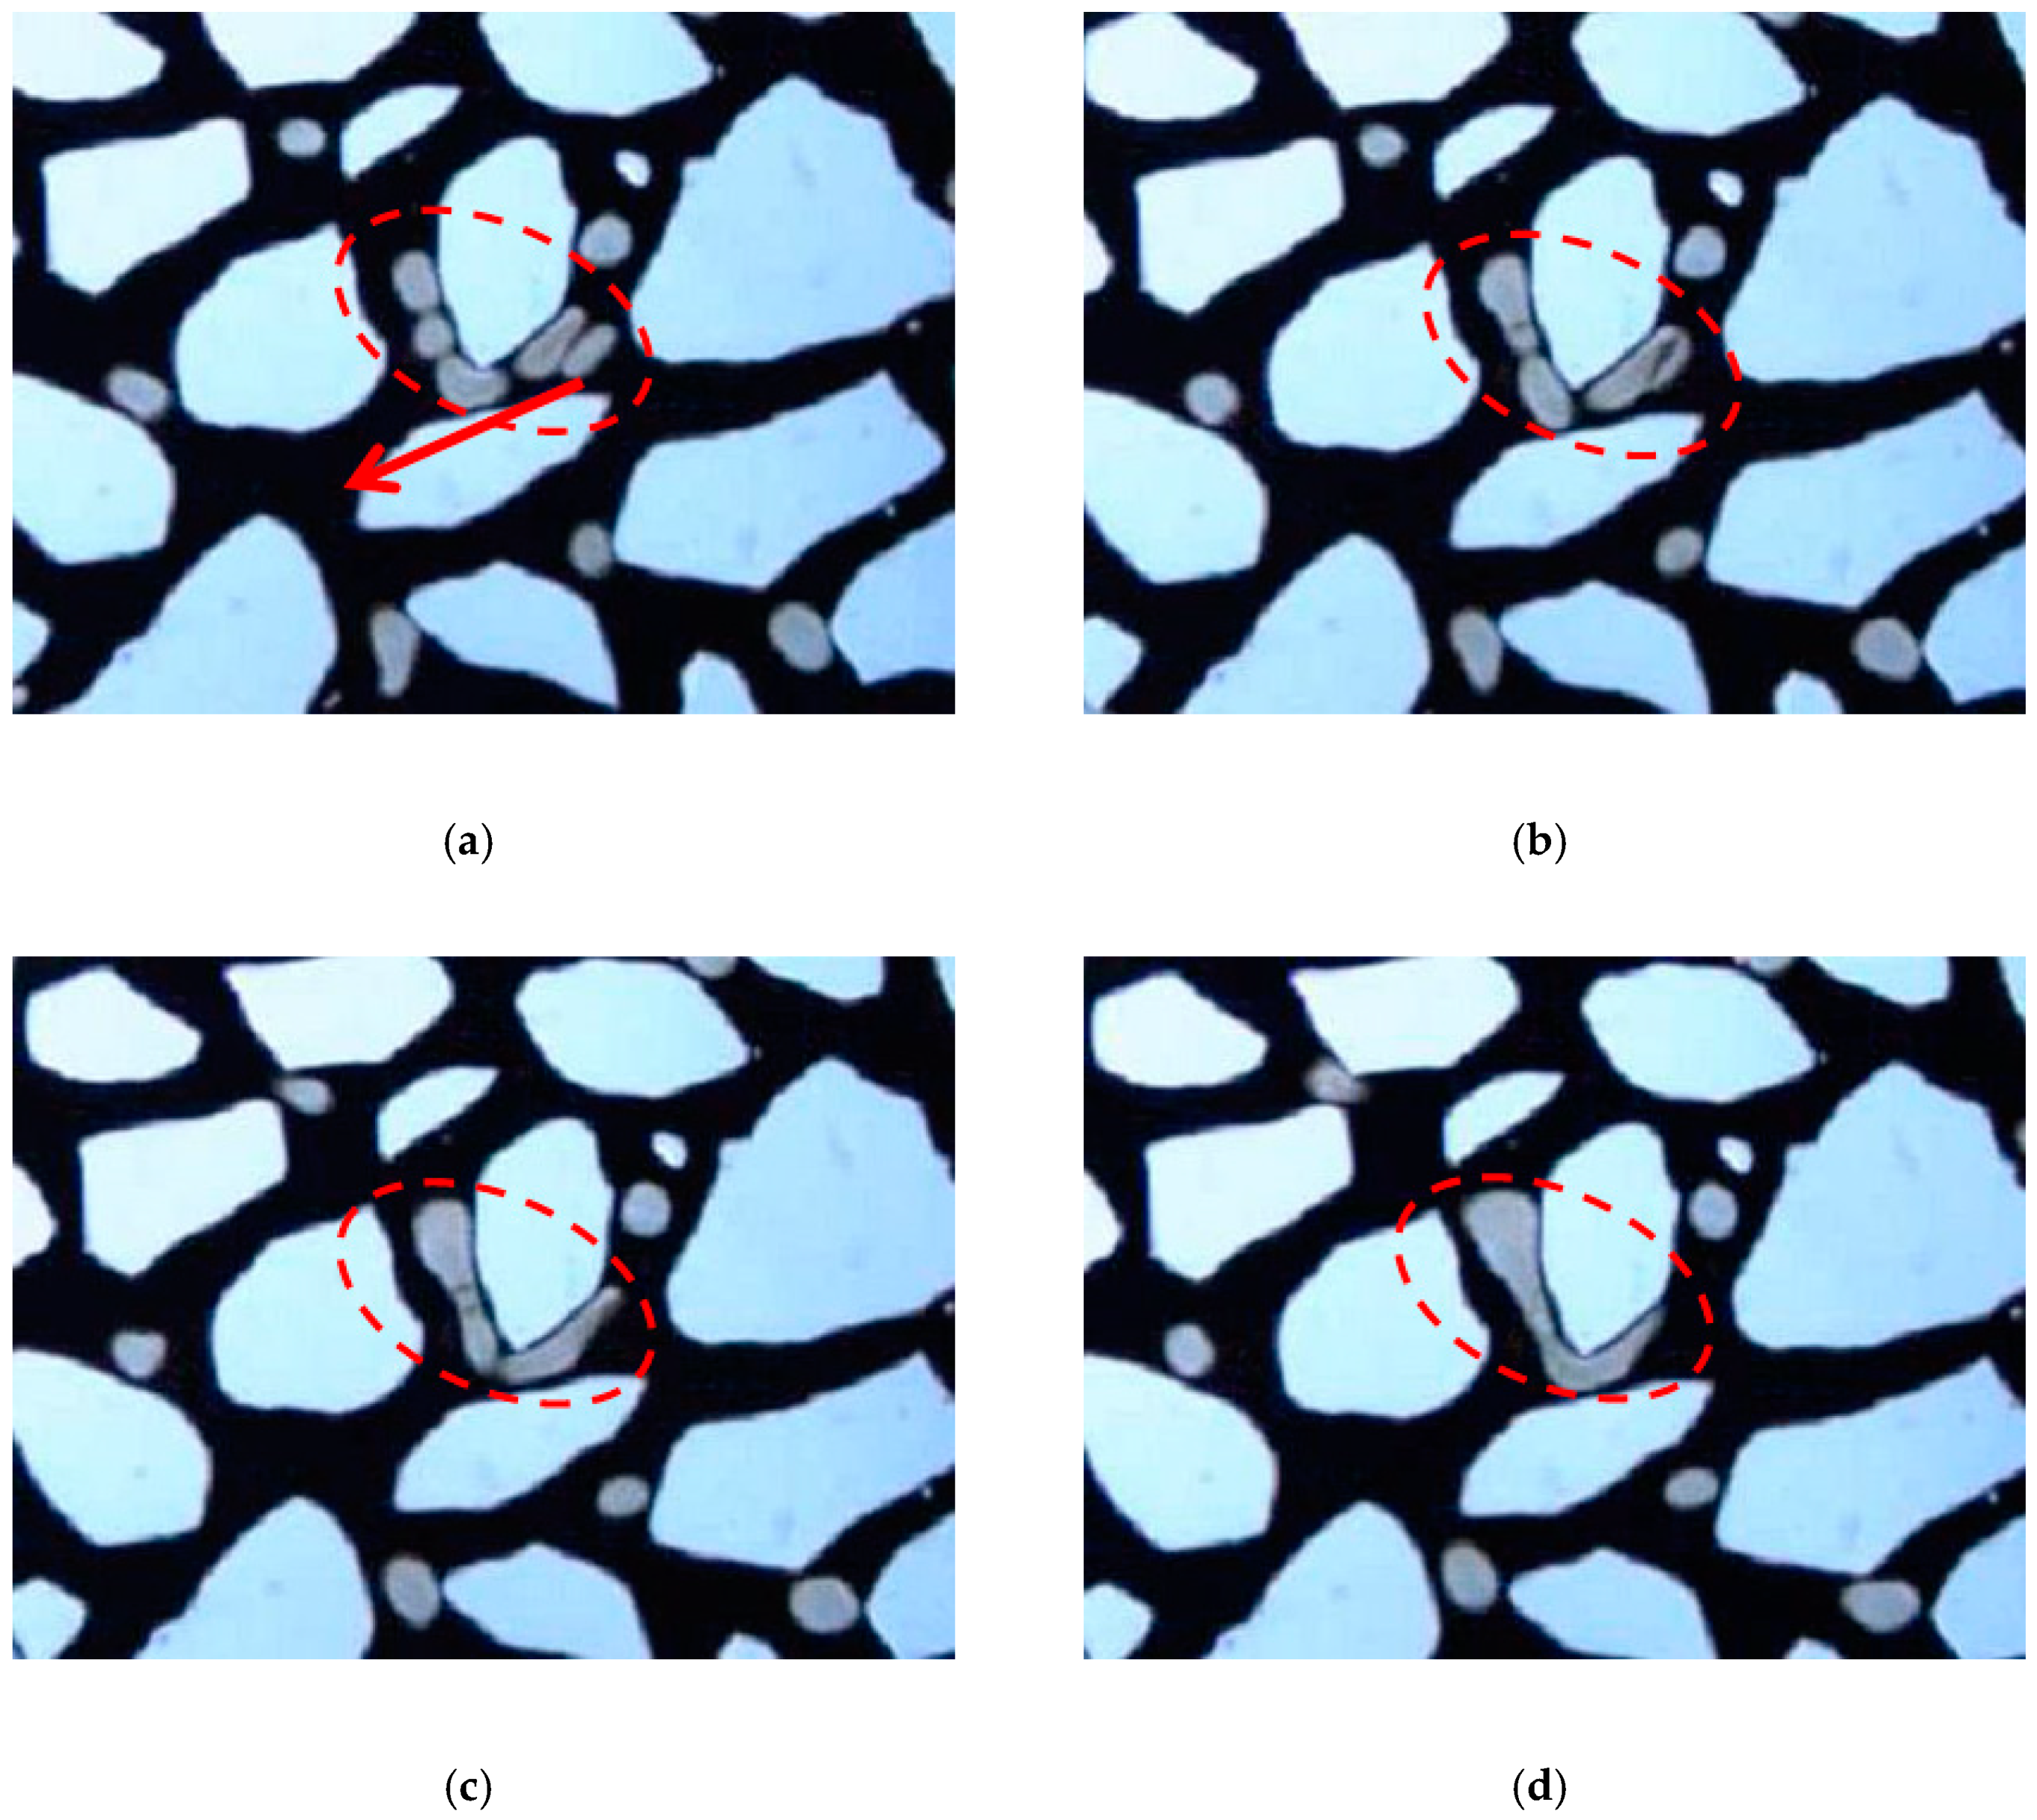
At the viscosity of 2270 mPa∙s and 875 mPa∙s, the flow characteristic was also different for asphaltenic oil and deasphalted oil, which echoes the difference in performance in the sandpack depletion experiment. The results at the viscosity of 2270 mPa∙s were taken as an example. The flow of foamy oil in asphaltenic oil is shown Figure 10. When a large bubble passed through a pore throat, it deformed easily, as shown in the red dotted box. The bubble was elongated and gradually thinned with the deformation, as shown in Figure 10b,c. Eventually, a large bubble split into two small bubbles, as shown in Figure 10d. The flow of foamy oil in deasphalted oil is shown Figure 11. In the red dotted box, bubbles coalesced gradually and eventually turned into a large bubble. Therefore, we can conclude that bubble deformation and splitting happened easily for the asphaltenic oil, which helped in maintaining the dispersed state and improving the stability of foamy oil. However, for deasphalted oil, bubbles tended to coalesce, which accelerated the formation of the continuous gas phase and was detrimental to foamy oil.
3.3. Interfacial Viscoelasticity Measurement
3.3.1. Effect of Oil Viscosity and Asphaltene on the Viscoelastic Modulus
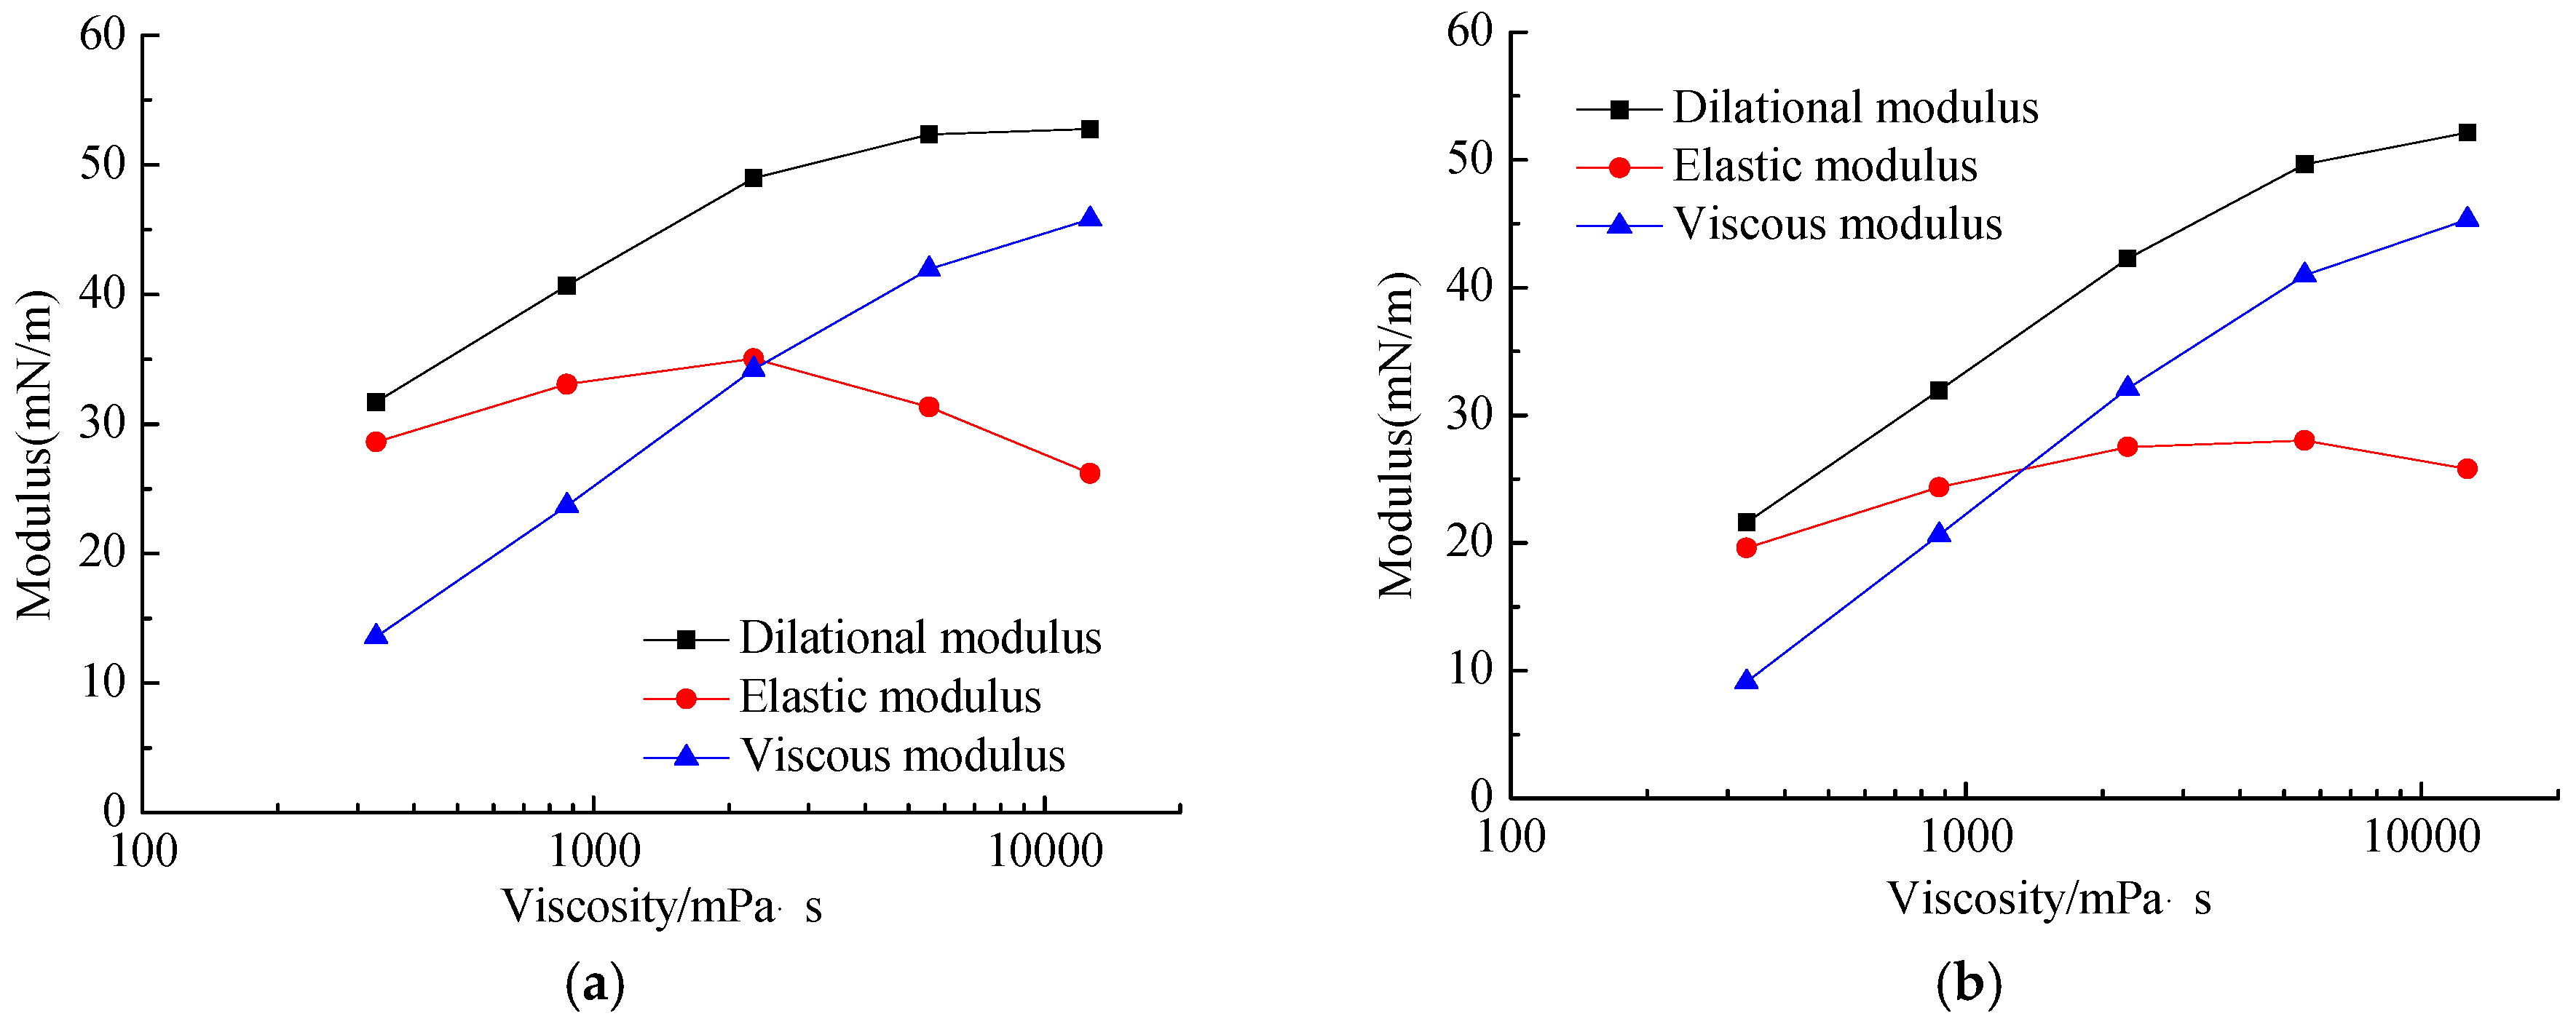
Figure 12a,b show the changes in viscoelastic moduli with viscosity for asphaltenic oil and deasphalted oil. We can see that the changes are similar for the two types of oil. With the decrease in oil viscosity, the dilatational modulus and the viscous modulus decreased, while the elastic modulus firstly increased then decreased. At the higher viscosity, the viscous modulus was dominant, much greater than the elastic modulus. This suggests that excessively high viscosity can be detrimental to the elasticity of the film because of over-rigidity. As the oil viscosity declined, the proportion of elastic modulus gradually exceeded that of the viscous modulus.
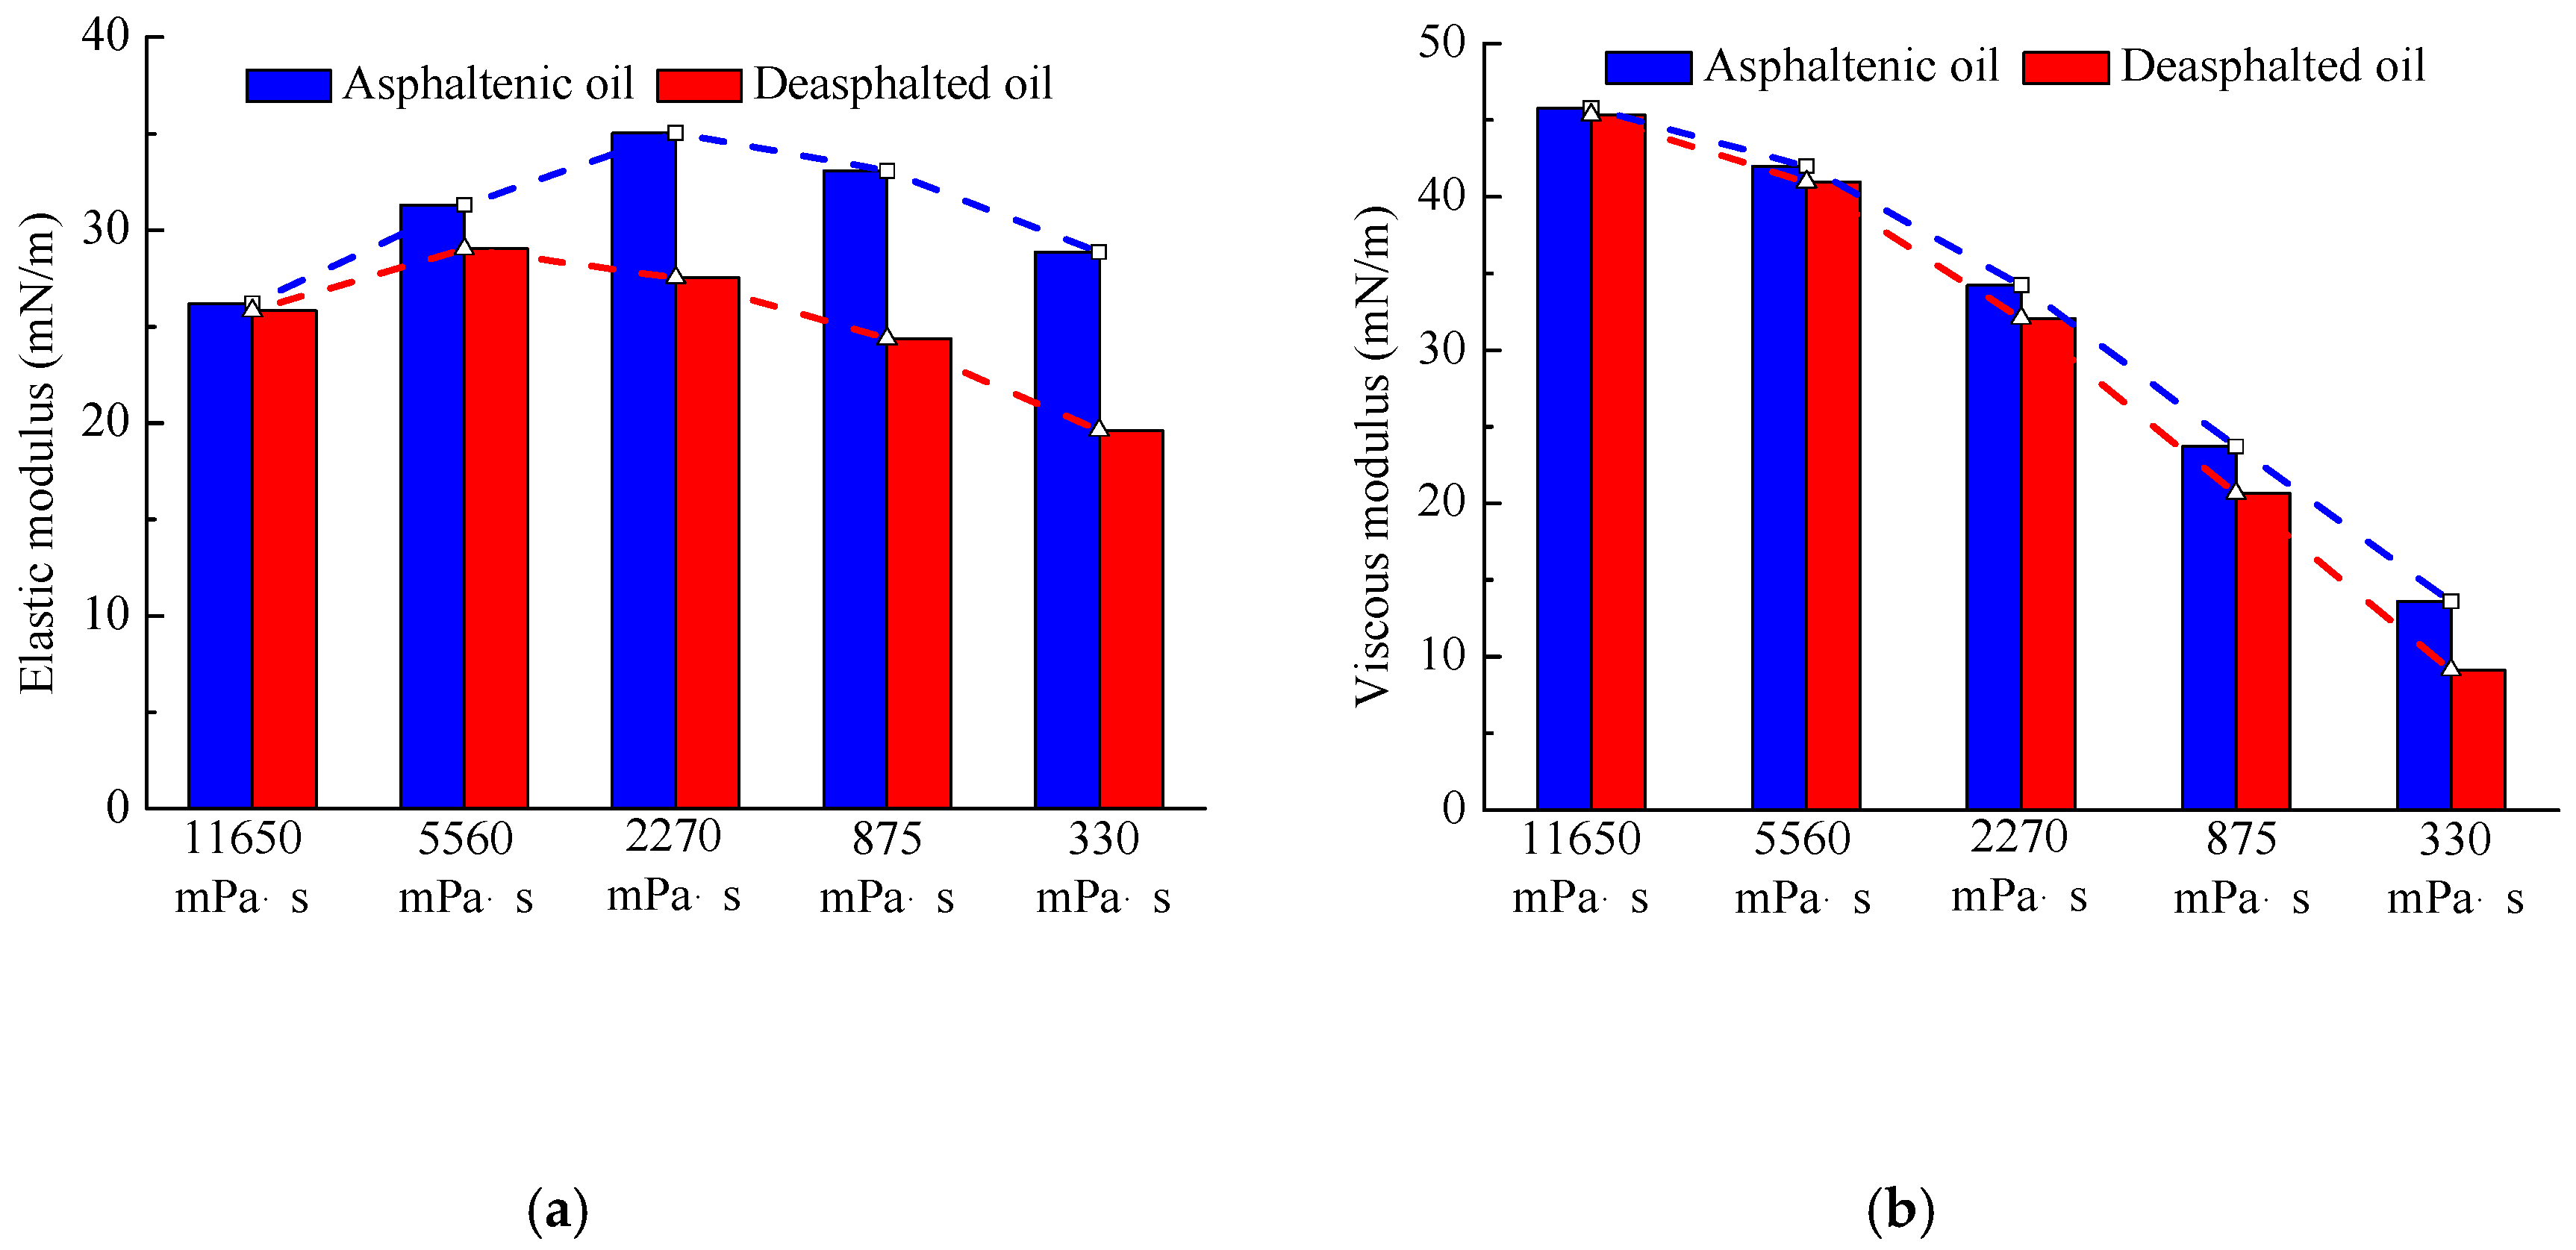
Figure 13a,b display the effect of asphaltene on the elastic modulus and viscous modulus, respectively, at different viscosities. At the same viscosity, the elastic modulus and the viscous modulus for asphaltenic oil were greater than those for deasphalted oil, especially for the lower-viscosity oil (≤2270 mPa∙s). Moreover, the difference in the elastic modulus was much greater than that in the viscous modulus, indicating that asphaltene influenced the elastic modulus more than the viscous modulus. This may be because the viscous modulus is mainly determined by the viscosity of the oil.
3.3.2. Relation between Viscoelastic Modulus and Foamy Oil
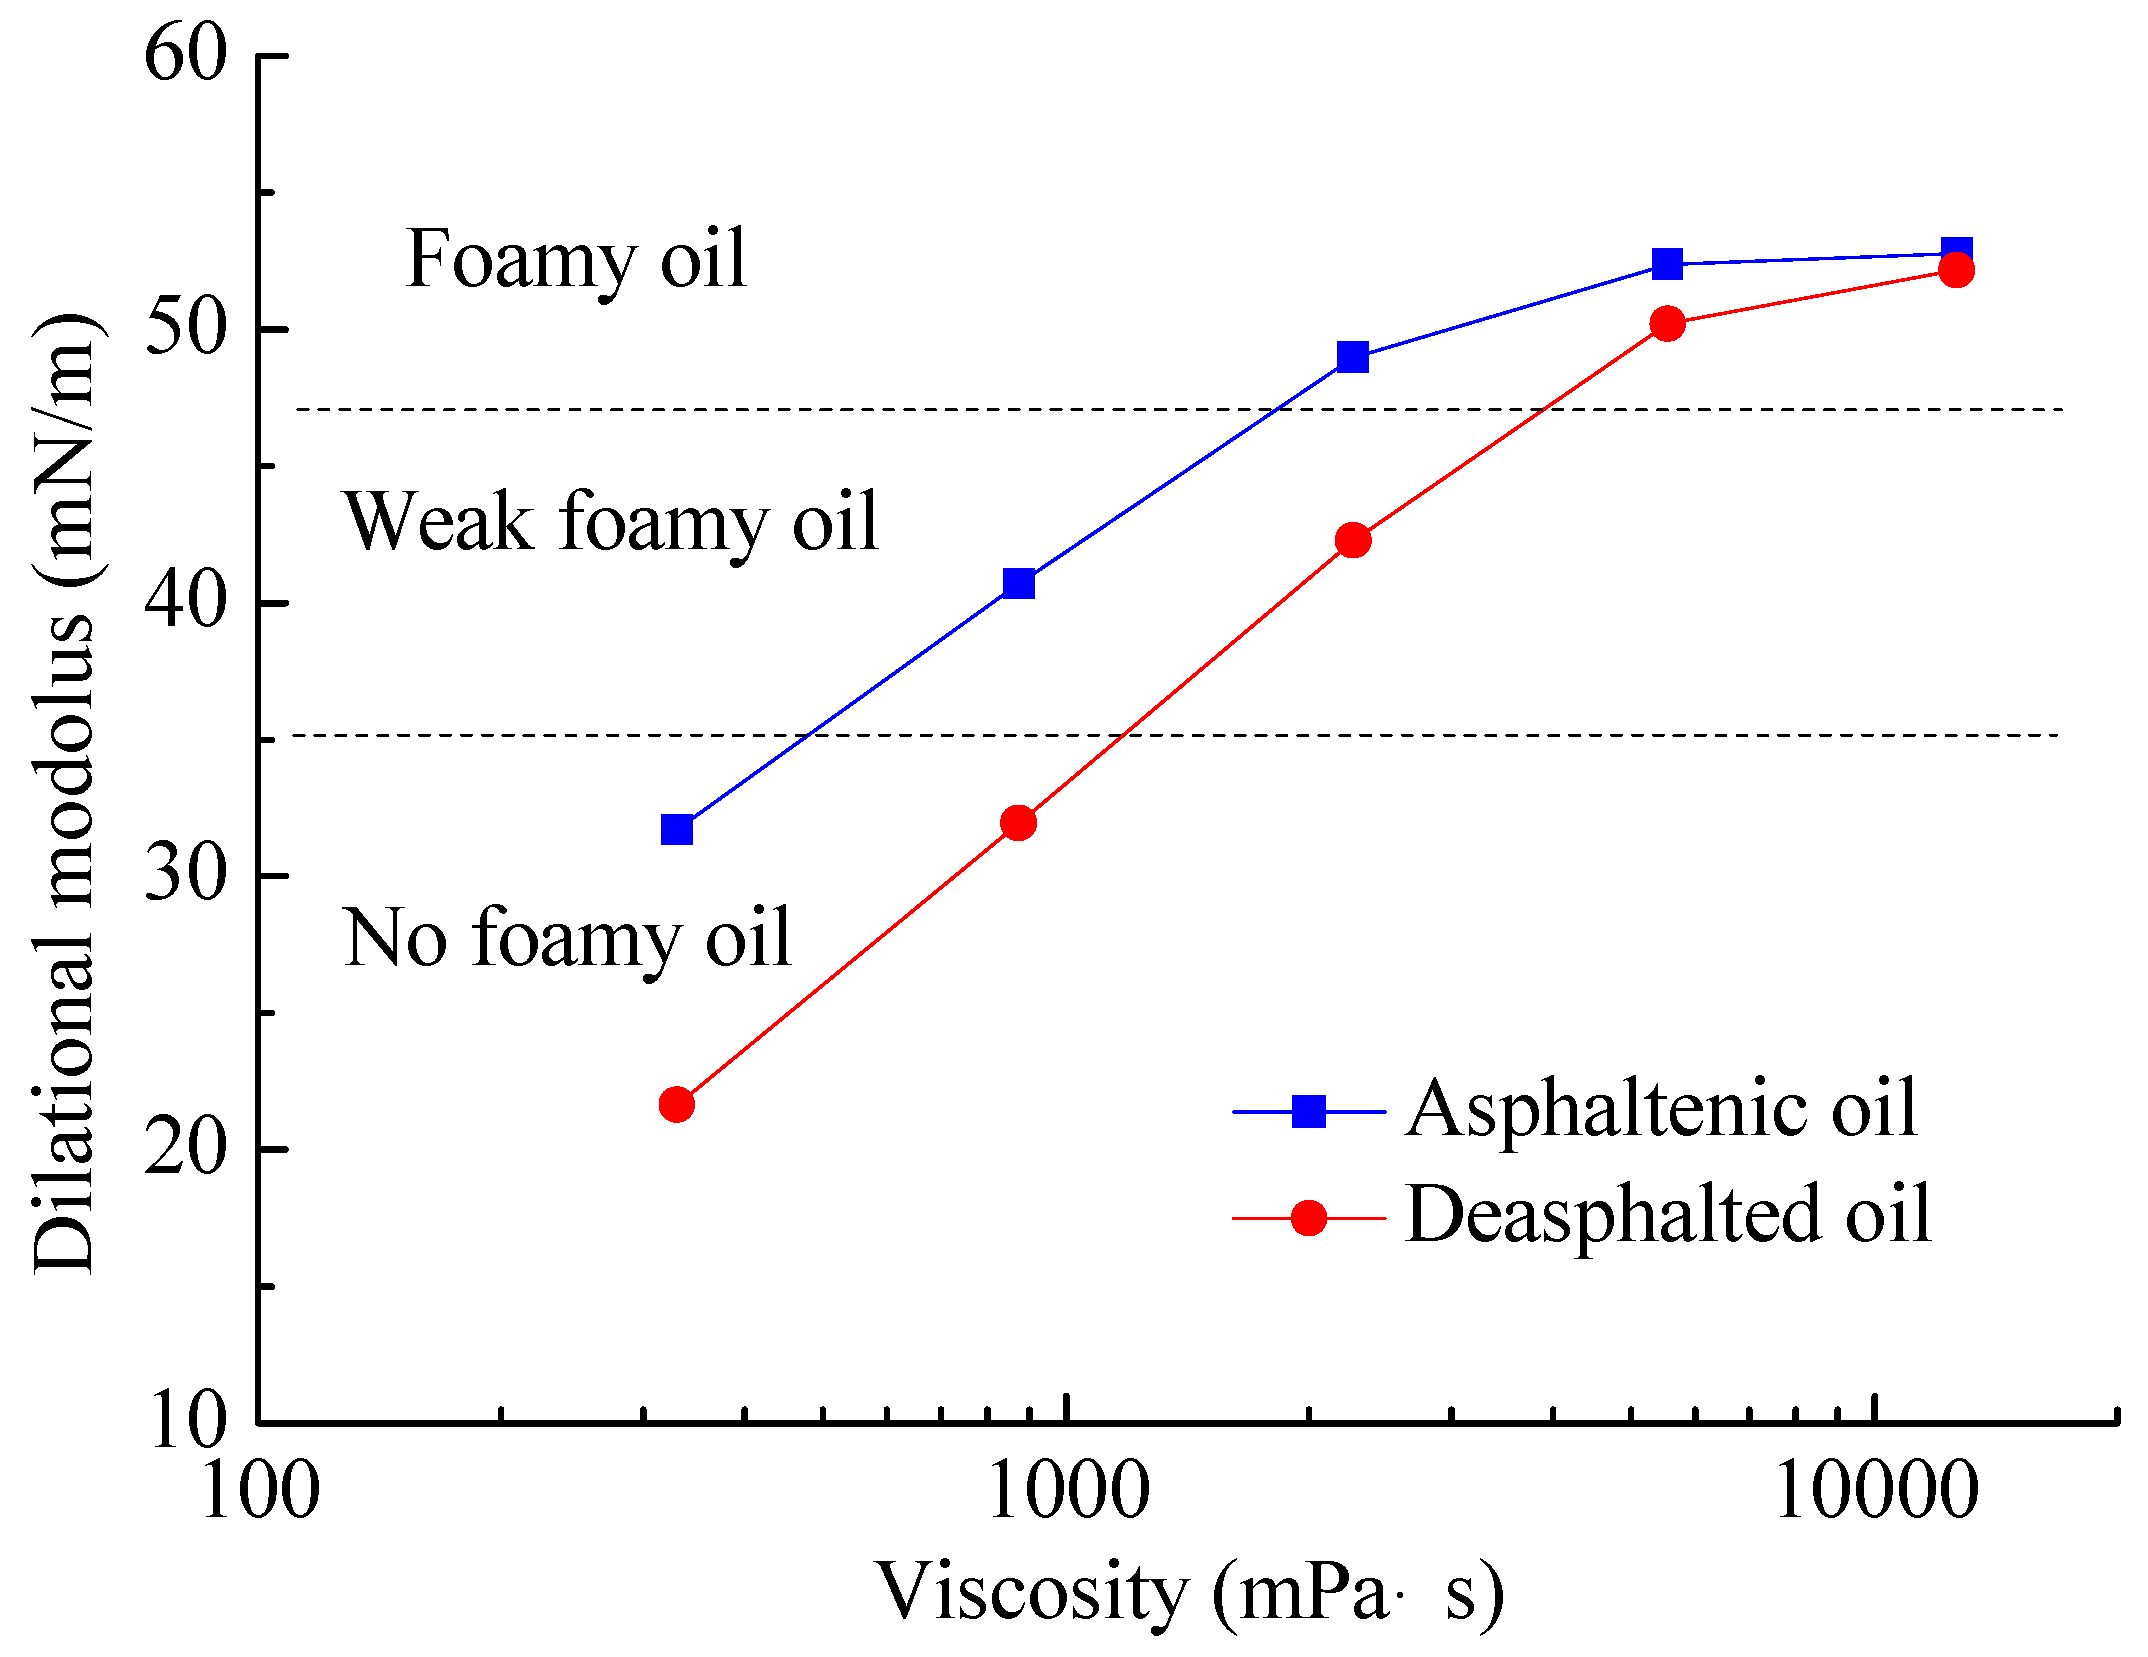
Based on the viscoelasticity and the depletion performance of the ten oil samples, a relationship between the viscoelastic modulus of the oil–gas interface and od foamy oil was analyzed, as shown in Figure 14. For the oil samples in which the depletion development was foamy oil, the dilatational moduli were all higher. For the oil samples in which the depletion development was conventional solution gas drive, the dilatational moduli were all lower. For the oil samples whose depletion development belonged to weak foamy oil type, the dilatational moduli were at a medium level. Therefore, it can be inferred that, for an oil reservoir, the performance of depletion development has a close relationship with the viscoelastic modulus of the oil–gas interface. The higher the viscoelastic modulus is, the more likely stable foamy oil will form in depletion development. The effects of viscosity and asphaltene on foamy oil can all be attributed to the viscoelastic modulus.
4. Discussion
For a viscoelastic interfacial film, when it is disturbed, the even distribution of a surfactant on the interface is broken; thus, an interfacial tension gradient is produced. Under the effect of the interfacial tension gradient, the migration of the surfactants on the interface occurs and the surfactant exchange between the interface and the continuous body phase happens.
The migration of the surfactant on the interface can bring along the migration of the solution in the interfacial layer because of the interaction between interfacial molecules (i.e., interaction between hydrophilic groups and hydration), which helps in getting the interfacial film back into shape and results in elasticity. The migration ability of the surfactant on the interface is characterized by the elastic modulus, which is closely related to the interaction between interfacial molecules.
The surfactant exchange between the interface and the continuous body phase can decrease the interfacial tension gradient but cannot restore the film; thus, the exchange is unfavorable to the stability of the interfacial film. The microscopic relaxation process of surfactant exchange is characterized by the viscous modulus, which is closely related to the viscosity of the continuous body phase. The higher the viscosity of the continuous body phase is, the higher the viscous modulus, the lower the surfactant exchange rate, and the more favorable to the stability of interfacial film the environment will be.
4.1. Effect of Oil Viscosity on Foamy Oil
For the foamy oil system, the continuous body phase and the solution in the interfacial layer represent the oil. We can explain the effect of oil viscosity on the elastic modulus and viscous modulus according to the above definition. When the oil viscosity is not too high, its increase can promote the interaction between interfacial molecules. However, excessively high viscosity will hinder the migration of interfacial molecules, leading to a decrease in the ability to restore the interfacial film. Thus, the elastic modulus firstly increases then decreases with the increase in oil viscosity. Moreover, because the viscous modulus is mainly related to the viscosity of the interfacial layer, the viscous modulus increases with the increase in oil viscosity.
On this basis, the effect of oil viscosity on foamy oil can be analyzed. For the high-viscosity oil, the viscous modulus of the oil–gas interface is very high, suggesting that the bubble film has good strength and rigidity. The strong and rigid oil film can lessen the chance of rupture and coalescence, and can steadily maintain the gas-in-oil disperse state. Furthermore, the high-viscosity oil film can greatly add resistance to gas diffusion and, thus, inhibit bubble growth. Therefore, foamy oil tends to form in high-viscosity oil. The high-viscosity oil film can provide sufficient strength and rigidity for the stability of foamy oil regardless of its elasticity. However, if the viscous modulus of bubble film is not large enough, the elasticity would make a difference to the foamy oil. The higher the elastic modulus is, the more favorable for foamy oil it will be. The micro-bubble with a high-elasticity film deforms and stretches more easily, which greatly increases the probability for bubble splitting. Thus, at the viscosity of 2270 mPa∙s and 875 mPa∙s, the foamy oil performance in the depletion experiment with asphaltenic oil was much better than that with deasphalted oil.
4.2. Effect of Asphaltene on Foamy Oil
Asphaltene, as a natural surfactant in oil, tends to aggregate at the oil–gas interface. The adsorption of asphaltene onto the interface can decrease the interfacial tension and improve the interfacial tension gradient when the interfacial film is disturbed, which helps in the migration of interfacial molecules. In other words, the adsorption of asphaltene onto the interface is favorable for the elasticity of interfacial film. Thus, the elastic modulus for asphaltenic oil is higher than that for deasphalted oil. Moreover, asphaltene can increase the viscosity of heavy oil, which is the main factor that influences the viscous modulus. Thus, asphaltene in oil can influence the viscous modulus to a certain extent.
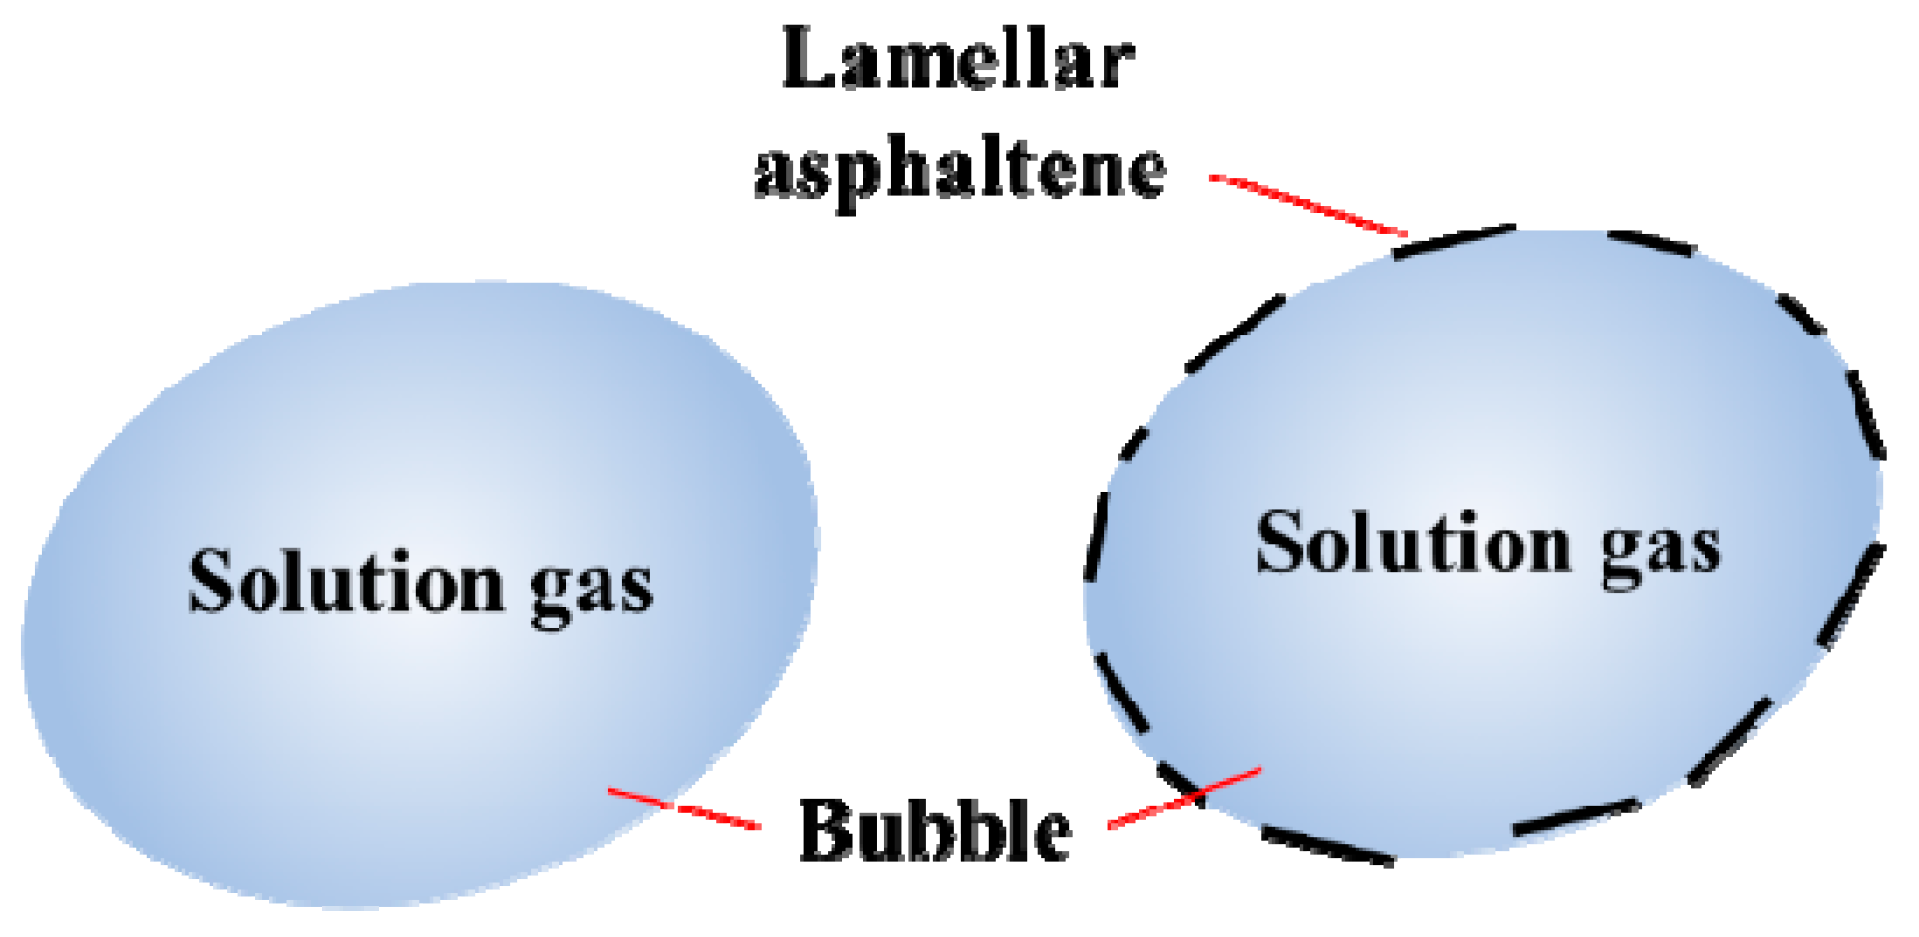
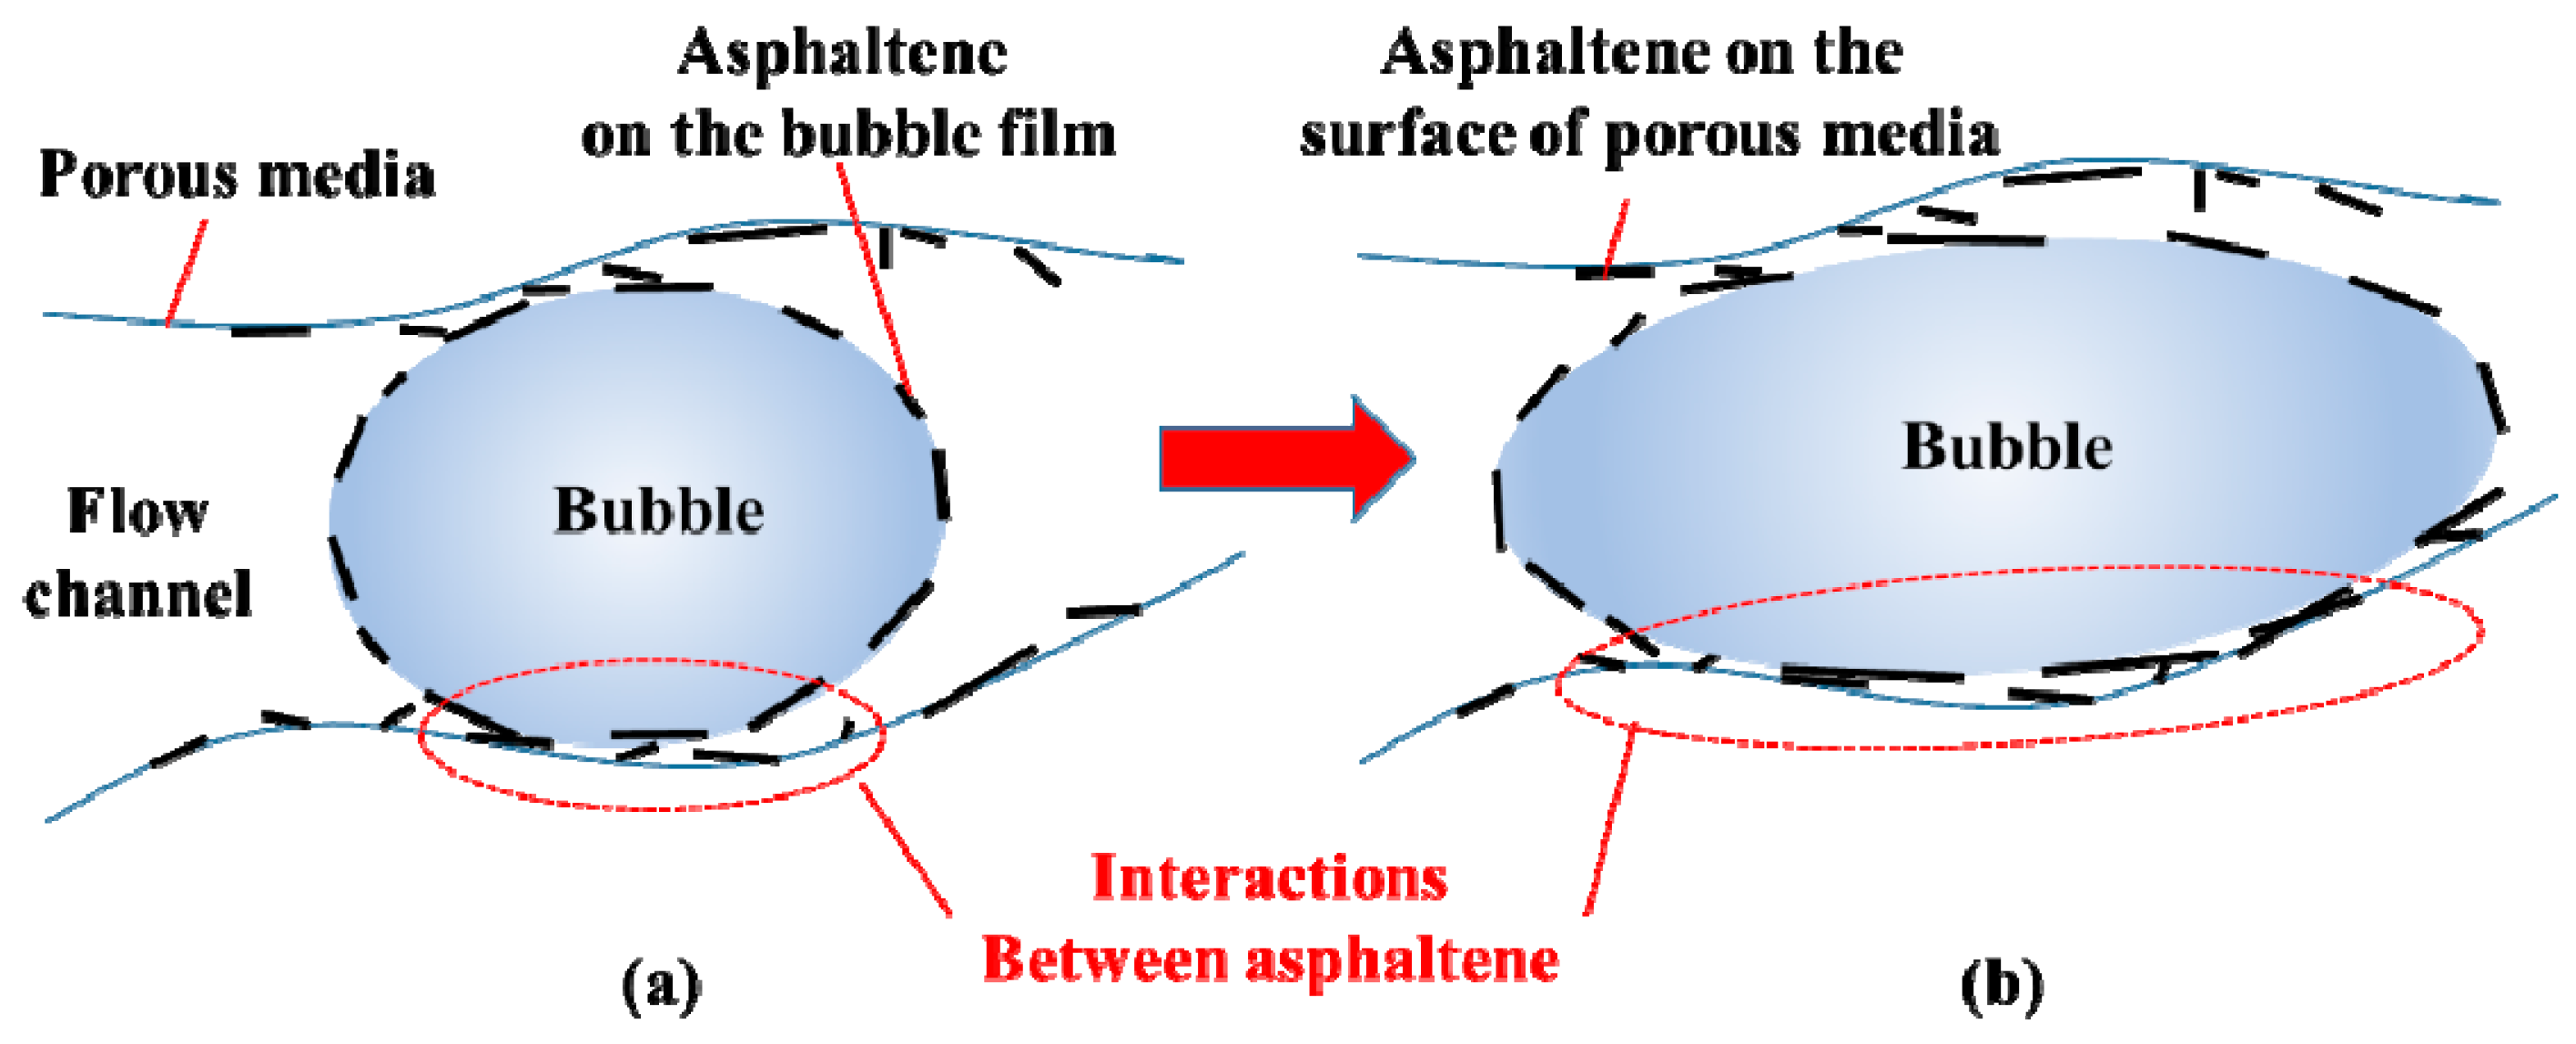
The effect of asphaltene on foamy oil is mainly related to its adsorption onto the interfacial film. In asphaltenic oil, micro-bubbles are wrapped in the asphaltene, akin to having a suit of armor, as shown in Figure 15. The elasticity and strength of the bubble film can be improved due to the “armor”, which helps in the stability of foamy oil. Meanwhile, the “armor” is a hindrance to the diffusion of solution gas, which can inhibit the growth and coalescence of micro-bubbles. In addition, some asphaltene can also be adsorbed onto the surface of porous media. There may exist interactions such as friction, as well as interlacement between the asphaltenes on the bubble film and on the surface of porous media, as shown in Figure 16. This can further cause the micro-bubble to deform and stretch, increasing the chance of bubble splitting. Therefore, the foamy oil performance in the depletion experiment with asphaltenic oil was better, especially at the viscosity range between 870 mPa∙s and 2270 mPa∙s.
5. Conclusions
- (1)
- Based on the depletion experiments in the sandpack and micromodel, foamy oil tends to form in high-viscosity oil. With the decrease in viscosity from 11,650 mPa∙s to 330 mPa∙s, the foamy oil performance worsened until no foamy oil formed. Asphaltene improves the foamy oil performance only at the mid-viscosity level (between 875 mPa∙s and 2270 mPa∙s).
- (2)
- The rough relationship between the viscoelastic modulus of the oil–gas interface and foamy oil performance shows that the higher the viscoelastic modulus is, the more likely foamy oil will form in depletion development.
- (3)
- Oil viscosity mainly influences the viscous modulus. The bubble film in high-viscosity oil has sufficiently high strength and rigidity to protect the micro-bubble from rupture and coalescence.
- (4)
- The adsorption of asphaltene onto the oil–gas interface can improve the elasticity and strength of the bubble film and reduce the gas diffusion rate. Furthermore, the interactions between the asphaltene on the bubble film and on the matrix surface can promote micro-bubbles to deform and stretch, thus increasing the chance for bubble splitting.
Author Contributions
Conceptualization, Z.W. and Z.L.; methodology, Z.W.; validation, Z.W. and Z.L.; formal analysis, Z.W.; investigation, Z.W.; data curation, Z.W.; writing—original draft preparation, Z.W.; writing—review and editing, Z.W. and Z.L.; visualization, Z.W.; supervision, Z.L.; project administration, Z.L.; funding acquisition, Z.L.
Acknowledgments
The work was supported by the National Natural Science Foundation of China (Grant 51604292), the Natural Science Foundation of Shandong Province, China (Grant ZR2016EEB29), the National Science and Technology Major Project of China (Grant 2016ZX05012-002-004), the Fundamental Research Funds for the Central Universities (Grant 17CX02014A), the National Science and Technology Major Project of China (Grant 2017ZX05009004-002), and the National Science and Technology Major Project of China (Grant 2016ZX05031-002-004-002).
Conflicts of Interest
The authors declare no conflict of interest.
References
- Meyer, R.F.; Attanasi, E.D.; Freeman, P.A. Heavy Oil and Natural Bitumen Resources in Geological Basins of the World; U.S. Geological Survey: Reston, VA, USA, 2007.
- Maini, B.; Busahmin, B. Foamy oil flow and its role in heavy oil production. AIP Conf. Proc. 2010, 1254, 103–108. [Google Scholar]
- Mai, A.; Bryan, J.; Goodarzi, N.; Kantzas, A. Insights into non-thermal recovery of heavy oil. J. Can. Pet. Technol. 2009, 48, 27–35. [Google Scholar] [CrossRef]
- Mu, L. Development actualities and characteristics of the Orinoco heavy oil belt, Venezuela. Pet. Explor. Dev. 2010, 37, 338–343. [Google Scholar]
- Alshmakhy, A.B.; Maini, B. Effect of foaminess on the performance of solution gas drive in heavy oil reservoirs. In Proceedings of the Canadian International Petroleum Conference, Calgary, AB, Canada, 12–14 June 2007; Petroleum Society of Canada: Calgary, AB, Canada, 2007. [Google Scholar]
- Sun, X.; Dong, M.; Zhang, Y.; Maini, B. Enhanced heavy oil recovery in thin reservoirs using foamy oil-assisted methane huff-n-puff method. Fuel 2015, 159, 962–973. [Google Scholar] [CrossRef]
- Smith, G.E. Fluid flow and sand production in heavy oil reservoirs under solution gas drive. In Proceedings of the 56th California Regional Meeting of the Society of Petroleum Engineers, Oakland, CA, USA, 2−4 April 1986. [Google Scholar]
- Maini, B.B.; Sarma, H.K.; George, A.E. Significance of foamy oil behavior in primary production of heavy oils. J. Can. Pet. Technol. 1993, 32, 50–56. [Google Scholar] [CrossRef]
- Shi, Y.; Yang, D. Experimental and theoretical quantification of nonequilibrium phase behavior and physical properties of foamy oil under reservoir conditions. J. Energy Resour. Technol. 2017, 139, 062902. [Google Scholar] [CrossRef]
- Liu, S.; Sun, X.; Li, S. Foamy oil recovery mechanism in cold production process of super heavy oil in Venezuela MPE-3 block. Spec. Oil Gas Reserv. 2011, 18, 102–104. [Google Scholar]
- Oskouei, J.; Zadeh, A.; Gates, I. A new kinetic model for non-equilibrium dissolved gas ex-solution from static heavy oil. Fuel 2017, 204, 12–22. [Google Scholar] [CrossRef]
- Or, C.; Sasaki, K.; Sugai, Y.; Nakano, M.; Imai, M. Experimental study on foamy viscosity by analysing CO2 micro-bubbles in hexadecane. Int. J. Oil Gas Coal Eng. 2014, 2, 11–18. [Google Scholar] [CrossRef]
- Abusahmin, B.S.; Karri, R.R.; Maini, B.B. Influence of fluid and operating parameters on the recovery factors and gas oil ratio in high viscous reservoirs under foamy solution gas drive. Fuel 2017, 197, 497–517. [Google Scholar] [CrossRef]
- Liu, P.; Wu, Y.; Li, X. Experimental study on the stability of the foamy oil in developing heavy oil reservoirs. Fuel 2013, 111, 12–19. [Google Scholar] [CrossRef]
- Li, S.; Li, Z.; Lu, T.; Li, B. Experimental Study on Foamy Oil Flow in Porous Media with Orinoco Belt Heavy Oil. Energy Fuels 2012, 26, 6332–6342. [Google Scholar] [CrossRef]
- Alshmakhy, A.; Maini, B.B. Effects of gravity, foaminess, and pressure drawdown on primary-depletion recovery factor in heavy-oil systems. J. Can. Pet. Technol. 2012, 51, 449–456. [Google Scholar] [CrossRef]
- Ostos, A.N.; Maini, B.B. An integrated experimental study of foamy oil flow during solution gas drive. In Proceedings of the Canadian International Petroleum Conference, Calgary, AB, Canada, 10–12 June 2003. [Google Scholar]
- Sheikha, H.; Pooladi-Darvish, M. The effect of pressure-decline rate and pressure gradient on the behavior of solution-gas drive in heavy oil. SPE Reserv. Eval. Eng. 2009, 12, 390–398. [Google Scholar] [CrossRef]
- Du, Z.; Zeng, F.; Peng, X.; Chan, C. Optimizing the pressure decline rate on the cyclic solvent injection process for enhanced heavy oil recovery. J. Pet. Sci. Eng. 2016, 145, 629–639. [Google Scholar] [CrossRef]
- Zhou, X.; Yuan, Q.; Zeng, F.; Zhang, L.; Jiang, S. Experimental study on foamy oil behavior using a heavy oil‒methane system in the bulk phase. J. Pet. Sci. Eng. 2017, 158, 309–321. [Google Scholar] [CrossRef]
- Zhou, X.; Zeng, F.; Zhang, L.; Wang, H. Foamy oil flow in heavy oil–solvent systems tested by pressure depletion in a sandpack. Fuel 2016, 171, 210–223. [Google Scholar] [CrossRef]
- Bondino, I.; McDougall, S.R.; Hamon, G. A pore-scale modelling approach to the interpretation of heavy oil pressure depletion experiments. J. Pet. Sci. Eng. 2009, 65, 14–22. [Google Scholar] [CrossRef]
- Li, S.; Li, Z.; Wang, Z. Experimental study on the performance of foamy oil flow under different solution gas–oil ratios. RSC Adv. 2015, 5, 66797–66806. [Google Scholar] [CrossRef]
- Chen, J.Z.; Maini, B.B. Numerical simulation of foamy oil depletion tests. In Proceedings of the Canadian International Petroleum Conference, Calgary, AB, Canada, 7–9 June 2005; Petroleum Society of Canada: Calgary, AB, Canada, 2005. [Google Scholar]
- Tang, G.; Firoozabadi, A. Effect of GOR Temperature and Initial Water Saturation on Solution-Gas Drive in Heavy-Oil Reservoirs. SPE J. 2005, 10, 34–43. [Google Scholar] [CrossRef]
- Lu, T.; Li, Z.; Li, S.; Liu, S.; Li, X.; Wang, P.; Wang, Z. Behaviors of foamy oil flow in solution gas drive at different temperatures. Transp. Porous Media 2015, 109, 25–42. [Google Scholar] [CrossRef]
- Li, S.; Li, Z. Effect of Temperature on the Gas/Oil Relative Permeability of Orinoco Belt Foamy Oil. SPE J. 2016, 21, 170–179. [Google Scholar] [CrossRef]
- Wang, J.; Yuan, Y.; Zhang, L.; Wang, R. The influence of viscosity on stability of foamy oil in the process of heavy oil solution gas drive. J. Pet. Sci. Eng. 2009, 66, 69–74. [Google Scholar] [CrossRef]
- Blázquez, C.; Dalmazzone, C.; Emond, E.; Schneider, S. Crude oil foams. Part 1–A novel methodology for studying non-aqueous foams formed by depressurization. Fuel 2016, 171, 224–237. [Google Scholar]
- Liu, P.; Mu, Z.; Li, W.; Wu, Y.; Li, X. A new mathematical model and experimental validation on foamy-oil flow in developing heavy oil reservoirs. Sci. Rep. 2017, 7, 8534. [Google Scholar] [CrossRef] [PubMed]
- Bera, A.; Babadagli, T. Relative permeability of foamy oil for different types of dissolved gases. Spe Reserv. Eval. Eng. 2016, 19, 604–619. [Google Scholar] [CrossRef]
- Adil, I.; Maini, B.B. Role of asphaltenes in foamy oil flow. J. Can. Pet. Technol. 2007, 46, 18–23. [Google Scholar] [CrossRef]
- Kumar, R.; Mahadevan, J. Well-performance relationships in heavy-foamy-oil reservoirs. SPE Prod. Oper. 2012, 27, 94–105. [Google Scholar] [CrossRef]
- Peng, J.; Tang, G.; Kovscek, A.R. Oil chemistry and its impact on heavy oil solution gas drive. J. Pet. Sci. Eng. 2009, 66, 47–59. [Google Scholar] [CrossRef]
- Busahmin, B.; Maini, B.; Karri, R.R.; Sabet, M. Studies on the stability of the foamy oil in developing heavy oil reservoirs. In Defect and Diffusion Forum; Trans Tech Publications: Princeton, NJ, USA, 2016; Volume 371, pp. 111–116. [Google Scholar]
- Rane, J.P.; Harbottle, D.; Pauchard, V.; Couzis, A.; Banerjee, S. Adsorption kinetics of asphaltenes at the oil–water interface and nanoaggregation in the bulk. Langmuir 2012, 28, 9986–9995. [Google Scholar] [CrossRef] [PubMed]
- Sun, X.; Zhang, Y.; Gai, Z.; Zhao, H.; Chen, G.; Song, Z. Comprehensive experimental study of the interfacial stability of foamy oil and identification of the characteristic responsible for foamy oil formation. Fuel 2019, 238, 514–525. [Google Scholar] [CrossRef]
- Poteau, S.; Argillier, J.F.; Langevin, D.; Pincet, F.; Perez, E. Influence of pH on stability and dynamic properties of asphaltenes and other amphiphilic molecules at the oil−water interface. Energy Fuels 2005, 19, 1337–1341. [Google Scholar] [CrossRef]
- Zaki, N.N.; Poindexter, M.K.; Kilpatrick, P.K. Factors contributing to petroleum foaming. 2. Synthetic crude oil systems. Energy Fuels 2002, 16, 711–717. [Google Scholar] [CrossRef]
Figure 1.
Schematic diagram of depletion experiment in the sandpack and micromodel.

Figure 2.
Schematic of the pendant drop tensiometer.

Figure 3.
Production behavior for the ten depletion experiments. (a) Change in average pressure with time. (b) Change in production gas–oil ratio with average pressure. (c) Change in oil recovery with average pressure.
Figure 3.
Production behavior for the ten depletion experiments. (a) Change in average pressure with time. (b) Change in production gas–oil ratio with average pressure. (c) Change in oil recovery with average pressure.


Figure 4.
Characteristics for foamy oil depletion development (taking test 1 as an example).

Figure 5.
Characteristics for weak foamy oil depletion development (taking test 7 as an example).

Figure 6.
Characteristics for conventional solution gas drive (taking test 8 as an example).

Figure 7.
Effect of oil viscosity and asphaltene on bubble pressure and pseudo-bubble pressure.

Figure 8.
Effect of oil viscosity and asphaltene on the total recovery and the recovery of each stage.
Figure 8.
Effect of oil viscosity and asphaltene on the total recovery and the recovery of each stage.

Figure 9.
Flow characteristic of each type of depletion development: (a) foamy oil depletion development; (b) weak foamy oil depletion development; (c) conventional solution gas drive.
Figure 9.
Flow characteristic of each type of depletion development: (a) foamy oil depletion development; (b) weak foamy oil depletion development; (c) conventional solution gas drive.

Figure 10.
A continuous process whereby the bubble goes through a pore throat and then splits into small bubbles: (a) bubble deforms; (b) bubble is elongated; (c) bubble gets thinner; (d) bubble splits.
Figure 10.
A continuous process whereby the bubble goes through a pore throat and then splits into small bubbles: (a) bubble deforms; (b) bubble is elongated; (c) bubble gets thinner; (d) bubble splits.

Figure 11.
A continuous process whereby bubbles coalesce: (a) bubbles come across; (b–d) bubbles coalesce.
Figure 11.
A continuous process whereby bubbles coalesce: (a) bubbles come across; (b–d) bubbles coalesce.

Figure 12.
Changes in viscoelastic moduli with viscosity: (a) asphaltenic oil; (b) deasphalted oil.

Figure 13.
Effect of asphaltene on the elastic modulus and viscous modulus at different viscosities: (a) elastic modulus; (b) viscous modulus.
Figure 13.
Effect of asphaltene on the elastic modulus and viscous modulus at different viscosities: (a) elastic modulus; (b) viscous modulus.

Figure 14.
Viscoelastic modulus and the performance of depletion experiments of the ten oil samples.
Figure 14.
Viscoelastic modulus and the performance of depletion experiments of the ten oil samples.

Figure 15.
Schematic showing how asphaltene plays a protective role akin to armor on the bubble film.
Figure 15.
Schematic showing how asphaltene plays a protective role akin to armor on the bubble film.

Figure 16.
Schematic showing how interactions between the asphaltene on the bubble film and on the surface of porous media promote the bubble to deform and stretch. (a) Interlacement between the asphaltenes on the bubble film and on the surface of porous media; (b) Bubble deformation and stretch happens due to the interlacement.


Table 1.
Properties of the five dead oils.
| Item | Oil A | Oil B | Oil C | Oil D | Oil E |
|---|---|---|---|---|---|
| Viscosity at 50 °C (mPa·s) | 87,685 | 52,130 | 13,530 | 4763 | 1530 |
| Density at 50 °C (kg/m3) | 991.8 | 976.5 | 950.2 | 943.3 | 915.6 |
| Saturate content (%) | 23.22 | 22.25 | 30.26 | 33.75 | 34.11 |
| Aromatic content (%) | 28.31 | 42.51 | 35.25 | 34.75 | 43.78 |
| Resin content (%) | 37.92 | 23.73 | 25.86 | 21.68 | 15.35 |
| Asphaltene content (%) | 10.55 | 13.51 | 8.63 | 7.82 | 6.76 |
Table 2.
Properties of the ten oil samples used in the work.
| No. | Oil | Treatment | Viscosity at 50 °C after Treatment (mPa·s) | Asphaltene Content after Treatment (%) |
|---|---|---|---|---|
| 1 | A | Deasphalted | 11,650 | 0 |
| 2 | Dilution | 11,580 | 6.68 | |
| 3 | B | Deasphalted | 5560 | 0 |
| 4 | Dilution | 5608 | 7.83 | |
| 5 | C | Deasphalted | 2270 | 0 |
| 6 | Dilution | 2250 | 6.15 | |
| 7 | D | Deasphalted | 875 | 0 |
| 8 | Dilution | 863 | 5.97 | |
| 9 | E | Deasphalted | 330 | 0 |
| 10 | Dilution | 352 | 5.66 |
Table 3.
Parameters for sandpack depletion experiments.
| No. | Porosity (%) | Permeability (mD) | Initial Oil Saturation (%) | Corresponding Oil Sample |
|---|---|---|---|---|
| 1 | 38.64 | 10,040 | 88.67 | 1 |
| 2 | 38.13 | 9860 | 89.54 | 2 |
| 3 | 37.38 | 9588 | 88.60 | 3 |
| 4 | 37.87 | 9730 | 87.75 | 4 |
| 5 | 37.11 | 9950 | 89.11 | 5 |
| 6 | 38.07 | 9985 | 88.36 | 6 |
| 7 | 37.66 | 9863 | 88.71 | 7 |
| 8 | 37.52 | 9855 | 88.20 | 8 |
| 9 | 38.27 | 10,135 | 89.62 | 9 |
| 10 | 37.92 | 9880 | 87.68 | 10 |
© 2019 by the authors. Licensee MDPI, Basel, Switzerland. This article is an open access article distributed under the terms and conditions of the Creative Commons Attribution (CC BY) license (http://creativecommons.org/licenses/by/4.0/).
Share and Cite
MDPI and ACS Style
Wang, Z.; Li, Z.; Lu, T. Experimental Study and Mechanism Analysis of the Effect of Oil Viscosity and Asphaltene on Foamy Oil. Energies 2019, 12, 761. https://0-doi-org.brum.beds.ac.uk/10.3390/en12040761
AMA Style
Wang Z, Li Z, Lu T. Experimental Study and Mechanism Analysis of the Effect of Oil Viscosity and Asphaltene on Foamy Oil. Energies. 2019; 12(4):761. https://0-doi-org.brum.beds.ac.uk/10.3390/en12040761
Chicago/Turabian StyleWang, Zhuangzhuang, Zhaomin Li, and Teng Lu. 2019. "Experimental Study and Mechanism Analysis of the Effect of Oil Viscosity and Asphaltene on Foamy Oil" Energies 12, no. 4: 761. https://0-doi-org.brum.beds.ac.uk/10.3390/en12040761
Note that from the first issue of 2016, this journal uses article numbers instead of page numbers. See further details here.