Assessment of Energy Efficiency and Its Determinants for Drinking Water Treatment Plants Using A Double-Bootstrap Approach


1
Departamento de Ingeniería Hidráulica y Ambiental, Pontificia Universidad Católica de Chile, Av. Vicuña Mackenna 4860, Santiago, Chile
2
Centro de Desarrollo Urbano Sustentable CONICYT/FONDAP/15110020, Av. Vicuña Mackenna 4860, Santiago, Chile
3
Departamento de Matemáticas para la Economía y la Empresa, Universidad de Valencia, Avd. Tarongers S/N, 46023 Valencia, Spain
*
Author to whom correspondence should be addressed.
Energies 2019, 12(4), 765; https://0-doi-org.brum.beds.ac.uk/10.3390/en12040765
Submission received: 21 January 2019
/
Revised: 17 February 2019
/
Accepted: 19 February 2019
/
Published: 25 February 2019
(This article belongs to the Special Issue Environmental and Energy Efficiency Evaluation Based on Data Envelopment Analysis (DEA))
Abstract
:To achieve energy and climate goals, the energy performance of current and future drinking water treatment plants (DWTPs) must be improved. A few studies have evaluated the energy efficiency of these facilities using data envelopment analysis (DEA), however, they have ignored the deterministic nature of the DEA method. To overcome this limitation, a double-bootstrap DEA approach was used in this study to estimate the energy efficiency of DWTPs. For a sample of Chilean DWTPs, bias-corrected energy efficiency scores were computed with consideration of data variability, and the determinants of DWTP energy efficiency were explored. Most DWTPs in the sample had much room for the improvement of energy efficiency. In the second stage of analysis, facility age, the volume of water treated, and the technology used for treatment were found to influence DWTP energy efficiency. These findings demonstrate the importance of using a reliable and robust method to evaluate the energy efficiency of DWTPs, which is essential to support decision making and to benchmark these facilities’ energy performance.
1. Introduction
In the context of climate change, energy demand for urban water supplies has emerged as a relevant issue [1]. In the future, more energy is expected to be required to treat and supply drinking water to citizens due to the adaption of water systems to the effects of climate change and to new regulatory requirements. Goal 6 of the Sustainable Development Goals adopted by the United Nations (UN) in 2015 involves the achievement of universal and equitable access to safe and affordable drinking water for all by 2030. The achievement of this goal will require the construction of many more drinking water treatment plants (DWTPs), which will increase the amount of energy required for drinking water supplies worldwide.
Urban water utilities use energy to extract, convey, treat, and distribute drinking water. Previous studies have focused on the evaluation of energy requirements for one or several activities in the urban water cycle. Several studies have focused on the quantification and evaluation of the economic and environmental effects of energy use to supply drinking water to major cities and on the comparison of energy use among cities and countries [2,3]. Other studies have involved a more detailed analysis of individual drinking-water supply stages and quantification of the energy required to treat raw water, i.e., the energy used by DWTPs [4]. The aim of these studies was to quantify and compare the energy intensity of DWTPs, that is, the energy consumed (kWh) per unit volume (m3) of drinking water produced (kWh/m3) [5]. However, as Santana et al. [6] and Molinos-Senante and Sala-Garrido [7] determined, the energy required to treat raw water depends on several factors, including the quality of the raw water and of drinking water standards, as well as the water treatment technology used. Sowby and Burian [8] also emphasized this issue; after analyzing the energy requirements for drinking water supplies in 109 cities in the United States, they concluded that energy intensity is an overly simplistic metric that is not adequate for the comparison of DWTP performance.
To overcome the comparability limitation and to facilitate benchmarking between DWTPs, a few studies have focused on evaluating DWTP energy efficiency. Molinos-Senante and Sala-Garrido [9] defined energy efficiency as a “synthetic index that incorporates both the quality of the raw water being processed and the energy required to treat it.” Although several methods can be used to estimate the energy efficiency of DWTPs, data envelopment analysis (DEA) has been used in the few studies conducted to date. DEA is a non-parametric method based on mathematical programming techniques that integrates multiple inputs (energy use) and outputs (concentrations of several pollutants removed from raw water and the volume of treated water) into a synthetic index; namely, the energy efficiency score. Molinos-Senante and Guzman [10] computed the energy efficiency of a sample of DWTPs using the DEA approach, investigating the presence of economies of scale in these facilities. Applying the more advanced metafrontier DEA model, Molinos-Senante and Sala-Garrido [9] compared energy efficiency among DWTPs using different treatment technologies. Recently, Ananda [11,12] computed the environmental efficiency and productivity change of a sample of 49 Australian urban water utilities using DEA, with a focus on economic issues, but integration of greenhouse gas emissions as undesirable outputs.
These studies [9,10,11,12] contributed to the literature by providing estimated energy efficiency scores for DWTPs derived from the application of a holistic and integrated approach. However, they have ignored the deterministic nature of the DEA methodology; as statistical inferences cannot be drawn from conventional DEA (energy) efficiency scores [11] and regression analysis cannot be conducted to explore the determinants of previously estimated scores [12]. Moreover, conventional DEA models do not integrate data variability into the (energy) efficiency assessment, which negatively impacts the robustness and reliability of the results.
In the framework of efficiency assessment, two main alternative methodological approaches have been proposed to explore the causality between factors and efficiency scores. Cazals et al. [13] proposed the method, in which a fraction of the sample is used to estimate efficiency scores. However, selection of the m value is challenging, and it affects efficiency scores [14]. Alternatively, Simar and Wilson [15] proposed a double-bootstrap DEA procedure for the estimation of efficiency scores that overcomes the two main limitations of conventional DEA models; i.e., it allows exploration of the determinants or factors affecting efficiency scores [16], and it permits bias correction and the calculation of confidence intervals for the scores. Despite the relevance of this type of analysis, the bootstrap approach has not been used to evaluate the energy efficiency of DWTPs.
Against this background, the objectives of this study were twofold. The first objective was to assess the energy efficiency of a sample of DWTPs with consideration of data variability, i.e., to estimate bias-corrected energy efficiency scores and their confidence intervals. The second objective was to explore the determinants DWTP energy efficiency. To do so, we employed the double-bootstrap DEA approach proposed by Simar and Wilson [17]. Empirical application was performed with a large sample (n = 146) of Chilean DWTPs. Although many scholars have examined the energy intensity of urban water cycle activities in recent times, few studies have assessed the energy efficiency of water treatment plants and none has involved the application of a robust methodological approach such as double-bootstrap DEA. This paper contributes to the current body of literature in the water–energy nexus field by presenting for the first time bias-corrected energy efficiency scores and discussing factors affecting the energy efficiency of a sample of DWTPs.
2. Methods
2.1. Energy Efficiency Estimation
Conventional DEA models, such as those proposed by Charnes et al. [18] and Banker et al. [19] (the CCR (Charnes, Cooper and Rhodes) and BCC (Banker, Charnes and Cooper), respectively) and subsequent developments, have been employed widely to evaluate the efficiency of water treatment facilities, such as WWTPs and DWTPs. DEA models can be used with a constant returns to scale (CRS) or variable returns to scale (VRS) technique. With the CRS approach, outputs increase in proportion to inputs, and producers (DWTPs in this case) are assumed to be able to linearly scale inputs and outputs without changing efficiency. By contrast, with the VRS approach, an increase or decrease in input or output does not result in a proportional change in outputs or inputs, respectively. Previous studies [1,5] have shown that the energy consumed by DWTPs to produce drinking water does not depend linearly on the pollutants removed from raw water. Hence, in this study, and as in Molinos-Senante and Sala-Garrido’s studies [9], a VRS DEA model was employed to evaluate DWTP energy efficiency.
Moreover, DEA models can have an input or output orientation, depending on whether the aim of the units analyzed (DWTPs) is to minimize the use of inputs or to maximize the production of outputs. In this case study, an input orientation was adopted because the main objective of DWTPs is to produce drinking water that complies with the legal quality standards using minimum energy. The quantity of pollutants to be removed depends on the quality of the raw water and the thresholds defined by drinking water standards, which are external to the water utilities.
Let us assume that we have a set of DWTPs, , each using a vector of M inputs, to produce a vector of outputs, . Assuming VRS technology, the input-oriented DEA model is denoted as follows:
where is the energy efficiency score of the DWTP evaluated, M is the number of inputs considered, S is the number of outputs produced, N is the number of DWTPs evaluated, and is a set of intensity variables representing the weighting of each DWTP evaluated, , in the composition of the efficient frontier.
The energy efficiency score () ranges from 0 to 1. A DWTP is energy efficient when and inefficient when . For an energy-inefficient DWTP, the value of informs us about the potential for energy savings, as it is the proportional input (energy consumption in this study) that can be achieved by DWTP , given the level of outputs produced.
2.2. Double-Bootstrap DEA Model
The double-bootstrap DEA model proposed by Simar and Wilson [15] is based on the simulation of sample distribution by mimicking of the data-generation process (DGP). Assuming that the original data sample was generated by the DGP, energy efficiency scores are re-computed with the simulated data [19]. In other words, the bootstrapping procedure generates new data that is used to re-estimate energy efficiency scores using Equation (1). Then, the distinction between the true and estimated frontiers allows for statistical inference in DEA, i.e., for the identification of determinants of energy efficiency [20].
The double-bootstrap procedure employed in this study is Algorithm 2 of Simar and Wilson’s model [20], summarized as follows:
- Estimate the energy efficiency scores, for all DWTPs in the sample using Equation (1).
- Carry out a truncated maximum likelihood estimation to regress energy efficiency scores against a set of explanatory variables , , and provide an estimate of the coefficient vector and estimate of , the standard deviation of the residual errors .
- For each DWTP, repeat the following four steps (3.1–3.4) times to obtain a set of bootstrap estimates for .
- 3.1
- Generate the residual error, from the normal distribution .
- 3.2
- Compute .
- 3.3
- Generate a pseudo data set where .
- 3.4
- Using the pseudo data set and Equation (1), calculate the pseudo energy efficiency estimates, .
- Calculate the bias-corrected estimator, , for each DWTP, using the bootstrap estimator or the bias where and .
- Use the truncated maximum likelihood estimation to regress on the explanatory variables, , and provide an estimate for and an estimate for .
- Repeat the following three steps (6.1–6.3) times to obtain a set of pairs of bootstrap estimates for .
- 6.1
- Generate the residual error from the normal distribution .
- 6.2
- Calculate .
- 6.3
- Use the truncated maximum likelihood estimation to regress on the explanatory variables, , and provide an estimate for and an estimate for .
- Construct the estimated confidence interval of the -th element, , of the vector , that is, with .
3. Sample and Variables
Chile is a long country whose extension is 4300 km. Hence, from a hydrometeorological point of view, Chile is a diverse country with significant precipitation variability throughout the country, increasing more than 500% from the North to the Austral region. Water runoff is also heterogeneous and varies from 510 m3/person/year to 2,300,000 m3/person/year. This diversity is expected to be accentuated by climate change, which will affect Chile in a complex fashion, with increased temperatures throughout the country and decreased precipitation in the Central and Southern areas of the country [21].
For empirical application, a sample of 146 Chilean DWTPs was used. All of the facilities were operated by private water companies, as the Chilean water industry was privatized between 1998 and 2004. The drinking water produced by all DWTPs must meet the quality standards of national norm NCh 409, which is based on the guidelines for drinking water quality published periodically by the World Health Organization (WHO) [22]. The quality of the drinking water supplied to citizens is monitored by water companies and the water regulation agency (Superintendencia de Servicios Sanitarios).
The energy consumed to treat raw water, expressed in kWh/year, was selected as the input; i.e., as the variable that DWTPs should minimize to improve energy performance. Following Molinos-Senante and Guzmán [10], the assessment of energy efficiency focused on DWTPs, without consideration of the energy used for groundwater pumping and raw water transport from the natural and artificial reservoirs to the DWTP.
In the assessment of water utility efficiency, the outputs selected should summarize the utilities’ main function [23]. In this case study, the main function of DWTPs was considered to be the production of drinking water that met the NCh 409 quality standards. Moreover, the energy consumed by DWPTs (in kWh/year) depends not only on the volume of drinking water produced, but also on the pollutants removed, i.e., on the quality of the raw water and drinking water produced [12]. Hence, following the approach applied in previous studies [24,25] four quality-adjusted outputs (QAOs) were considered to assess DWTP energy efficiency, defined as follows:
where V is the volume of drinking water produced (in m3/year), is the concentration of pollutant in the influent of the DWTP, and is the concentration of pollutant in the effluent of the DWTP. Molinos-Senante and Sala-Garrido [7] defined energy intensity as the “energy consumed (kWh) per unit volume (m3) of drinking water produced”. These authors developed energy intensity functions for DWTPs using parametric regression analysis to identify the main drivers of energy use in DWTPs. They concluded that energy intensity of DWTPs depended on the capacity of the facility and the removal efficiency of i) turbidity, ii) arsenic, iii) total dissolved solids, and iv) sulfates. Hence, these four pollutants were considered in this study as QAOs.
According to Sanders and Webber [26], the energy efficiency of a given water treatment technology correlates with the size, concentrations, and nature of the pollutants to be removed. Other factors, such as the water company operating the facility or the age of the DWTP, might also impact energy efficiency [9]. Based on previous studies [4,27], four variables were included as potential determinants of DWTP energy efficiency scores: i) DWTP age, ii) raw water source, iii) ownership of the company operating the DWTP, and iv) type of treatment.
Table 1 shows the main statistics for the variables (input, outputs, and factors underlying efficiency) used in this empirical application.
4. Results and Discussion
4.1. Estimated Energy Efficiency
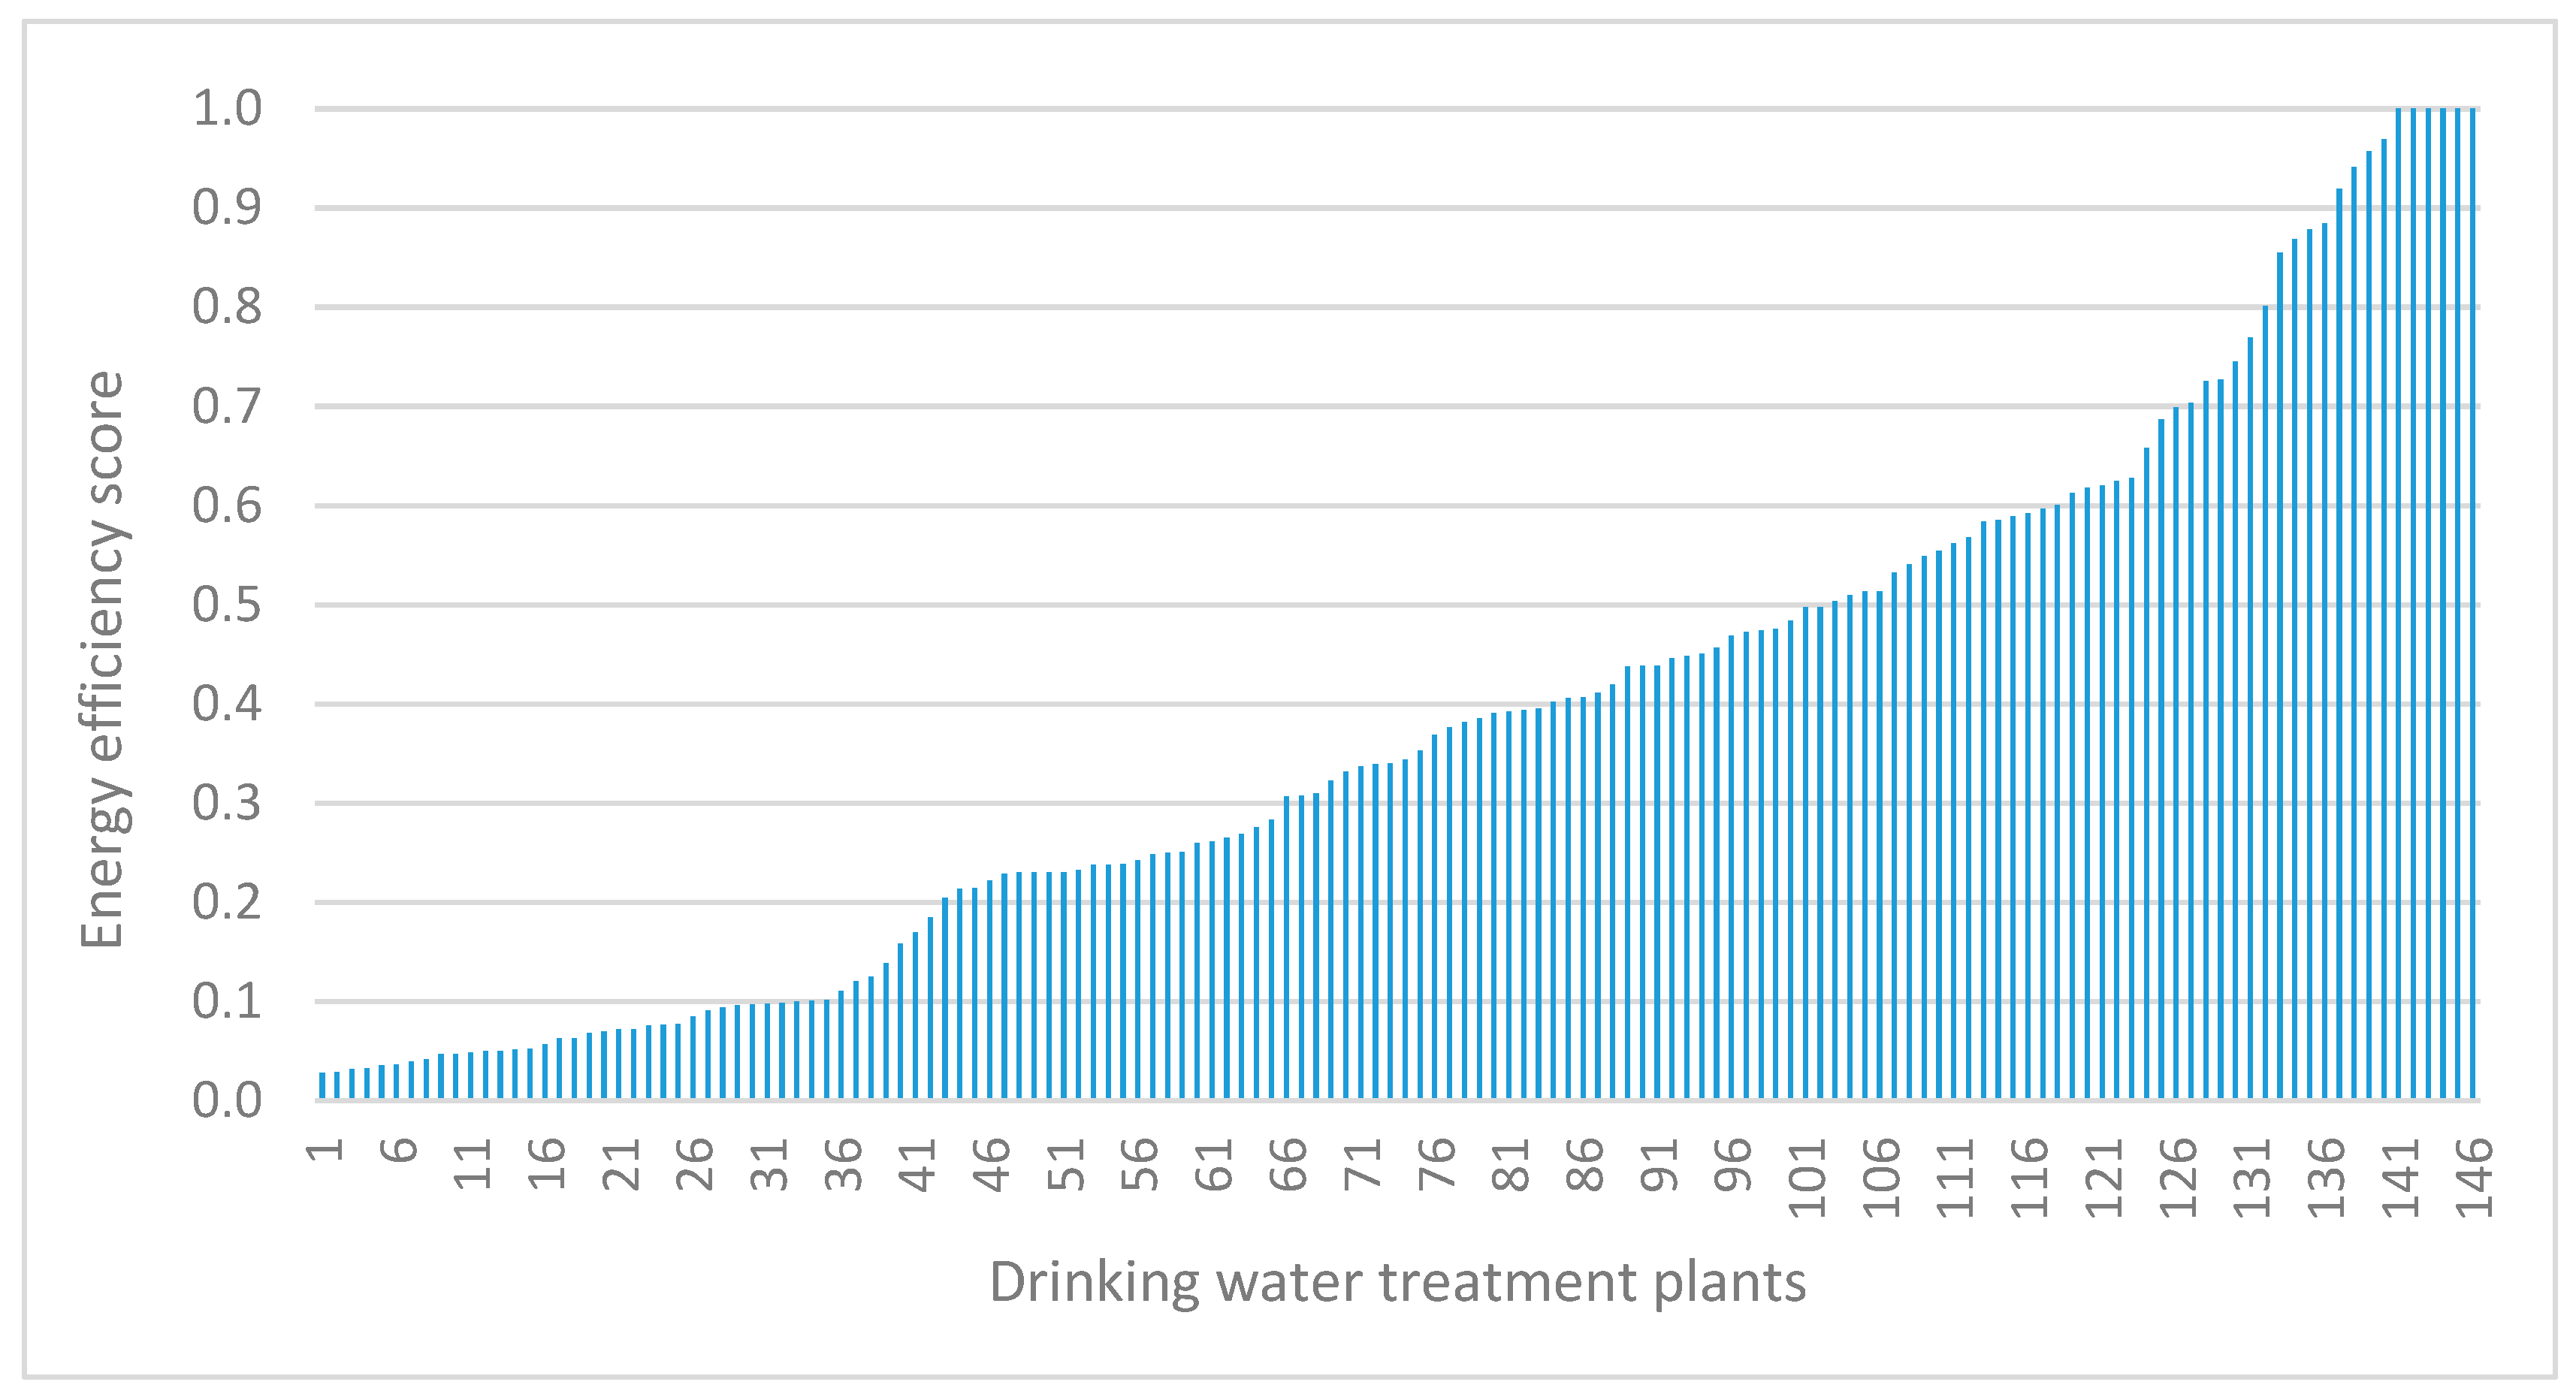
The energy efficiency of each DWTP was estimated following the methodological approach described in Section 2.1., i.e., by employing Equation (1). According to the energy efficiency scores calculated with the original data, 6 of 146 (4.1%) DWTPs were energy efficient (Figure 1). These DWTPs formed the best practice frontier, as they used the minimum quantity of energy given their efficiency of pollutant removal compared with the other DWTPs evaluated. The mean energy efficiency of the DWTPs assessed was 0.38, meaning that on average they could reduce the energy consumed by 62% while retaining output production if they were operated as energy-efficient facilities. The average energy efficiency seems to be low, but this result is consistent with those of previous studies. Molinos-Senante and Guzmán [10] and Hernández-Sancho et al. [28] reported average energy efficiencies of 0.45 and 0.31 for samples of Chilean DWTPs and Spanish WWTPs, respectively. The results of this study confirmed in general that the water treatment facilities had notable room for energy saving. Moreover, the sample of DWTPs evaluated was very heterogeneous in terms of energy efficiency (Figure 1); almost one-third (42 of 146) of the facilities had energy efficiency scores <0.2, indicating dramatically poor energy performance and thus much improvement potential.
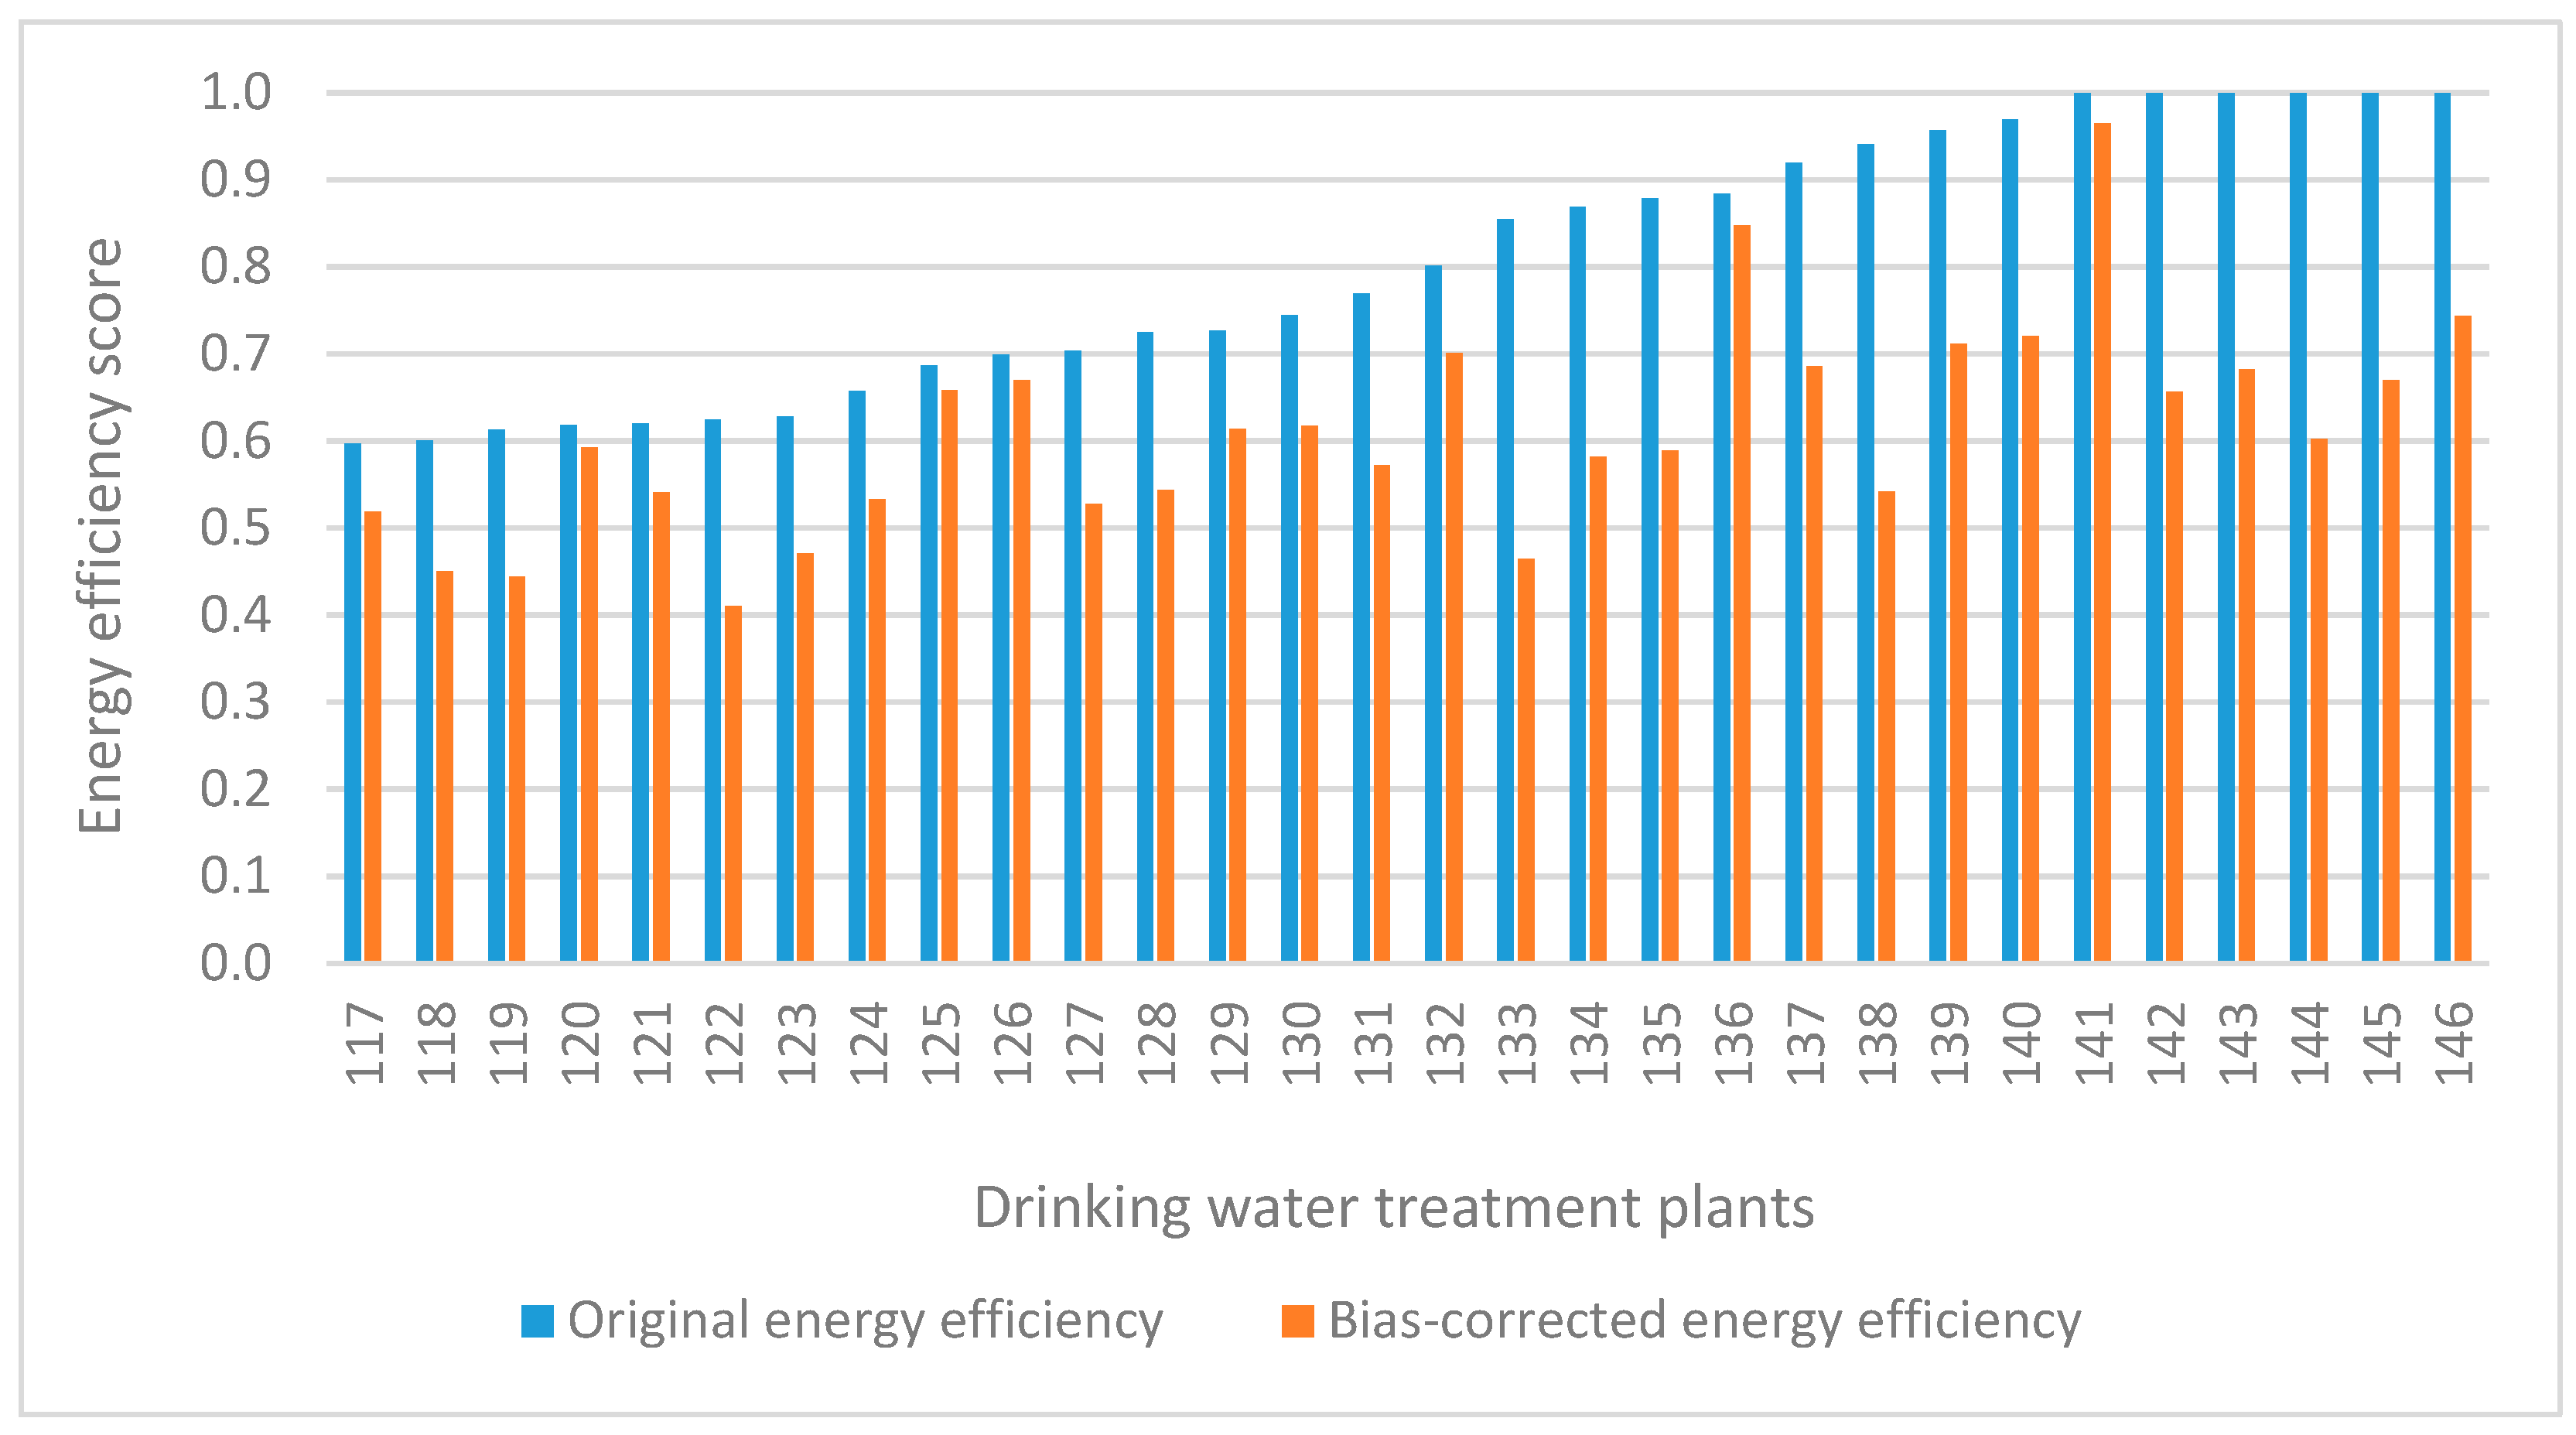
As reported in Section 2.2, to compute bias-corrected energy efficiency scores and bootstrap 95% confidence intervals, 2000 bootstrap samples were generated. The original and bias-corrected bootstrap energy efficiency estimates are compared in Figure 2. To facilitate comparison, only results for the 30 DWTPs with the highest original energy efficiency scores are presented. Detailed information for all DWTPs evaluated is provided in the Supplementary Materials. As expected from a theoretical point of view [12,16,29], the bias signs were negative (bias-corrected energy efficiency scores were lower than original scores) for the 146 DWTPs assessed. The average bias-corrected energy efficiency score was 0.28, meaning that DWTPs could conserve 71% of the energy currently used while maintaining output generation if they were operated as energy-efficient facilities. The difference between the bias-corrected and original energy efficiency scores reflects the limitations of the traditional DEA model, which does not integrate data variability in efficiency assessment. Although the difference in average scores was not large, it altered the ranking of DWTPs (Figure 2). For example, DWTP 144 was ranked first based on the original energy efficiency score (1), but 15th of the 30 DWTPs listed in Figure 2 based on the bias-corrected score. Under both methodological approaches, DWTP 141 was ranked first, showing that it was the most energy efficient facility in the sample. It is one of the largest facilities evaluated and it employs rapid gravity filters to treat raw water. To verify that the DWTP ranking differed statistically according to the DEA model used, the non-parametric Mann–Whitney test was performed. The value was <0.01, reflecting a strongly significant difference in ranking.
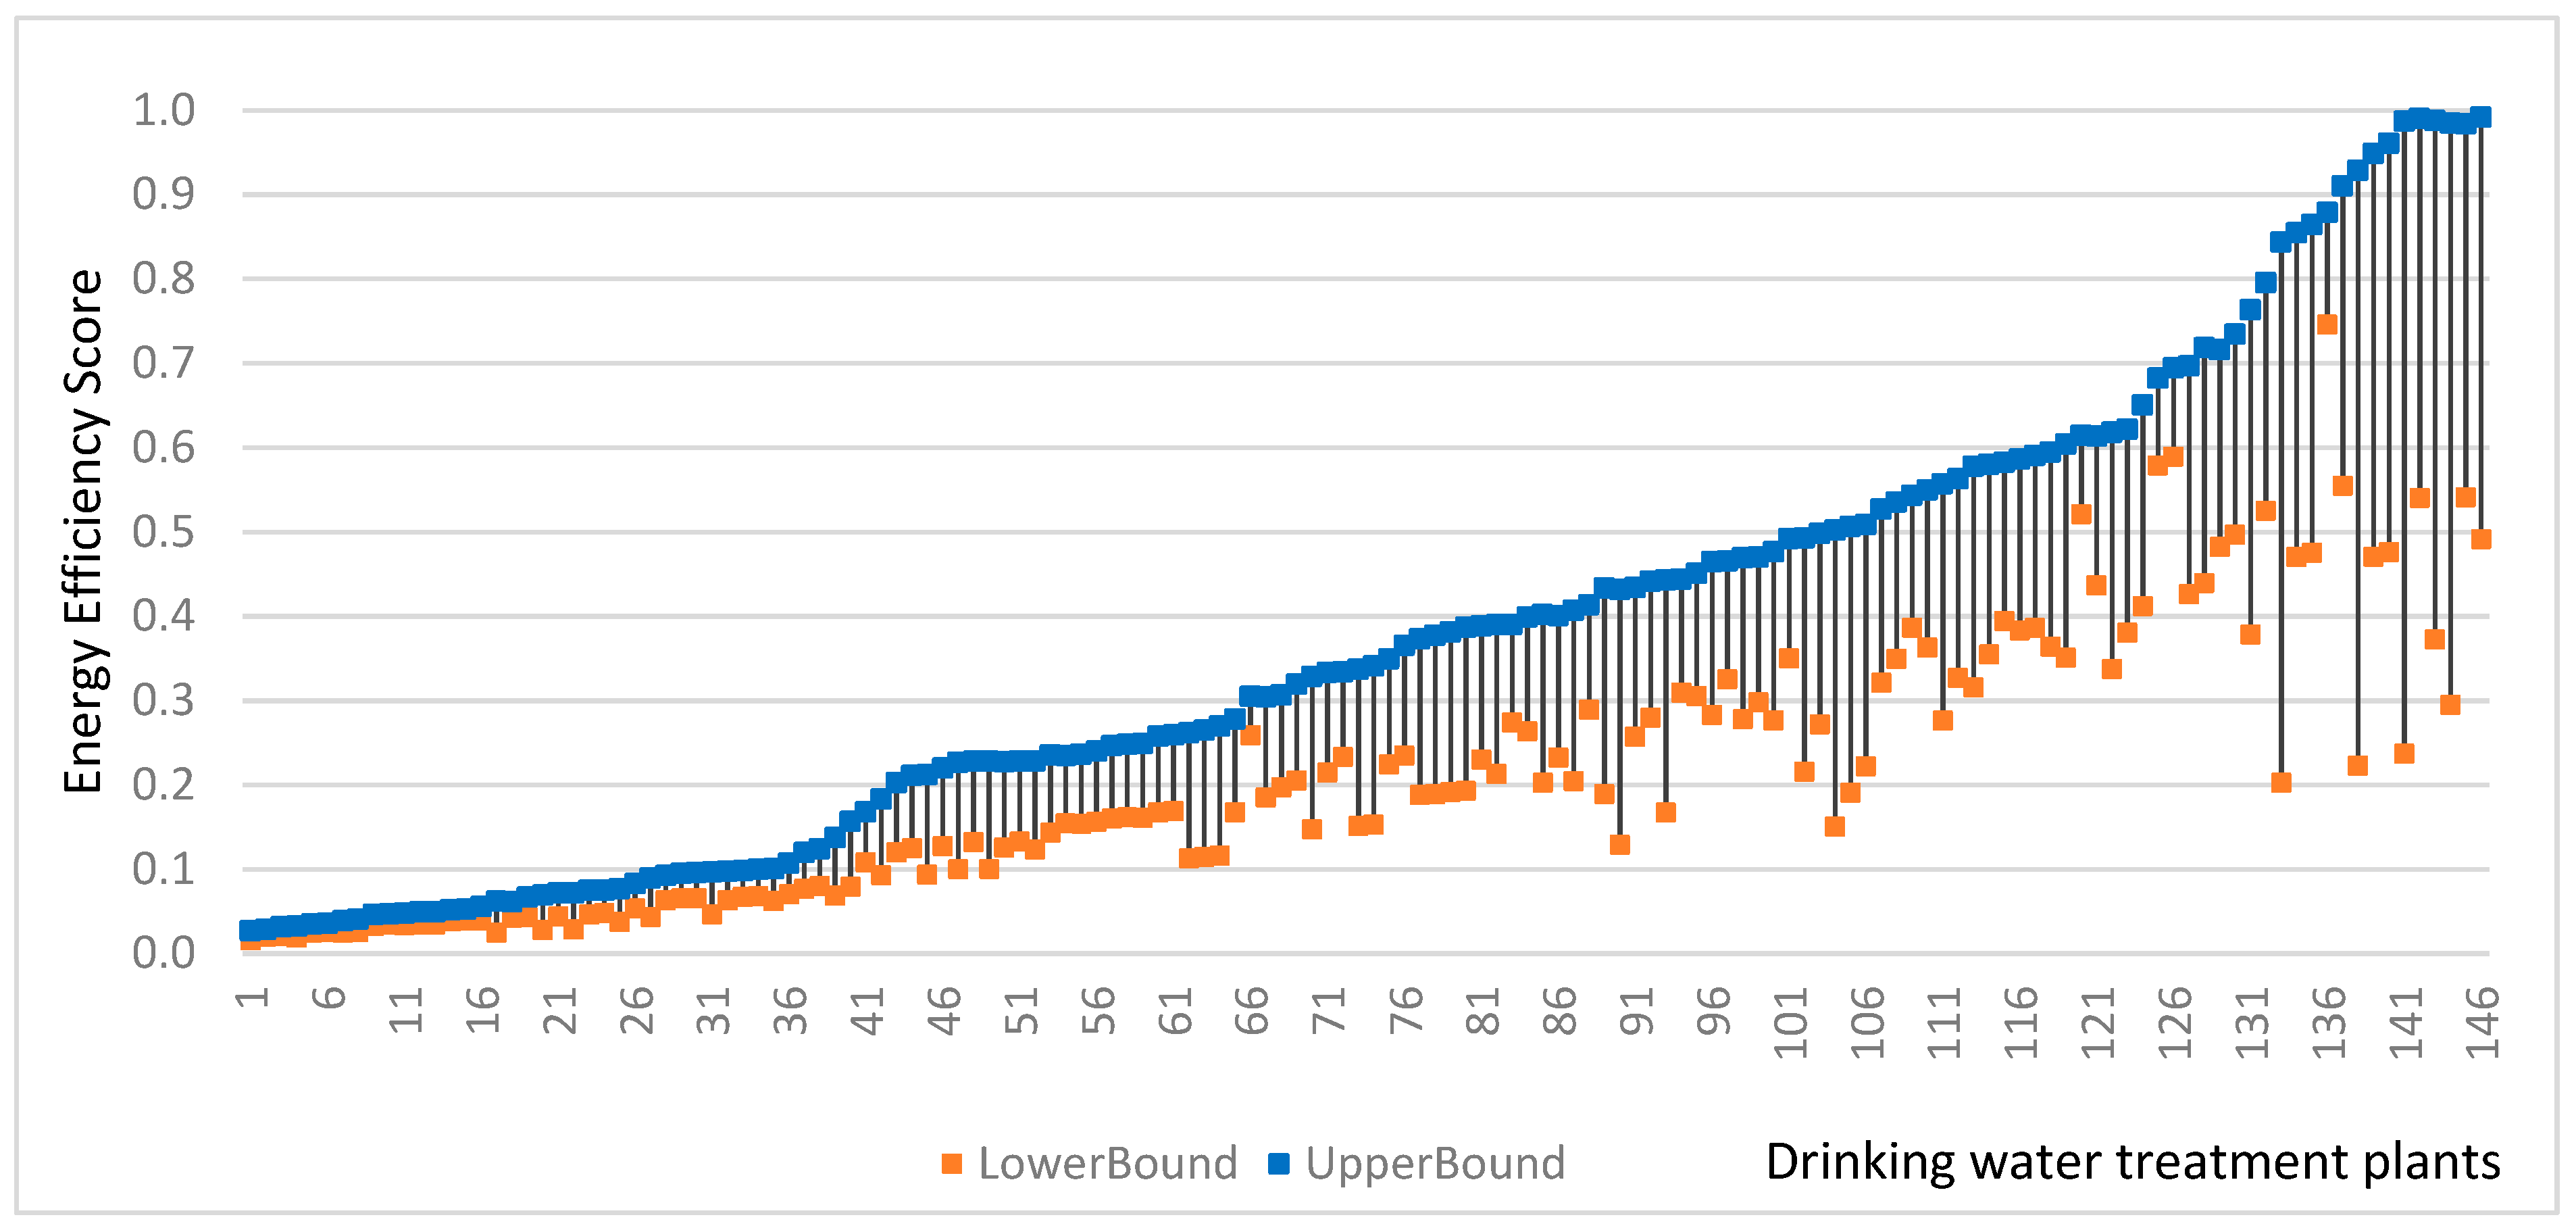
The lower and upper bounds are the maximum and minimum energy efficiency scores computed, considering the 2000 bootstrap samples generated. In other words, the difference between the lower and upper bounds represented the variability in energy efficiency for each DWTP evaluated. For DWTPs with the lowest energy efficiency scores, the gaps between the upper and lower bounds were small (minimum, 0.008), reflecting almost no variability (Figure 3). By contrast, the gaps between maximum and minimum energy efficiency scores was large (maximum, 0.75) for DWTPs with the highest original energy efficiency scores. This finding showed the importance of considering data variability in efficiency assessment employing the DEA approach, to provide more reliable and robust energy efficiency estimations to support decision-making. Such integration of variability is essential when the purpose of the analysis is to rank facilities based on performance (Figure 3). In the context of regulated water industries, this issue is very relevant, as benchmarking is used to set water tariffs in several water regulation models.
4.2. Determinants of Energy Efficiency
To improve the energy efficiency of DWTPs, not only inefficient facilities, but also the factors that influence energy efficiency, must be identified. This is the main advantage of the double-bootstrap technique. In the second stage of analysis, regression was conducted with four variables to identify factors influencing DWTP energy efficiency. Table 2 shows the bias-corrected coefficients of the regressed variables, with standard errors and p values. From a statistical point of view, a variable influences the energy efficiency of DWTPs at the 95% significance level if its p value is ≤0.05.
The DWTP age positively influenced energy efficiency (Table 2). Hence, older water treatment facilities exhibited a better energy performance than did younger facilities. The oldest facility analyzed had been operating for 52 years, and the sample contained a non-minor number of DWTPs that were more than 25 years old, in which old equipment had been replaced with newer, more efficient systems. This finding reflects the importance of proper equipment maintenance and the continuous incorporation of processes to improve the energy efficiency of DWTPs [10].
As in the case of WWTPs [15], the water treatment facilities presented economies of scale regarding energy use (Table 2). Larger DWTPs had significantly higher energy efficiency scores than did smaller facilities. This information is essential for the planning of new DWTPs, given the current tendency to decentralize urban water treatment facilities to increase redundancy in the case of an unplanned event (e.g., earthquake, volcanic eruption, or hurricane). However, from economic and environmental perspectives, larger DWTPs, i.e., centralized systems, are more favorable because per-unit energy use decreases with increasing capacity.
The quality of raw water, and thus the treatment intensity required to produce drinking water, sometimes depends on the water source. The DWTPs evaluated treated surface water, groundwater, and mixed water (Table 1). Following [12], the raw water source variable was integrated into the regression analysis as three dummy variables. The results showed that the source of raw water did not affect DWTP energy efficiency. This finding was consistent with the definition of the outputs considered in energy efficiency estimation, which included the concentrations of pollutants in DWTP influents and effluents. Usually, the use of groundwater requires more energy for water pumping, as well as the depth, which depends on water availability. However, in this case study, to guarantee homogeneity to the greatest extent possible, energy use for groundwater pumping was not considered in the analysis.
Several studies [24,30,31] have focused on the comparison of the performance of public and private water companies. In Chile, 98% of urban customers are supplied by private water companies [22], which operate under two regimes: i) Fully private water companies following the English and Welsh model, and ii) concessionary water companies following the French model [32] (The difference between water company types is the concession term (perpetuity for fully private companies and 30 years for concessionary water companies). Thus, DWTP ownership was integrated in the analysis as two artificial dummy variables. DWTP ownership did not impact energy efficiency (Table 2). This finding was consistent with Sowby’s [33] finding that energy efficiency did not differ significantly between public and private water companies.
For WWTPs, which have been studied more widely than DWTPs, results regarding the influence of treatment technologies on energy efficiency were inconclusive [34]. Thus, we investigated whether the technology used (i.e., pressure filtration or rapid gravity filtration) was a determinant factor for DWTP energy efficiency. The average energy efficiency score for water treatment facilities using pressure filtration was 0.351, and that for those employing rapid gravity filtration was 0.408; thus, the latter facilities exhibited significantly better energy performance (Table 2).
From the perspective of cleaner production, the findings of this study demonstrate the importance of adequate maintenance and equipment replacement to ensure DWTP energy efficiency. Moreover, the role of the technology in this efficiency has been revealed. This issue is fundamental for decision-making, especially in the context of the UN’s Sustainable Development Goals. The achievement of Goal 6 (“by 2030, achieve universal and equitable access to safe and affordable drinking water for all”) will involve the construction and operation of new DWTPs. The technological factor must be taken into account to reduce the energy requirements of these new facilities.
5. Conclusions
The assessment of energy requirements for urban water supplies has emerged as a relevant topic. The few previous studies that have evaluated the energy efficiency of DWTPs have employed conventional DEA models, ignoring the deterministic nature of this method. To overcome this limitation, a double-bootstrap DEA model was used in this study to evaluate the energy efficiency of a sample of DWTPs.
Empirical application with a sample of Chilean DWTPs provided three primary conclusions. First, the energy efficiency of the sample of DWTPs evaluated was very low; less than 5% of facilities were energy efficient, and the DWTPs could reduce the energy consumed by >50% while maintaining the same level of pollutant removal. Many water companies have focused on the optimization of energy use in WWTPs in recent years; the findings of this study show that improving the energy efficiency of DWTPs is also challenging. Second, the integration of data variability in the energy efficiency assessment notably affected the results. The ranking of DWTPs based on original and bias-corrected energy efficiency scores differed significantly. Water regulators that use benchmarking to regulate water companies or to set water tariffs should integrate data variability in their performance assessments, as in this study, to avoid the generation of biased results and conclusions. Third, among the variables studied, the determinants of energy efficiency were the volume of raw water treated (i.e., facility capacity), DWTP age, and the main technology used to treat raw water (i.e., pressure filters or rapid gravity filters). Plant size and the technology used to treat raw water are structural variables that cannot be modified by DWTP managers; thus, the improvement of energy efficiency in existing facilities is difficult in the short term. However, in consideration of long-term energy efficiency, these features must be taken into account when planning the construction of new DWTPs. In addition, facility age positively influenced energy efficiency, revealing the important role of equipment maintenance and replacement in the energy efficiency of water treatment facilities.
The improvement of DWTP energy efficiency is essential to achieve global climate goals and provide affordable drinking water for all people. Several regulations, such as the Revised Energy Efficiency Directive (which defines the European Union energy efficiency targets), and international agreements are focused on the reduction of consumers´ energy requirements. The European Water Framework Directive, which establishes full cost recovery for water services, was implemented in 2000. It mandates that all costs of urban water services, including DWTPs, must be transferred to citizens via water tariffs. The improvement of DWTP energy efficiency contributes to the achievement of the UN’s Sustainable Development Goal 6 and to the fulfillment of climate change agreements. In this context, to support decision-making, it is essential not only to assess the energy efficiency of DWTPs, but also to identify the determinants of energy efficiency using a reliable and robust methodological approach, as was done in this study.
Supplementary Materials
The Supplementary Materials are available online at https://0-www-mdpi-com.brum.beds.ac.uk/1996-1073/12/4/765/s1.
Author Contributions
Conceptualization, M.M.-S. and R.S.-G.; methodology, R.S.-G.; software, R.S.-G.; validation, M.M.-S. and R.S.-G.; formal analysis, M.M.-S.; investigation, M.M.-S. and R.S.-G.; resources, M.M.-S.; data curation, R.S.-G.; writing—original draft preparation, M.M.-S.; writing—review and editing, M.M.-S.; visualization, R.S.-G.; supervision, M.M.-S. and R.S.-G.; project administration, M.M.-S.; funding acquisition, M.M.-S.
Funding
This research was funded by CONICYT, programme Fondecyt (11160031).
Conflicts of Interest
The authors declare no conflict of interest.
References
- Lam, K.L.; Kenway, S.J.; Lant, P.A. Energy use for water provision in cities. J. Clean. Prod. 2017, 143, 699–709. [Google Scholar] [CrossRef] [Green Version]
- Wang, S.; Cao, T.; Chen, B. Urban energy-water nexus based on modified input-output analysis. Appl. Energy 2016, 196, 208–217. [Google Scholar] [CrossRef]
- Wakeel, M.; Chen, B.; Hayat, T.; Alsaedi, A.; Ahmad, B. Energy consumption for water use cycles in different countries: A review. Appl. Energy 2016, 178, 868–885. [Google Scholar] [CrossRef]
- Miller, L.A.; Ramaswami, A.; Ranjan, R. Contribution of water and wastewater infrastructures to urban energy metabolism and greenhouse gas emissions in cities in India. J. Environ. Eng. 2013, 139, 738–745. [Google Scholar] [CrossRef]
- Lee, M.; Keller, A.A.; Chiang, P.-C.; Den, W.; Wang, H.; Hou, C.-H.; Wu, J.; Wang, X.; Yan, J. Water-energy nexus for urban water systems: A comparative review on energy intensity and environmental impacts in relation to global water risks. Appl. Energy 2017, 205, 589–601. [Google Scholar] [CrossRef] [Green Version]
- Santana, M.V.E.; Zhang, Q.; Mihelcic, J.R. Influence of water quality on the embodied energy of drinking water treatment. Environ. Sci. Technol. 2014, 48, 3084–3091. [Google Scholar] [CrossRef] [PubMed]
- Molinos-Senante, M.; Sala-Garrido, R. Energy intensity of treating drinking water: Understanding the influence of factors. Appl. Energy 2017, 202, 275–281. [Google Scholar] [CrossRef]
- Sowby, R.B.; Burian, S.J. Survey of energy requirements for public water supply in the United States. J. Am. Water Works Assoc. 2017, 109, E320–E330. [Google Scholar] [CrossRef]
- Molinos-Senante, M.; Sala-Garrido, R. Evaluation of energy performance of drinking water treatment plants: Use of energy intensity and energy efficiency metrics. Appl. Energy 2018, 229, 1095–1102. [Google Scholar] [CrossRef]
- Molinos-Senante, M.; Guzmán, C. Benchmarking energy efficiency in drinking water treatment plants: Quantification of potential savings. J. Clean. Prod. 2018, 176, 417–425. [Google Scholar] [CrossRef]
- Ananda, J. Productivity implications of the water-energy-emissions nexus: An empirical analysis of the drinking water and wastewater sector. J. Clean. Prod. 2018, 196, 1097–1105. [Google Scholar] [CrossRef]
- Ananda, J. Explaining the environmental efficiency of drinking water and wastewater utilities. Sustain. Prod. Consum. 2019, 17, 188–195. [Google Scholar] [CrossRef]
- Marques, R.C.; Berg, S.; Yane, S. Nonparametric benchmarking of Japanese water utilities: Institutional and environmental factors affecting efficiency. J. Water Resour. Plan. Manag. 2014, 140, 562–571. [Google Scholar] [CrossRef]
- See, K.F. Exploring and analysing sources of technical efficiency in water supply services: Some evidence from Southeast Asian public water utilities. Water Resour. Econ. 2015, 9, 23–44. [Google Scholar] [CrossRef]
- Cazals, C.; Florens, J.-P.; Simar, L. Nonparametric frontier estimation: A robust approach. J. Econ. 2002, 106, 1–25. [Google Scholar] [CrossRef]
- De Witte, K.; Marques, R.C. Influential observations in frontier models, a robust non-oriented approach to the water sector. Ann. Oper. Res. 2010, 181, 377–392. [Google Scholar] [CrossRef] [Green Version]
- SISS. Drinking Water and Sewerage Management Report in Chile. 2016. Available online: http://www.siss.gob.cl/586/w3-propertyvalue-6415.html (accessed on 10 October 2018).
- Charnes, A.; Cooper, W.W.; Rhodes, E.L. Measuring the Efficiency of Decision Making Units. Eur. J. Oper. Res. 1978, 2, 429–444. [Google Scholar] [CrossRef]
- Banker, R.D.; Charnes, A.; Cooper, W.W. Some models for estimating technical and scale inefficiencies in data envelopment analysis. Manag. Sci. 1984, 30, 1078–1092. [Google Scholar] [CrossRef]
- Simar, L.; Wilson, P.W. Estimation and inference in two-stage, semi-parametric models of production processes. J. Econ. 2007, 136, 31–64. [Google Scholar] [CrossRef] [Green Version]
- Güngör-Demirci, G.; Lee, J.; Keck, J. Assessing the performance of a California water utility using two-stage data envelopment analysis. J. Water Resour. Plan. Manag. 2018, 144, 05018004. [Google Scholar] [CrossRef]
- Cai, Y.; Sam, C.Y.; Chang, T. Nexus between clean energy consumption, economic growth and CO2 emissions. J. Clean. Prod. 2018, 182, 1001–1011. [Google Scholar] [CrossRef]
- Ananda, J. Evaluating the performance of urban water utilities: Robust nonparametric approach. J. Water Resour. Plan. Manag. 2014, 140, 04014021. [Google Scholar] [CrossRef]
- Donoso, G. Water Policy in Chile; Global Issues in Water Policy; Springer: Cham, Switzerland, 2018. [Google Scholar]
- Lorenzo-Toja, Y.; Vázquez-Rowe, I.; Chenel, S.; Moreira, M.T.; Feijoo, G. Eco-efficiency analysis of Spanish WWTPs using the LCA+DEA method. Water Res. 2015, 68, 651–666. [Google Scholar] [CrossRef] [PubMed]
- Saal, D.S.; Parker, D.; Weyman-Jones, T. Determining the contribution of technical change, efficiency change and scale change to productivity growth in the privatized English and Welsh water and sewerage industry: 1985–2000. J. Product. Anal. 2007, 28, 127–139. [Google Scholar] [CrossRef]
- Dong, X.; Zhang, X.; Zeng, S. Measuring and explaining eco-efficiencies of wastewater treatment plants in China: An uncertainty analysis perspective. Water Res. 2017, 112, 195–207. [Google Scholar] [CrossRef] [PubMed]
- Sanders, K.T.; Webber, M.E. Evaluating the energy consumed for water use in the United States. Environ. Res. Lett. 2012, 7, 034034. [Google Scholar] [CrossRef] [Green Version]
- Gude, V.G. Energy and water autarky of wastewater treatment and power generation systems. Renew. Sustain. Energy Rev. 2015, 45, 52–68. [Google Scholar] [CrossRef]
- Hernández-Sancho, F.; Molinos-Senante, M.; Sala-Garrido, R. Energy efficiency in Spanish wastewater treatment plants: A non-radial DEA approach. Sci. Total Environ. 2011, 409, 2693–2699. [Google Scholar] [CrossRef] [PubMed]
- Simões, P.; Marques, R.C. Performance and congestion analysis of the portuguese hospital services. Cent. Eur. J. Oper. Res. 2011, 19, 39–63. [Google Scholar] [CrossRef]
- Suárez-Varela, M.; de los Ángeles García-Valiñas, M.; González-Gómez, F.; Picazo-Tadeo, A.J. Ownership and Performance in Water Services Revisited: Does Private Management Really Outperform Public? Water Resour. Manag. 2017, 31, 2355–2373. [Google Scholar] [CrossRef]
- Guerrini, A.; Molinos-Senante, M.; Romano, G. Italian regulatory reform and water utility performance: An impact analysis. Util. Policy 2018, 52, 95–102. [Google Scholar] [CrossRef]
- Marques, R.C. Regulation of Water and Wastewater Services; An International Comparison; IWA Publishing: London, UK, 2010. [Google Scholar]
Figure 1.
Original energy efficiency scores of drinking water treatment plants.

Figure 2.
Ranking of drinking water treatment plants based on original and bias-corrected energy efficiency scores.
Figure 2.
Ranking of drinking water treatment plants based on original and bias-corrected energy efficiency scores.

Figure 3.
Lower and upper bounds of energy efficiency for each drinking water treatment plant.


Table 1.
Sample description. (Source: Water and Sewerage Management Reports by SISS).
| Data | Variables | Average | SD | Minimum | Maximum |
|---|---|---|---|---|---|
| Input | Energy consumed (kWh/year) | 258,878 | 441,353 | 1,152 | 2,331,739 |
| Energy consumed (kWh/m3) | 0.175 | 0.259 | 0.022 | 1.194 | |
| Outputs | Water treated (m3/year) | 17,306,317 | 61,159,647 | 6,642 | 386,483,247 |
| Efficiency in turbidity removal (%) | 56.2 | 21.2 | 5.6 | 95.5 | |
| Efficiency in arsenic removal (%) | 58.2 | 24.4 | 4.8 | 86.7 | |
| Efficiency in TDS removal (%) | 39.2 | 24.3 | 4.8 | 80.0 | |
| Efficiency in sulfates removal (%) | 47.3 | 28.3 | 4.4 | 90.9 | |
| Continous explanatory variable | Age (years) | 27.4 | 15.5 | 11.0 | 52.0 |
| Categorial explanatory variable | Number | % total | |||
| Source of water | Surface | 45 | 30.8 | ||
| Groundwater | 43 | 29.5 | |||
| Mixed | 58 | 39.7 | |||
| Water company | Private operator | 76 | 52.0 | ||
| Concession | 70 | 48.0 | |||
| Type of treatment | PF | 70 | 48.0 | ||
| RGF | 76 | 52.0 | |||
SD: Standard Deviation; PF: Pressure filtration; RGF: Rapid gravity filtration.
Table 2.
Results of bootstrap regression.
| Variables | Bias-Corrected Coefficient | Standard Error | p-Value |
|---|---|---|---|
| Age | −25.25 | 4.51 | 0.030 ** |
| Volume | 10.44 | 2.14 | <0.001 * |
| Surface water | Reference variable | ||
| Groundwater | 58.54 | 10.25 | 0.751 |
| Mixed water | 45.32 | 7.55 | 0.354 |
| Privatized company | Reference variable | ||
| Concessionary company | 10.25 | 3.24 | 0.548 |
| Pressure filtration | Reference variable | ||
| Rapid gravity filtration | −5.25 | 1.21 | 0.006 * |
* Significant at 1% level; ** Significant at 5% level.
© 2019 by the authors. Licensee MDPI, Basel, Switzerland. This article is an open access article distributed under the terms and conditions of the Creative Commons Attribution (CC BY) license (http://creativecommons.org/licenses/by/4.0/).
Share and Cite
MDPI and ACS Style
Molinos-Senante, M.; Sala-Garrido, R. Assessment of Energy Efficiency and Its Determinants for Drinking Water Treatment Plants Using A Double-Bootstrap Approach. Energies 2019, 12, 765. https://0-doi-org.brum.beds.ac.uk/10.3390/en12040765
AMA Style
Molinos-Senante M, Sala-Garrido R. Assessment of Energy Efficiency and Its Determinants for Drinking Water Treatment Plants Using A Double-Bootstrap Approach. Energies. 2019; 12(4):765. https://0-doi-org.brum.beds.ac.uk/10.3390/en12040765
Chicago/Turabian StyleMolinos-Senante, María, and Ramón Sala-Garrido. 2019. "Assessment of Energy Efficiency and Its Determinants for Drinking Water Treatment Plants Using A Double-Bootstrap Approach" Energies 12, no. 4: 765. https://0-doi-org.brum.beds.ac.uk/10.3390/en12040765
Note that from the first issue of 2016, this journal uses article numbers instead of page numbers. See further details here.