Analysis of Fossil Fuel Energy Consumption and Environmental Impacts in European Countries †


1
REQUIMTE/LAQV/ISEP, School of Engineering, P. Porto 4249-015, Portugal
2
CIETI/ISEP, School of Engineering, P. Porto 4249-015, Portugal
3
Institute of Power and Applied Electrical Engineering, FEI - Slovak University of Technology, Ilkovicova 3, 812 19 Bratislava 1, Slovakia
4
LEPABE-Laboratory for Process Engineering, Environment, Biotechnology and Energy, Faculty of Engineering, University of Porto, Rua Dr. Roberto Frias, 4200-465 Porto, Portugal
*
Author to whom correspondence should be addressed.
†
This paper is an extension of the paper presented in ICEER2018 and published in Energy Procedia, vol. 153.
Energies 2019, 12(6), 964; https://0-doi-org.brum.beds.ac.uk/10.3390/en12060964
Submission received: 15 January 2019
/
Revised: 19 February 2019
/
Accepted: 8 March 2019
/
Published: 13 March 2019
(This article belongs to the Special Issue Sustainable Energy Systems)
Abstract
:The use of fossil fuels as the main source of energy for most countries has caused several negative environmental impacts, such as global warming and air pollution. Air pollution causes many health problems, causing social and economic negative effects. Worldwide efforts are being made to avoid global warming consequences through the establishment of international agreements that then lead to local policies adapted to the development of each signing nation. In addition, there is a depletion of nonrenewable resources which may be scarce or nonexistent in future generations. The preservation of resources, which is a common goal of the Circular Economy strategy and of sustainable development, is not being accomplished nowadays. In this work, the calculation of indicators and mathematical and statistical analysis were applied to clarify and evidence the trends, provide information for the decision-making process, and increase public awareness. The fact that European countries do not possess abundant reserves of fossil fuels will not change, but the results of this analysis can evolve in the future. In this work, fossil fuel energy consumption, fossil fuel depletion, and their relationship with other variables, such as energy dependence and share of renewable energy in gross final energy consumption, were analyzed for 29 European countries. Furthermore, it was possible to conclude that many European countries still depend heavily on fossil fuels. Significant differences were not found in what concerns gross inland consumption per capita when the Kruskal–Wallis test was applied. It was possible to estimate that by 2050 (considering Jazz scenario) it will only remain approximately 14% of oil proven reserves, 72% of coal proven reserves and 18% of gas proven reserves. Given the small reserves of European countries on fossil fuels, if they need to use them, they will fast disappear.
1. Introduction
Most countries’ energy systems, either developed or in development, are based on fossil fuels [1,2]. In spite of their qualities, e.g., good operational control in thermal plants [3], their use has many problems which have been analyzed and addressed in many studies [4]. These problems, such as the environmental impacts, scarcity, supply risk, and instability of prices and markets, put fossil fuels at the center of the shift to low carbon economies. Khan et al. [5] found that, in Pakistan, there is a strong relationship between energy consumption, air pollution, water resources, and natural resource rents. Zheng et al. [6] used panel data regression analysis on a sample of 26 Chinese provinces and four centrally-controlled municipalities in the period from 2002 to 2011 and found empirical support for the positive impacts of provincial energy saving regulations and two environmental standards on the improvement of local air quality.
The use of fossil fuels is responsible for environmental problems such as global warming and air pollution, which cause health problems and affect the quality of life of populations. Lott et al. [7] concluded that by applying adequate changes in technology for residential heating, the UK would meet its decarbonization targets by 2050, and there would be a 40% and 45% decrease in PM10 (Particulate matter with a diameter less than 10 µm) and PM2.5 (Particulate matter with a diameter less than 2.5 µm) pollution, respectively, between 2010 and 2050. Contrarily, limited change in the pollution profile for transportation would be observed if the established policy strategies were applied in that sector. Li et al. [8] concluded that Chinese government policy plays a major role in the long-term and more permanent SO2 emission decline, through modification of industrial structure, change to cleaner energy sources, population growth limitation, and regulation of the number and emissions of vehicles. The reforms introduced in the Beijing economic structure, aiming to decrease the ratio of secondary industry, show that the policies implemented by the government are the major driver to improve air quality. Zhang et al. [9] analyzed the difference between the effects of trade and trade-related emissions on premature deaths attributable to air pollution in three regions of China and concluded that there is a strong and broad impact of domestic trade on regional air quality. This justifies the need for a comprehensive consideration of supply chains in designing policy to mitigate the negative health impacts of air pollution in China.
Besides the environmental and health problems, fossil fuels are unevenly distributed, which increases the concerns about energy security due to their key role in today’s energy production systems [10]. Moreover, they are nonrenewable resources which raises the problem of their availability for this and future generations. Their complete depletion should be avoided, thus contributing to the decrease in the environmental impact in the corresponding impact category. The instability of markets and prices is also a drawback in their use, causing negative economic impacts.
All the above-mentioned issues contribute to today’s unsustainable energy systems and to the quest for new solutions that will reduce the economic, social, and environmental negative impacts of energy systems, thus increasing sustainability. Achieving sustainable energy systems still remains a challenge for the majority of countries, in spite of the efforts made by governments, international agencies, and other stakeholders. In the last few decades, new policies have been implemented and incentives for renewable energy have been granted through support mechanisms, for example, feed-in-tariffs. Many other strategies, such as demand side measures and smart grids, have been addressed to overcome the challenges that a change to low carbon energy systems create [11,12].
In order to verify if the pathways chosen are being effective, it is necessary to find ways of evaluating energy systems and energy policies. The approaches used usually define a set of indicators to be applied, and then the performance of each country can be assessed and compared. The goal of such a set of indicators is to evaluate the sustainability of energy systems and can include indicators about energy efficiency, energy availability, and renewable energy. Some of these are applicable on a global scale and others in a local area, such as a country [13,14]. Economical aspects, such as subsidies, can directly affect the selected indicators and the progress toward more sustainable energy systems [15,16]. Projection and scenarios for the future are also techniques frequently used, because environmental concerns (greenhouse gas emissions), social issues (electrification rate and accessibility to energy at fair prices), and energy policies and investments are very closely linked [17,18,19]. Technological advances and innovation can also contribute to new solutions and make new resources available. All these issues are necessary to define possible pathways in the future.
European countries have been at the edge of these changes and renewable energy sources are a key aspect in new energy policy and projected pathways [20]. However, fossil fuels are still crucial in energy systems [21]. This work analyzes fossil fuel information and applies statistical tools to show the present situation in European countries. Although there is information available in open literature, it has not been analyzed under such a mathematical approach. The calculation of indicators, merit figures, and mathematical and statistical analysis are mainly used to clarify and emphasize the trends, problems, and provide condensed information that can be useful in the decision-making process. Therefore, this work analyzes fossil fuel energy consumption (oil, solid fuels, and gas), fossil fuel depletion in European countries, and their relationship with other variables, such as energy dependence and share of renewable energy. It also analyzes the progress made by individual European countries toward a low carbon energy system. Projections for the future and their impacts are also addressed in this paper. A Kruskal–Wallis test was applied to assess the effect of several factors on gross inland consumption per capita.
2. Materials and Methods
Energy systems are changing, and it is important to quantify and assess those variations, measuring the progress toward the established goals. Indicators can be a useful tool to achieve that purpose. These indicators can analyze energy systems globally, such as the energy mix for a given country, considering the different sources of energy: fossil (fuel, coal, and gas), nuclear, biofuels and waste, renewable (hydro, solar, wind, geothermal, etc.), or parts of the energy system (renewable energy sources) [22]. Another indicator is energy dependence, which is important because it can significantly affect the development of countries, since it increases their vulnerability to price instability and supply ruptures. Share of renewable energy in the gross final energy consumption is an important indicator, since it can represent the pathway to lower carbon energy systems. Concerning fossil fuels, there are some indicators that are very important, such as the fossil fuel energy mix, fossil fuel energy consumption, and fossil fuel depletion.
These indicators can be defined as follows:
- Energy mix: contribution of each source of energy to total energy;
- Energy dependence: the percentage of imports in total energy consumption;
- Share of renewable energy: the percentage of renewable energy in gross final energy consumption [22];
- Fossil fuel energy mix: the contribution of each fossil fuel source of energy to the fossil energy;
- Fossil fuel energy consumption: the quotient between the usage of fossil fuels (oil, solid fuels, and gas) and gross inland energy consumption (Equation (1)):where Esolids fuels is the energy consumption from solid fuels, Etotal petroleum products is the energy consumption from petroleum products, and Egas is the energy consumption from gas.
- Depletion of fossil fuels: the quotient between fossil fuel reserves (proven) and gross annual production (Equation (2)). There are three indicators, one for oil, one for gas, and one for coal:
Data, relative to the year 2016, were gathered for several European countries from Eurostat [23] and used in this study. Furthermore, statistical data from BP were used, dated from the year 2017 [24].
Two of the mathematical tools (the software used was SPSS Statistics 25) used in this work were Pearson correlation and Spearman’s correlation [25]. Pearson r correlation is applied to assess a linear relation between two variables. Pearson correlation is more reliable when the distribution is normal; however, since there are different degrees of violation of normality, both methods were applied. Spearman’s correlation also assesses the relationship between two variables, yet it is a nonparametric method and does not require a normal distribution. Significant correlation between variables exist when the p value is lower than 0.05. If variables are negatively correlated, this means that the higher one of them is the lower the other one will be. To assess normality, the Shapiro–Wilk test was used. Another statistical tool used was the Kruskal–Wallis test [26]. This is a nonparametric test that is used to compare two or more independent groups. It can be used to determine if there are statistically significant differences between groups (two or more) of a categorical independent variable on a continuous dependent variable. In this study, four independent variables were considered, namely energy dependence, fossil fuel energy consumption, share of renewable energy, and fossil fuel reserves, and the dependent variable was the Gross Inland Consumption (GIC) per capita.
3. Results and Discussion
3.1. Fossil Fuel Energy Mix for European Countries
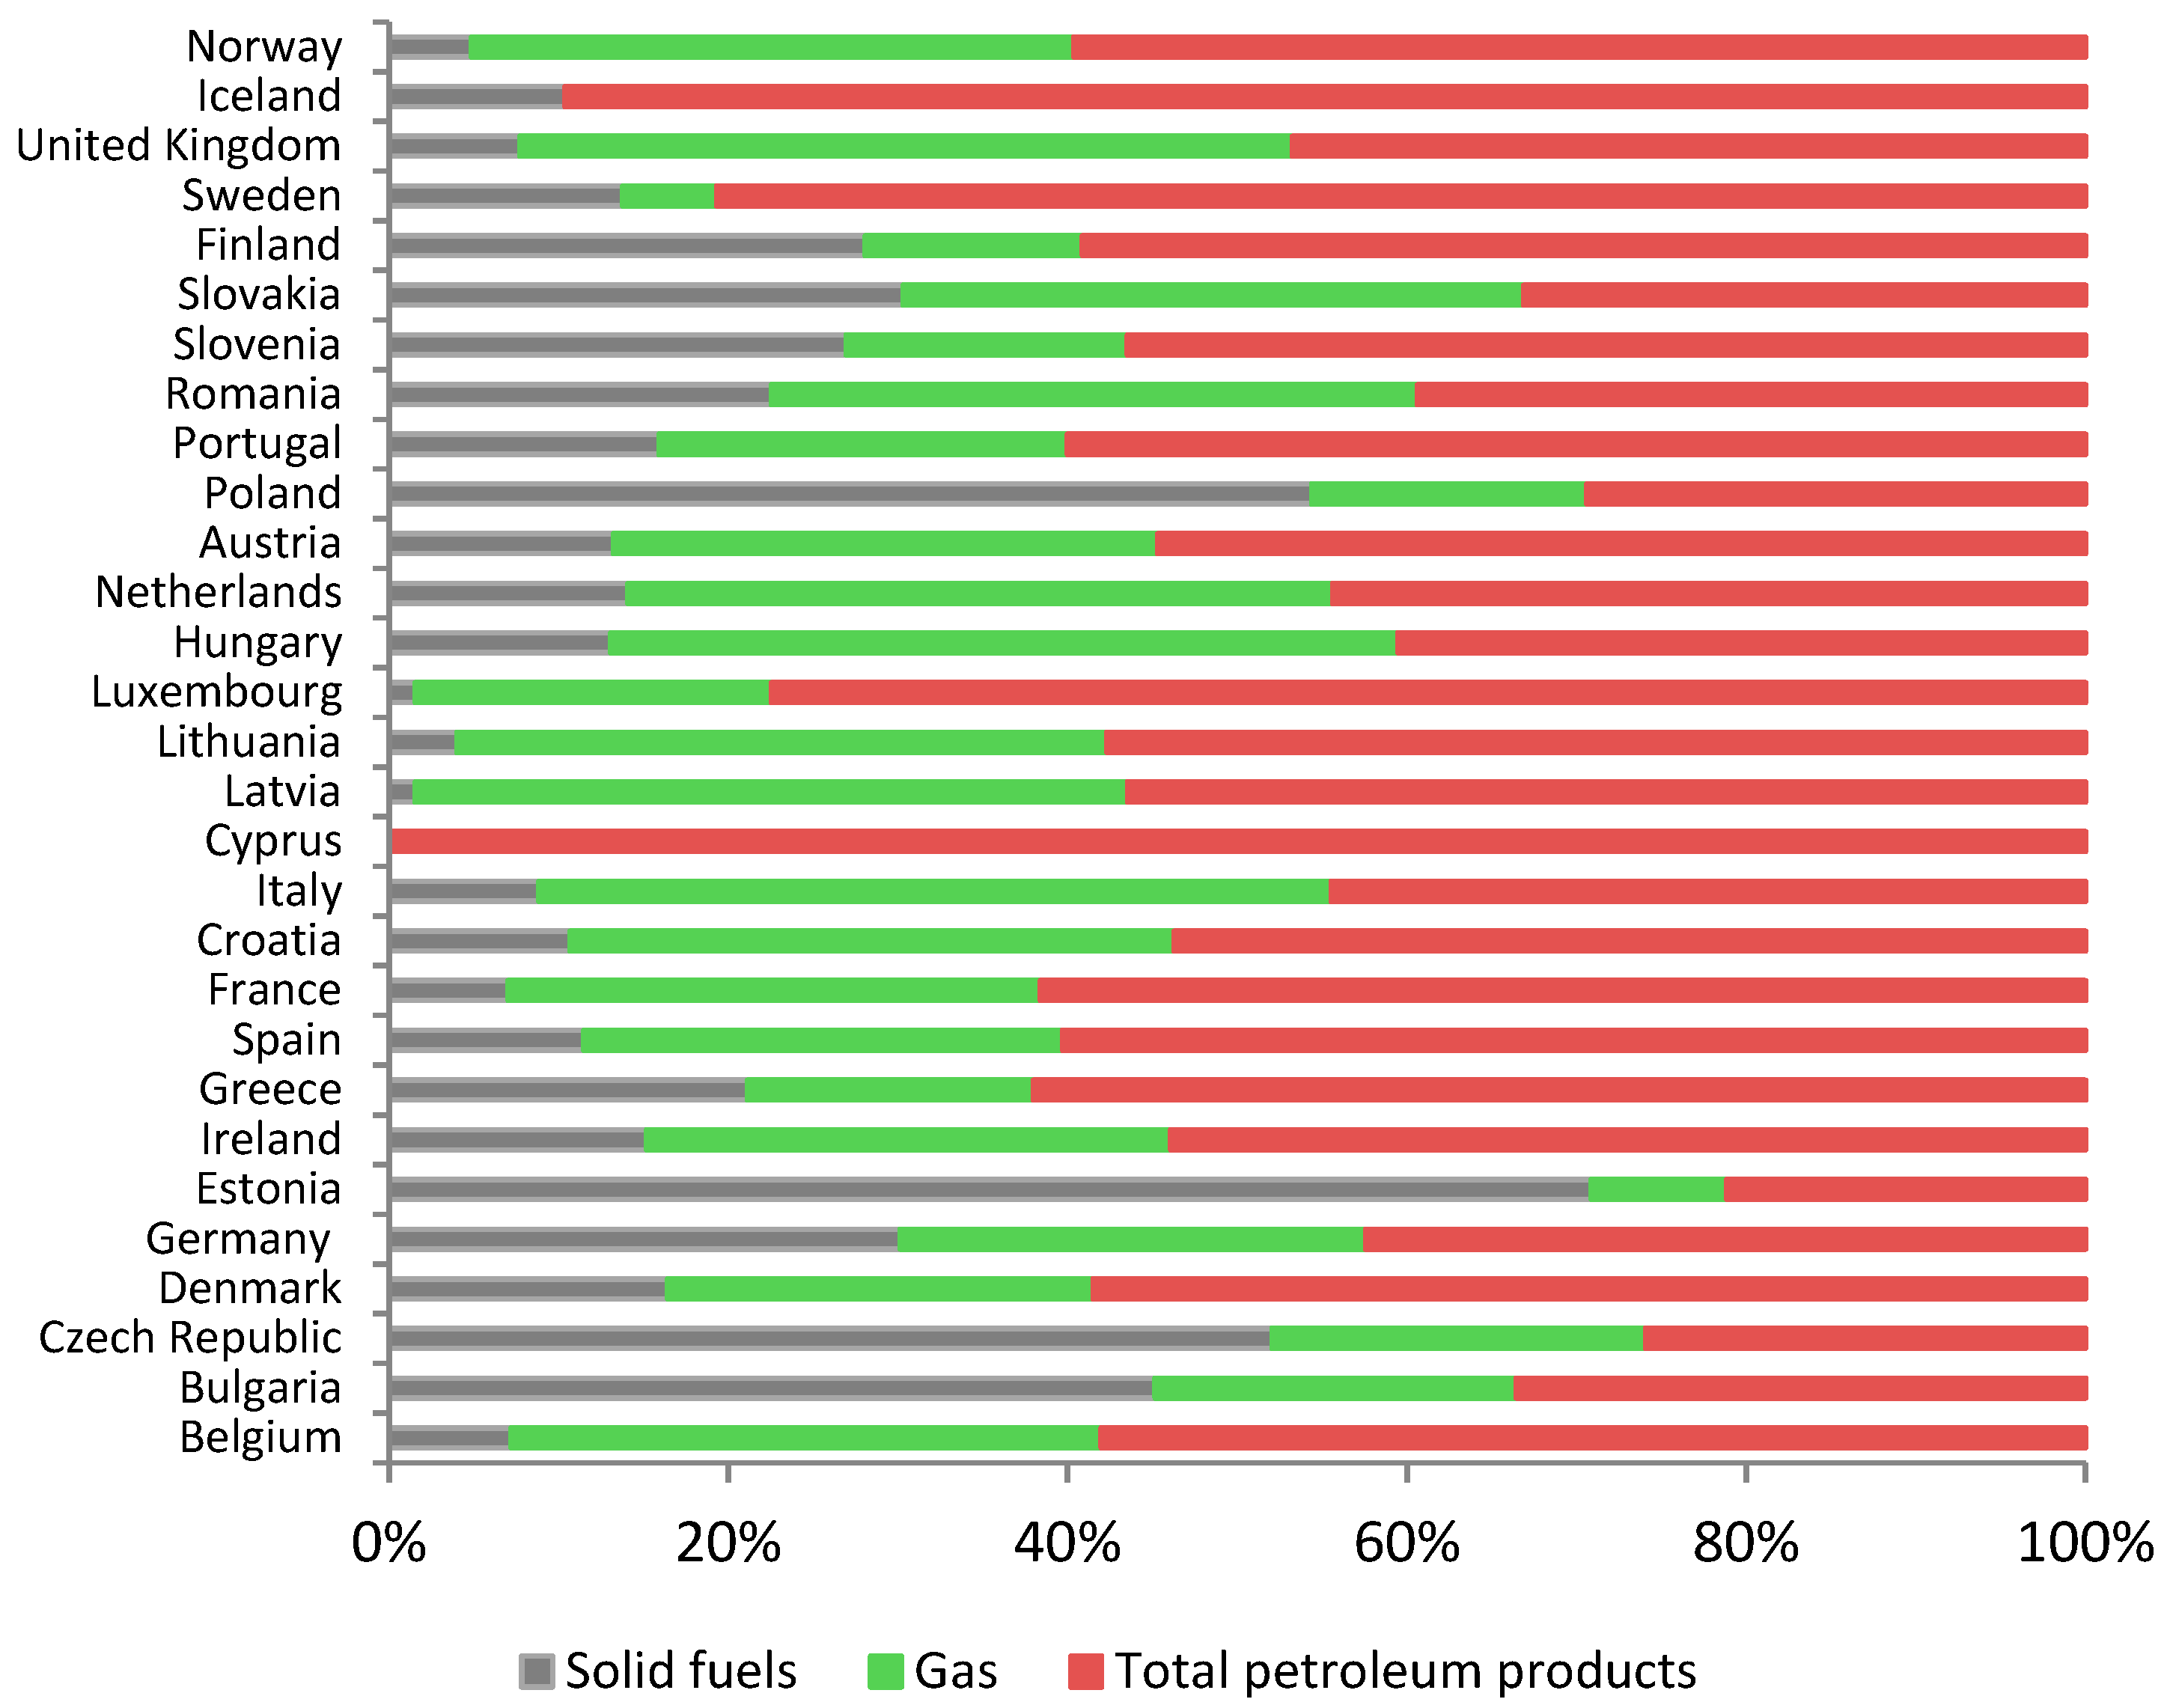
Figure 1 shows the fossil fuel energy mix for the European Union countries.
The indicators were calculated using data (2016) that were gathered for several European countries from Eurostat [23]. Considering the energy consumption of oil, solid fuels, and gas in the selected European countries, it is possible to conclude that in most of the countries considered the oil presents the highest percentage. Only in four countries, solid fuels present a higher percentage, namely Bulgaria, the Czech Republic, Estonia, and Poland, which is due to the local availability of solid fuels. In Italy, Hungary, and Slovakia, gas presents the highest percentage. In many countries the solid fuels’ percentage is very small, as can be seen in Figure 1, which is a positive aspect since solid fuels are recognized as having more severe environmental and social negative impacts. The European directives issued toward the use of cleaner sources of energy can be indicated as a factor that contributed to this situation [27].
3.2. Fossil Fuel Energy Consumption Indicator
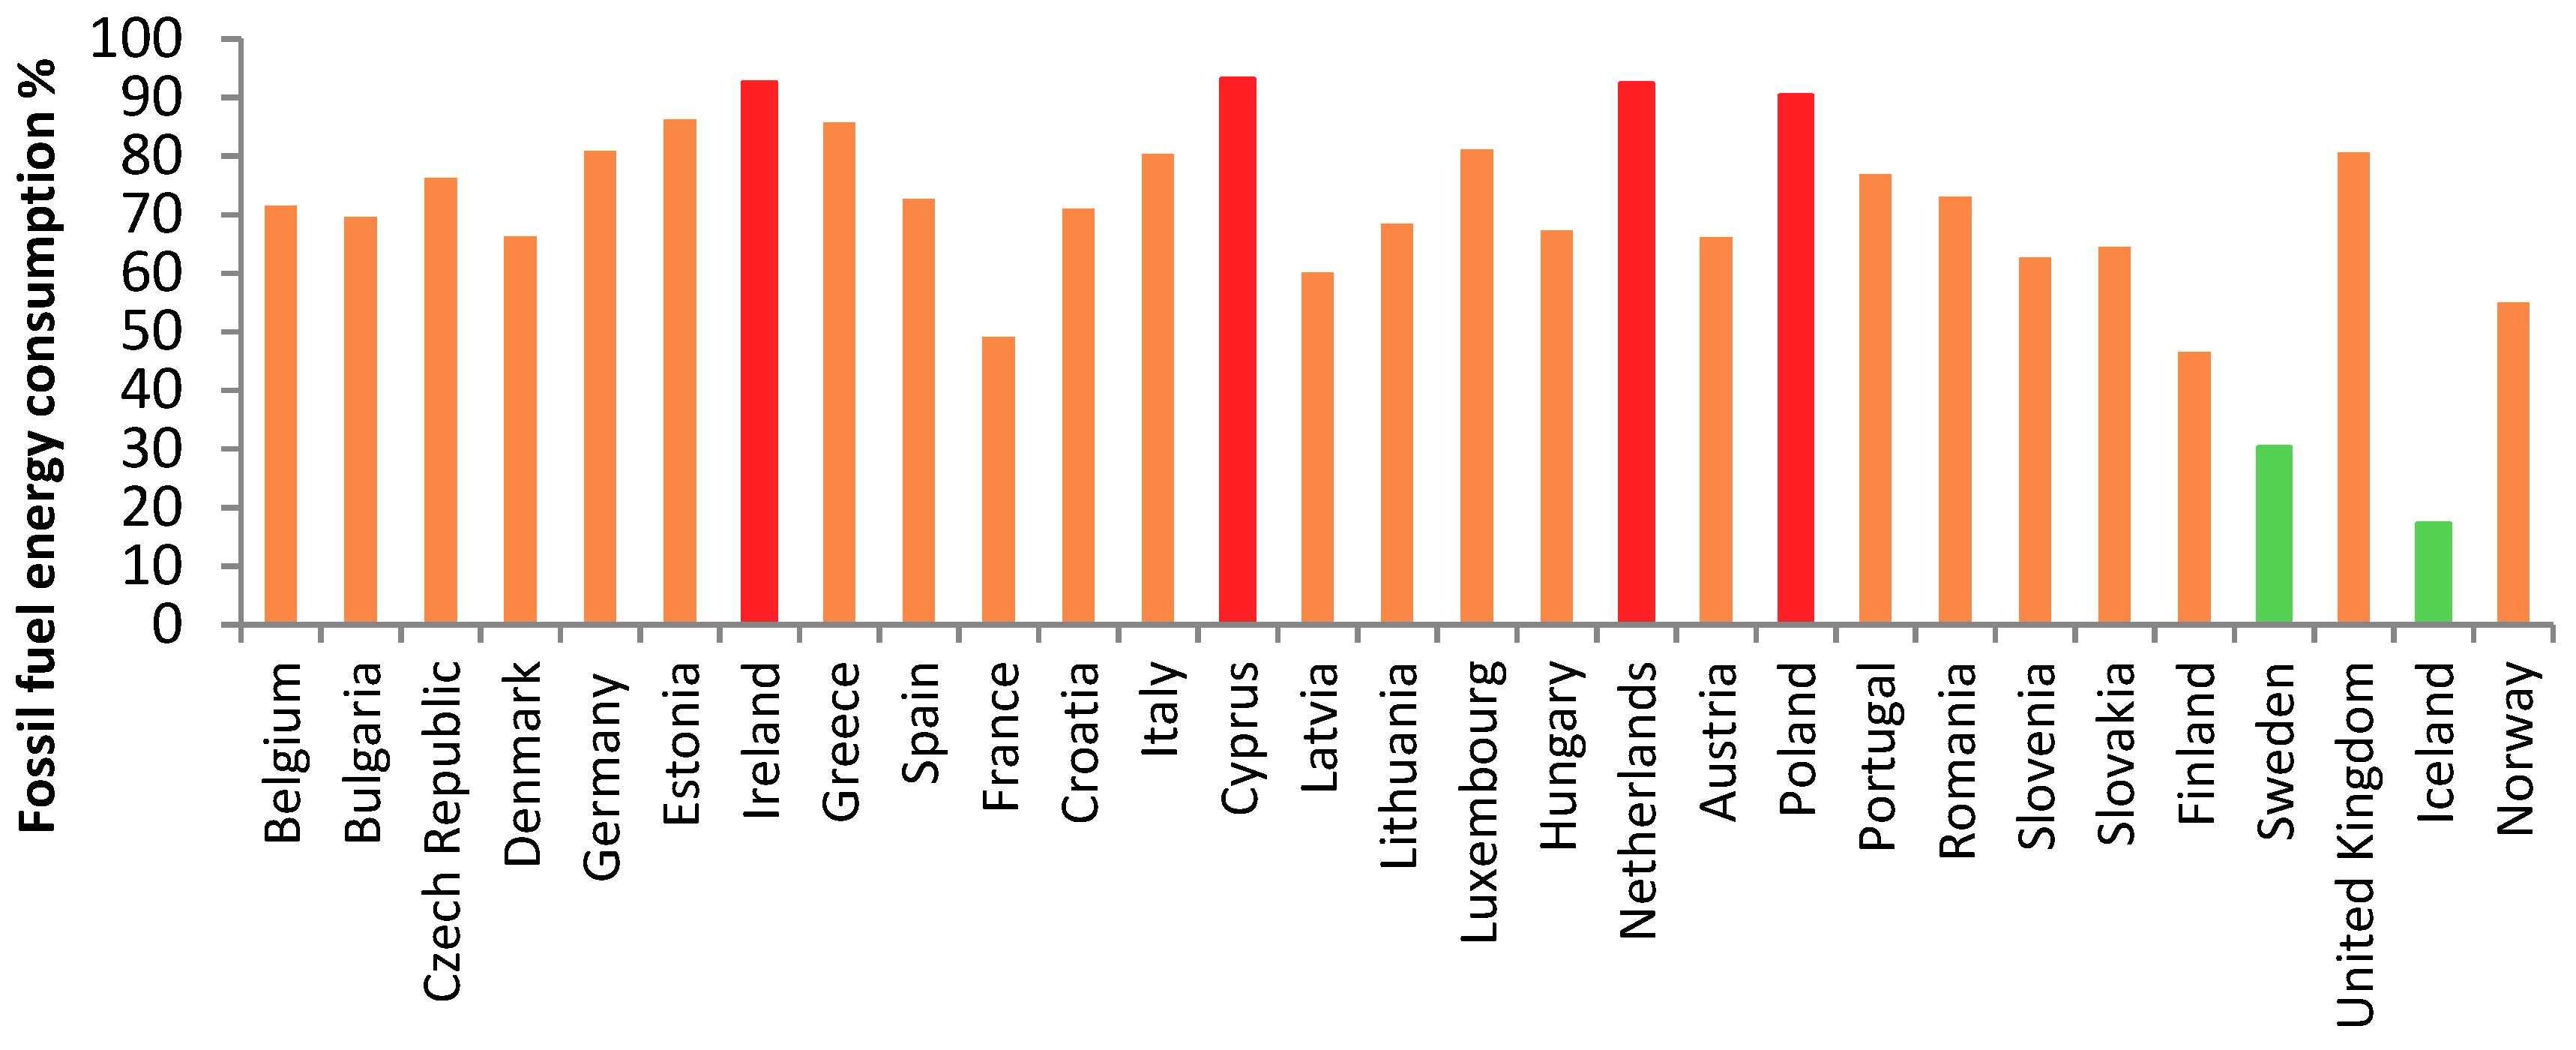
The fossil fuel energy consumption (FFEC) was calculated for the 29 selected European countries (shown in Figure 2).
It is possible to conclude that Iceland and Sweden are the only countries where the FFEC indicator is lower than 40% (to emphasize this fact their bars are green). In fact, Iceland has a value even lower than 20%. There are only three countries with FFEC indicator values between 40% and 60%, namely France, Finland, and Norway. All the other countries have FFEC values above 60%. Ireland, Cyprus, Poland, and the Netherlands have values higher than 90% for this indicator (due to the high value of the indicator the bars are red to emphasize this fact), which can be attributed to a higher local availability of fossil fuels.
3.3. Fossil Fuel Depletion
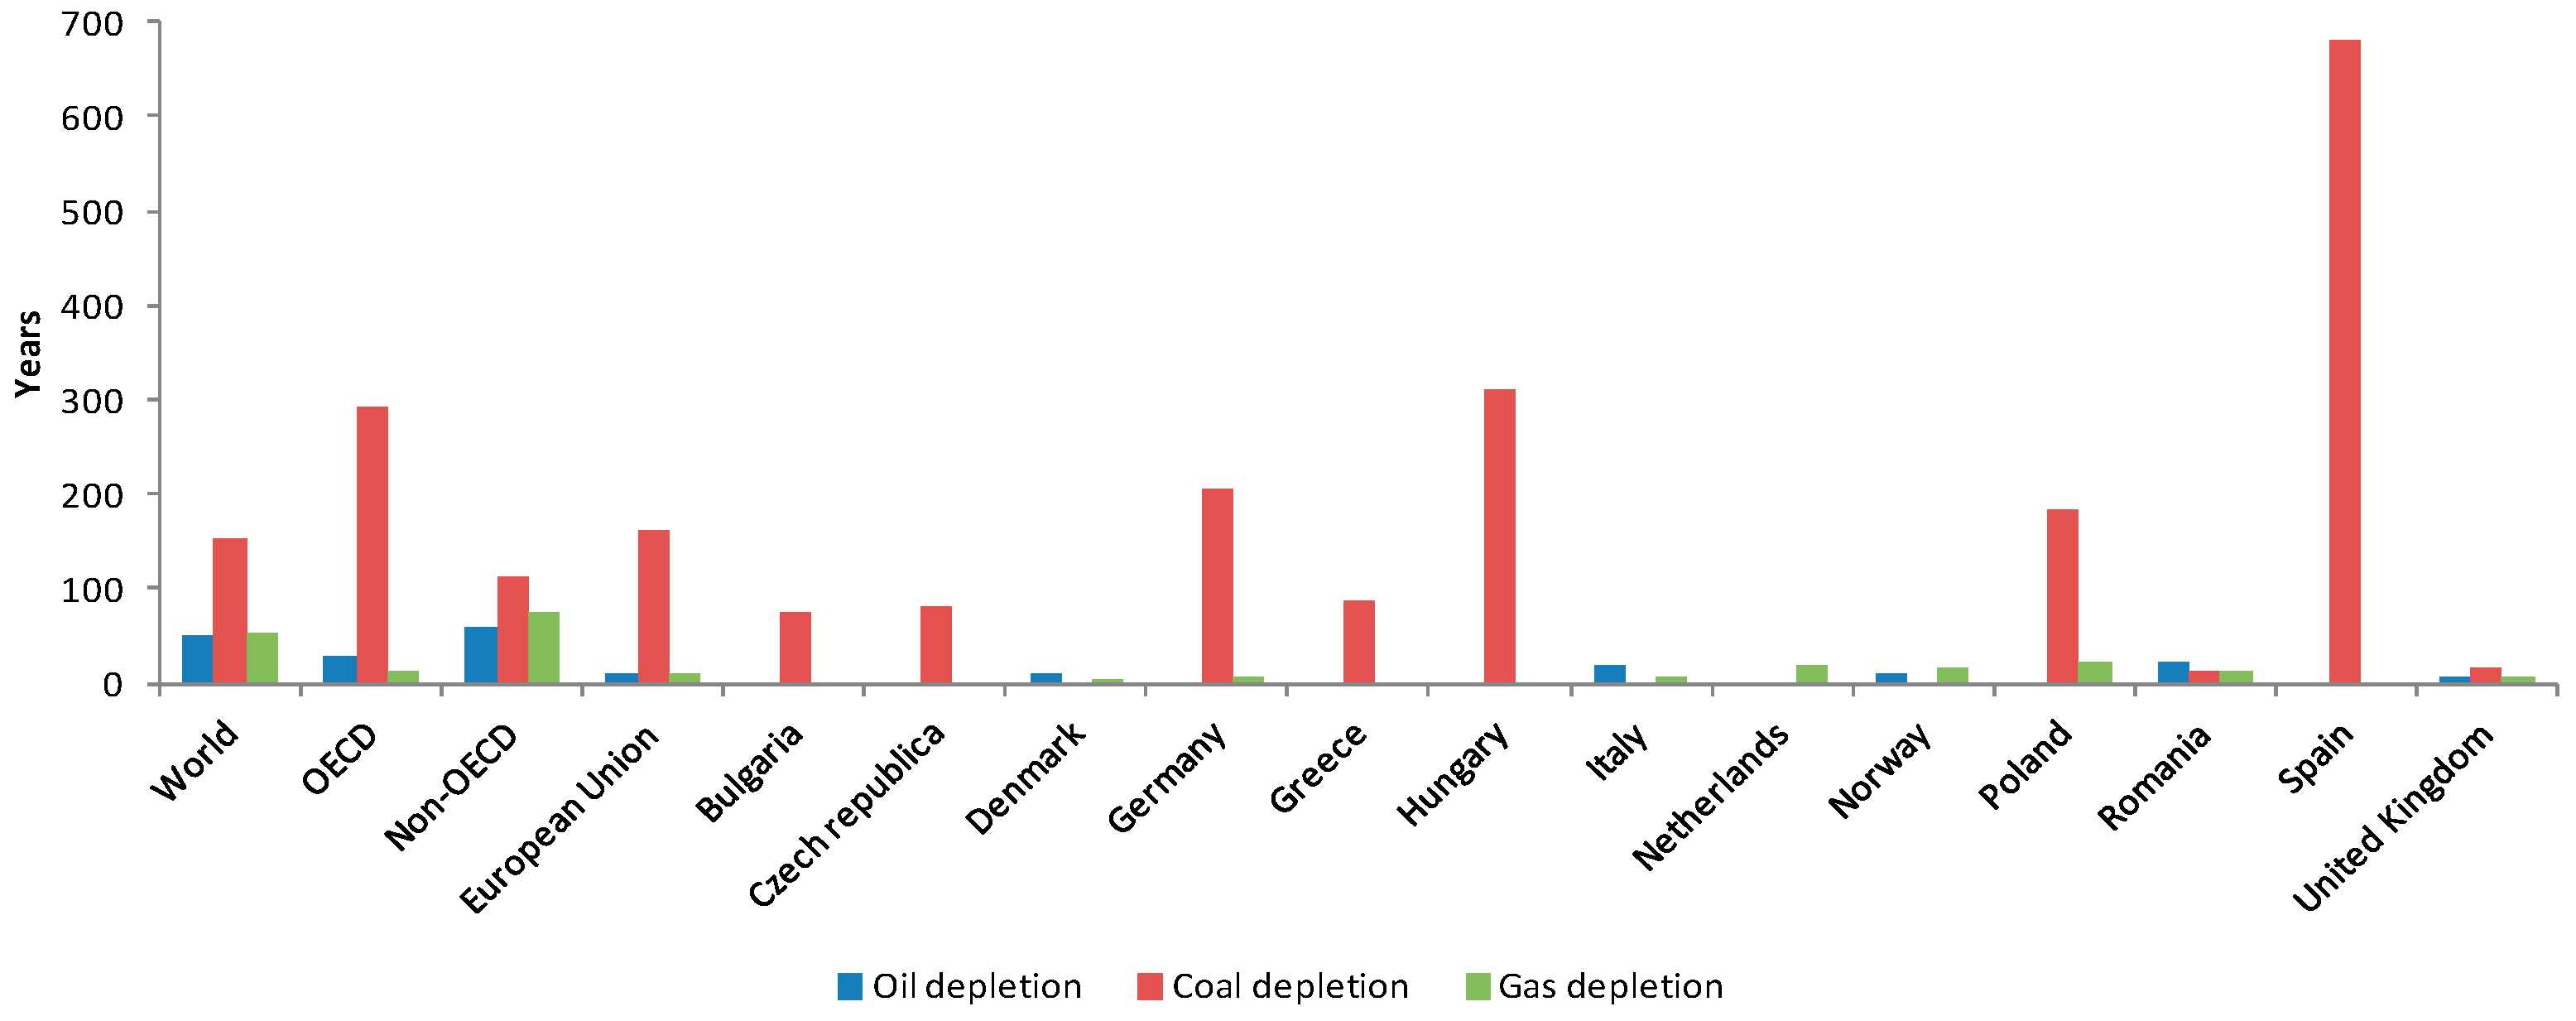
The European countries do not possess many fossil fuel resources, as can be verified in Table 1. Figure 3 presents oil, coal, and gas depletion for the world and some European countries (data from [24]). Eurasian countries, such as the Russian Federation, were not considered in this analysis. As shown in Figure 3, the result for coal depletion in Spain is very high (>500 years), because its production is very low. Conversely, Poland has much higher reserves of coal than Spain, but its production is 75 times higher, which results in less years to fossil fuel depletion in Poland.
3.4. Fossil Fuel Energy Consumption and Other Variables
Another stage of this work was to analyze the relationship of fossil fuel energy consumption (FFEC) and fossil fuel reserves (FFR) with other variables such as energy dependence (ED, calculated as the percentage of imports in total energy consumption) and share of renewable energy (SRE) in gross final energy consumption (data from [23]). Norway was excluded from this analysis because the value for energy dependence was very different from all the other countries’ values, and that could have significantly affected the results.
Table 2 presents the results of a correlation analysis made by two methods, one that uses the Pearson correlation and the other that uses Spearman’s correlation. A significant negative correlation was found for energy dependence and share of renewable energy and fossil fuel energy consumption and share of renewable energy by both methods (p < 0.05). Since fossil fuel energy consumption and share of renewable energy are negatively correlated, this means that the higher the share of renewable energy the lower the fossil fuel energy consumption. The same can be said of the correlation concerning energy dependence and share of renewable energy. Fossil fuel reserves presented a significant positive correlation with fossil fuel energy consumption in the Spearman’s correlation, which has some justification, because the ownership of fossil fuel reserves may induce some fossil fuel consumption since it is a resource that the country possesses. Table 3 presents the confidence intervals (for 95%) for these two significant Pearson correlations.
GIC (gross final energy consumption per capita in GJ) presented a significant negative correlation with fossil fuel energy consumption and a positive one with share of renewable energy when the Pearson correlation was used (Table 2). This should be carefully followed, because it means that the higher the share of renewable energy the higher the GIC per capita. By applying the Shapiro–Wilk test for assessing normality, it was possible to conclude that all hypotheses of normal distribution were rejected except for energy dependency, so the Spearman’s correlations were more reliable. When Norway was included, all hypotheses of normal distribution were rejected.
Most countries presented a high fossil fuel energy consumption and a low share of renewable energy. The exceptions were Iceland and Sweden, which presented a low fossil fuel energy consumption and a high share of renewable energy, and Norway, which presented high percentages for both variables. In Iceland, electricity came from hydro (73%) and geothermal (27%) sources in 2016, and the majority of houses were heated using geothermal energy. Iceland still presented a high dependence on fossil fuels when considering transportation and fishing [28,29]. In 2016 in Sweden, almost 98% of electricity came from nuclear and renewable (40% from hydroelectric power), and its share of renewable energy was the highest in the European Union [23,30]. In Norway, for the same year, electricity was mainly generated by hydro resources (97%). However, Norway is a supplier of oil and gas, since it has significant hydrocarbon resources [31]. Due to this, Norway was excluded from the correlation analysis since the value for energy dependence is very different from the other countries’ values.
The significant negative correlations observed between fossil fuel energy consumption and share of renewable energy and energy dependence and share of renewable energy show that most European countries have a long pathway ahead in order to achieve low carbon energy systems. It is definitely necessary to increase the share of renewable energy and continue with the incentives for renewable energy. The exceptions to this trend described above show that it is necessary that each country should choose its energy mix according to its own local characteristics, making the most of its natural renewable resources.
Nuclear energy is low carbon energy; however, it presents several disadvantages, such as the consequences of nuclear accidents or the management of nuclear wastes, which impact on the environment. These aspects can mask the positive characteristics of this kind of energy and can be an obstacle to its implementation or continuity, especially when comparing it with renewable energy.
3.5. Analysis of Gross Inland Consumption per Capita Using Kruskal–Wallis Test
In the Kruskal–Wallis test, four independent variables were considered, namely energy dependence, fossil fuel energy consumption, share of renewable energy, and fossil fuel reserves, and the GIC per capita was the dependent variable. The results for the Kruskal–Wallis test are presented in Table 4. Analyzing the results, it is possible to conclude that significant differences (p < 0.05) were found for share of renewable energy. For all other variables, statistical differences were not found. Norway was not considered in the first test because its value for energy dependence is completely different from the values of the other countries, and it could have significantly affected the results.
The results of this statistical test seem to corroborate the link between GIC per capita and share of renewable energy. When the share of renewable energy is higher, between 50% and 75%, the average GIC is much higher than in the other groups. Looking closer at the data, it is possible to conclude that this result was obtained due to Iceland. If Iceland is excluded, no significant differences are found—its GIC is more than two times the next higher value.
3.6. Fossil Fuel Energy Usage Projection to 2050
According to the scenarios developed by the World Energy Council [20], the primary energy supply in 2050 will be 879 EJ/y in the Jazz scenario and 696 EJ/y in the Symphony scenario, where the share of fossil fuels in the energy mix will be 79% and 59%, respectively. Jazz gives priority to achieving individual access and affordability of energy through economic growth, and Symphony gives priority on achieving environmental sustainability through internationally coordinated policies and practices [20]. In the Jazz scenario, the share of fossil fuels is similar to the present share of fossil fuels [22]. In this work, the impact on the proven reserves of fossil fuels was estimated by calculating an annual average increase in energy which will be reflected in an equal increase of the energy production rate in the different fossil fuels (since the energy mix is similar). The average annual increase in the Jazz scenario was 1.2% and that increase was considered in the production of energy from oil, coal, and gas taking into consideration the energy content of each fossil fuel [24]. For solid fuels an average value was considered between hard coal and lignite and sub-bituminous coal. It was possible to conclude that by 2050 it will only remain approximately 14% of oil proven reserves, 72% of coal proven reserves and 18% of gas proven reserves. Given the small reserves of European countries, it means that if they need to use their fossil fuel reserves, they will rapidly disappear. However, technological advances in several areas can help to find new reserves/resources and also help to increase the efficiency in energy use. Biofuels are also being studied to find substitutes for some products produced from fossil fuels [32,33]. In addition, the increase in primary energy in Europe will be lower than in other regions of the world. Some studies are also evaluating the role of renewable energy and the possibility of having a European energy system based on 100% renewable sources [34,35,36,37].
4. Conclusions
One of the conclusions of this work is that many European countries are still heavily dependent on fossil fuels. The values for the fossil fuel energy consumption indicator is higher than 60% for most countries, which corresponds to 24 countries out of the 29 European countries analyzed in this study. Additionally, 10 countries present values higher than 80%, which includes countries, such as Germany and the United Kingdom, that are considered leaders in the shift to renewable energy. This means that, in spite of the efforts and changes in energy policies made by European countries, there is still a long way ahead to achieve low carbon energy systems. Moreover, fossil fuels do not exist in quantity in most of the European countries. Solid fuels present the highest availability, but, as is known, they present more severe environmental impacts. However, probably due to European legislation, the fossil fuel energy mix of the European countries studied does not depend heavily on solid fuels, which is a positive aspect from an environmental and social perspective. The positive factor is that the renewable energy and fossil fuel energy consumption indicators are negatively correlated, the higher the first the lower the other. This work also revealed that a correlation between gross inland consumption (GIC) per capita and share of renewable energy should be carefully followed and further studied in the future, since it seems that they could be positively correlated. The indicators that were calculated and the mathematical and statistical analysis performed all clarified and highlighted the present trends. It was possible to estimate that by 2050 (considering Jazz scenario) it will only remain approximately 14% of oil proven reserves, 72% of coal proven reserves and 18% of gas proven reserves. If European countries need to use their limited fossil fuel reserves, they will fast disappear. This work provided relevant information for the decision-making process and to increase awareness in a comprehensive way. Renewable energy is a key issue to decrease fossil fuel usage and to the shift to low carbon energy systems.
Author Contributions
Conceptualization and methodology, F.M.; writing—original draft preparation, F.M., C.F., and M.S.; writing—review and editing, N.C.
Funding
This work was financially supported by project UID/EQU/00511/2019—Laboratory for Process Engineering, Environment, Biotechnology and Energy (LEPABE) funded by national funds through FCT/MCTES (PIDDAC), by project UID/EQU/00305/2013—Center for Innovation in Engineering and Industrial Technology (CIETI), and by European Union (FEDER funds through COMPETE) and National Funds (FCT) through project UID/QUI/50006/2013.
Conflicts of Interest
The authors declare no conflict of interest.
References and Note
- Sugiawan, Y.; Managi, S. New evidence of energy-growth nexus from inclusive wealth. Renew. Sustain. Energy Rev. 2019, 103, 40–48. [Google Scholar] [CrossRef]
- Caetano, N.S.; Mata, T.M.; Martins, A.A.; Felgueiras, M.C. New Trends in Energy Production and Utilization. Energy Procedia 2017, 107, 7–14. [Google Scholar] [CrossRef]
- Savvidis, G.; Siala, K.; Weissbart, C.; Schmidt, L.; Borggrefe, F.; Kumar, S.; Pittel, K.; Madlener, R.; Hufendiek, K. The gap between energy policy challenges and model capabilities. Energy Policy 2019, 125, 503–520. [Google Scholar] [CrossRef]
- Pillot, B.; Muselli, M.; Poggi, P.; Dias, J.B. Historical trends in global energy policy and renewable power system issues in Sub-Saharan Africa: The case of solar PV. Energy Policy 2019, 127, 113–124. [Google Scholar] [CrossRef]
- Khan, M.M.; Zaman, K.; Irfan, D.; Awan, U.; Ali, G.; Kyophilavong, P.; Shahbaz, M.; Naseem, I. Triangular relationship among energy consumption, air pollution and water resources in Pakistan. J. Clean. Prod. 2016, 112, 1375–1385. [Google Scholar] [CrossRef]
- Zheng, S.; Yi, H.; Li, H. The impacts of provincial energy and environmental policies on air pollution control in China. Renew. Sustain. Energy Rev. 2015, 49, 386–394. [Google Scholar] [CrossRef]
- Lott, M.C.; Pye, S.; Dodds, P.E. Quantifying the co-impacts of energy sector decarbonisation on outdoor air pollution in the United Kingdom. Energy Policy 2017, 101, 42–51. [Google Scholar] [CrossRef] [Green Version]
- Li, S.; Feng, K.; Li, M. Identifying the main contributors of air pollution in Beijing. J. Clean. Prod. 2017, 163, S359–S365. [Google Scholar] [CrossRef]
- Zhang, Y.; Qu, S.; Zhao, J.; Zhu, G.; Zhang, Y.; Lu, X.; Sabel, C.E.; Wang, H. Quantifying regional consumption-based health impacts attributable to ambient air pollution in China. Environ. Int. 2018, 112, 100–106. [Google Scholar]
- Narula, K. Global Energy System and Sustainable Energy Security. In The Maritime Dimension of Sustainable Energy Security; Springer: Singapore, 2019; pp. 23–49. [Google Scholar]
- Saffari, M.; de Gracia, A.; Fernández, C.; Belusko, M.; Boer, D.; Cabeza, L.F. Optimized demand side management (DSM) of peak electricity demand by coupling low temperature thermal energy storage (TES) and solar PV. Appl. Energy 2018, 211, 604–616. [Google Scholar] [CrossRef]
- Hossain, M.S.; Madlool, N.A.; Rahim, N.A.; Selvaraj, J.; Pandey, A.K.; Khan, A.F. Role of smart grid in renewable energy: An overview. Renew. Sustain. Energy Rev. 2016, 60, 1168–1184. [Google Scholar] [CrossRef]
- Urpelainen, J. RISE to the occasion? A critique of the World Bank’s Regulatory Indicators for Sustainable Energy. Energy Res. Soc. Sci. 2018, 39, 69–73. [Google Scholar] [CrossRef]
- Sheinbaum-Pardo, C.; Ruiz-Mendoza, B.J.; Rodríguez-Padilla, V. Mexican energy policy and sustainability indicators. Energy Policy 2012, 46, 278–283. [Google Scholar] [CrossRef]
- Coady, D.; Parry, I.; Sears, L.; Shang, B. How large are global fossil fuel subsidies? World Dev. 2017, 91, 11–27. [Google Scholar] [CrossRef]
- Lia, J.; Sunb, C. Towards a low carbon economy by removing fossil fuel subsidies? China Econ. Rev. 2018, 50, 17–33. [Google Scholar] [CrossRef]
- Mohr, S.H.; Wang, J.; Ellem, G.; Ward, J.; Giurco, D. Projection of world fossil fuels by country. Fuel 2015, 141, 120–135. [Google Scholar] [CrossRef]
- Bauer, N.; Hilaire, J.; Brecha, R.J.; Edmonds, J.; Jiang, K.; Kriegler, E.; Rogner, H.-H.; Sferra, F. Assessing global fossil fuel availability in a scenario framework. Energy 2016, 111, 580–592. [Google Scholar] [CrossRef]
- EIA. Annual Energy Outlook 2018 with Projections to 2050; EIA: Washington, DC, USA, 2018. [Google Scholar]
- World Energy Council. World Energy Scenarios—Composing Energy Futures to 2050; World Energy Council: London, UK, 2013. [Google Scholar]
- Martins, F.; Felgueiras, C.; Smitková, M. Fossil fuel energy consumption in European countries. Energy Procedia 2018, 153, 107–111. [Google Scholar] [CrossRef]
- IEA. Key World energy Statistics 2017; IEA: Paris, France, 2017. [Google Scholar]
- Available online: http://ec.europa.eu/eurostat (accessed on 19 March 2018).
- BP. Statistical Review of World Energy; BP: London, UK, 2017. [Google Scholar]
- Dalgaard, P. Regression and Correlation. In Introductory Statistics with R; Springer: New York, NY, USA, 2008; pp. 109–125. [Google Scholar]
- Dalgaard, P. Analysis of Variance and the Kruskal—Wallis Test. In Introductory Statistics with R; Springer: New York, NY, USA, 2008; pp. 127–143. [Google Scholar]
- European Parliament and Council, Directive 2009/28/EC of the European Parliament and of the Council of 23 April 2009.
- ORKUSTOFNUN. National Energy Authority, Meet Iceland—A pioneer in the Use of Renewable Resources; ORKUSTOFNUN: Reykjavik, Iceland, 2009. [Google Scholar]
- ORKUSTOFNUN. National Energy Authority, Energy Statistics in Iceland 2016; ORKUSTOFNUN: Reykjavik, Iceland, 2017. [Google Scholar]
- IEA. Sweden—Energy System Overview; IEA: Paris, France, 2017. [Google Scholar]
- IEA. Norway—Energy System Overview; IEA: Paris, France, 2017. [Google Scholar]
- Varanda, M.; Pinto, G.; Martins, F. Life Cycle Analysis of Biodiesel Production. Fuel Process. Technol. 2011, 92, 1087–1094. [Google Scholar] [CrossRef]
- Brito, M.; Martins, F. Life cycle assessment of butanol production. Fuel 2017, 208, 476–482. [Google Scholar] [CrossRef]
- Blazquez, J.; Nezamuddin, N.; Zamrik, T. Economic policy instruments and market uncertainty: Exploring the impact on renewables adoption. Renew. Sustain. Energy Rev. 2018, 94, 224–233. [Google Scholar] [CrossRef]
- Zappa, W.; Junginger, M.; van den Broek, M. Is a 100% renewable European power system feasible by 2050? Appl. Energy 2019, 233–234, 1027–1050. [Google Scholar] [CrossRef]
- Scarlat, N.; Dallemand, J.-F.; Monforti-Ferrario, F.; Banja, M.; Motola, V. Renewable energy policy framework and bioenergy contribution in the European Union—An overview from National Renewable Energy Action Plans and Progress Reports. Renew. Sustain. Energy Rev. 2015, 51, 969–985. [Google Scholar] [CrossRef]
- Martins, F. PV sector in the European Union countries—Clusters and efficiency. Renew. Sustain. Energy Rev. 2017, 74, 173–177. [Google Scholar] [CrossRef]
Figure 1.
Fossil fuel energy mix in the European Union countries (adapted from [21]).
Figure 1.
Fossil fuel energy mix in the European Union countries (adapted from [21]).

Figure 2.
Fossil fuel energy consumption indicator in the European Union countries.

Figure 3.
Fossil fuel depletion.


Table 1.
Fossil fuel proven reserves [24] in European countries.
Table 1.
Fossil fuel proven reserves [24] in European countries.
| Country | Oil Reserves | Coal Reserves | Gas Reserves |
|---|---|---|---|
| (Million Barrels) | (Million Tonnes) | (Billion Cubic Meters) | |
| Bulgaria | 0 | 2366 | 0 |
| Czech Republic | 0 | 3676 | 0 |
| Denmark | 400 | 0 | 14 |
| Germany | 0 | 36,212 | 37 |
| Greece | 0 | 2876 | 0 |
| Hungary | 0 | 2909 | 0 |
| Italy | 500 | 0 | 37 |
| Netherlands | 0 | 0 | 700 |
| Norway | 7600 | 0 | 1800 |
| Poland | 0 | 24,161 | 100 |
| Romania | 600 | 291 | 100 |
| Spain | 0 | 1187 | 0 |
| United Kingdom | 2500 | 70 | 200 |
Table 2.
Correlation between variables.
| ED | FFEC | SRE | FFR | GIC | ED | FFEC | SRE | FFR | GIC | ||||
|---|---|---|---|---|---|---|---|---|---|---|---|---|---|
| ED | Pearson | 1 | 0.353 | −472 * | −0.037 | −0.210 | Spearman’s | 1.000 | 0.279 | −0.407 * | −0.192 | −0.181 | |
| Sig. (2-tailed) | - | 0.065 | 0.011 | 0.851 | 0.283 | Sig. (2-tailed) | - | 0.151 | 0.032 | 0.327 | 0.356 | ||
| N | 28 | 28 | 28 | 28 | 28 | N | 28 | 28 | 28 | 28 | 28 | ||
| FFEC | Pearson | 0.353 | 1 | −820 ** | 0.250 | −0.592 ** | Spearman’s | 0.279 | 1.000 | −0.663 ** | 0.381 * | −0.141 | |
| Sig. (2-tailed) | 0.065 | - | 0.000 | 0.200 | 0.001 | Sig. (2-tailed) | 0.151 | - | 0.000 | 0.046 | 0.474 | ||
| N | 28 | 28 | 28 | 28 | 28 | N | 28 | 28 | 28 | 28 | 28 | ||
| SRE | Pearson | −0.472 * | −0.820 ** | 1 | −0.204 | 0.583 ** | Spearman’s | −0.407 * | −0.663 ** | 1.000 | −0.353 | −0.059 | |
| Sig. (2-tailed) | 0.011 | 0.000 | - | 0.299 | 0.001 | Sig. (2-tailed) | 0.032 | 0.000 | 0.066 | 0.766 | |||
| N | 28 | 28 | 28 | 28 | 28 | N | 28 | 28 | 28 | 28 | 28 | ||
| FFR | Pearson | −0.037 | 0.250 | −0.204 | 1 | −0.078 | Spearman’s | −0.192 | 0.381 * | −0.353 | 1.000 | −0.239 | |
| Sig. (2-tailed) | 0.851 | 0.200 | 0.299 | 0.694 | Sig. (2-tailed) | 0.327 | 0.046 | 0.066 | - | 0.221 | |||
| N | 28 | 28 | 28 | 28 | 28 | N | 28 | 28 | 28 | 28 | 28 | ||
| GIC | Pearson | −0.210 | −0.592 ** | 0.583 ** | −0.078 | 1 | Spearman’s | −0.181 | −0.141 | −0.059 | −0.239 | 1.000 | |
| Sig. (2-tailed) | 0.283 | 0.001 | 0.001 | 0.694 | Sig. (2-tailed) | 0.356 | 0.474 | 0.766 | 0.221 | ||||
| N | 28 | 28 | 28 | 28 | 28 | N | 28 | 28 | 28 | 28 | 28 | ||
* Correlation is significant at the 0.05 level (2-tailed). ** Correlation is significant at the 0.01 level (2-tailed). Sig.—Significance N- number of countries
Table 3.
Confidence intervals for correlation.
| r | n | Lower Bound | Upper Bound |
|---|---|---|---|
| −0.472 | 28 | −0.7185 | −0.1201 |
| −0.820 | 28 | −0.9136 | −0.6439 |
Table 4.
Kruskal–Wallis results.
| Groups | GIC Per Capita (GJ) | ||||
|---|---|---|---|---|---|
| Number | Mean | SD | Kruskal–Wallis Test | ||
| ED (%) | >75; 50–75; 25–50; <25 | 5 8 11 4 | 169.3774 123.8830 149.388 274.536 | 88.16911 27.28434 55.27619 291.03302 | 0.781 |
| FFEC (TJ) | >75; 50–75; 25–50; <25 | 12 13 3 1 | 150.1715 128.6138 209.8192 703.8394 | 60.56168 47.26717 54.04421 | 0.070 |
| SRE (%) | 50–75; 25–50; <25 | 3 9 17 | 380.3492 132.9515 145.2778 | 280.30720 63.98637 52.64289 | 0.030 |
| FFR (TJ) | >10 million; 1–10 million; <1 million | 11 2 16 | 133.5069 117.3098 194.0098 | 47.66839 14.85270 149.6713 | 0.434 |
© 2019 by the authors. Licensee MDPI, Basel, Switzerland. This article is an open access article distributed under the terms and conditions of the Creative Commons Attribution (CC BY) license (http://creativecommons.org/licenses/by/4.0/).
Share and Cite
MDPI and ACS Style
Martins, F.; Felgueiras, C.; Smitkova, M.; Caetano, N. Analysis of Fossil Fuel Energy Consumption and Environmental Impacts in European Countries. Energies 2019, 12, 964. https://0-doi-org.brum.beds.ac.uk/10.3390/en12060964
AMA Style
Martins F, Felgueiras C, Smitkova M, Caetano N. Analysis of Fossil Fuel Energy Consumption and Environmental Impacts in European Countries. Energies. 2019; 12(6):964. https://0-doi-org.brum.beds.ac.uk/10.3390/en12060964
Chicago/Turabian StyleMartins, Florinda, Carlos Felgueiras, Miroslava Smitkova, and Nídia Caetano. 2019. "Analysis of Fossil Fuel Energy Consumption and Environmental Impacts in European Countries" Energies 12, no. 6: 964. https://0-doi-org.brum.beds.ac.uk/10.3390/en12060964
Note that from the first issue of 2016, this journal uses article numbers instead of page numbers. See further details here.