Italian Biogas Plants: Trend, Subsidies, Cost, Biogas Composition and Engine Emissions


1
Department of Industrial Engineering, University of Padova, 35100 Padova, Italy
2
Department of Engineering and Management, University of Padova, 35100 Padova, Italy
*
Author to whom correspondence should be addressed.
Energies 2019, 12(6), 979; https://0-doi-org.brum.beds.ac.uk/10.3390/en12060979
Submission received: 31 January 2019
/
Revised: 21 February 2019
/
Accepted: 7 March 2019
/
Published: 13 March 2019
(This article belongs to the Special Issue Production and Utilization of Biogas)
Abstract
:Italy is one of the leading nations in the biogas sector. Agricultural, landfill, sewage and manure substrates are converted into biogas using anaerobic digestion and, then, into electricity and heat by means of properly arranged internal combustion engines. In this study, after an overview of the European context, the authors present the Italian biogas sector status in terms of development trends and factors that favour/block biogas spread. Despite the fact that biogas is a renewable fuel and a consolidate technology, it is mandatory to examine its real costs, biogas composition and engine combustion products. For this purpose, in the present work, the authors selected six in-operation biogas plants fed by different substrates, investigate plants construction and operation costs and measure both biogas and engine emissions compositions. Biogas status analysis shows a high growth rate until the end of 2012 due to generous Government subsidies while, after supports reduction, a continuous depletion of biogas installations is observed. Alongside the development, established supports overlook also the plant size as well as the cost. In fact, the most widespread plant nameplate electric power is 1 MW while its construction cost ranges between 4.2–4.8 millions of Euros. Real on-site measurements show variable biogas composition while engine emissions are comparable with the natural gas ones.
1. Introduction
Energy is the prime mover of our society. Indeed, in countries with high industrial growth, the standard of living is also high. However, this is strictly related to energy availability. Thus, to boost population growth, urbanization and industrialization, it is crucial to efficiently cover the ever-increasing energy demand by means of cheap energy sources.
Presently, the world energy demand is for 85% [1] fulfilled by fossil fuels (coal, oil and natural gas): exhaustible natural resources characterised by a carbon footprint. In addition, fossil fuels are available only in specific regions: a fact that causes economic concerns and, in several historical periods, geopolitical tensions and crises.
For these reasons, several countries started to seek new effective solutions able to guarantee secure energy supply at reasonable prices and low or even null environment impact. The major outcome is a growing interest into renewable energy production and, in particular, on resources which can replace conventional fuels to produce heat and power. Please note that due to their fossil fuels shortage and population’s increasing awareness about environmental issues, the European countries are the most involved nations.
The European Union (EU) and the other world authorities, after an in-depth discussion, stated that spreading Renewable Energy Sources (RES), improving energy efficiency and mitigating power systems carbon footprint are actions that can help to improve energy security and abate environmental pollution. Hence, they ratify stringent environmental protection actions and energy efficiency policies devoted to a rapid transition to a low carbon economy.
At worldwide level, the Kyoto Protocol [2] was the first international treaty that commits state parties to reduce GreenHouse Gas emissions (GHG) on the basis that global warming is occurring, and this is predominantly linked to human made carbon dioxide (CO) emissions. Despite the Kyoto Protocol was adopted in 1997, it entered into force on 16 February 2005, and will expires in 2020. The year in which the Paris Agreement [3], adopted by consensus on 12 December 2015, enters into force.
At regional level, the EU is the most active region because it progressively fixed objectives for 2020, 2030 and 2050. The European Renewable Energy Directive 2009/28/EC [4] established a common framework for the promotion of energy from renewable sources. In a nutshell, the three ambitious targets for 2020 are: a GHG emissions 20% lower than 1990 levels, a 20% of energy coming from renewable energy and a rise of 20% of energy efficiency. Obviously, to fulfil the common objectives, each European country developed its own National Renewable Energy Action Plan (NREAP). A detailed report which outlines commitments and initiatives put into force by the country to develop renewable energy. In Italy as a whole, the established targets for 2020 are [5]: a 17% share of energy generated from renewable sources in gross final energy consumption, a 17% of heat consumption met by renewable sources, a 26% of electric demand covered by electricity generated from RES and a 10% of energy demand met by renewable resources.
To achieve these targets, support schemes were settled on: feed-in tariffs, energy efficiency credits, renewable building hot water obligations, green certificates, quota system for electricity generated from renewable, biofuel transport quotas, tax relief for biofuels and financial support for research and development activities.
In order to continue RES foster after 2020, European countries have developed and, subsequently, ratified, the 2030 framework for climate and energy and the 2050 low-carbon economy roadmap [6,7]. The 2030 framework is valid for the period 2020–2030 and plans a 40% reduction of GHG emissions from 1990 levels, a 27% increase of the energy saving and an increase of EU energy consumption produced from RES by 27%, while the 2050 low-carbon economy roadmap sets a more ambitious target: a cut of 80% of GHG emissions from 1990 levels. Then, by 2030, the GHG emissions cut needs to be of 40% while, by 2040, a 60% reduction from 1990 levels needs to be achieved.
As stated in several statistical reports (see, e.g., [8]), the actions established in these Regulations contributed to boost RES investments and installations: two aspects that rapidly support the spread of renewable electricity generation.
In 2017, new annual investment in renewable power and biofuels reached 279.8 billion US Dollars (+2% compared to 2016) while, in one year, the renewable power capacity has gone from 2017 GW to 2195 GW: 178 GW added globally. RES power accounted for 70% of net additions to global power generating capacity and new solar photovoltaic (PV) installations alone were greater than the combined additions of coal, natural gas and nuclear power [8].
At the end of 2017, hydro-power is the RES technology with the largest installed capacity worldwide: 1114 GW (+1.7% compared to 2016). Wind power capacity is in second place with 539 GW (+9.6% compared to 2016) while PV is the third larger contributor with 402 GW (+24.6% compared to 2016). Bioenergy capacity reached 122 GW while geothermal and ocean power capacity reached 12.8 GW (+5% compared to 2016) and 0.5 GW (+0% compared to 2016), respectively.
Please note that despite in 2017 RES power accounted for 70% of the net additions to global power generating capacity, global carbon dioxide emissions, related to energy production, rose to 1.4% due to the robust world economic growth (+3.7% compared to 2016), the low fossil fuel prices and the weak penetration of the energy efficiency concept.
Similar trends can be observed in the Italian RES sector [9,10] where solar and wind are the most installed technologies.
As depicted in Figure 1a, in 2006, PV plants were 14, in 2007, they became 7647 while, in 2017, PV installations reached 774,014 units. In one year (2006–2007), there was a 54,500% increase while, in 10 years (2007–2017), PV units raised of two order of magnitude and constituted over the 90% of net additions to the Italian power generation capacity.
In terms of installed power (see Figure 1a) and annual gross electricity production (see Figure 1b) the 10 years increment is also staggering. In 2007, the installed power was 86.80 MW with an annual gross electricity production of 39.10 GWh while, 10 years later, the installed power reached 19.682 GW with an annual gross electricity production of 24.378 TWh. This means that PV plants constitute about 20% of the Italian installed power and are able to cover about 7% of the Italian electricity demand.
A similar trend, but with less striking figures, can be recognised in the wind sector. One hundred sixty-nine wind turbines were installed in Italy in 2006. Ten years later, there were 3598. During the same decade (2006–2016), the installed power and the annual gross electricity production rose, respectively, from 1908.3 MW to 9409.9 MW and from 2970.7 GWh to 17688.7 GWh. A growth that brought wind power to be about 8% of the Italian installed power and electricity from wind to be able to cover 5.6% of the Italian electricity demand.
As previously said, at the global level, wind and solar are the technologies with the highest rate of growth in terms of installed units and power due to their capability of generating electrical energy in an environmental friendly way. However, being sources characterised by high variability, unpredictability and uncontrollability, their electricity production suffers of large fluctuations on a daily, monthly or even annually basis. On account of these drawbacks and despite the expected future remarkable contribution to electricity production from wind and solar, several researchers are reconsidering the role and the potential of bioenergy in the future energy scenario. This renewed interest stems from the fact that electricity, heat or both of them can be generated by exploiting the large quantities of unused bio-wastes and bio-residues coming from, e.g., forestry, agriculture and other similar sectors.
Solid, liquid and gaseous biofuel like wood, biogas, biomethane, bioethanol, biodiesel, vegetable oil, etc. are available worldwide, can generate electricity, thermal energy or both of them in an eco-friendly way, guarantee a stable and programmable production without suffering of variability, unpredictability and uncontrollability as in the case of wind and solar, can enhance energy security and reduce GHG emissions. Important features which have renewed the interest in these sources both within the developed and developing countries.
More specifically, bioenergy truly constitutes an opportunity to boost in-developing countries rural development because they can:
- Improve or reinforce energy security. They can help to reduce fossil fuels import as well as the dependence from foreigner countries natural resources.
- Develop local bioenergy chains. In this way, new local markets with regional producers can be established as well as new forms of employment for local people. Aspects that can positively affect agricultural and rural incomes with the result of boosting economic growth and, consequently, reduce poverty.
- Support regional development without increasing local, regional or even global GHG emissions.
Nevertheless, the last bullet point clearly explains why also the most developed countries and, in particular the European ones, consider bioenergy a key source in their policy agenda. However, a massive and on large-scale exploitation of bioenergy is the cause of deep concern about food security and environmental impact [11,12]. In particular, the first point of discussion is still overly focused on food versus fuel and why agricultural crops should be redirected to biofuels to the detriment of the food supply. On the other hand, the second critical point is linked to the negative environmental effects of biofuel support policies: indirect land-use change effects, indirect output use change effects, loss of natural habitats and large use of fertilizers and pesticides due to the need for pushing crops growth and, subsequently, their production.
To overcome these issues, several researchers worldwide are working, on the one hand, to estimate the bioenergy potential and how can be efficiently used for electricity production, thermal energy generation or combined heat and power (CHP) production. On the other hand, defining how authorities can support bioenergy sustainable development or how the massive use of these kind of RES can boost the competition between energy and food production are the other hot research topics. Obviously, these research are generally focused on a specific type/kind of bioenergy. Therefore, being this work focused on biogas, it is interesting to investigate research lines linked only to this biofuel.
Generally speaking, in biogas field, the following areas are hot research topics:
Despite the huge number of research conducted on biogas, to the authors’ knowledge, no one is focused on the Italian biogas sector or analysed the drives that, firstly, supported its development and, then, stemmed it.
For this purpose, in the present work, the authors firstly introduce the concept of biomass, bioenergy, biofuels and biogas to clarify the differences and the meaning of each terms. Then, they examine the biogas sector at EU and Italian level in order to figure out its trend of development, the legislation evolution and factors that influenced its past growth, but also that can boost or stem its present and future progression.
In addition, in the literature, few works focus on biogas composition evaluation and its emissions using real on-site measurements on plants fed by different feedstocks. Usually, published works which evaluate biogas composition are focused on chemical aspects of the anaerobic digestion process and tests are conducted in laboratory scale test rig. To the authors’ knowledge, no experimental measurements are available on in-operation plants which works with different feedstocks. Similarly, only a few works are available on on-site measurements of the emissions of in-operation biogas ICEs fed with biogas derived from different kind of feedstocks. In general, biogas combustion emissions are evaluated using laboratory scale engines in which the fuel is not pure biogas but a mixture of methane and carbon dioxide or natural gas and CO (sometimes this fuel is called “simulated biogas”). Varying methane and carbon dioxide percentage, researchers evaluates combustion products and their quantity. However, in commercial anaerobic digestion plants, the produced biogas is composed by methane, carbon dioxide and several other substances that must be detected and measured as well as the products of biogas combustion.
For this purpose, the authors, after the analysis of biogas legislation at the Italian level in terms of biogas quality and emission limits, selected 20 in-operation biogas plants (BGs) and conducted an experimental campaign devoted to measure feedstocks, digestate, biogas and emissions compositions.
In the present work, among the 20 investigated plants, six are considered and analysed. They are equipped with a 1 MW internal combustion engine while digesters diet is different in terms of type of supplied feedstocks and quantity. For these plants, biogas composition is analysed. Then, the combustion products released by the engines are evaluated and compared with the limits prescribed by the Italian standard and with the exhaust gases components of an engine fed by natural gas. Engines nameplate power and manufacturer are the same for both biogas and natural gas (NG) units. Finally, real construction and operation costs are presented and discussed.
The rest of the paper is organised as follows: in Section 2, bioenergy is firstly defined. Then, the EU and Italian bioenergy sectors are analysed focusing on biogas sub-sector. After that, in Section 3, the Italian Standards which set the acceptable limits for exhaust emissions of biogas engine are presented and compared with the ones adopted in other EU countries. Section 4 reports the method adopted to estimate feedstocks quantity, plant costs and biogas and emissions compositions while, in Section 5, the selected biogas and natural gas plants are described. Plants diet and costs and real measurements on biogas composition and exhaust gases emissions are presented and discussed in Section 6 while conclusion remarks are given in Section 7.
2. Biomass, Biofuels, Bioenergy and Biogas
After the energy markets deregulation and the introduction of policies devoted to RES spread, the bioenergy concept entered the public domain and, sometimes, is confused with other terms like biomass or biofuels. Therefore, it is firstly necessary to define these terms and understand the difference among them (see, Section 2.1). Being this work focused on biogas plants, in Section 2.2 and Section 2.3, the EU and Italian biogas sectors are analysed considering trends, targets and support schemes.
2.1. Definitions and Differences among Bioenergy, Biomass and Biofuels
Biofuels are fuels made from biomass while biomass is the source of bioenergy [50]. Biomass is an organic material derived from plants and animals. In particular, it can come from several organic matters like wood and wood waste, agricultural and forestry crops, agricultural and food industry waste, municipal solid waste, sewage, industrial and animal residues [51,52,53].
Biomass can be directly burnt to produce bioenergy namely heat, electricity or both of them but, in several cases, it is better to treat biomass in some way to convert it into a useful biofuel capable to be easily used to produce, again, bioenergy [54].
A biofuel can be in three forms: solid, liquid or gaseous. Pellets, wood chips and biomass briquettes are examples of solid biofuels that can be used alone in biomass boilers or burnt in conjunction with coal in conventional electricity generation units [55].
Bioethanol and biodiesel were the first biofuel to be produced from biomass. Bioethanol is mainly manufactured by the fermentation of plants containing sugar and starch like sugar crops [56,57] while Biodiesel is made from vegetable oils and animal tallow via transesterification [58,59]. The first one is generally added to gasoline at a ratio of ten percent by volume while biodiesel can be burned in a standard diesel engine as single-fuel (diesel and biodiesel) and dual-fuel (biogas and biodiesel) [60]. Another biofuel is the so called green diesel: a renewable fuel derived from oils which, in turn, are derived from plants, hence from biomass. It is usually mix in a percentage lower than 15% with conventional diesel and used in vehicles designed to operate with fossil diesel fuel. This mixture helps to reduce both fuel costs and engine emissions especially in lightweight vehicles.
Other types of liquid biofuels are propanol, butanol or the one derived from the filtration and purification of low quality vegetable oils like the restaurants’ waste oils. Also these biofuels are mixed with conventional fossil fuels and used to fed lightweight vehicles.
The last form in which biofuels can be produced is the gaseous one. In this case, fuel production process can be gasification, pyrolysis, fermentation or anaerobic digestion [61,62]. The gaseous product can be called “syngas” if biomass is gasified (gasification is a thermochemical process) or “biogas” if gas is produced by the biological decomposition of organic matters in an oxygen deprived environment. Please note that syngas or synthetic gas can be also produced from gasification of coal or from biogas reforming. Syngas is mainly composed by carbon monoxide (CO), carbon dioxide and hydrogen (H) while biogas main components are methane (CH) and carbon dioxide. Both these gaseous biofuels are considered energy vectors, are flammable and need to be purified before being burnt.
As said, biogas results from a process called “anaerobic digestion” (AD). Anaerobic digestion is a biological process, it occurs in an oxygen-free environment and its aim is to degrade biomass organic matters in a gaseous fuel called “biogas” [63]. In order to allow the AD process, biomass organic matters need to be rich in proteins, fats, sugar and starch. Substances contained in feedstock like energy crops, agricultural and industrial residues, animal manures and sewage, municipal and industrial waste. Therefore, compared to other biofuels like biodiesel or bioethanol, biogas fuel can be produced only using biological waste.
Despite the possibility of deriving biogas from agricultural and industrial residues or animal manures and sewage, in the recent years, biogas production adopts large quantitative of energy crops (maize, grasses, beets, sunflowers, etc.). These feedstocks have the ability of stabilizing the AD process, are characterised by fast growth and are ease to procure. This is a fact that, as previously remarked, introduced concerns over the potential adverse impact on food security and environmental repercussion of intensive agricultural production [11,64].
2.2. The EU Biogas Sector: Trend, Targets and Support Schemes
At the global level, biomass plays a key role because, in 2015, it reaches 60 EJ which means 10% of the global primary energy consumption share and 14% of the contribution in terms of final energy consumption [19].
Given its primary products are easy to store and directly convertible into energy [54], it covers most energy needs, including cooking and heating, in in-developing countries like Nepal (97%), Bhutan (86%), Nigeria (85%), Kenya (76%) and Cote d’Ivoire (75%) [65].
Since the early 1990s, thanks to generous supports schemes and environmental actions devoted to emissions abatement, EU countries increased their use of biomass and bio-products. Policies that brought biomass to cover 4% of the EU energy share [66].
However, in developed countries, biomass is used to generate electricity, heat or both of them in complex power generation units while it plays a marginal role in the domestic heating sector or in food preparation activities compared to in-developing nations. Note that producing power from biomass through external combustion is less efficient than converting biomass using, e.g., anaerobic digestion and, then, burn the gaseous biofuel in an internal combustion engine [67].
As stated in [67,68], the production of biofuel, via anaerobic digestion, and the use of biogas is an economic and environmental friendly way to address global energy needs and provide multiple environmental benefits like green energy production of electricity, heat, vehicle fuels, organic waste disposal, GHG emissions reduction and environmental protection. Favourable aspects that spread biogas production around the world. Across Asia, there is a great interest on biogas technology and modern use of biomass, but the vast majority of plants are in the United States and Europe.
In 2000, the world biogas production was 0.28 EJ while, in 2014, it reached 1.28 EJ: a rapid growth that corresponds to a production of 59 billion cubic meter (m) of biogas or 35 billion m of methane equivalent [69].
In EU, from 2005 to 2015, the primary energy production from biogas grew from 167 PJ to 654 PJ while, in the same period, the biogas volume rose from 2.5 to 18 billion m methane equivalent. A value which represents half of the global biogas production [69,70].
Based on statistical analyses [71], the number of EU28 biogas installations rose from 10,508 to 17,662 in the period 2010–2016 while, in the same time, the installed electricity capacity rose from 4158 to 9985 MW (see, Figure 2a). The gross electricity generation from biogas grew rapidly in the last 25 years as depicted in Figure 2b: in 1990 it was 915 GWh, ten years later (2000) it became 6427 GWh while, in 2010 and 2016, it reached 31,818 GWh and 62,704 GWh, respectively.
Analysing the evolution of biogas plants installations and of the installed electricity capacity in Europe, it is important to point out that the highest increment of plant number was registered in the period 2009–2010: +68% (from 6227 to 10,508 units) while the highest growth in installed electricity capacity reached +52% in the period 2011÷2012 (from 4778 to 7265 MW). In the same time, electricity generation from biogas rose from 25,180 GWh to 44,565 GWh, which means +77% of new generation.
As shown in Figure 3a, among the 17662 existing biogas plants, 71% of them run with agriculture feedstock while 16% and 9% derived biogas from sewage and landfill feedstock, respectively. Remaining plants produced biogas from various types of organic waste such as bio and municipal waste (named “other”) or the source are unknown.
In terms of installed power (for clarity see Figure 3b), the situation is slightly different because agriculture feedstock remains the most used substrate: 64% of the total installed capacity (6349 MW) works with agricultural matters, but, in this case, the installed capacity which runs with landfill feedstock is 2.65 times the one fed with sewage substrate: 2178 MW versus (vs.) 821 MW.
Similarly, the electricity generation per feedstock is, in 2016, 45,175 GWh from agriculture feedstock (72%), 8272 GWh from landfill (13%) and 3295 GWh from sewage (5%), while 3967 GWh (6%) and 1994 GWh (3%) is, respectively, generated from plants where information related to feedstock is unknown or coming from various types of organic waste such as municipal, industrial or bio-waste (see, Figure 3c).
As depicted in Figure 3d, the reckon of feedstock use for biogas production in 2016 shows that energy crops and agri-residues produced 39% each; bio-, municipal and industrial waste contributed for 8% while sewage and unknown feedstock supplied 5% and 9%, respectively.
In the biogas sector, Germany is the leading country. In terms of number of plants, 10,849 (which corresponds to the 61.5% of the EU28) are installed in Germany while Italy and France are in second and third place with 1555 and 873 plants, respectively. Germany is also in the first place in regards to installed electricity capacity and electricity generation from biogas: 4635 MW of 9985 MW and 34,162 GWh of 62,704 GWh are, respectively, installed and generated in Germany. The United Kingdom (UK) and Italy are, respectively, in the second and third place in terms of installed electricity capacity with 1543 MW and 1171 MW while, there is a places inversion between these countries when the electricity generation is considered: 9368 GWh are generated in Italy against the 7832 GWh produced in UK.
Given that Government supports were established for electricity production from biogas, the technologies that can be adopted to convert this fuel in useful electricity are: Stirling engine, gas turbine, fuel cell, spark ignition or diesel internal combustion engines.
Despite the large variety of commercially available technologies, the most adopted solution is constituted by an internal combustion engine. Around Europe, as stated in [72], approximately 50% of the installed units are equipped with spark ignition ICEs while the remaining 50% adopts Diesel internal combustion engines. Solutions in which gas turbines or fuel cells are used to convert biogas in electricity are really few.
Spark ignition engines are adopted when the required electrical power ranges between 100 kW and 1 MW while Diesel engines are employed when the required power is less than 100 kW. For this reason, it is common to install Diesel engines in small scale agricultural biogas plants. In addition, in Diesel engine biogas is generally mixed with Diesel fuel; then, in this case, ICES are dual-fuels engine.
Being initially designed for natural gas applications, spark ignition ICEs are characterised by high electrical efficiency (34–40%), long lifespan (60,000 h of operation) and low-cost (1000–1300 US$/kW) [72]. Ignition Diesel engines lifespan is approximately half of the spark ignition ones (35,000 h of operation) and they require frequent oil analysis (every 465 h of operation). An aspect that increases biogas plant operating costs [72].
In terms of emissions, spark ignition ICEs are more efficient than Diesel engines but, both of them, need to be monitored in order to comply prescribed limits fixed by regional or national authorities.
As mentioned above, biogas sector development has been planned and pushed at the European level by means of European targets in terms of total installed electricity capacity. These annual targets have been shared among EU members and set in their own National Renewable Action Plan (NREAP). In each EU Member NREAP report, the support actions established to boost RES development have been pointed out with the aim of fulfil the pre-defined annual target. Figure 4 shows the EU biogas yearly targets for the period 2010–2020 (NREAP targets).
As said, at each member state is assigned an annual target that needs to be fulfilled. To achieve fixed targets, each member state developed its National Renewable Energy Action Plant in which its installed electricity capacity targets and established support schemes on annual basis are specified.
Looking again at Figure 4, it is interesting to highlight that from 2012 unit 2016, the EU28 installed electricity capacity has repeatedly beaten the annual fixed target. As an example, in 2012, the annual target was surpassed by 928 MW (+15%), while, in 2016, the target was outdone by 1395 MW (+16%). The positive trend is strictly related to German and Italian biogas development boosted by generous support schemes. However, at the time of writing, these Governments cut financial supports. The result is biogas installations slowed down or blocked. So, to compensate Germany and Italy growth reduction and reach the 2020 collective targets, it is fundamental that countries like Romania, Portugal, Greece, Poland and France boost their biogas sector and reach their own targets.
As an example, in 2016, the Romanian target was set to 160 MW, while the installed electricity capacity was 9 MW. Similarly, Portuguese, Greek, Polish and French targets were 120 MW, 120 MW, 280 MW and 415 MW while the installed electricity capacity reached 88 MW, 58 MW, 234 MW and 393 MW: a lack of 162 MW of originally budgeted power which needs to be absolutely installed.
Support schemes are vital instruments to achieve a rapid and smooth transition toward RES but, they are also crucial to push renewables economic competitiveness with fossil fuels technologies. At the European level no indications are given about type of support schemes because supports for biogas, biomethane and electricity from biogas are established at national level.
Across Europe, a wide range of schemes have been implemented with more or less successful outcomes. Incentives can be grouped in two categories: price-based and quality-based methods. Feed-in Tariffs or Feed-in Premiums are price-based approaches; they are, respectively
- A technology specific remuneration per unit of renewable energy. The tariff is defined and guaranteed for a certain period from National Authorities. Depending on technology type, source quality, plant size and location, the payment amount changes. Obviously, a progressively reduction of the tariff over the years is usually implemented
- A technology specific remuneration per unit of RES and a technology specific subsidy level per unit of renewable energy at a pre-defined, fixed or floating quota. Also in this case, depending on technology or plant size, etc., the tariff changes.
Quota or Green Certificates (GC) and fiscal incentives are quality-based incentives. In the first case, renewable energy producers remuneration derived from selling energy to the grid and the certificates on the green certificates marker. In the second case, a tax exemptions or reductions is applied to renewable energy producers.
Among support schemes, Feed-in Tariffs is the most adopted approach even if all supports are in general simultaneously implemented. For further details, in Section 2.3, the Italian case is presented. It is important to note that support schemes are crucial instruments to reach the economic competitiveness of a certain kind of technology; so, their rapid reduction can slow down or even stop the technology spread. Therefore, it would be useful to plant at EU level these strategic aspects in order to harmonise rules and boost again biogas installations.
Finally, it is interesting to examine biomethane sector at the European level. In 2016, biomethane plants were 503 and were able to generate 17,264 GWh. From 2011 to 2016, the biomethane production rose from 752 GWh to 17,264 GWh. The highest growth rate was registered in 2013 with +308% but, also in 2012, a rose of +203% was observed.
Germany is, as in biogas production, the leading nation with 9400 GWh of biomethane production followed by UK and Sweden: 3663 GWh and 1297 GWh, respectively. Italy is only at the 13th place with 50 GWh of biomethane production.
At the time of writing, no EU targets for biomethane installations have been set up. In terms of support scheme for biomethane production only in nine EU countries are set: Italy, Germany, UK, France, Norway, Finland, Austria, Iceland and Sweden. Despite Italy being one of these countries, the established support actions are not able to boost the biomethane sector. This is probably related, on the one hand, to poor incentives and, on the other hand, to the absence of national biomethane yearly targets.
2.3. The Italian Biogas Sector: Trend, Targets and Support Schemes
Based on the analysis of the EU scenario, there is no doubt that Italy is one of the European countries with the most developed biogas sector.
The Italian biogas sector started its development in the early 1990s; however, only in 1999 with the establishment of the green certificate system, did biogas electricity production, for the first time, attempt to be boosted through state subsidies.
From 1995 to 1999, the growth of biogas electricity production was approximately 100 GWh per year while, notwithstanding the efforts made and the initiatives carried out by the Government (the green certificate system), biogas electricity production raised from 500 GWh to 1000 GWh during the period 1999–2008. This means 55 GWh per year: a sluggish growth that led the Italian Government to take conspicuous stimulus actions.
In 2008, with the aim of shaking up the renewables sector, the Italian Government established, in the Budget Act of 2008 [73] and in the ARG/elt 1/09 [74], that electricity generators with an installed power ranges between 1 kW and 1 MW (0.2 MW for wind energy) were entitled to receive a guarantee “All inclusive” feed-in tariff (in Italian “Tariffa omnicomprensiva”) as an alternative to green certificate (Art. 2 par. 145 L 244/07 and Art. 2 par. 3 ARG/elt 1/09).
Therefore, biogas plant with an electric nameplate power in the range 1–1000 kW are eligible to receive the “All inclusive” feed-in tariff as stated in Art. 2 par. 145 L 244/07 and Art. 2 par. 3 ARG/elt 1/09. The “All inclusive” feed-in tariff is guaranteed for 15 years if the plant enters in operation before 31 December 2012. The amount is equal to 0.18 € kWh for plant based on landfill waste while, in the case of plants which derive biogas from biomass substrates, the tariff reaches 0.28 € kWh.
The “All inclusive” feed-in tariff was the only support scheme adopted by biogas plants due to the considerable amount of the incentive, while the most installed nameplate power and adopted technology were 999 kW and ICE, respectively.
Please note that despite green certificates are granted for 15 years as the “All inclusive” feed-in tariff, they are not convenient for generators with an installed power lower than 1 MW because one GC validates 1 MWh of renewable electricity but its monetary value depends on the previous year plant electricity production, the type of feedstock and GC market. As outlined in Art. 2 par 147, 148 L 244/07, the highest GC price is granted to biogas plants which convert agricultural, livestock or forestry bio-products collected in an area of 70 km around the biogas unit.
The “All inclusive” feed-in tariff was the most generous support scheme established in EU for renewable electricity generation. This feed-in tariff was the factor that demonstrated biogas potential and considerably boosted the installations.
Figure 5a depicts the trend of biogas number of plants using EBA [71] and GSE [75] dataset. The “Gestore dei Servizi Energetici—GSE” is the company identified by the Italian Government to pursue and achieve environmental sustainability through the two pillars of renewable sources and energy efficiency, while EBA is the “European Biogas Association”. The discrepancy among available data is related to the fact that EBA dataset is based on data provided by national biogas association. In the Italian case, the association is named “Consorzio Italiano Bioga—CIB”. Being CIB membership not mandatory, several plants can not be inserted in their statistical reports. For the sake of completeness, in the present study, the authors report on both datasets, but trends analyses are based on GSE data due to their higher accuracy.
In the period 2008–2012, biogas plant installations rose from 107 to 1548 while the installed electricity capacity grew from 55 MW to 1342.7 MW (see, Figure 5a,b). In the same period also the electricity production expanded from approximately 1000 GWh to 4620 GWh as depicted in Figure 5b. However, the biggest biogas electricity production growth was observed in the period 2012–2013 because, before 31 December 2012, were put in operation several biogas units with the aim of receiving the “All inclusive” feed-in tariff before it expired.
This skyrocket growth helped to fulfil the Italian Renewable Energy Action Plan yearly targets as explained below. Please note that the Italian NREAP yearly targets were set in accordance with the EU28 yearly targets in order to fulfil the prescribed target of installed power for the year 2020.
In 2009, the EU drafted and approved the Directive 2009/28/EC [4] of the European Parliament and of the Council of 23 April 2009 on the promotion of the use of energy from renewable sources and amending and subsequently repealing Directives 2001/77/EC [76] and 2003/30/EC [77]. As presented in Section 1, the Directive commissioned to member states of the European Union to deploy a report (called National Renewable Energy Action Plan) which describes how the State planed to achieve its legally binding target of share of energy from renewable sources in gross final energy consumption by 2020.
The Renewable Energy Directive 2009/28/EC was transposed by the Italian Government with the D.lgs. 3 March 2011, n. 28 [78] which established two objectives for 2020: an increase of the Italian energy consumption from RES up to 17% and an increase up to 10% of the consumption of renewable in the transportation sector. By means of the Italian NREAP [5], approved in 30 June 2010, the Ministry of Economic Development explained how it intended to fulfil the targets set up in [78]. For the biogas sector, progressive targets for the decade 2010–2020 were established as depicted in Figure 5d.
Obviously, in conjunction with new targets, the Italian Government updated the support scheme which entered into force from 1 January 2013.
New support policies are detailed presented in the Ministerial Decree of 6 July 2012, [79] and it is apply to plants commissioned from 1 January 2013. In the Decree, new, totally rebuilt, reactivated, re-powered or upgraded or renovated RES plants other than photovoltaic with an electric nameplate power of at least 1 kW are eligible to receive the State support. As established in the Budget Act of 2008 and in the ARG/elt 1/09 [73,74], two types of incentives are available depending on plant nameplate power and type and adopted RES: All-inclusive feed-in tariff (To) and Incentive (I).
The All-inclusive feed-in tariff is applicable only to plants with an electric nameplate power lower than 1 MW while Incentive can be applied to plant with a design power lower or higher than 1 MW but which does not benefit of To. The All-inclusive feed-in tariff is computed as the sum of a base feed-in tariff (Tb) and a premium (Pr), if the plant is eligible. As underlined in Annex 1 of the Decree, Tb depends on plant capacity, source kind and plant type while the premium is assigned to plant which, e.g., operates in high efficiency combined heat and power mode or guarantees a high reduction of pollutants emissions.
More complex is the Incentive calculation because I is given by the difference between Tb, gained by Pr (if the plant is eligible), and the hourly zonal electricity price (Pz). The hourly zonal electricity price is computed based on the zone where the plant produces and injects electricity into grid. Pz depends also from the time of day at which it is produced and, obviously, the day itself (weekly days prices are higher than public holidays ones as well as high demand hours compared to off-peak ones).
Please note that plants granted with incentives have the advantage of remaining the owners of the produced electricity while for both Tb and I, the period for which the subsidy is guaranteed depends on plant nameplate power and RES type.
Plants which benefit of the All-inclusive feed-in tariff or the Incentive are not eligible to net metering (“scambio sul posto”) or simplified purchase/resale arrangements (“ritiro dedicato”).
In regards to biogas units, both Tb and I are granted for 20 years independently to plant power and source type. Tb depends on plant capacity and feedstock type while Pr changes with plant capacity, feedstock type and if the plant is considered a high-efficiency CHP unit.
The new Feed-in Premium scheme entered in operation the 1st of January 2013 and it runs until 30 June 2016. It was applied to plants with a rated power from 1 kW to 5 MW while the incentives ranged from 0.109 € kWh to 0.236 € kWh. This Feed-in Premium scheme was hardly considered generous compared with the previous one. Therefore, biogas installations continued to growth in terms of plants number, but the total installed electricity capacity and the related electricity generation remained approximately constant as clearly shown in Figure 5a,b.
The Ministerial Decree of 6 July 2012 entered into force the 1st of January 2013 and expired on 30 June 2016 when entered into force the Ministerial Decree of 23 June 2016 [80]. The Decree updates again the Government supports regarding the electricity generation from RES plants other than photovoltaic with a capacity of at least 1 kW. However, in this case, stringent conditions were set up.
As in the previous Decree, new, totally rebuilt, reactivated, re-powered/upgraded or renovated RES plants other than PV commissioned on or after the 1st of January 2017 can access to the established supports. However, in this Decree, the Government established that new incentives are granted from the 30th of June, 2016 until 30 days after reaching one of the following conditions:
- 1 December 2017 for all renewable plants or, for plants who directly access to supports.
- 5.8 billion € per year. This is the maximum indicative cumulative cost available for renewable plants other than PV which produce electricity.
In addition to the previous conditions, the Government established different paths to incentives access depending on engine nameplate electric power, kind of proposed project and adopted RES:
- Direct access for new, totally rebuilt, reactivated or re-powered/upgraded plants with a capacity not exceeding a given limit and using specific types of sources or for special projects.
- Enrolment into the Registries for new, totally rebuilt, reactivated or re-powered/upgraded and renovated plants.
- Awarding of incentives after participation in a competitive Dutch auctions (electronic auctions held by GSE) for new, totally rebuilt, reactivated or re-powered/upgraded plants: the capacity of these plants shall exceed a given threshold (5 MW).
The Decree also fixed that:
- Incentives can be granted only to grid injected electricity. Therefore, self-consumed electricity is not grated with supports and needs to be excluded from RES electricity generation calculations.
- A maximum installed capacity of 1370 MW of which 800 MW for new onshore wind capacity can be awarded with incentives.
Regarding support schemes, as in previous cases [73,74,79], two types of incentives are available depending on plant nameplate power and type and adopted RES: All-inclusive feed-in tariff (To) and Incentive (I).
The All-inclusive feed-in tariff is applicable only to plant with an electric nameplate power lower than 500 kW while Incentive can be applied to plant with a design power lower or higher than 500 kW but which does not benefit of To. The All-inclusive feed-in tariff is computed as the sum of a base feed-in tariff (Tb) and a premium (Pr), if the plant is eligible. As underlined in Annex 1 of the Decree, Tb depends on plant capacity, source kind and plant type while the premium is assigned to plant which, e.g., operates in high efficiency combined heat and power mode or guarantees a high reduction of pollutants emissions.
As in previous Decree, the Incentive is computed as the difference between Tb, increased by Pr (if the plant is eligible), and the hourly zonal electricity price (Pz). The hourly zonal electricity price is computed based on the zone where the plant produces and injects electricity into the grid. Pz depends also from the time of day at which it is produced and, obviously, the day itself (weekly days prices are higher than public holidays ones as well as high demand hours compared to off-peak ones).
Plants granted with incentives I have the advantage of remaining the owners of the produced electricity while for both Tb and I, the period for which the subsidy is guaranteed depends on plant nameplate power and RES type.
Plants which benefit of the All-inclusive feed-in tariff or the Incentive are not eligible to net metering (“scambio sul posto”) or simplified purchase/resale arrangements (“ritiro dedicato”).
In regards to biogas units, nothing is changed from the previous Decree because both Tb and I are granted for 20 years independently to plant power and source type. Tb depends on plant capacity and feedstock type while Pr changes with plant capacity, feedstock type and if the plant is considered an high-efficiency CHP unit. Obviously, Tb and Pr established in the Ministerial Decree of 23 June 2016, are lower than the ones established in the Ministerial Decree of 6 July 2012, but, in the last Decree, biogas producers can access to tax exemptions.
In fact, in 2017, the Feed-in Tariff is available for biogas plants with a rated power from 1 to 500 kW, it has a duration of 20 years and a value which ranges from 0.085 to 0.233 € kWh.
The further incentives drop coupled with the plant rated power reduction to receive incentives further slowing down the Italian biogas plant installations as, again, depicted in Figure 5a,b.
The blockade of biogas installations is a crucial point because, in 2016, 2735 plants fed by bioenergy where installed in Italy. However, among them, 1995 were biogas units while only 516 and 407 were plants fed by liquid biofuels and solid biomass, respectively.
Bioenergy plants represented the 7.9% of the RES installed power (4124 MW): 40.5% of them are fed by solid biomass and 25% by liquid biofuels while the 34.5% is biogas based power generation units.
In Italy, due to high subsidies until end-2012, the most widespread technology is the four-stroke internal combustion engine with an electric design power of 1 MW. The heat generated by the ICE is partially recovered and used to maintain the digester required temperature (usually the heat recovered from the engine cooling water and the oil employed in the lubrication system) while the exhaust gases are directly released into the environment with a remarkable waste of heat [45].
Bioenergy generation amounted for 19,509 GWh: 18.1% of the Italian RES total production. Biogas plants generated the 42.3% of the 19,509 GWh, while solid biomass and bioliquids contributed for 33.6% and 24.1%, respectively.
Focusing on biogas Regional production, the 81.2% was generated in northern Italy. The Lombardia region contributed for 33.8% while Emilia Romagna, Veneto and Piemonte generated 14.6%, 14.5% and 12.5% of the Italian biogas total production.
Among the 1995 biogas plants (year 2016), 49.6% run with agriculture feedstock while 27% and 19.5% of them derived biogas from animal manure and waste, respectively. The remaining 3.9% run with sludge.
In terms of installed power, the situation is slightly different. Agriculture feedstock remains the most used substrate with 52.6% of the total installed capacity while sludge substrate is in the second place with 28.2% of the total installed capacity. Waste and animal manure contributed for 16.1% and 3.1%, respectively.
Similarly, the electricity generation per feedstock is 66.5% from agriculture feedstock, 17.9% from sludge, 14% from animal manure and 1.6% from waste.
Despite the huge number of biogas plants and largest EU fleet of vehicles fuelled with gas [71], Italy has only 6 biomethane plants: 3 based on agricultural substrates, 2 on municipal solid waste and 1 on landfill waste. All of them sell biomethane to vehicles fuel stations and no one is connected to the natural gas network. As explain also in [71], biomethane is one of the most attracted way to de-carbonise the transportation sector especially in a country with over 1100 gas fuel stations for vehicles refilling and imports crude oil for 21,662 million of Euro.
In conclusion, it is important to remark that:
- Italy ranks second only to Germany in terms of number of biogas plants; this means that approximately 9% of the EU28 installed plants are placed in Italy.
- In terms of installed electricity capacity, Italy is in the third position behind Germany and UK. Then, approximately 12% of the EU28 installed electricity capacity is placed in Italy.
- The Italian biogas plants are mainly devoted to electricity production. In fact, at European level, Italy ranks second only, again, to Germany in terms of electricity generation from biogas. However, despite the second position and an electricity generation of 9368 GWh, German electricity generation is 3.5 fold greater than the Italian one.
- Italy needs to restart biogas installations because, at the time of writing, it fulfils the National Renewable Energy Action Plan targets at 2020, but, in a couple of years, new targets will be set for at least 2030. So, the sector needs new supports especially to expand upon both biogas (for electricity and heat generation) and biomethane (for injection in natural gas network as well as fuel for transportation purposes) sub-sectors.
3. Existing Legislation on Biogas Composition and Its Emissions
In Italy, as in several other European countries, biogas composition is not subject to a specific legislation like biogas engine emissions. Therefore, each biogas plant manufacturer adjust the anaerobic digestion process in such a way that the methane quantity in the produce biogas is the highest possible. This aspect guarantees a higher combustion quality in terms of stability and emissions.
Biogas plant emissions are regulated by the Legislative Decree No 152—3 April 2006 [81] and the Legislative Decree No 118—19 May 2016 [82].
Limits are set for Nitrogen Oxides (NO), Carbon Monoxide (CO), Hydrogen Chloride (HCI) and Volatile Organic Compounds (VOC) expressed as Total Organic Carbon (TOC) while they change based on nameplate thermal power () and plant type: internal combustion engine, gas turbine, other combustion system.
Being Italian biogas used in internal combustion engines, in this work, the authors report on only the Italian limits for biogas ICEs (Table 1). Limits are referred to 0 °C, 1013 mbar, 5% O and to an internal combustion engine which operates at design point conditions.
Bearing in mind Table 1, it is important to note that:
- In [81], the limit set to VOC includes also methane.
- In the updated version of the legislation, see [82], the TOC limit for internal combustion engine with a nameplate thermal power which not exceeds 3 MW is reduced and set equal to 100 mg Nm. Biogas plants must be brought into line with this new legislation until the end of 2016.
- In [82], it is specified that VOC expressed as TOC limit does not include methane and the limit is 100 mg Nm independently to engine nameplate thermal power.
Being Germany and natural gas, respectively, the biogas leader and the biogas competitor, it is mandatory to perform a comparison in terms of set limits.
Comparisons among Italian and German biogas regulated substances show that also Germany restricts NO and CO while no limitations are set for HCl and VOC. Nitrogen Oxides and Carbon Monoxide maximum values depend on engine type and not on nameplate thermal power. NO need to be lower than 500 mg Nm in the case of gas four-stoke engines, 1500 mg Nm for gas compression-ignition engines and 1000 mg Nm for ignition oil diesel engines. Similarly, CO needs to be lower than 1000 mg Nm if the engine is a gas four-stoke engine while in the case of gas compression-ignition engines or ignition oil diesel engines the limit is 2000 mg Nm [72].
In contrast to Italy, Germany defines limits for Sulphur Dioxide (SO) (350 mg Nm) and Formaldehyde (60 mg Nm) [72].
In Italy, internal combustion engines fed by natural gas, independently to the nameplate thermal power, are restricted in terms of:
- Particulate → 5 mg Nm.
- NO→ 350 mg Nm.
- Sulphur Oxide (SO) → 35 mg Nm.
While no prescriptions are set for CO, HCl and TOC.
In this context, it is possible to claim that NO limit, in the case of natural gas, is more stringent than the biogas one, while German regulation prescribe limit to Formaldehyde: a toxic and volatile compound which is known to be a human carcinogen.
For this reason, in the present work, the authors analysed biogas emission components not only taking into account the regulated emissions listed in Table 1 but also substances like particulate, SO, Formaldehyde, etc.
Please note that the experimental campaign included also substances like Polycyclic Aromatic hydrocarbons (PAHs), polychlorinated dibenzo-p-dioxins (PCDDs), polychlorinated dibenzofurans (PCDFs), Aldehydes, etc. These substances are not analysed in the present work because they are the so-called “unregulated emissions”. Emissions for which are not currently available a legislation at both Italian and European level.
4. Method
The analysis of biogas plants’ diet are made considering plants operators’ provided data. Similarly, plants investment and operation costs are derived from data provided by biogas plants operators.
Analyses of biogas composition involved characteristic compounds like methane, carbon dioxide, nitrogen, oxygen, hydrogen, etc. but also elements like volatile organic compounds, particulate or oily mists.
Moisture and temperature measurements are performed in accordance with UNI 10169:2001 while the lower heating value (LHV) are computed based on UNI EN ISO 6976:2008. Percentage of methane, carbon dioxide, nitrogen and oxygen are based on EPA 3C 1996 while hydrogen and ammonia values are measured based on ASTM D1945 2014 and M.U. 632:84 standards, respectively. Total chlorine, fluorine and sulphur are measured based on PO/GEN/036R.0 while inorganic compounds of chlorine and fluorine as well as HSO are computed based on DM 25/08/2000 GU no 223 23/09/2000 All. 2. Hydrogen sulphur calculation refers to M.U. 634:84 while particulate and silica (SiO) are measured using UNI EN 132841:2003 and UNI EN 132841:2003 + Unichem 723/86 + APHA ed 21th 2005, 3111 D. The composition of oily mists is estimated by UNI EN 132841:2003 + M.U. 759:87 while polysiloxanes and the composition of the Refinery Gas are based on UNI EN 13649:2002 and UNI EN 15984:2011, respectively. The EPA TO15 1999 is used to measure volatile organic compounds.
Biogas engine emissions can be grouped as regulated and unregulated emissions. Regulated emissions, in the biogas case, are CO, NO, VOC and HCl while, in the case of an ICE fed by natural gas, they are Particulate, NO and SO. Unregulated emissions considered in this work is Formaldehyde because a comparison between Italian and German Standards is performed.
Exhaust gases temperature and flow rates measurements are performed following the UNI 10169:2001 while PM and Particulate are measured as prescribed by UNI EN ISO 23210:2009 and UNI EN 132841:2003, respectively. Oxygen is evaluated following the specifications reported in UNI EN 14789:2006 while UNI EN 14789:2006 is used to measure Carbon dioxide. Ammonia and HS are measured based on M.U. 632:84 while CO, SO and NO measurements referred to UNI EN 14791:2006. HCl is measured following the UNI EN 1911:2010 while Fluorine inorganic compounds and VOC as TOC are based on DM 25/08/2000 GU no 223 23/09/2000 All 2 and UNI EN 12619:2013, respectively. Formaldehyde is evaluated on the basis of CARB 430 1991.
5. Structure of Biogas Plants
Biogas plants involved in this research project are made up of a reception tank, two primary fermenter, two secondary fermenters, a gas holder, a residue storage tank, a solid feeder, a biogas filtration unit and a biogas ICE.
Primary and secondary fermentes have a cylindrical shape, both are characterised by a height of 6 m but primary fermentes have an an external diameter of 23.7 m while secondary fementers external diameter is 26.7 m. Both primary and secondary fermentes thickness is 0.7 m. In the crawl space between internal and external diameter (fermentes walls), heating tubes and multiple layers of insulation materials are placed. Heating tubes are used to maintain fermenters at a constant temperature as required by the AD process [63]. The heating pipes are fed by the hot water heated up recovering the heat of the engine cooling water and of the lubrication oil.
The residue storage tank has the same dimension of the secondary fermentes while solids feeder are tanks with variable shape and dimensions which are usually placed near fermentes.
As mentioned in Section 2.3, before 31 December 2012, the higher Italian incentive was assigned to biogas plant with an electric nameplate power lower than 1 MW. This aspect boosted the spread of ICEs fed by biogas with a nameplate electric power of 999 kW. Being this engine size the standard and the most widespread one, the authors of the present work consider in their investigation only this type of engine.
Biogas internal combustion engines are GE power units [83] with technical characteristics listed in Table 2. This engine type was initially designed to run with natural gas. Then, with biogas spread, engine manufactures optimised the natural gas engine also for running with biogas. For this reason, the natural gas engine used as reference for emissions comparisons is characterised by the same technical data of biogas units.
Regarding engine control system and strategy, the authors are not allowed to describe it due to non disclosure agreement with plants owners and engines manufacturer.
Please note that this engine is a combined heat and power unit. This means that it generates electricity and heat. In practice, the engine is considered a CHP unit because the heat extracted by the engine coolant and lube oil is used to warm up the water employed to maintain fermentes at their designed temperature. However, only a few engines are equipped with a WHRU able to recover also the heat contained into the engine exhaust gases. This is linked to two issues:
- If the WHRU generates additional electricity using, for example, an organic Rankine cycle (ORC) unit, the plant is made up to a 1 MW ICE and an ORC turbogenerator with a design power of, e.g., 70 kW. In this configuration, the engine is de-rated at 929 kW while the ORC generates 70 kW. Obviously, the engine works in part-load and its efficiency is lower than at design point condition as well as its biogas consumption. The plant total production is lower than 1 MW, so, the highest incentive can be assigned (if the plant entered in operation before the end of 2012). The above-mentioned plant arrangement is adopted only if the biogas plant has access to a limited quantity of feedstock. However, it is important to remark that ORC requires frequent maintenance and the generation unit (ICE + ORC) is more complex to manage and characterised by higher investment cost.
- If the WHRU generates additional heat using, for example, an inverse water generator or steam by means of an inverse steam generator, the issue is related to the water/steam user. Generally, biogas plant are located in remote areas where it is difficult to find users which need heat.
Despite these issues, among the six considered biogas units, one of them is equipped with an ORC unit and another one consists of an ICE plus an inverse water generator, while the ICE fed by natural gas is equipped with an inverse steam generator. The inverse water generator is used to provide hot water to a swimming pool while the inverse steam generator delivers steam to a small ceramic industry.
6. Results and Discussion
After analysing EU and Italian biogas sectors, the research focuses on the analysis of biogas plants diet and “Decision of the Regional Government” that authorized the plant construction as well as building and operation costs.
As previously stated, biogas plants operators take note of feedstock type and amount in order to keep a record of plant consumption level. This activity should be on daily basis but, in several cases, the authors noted typing mistakes or incomplete data. For this reason, being the time requires by the feedstock digestion process approximately of 40–50 days, the authors fitted available data to derive a mean quantity of each feedstock starting from 45 days before biogas and ICE emission measurements.
Table 3 lists plant diet in terms of feedstock type and quantity. By its analysis, it is clear that the selected plants are fed with different feedstock, but all of them adopted maize silage. This feedstock is essential to stabilize the anaerobic digestion process.
BG6 adopts pig sewage because it serves a pig farm while BG5 uses pig sewage as feedstock because it is located near pig farms. In this case, feedstock is purchased while, in the case of BG6, the biogas plant is used to treat animal manure and sewage produced by the farming activity.
Chicken-dung is adopted only in BG5 and it worries plant owner for the frequent formation of limescale in fermenters adduction pipes. In fact, BG5 needs frequent maintenance works to remove limescale formations. Fortunately, during maintenance works there is no need for switching of the ICE thanks to fuel stocked in biogas holders.
Table 4 lists emission limits of selected plants as reported in their Decision of the Regional Government that authorized plant construction and operation.
Being considered plants entered in operation in 2012, located in the same Italian region and subjected to Italian legislation and emissions standards, it is expected that emission limits are the same. Unfortunately, it is not the case because it is the Regional Government that authorizes the plant construction and operation. Then, it can decide to set different limits. A case in point is BG2 which is far from BG1 of about 3 km, but its NO limit is 50 mg Nm lower than in the case of BG1 while CO is half of the one set for BG1. Similarly, the VOC as TOC limit set for BG1 and BG2 is 50% higher than in the case of BG3-BG6. Actually, this is not an issue because, starting from 1 January 2017, the limit is changed and set equal to 100 mg Nm. However, differences between NO or CO limits influenced engines set up in terms of air-to-fuel ratio and, also, the environmental impact of the biogas unit.
The authors tried to understand the criteria adopted to set plants limits but provided explanations were flimsy arguments.
Regarding plants costs, analyses show that plant turnkey cost ranges between 4.2 to 4.8 mln €. Approximately, 65% of total construction cost needs to build fermenters, gas holder, residue storage tank, solid feeder, biogas filtration unit, etc. while the remaining 35% is for biogas engine. Usually, the engine cost is around 1 mln € while the ORC unit or the water boiler which recovers heat from the engine cost exhaust gases costs approximately 5000 € kW and 35–40,000 €, respectively. Please note that ICE cost is the same for both biogas and natural gas engine because the large spread of this type of engine enabled to reduce the cost.
Maintenance costs ranges between 115,000 to 180,000 € per year while, after 7–8 years of operation it is necessary to carry out a major refurbishment that costs approximately 275,000 €. The highest maintenance costs are registered for plant in which chicken-dung is used because this feedstock cause limescale formations in fermenters which need to be frequently cleaned.
The annual cost for feedstocks production ranges from 700,000 to 1,200,000 € per year while digestate disposal costs amounted to 80,000 € per year.
As already mentioned, biogas engines run for approximately 8000 h per year. However, considered plants run for 8100–8570 h per year. So, their electricity production ranges between 8,191,800 and 8,561,430 kWh; this means 2.3–2.4 mln € per year of income because all of them received the “All inclusive” feed-in tariff of 280 € MWh.
Considering a plant lifespan of 15 years, the simple pay back is in the range 3.2–4.8 years while net present value ranges between 4 and 6 mln €.
Equipping the ICE with an ORC helps to reduce feedstock consumption of about 10%.
After this phase devoted to diet, emission limits and costs identification, the authors measured biogas and exhaust gasses compositions by means of a certified company.
Table 5, Table 6 and Table 7 listed biogas composition elements for selected plants while Table 8 lines up the composition of the engine exhaust gasses for both biogas plants and the natural gas unit.
Performed analyses on biogas composition involved characteristic compounds like CH, CO, nitrogen, oxygen or hydrogen but also elements like VOC, particulate and oily mists.
The volumetric percentage of methane is practically constant in plants BG1-BG5 because it varies between 51% and 55% despite different feedstock kinds and quantities. Only in BG6, methane percentage is 47%. A similar trend can be observed for carbon dioxide, hydrogen, nitrogen and oxygen. As for CH, the BG6 CO percentage is lower than in the other plants while N percentage is 4.5 times higher than in other biogas units.
Biogas lower heating value ranges between 17.99 and 20.64 MJ Nm. Approximately 55% lower than the natural gas LHV (33.5 MJ Nm) and of the one of pure methane (35.8 MJ Nm).
Ammonia is detected in biogas flow rate but its content is really variable and tough to connect with plant diet. A similar behaviour is observed for total sulphur. Sulphur compounds detected in the present experimental campaign are hydrogen sulphide (HS) and sulphuric acid (HSO). These compounds are the result of sulphur amino acids anaerobic digestion. Sulphur substances in combination with water can cause engine metal parts corrosion. Therefore, detecting these substances can be useful to predict engine parts corrosion phenomena.
Halogenated compounds are very rare in biogas produced from energy crops and animal manure. In fact, as shown in Table 7, these compounds are below threshold values of the measurement apparatus.
Polysiloxanes are the most frequent silica compounds which can be detected in biogas. They are harmful to health and, during the combustion process, they can give rise to silicon oxide which can be deposit to engine parts. This can compromise engine operation. Despite this aspect, in the present study, the only traces of Polysiloxanes are detected as shown in Table 6.
As previously said, emissions can be classified in regulated (CO, NO, VOC, HCl) and unregulated. In this work, only regulated emissions are analysed as listed in Table 8 while Figure 6 depicts regulated emissions of biogas and natural gas and their prescribed limits.
Based on Table 8 listed values, it is clear that biogas plants named BG4, BG5, BG6 and the natural gas engine are equipped with WHRUs which recover heat from exhaust gases (see, Temperature row) while units BG1, BG2 and BG3 recover the heat only from engines cooling water and oil lubrication system. Being in these cases the exhaust gases temperature higher than 350 °C, there is no way of measuring PM 10, PM 2.5 and Particulate because the measuring probe cannot abide such temperature levels.
Analysing Figure 6, it is clear that investigated biogas units respect limits of HCl and CO, while, in two cases (BG3 and BG4), the NO limit is exceeded. To overcome this issue, the engine air-to-fuel ratio is properly tuned and NO content immediately became lower than the prescribed limit.
Comparisons among biogas engines and the natural gas unit, clearly show that NO and CO emissions are higher in the case of biogas while the HCl content is comparable.
A different approach has been used to analyse the Volatile Organic Compounds because, during the experimental campaign, the existing legislation was [81] instead of [82]. This means that also methane was included in VOC. So, the limit was unfeasible to respect. The authors have therefore measured the total VOC and the comparison is performed between biogas and natural gas and not with the limit prescribed by the standard.
Based on the above-mentioned remarks, it is possible to claim that natural gas and biogas engines emit the same quantity of VOC because, in two cases, biogas engines emissions are lower than the natural gas one, in 3 cases are comparable and in one case is much more than the natural gas one.
The standard prescribes limits for SO and particulate in the case of natural gas engine. Comparisons between biogas and natural gas SO and particulate emissions show that biogas engines emits a lot of SO. In 3 cases, SO emissions are lower than the limit prescribed for natural gas but, in the other 3 biogas plants, values exceed limits of 2–4 times.
In contrast to SO, the particulate emissions are, in each case, under the standard prescription. Only in one biogas plant the particulate emissions are higher than the natural gas one, while in the another cases are much smaller or totally lacked.
German standards prescribe to measure also SO and Formaldehyde with the following limits: 350 mg Nm and 60 mg Nm. Based on the performed measurements it is clear that the monitored biogas plants respected also these limits. In particular, it is known that formaldehyde is carcinogenic but, the present analysis shows that its value is at least 70 times lower that the German limit. Also in terms of Formaldehyde and SO emissions, biogas and natural gas engines are comparable.
It is now interesting to compare the authors’ measurements with the ones reported in [84]. The analysis performed by Kristensen et al. [84] included biogas produced from agricultural waste (manure) but also biogas from old waste deposit sites and waste-water treatment plants. The biogas considered in Ref. [84] contains approximately 65% of methane and 35% CO. Therefore, the methane content is 21% lower than the author’s one while CO is 20% higher in the present set of measurements than in [84]. These aspects affect the lower heating value and, also, the combustion process. Additional comparisons are not allowed due to the absence of additional data on biogas composition elements reported in [84].
By the way, the most import aspect is the analysis of the present emissions set of data and the ones reported in literature. Table 9 lists the average values computed with the present set of data and the one specified in [84].
The comparison between data sets show that emissions for both biogas and natural gas are lower in the present case compared to the ones reported in [84]. However, VOC as TOC emissions are higher in the authors’ samples than the ones reported in [84] set of data. To this end, it is important to remark that feedstock, fermenters and engines considered in the present work are really different from the ones used in [84] because several technological advancements have been introduced in both biogas and natural gas sector.
7. Conclusions and Future Works
The present work focuses on the biogas sector. Biogas trend of growth at the European level is firstly presented and discussed. Then, the Italian biogas sector is examined with the aim of underlining the trend of growth and factors which have enabled biogas development.
Analysis shows that biogas highest development took place before the end of 2012 due to generous support schemes established by the Italian Government. These subsidies also guided the plant nameplate power selection because, until end-2012, the “All inclusive” feed-in tariff guaranteed 280 € MWh to plant with a nameplate power until 1 MW. It was the most generous support across EU28 and boosted the spread of 1 MW plants. In this power range, the most efficient and easy way to convert biogas in useful energy consists in the Internal Combustion Engine technology. In fact, in almost entirely biogas plants, electricity is generated by means of internal combustion engines.
After sector overview, the authors’ focus on real in-operation biogas plants with the aim of understanding their construction and operation costs, adopted feedstock, biogas composition and engine emissions.
For this purpose, six biogas units, each one fed by different feedstock, and a plant fed with natural gas have been selected and monitored by on-site measurements. This approach allows to estimate real plants costs and to analyse diet, biogas composition and engine emissions as well as comparing biogas with natural gas.
Each plant is equipped with a 1 MW internal combustion engine which converts biogas into electricity and heat. Italian standards set limits to engine emissions in terms of nitrogen oxides, carbon monoxide, hydrogen chlorine and volatile organic compounds expressed as total organic carbon, while no specifications are given for biogas composition. Natural gas engine limits are set for particulate, nitrogen oxides and sulphur oxide.
A biogas plant with an electric nameplate power of 1 MW costs approximately 4.2–4.8 mln €: 65% is for biological equipments while the rest is for the power generation unit.
Different kinds of energy crops (e.g., maize or wheat silage), manure and sewage (e.g., cattle, pig or chicken dung) mix are used as feedstock. Based on the performed monitoring activity, it is possible to observe that maize silage is the basis for the entire set of plants, while chicken-dung causes plant running problems. Maize silage is fundamental to stabilize the anaerobic digestion process while chicken-dung causes limescale formations in fermenters which need to be frequently removed. Therefore, frequent plant start-up and shut-down and higher maintenance costs characterised plants fed by chicken-dung.
Biogas composition and engine emissions measurements show that both of them are not affected by plant diet. Biogas methane content ranges between 47 and 55% while carbon dioxide is in the range 41–48%. Nitrogen ranges between 0.7 and 1.9% excepting in one case where it reaches 9%. In terms of lower heating value, the biogas one is 50% lower than the natural gas one.
Biogas and natural gas plants emissions are comparable even if in two cases biogas engines exceed nitrogen oxides limit. Given that German standard prescribed limits in terms of sulphur dioxide and Formaldehyde, comparisons among these limits and measurements are also performed. In monitored plants, sulphur dioxide and Formaldehyde are under German limits and, in the case of Formaldehyde, it is two orders of magnitude lower.
Based on these evidence, in future works, the authors plans to investigate and compare biogas and natural gas regulated and unregulated emissions to perform a risk assessment analysis as well as how biogas sector can be boosted again.
Author Contributions
Conceptualization, A.B. and A.M.; Formal analysis, A.B. and A.M.; Funding acquisition, A.M.; Methodology, A.B. and A.M.; Writing—original draft, A.B.; Writing—review & editing, A.B. and A.M.
Funding
This research was funded by “FONDAZIONE CARIVERONA” grant number “2015.0873 - 3 POLI 5”.
Acknowledgments
The authors acknowledge the “FONDAZIONE CARIVERONA” for selecting and financing the research project named “STUDIO PER L’IMPLEMENTAZIONE DELLE FERMENTAZIONI ANAEROBICHE A FINI ENERGETICI E ANALISI DEL LORO IMPATTO AMBIENTALE”.
Conflicts of Interest
The authors declare no conflict of interest.
Abbreviations
| To | All-inclusive feed-in tariff |
| AD | Anaerobic Digestion |
| Tb | Base feed-in tariff |
| BG | Biogas Plant |
| CO | Carbon Dioxide |
| CO | Carbon Monoxide |
| CHP | Combined Heat and Power |
| CIB | Consorzio Italiano Biogas |
| m | cubic meter |
| d | day |
| el | electric |
| EBA | European Biogas Association |
| EU | European Union |
| GSE | Gestore dei Servizi Energetici |
| GJ | GigaJoule |
| g | gram |
| GHG | GreenHouse Gases |
| h | hour |
| H | Hydrogen |
| HCl | Hydrogen Chloride |
| H | hydrogen sulphide |
| I | Incentive |
| ICE | Internal Combustion Engine |
| LCA | LifeCycle Assessment |
| LHV | Lower Heating Value |
| MW | Megawatt |
| CH | Methane |
| mg | microgram |
| mln | million |
| mol | moles |
| NREAP | National Renewable Energy Action Plan |
| NG | Natural gas Plant |
| NO | Nitrogen Oxide |
| Nm | normal cubic meter |
| ORC | Organic Rankine Cycle |
| PM | Particulate Matter |
| PV | Photovoltaic |
| PCDF | polychlorinated dibenzofuran |
| PCDD | polychlorinated dibenzo-p-dioxin |
| PAHs | Polycyclic Aromatic Hydrocarbons |
| P | power |
| Pz | Premium |
| RES | Renewable Energy Source |
| SiO | Silica |
| SO | Sulphur Dioxide |
| SO | Sulphur Oxide |
| H | Sulphuric acid |
| th | thermal |
| t | ton |
| TOC | Total Organic Carbon |
| UK | United Kingdom |
| US | United States |
| vs. | versus |
| VOC | Volatile Organic Compounds |
| WHRU | Waste Heat Recovery Unit |
| € | Euro |
| $ | Dollar |
References
- Balta, M.O.; Eke, F. Spatial reflection of urban planning in metropolitan areas and urban rent; a case study of Çayyolu, Ankara. Eur. Plan. Stud. 2011, 19, 1817–1838. [Google Scholar] [CrossRef]
- Grubb, M.; Vrolijk, C.; Brack, D. The Kyoto Protocol: A Guide and Assessment; Royal Institute of International Affairs Energy and Environmental Programme: London, UK, 1997. [Google Scholar]
- Agreement, P. United Nations Framework Convention on Climate Change; United Nations: Paris, France, 2015. [Google Scholar]
- European Parliament and Council of the European Union. Directive 2009/28/EC of the European Parliament and of the Council of 23 April 2009 on the Promotion of the Use of Energy from Renewable Sources and Amending and Subsequently Repealing Directives 2001/77/EC and 2003/30/EC; United Nations: Paris, France, 2009. [Google Scholar]
- Italian Government. National Renewable Energy Action Plan. 2010. Available online: https://ec.europa.eu/energy/en/topics/renewable-energy/national-action-plans (accessed on 15 January 2019).
- Foundation, E.C. 2030 Framework for Climate and Energy Policies. 2014. Available online: www.ec.europa.eu (accessed on 15 January 2019).
- Foundation, E.C. EU Roadmap 2050. 2010. Available online: www.roadmap2050.eu (accessed on 15 January 2019).
- Zervos, A. Renewables 2018—Global Status Report. 2018. Available online: http://www.ren21.net (accessed on 15 January 2019).
- TERNA. Dati Statistici. 2017. Available online: https://www.terna.it/it-it/sistemaelettrico/statisticheeprevisioni/datistatistici.aspx (accessed on 15 January 2019).
- Gestore dei Servizi Energetici S.p.A. Rapporto Statistico Solare Fotovoltaico 2017. 2018. Available online: https://www.gse.it/dati-e-scenari/statistiche (accessed on 15 January 2019).
- Food and Agriculture Organization of the United Nations. Bioenergy and Food Security—The BEFS Analytical Framework. 2010. Available online: http://www.fao.org/docrep/013/i1968e/i1968e.pdf (accessed on 15 January 2019).
- Wesseler, J.; Drabik, D. Prices matter: Analysis of food and energy competition relative to land resources in the European Union. NJAS Wagening. J. Life Sci. 2016, 77, 19–24. [Google Scholar] [CrossRef]
- Baek, G.; Kim, J.; Kim, J.; Lee, C. Role and potential of direct interspecies electron transfer in anaerobic digestion. Energies 2018, 11, 107. [Google Scholar] [CrossRef]
- Chen, Y.; Yang, G.; Sweeney, S.; Feng, Y. Household biogas use in rural China: A study of opportunities and constraints. Renew. Sustain. Energy Rev. 2010, 14, 545–549. [Google Scholar] [CrossRef]
- Amigun, B.; Von Blottnitz, H. Capacity-cost and location-cost analyses for biogas plants in Africa. Resourc. Conserv. Recycl. 2010, 55, 63–73. [Google Scholar] [CrossRef]
- Meyer, A.; Ehimen, E.; Holm-Nielsen, J. Future European biogas: Animal manure, straw and grass potentials for a sustainable European biogas production. Biomass Bioenergy 2018, 111, 154–164. [Google Scholar] [CrossRef]
- Baute, K.; Van Eerd, L.; Robinson, D.; Sikkema, P.; Mushtaq, M.; Gilroyed, B. Comparing the Biomass Yield and Biogas Potential of Phragmites australis with Miscanthus x giganteus and Panicum virgatum Grown in Canada. Energies 2018, 11, 2198. [Google Scholar] [CrossRef]
- Scarlat, N.; Fahl, F.; Dallemand, J.F.; Monforti, F.; Motola, V. A spatial analysis of biogas potential from manure in Europe. Renew. Sustain. Energy Rev. 2018, 94, 915–930. [Google Scholar] [CrossRef]
- Scarlat, N.; Dallemand, J.F.; Fahl, F. Biogas: Developments and perspectives in Europe. Renew. Energy 2018, 129, 457–472. [Google Scholar] [CrossRef]
- Einarsson, R.; Persson, U.M. Analyzing key constraints to biogas production from crop residues and manure in the EU—A spatially explicit model. PLoS ONE 2017, 12, e0171001. [Google Scholar] [CrossRef]
- Maisonnier, G.; Grandjean, J.; Bouter, A.; Collet, P.; Gauthier, T. Panorama 2018-Biogas in Europe: Future Prospects? INIS-FR–18-0386. 2018. Available online: https://inis.iaea.org/search/search.aspx?orig_q=RN:49020790 (accessed on 13 March 2019).
- Wang, X.; Yang, G.; Feng, Y.; Ren, G.; Han, X. Optimizing feeding composition and carbon–nitrogen ratios for improved methane yield during anaerobic co-digestion of dairy, chicken manure and wheat straw. Bioresour. Technol. 2012, 120, 78–83. [Google Scholar] [CrossRef] [PubMed]
- Dioha, I.; Ikeme, C.; Nafi’u, T.; Soba, N.; Yusuf, M. Effect of carbon to nitrogen ratio on biogas production. Int. Res. J. Nat. Sci. 2013, 1, 1–10. [Google Scholar]
- Sänger, A.; Geisseler, D.; Ludwig, B. Effects of rainfall pattern on carbon and nitrogen dynamics in soil amended with biogas slurry and composted cattle manure. J. Plant Nutr. Soil Sci. 2010, 173, 692–698. [Google Scholar] [CrossRef]
- Tanimu, M.I.; Ghazi, T.I.M.; Harun, R.M.; Idris, A. Effect of carbon to nitrogen ratio of food waste on biogas methane production in a batch mesophilic anaerobic digester. Int. J. Innov. Manag. Technol. 2014, 5, 116. [Google Scholar]
- Duan, N.; Ran, X.; Li, R.; Kougias, P.; Zhang, Y.; Lin, C.; Liu, H. Performance evaluation of mesophilic anaerobic digestion of chicken manure with algal digestate. Energies 2018, 11, 1829. [Google Scholar] [CrossRef]
- Roubík, H.; Mazancová, J.; Le Dinh, P.; Dinh Van, D.; Banout, J. Biogas quality across small-scale biogas plants: A case of central Vietnam. Energies 2018, 11, 1794. [Google Scholar] [CrossRef]
- Wagner, A.; Lackner, N.; Mutschlechner, M.; Prem, E.; Markt, R.; Illmer, P. Biological pretreatment strategies for second-generation lignocellulosic resources to enhance biogas production. Energies 2018, 11, 1797. [Google Scholar] [CrossRef]
- Milledge, J.; Nielsen, B.; Sadek, M.; Harvey, P. Effect of freshwater washing pretreatment on Sargassum muticum as a feedstock for biogas production. Energies 2018, 11, 1771. [Google Scholar] [CrossRef]
- Al-Addous, M.; Saidan, M.N.; Bdour, M.; Alnaief, M. Evaluation of Biogas Production from the Co-Digestion of Municipal Food Waste and Wastewater Sludge at Refugee Camps Using an Automated Methane Potential Test System. Energies 2018, 12, 32. [Google Scholar] [CrossRef]
- Benato, A.; Macor, A.; Rossetti, A. Biogas Engine Emissions: Standards and On-Site Measurements. Energy Procedia 2017, 126, 398–405. [Google Scholar] [CrossRef]
- Henham, A.; Makkar, M. Combustion of simulated biogas in a dual-fuel diesel engine. Energy Convers. Manag. 1998, 39, 2001–2009. [Google Scholar] [CrossRef]
- Lafay, Y.; Taupin, B.; Martins, G.; Cabot, G.; Renou, B.; Boukhalfa, A. Experimental study of biogas combustion using a gas turbine configuration. Exp. Fluids 2007, 43, 395–410. [Google Scholar] [CrossRef] [Green Version]
- Noor, M.; Wandel, A.P.; Yusaf, T. Numerical study of oxygen dilution and temperature distribution of biogas combustion in Bluff-body MILD burner. In Proceedings of the 7th Australian Combustion Symposium (ACS 2013), Perth, Australia, 6–8 November 2013; pp. 299–303. [Google Scholar]
- Hosseini, S.E.; Wahid, M.A.; Abuelnuor, A.A.A. Biogas flameless combustion: A review. In Applied Mechanics and Materials; Trans Tech Publications: Zürich, Switzerland, 2013; Volume 388, pp. 273–279. [Google Scholar] [CrossRef]
- Noor, M.; Wandel, A.P.; Yusaf, T. The simulation of biogas combustion in a mild burner. J. Mech. Eng. Sci. 2014, 6, 995–1013. [Google Scholar] [CrossRef]
- Hosseini, S.E.; Wahid, M.A. Development of biogas combustion in combined heat and power generation. Renew. Sustain. Energy Rev. 2014, 40, 868–875. [Google Scholar] [CrossRef]
- Qian, Y.; Sun, S.; Ju, D.; Shan, X.; Lu, X. Review of the state-of-the-art of biogas combustion mechanisms and applications in internal combustion engines. Renew. Sustain. Energy Rev. 2017, 69, 50–58. [Google Scholar] [CrossRef]
- Gao, H.; Qu, Z.; Tao, W.; He, Y.; Zhou, J. Experimental study of biogas combustion in a two-layer packed bed burner. Energy Fuels 2011, 25, 2887–2895. [Google Scholar] [CrossRef]
- Rahman, K.A.; Ramesh, A. Studies on the effects of methane fraction and injection strategies in a biogas diesel common rail dual fuel engine. Fuel 2019, 236, 147–165. [Google Scholar] [CrossRef]
- Hotta, S.K.; Sahoo, N.; Mohanty, K. Ignition advancement study for optimized characteristics of a raw biogas operated spark ignition engine. Int. J. Green Energy 2019, 16, 101–113. [Google Scholar] [CrossRef]
- Hassan, S.; Ya, H. Experimental Study on Electrical Power Generation from a 1-kW Engine Using Simulated Biogas Fuel. In Rotating Machineries; Springer: Singapore, 2019; pp. 93–104. [Google Scholar]
- Goga, G.; Chauhan, B.S.; Mahla, S.K.; Cho, H.M. Performance and emission characteristics of diesel engine fueled with rice bran biodiesel and n-butanol. Energy Rep. 2019, 5, 78–83. [Google Scholar] [CrossRef]
- Muhajir, K.; Badrawada, I.; Susastriawan, A. Utilization of biogas for generator set fuel: Performance and emission characteristics. Biomass Convers. Biorefinery 2019. [Google Scholar] [CrossRef]
- Benato, A.; Macor, A. Biogas Engine Waste Heat Recovery Using Organic Rankine Cycle. Energies 2017, 10, 327. [Google Scholar] [CrossRef]
- Ishikawa, S.; Hoshiba, S.; Hinata, T.; Hishinuma, T.; Morita, S. Evaluation of a Biogas Plant From Life Cycle Assessment (LCA); International Congress Series; Elsevier: Amsterdam, The Netherlands, 2006; Volume 1293, pp. 230–233. [Google Scholar] [CrossRef]
- Prince, G.; Lefebvre, M.; Briend, P.; Paget, N. Method for Producing Biomethane by Purifying Biogas from Non-Hazardous Waste Storage Facilities and Facility for Implementing the Method. U.S. Patent App. 16/065,644, 3 January 2019. [Google Scholar]
- Hoo, P.Y.; Hashim, H.; Ho, W.S.; Yunus, N.A. Spatial-economic optimisation of biomethane injection into natural gas grid: The case at southern Malaysia. J. Environ. Manag. 2019. [Google Scholar] [CrossRef] [PubMed]
- Razavi, A.; Koupaie, E.H.; Azizi, A.; Hafez, H.; Elbeshbishy, E. Bioenergy production data from anaerobic digestion of thermally hydrolyzed organic fraction of municipal solid waste. Data Brief 2019, 22, 1018–1026. [Google Scholar] [CrossRef] [PubMed]
- Offermann, R.; Seidenberger, T.; Thrän, D.; Kaltschmitt, M.; Zinoviev, S.; Miertus, S. Assessment of global bioenergy potentials. Mitig. Adapt. Strateg. Glob. Chang. 2011, 16, 103–115. [Google Scholar] [CrossRef]
- Long, H.; Li, X.; Wang, H.; Jia, J. Biomass resources and their bioenergy potential estimation: A review. Renew. Sustain. Energy Rev. 2013, 26, 344–352. [Google Scholar] [CrossRef]
- Mao, G.; Zou, H.; Chen, G.; Du, H.; Zuo, J. Past, current and future of biomass energy research: A bibliometric analysis. Renew. Sustain. Energy Rev. 2015, 52, 1823–1833. [Google Scholar] [CrossRef]
- Su, Y.; Zhang, P.; Su, Y. An overview of biofuels policies and industrialization in the major biofuel producing countries. Renew. Sustain. Energy Rev. 2015, 50, 991–1003. [Google Scholar] [CrossRef]
- De Meyer, A.; Cattrysse, D.; Rasinmäki, J.; Van Orshoven, J. Methods to optimise the design and management of biomass-for-bioenergy supply chains: A review. Renew. Sustain. Energy Rev. 2014, 31, 657–670. [Google Scholar] [CrossRef] [Green Version]
- Naik, S.; Goud, V.V.; Rout, P.K.; Dalai, A.K. Production of first and second generation biofuels: A comprehensive review. Renew. Sustain. Energy Rev. 2010, 14, 578–597. [Google Scholar] [CrossRef]
- Gray, K.A.; Zhao, L.; Emptage, M. Bioethanol. Curr. Opin. Chem. Biol. 2006, 10, 141–146. [Google Scholar] [CrossRef]
- Sarkar, N.; Ghosh, S.K.; Bannerjee, S.; Aikat, K. Bioethanol production from agricultural wastes: An overview. Renew. Energy 2012, 37, 19–27. [Google Scholar] [CrossRef]
- Ma, F.; Hanna, M.A. Biodiesel production: A review. Bioresour. Technol. 1999, 70, 1–15. [Google Scholar] [CrossRef]
- Meher, L.; Sagar, D.V.; Naik, S. Technical aspects of biodiesel production by transesterification—A review. Renew. Sustain. Energy Rev. 2006, 10, 248–268. [Google Scholar] [CrossRef]
- Yoon, S.H.; Lee, C.S. Experimental investigation on the combustion and exhaust emission characteristics of biogas–biodiesel dual-fuel combustion in a CI engine. Fuel Process. Technol. 2011, 92, 992–1000. [Google Scholar] [CrossRef]
- Lindkvist, E.; Karlsson, M. Biogas production plants; existing classifications and proposed categories. J. Clean. Prod. 2018, 174, 1588–1597. [Google Scholar] [CrossRef]
- Kumar, S. Biogas; InTech: London, UK, 2012. [Google Scholar]
- Cesaro, A.; Belgiorno, V. Combined biogas and bioethanol production: Opportunities and challenges for industrial application. Energies 2015, 8, 8121–8144. [Google Scholar] [CrossRef]
- Tilman, D.; Socolow, R.; Foley, J.A.; Hill, J.; Larson, E.; Lynd, L.; Pacala, S.; Reilly, J.; Searchinger, T.; Somerville, C.; et al. Beneficial biofuels-the food, energy, and environment trilemma. Science 2009, 325, 270–271. [Google Scholar] [CrossRef]
- Demirbas, M.F.; Balat, M.; Balat, H. Potential contribution of biomass to the sustainable energy development. Energy Convers. Manag. 2009, 50, 1746–1760. [Google Scholar] [CrossRef]
- Cheng, J. Biomass to Renewable Energy Processes; CRC Press: Boca Raton, FL, USA, 2017. [Google Scholar]
- Divya, D.; Gopinath, L.; Christy, P.M. A review on current aspects and diverse prospects for enhancing biogas production in sustainable means. Renew. Sustain. Energy Rev. 2015, 42, 690–699. [Google Scholar] [CrossRef]
- Mao, C.; Feng, Y.; Wang, X.; Ren, G. Review on research achievements of biogas from anaerobic digestion. Renew. Sustain. Energy Rev. 2015, 45, 540–555. [Google Scholar] [CrossRef]
- World Bioenergy Association (WBA). Global Bioenergy Statistics 2017; WBA: Stockholm, Sweden, 2017. [Google Scholar]
- Eurostat. European Statistics. 2017. Available online: http://ec.europa.eu/eurostat (accessed on 15 January 2019).
- European Biogas Association. Statistical Report 2017; European Biogas Association: Brussels, Belgium, 2017. [Google Scholar]
- Deublein, D.; Steinhauser, A. Biogas from Waste and Renewable Resources: An Introduction; John Wiley & Sons: Hoboken, NJ, USA, 2011. [Google Scholar]
- Camera dei deputati ed il Senato della Repubblica. Disposizioni per la Formazione del Bilancio Annuale E Pluriennale dello Stato (Legge Finanziaria 2008) (GU n.300 del 28-12-2007—Suppl. Ordinario n. 285). 2007. Available online: http://www.gazzettaufficiale.it/atto/stampa/serie_generale/originario (accessed on 15 January 2019).
- Autorità per l’Energia Elettrica e il Gas. Delibera ARG/elt 1/09 del 09/01/2009. 2009. Available online: https://www.arera.it/it/index.htm (accessed on 15 January 2019).
- Gestore dei Servizi Energetici GSE S.p.A. Statistiche. 2018. Available online: https://www.gse.it/dati-e-scenari/statistiche (accessed on 15 January 2019).
- European Parliament and Council of the European Union. Directive 2001/77/EC of the European Parliament and Council of the European Union of 27 September 2001 on the Promotion of Electricity Produced from Renewable Energy Sources in the Internal Electricity Market. 2001. Available online: https://eur-lex.europa.eu/legal-content/EN/TXT/?uri=CELEX%3A32001L0077 (accessed on 15 January 2019).
- European Parliament and Council of the European Union. Directive 2003/30/EC of the European Parliament and of the Council of 8 May 2003 on the Promotion of the Use of Biofuels or Other Renewable Fuels for Transport. 2003. Available online: https://eur-lex.europa.eu/legal-content/EN/ALL/?uri=celex%3A32003L0030 (accessed on 15 January 2019).
- Italian Parliament. DECRETO LEGISLATIVO 3 marzo 2011, n. 28 Attuazione Della Direttiva 2009/28/CE Sulla Promozione Dell’Uso Dell’Energia Da Fonti Rinnovabili, Recante Modifi Ca E Successiva Abrogazione Delle Direttive 2001/77/CE e 2003/30/CE. 2011. Available online: http://www.acs.enea.it/doc/dlgs_28-2011.pdf (accessed on 15 January 2019).
- Ministero Dello Sviluppo Economico. DECRETO 6 Luglio 2012; 2012. Available online: https://www.mise.gov.it/images/stories/normativa/DM_6_luglio_2012_sf.pdf (accessed on 15 January 2019).
- Ministero Dello Sviluppo Economico. DECRETO 23 Giugno 2016 Incentivazione Dell’energia Elettrica Prodotta Da Fonti Rinnovabili Diverse Dal Fotovoltaico; 2016. Available online: https://www.gse.it/documenti_site/Documenti%20GSE/Servizi%20per%20te/FER%20ELETTRICHE/NORMATIVE/DM%2023%20giugno%202016.PDF (accessed on 15 January 2019).
- Italian Parliament. Decreto Legislativo 3 Aprile 2006, n. 152. Norme in Materia Ambientale; 2006. Available online: http://www.gazzettaufficiale.it/atto/serie_generale/caricaDettaglioAtto/originario?atto.dataPubblicazioneGazzetta=2006-04-14&atto.codiceRedazionale=006G0171 (accessed on 15 January 2019).
- Ministero Dell’ambiente E Della Tutela Del Territorio E Del Mare. DECRETO 19 maggio 2016, n. 118. Regolamento Recante Aggiornamento dei Valori Limite Di Emissione in Atmosfera per le Emissioni di Carbonio Organico Totale Degli Impianti Alimentati a Biogas, ai Sensi Dell’articolo 281, Comma 5, Del Decreto Legislativo n. 152 del 2006. 2016. Available online: http://www.arpa.veneto.it/temi-ambientali/energia/file-e-allegati/normativa/DM%2019%20maggio%202016%20n.%20118.pdf (accessed on 15 January 2019).
- GE. GE Power Generation. 2016. Available online: https://powergen.gepower.com/applications/biogas.html (accessed on 15 January 2019).
- Kristensen, P.G.; Jensen, J.K.; Nielsen, M.; Illerup, J.B. Emission factors for gas fired CHP units <25 MW. 2004. Available online: https://www2.dmu.dk/1_Viden/2_Miljoe-tilstand/3_luft/4_adaei/doc/EmissionfactorsforgasfiredCHPunits.pdf (accessed on 13 March 2019).
Figure 1.
Trend of Italian PV (a) Installed power and number of plants, (b) Generated electricity. Source: GSE [10].
Figure 1.
Trend of Italian PV (a) Installed power and number of plants, (b) Generated electricity. Source: GSE [10].

Figure 2.
Trend of EU28 biogas (a) Installed power and number of plants, (b) Generated electricity. Source: EBA [71].
Figure 2.
Trend of EU28 biogas (a) Installed power and number of plants, (b) Generated electricity. Source: EBA [71].

Figure 3.
Trend of the EU biogas (a) Number of plants per feedstock, (b) Installed power per feedstock, (c) Generated electricity per feedstock, (d) Feedstock use for biogas production. Source: EBA [71].
Figure 3.
Trend of the EU biogas (a) Number of plants per feedstock, (b) Installed power per feedstock, (c) Generated electricity per feedstock, (d) Feedstock use for biogas production. Source: EBA [71].

Figure 4.
Trend of the EU28 NREAP targets and installed electricity capacity at the EU level. Source: EBA [71].
Figure 4.
Trend of the EU28 NREAP targets and installed electricity capacity at the EU level. Source: EBA [71].

Figure 5.
Trend of the Italian biogas (a) Number of plants, (b) Installed power, (c) Generated electricity, (d) NREAP targets and Installed Electricity Capacity. Source: EBA [71] and GSE [75] dataset.

Figure 6.
Trend of (a) NO, (b) CO, (c) HCl, (d) COV, (e) SO and (f) Particulate.


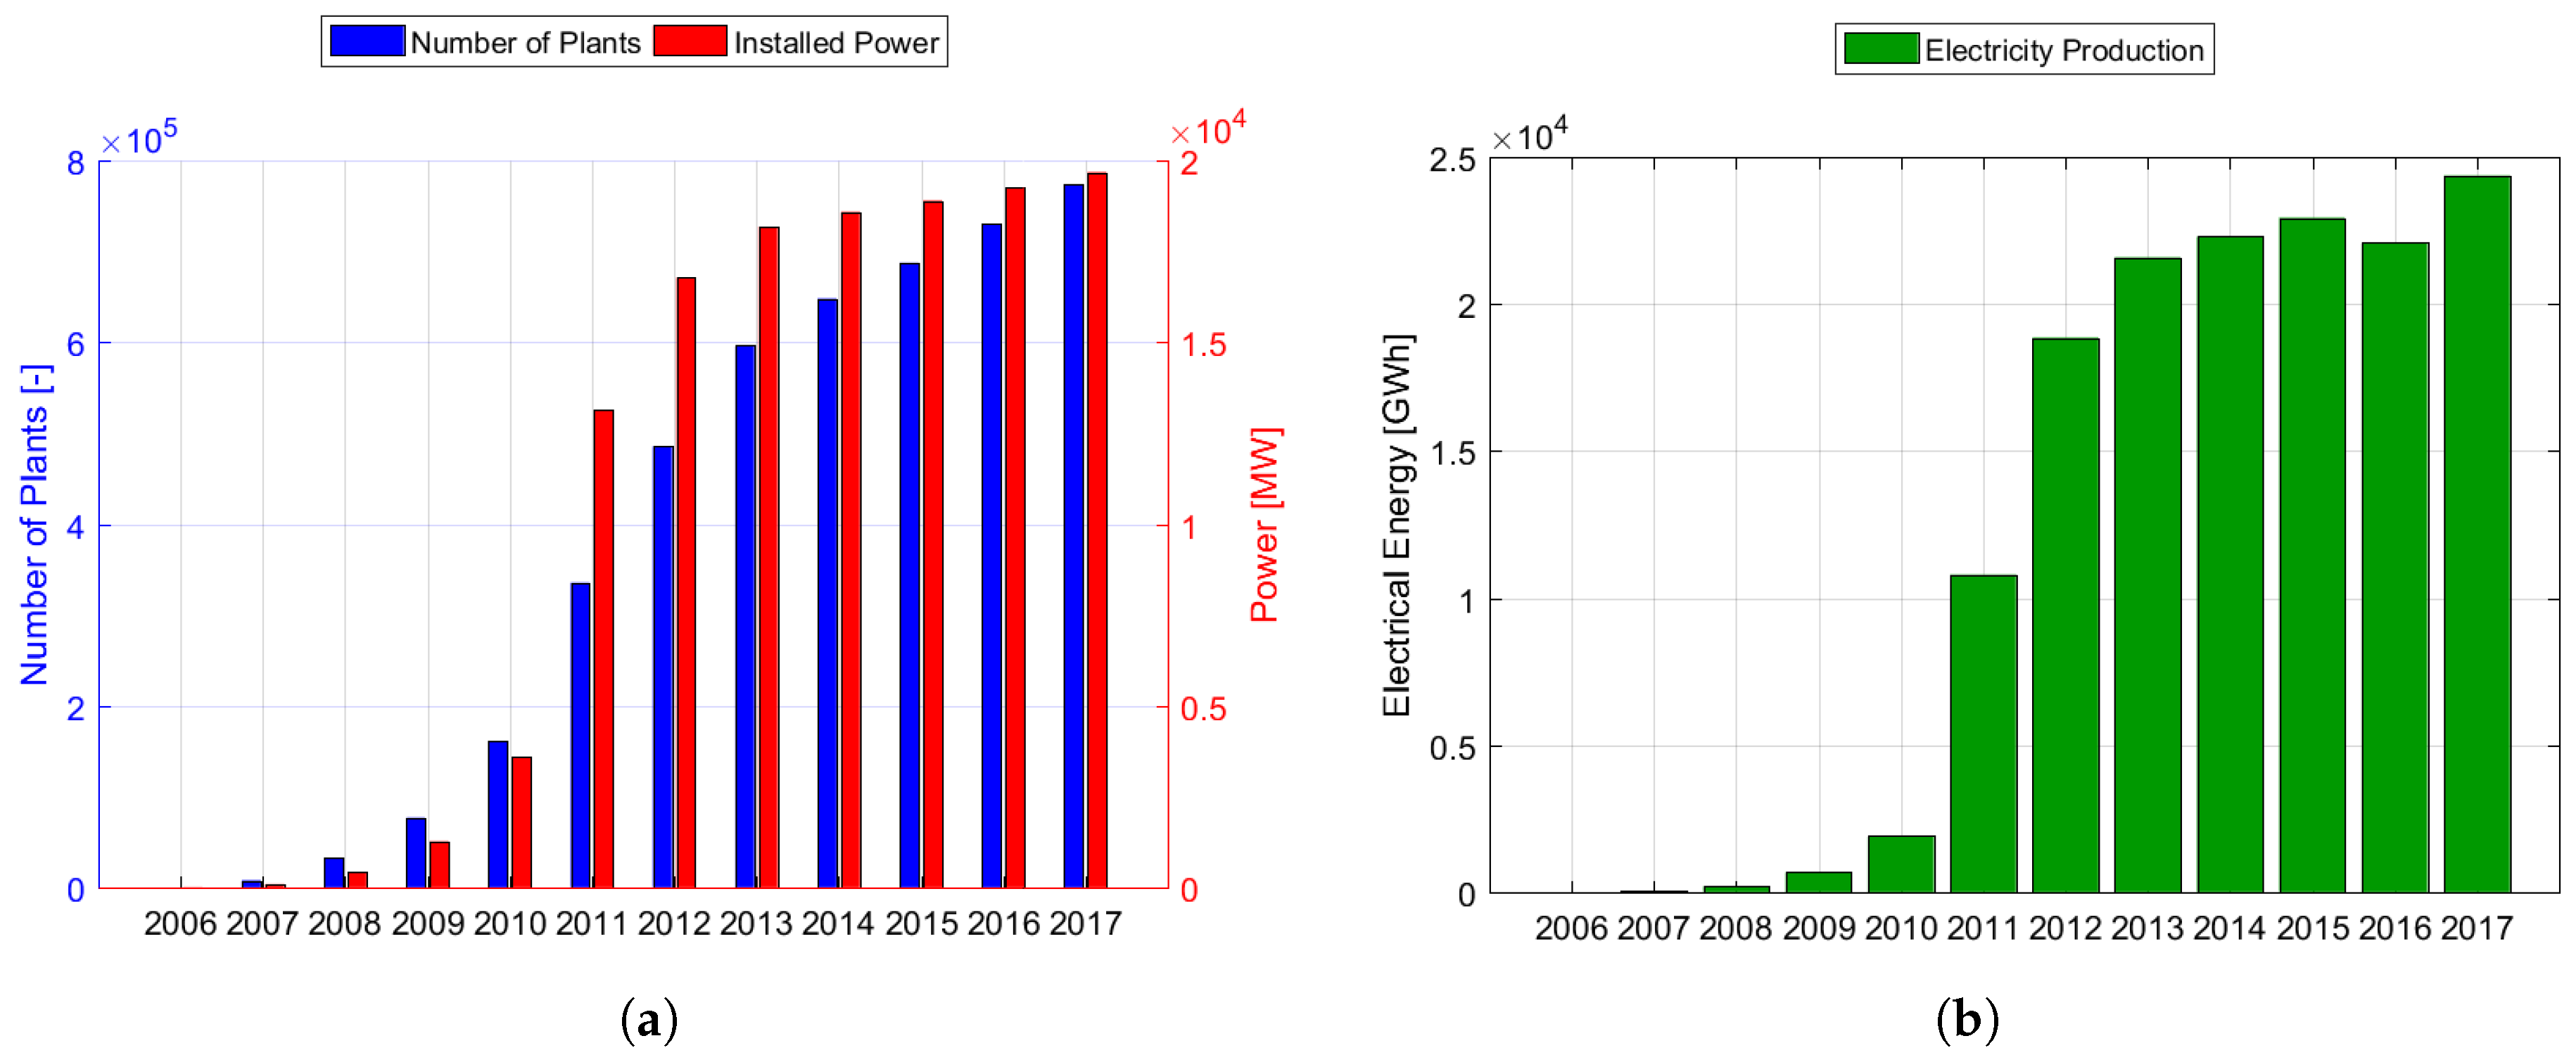
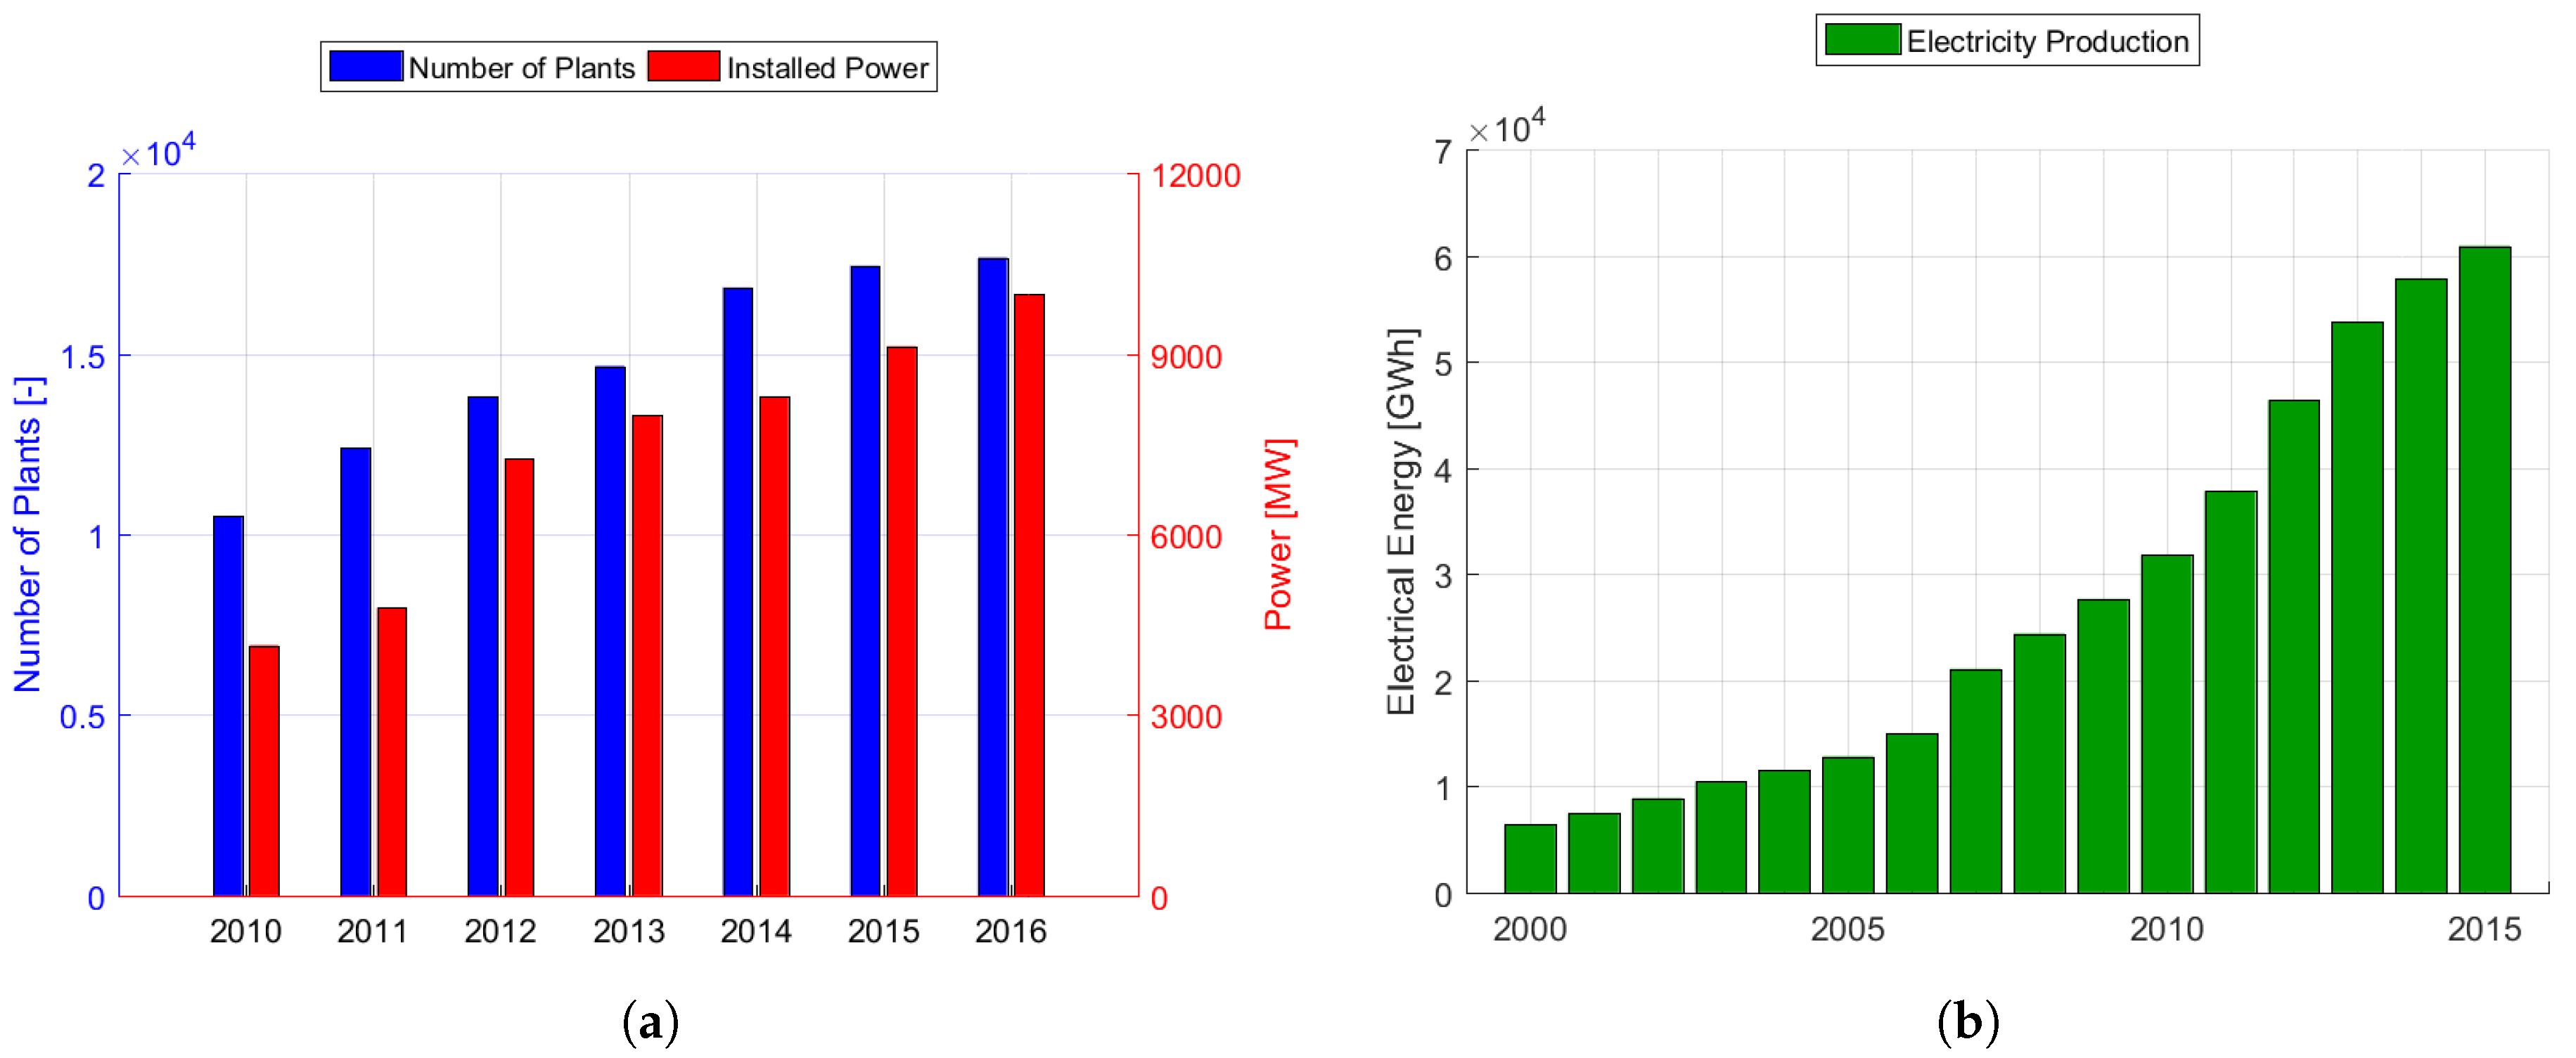
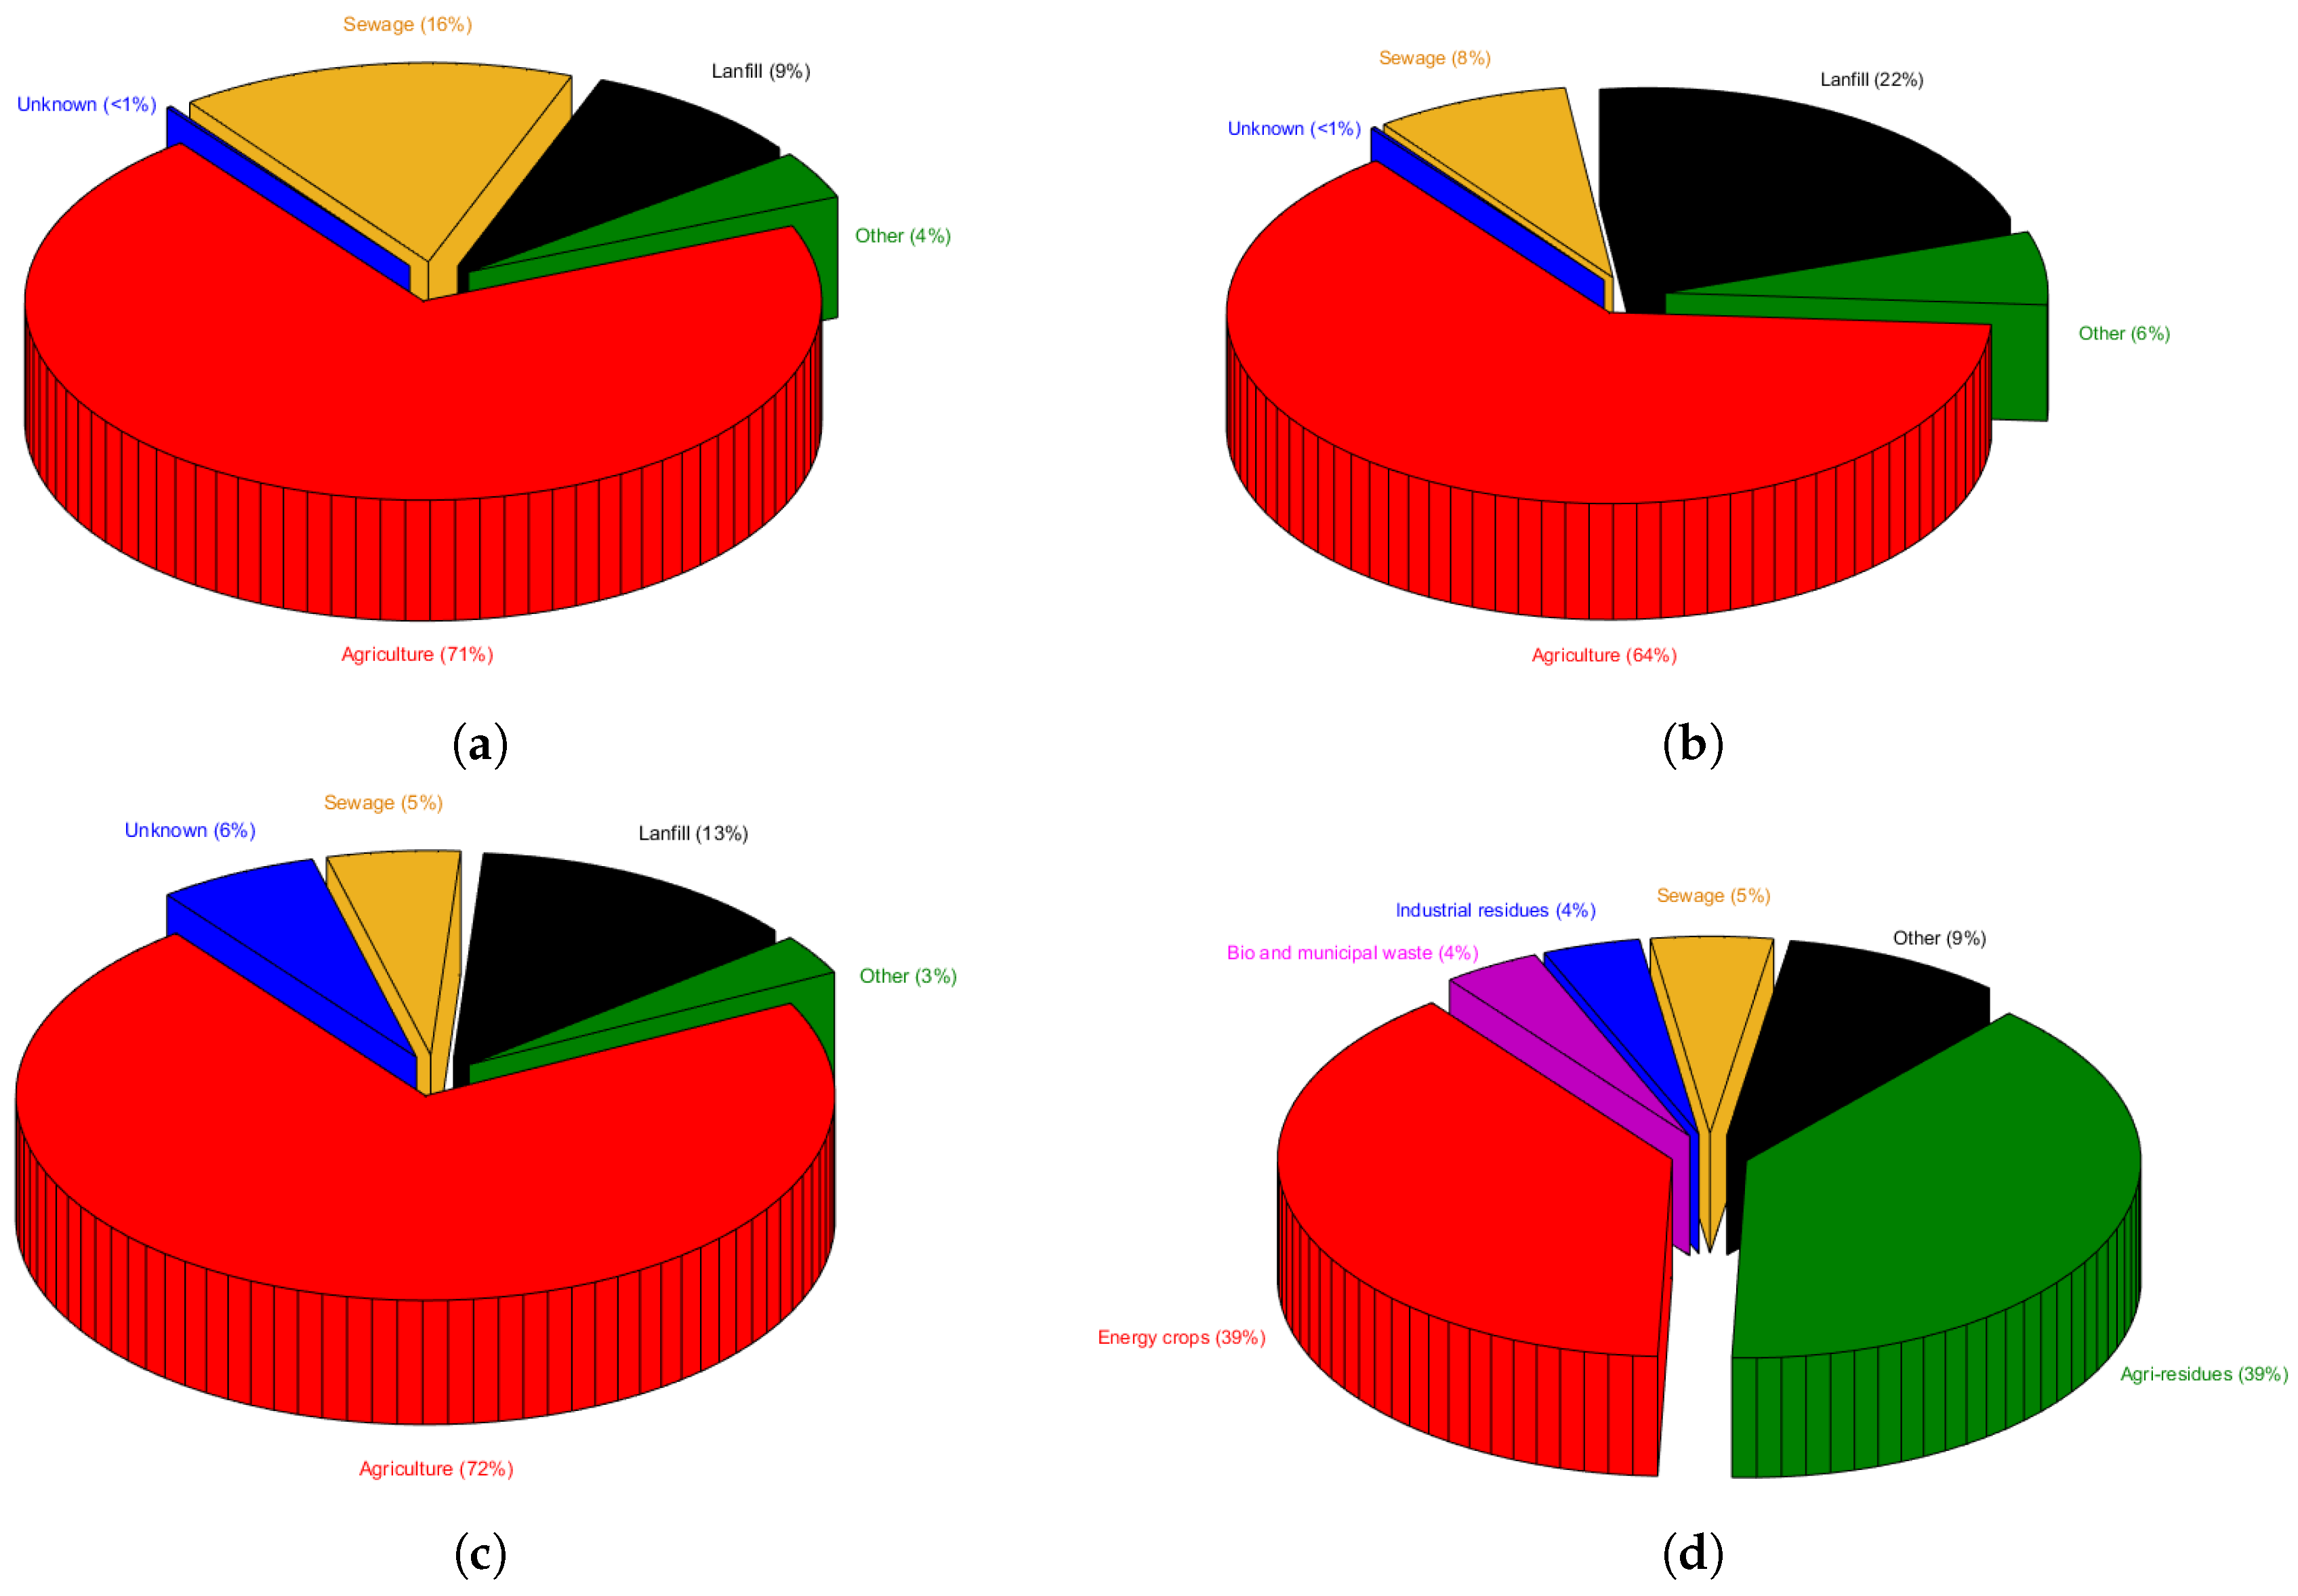
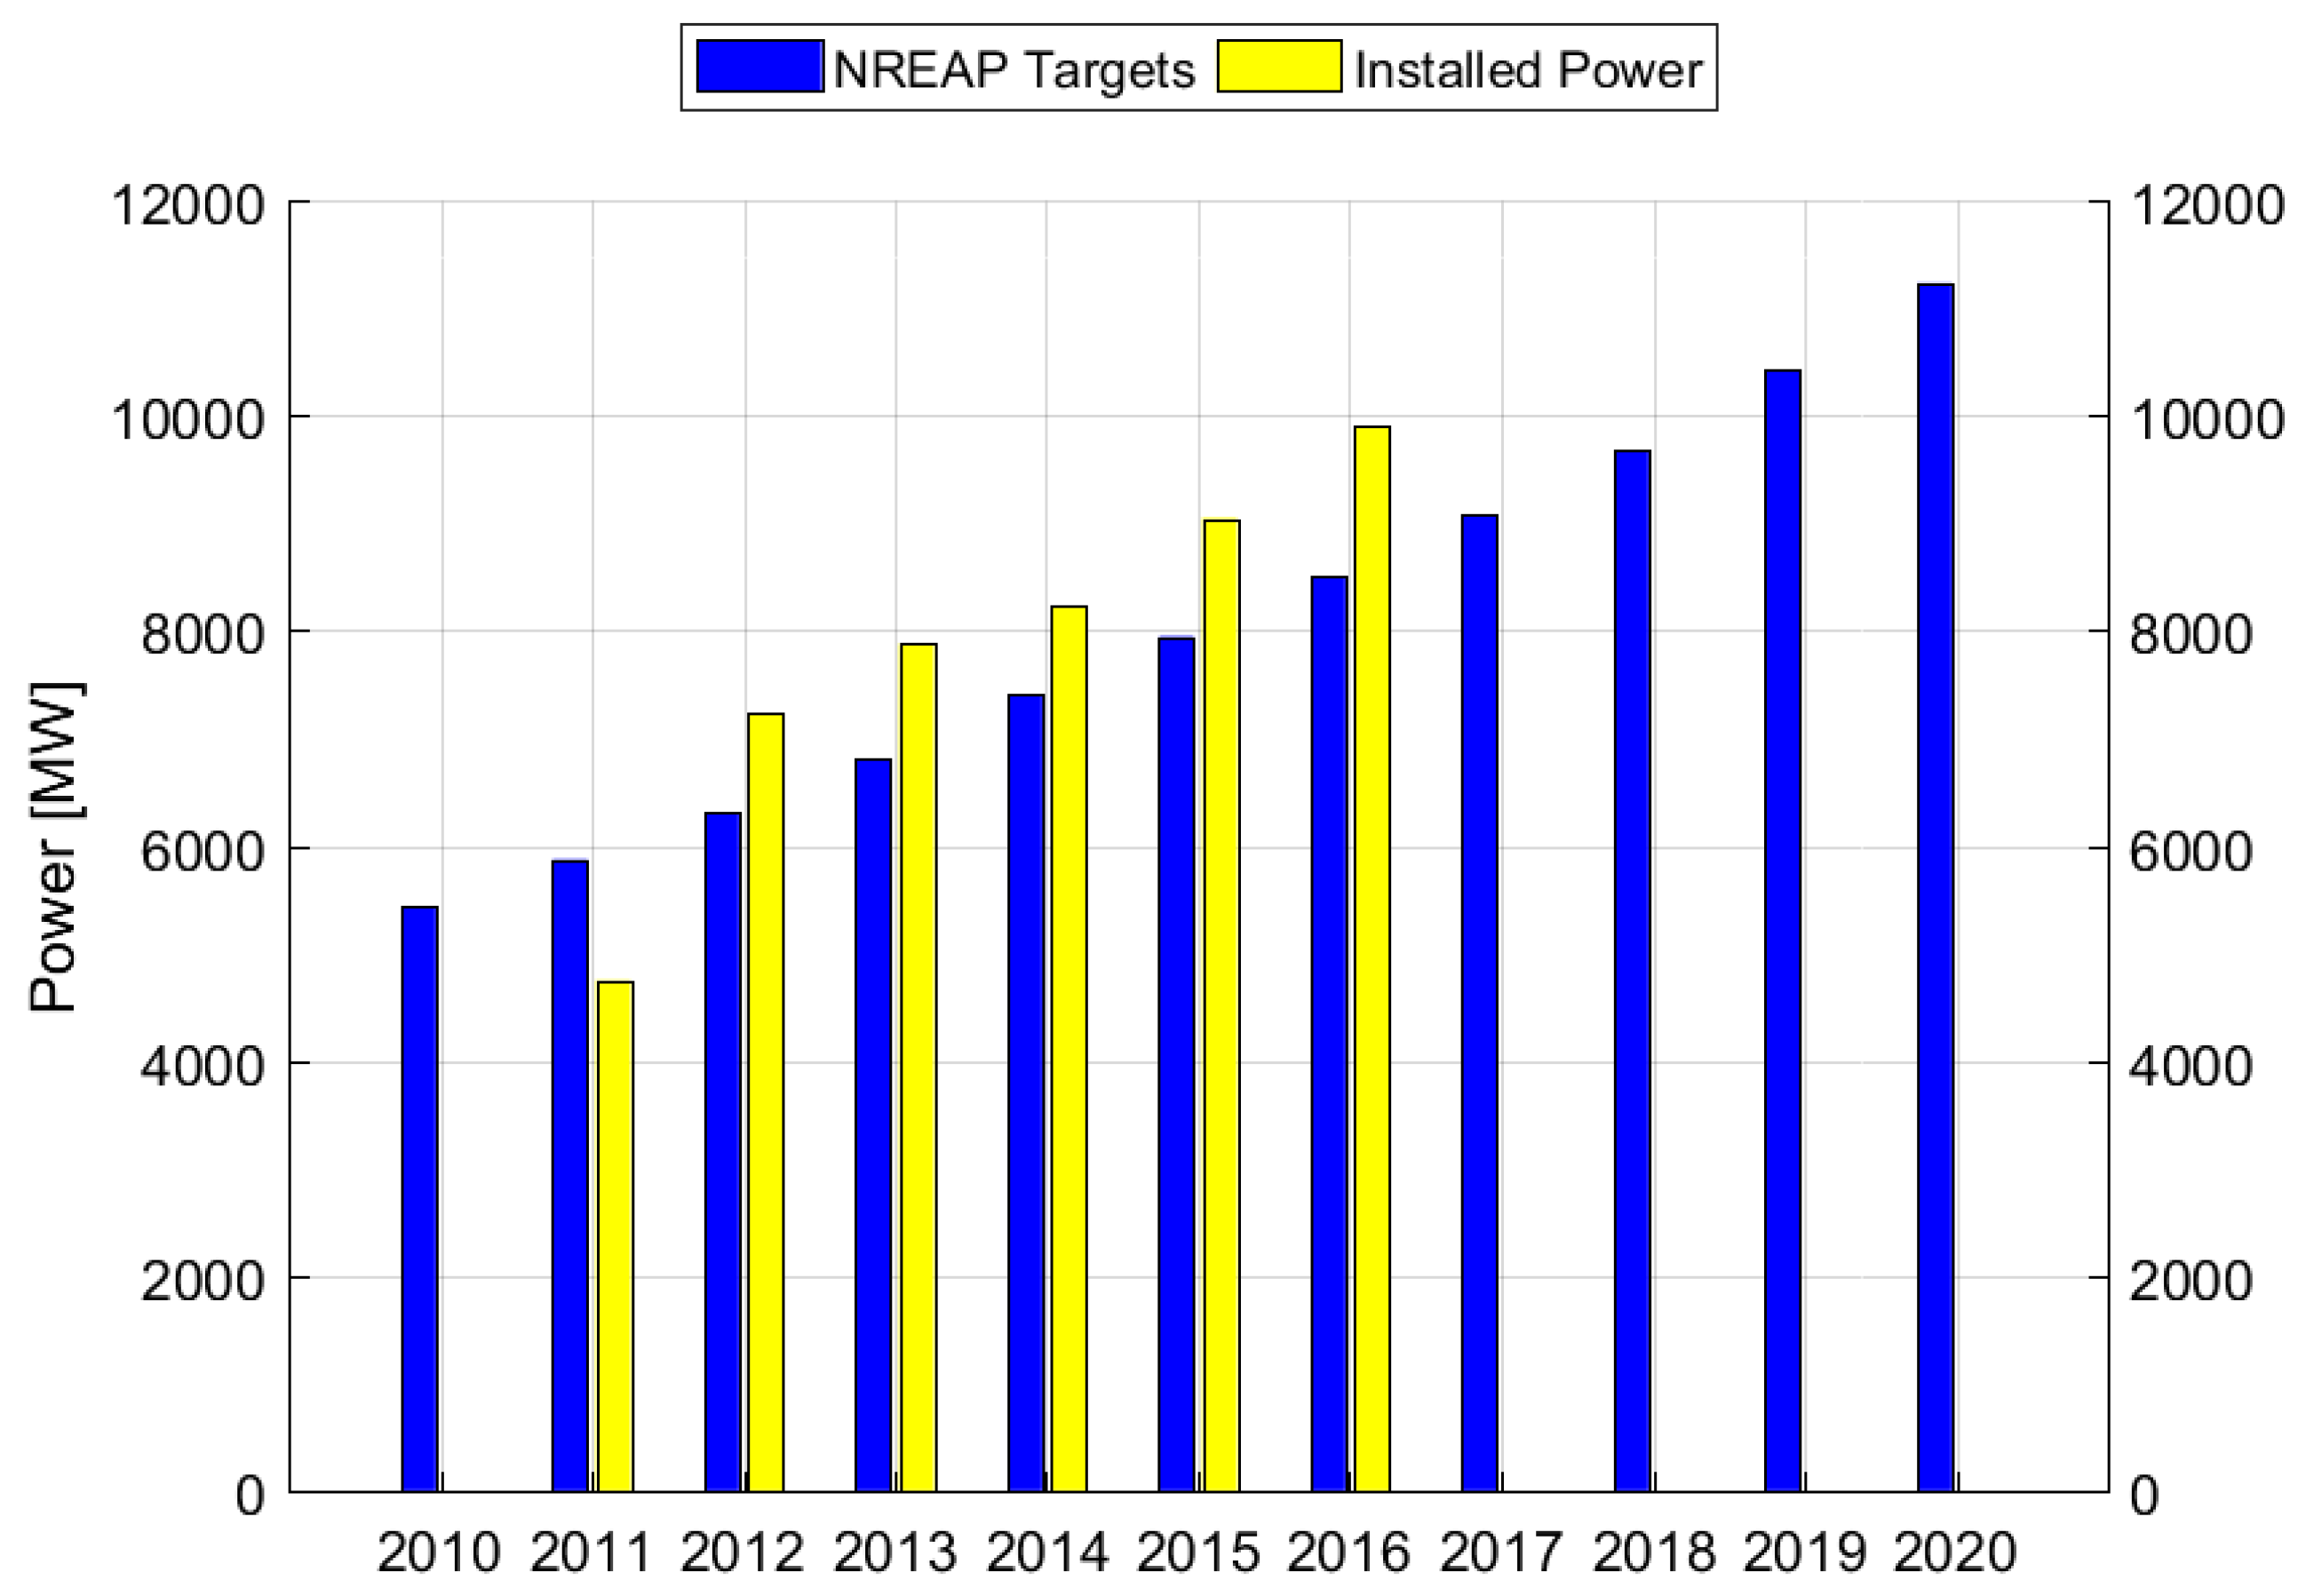
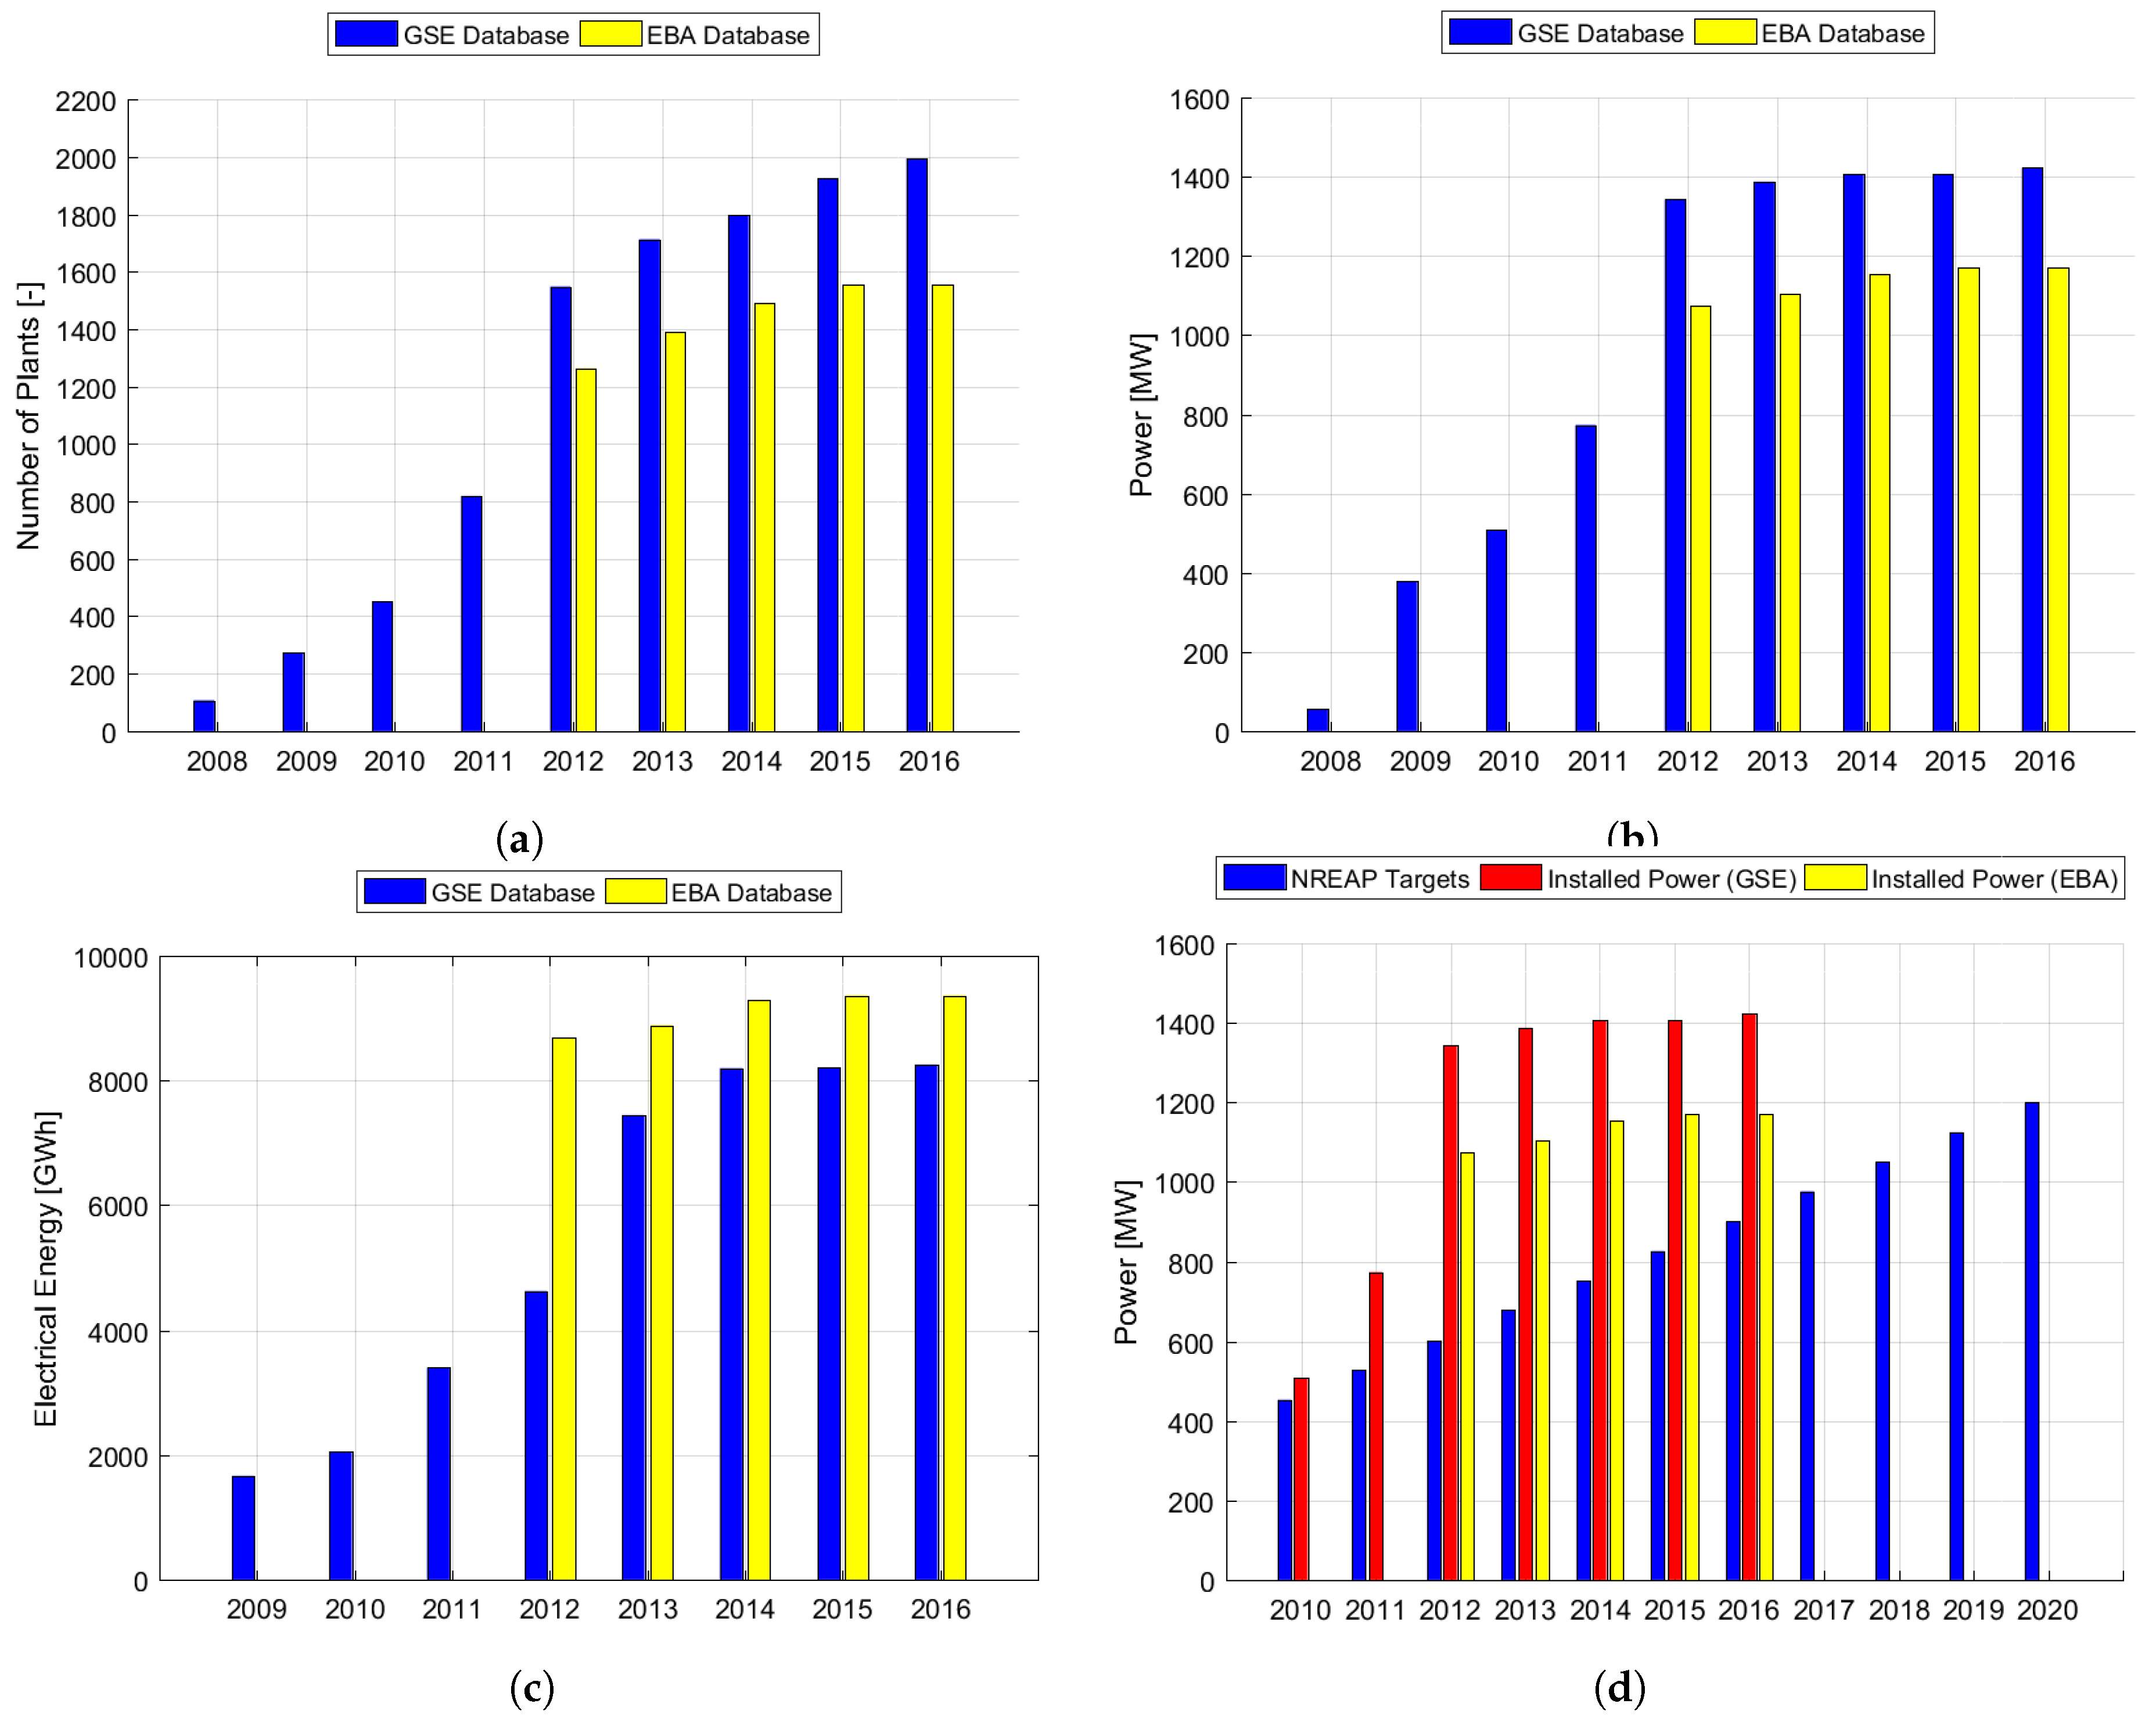
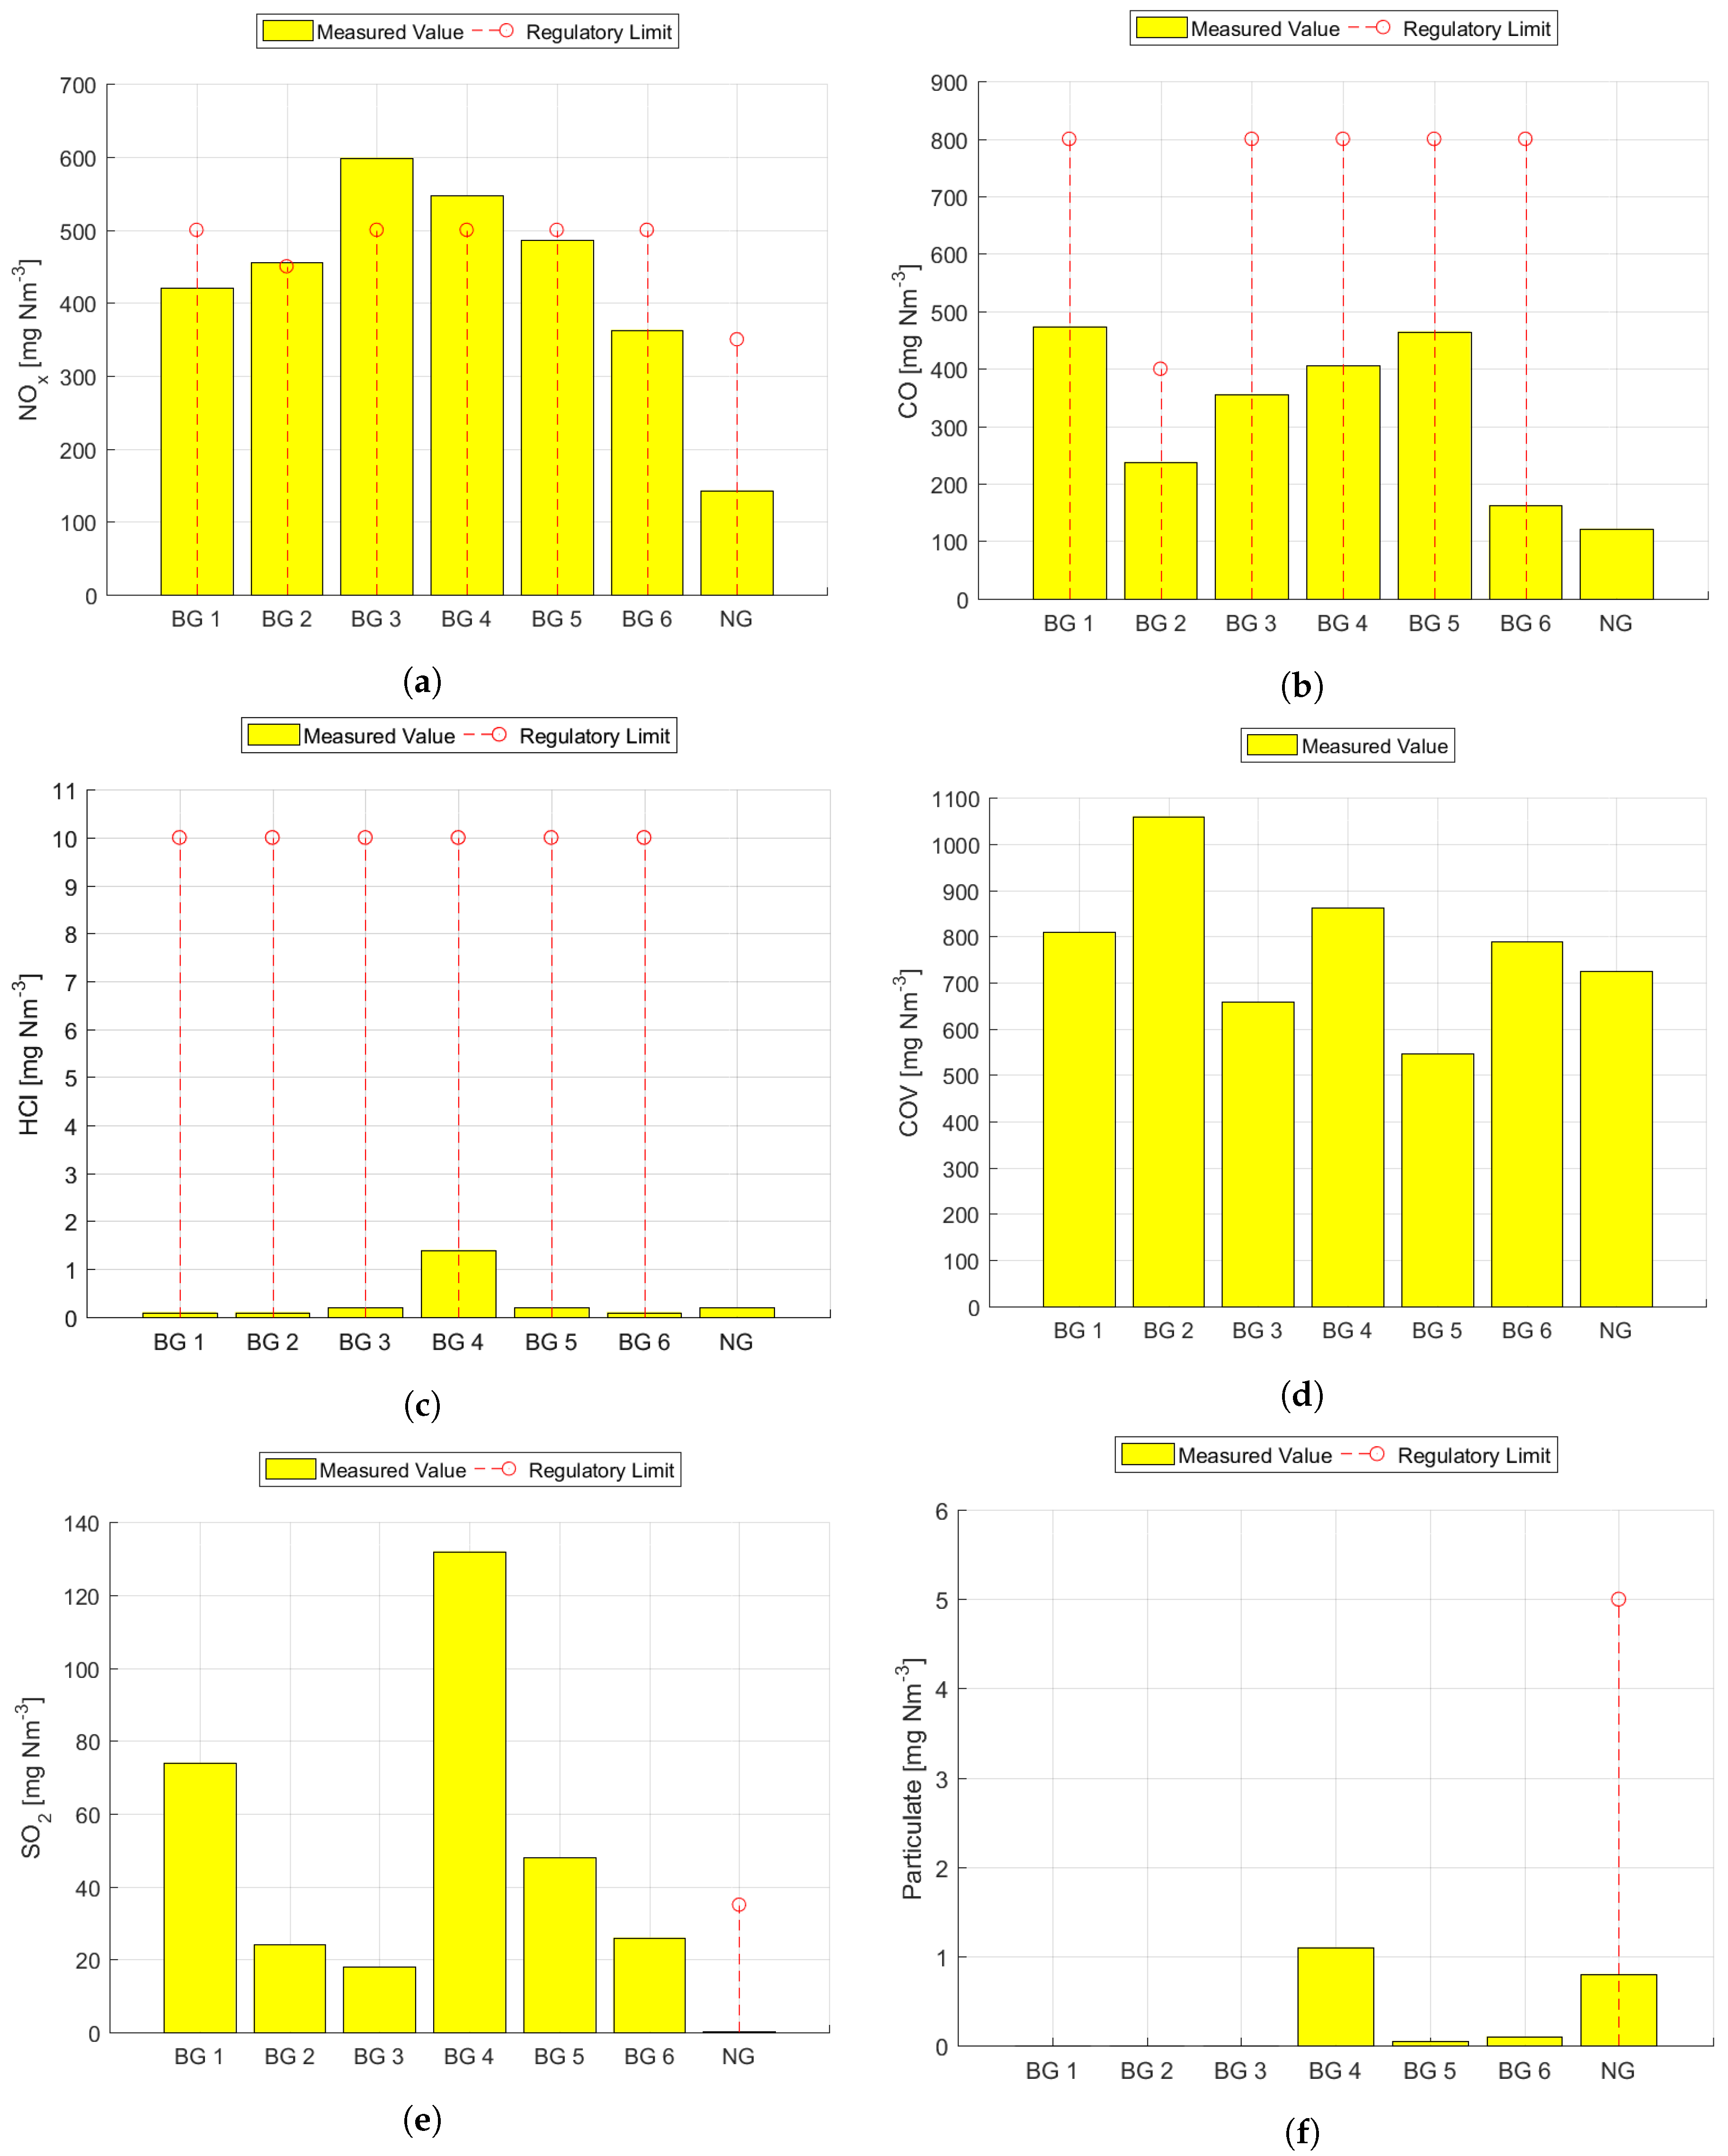
Table 1.
Prescribed Italian limits for biogas plants [81].
Table 1.
Prescribed Italian limits for biogas plants [81].
| Contaminants | MW | MW |
|---|---|---|
| NO | 500 mg Nm | 450 mg Nm |
| CO | 800 mg Nm | 650 mg Nm |
| HCI | 10 mg Nm | 10 mg Nm |
| VOC as TOC | 150 mg Nm | 100 mg Nm |
Table 2.
Biogas engine technical data.
| Parameter | |
|---|---|
| Configuration | V 70° |
| No. of cylinders | 20 |
| Bore (mm) | 135 |
| Stroke (mm) | 170 |
| Displacement/cylinder (L) | 2.433 |
| Speed (rpm) | 1500 |
| Mean piston speed (m s) | 8.5 |
| Electrical output (kW) | 999 |
| Energy input (kW) | 2459 |
| Electrical efficiency (%) | 40.58 |
| Thermal efficiency (%) | - |
| Total efficiency (%) | 40.58 |
| Fuel flow rate (Nm h) | 547 ± 5% |
| Fuel Lower Heat Value (kWh Nm) | 4.5 |
| Exhaust gases mass flow rate (kg h) | 5312 |
| Exhaust gases temperature (°C) | 457 |
Table 3.
Diet of the selected plants.
| Plant | Feedstock | |
|---|---|---|
| BG1 | Maize silage | 39.4 t d |
| Cattle sewage | 60 m d | |
| Cattle manure | 25.26 t d | |
| BG2 | Maize silage | 45 t d |
| Water | 30 m d | |
| Wheat Silage | 15 t d | |
| BG3 | Maize silage | 25 t d |
| Corn flour | 3 t d | |
| Sugar beets | 20 t d | |
| BG4 | Maize silage | 44 t d |
| Corn flour | 3 t d | |
| BG5 | Maize silage | 27.5 t d |
| Pig sewage | 60 m d | |
| Chicken-dung | 22.5 t d | |
| BG6 | Maize silage | 33 t d |
| Pig sewage | 50 m d | |
| Triticale silage | 16 t d | |
| NG | Natural gas | 281 m h |
Table 4.
Emission limits of the selected plants.
| Plant | Emission | Limit |
|---|---|---|
| BG1 | NOx | 500 mg Nm |
| CO | 800 mg Nm | |
| HCl | 10 mg Nm | |
| VOC as TOC | 150 mg Nm | |
| BG2 | NOx | 450 mg Nm |
| CO | 400 mg Nm | |
| HCl | 10 mg Nm | |
| VOC as TOC | 150 mg Nm | |
| BG3 | NOx | 500 mg Nm |
| CO | 800 mg Nm | |
| HCl | 10 mg Nm | |
| VOC as TOC | 100 mg Nm | |
| BG4 | NOx | 500 mg Nm |
| CO | 800 mg Nm | |
| HCl | 10 mg Nm | |
| VOC as TOC | 100 mg Nm | |
| BG5 | NOx | 500 mg Nm |
| CO | 800 mg Nm | |
| HCl | 10 mg Nm | |
| VOC as TOC | 100 mg Nm | |
| BG6 | NOx | 500 mg Nm |
| CO | 800 mg Nm | |
| HCl | 10 mg Nm | |
| VOC as TOC | 100 mg Nm | |
| NG | NOx | 350 mg Nm |
| SOx | 35 mg Nm | |
| Particulate | 5 mg Nm |
Table 5.
Biogas composition—part 1.
| Substance | BG1 | BG2 | BG3 | BG4 | BG5 | BG6 | |
|---|---|---|---|---|---|---|---|
| Moisture | %v/v | <2.0 | <2.0 | 2.0 ± 0.6 | <2.0 | <2.0 | <1.0 |
| Temperature | °C | 27 ± 2 | 24 ± 2 | 28 ± 2 | 30 ± 2 | 24 ± 2 | 19 ± 2 |
| LHV | MJ Nm | 19.88 | 19.67 | 19.92 | 20.64 | 19.67 | 17.99 |
| CH | % | 53 ± 8 | 53 ± 7.95 | 51 ± 7.7 | 53 ± 8 | 55 ± 8.2 | 47 ± 7.1 |
| CO | % | 44 ± 6.6 | 44 ± 6.6 | 48 ± 7.2 | 45 ± 6.8 | 44 ± 6.6 | 41 ± 6.1 |
| N | % | 1.9 ± 0.3 | 1.9 ± 0.3 | 0.7 ± 0.1 | 1.7 ± 0.3 | 1.1 ± 0.17 | 9 ± 1.4 |
| O | % | 0.4 ± 0.06 | 0.4 ± 0.06 | 0.1 ± 0.015 | 0.4 ± 0.06 | 0.1 ± 0.02 | 2.4 ± 0.4 |
| H | % | <0.5 | <0.5 | <0.5 | <0.5 | <0.5 | <0.5 |
| NH | mg Nm | 11 ± 3.3 | <0.5 | 2.9 ± 0.9 | 19 ± 5.7 | 17 ± 5.1 | <0.5 |
| Total chlorine | mg Nm | <2.5 | <2.5 | <2.1 | <2.0 | <2.1 | <2.1 |
| Total fluorine | mg Nm | <0.5 | <1.0 | <0.4 | <0.5 | <0.4 | <0.5 |
| Total sulphur | mg Nm | 856 | 165 | 110 | 531 | 132 | 118 |
| Chlorine inorganic compounds | mg Nm | <0.5 | <0.5 | <0.5 | <0.5 | <0.5 | <0.5 |
| Fluorine inorganic compounds | mg Nm | <0.5 | <0.5 | <0.5 | <0.5 | <0.5 | <0.5 |
| HSO | mg Nm | 24 ± 8 | 24 ± 8 | 6.5 ± 2 | 4.7 ± 1.4 | 11 ± 3.3 | 0.9 ± 0.3 |
| HS | mg Nm | 900 ± 270 | 165 ± 49.5 | 115 ± 34.5 | 561 ± 168 | 135 ± 41 | 123 ± 37 |
| Particulate | mg Nm | 0.5 ± 0.15 | <0.4 | <0.3 | <0.4 | <0.3 | <0.4 |
| Silica | mg Nm | <0.4 | <0.4 | <0.4 | <0.4 | <0.4 | <0.4 |
| Oily mists | mg Nm | <0.5 | <0.5 | <1.4 | <1.5 | <0.5 | <0.5 |
Table 6.
Biogas composition—part 2.
| Substance | BG1 | BG2 | BG3 | BG4 | BG5 | BG6 | |
|---|---|---|---|---|---|---|---|
| Polysiloxane | |||||||
| Hexamethyldisiloxane | mg Nm | <0.5 | <0.5 | <0.5 | <0.5 | <0.5 | <0.5 |
| Hexamethylcyclotrisiloxane | mg Nm | <0.5 | <0.5 | <0.5 | <0.5 | <0.5 | <0.5 |
| Octametiltrisiloxane | mg Nm | <0.5 | <0.5 | <0.5 | <0.5 | <0.5 | <0.5 |
| Decamethyl Tetra Siloxane | mg Nm | <0.5 | <0.5 | <0.5 | <0.5 | <0.5 | <0.5 |
| Octamethylcycletetrasiloxane | mg Nm | <0.5 | <0.5 | <0.5 | 0.8 ± 0.2 | <0.5 | <0.5 |
| Decamethylcyclopentasiloxane | mg Nm | <0.5 | <0.5 | <0.5 | 1.1 ± 0.3 | 0.7 ± 0.2 | <0.5 |
| Dodecamethylpentasiloxane | mg Nm | <0.5 | <0.5 | <0.5 | <0.5 | <0.5 | <0.5 |
| Dodecamethylcicloesasiloxane | mg Nm | <0.5 | <0.5 | <0.5 | <0.5 | <0.5 | <0.5 |
| Hydrocarbons | |||||||
| 1,3 Butadiene | mol (100 mol) | <0.02 | 0.18 ± 0.013 | <0.02 | <0.02 | <0.02 | <0.02 |
| 1 Butene | mol (100 mol) | <0.02 | 0.11 ± 0.008 | <0.02 | <0.02 | <0.02 | <0.02 |
| 2 Methyl Propene | mol (100 mol) | <0.02 | <0.02 | <0.02 | <0.02 | <0.02 | <0.02 |
| Etino (Acetylene) | mol (100 mol) | <0.02 | 0.03 ± 0.002 | <0.02 | <0.02 | <0.02 | <0.02 |
| Carbon monoxide | mol (100 mol) | <0.05 | <0.05 | <0.05 | <0.05 | <0.05 | <0.05 |
| Cis2Butene | mol (100 mol) | <0.02 | 0.13 ± 0.009 | <0.02 | <0.02 | <0.02 | <0.02 |
| Ethane | mol (100 mol) | <0.02 | 0.12 ± 0.008 | <0.02 | <0.02 | <0.02 | <0.02 |
| Ethene | mol (100 mol) | <0.02 | 0.06 ± 0.004 | <0.02 | <0.02 | <0.02 | <0.02 |
| Hydrogen | mol (100 mol) | <0.05 | 0.13 ± 0.009 | <0.05 | <0.05 | <0.05 | <0.05 |
| IsoButane | mol (100 mol) | <0.02 | 0.24 ± 0.017 | <0.02 | <0.02 | <0.02 | <0.02 |
| IsoPentane | mol (100 mol) | <0.02 | 0.08 ± 0.006 | <0.02 | <0.02 | <0.02 | <0.02 |
| nButane | mol (100 mol) | <0.02 | 0.23 ± 0.016 | <0.02 | <0.02 | <0.02 | <0.02 |
| nPentane | mol (100 mol) | <0.02 | 0.1 ± 0.007 | <0.02 | <0.02 | <0.02 | <0.02 |
| Oxygen + Argon | mol (100 mol) | 0.44 ± 0.03 | 0.85 ± 0.06 | <0.02 | <0.02 | <0.02 | <0.02 |
| Propadiene | mol (100 mol) | <0.02 | 0.05 ± 0.0035 | <0.02 | <0.02 | <0.02 | <0.02 |
| Propane | mol (100 mol) | <0.02 | 0.24 ± 0.028 | <0.02 | <0.02 | <0.02 | <0.02 |
| Propene | mol (100 mol) | <0.02 | 0.12 ± 0.0084 | <0.02 | <0.02 | <0.02 | <0.02 |
| Trans2Butene | mol (100 mol) | <0.02 | 0.02 ± 0.0014 | <0.02 | <0.02 | <0.02 | <0.02 |
Table 7.
Biogas composition—part 3.
| Substance | BG1 | BG2 | BG3 | BG4 | BG5 | BG6 | |
|---|---|---|---|---|---|---|---|
| Volatile Organic Compounds | |||||||
| Dichlorine Difluorine Methane | mg Nm | <0.2 | <0.2 | <0.2 | <0.2 | <0.2 | <0.2 |
| Chlorine Methane | mg Nm | <0.2 | <0.2 | <0.2 | <0.2 | <0.2 | <0.2 |
| 1,2Dichlorine1,1,2,2Tetrafluorine Ethane | mg Nm | <0.2 | <0.2 | <0.2 | <0.2 | <0.2 | <0.2 |
| Vinyl chloride | mg Nm | <0.2 | <0.2 | <0.2 | <0.2 | <0.2 | <0.2 |
| Methyl bromide | mg Nm | <0.2 | <0.2 | <0.2 | <0.2 | <0.2 | <0.2 |
| Ethyl chloride | mg Nm | <0.2 | <0.2 | <0.2 | <0.2 | <0.2 | <0.2 |
| Trichlorine fluorine Methane | mg Nm | <0.2 | <0.2 | <0.2 | <0.2 | <0.2 | <0.2 |
| 1,1Dichlorine Ethylene | mg Nm | <0.2 | <0.2 | <0.2 | <0.2 | <0.2 | <0.2 |
| Dichlorine Methane | mg Nm | <0.2 | <0.2 | <0.2 | <0.2 | <0.2 | <0.2 |
| 1,1,2Trichlorine2,2,1Trifluorine Ethane | mg Nm | <0.2 | <0.2 | <0.2 | <0.2 | <0.2 | <0.2 |
| 1,1Dichlorine Ethane | mg Nm | <0.2 | <0.2 | <0.2 | <0.2 | <0.2 | <0.2 |
| 1,2cisDichlorine Ethylene | mg Nm | <0.2 | <0.2 | <0.2 | <0.2 | <0.2 | <0.2 |
| Chloroform | mg Nm | <0.2 | <0.2 | <0.2 | <0.2 | <0.2 | <0.2 |
| 1,2Dichlorine Ethane | mg Nm | <0.2 | <0.2 | <0.2 | <0.2 | <0.2 | <0.2 |
| 1,1,1Trichlorine Ethane | mg Nm | <0.2 | <0.2 | <0.2 | <0.2 | <0.2 | <0.2 |
| Benzene | mg Nm | <0.2 | <0.2 | <0.2 | <0.2 | <0.2 | <0.2 |
| Tetrachloride carbon | mg Nm | <0.2 | <0.2 | <0.2 | <0.2 | <0.2 | <0.2 |
| 1,2Dichlorine Propane | mg Nm | <0.2 | <0.2 | <0.2 | <0.2 | <0.2 | <0.2 |
| Trichlorine Ethylene | mg Nm | <0.2 | <0.2 | <0.2 | <0.2 | <0.2 | <0.2 |
| 1,3cisDichlorine Propene | mg Nm | <0.2 | <0.2 | <0.2 | <0.2 | <0.2 | <0.2 |
| 1,3transDichlorine Propene | mg Nm | <0.2 | <0.2 | <0.2 | <0.2 | <0.2 | <0.2 |
| 1,1,2Trichlorine Ethane | mg Nm | <0.2 | <0.2 | <0.2 | <0.2 | <0.2 | <0.2 |
| Toluene | mg Nm | 1.5 ± 0.5 | 1.4 ± 0.4 | 0.4 ± 0.1 | 0.5 ± 0.1 | 0.9 ± 0.2 | 0.2 ± 0.05 |
| 1,2Dibromo ethane | mg Nm | <0.2 | <0.2 | <0.2 | <0.2 | <0.2 | <0.2 |
| Tetrachloro Ethylene | mg Nm | <0.2 | <0.2 | <0.2 | <0.2 | <0.2 | <0.2 |
| Chlorine Benzene | mg Nm | <0.2 | <0.2 | <0.2 | <0.2 | <0.2 | <0.2 |
| Ethyl Benzene | mg Nm | <0.2 | <0.2 | <0.2 | <0.2 | <0.2 | <0.2 |
| meta Xylene + para Xylene | mg Nm | <0.2 | <0.2 | <0.2 | <0.2 | <0.2 | <0.2 |
| Styrene | mg Nm | <0.2 | <0.2 | <0.2 | <0.2 | <0.2 | <0.2 |
| 1,1,2,2Tetrachloro Ethane | mg Nm | <0.2 | <0.2 | <0.2 | <0.2 | <0.2 | <0.2 |
| orto Xylene | mg Nm | <0.2 | <0.2 | <0.2 | <0.2 | <0.2 | <0.2 |
| 1,3,5Trimetil Benzene | mg Nm | <0.2 | <0.2 | <0.2 | <0.2 | <0.2 | <0.2 |
| 1,2,4Trimetil Benzene | mg Nm | <0.2 | <0.2 | <0.2 | <0.2 | <0.2 | <0.2 |
| 1,3DiChlorine Benzene | mg Nm | <0.2 | <0.2 | <0.2 | <0.2 | <0.2 | <0.2 |
| 1,4DiChlorine Benzene | mg Nm | <0.2 | <0.2 | <0.2 | <0.2 | <0.2 | <0.2 |
| 1,2DiChlorine Benzene | mg Nm | <0.2 | <0.2 | <0.2 | <0.2 | <0.2 | <0.2 |
| 1,2,4TriChlorine Benzene | mg Nm | <0.2 | <0.2 | <0.2 | <0.2 | <0.2 | <0.2 |
| EsaChlorine Butadiene | mg Nm | <0.2 | <0.2 | <0.2 | <0.2 | <0.2 | <0.2 |
| Dimetil Sulfide | mg Nm | <0.5 | <0.5 | 1.5 | <0.5 | <0.5 | <0.5 |
| Carbon Disulfide | mg Nm | <0.5 | <0.5 | <0.5 | <0.5 | <0.5 | <0.5 |
| Thiophene | mg Nm | <0.5 | <0.5 | <0.5 | <0.5 | <0.5 | <0.5 |
| Dietil Sulfide | mg Nm | <0.5 | <0.5 | <0.5 | <0.5 | <0.5 | <0.5 |
| Tetraidro Thiophene | mg Nm | <0.5 | <0.5 | <0.5 | <0.5 | <0.5 | <0.5 |
| Diallil Sulfide | mg Nm | <0.5 | <0.5 | <0.5 | <0.5 | <0.5 | <0.5 |
| Dimetil DiSulfide | mg Nm | <0.5 | <0.5 | <0.5 | <0.5 | <0.5 | <0.5 |
| Metil Mercaptan | mg Nm | <0.5 | <0.5 | <0.5 | <0.5 | <0.5 | <0.5 |
| Etil Mercaptan | mg Nm | <0.5 | <0.5 | <0.5 | <0.5 | <0.5 | <0.5 |
| nPropil Mercaptan | mg Nm | <0.5 | <0.5 | <0.5 | <0.5 | <0.5 | <0.5 |
| nButil Mercaptan | mg Nm | <0.5 | <0.5 | <0.5 | <0.5 | <0.5 | <0.5 |
Table 8.
Exhaust gases composition.
| Substance | BG1 | BG2 | BG3 | BG4 | BG5 | BG6 | NG | |
|---|---|---|---|---|---|---|---|---|
| Temperature | °C | 503 ± 5 | 505 ± 5 | 470 ± 5 | 171 ± 2 | 267 ± 5 | 227 ± 5 | 149 ± 2 |
| Flow rate (wet) | Nm h | 5100 ± 510 | 4850 ± 485 | 4000 ± 400 | 4130 ± 413 | 4300 ± 430 | 4900 ± 490 | 4900 ± 490 |
| Flow rate (dry) | Nm h | 4200 ± 420 | 4030 ± 403 | 3500 ± 350 | 3350 ± 335 | 3700 ± 370 | 4300 ± 430 | 4250 ± 425 |
| Water vapor | %v/v | 18 ± 5.4 | 17 ± 5.1 | 13 ± 4.3 | 19 ± 5.7 | 14 ± 4.2 | 14 ± 4.2 | 10 ± 3 |
| PM 10 | mg Nm | 0.8 ± 0.2 | <0.1 | <0.1 | 0.3 ± 0.06 | |||
| PM 2.5 | mg Nm | 0.8 ± 0.2 | <0.1 | <0.1 | 0.2 ± 0.06 | |||
| Particulate | mg Nm | 1.1 ± 0.3 | <0.1 | 0.1 ± 0.03 | 0.8 ± 0.2 | |||
| O | %v/v | 7.2 ± 0.4 | 7.4 ± 0.4 | 7.3 ± 0.4 | 7.2 ± 0.4 | 7.2 ± 0.4 | 7.6 ± 0.4 | 11.6 ± 0.6 |
| CO | %v/v | 12.4 ± 0.93 | 12.5 ± 0.9 | 13.6 ± 1 | 13.2 ± 1 | 12.6 ± 0.9 | 16.2 ± 1.2 | 5.4 ± 0.4 |
| Ammonia | mg Nm | 0.7 ± 0.2 | 3.7 ± 1.1 | <0.5 | <0.5 | <0.5 | <0.5 | <0.5 |
| HS | mg Nm | <4.0 | <4.0 | <4.0 | <4.0 | <4.0 | <4.0 | <4 |
| HCl | mg Nm | <0.1 | <0.1 | <0.2 | 1.4 0.4 | <0.2 | <0.1 | 0.2 0.06 |
| SO | mg Nm | 74 ± 22 | 24 ± 8 | 18 ± 6 | 132 ± 39.6 | 48 ± 14.4 | 26 ± 7.8 | 0.2 ± 0.06 |
| Fluorine inorganic | ||||||||
| compounds | mg Nm | 2.5 ± 0.8 | <0.5 | <0.5 | <0.5 | <0.5 | 0.9 ± 0.3 | 3.9 ± 1.2 |
| CO | mg Nm | 474 ± 47 | 238 ± 23.8 | 356 ± 36 | 406 ± 41 | 465 ± 46.5 | 163 ± 16 | 122 ± 12 |
| NO | mg Nm | 420 ± 36 | 455 ± 39 | 599 ± 60 | 547 ± 46 | 486 ± 41 | 363 ± 31 | 143 ± 12 |
| VOC as TOC | mg Nm | 809 ± 81 | 1060 ± 106 | 658 ± 66 | 862 ± 86 | 546 ± 55 | 789 ± 79 | 724 ± 72 |
| Formaldehyde | mg Nm | 0.88 ± 0.15 | 0.5 ± 0.15 | <0.03 | <0.04 | <0.03 | 0.11 ± 0.03 | 0.11 ± 0.03 |
Table 9.
Comparisons among measured data and the ones listed in [84].
© 2019 by the authors. Licensee MDPI, Basel, Switzerland. This article is an open access article distributed under the terms and conditions of the Creative Commons Attribution (CC BY) license (http://creativecommons.org/licenses/by/4.0/).
Share and Cite
MDPI and ACS Style
Benato, A.; Macor, A. Italian Biogas Plants: Trend, Subsidies, Cost, Biogas Composition and Engine Emissions. Energies 2019, 12, 979. https://0-doi-org.brum.beds.ac.uk/10.3390/en12060979
AMA Style
Benato A, Macor A. Italian Biogas Plants: Trend, Subsidies, Cost, Biogas Composition and Engine Emissions. Energies. 2019; 12(6):979. https://0-doi-org.brum.beds.ac.uk/10.3390/en12060979
Chicago/Turabian StyleBenato, Alberto, and Alarico Macor. 2019. "Italian Biogas Plants: Trend, Subsidies, Cost, Biogas Composition and Engine Emissions" Energies 12, no. 6: 979. https://0-doi-org.brum.beds.ac.uk/10.3390/en12060979
Note that from the first issue of 2016, this journal uses article numbers instead of page numbers. See further details here.