The Heterogeneous Interconnections between Supply or Demand Side and Oil Risks


1
College of Finance and Statistics, Hunan University, Changsha 410006, China
2
Guangzhou International Institute of Finance and Guangzhou University, Guangzhou 510405, China
*
Authors to whom correspondence should be addressed.
Energies 2019, 12(11), 2226; https://0-doi-org.brum.beds.ac.uk/10.3390/en12112226
Submission received: 5 May 2019
/
Revised: 6 June 2019
/
Accepted: 8 June 2019
/
Published: 11 June 2019
(This article belongs to the Special Issue Energy Markets and Economics Ⅱ)
Abstract
:Due to the crucial implication of oil risks for economic growth and policy making, the aim of this paper is to explore the heterogeneous interconnections of supply or demand in oil risks over time horizons and different countries. Specifically, we first examine the correlation of supply or demand in oil return risks and show the relationships in different countries based on wavelet coherence. Furthermore, we explore the time-varying interconnections between supply- or demand-side and oil return risks, as well as oil producers and demand countries. The empirical results show that the correlation between supply and oil return risks is relatively stable, whereas the linkage between demand and oil return risks shows greater volatility due to the impact of specific events. Further study indicates that there are heterogeneous interconnections between supply- or demand-side and oil return risks over sample periods. Specifically, the sign of response could be divided into four phases, i.e., 1997–2002, 2002–2010, 2010–2013 and 2014–2018. In addition, the interconnections of the demand side could be divided into three phases due to the sign of it. What is more, the dynamic interconnections of oil producers’ or countries’ demands behave quite heterogeneously in different countries. Thus policymakers should focus on the coordination level and space capacity in the global crude oil market.
1. Introduction
Since the seminal work by Kilian [1], a large literature has explored the interconnections of supply and demand in the fluctuation of oil price. As we all know, oil price experienced extraordinary volatility from 2007 to 2009 and during the period of 2014–2016. Hamilton [2] noted that demand factors play a dominant role in oil price volatility during the oil price increase period from 2007 to 2008. Moreover, Yu [3] identified global oil supply shocks and China’s demand shocks and investigated the impact of China’s demand shocks in promoting the volatility of global oil prices after the financial crisis. What is more, other scholars also claimed that some supply and demand factors, such as the US shale oil production, played a crucial role in the oil price drop during the period of 2014–2016 [4,5]. Indeed, the identification of this coherence, which depicts the underlying interconnections of supply or demand in oil risks, is crucial not only for clarifying crude oil markets, but also for explaining the dominant or heterogeneous role of different factors. What is more, changes in the oil price can significantly affect the economy as well as financial markets [6,7,8,9,10,11]. Therefore, the first goal of this paper is to verify the interconnections by examining the coherence of supply and demand in oil risks and by showing the relationships in different countries.
For instance, there are heterogeneous interconnections of supply and demand in oil risks over time horizons. To understand the different relationships of supply and demand over the time horizon, it is worth noting that the fundamental characteristics of crude oil price series are the result of different types of interconnections in different time windows [12]. Most of current studies obtain the fluctuation mechanism of oil prices by investigating the structural break effect, which could hide the diversity and evolution characteristics of oil price fluctuations [13,14]. It is also obvious that we could obtain detailed information regarding the oil price volatility by exploring the heterogeneous interconnection, which is important to understand crude oil markets. What is more, the stability of crude oil markets could play a major role in the decision making and precautionary behaviors of suppliers and demanders due to different stakeholders [15,16,17]. The decline of crude oil prices, on the one hand, could cause the dynamic of production decisions and investment strategies, on the other hand, could also drive up the uncertainty of strategies in petroleum enterprises through reducing their profits.
We next assess the heterogeneous importance of supply and demand countries in explaining crude oil return risks. During the last two decades, the landscape of crude oil markets has shifted dramatically. The impact of OPEC members’ production level on oil prices fluctuations is a controversial issue with the development of non-OPEC countries. Specifically, this impact has been changing over time, since the dynamic of the market share of non-OPEC oil producers. Otherwise, the change of members’ oil production could also strongly influence the global crude oil market as the prices deviate from their competitive level [18]. Meanwhile, the change of oil price has not caused any negative effects on the economic environment, and this sparked some researches to explore the role of consumption in global oil risks [19].
In this article, we explore the question of how supply- or demand-side exerts heterogeneous impacts on global oil return risks. This is a critical issue for academic scholars, as well as policymakers. Sharp movements in the oil price have serious impacts on risk management, hedging strategies and monetary policies. It is also plausible that real economic activities may inherit nonlinearity and instability of the oil price. What is more, the supply or demand status contributes to the global oil markets and then affects the oil return risks.
The main objective of this paper is to investigate the interconnections of supply- or demand-side on global oil risks. To be more specific, the first objective is to test the causal effect of underlying supply or demand on the oil markets. Our next aim is to investigate whether the increased oil risk for oil originates from the supply side shows a heterogeneous impact from the demand side. Having established where the interconnection evaluates, we further analyze the diverse response to oil producers’ and countries’ consumption of oil risks. The exploration of responses is plausible not just for clarifying the source of global oil return risks, but also for identifying the diverse role of main factors, such as the coordination level and space capacity, associated with global crude oil markets.
The literature that estimates the oil risk factors focuses on explaining the fundamentals and disruptive factors in crude oil markets. From the perspective of the fundamentals, a large body of literature has investigated whether the oil price volatility could be affected by recurrent bubbles and structural breaks [20,21]. Ji [22] indicated the heterogeneous dependence between a bearish and bullish regime. In addition, He [23] estimated the oil risk with the prediction of oil price volatility led by changes in fundamentals, as well as other risk factors. In terms of disruptive factors, oil supply and demand are regarded as fundamental triggers. Before the year of 2000, specifically, it could be better accepted that the equilibrium model is more suitable to depict the production and consumption characteristics in crude oil markets [24,25].
We extend the literature in some folds. First, we examine possible time-varying correlations between supply or demand side and oil return risks, and we further test the causal relationship between oil production or consumption in different countries and oil risks via the wavelet coherence. Based on the wavelet theory, this paper explores the time-varying response of oil return risks to supply or demand side based on the time-varying parameter structural VAR (TVP-SVAR) model. To our best knowledge, no research has further explored this topic, in which the supply or demand shocks are identified using sign restrictions on impulse responses. Furthermore, this study also documents the time-varying response of oil return risks to crude supply countries and to demand countries.
The rest of the paper is organized as follows. After the introduction, Section 2 presents the coherence between supply or demand and oil risks and shows the causal relationship between oil production or consumption in different countries and oil risks. Section 3 discusses the heterogeneous interconnections of the full sample. In addition, the heterogeneous interconnections in different countries are shown in Section 4. Section 5 concludes.
2. Examining the Correlation between Supply or Demand and Oil Risks
2.1. Data and Wavelet Approach
To measure the oil risks, we use Brent oil spot price based on the conditional autoregressive value at risk (CAViaR) [26]. Value-at-Risk (VaR) could be regarded as an effective tool to calculate the oil return risks. The VaR reflects the maximum amount of loss exposed in oil during a specific period. In the existing literature, there are many studies focus on the application and some alternative risk measures based on GARCH-type models [27,28,29,30,31]. However, these approaches often assume that the distribution of oil return is invariable across time. In general, there are speculation and significant intra-cluster in global oil markets, which make oil return risks more dynamic [32,33]. Thus, we use the CAViaR to calculate the oil return risks in this study.
Moreover, the oil return risks could be explained by supply or demand side in crude oil markets. From the perspective of the supply side, those just emphasize the aggregate global oil production and ignore to model OPEC and non-OPEC oil production separately will lead to underestimation of the influence of the supply side on oil risks [34]. In terms of the demand side, global demand shocks, in particular, may have an indirect effect working through the fluctuation of oil. Specifically, we collect monthly Brent spot price, OPEC and non-OPEC oil production and world total oil consumption (million barrels per day) from January 1997 to December 2018 due to the data availability. The data are available from the US Energy Information Administration (EIA).
We rely on an alternative approach to examine the correlation between supply or demand and oil risks: The wavelet coherence analysis. On the one hand, wavelet coherence is a powerful mathematical tool of Xt (in our study, Xt is the oil return risks and other variables series (Other variables include OPEC oil production, non-OPEC oil production, world total petroleum consumption and oil supply or demand in countries)) with the non-stationary and continuous volatility. Recently, this approach has received great attention in crude oil markets [35,36,37,38,39,40]. On the other hand, numerous studies have attempted to examine the correlation between oil supply or demand and fluctuation in the crude oil price based on Granger tests [41]. Indeed, the increase of the demand side has changed the pattern of the crude oil market. In addition, it is a common belief that the change of oil supply and demand also behaves as the source of oil price volatility, which remains that the dynamic correlation depends on different market characters [42]. Therefore, we use wavelet coherence to examine the dynamic correlation between supply or demand and oil risks and further explore the role of oil producer or countries’ demand in oil return risks.
In the following, we briefly introduce the basics of the wavelet coherence approach.
The wavelet family could be written as Equation (1).
where represents time and scale for wavelet mother function , respectively.
Let be a series of oil return risks and is the length of sample (Others are similar to oil return risk for obtaining the CWT). As mentioned in (1), we can obtain continuous wavelet transform (CWT) from a particular wavelet mother function for . It could be written as Equation (2).
where the bar denotes a complex conjugate.
Moreover, the wavelet power spectrum (WPS) could generate the variance distribution of oil return risks. It could be shown as Equation (3).
The wavelet coherence between oil return risks and one of other variables could be depicted by CWT of oil return risks and OPEC oil production. At a more specific level, take the OPEC oil production as an example, CWT could be shown as Equation (4).
where and indicate the CWT of oil return risks and the OPEC oil production. The bar shows complex conjugate.
Following Torrence [43], the squared wavelet coherence could be defined as Equation (5).
where stands for a function that is smoothing procedure over time, with . A value of represents correlation between oil return risks and the OPEC oil production.
2.2. Correlation Analysis in Supply or Demand
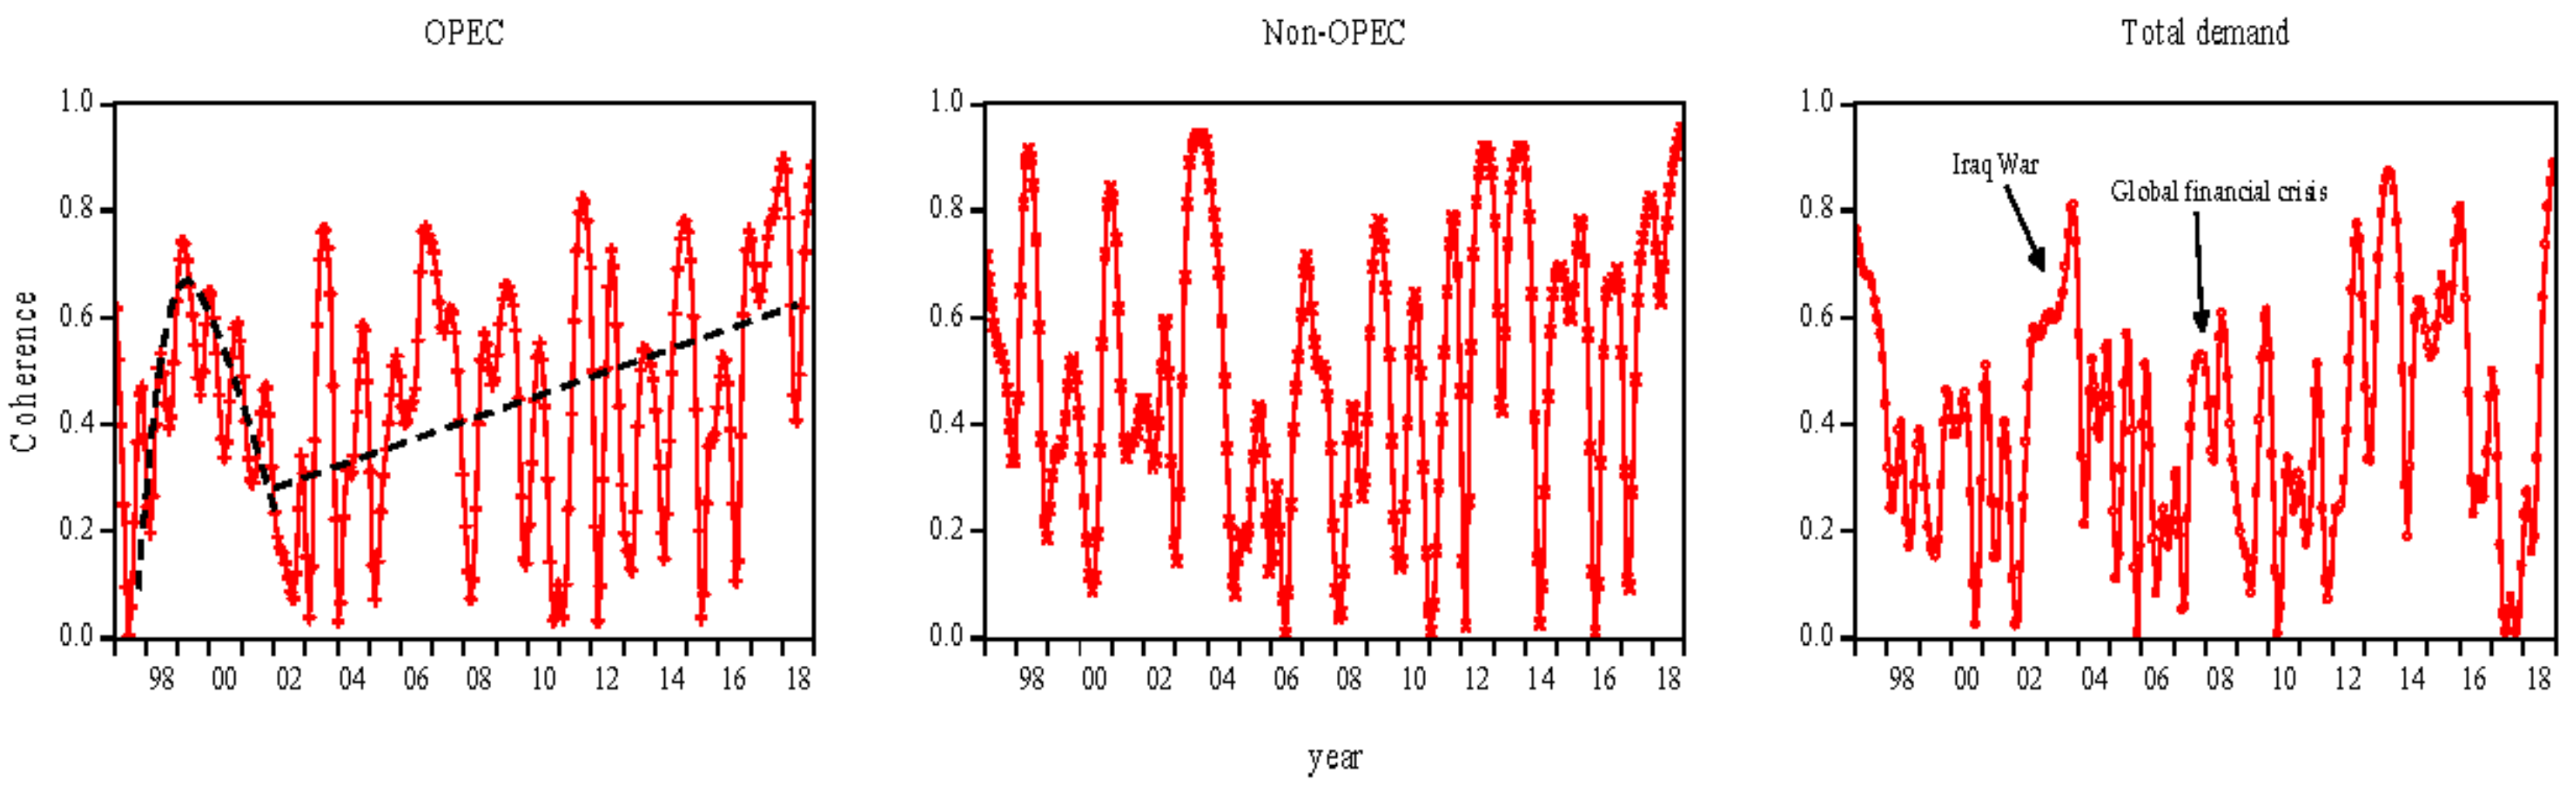
To examine the linkage of oil return risks with supply or demand side, a wavelet coherence for monthly oil production or consumption along with Brent oil return risks is developed (as portrayed in Figure 1). Specifically, the wavelet coherence will denote the strength of correlation between examined pairs.
In summary, we find evidence that there is strong correlation between supply or demand and oil return risks. In general, the correlation between supply and oil return risks is relatively stable, whereas the linkage between demand and oil return risks shows greater volatility due to the impact of specific events. From the perspective of the supply side, the correlation of the two types of producers has been differentiated during different phases. In Figure 1, for both OPEC and non-OPEC, we could divide the correlation into two phases. The first stage is 1997–2002. At this stage, the correlation between OPEC oil production and oil return risks shows an “inverted U” trend, while the dependence between non-OPEC oil production and oil return risks is generally stable, but the fluctuation is dramatic. The other phase is 2002–2018. The amplitude of the correlation between non-OPEC oil production and oil return risks is greater than that in OPEC oil supply. It could be explained by the market power and the change in oil production. Hence, to a certain extent, OPEC promotes the stability of crude oil markets through adjusting its production, which changes its market share rather than competitive condition. What is more, the global oil return risks reduce when stable sources of oil supply is more than unstable supplies. In fact, OPEC oil production has been less able than non-OPEC since OPEC has remained its market share at a relatively constant level recently. Thus the correlation between non-OPEC oil supply and oil return risks is greater than that in OPEC.
With reference to the total demand Figure, we show the correlation between demand and oil return risks. It is interesting to note that there are significant effects of external political environment on the correlation [44]. Specifically, it experienced a sharp increase induced by the Iraq war during 2002–2004. During the Iraq war, changes in oil production led to a relative rise in oil demand. Due to OPEC’s market power in adjustment, the supply shortage caused by the war is supplemented by other OPEC members. According to the lag of adjustment, however, the correlation between total oil consumption and oil return risks is enhanced. In addition, it also could be seen that the correlation strengthened during the global financial crisis. The scope of the global financial crisis caused by the US sub-prime mortgage crisis has gradually expanded, and the impact has gradually shifted from the virtual economy to the real economy. The total world oil consumption is reduced for the first time, and petroleum companies have also suffered a major impact. As the demand declines, the imbalance between supply and demand in the market is aggravated, which in turn reduces the stability of the market. Another sharp increase is during 2012–2016. Due to weak global economic recovery and rising oil prices, the growth of total world oil consumption is weak. Moreover, the continuous increase in oil supply during this period has made the market supply abundant. The downward pressure on oil prices is affected by the imbalance between supply and demand, which is mainly affected by demand.
2.3. Correlation Analysis in Oil Producers’ or Countries’ Demand
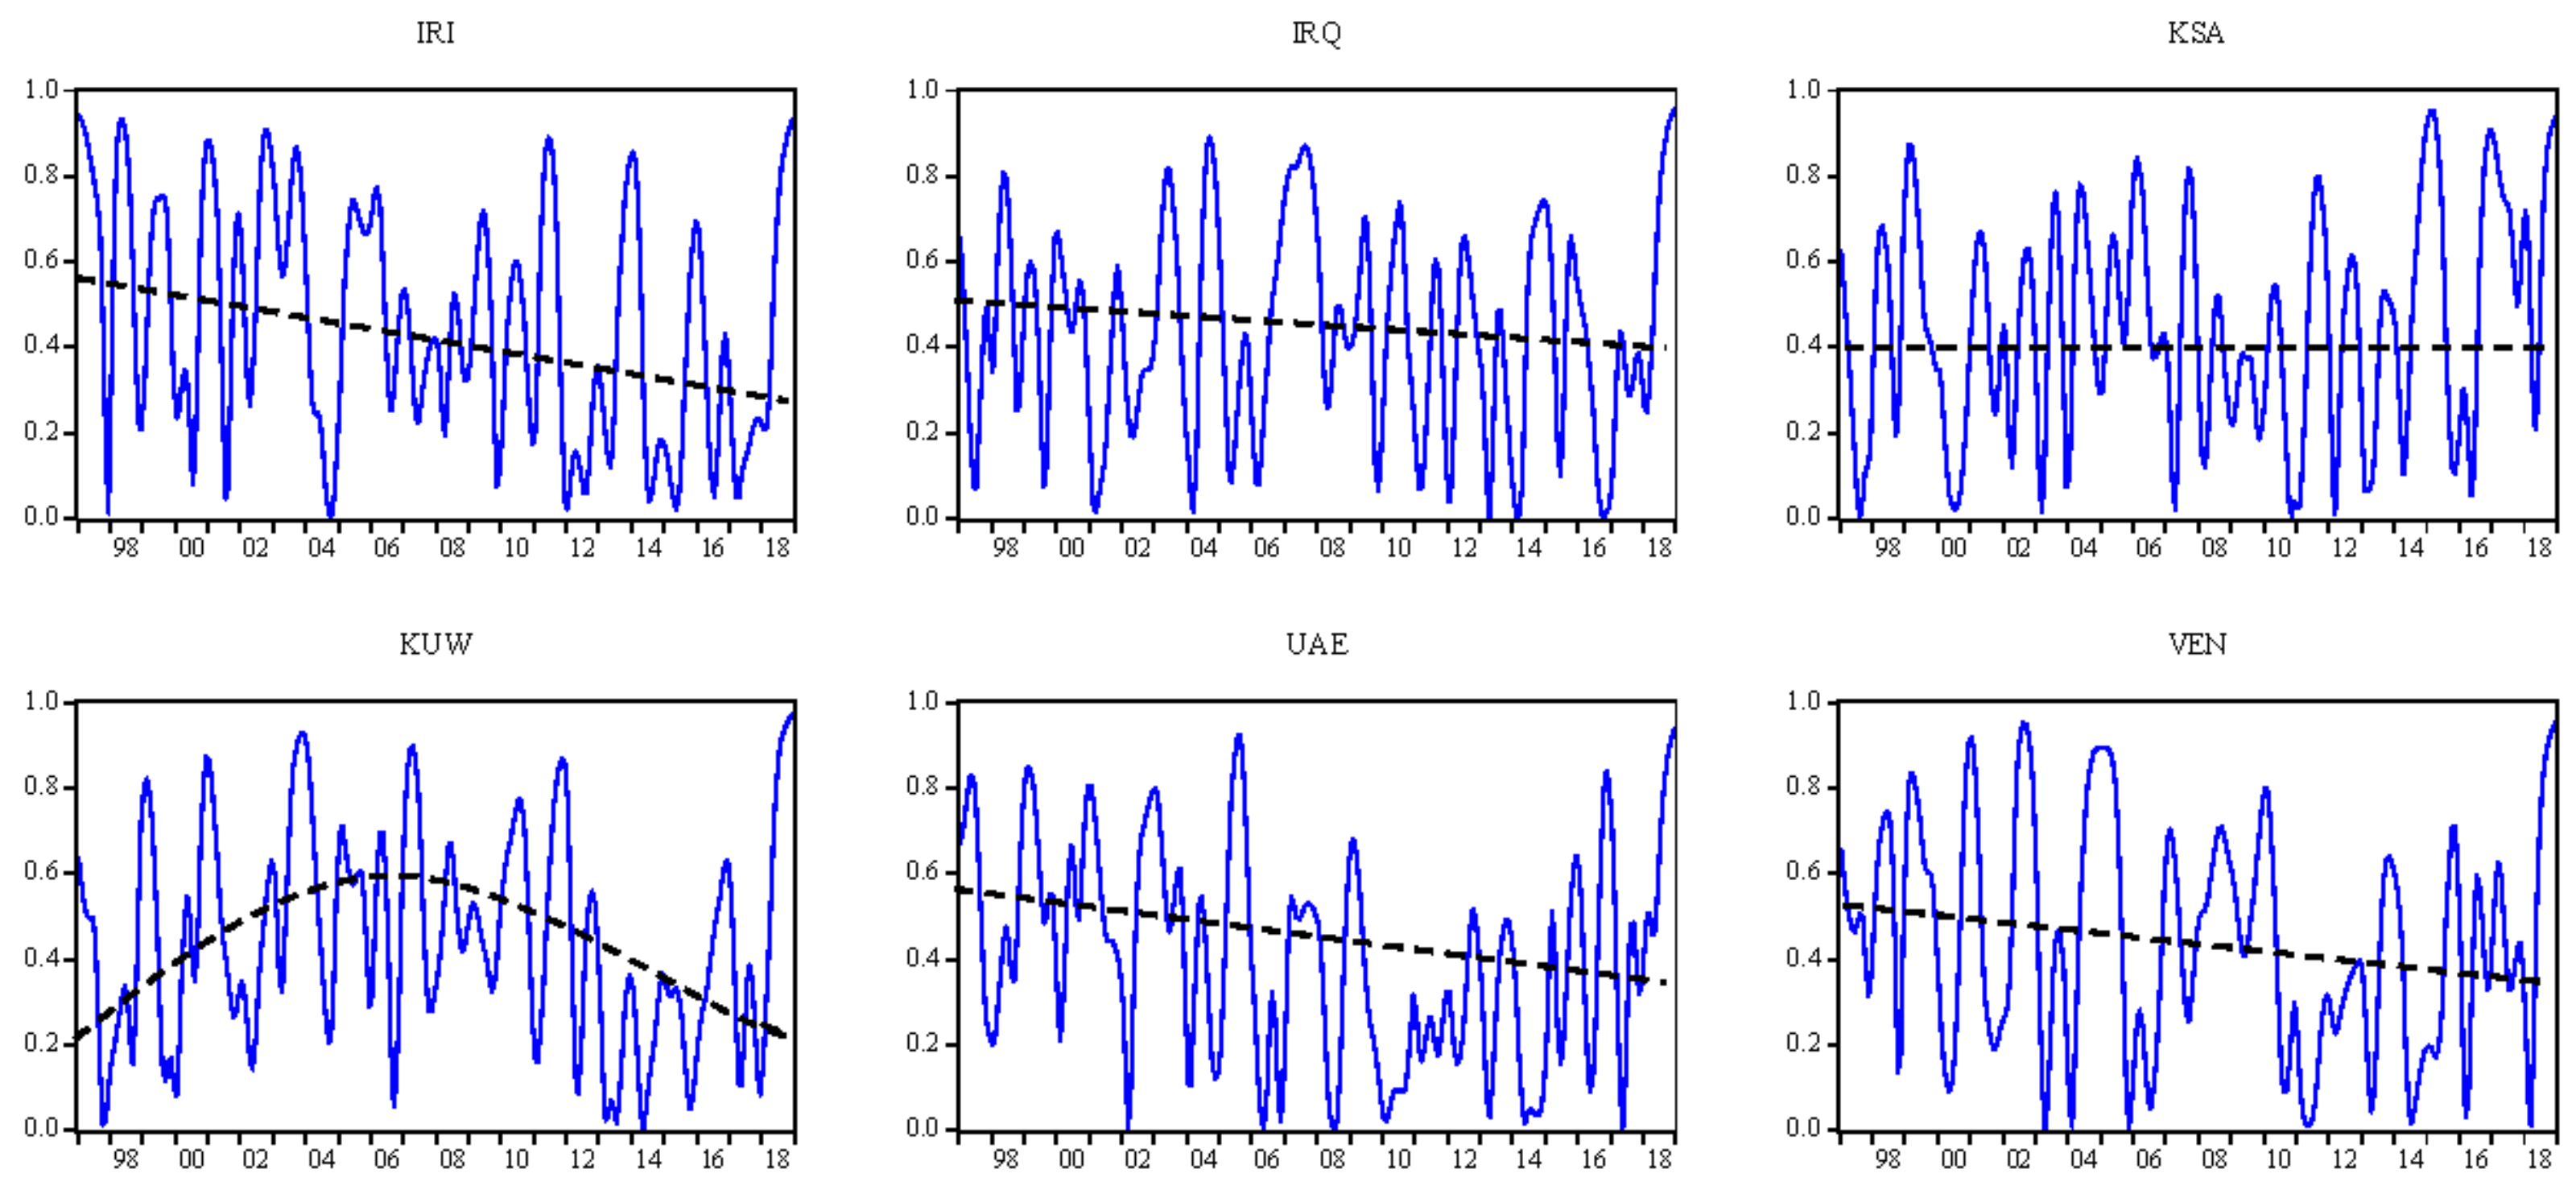
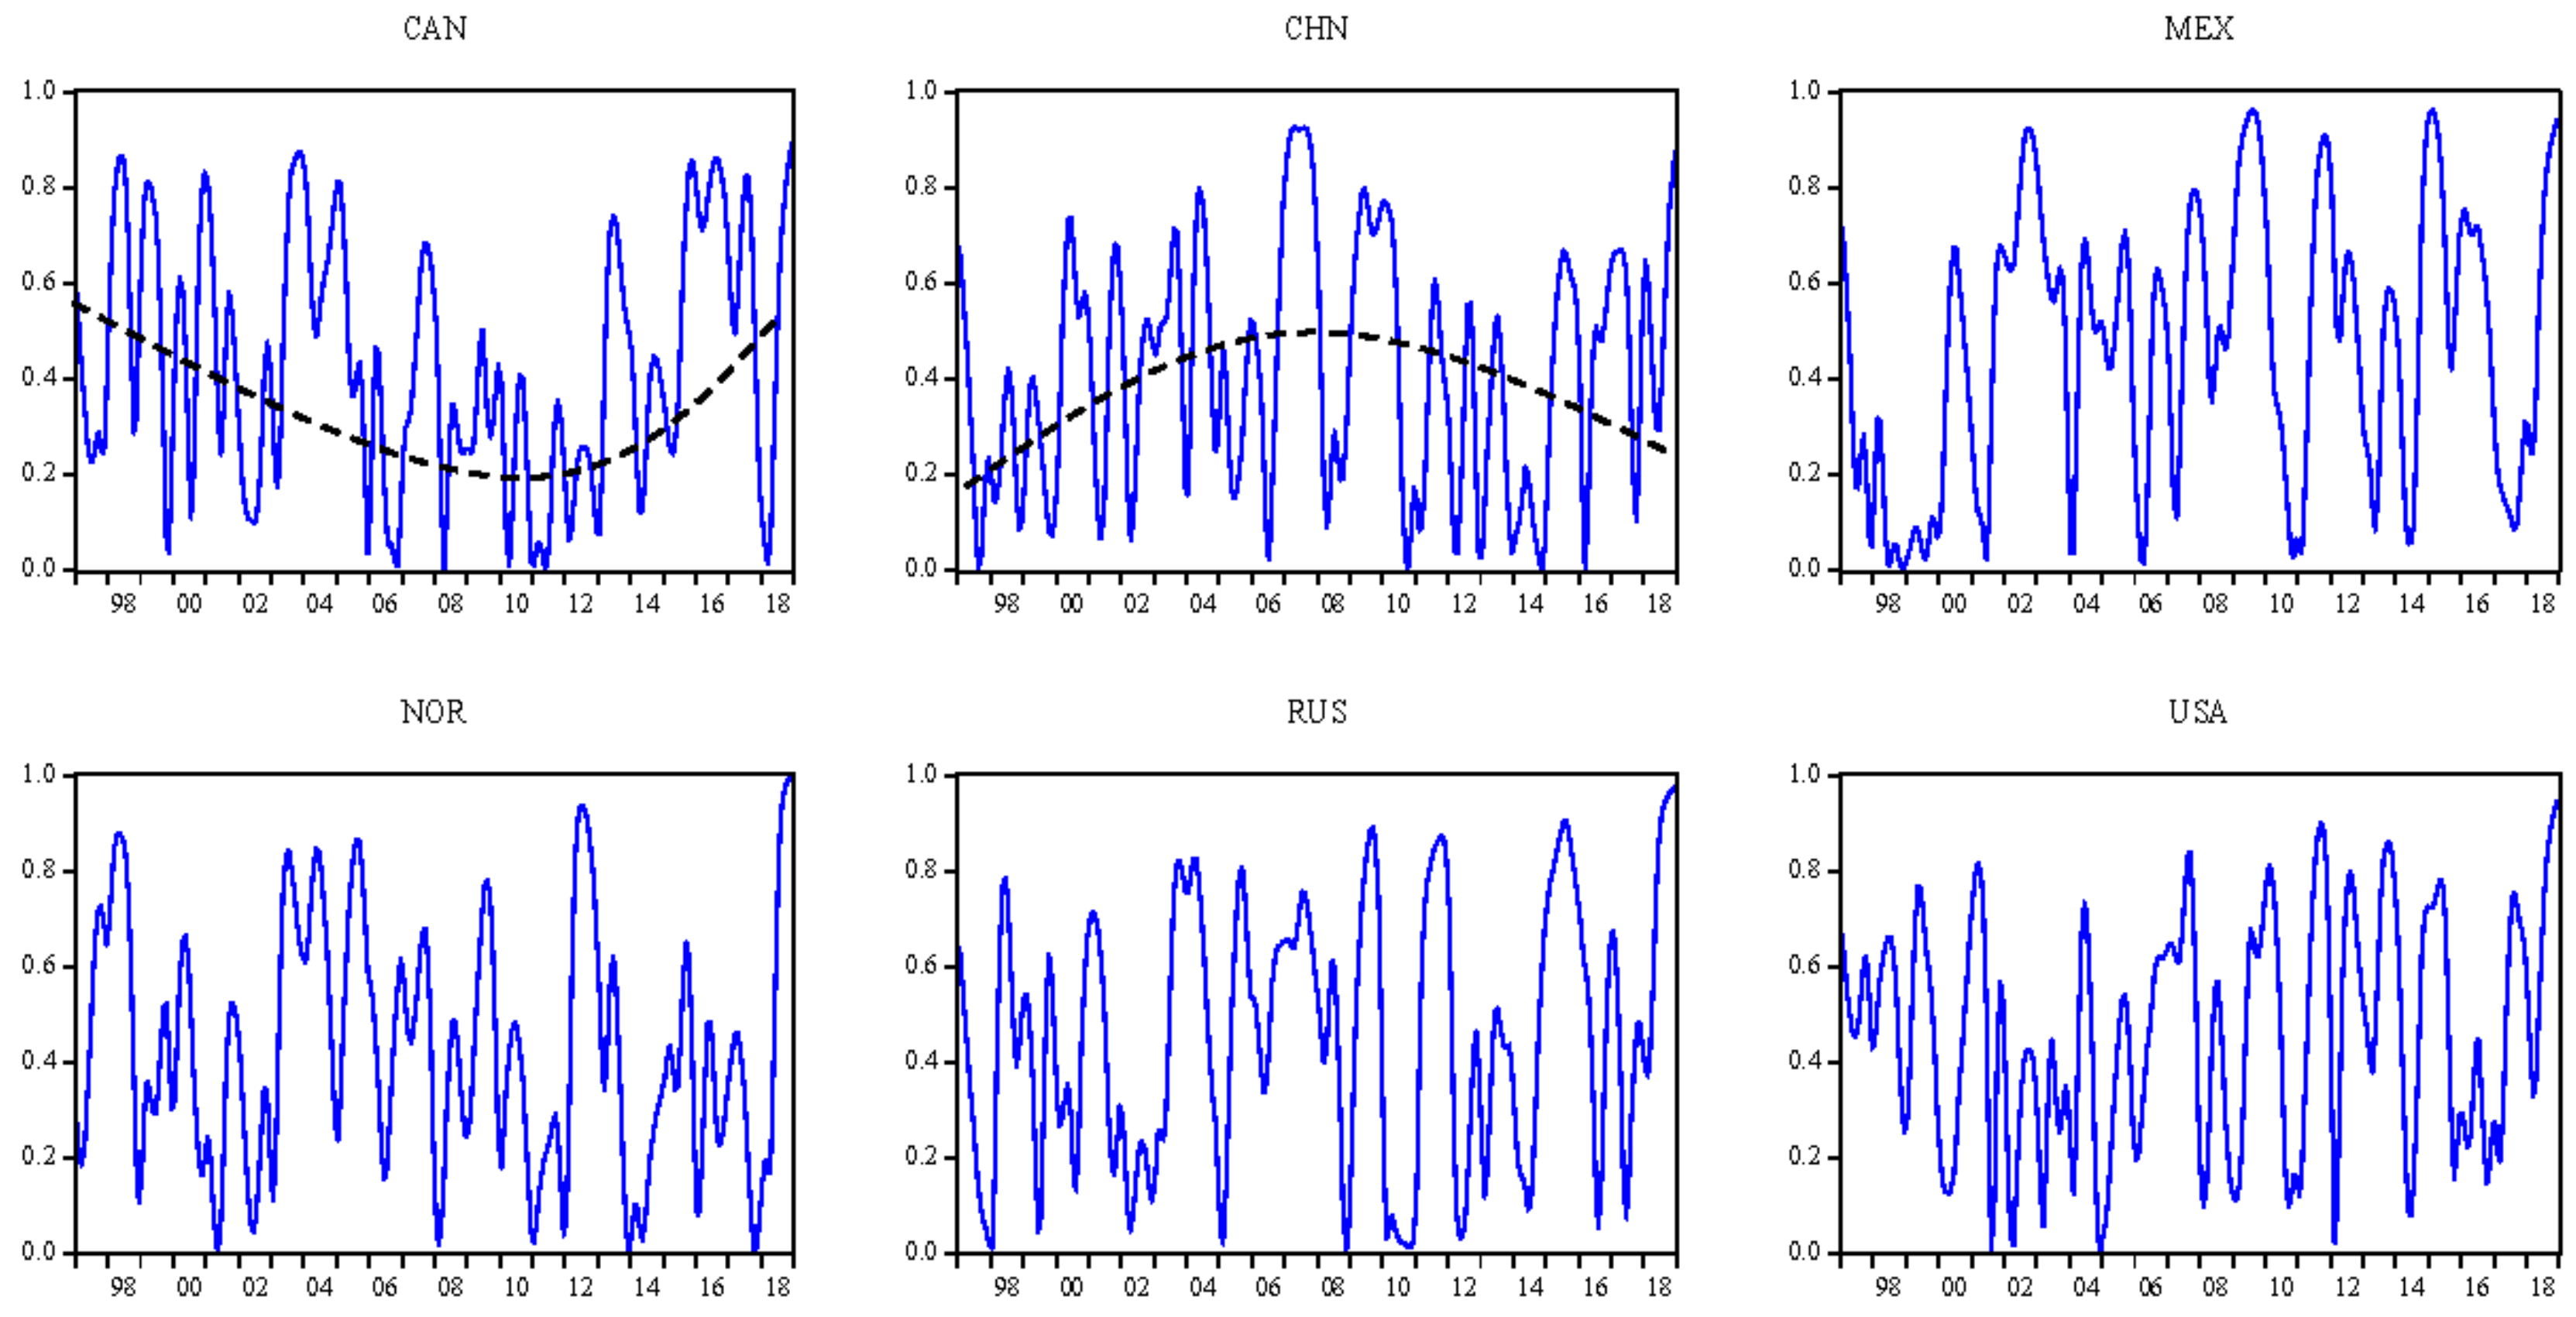
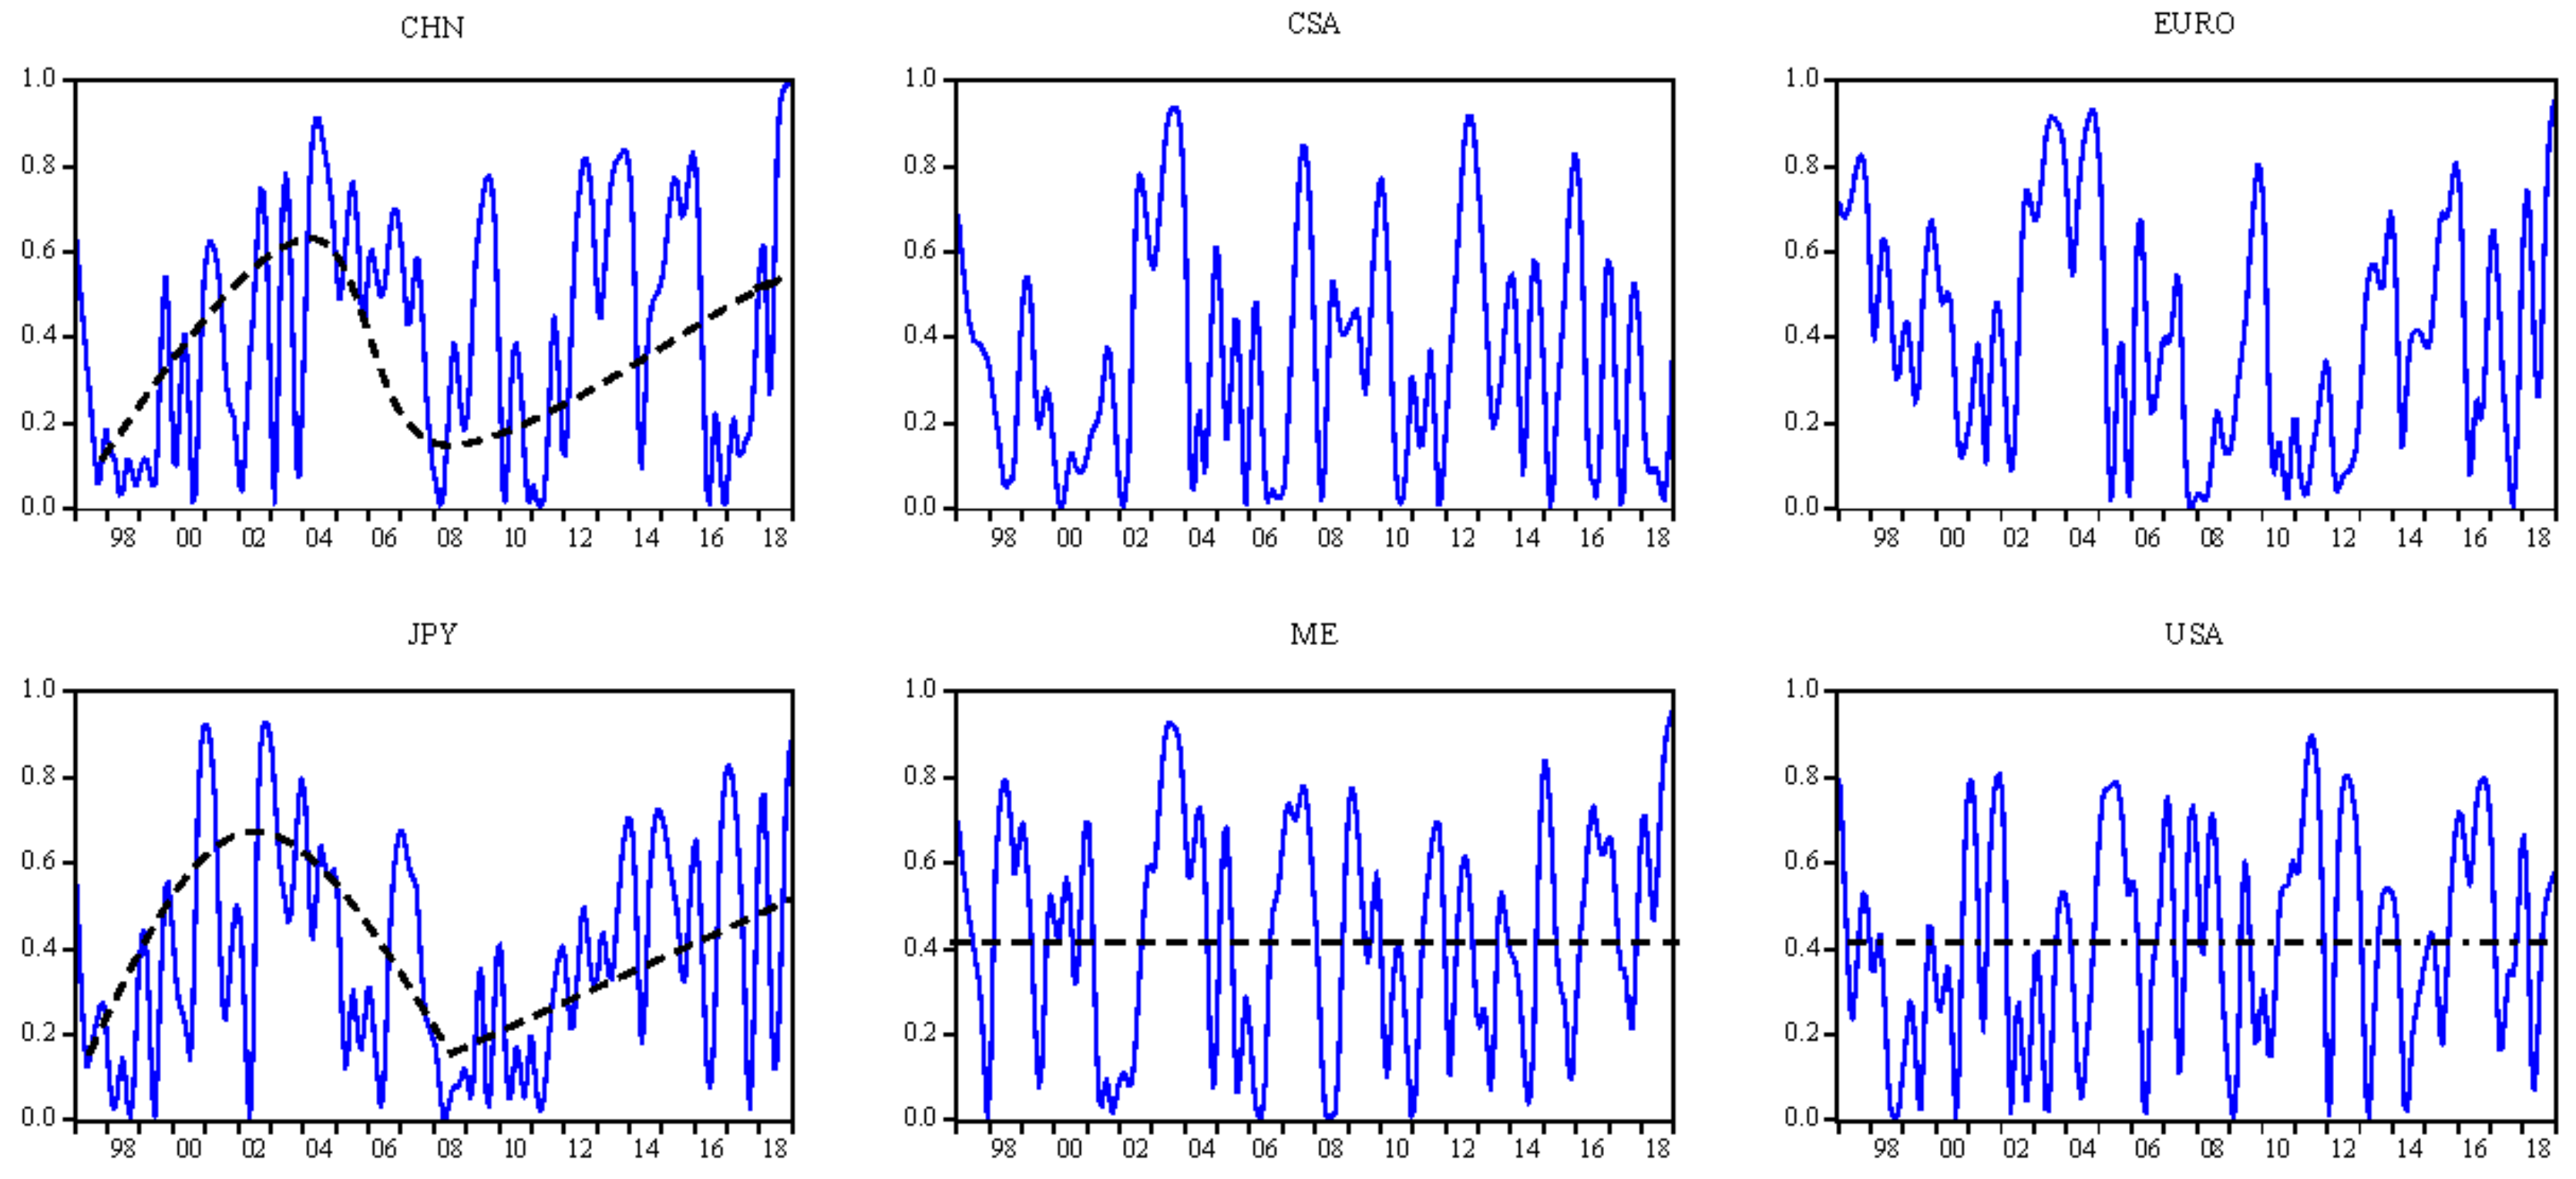
Since the heterogeneous correlation between supply or demand and oil return risks, we further examine the correlation in oil producers’ or countries’ demand. On the one hand, we select oil producers based on the oil production at a monthly frequency for both OPEC and non-OPEC countries. More specifically, non-OPEC oil producers are not as strong an impact as OPEC oil producers for reasons such as lack of coordination in different members, to make up for short supply, and high production. On the other hand, the increase in oil consumption from economies such as China and the Middle East has an effect on oil return risks. In this paper, we examine the dynamic correlation of 6 OPEC members, 6 non-OPEC and 6 demand countries (The countries include three categories; they are, OPEC members (Iran (IRI), Iraq (IRQ), Saudi Arabia (KSA), Kuwait (KUW), United Arab Emirates (UAE) and Venezuela (VEN)), non-OPEC countries (Canada (CAN), China (CHN), Mexico (MEX), Norway (NOR), Russia (RUS), United States (USA)) and demand countries or regions (CHN, Central and South America (CSA), Europe (EURO), Japan (JPN), Middle East (ME), USA)). The monthly data could be collected at https://www.eia.gov.
Figure 2, Figure 3 and Figure 4 show the cross-correlations between variables. It is interesting to note, in general, the global oil market risk is closely related to the state of the country’s oil production capacity, and it is highly correlated with major political and economic events in demand countries or regions.
First, we consider the correlation between OPEC members’ oil production and oil return risks. It can be seen that OPEC members’ oil production serves as heterogeneous producers as it produces large differences of space capability. Overall, the correlation between KSA production and oil return risks is more stable. Its leadership is crucial for decreasing oil risks and achieving its political goals. In addition, it is usually regarded as swing producer which absorbs fluctuations in supply and demand in order to maintain the crude oil market stability. What is more, the tit-for-tat strategy in KSA matches the level of cheating by other members and thus stabilizes the crude oil markets. However, the correlation between IRI, IRQ, UAE and VEN production and oil return risks show a decrease trend over sample periods. In addition, it is also related with major events. For example, during the Iraq war (2003), the correlations between IRQ or IRI production and oil return risks are greater due to geopolitics. The linkage of IRI production with oil return risks is also larger during Iran’s nuclear sanctions (2015). For another, the dependence of KUW production with oil return risks shows an “inverted U” shape. This is associated with the compliance with OPEC’s administered quotas. As a mid-oil-producer, KUW displays much lower frequencies and magnitudes of noncompliance with OPEC’s oil production cut [45]. In 2002, affected by the crude oil market environment, OPEC made a large adjustment to oil production quotas, which caused KUW oil production to fluctuate, thereby expanding its correlation with oil return risks.
It should be noted that Figure 3 implies that the policy environment is the main reason for the fluctuations in the correlation between non-OPEC counties’ production and oil return risks. Specifically, the correlations between MEX and NOR production and oil return risks display the highest fluctuation, whereas RUS and USA have the lowest volatility. Moreover, the amplitude of correlation between CHN production and oil return risks shows an “inverted U” trend. The fluctuation of the linkage of CAN production and oil return risks decreases first and then increases over the sample period. These results could be explained by the market foundation. Hence, the excessive dependence of MEX or NOR economic development on oil production makes the correlation between oil production and return risks fluctuate greatly. The global economic state and the monetary status of the US dollar protect its volatility in relation to oil return risks. Otherwise, the rapidly increasing position of RUS in the crude oil market has made its correlation with oil return risks relatively stable. The imperfection of the CHN oil market is vulnerable to the spillover effects of other market policies, which increases the uncertainty of the domestic policy environment, and thus the fluctuation changing over sample period. However, the time-varying correlation between CAN production and oil return risks is related to the oil market share over time.
Furthermore, we turn to the relation between demand countries or regions’ consumption and oil return risks. It is obvious that there are differences in the correlation between demand countries and oil return risks. Overall, the correlation between USA and ME consumption and oil risks is more stable, while there are phases in the relation between JPY and CHN consumption and oil return risks. Specifically, the role of USA consumption in the crude oil market is connected with the presidential election. In addition, with reference to Figure 4-JPY, it is interesting to note that the correlation shows an “inverted U” shape before the global financial crisis, then it increases over the time periods. In terms of the correlation between CNY consumption and oil return risks, it could be divided into three phases. The first stage is 1997–2004. We could clearly note that it shows an increase trend due to the economic growth. Then, the relationship decreased during 2004–2008. Moreover, China carried out the Four-Trillion-Yuan stimulus plan in 2008 to promote the domestic economy. Thus the correlation between CNY consumption and oil return risks has increased since 2008. These results indicate that major events and the announcement of both policies could potentially be a part of the relationship between demand countries’ consumption and oil return risks at a particular point of time.
3. The Heterogeneous Interconnections between Supply- or Demand-Side and Oil Risks
While informative, the dynamic causal effect does not completely depict the relationship between supply- or demand-side and oil return risks for two reasons: It does not hint on the sign of the response to supply or demand of oil return risks, and there are heterogeneous responses in different time windows. Thus, this section presents the TVP-SVAR model and explores the response to supply or demand in the crude oil market [46].
3.1. TVP-SVAR
In order to explore the response of supply- or demand-side in a time-varying fashion, this study uses the TVP-SVAR to empirically research the oil return risks. Particularly, we mainly focus on the short-term response to supply or demand of oil return risks since the significant effects of oil price on economy and financial markets. In fact, the impact of oil production or consumption on the crude oil market mainly refers to the short-term, whereas long-term response will be regulated by the market. Thus, the impulse response functions could be used to measure the impact of oil production and consumption on oil return risks in the short-term. Some alternative analyses are variance decomposition and the coefficient of different variables based on VAR models. As we all know, the result of variance decomposition could be affected by the number of variables. In addition, the coefficient could also be impacted by the rank of variables in VAR models. Thus we focus on the impulse response functions. What is more, some alternative methods, such as ECM and Cointegration tests, have ignored the evolution of response to oil production or consumption of oil risks.
Otherwise, the baseline model explores the joint behaviors of OPEC oil production (), non-OPEC oil production (), total world oil consumption () and oil return risks (). Another advantage in TVP-SVAR compared with the constant basic VAR includes in the sense that we can obtain the time-varying response in different oil producers’ or countries’ demand over the sample period. As we explained above, the TVP-SVAR is very useful to investigate the time-varying response to supply or demand of oil return risks. In this paper, we estimate the parameters in the TVP-SVAR model based on the Markov Chain Monte Carlo (MCMC).
As we all know, a basic structural VAR could be defined as (6).
where . are 4 × 4 matrices of different lag order , and is the length of sample period. In addition, is the error item with . In addition, .
The reduced form of Equation (6) could be written as Equation (7).
where
Theoretically, the TVP-SVAR updated from Equation (7) by allowing the parameters to change over time. Thus, the expression of Equation (7) to the TVP-SVAR model with stochastic volatility is given as Equation (8).
Furthermore, (8) can be written as (9) (We stack in a vector for all the R.H.S coefficients. In addition, the symbol in Equation (9) denotes the Kronecker product).
Moreover, there are assumptions of estimating the TVP-SVAR. First, we assume that oil risk is associated with OPEC and non-OPEC oil production, and non-OPEC oil production has impact on the OPEC production in current period. Second, we define the parameters following a random walk process as Equation (10).
where the distributional assumptions as regards are stated as Equation (11).
3.2. The Interconnections between Supply-Side and Oil Return Risks
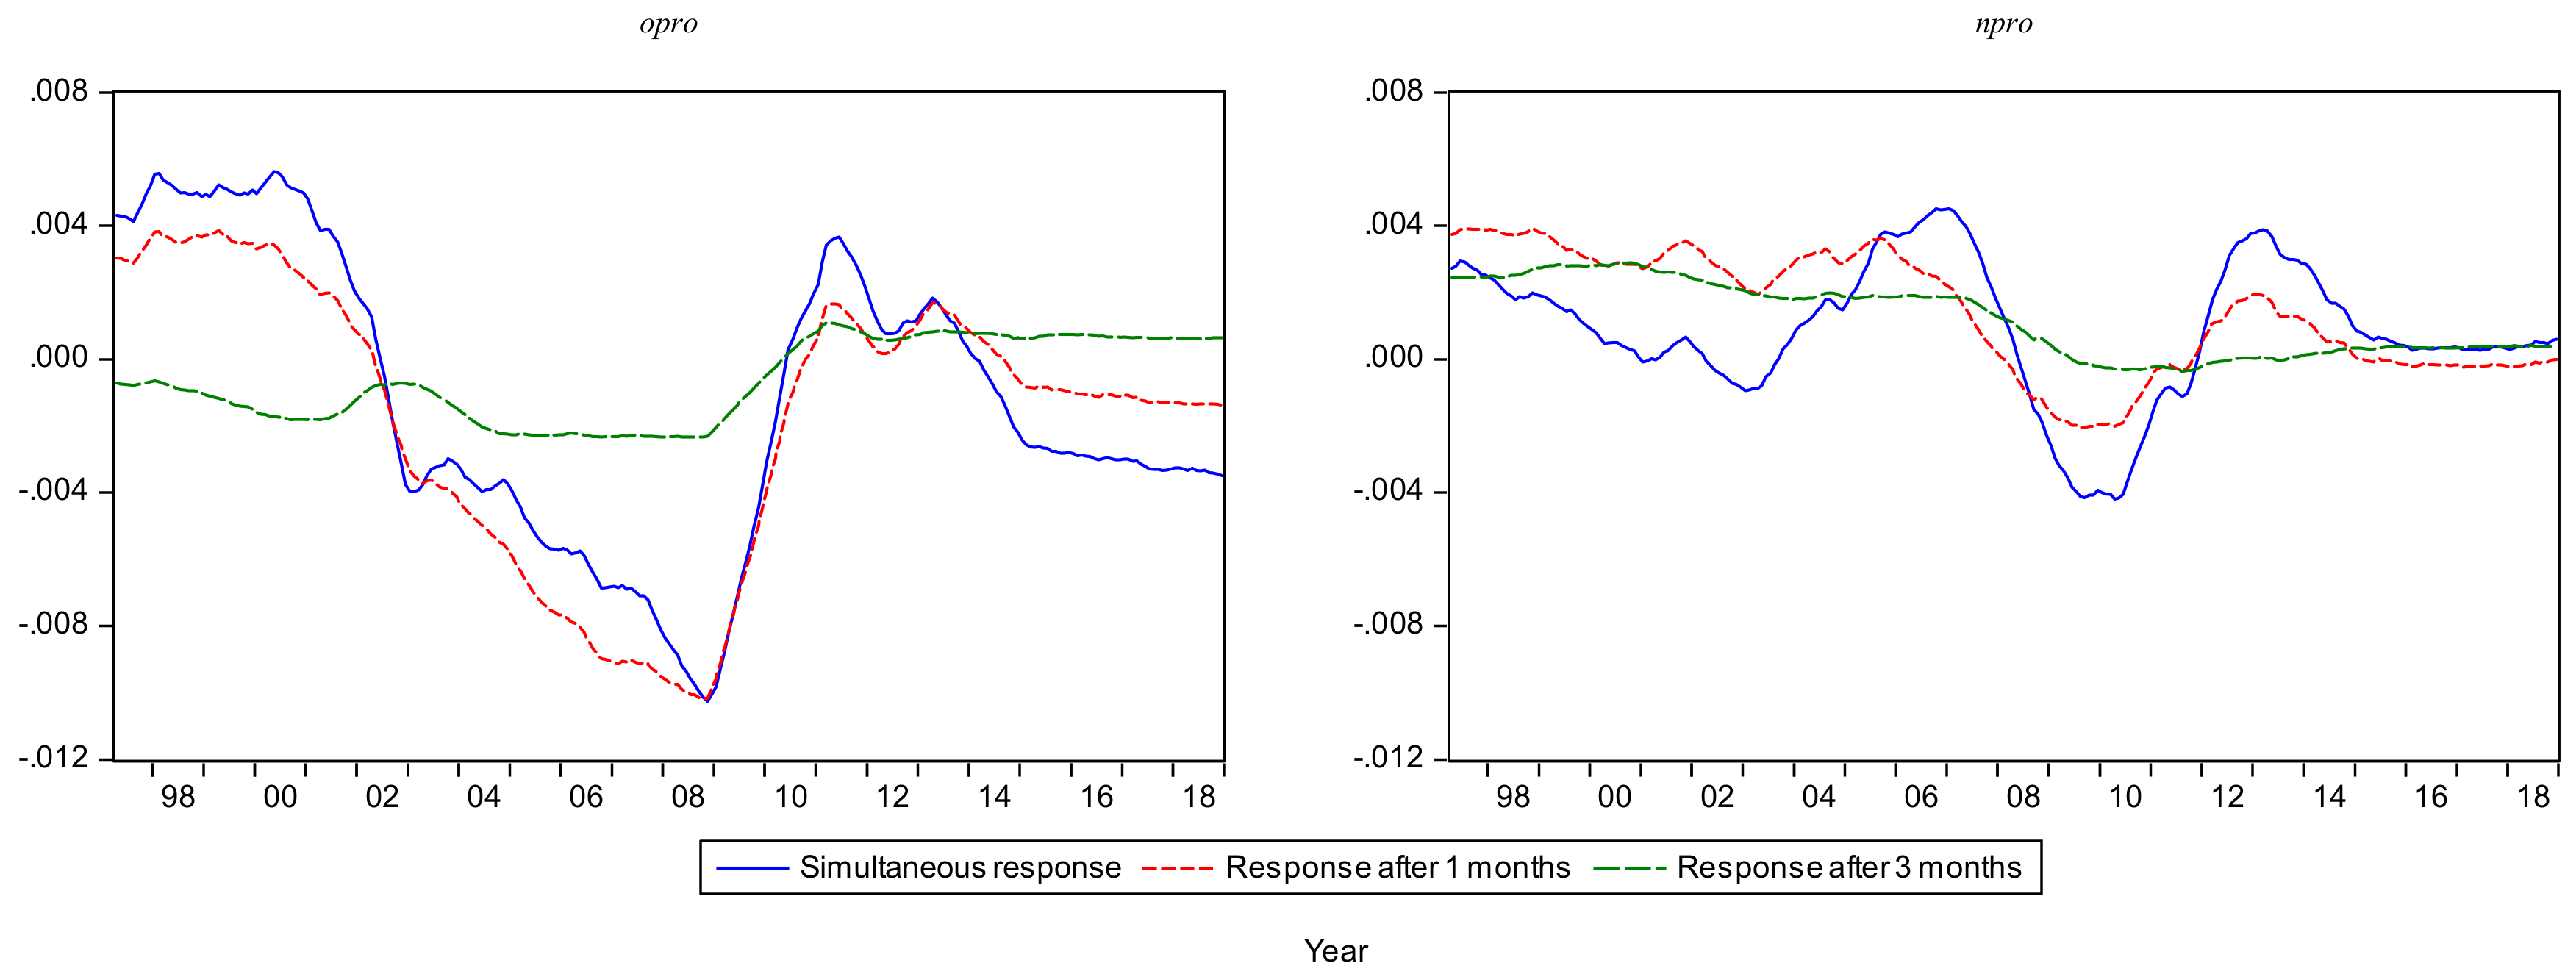
Exploring impulse responses is a standard way of the VAR model to measure lag effects between the supply side and oil return risks. However, the responses vary with time in the TVP-SVAR model over the sample period. Figure 5 shows the time-varying impulse response to and of after 0 months (simultaneous), 1 month and 3 months (We have tested that the response after 6 months is same as it after 3 months. In addition, the response over 6 months is approximated to zero).
The dynamic impulse response to the supply-side of oil return risks shows a significant change over the sample period. Overall, the sign of simultaneous response is almost the same as the 1-month one in the OPEC production. Moreover, the degree of response in the OPEC production is greater than that of the non-OPEC one, suggesting that OPEC plays more significant role in the crude oil market. This is not surprising, and due to the fact that there is heterogeneity about the absence of enforcement mechanisms and market power. Apart from that, it is obvious that the response after 3 months is approximate to zero. This suggests that the non-OPEC is more complaisant against the crude oil market and the oil return risk is similarly more reactive to the OPEC production during the same time horizon.
At a more specific level, there are differences in the sign of the response to OPEC or non-OPEC production of oil return risks in different phases. As shown in Figure 5, we divide the correlation into four phases. The first stage is 1997–2002. At this stage, the response to the supply side is positive and shows a decrease trend in OPEC or non-OPEC production. This indicates that OPEC, as a cartel, plays a dominant role in the crude oil market. The next stage is 2002–2010. It is interesting to note that the response to the OPEC production is negative and shows an “inverted U” trend in crude oil markets, which was increasing before 2008 and switched to decrease after 2008. The response fluctuation to the non-OPEC production, however, is dramatic. This result is associated with the coordination behavior. Before the 2008 financial crisis, OPEC determined the quota by using the resolution of the basic situation of the crude oil market, and then achieved the effect of stabilizing the market. Since the financial crisis occurred in 2008, the determinant role of OPEC announcements gradually decreased due to the misjudgment of the crude oil market by the OPEC meeting. Moreover, the lower coordination level in the non-OPEC production makes more volatility of the response of oil return risks. The other stage is 2010–2013. It is worth noticing that the sign of response to the OPEC production of oil return risks is the same as the one in the non-OPEC production. This is not surprising either due to the increase of cooperation in OPEC and non-OPEC. The final phase is 2014–2018. The response to OPEC production of oil return risks is negative and shows an increase trend, whereas the one in non-OPEC production is approximated to zero. It also could be explained by the market adjustment in the oil supply market. Hence, there is an asymmetric process in oil price adjustment between OPEC and non-OPEC. This indicates that the oil return risk is more reactive to the OPEC production.
3.3. The Interconnections between Demand-Side and Oil Return Risks
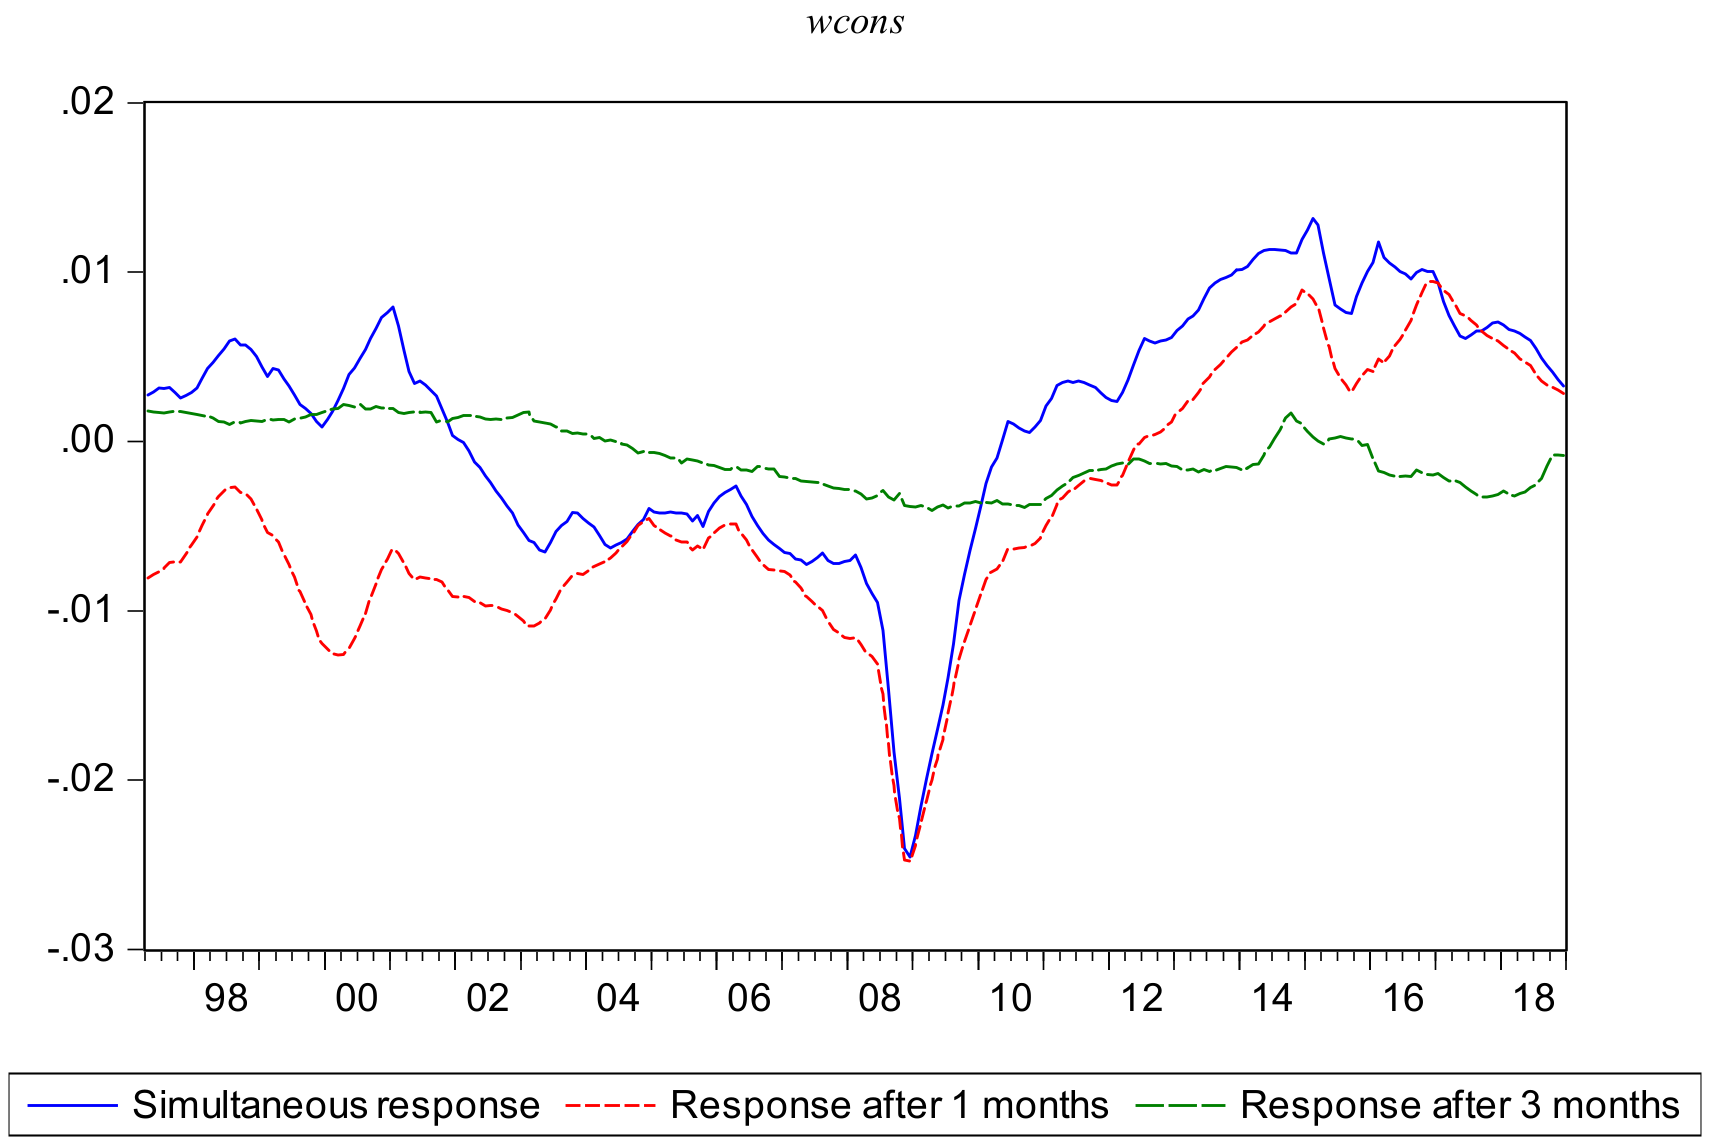
The response value to world oil consumption, as shown in Figure 6, shows more than ten times higher than that of oil production on risks. It is worth noticing that the impulse responses to the demand side of oil return risks significantly vary over the sample period, and it could be divided into three phases due to the sign of it. Before 2002, the simultaneous response to the demand side of oil return risks is positive, whereas the response after 1 month is negative. In addition, the differences between the simultaneous response and the one after 1 month gradually narrow. This could be explained by the influence of major events. After the “9.11” incident, the world economic growth was sluggish, causing the world oil demand to shrink and international oil prices to fall. The trend of international oil prices in 2002 mainly depends on the development trend of the world economy, especially the recovery of the US economy, and the improvement of the European and Asian economies.
Moreover, oil return risks have become more reactive to total world consumption during 2002–2008 and switched to decrease during 2008–2010. During the former period, the sign of response to world consumption is negative and shows an increase trend. Economic growth in emerging countries has led to a sharp increase in global demand for crude oil. Indeed, emerging developing countries, especially China, have a sharp increase in demand for oil, while the world is known oilfield production capacity begun to decline. At the same time, since non-OPEC countries have weak growth in output and global surplus capacity has shrunk, the crude oil market has entered a period of imbalance between supply and demand. During the latter period, the total world oil consumption reduced after the 2007 financial crisis due to the weak world economy. In addition, because of the environment of the global crude oil market, the response to world consumption of oil return risks decreased during 2008–2010.
Finally, the sign of the responses after 2010 is significantly different from that before the period during distinct time windows. It is obvious that the response to world consumption of oil return risks is positive. This is not surprising and due to the volatility of economic policy uncertainty and world consumption [47,48,49]. On the one hand, the crude oil market was strongly developed since the economic recovery in 2010. What is more, the oil supply was also sufficient, and the petroleum inventory was at a high level. Thus, the global oil market was in a relatively loose equilibrium. However, the total world oil consumption shows strong uncertainty and is easily affected by the internal petroleum environment, causing fluctuations in the oil demand, which in turn affects the stability of the oil market. On the other hand, it is well-known that there is significant linkage between economic policy uncertainty and oil consumption, which in turn impacts the stability of crude oil market [32]. Hence, the global economic policy uncertainty has become more volatile, causing the increase of uncertainty in the external economic environment since 2010, which results in the expansion of the uncertainty of the global oil demand. Affected by fluctuations in world oil demand, there is a phenomenon of imbalance between oil supply and demand, thereby reducing the stability of the crude oil market and increasing the oil return risks.
4. The Heterogeneous Interconnections between Oil Producers’ or Countries’ Demand and Oil Risks
Additionally, countries with high oil production levels have significantly more influence on oil return risks. In order to explore the time-varying interconnections between oil producers’ or countries’ demand and oil return risks, we reconstruct the TVP-SVAR, mentioned in Section 3.1 and further focus on the impulse response of oil return risks in this section.
4.1. The Heterogeneous Interconnections between Oil Producers and Oil Return Risks
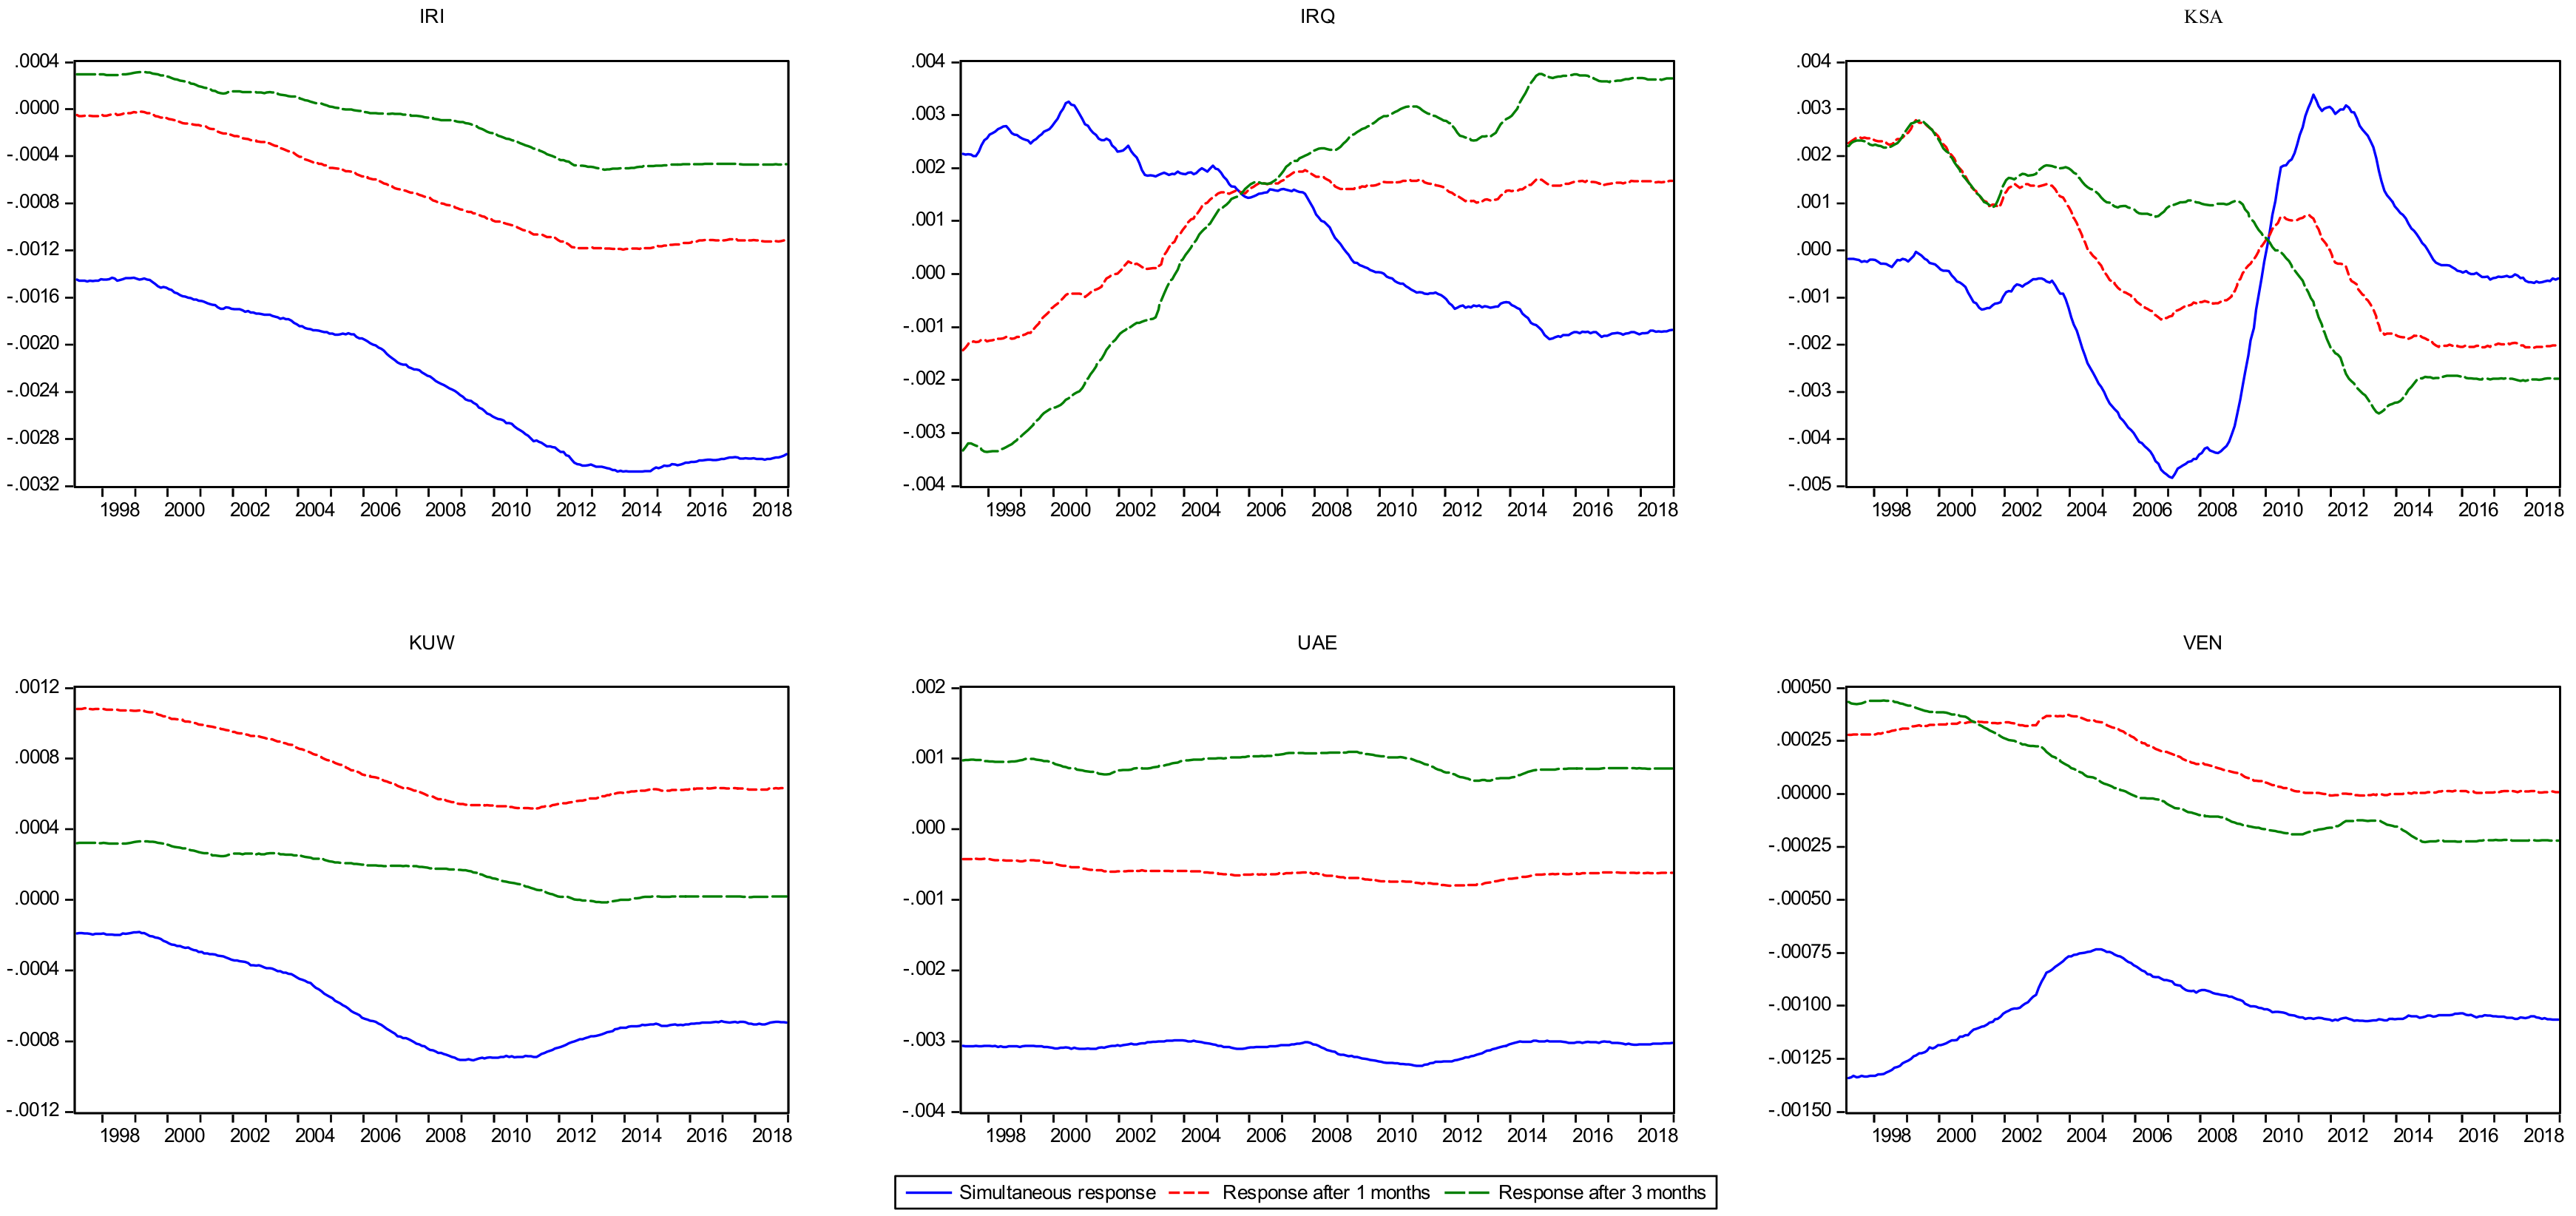
Figure 7 portrays the impulse response to OPEC members’ production of oil return risks. It is worth noting that the signs of responses to different OPEC countries present different characteristics. Overall, they could be divided into three categories. Firstly, although the negative response occurs on simultaneous response, the responses of KUW and VEN oil consumption to the oil return risks are positive on the other lagged months. The next category includes IRI and UAE. Specifically, the sign of simultaneous and lagged 3 months response are negative and stable, whereas the one after 1 month is positive. This result could be explained by the geopolitics. From the perspective of the strategic position of the oil market, KUW, UAE and VEN account for a small share of the oil market. Together with the operating mechanism of OPEC, the responses of production in these members to oil return risks are stable and play a negative role in market risks. Otherwise, the relevant policies implemented in IRI have expanded Iran’s role in the oil market and reduced the uncertainty of the Iranian oil market, thereby stabilizing oil revenue risks.
Finally, the sign of response to IRQ and KSA of oil return risks changed over time. It is not surprising and due to the geographic location and space capacity. On the one hand, it is obvious that the sign of simultaneous response to IRQ production changed in 2008, which is positive before 2008 and switches to negative after 2008. In addition, the sign of response switches from negative to positive on the other lagged months. Due to the important role of Iraqi oil in economic development, the restoration and development of the Iraqi oil industry is an important cornerstone of economic development after the financial crisis. In addition, the Iraq war and the global financial crisis have caused enormous obstacles to the development of the Iraqi oil market. In order to stabilize the economic development, in 2009, Iraq publicly auctioned the mining rights of oil and gas fields and formulated the “Oil and Gas Law” to achieve the purpose of controlling risks in the crude oil market. On the other hand, the sign of simultaneous response to KSA production changed over time, whereas it is almost positive before 2010 and switches to negative after 2010 on the other lagged months. These results are associated with the market mechanism and the space capacity. As a fringe of non-cooperative producer, KSA used to cut its oil production to neutralize the partial conformity by the other OPEC member nations, while it tends to offset its peers’ conduct. However, because of the higher volatility of economic policy uncertainty in KSA, the simultaneous response to KSA production of oil return risks changed over the sample period. Moreover, spare capacity is imperative for decreasing the oil risks and remaining KSAs’ leadership as a price maker.
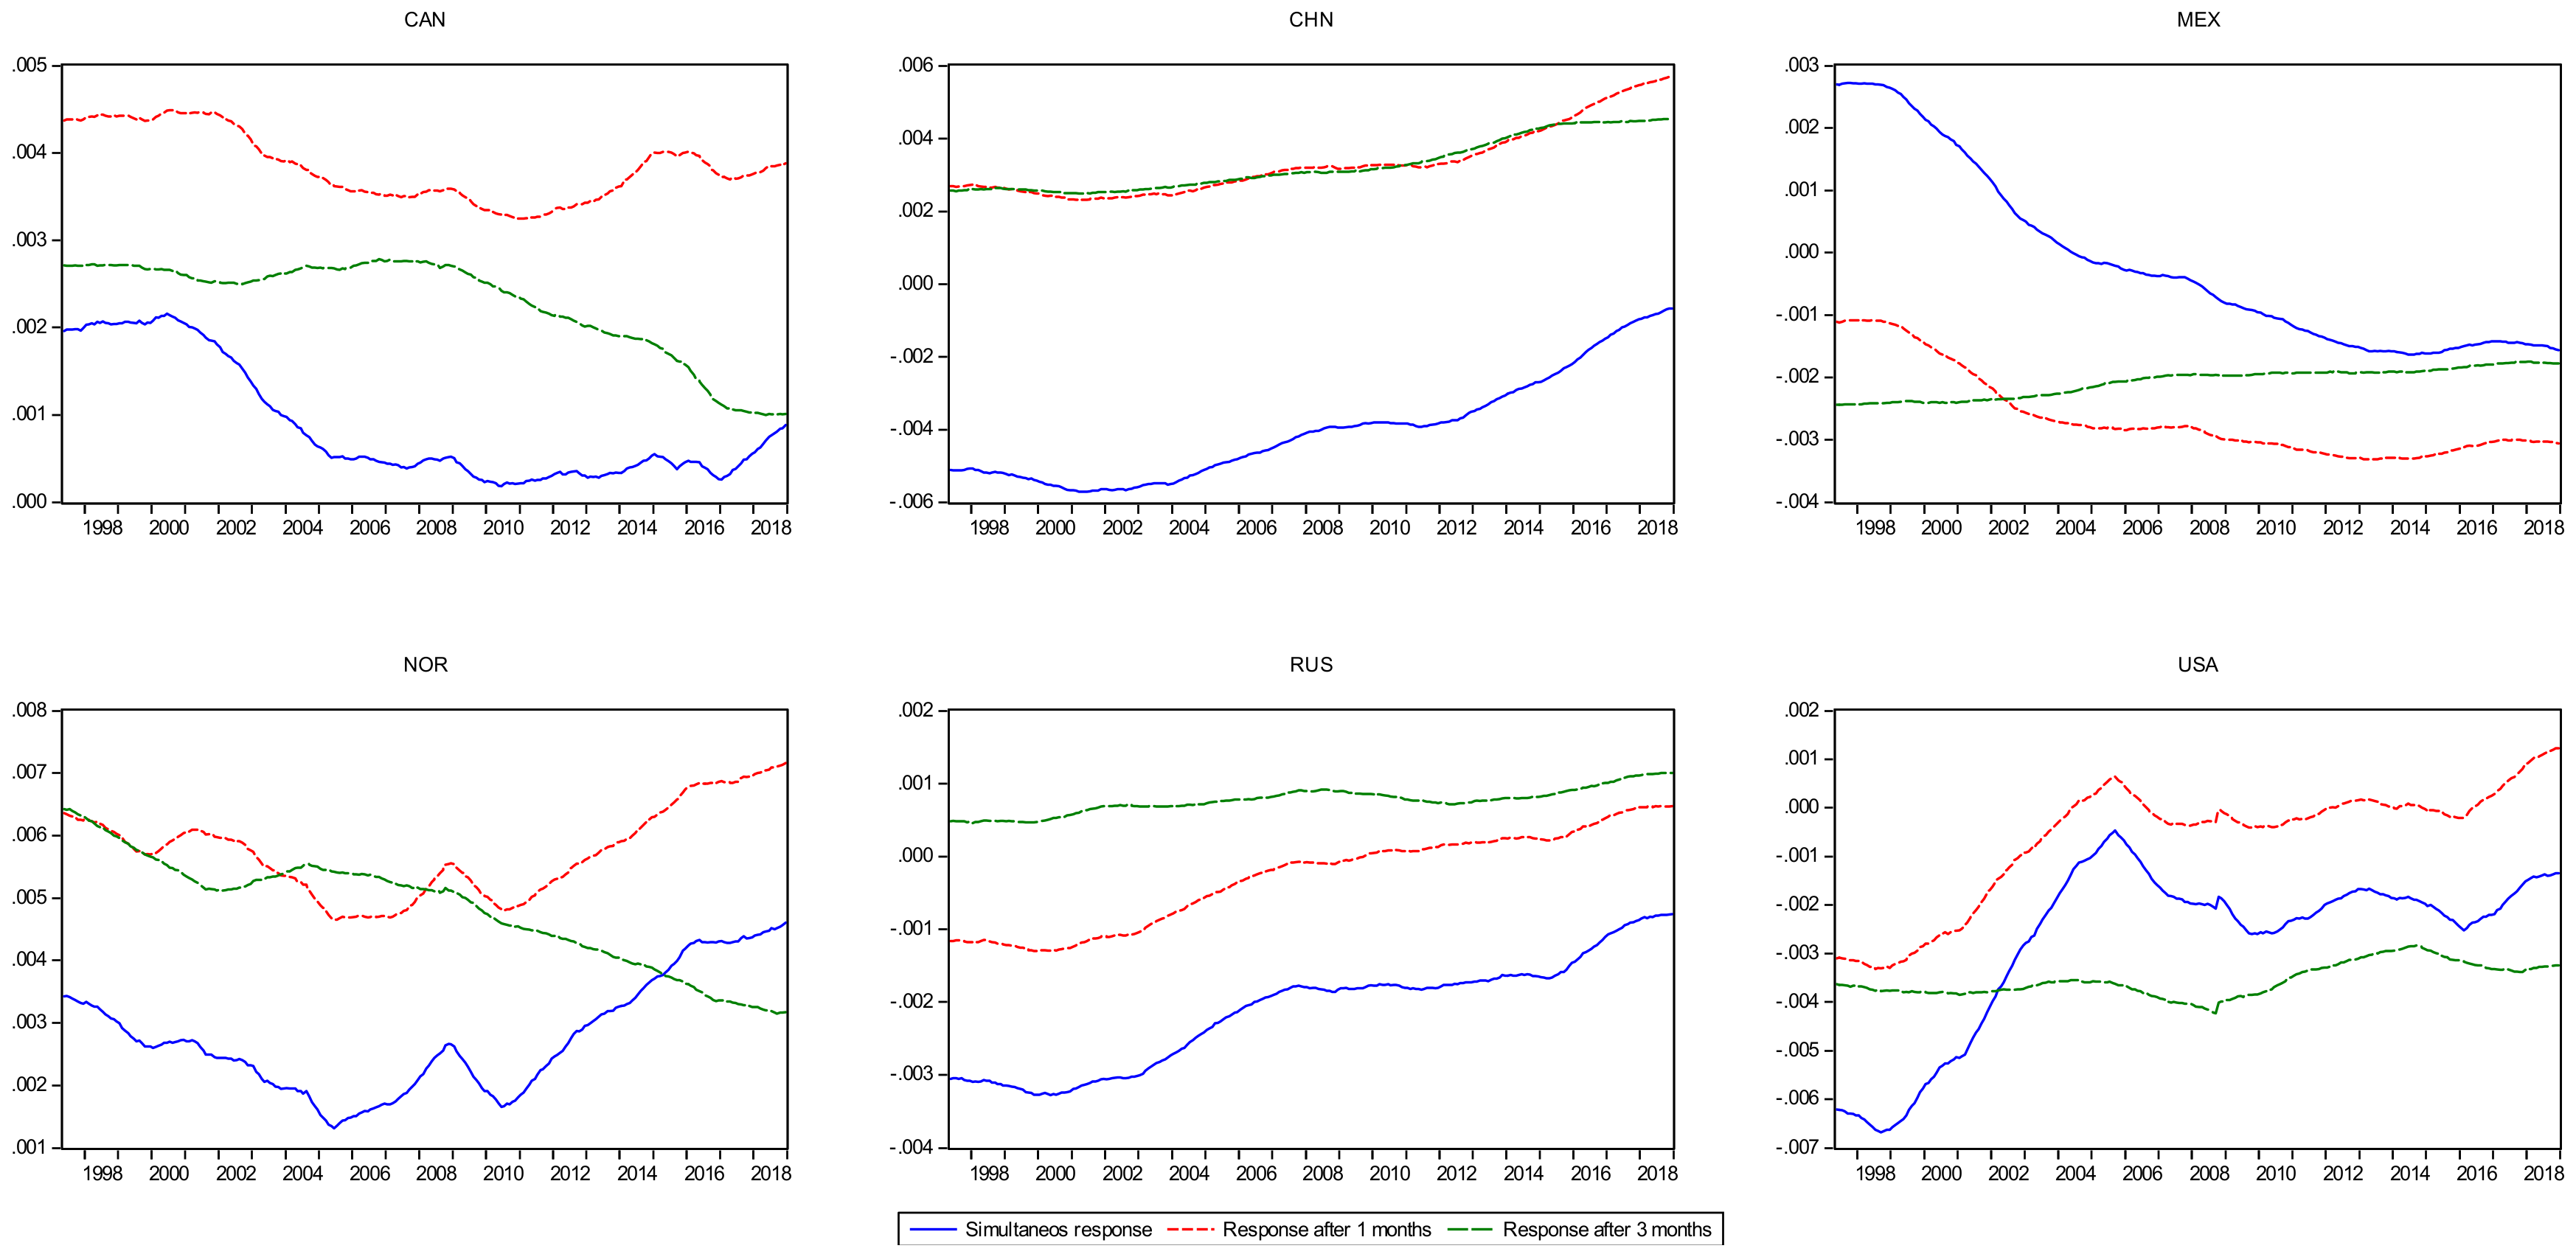
Since the increasing market power of non-OPEC oil producers, we further explore the heterogeneous relationship between non-OPEC oil producers and oil return risks. Figure 8 traces out the time-varying impulse response to non-OPEC producers of oil return risks. It is obvious that the dynamic response to non-OPEC oil producers of oil return risks behaves quite differently in different countries. While the positive response occurs on CAN and NOR, the response of RUS and USA production to oil return risks is negative. Specifically, the positive response after 1 month to CAN production of oil return risks is the largest compared to other lagged months. Moreover, the main response of USA production to oil return risks is negative and after 3 months, where the one of RUS production is simultaneous. The results confirm that the response is related to economic fundamentals in different oil producers. Indeed, when the oil demand increases, USA and RUS may correct any market imbalance that may occur due to the economic states through a unified strategic reaction.
It is particularly interesting to note that the negative response to CHN production of oil return risks is gradually decreasing, and one is mainly positive on other lagged months. In addition, MEX is just the opposite. This is not surprising and due to the major events and geopolitics in different markets. For one thing, major events play a main role in the response of CHN production to oil return risks. Affected by the policy, China’s oil supply has greater uncertainty. In addition, due to the correlation between the oil futures market and spot market and the “herd effect” of investors, the uncertainty of oil production further reduces the stability of the market. Thus, the responsiveness increases for the oil return risks while the rise for the CHN oil production. For another, the response to MEX production in the crude oil market is related to the geopoliticsl. In fact, there is a significant decline in Mexican crude oil production and reserves over the sample period. In addition, due to the influence of the external policy environment on MEX’s oil production, its simultaneous response is gradually reduced. In addition, oil production has a lag effect on the crude oil market stability. This is mainly because of the state of the domestic oil market in MEX. Specifically, the oil supply in MEX can basically meet internal demand since MEX oil consumption is relatively stable. Thus it is less affected by the spillover effects of other international oil markets, which can better protect the development of the domestic oil market and further promote the stability of the global oil market.
4.2. The Heterogeneous Interconnections between Countries’ Demand and Oil Return Risks
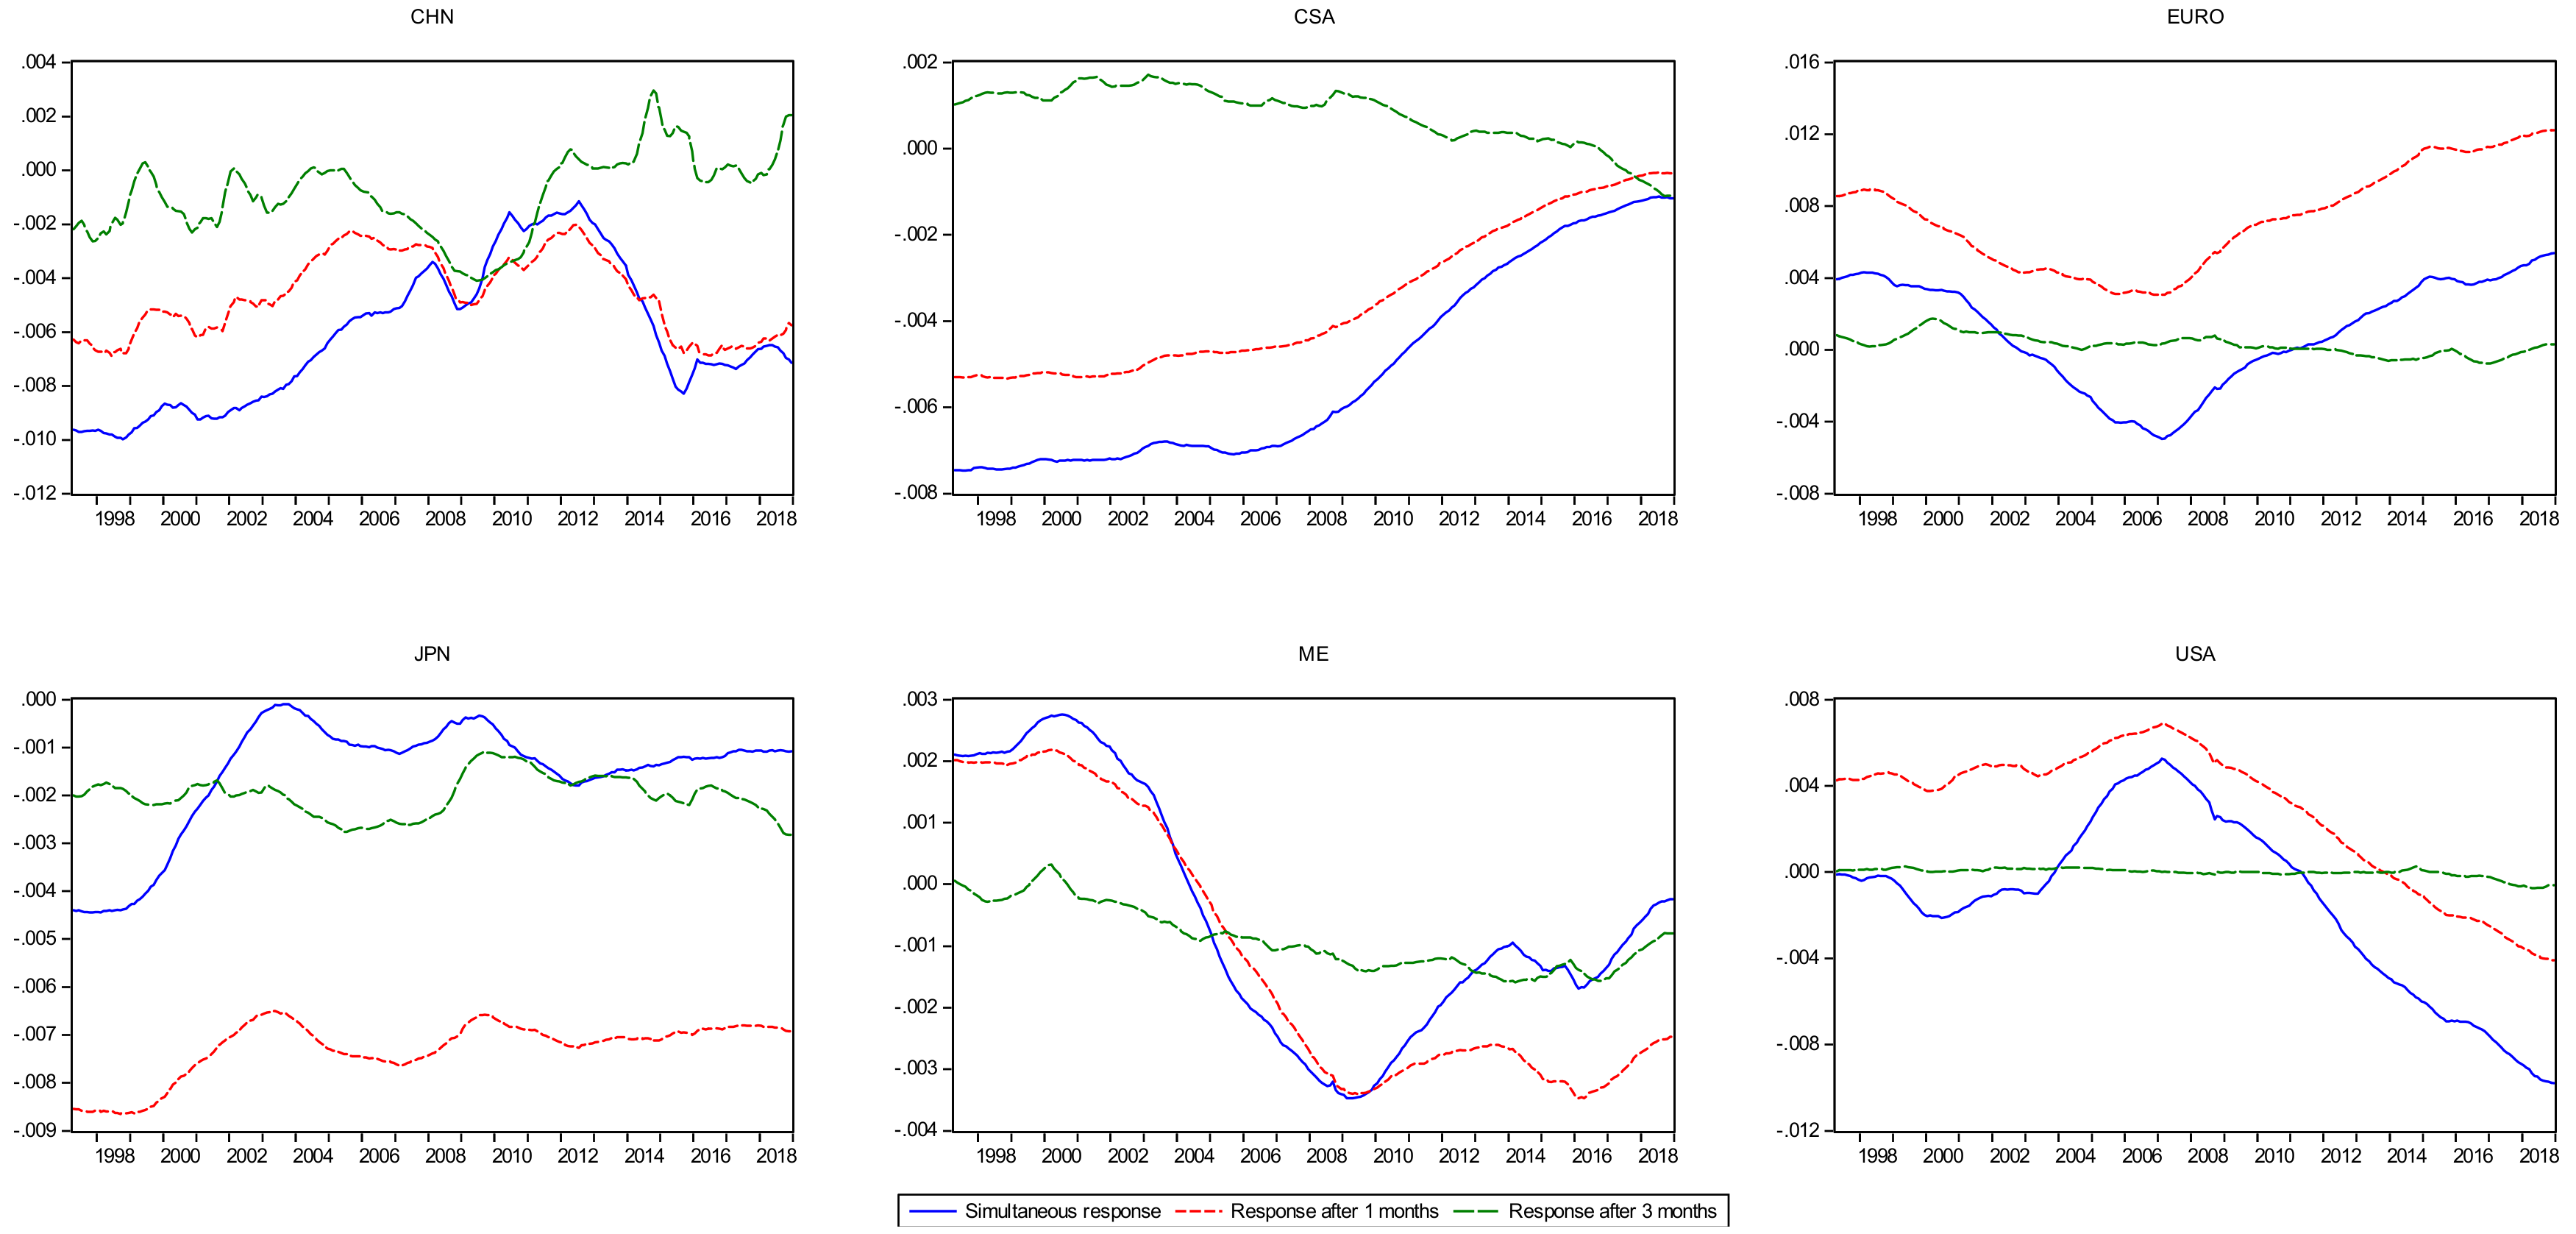
It is particularly interesting to study how the observed time variations affect the transmission of countries’ oil consumption. Figure 9 points out the time-varying impulse response to countries’ demand and oil return risks. It is obvious that the responses of various countries present different phases characteristics. In general, the impulse responses to CHN consumption of oil return risks significantly vary after 2013. A significant change is also noticeable in 2012. We clearly notice that the negative responses on all lagged show decrease before 2012, and the response after 3 months switches to positive while the other response is also negative and increase. This finding could be explained by the change of the economic state, as well as the reform of the policy.
The impulse response to CSA consumption of oil return risks has significantly weakened in generation. However, impulse responses to JPN consumption of oil return risks are relatively steady, indicating that the JPN consumption is beneficial to decreasing the oil risks. Additionally, despite the positive response took place before 2004, the response to ME consumption of oil return risk is negative. This result indicates that the appreciation of the ME consumption decreased the oil return risks. By contrast, the sign of the impulse to EURO consumption of oil return risks eventually varies during different periods. Specifically, the simultaneous response is almost the same as the 1-month one, which is negative during 2002–2010 and switches to positive in other periods. This phenomenon may be a result of the development of emerging markets during 2002–2008 and the change of the global economic and financial environment after 2008. On the contrary, the simultaneous impulse responses to USA consumption of oil return risks is positive from 2004 to 2010 and negative during other periods. However, the response after 1 month to oil return risks is positive before 2013 and switches to negative after 2013. What is more, the negative impact of the oil demand on the market in the USA shows an increasing trend. This indicates the growing dominant role of the US oil demand on the global crude oil market. This finding also reflects that this feature in the USA oil market exists in the global.
5. Discussions and Conclusions
The relationship between supply or demand and oil price volatility may reflect the importance of supply or demand in global crude oil markets. By applying the structural VAR model, Kilian [1] found that the synchronization between demand or supply shocks and the oil real price. Following Kilian [1], Yu [3] discovered the strong effect of the China demand on global oil price volatility after the financial crisis. Moreover, Aastveit [19] found that the impact on the real oil price is more than twice of demand from emerging economies compared with that in developed counties. However, there are many reasons that result in such reactions, such as the major events mentioned in Section 2.2, as well as coordination levels and space capacity of countries [50,51].
Unlike these studies, the empirical results from wavelet coherence and the impulse response functions all point to the heterogeneity of oil return risks response to supply or demand-side, as well as different countries. In this paper, we first examine the correlation of supply and demand in oil return risks and show the relationships in different countries based on wavelet coherence. Furthermore, we explore the time-varying interconnections between supply- or demand-side and oil return risks. What is more, we also study the heterogeneous role of oil producers or demand countries on the global crude oil market via the TVP-SVAR model. Specific conclusions are as follows.
The interconnection between supply or demand and oil return risks has stronger differences in the global crude oil market. In general, the correlation between supply and oil return risks is relatively stable, whereas the linkage between demand and oil return risks shows greater volatility due to the impact of specific events. According to Antonakakis [52], specific events have a direct effect on firm investment, in turn affecting the oil consumption and its risks. At a more specific level, the global oil market risk is closely related to the state of the country’s oil production capacity, and highly correlated with major political and economic events in demand countries or regions. Specifically, due to space capacity, the correlation between the KSA oil production and oil return risks is relatively stable, and IRI, KUW, UAE, and VNE show a decrease trend. In addition, because of the policy environment, the oil supply of MEX, USA and CHN is inconsistent with the fluctuation of oil return risks. In terms of demand countries, the correlation between USA and ME consumption and oil risks is more stable, and it shows an “inverted U” shape on the JPN market. In addition, the relationship between CNY consumption and oil return risks could be divided into three phases.
There are heterogeneous interconnections between supply- or demand-side and oil return risks over sample periods. In the perspective of the supply side, the sign of response could be divided into four phases, i.e., 1997–2002, 2002–2010, 2010–2013 and 2014–2018. Since differences of coordination behavior and market adjustment existing in the OPEC and non-OPEC countries, there are further differences role of OPEC and non-OPEC during 2002–2010 and 2014–2018. According to the differences in geopolitical factors, non-OPEC countries adjust the crude oil market fluctuation that could be resulted in the lag effects of the OPEC when the oil price changed. In terms of the demand side, the interconnections could be divided into three phases due to their signs. Especially, the simultaneous response to the demand side of oil return risks is positive, whereas the response after 1 month is negative before 2002. During 2002–2010, the sign of response is negative and oil return risks have become more reactive to total world consumption during 2002–2008 and switch to decrease during 2008–2010. In addition, the signs of the responses after 2010 are significantly different from those before that period.
The time-varying interconnections of oil producers or countries demand behave quite heterogeneously in different countries. Different local markets show global and regional status of the global oil market. For oil producers, the sign of response to IRQ and KSA oil return risks changed over time due to the market power. While the negative response occurs on simultaneous response, the responses of CHN, KUW and VEN oil consumption to the oil return risks are positive on the other lagged months, which are opposite to those of MEX, IRI and UAE. In addition, the positive response occurs on CAN and NOR, whereas the response of RUS and USA production to oil return risks is negative. For countries demand, the impulse responses to CHN consumption of oil return risks significantly vary in all lagged months after 2013. Otherwise, the impulse response to CSA consumption of oil return risks has significantly weakened in generation. However, impulse responses to JPN consumption of oil return risks are relatively steady. By contrast, although the positive response occurs before 2004, the response to ME consumption of oil return risks is negative. On the contrary, the signs of the impulse to EURO and USA consumption of oil return risks eventually vary during different periods.
These findings have implication for policymakers and investors in the global crude oil market. On the one hand, coordination levels and space capacity play a dominant role in improving the stability of the global oil market. Thus, Policymakers have stabilized the fluctuations in the oil market by formulating relevant cooperation policies to ease the imbalance between supply and demand in the domestic oil market. In addition, they also should strengthen the research and development of petroleum innovation technology and give full play to the space capacity of the oil market to meet the dependence role of oil in economic development, which in turn realizes the coordinated co-movement of the oil market and economy. On the other hand, the main concern of investors is the maximization of profits. Thus, investors need to focus on the market characteristics and the evolution of policies before investing in the decision-making, and they should further be familiarised with the operating mechanism of the market. Moreover, they also need to pay attention to the major events of major countries or organizations in the market, such as OPEC meetings and reports. What is more, they should make a reasonable assessment of the investment location and eliminate as much as possible the decision-making mistakes caused by geopolitical factors.
This paper is not without limitations. For instance, we ignored the difference between WTI and Brent oil price. It is also worth noting that the difference between WTI and Brent price has been expanded since 2011, thus we could further study the heterogeneous correlation by adding more global benchmark oil prices. In addition, further analysis about the asymmetric effects of investor sentiment and oil return risks in different regimes would be a valuable area to explore.
Author Contributions
Conceptualization, Z.L.; Data curation, Y.L.; Formal analysis, Z.L.; Investigation, Y.L.; Methodology, G.L.; Project administration, Z.L.; Validation, Y.L.; Writing—original draft, G.L.; Writing—review & editing, Z.D.
Funding
This research was funded by Guangdong Natural Science Foundation, grant number 2018A030313115.
Acknowledgments
The author are most grateful the three anonymous referees for their helpful comments and suggestions.
Conflicts of Interest
The authors declare no conflict of interest.
References
- Kilian, L. Not all oil price shocks are alike: Disentangling demand and supply shocks in the crude oil market. Am. Econ. Rev. 2009, 99, 1053–1069. [Google Scholar] [CrossRef]
- Hamilton, J.D. Causes and Consequences of the Oil Shock of 2007-08 (No. w15002); NBER Cambridge: Cambridge, MA, USA, in press.
- Yu, Y.; Zhang, W. The Role of China’s Demand in Global Oil Price Dynamics. Emerg. Mark. Financ. Trade 2019, 55, 1199–1215. [Google Scholar] [CrossRef]
- Ansari, D. OPEC, Saudi Arabia, and the shale revolution: Insights from equilibrium modelling and oil politics. Energy Policy 2017, 111, 166–178. [Google Scholar] [CrossRef] [Green Version]
- Kim, M.S. Impacts of supply and demand factors on declining oil prices. Energy 2018, 155, 1059–1065. [Google Scholar] [CrossRef]
- Baumeister, C.; Peersman, G. Time-varying effects of oil supply shocks on the US economy. Am. Econ. J. Macroecon. 2013, 5, 1–28. [Google Scholar] [CrossRef]
- Hamilton, J.D. Oil and the macroeconomy since World War II. J. Polit. Econ. 1983, 91, 228–248. [Google Scholar] [CrossRef]
- Nazlioglu, S.; Soytas, U.; Gupta, R. Oil prices and financial stress: A volatility spillover analysis. Energy Policy 2015, 82, 278–288. [Google Scholar] [CrossRef] [Green Version]
- Chen, Z.M.; Wang, L.; Zhang, X.B.; Zheng, X. The co-movement and asymmetry between energy and grain prices: Evidence from the crude oil and corn markets. Energies 2019, 12, 1373. [Google Scholar] [CrossRef]
- Chang, C.L.; Li, Y.Y.; McAleer, M. Volatility Spillovers between Energy and Agricultural Markets: A Critical Appraisal of Theory and Practice. Energies 2018, 11, 1595. [Google Scholar] [CrossRef]
- Zhong, J.; Wang, M.; Drakeford, B.; Li, T. Spillover effects between oil and natural gas prices: Evidence from emerging and developed markets. Green Financ. 2019, 1, 30–45. [Google Scholar] [CrossRef]
- Gao, X.; Fang, W.; An, F.; Wang, Y. Detecting method for crude oil price fluctuation mechanism under different periodic time series. Appl. Energy 2017, 192, 201–212. [Google Scholar] [CrossRef]
- Sun, J.; Shi, W. Breaks, trends, and unit roots in spot prices for crude oil and petroleum products. Energy Econ. 2015, 50, 169–177. [Google Scholar] [CrossRef]
- Wen, F.; Gong, X.; Cai, S. Forecasting the volatility of crude oil futures using HAR-type models with structural breaks. Energy Econ. 2016, 59, 400–413. [Google Scholar] [CrossRef]
- Charles, A.; Darné, O. Volatility persistence in crude oil markets. Energy Policy 2014, 65, 729–742. [Google Scholar] [CrossRef] [Green Version]
- Li, Z.; Liao, G.; Wang, Z.; Huang, Z. Green loan and subsidy for promoting clean production innovation. J. Clean Prod. 2018, 187, 421–431. [Google Scholar] [CrossRef]
- Huang, Z.; Liao, G.; Li, Z. Loaning scale and government subsidy for promoting green innovation. Technol. Forecast. Soc. Chang. 2019, 144, 148–156. [Google Scholar] [CrossRef]
- Loutia, A.; Mellios, C.; Andriosopoulos, K. Do OPEC announcements influence oil prices? Energy Policy 2016, 90, 262–272. [Google Scholar] [CrossRef]
- Aastveit, K.A.; Bjørnland, H.C.; Thorsrud, L.A. What drives oil prices? Emerging versus developed economies. J. Appl. Econom. 2015, 30, 1013–1028. [Google Scholar] [CrossRef]
- Liu, T.Y.; Lee, C.C. Will the energy price bubble burst? Energy 2018, 150, 276–288. [Google Scholar] [CrossRef]
- Su, C.W.; Li, Z.Z.; Chang, H.L.; Lobonţ, O.R. When will occur the crude oil bubbles? Energy Policy 2017, 102, 1–6. [Google Scholar] [CrossRef]
- Ji, Q.; Bouri, E.; Roubaud, D.; Shahzad, S.J.H. Risk spillover between energy and agricultural commodity markets: A dependence-switching CoVaR-copula model. Energy Econ. 2018, 75, 14–27. [Google Scholar] [CrossRef]
- He, K.; Tso, G.K.; Zou, Y.; Liu, J. Crude oil risk forecasting: New evidence from multiscale analysis approach. Energy Econ. 2018, 76, 574–583. [Google Scholar] [CrossRef]
- Huang, S.; An, H.; Wen, S.; An, F. Revisiting driving factors of oil price shocks across time scales. Energy 2017, 139, 617–629. [Google Scholar] [CrossRef]
- Zhang, Y.J.; Zhang, L. Interpreting the crude oil price movements: Evidence from the Markov regime switching model. Appl. Energy 2018, 143, 96–109. [Google Scholar] [CrossRef]
- Engle, R.F.; Manganelli, S. CAViaR: Conditional autoregressive value at risk by regression quantiles. J. Bus. Econ. Stat. 2004, 22, 367–381. [Google Scholar] [CrossRef]
- Das, A. Performance evaluation of modified adaptive Kalman filters, least means square and recursive least square methods for market risk beta and VaR estimation. Quant. Financ. Econ. 2019, 3, 124–144. [Google Scholar] [CrossRef]
- Dičpinigaitienė, V.; Novickytė, L. Application of systemic risk measurement methods: A systematic review and meta-analysis using a network approach. Quant. Financ. Econ. 2018, 2, 798–820. [Google Scholar] [CrossRef]
- Ferraty, F.; Quintela-Del-Río, A. Conditional VAR and Expected Shortfall: A New Functional Approach. Econom. Rev. 2016, 35, 263–292. [Google Scholar] [CrossRef]
- Li, Z.H.; Dong, H.; Huang, Z.H.; Failler, P. Asymmetric Effects on Risks of Virtual Financial Assets (VFAs) in different regimes: A Case of Bitcoin. Quant. Financ. Econ. 2018, 2, 860–883. [Google Scholar] [CrossRef]
- Shi, Y.; Ng, C.T.; Yiu, K.F.C. Portfolio selection based on asymmetric Laplace distribution, coherent risk measure, and expectation-maximization estimation. Quant. Financ. Econ. 2018, 2, 776–797. [Google Scholar] [CrossRef]
- Dong, H.; Liu, Y.; Chang, J.Q. The heterogeneous linkage of economic policy uncertainty and oil return risks. Green Financ. 2019, 1, 46–66. [Google Scholar] [CrossRef]
- Gong, X.; Wen, F.; Xia, X.H.; Huang, J.; Pan, B. Investigating the risk-return trade-off for crude oil futures using high-frequency data. Appl. Energy 2017, 196, 152–161. [Google Scholar] [CrossRef]
- Kolodzeij, M.; Kaufmann, R.K. Oil demand shocks reconsidered: A cointegrated vector autoregression. Energy Econ. 2014, 41, 33–40. [Google Scholar] [CrossRef]
- Basta, M.; Molnar, P. Oil market volatility and stock market volatility. Financ. Res. Lett. 2018, 26, 204–214. [Google Scholar] [CrossRef]
- Bernas, A.; Aldenkamp, A.P.; Zinger, S. Wavelet coherence-based classifier: A resting-state functional MRI study on neurodynamics in adolescents with high-functioning autism. Comput. Meth. Programs Biomed. 2018, 154, 143–151. [Google Scholar] [CrossRef]
- Hkiri, B.; Hammoudeh, S.; Aloui, C.; Shahbaz, M. The interconnections between US financial CDS spreads and control variables: New evidence using partial and multivariate wavelet coherences. Int. Rev. Econ. Financ. 2018, 57, 237–257. [Google Scholar] [CrossRef]
- Khalfaoui, R.; Boutahar, M.; Boubaker, H. Analyzing volatility spillovers and hedging between oil and stock markets: Evidence from wavelet analysis. Energy Econ. 2015, 49, 540–549. [Google Scholar] [CrossRef]
- Mensi, W.; Hkiri, B.; Al-Yahyaee, K.H.; Kang, S.H. Analyzing time–frequency co-movements across gold and oil prices with BRICS stock markets: A VaR based on wavelet approach. Int. Rev. Econ. Financ 2018, 54, 74–102. [Google Scholar] [CrossRef]
- Pal, D.; Mitra, S.K. Oil price and automobile stock return co-movement: A wavelet coherence analysis. Econ. Model. 2019, 76, 172–181. [Google Scholar] [CrossRef]
- Li, R. The role of OPEC in the world oil market. Int. J. Bus. Econ. 2010, 9, 83. [Google Scholar]
- Ghassan, H.B.; AlHajhoj, H.R. Long run dynamic volatilities between OPEC and non-OPEC crude oil prices. Appl. Energy 2016, 169, 384–394. [Google Scholar] [CrossRef] [Green Version]
- Torrence, C.; Compo, G.P. A practical guide to wavelet analysis. Bull. Amer. Meteorol. Soc. 1998, 79, 61–78. [Google Scholar] [CrossRef]
- Ji, Q.; Guo, J.F. Oil price volatility and oil-related events: An Internet concern study perspective. Appl. Energy 2015, 137, 256–264. [Google Scholar] [CrossRef]
- Parnes, D. Heterogeneous noncompliance with OPEC’s oil production cuts. Energy Econ. 2019, 78, 289–300. [Google Scholar] [CrossRef]
- Primiceri, G.E. Time varying structural vector autoregressions and monetary policy. Rev. Econ. Stud. 2005, 72, 821–852. [Google Scholar] [CrossRef]
- Bekiros, S.; Gupta, R.; Paccagnini, A. Oil price forecastability and economic uncertainty. Econ. Lett. 2015, 132, 125–128. [Google Scholar] [CrossRef] [Green Version]
- Yin, L. Does oil price respond to macroeconomic uncertainty? New evidence. Empir. Econ. 2016, 51, 921–938. [Google Scholar] [CrossRef]
- Reboredo, J.C.; Uddin, G.S. Do financial stress and policy uncertainty have an impact on the energy and metals markets? A quantile regression approach. Int. Rev. Econ. Financ. 2016, 43, 284–298. [Google Scholar] [CrossRef]
- Al Rousan, S.; Sbia, R.; Tas, B.K.O. A dynamic network analysis of the world oil market: Analysis of OPEC and non-OPEC members. Energy Econ. 2018, 75, 28–41. [Google Scholar] [CrossRef]
- Belloumi, M.; Alshehry, A. Sustainable energy development in Saudi Arabia. Sustainability 2015, 7, 5153–5170. [Google Scholar] [CrossRef]
- Antonakakis, N.; Chatziantoniou, I.; Filis, G. Dynamic spillovers of oil price shocks and economic policy uncertainty. Energy Econ. 2014, 44, 433–447. [Google Scholar] [CrossRef] [Green Version]
Figure 1.
Wavelet coherence between supply or demand and oil return risk. Source: Author estimation. (Notes: The black dotted line shows the trend).
Figure 1.
Wavelet coherence between supply or demand and oil return risk. Source: Author estimation. (Notes: The black dotted line shows the trend).

Figure 2.
Wavelet coherence between OPEC members’ oil production and oil return risks. Source: Author estimation. (Note: The black dotted line shows the trend).
Figure 2.
Wavelet coherence between OPEC members’ oil production and oil return risks. Source: Author estimation. (Note: The black dotted line shows the trend).

Figure 3.
Wavelet coherence between non-OPEC countries oil production and oil return risk. Source: Author estimation. (Note: The black dotted line shows the trend).
Figure 3.
Wavelet coherence between non-OPEC countries oil production and oil return risk. Source: Author estimation. (Note: The black dotted line shows the trend).

Figure 4.
Wavelet coherence between demand countries or regions’ oil consumption and oil return risk. Source: Author estimation. (Note: The black dotted line shows the trend).
Figure 4.
Wavelet coherence between demand countries or regions’ oil consumption and oil return risk. Source: Author estimation. (Note: The black dotted line shows the trend).

Figure 5.
Time-varying impulse response to supply-side of oil return risks. Source: Author estimation.
Figure 5.
Time-varying impulse response to supply-side of oil return risks. Source: Author estimation.

Figure 6.
Time-varying impulse response to demand-side to oil return risks. Source: Author estimation.
Figure 6.
Time-varying impulse response to demand-side to oil return risks. Source: Author estimation.

Figure 7.
The time-varying impulse to OPEC members’ production of oil return risk. Source: Author estimation.
Figure 7.
The time-varying impulse to OPEC members’ production of oil return risk. Source: Author estimation.

Figure 8.
The time-varying impulse to non-OPEC producers of oil return risk. Source: Author estimation.
Figure 8.
The time-varying impulse to non-OPEC producers of oil return risk. Source: Author estimation.

Figure 9.
The time-varying impulse response to countries’ demand to oil return risk. Source: Author estimation.
Figure 9.
The time-varying impulse response to countries’ demand to oil return risk. Source: Author estimation.

© 2019 by the authors. Licensee MDPI, Basel, Switzerland. This article is an open access article distributed under the terms and conditions of the Creative Commons Attribution (CC BY) license (http://creativecommons.org/licenses/by/4.0/).
Share and Cite
MDPI and ACS Style
Liao, G.; Li, Z.; Du, Z.; Liu, Y. The Heterogeneous Interconnections between Supply or Demand Side and Oil Risks. Energies 2019, 12, 2226. https://0-doi-org.brum.beds.ac.uk/10.3390/en12112226
AMA Style
Liao G, Li Z, Du Z, Liu Y. The Heterogeneous Interconnections between Supply or Demand Side and Oil Risks. Energies. 2019; 12(11):2226. https://0-doi-org.brum.beds.ac.uk/10.3390/en12112226
Chicago/Turabian StyleLiao, Gaoke, Zhenghui Li, Ziqing Du, and Yue Liu. 2019. "The Heterogeneous Interconnections between Supply or Demand Side and Oil Risks" Energies 12, no. 11: 2226. https://0-doi-org.brum.beds.ac.uk/10.3390/en12112226
Note that from the first issue of 2016, this journal uses article numbers instead of page numbers. See further details here.