Article

The Effects of Lithium Sulfur Battery Ageing on Second-Life Possibilities and Environmental Life Cycle Assessment Studies

1
Catalonia Institute for Energy Research (IREC), Sant Adrià de Besòs 08930, Spain
2
Universitat Politècnica de Catalunya (UPC), Barcelona 08034, Spain
*
Author to whom correspondence should be addressed.
Submission received: 29 May 2019 / Accepted: 24 June 2019 / Published: 25 June 2019
(This article belongs to the Special Issue Energy Storage and Management for Electric Vehicles)

Abstract

:
The development of Li-ion batteries has enabled the re-entry of electric vehicles into the market. As car manufacturers strive to reach higher practical specific energies (550 Wh/kg) than what is achievable for Li-ion batteries, new alternatives for battery chemistry are being considered. Li-Sulfur batteries are of interest due to their ability to achieve the desired practical specific energy. The research presented in this paper focuses on the development of the Li-Sulfur technology for use in electric vehicles. The paper presents the methodology and results for endurance tests conducted on in-house manufactured Li-S cells under various accelerated ageing conditions. The Li-S cells were found to reach 80% state of health after 300–500 cycles. The results of these tests were used as the basis for discussing the second life options for Li-S batteries, as well as environmental Life Cycle Assessment results of a 50 kWh Li-S battery.

1. Introduction

The history of the electric vehicle (EV) is full of back and forth. It was born in the 19th century before the first internal combustion engine vehicle (ICEV), but was soon abandoned. It resurged in the 1890s by the hand of General Motors but was also soon abandoned. It was not until the arrival of lithium ion batteries, with their clearly higher performance in comparison to other energy storage systems, that the EV again entered the market in 2010. This time, though, apart from technical and economic issues, the development and implementation of country and region-specific environmental policies and directives was crucial for market penetration [1].
With the market share of electric vehicles (EVs) increasing and EV adoption being widely debated [2], research related to EV energy consumption, environmental impact and economic impact has increased on a yearly basis [3]. As part of this, and due to the increasing interest of adopting Circular Economy principles, Life Cycle Assessment studies have been conducted to quantify the environmental impact of EVs with the goal of reducing the pressure on ecosystems and natural resources [4].
Life Cycle Assessment (LCA) is the current state-of-the-art for quantifying the environmental life cycle impact and is thought to be valuable for assessing the potential impact of moving towards an electrified transportation infrastructure [5]. LCA is defined as the “compilation and evaluation of the inputs, outputs and the potential environmental impacts of a product system throughout its life cycle” [6]. LCA studies of EVs have focused on impact categories such as climate change and energy demand. This is due to the fact that variation in the electricity grid mix has a large influence on the overall result, and thus decarbonization of the grid mix will lead to further improvements in the environmental impact of the EV [7]. Along the same line, improvements in driving range and efficiency of the battery will also lead to a lower environmental impact. Therefore, many efforts have focused on the environmental analysis of the use phase of the EV. However, components such as batteries, that generally use scarce and precious materials, also present environmental concerns that need to be addressed, such as resource depletion. An LCA approach is necessary to give a more complete picture of the environmental burdens caused by EVs, from raw material extraction through to final disposal.
In order to normalize the results from one LCA study to the next, most studies have assumed a total lifetime driving distance above 100,000 km [8,9], a consumption of between 0.12 [10] and 0.2 kWh/km [11,12], and a battery lifespan that is equivalent to that of the EV. Other studies have conducted scenario analysis on the driving distance, the consumption, and the battery lifespan (including one or more battery replacements [13]). In terms of End-of-Life (EoL) of the EV battery, degradation to 80% of the initial battery capacity is considered the appropriate lifespan for mobility purposes, after which the battery should be replaced [14]. However, this 80% limit has been debated in relation to the real needs of the EV owner [15], as trips are often well below 100 km [16] and may still be supported with a battery below the suggested 80% State of Health (SoH). Once the battery reaches its EoL, there is an opportunity to reuse the battery in stationary applications [17], referred to as the second life of the battery [18].
There are three main strategies to consider regarding second life batteries, each having positive and negative aspects. The first suggests that the best option from an economical perspective is to use the batteries exactly as they are when extracted from the vehicle, without any further manipulation. The battery pack is installed as one unit in a portable container [19,20], or a tertiary building knowing that the battery might not be the most suitable for the stationary application. The second strategy is based on the concept that the battery re-use should concentrate on modules, which are relatively easy to dismantle from the battery pack and will allow for the battery to be sized according to the second life application. In this case, the repurposed battery can use modules from different car manufacturers [21]. Finally, the third strategy suggests that the dismantling of the EV battery should be at cell level in order to select the cells that have similar degradation. This selection allows perfectly homogeneous batteries to be built [22]. However, besides the choice of the strategy and stationary application to use, there are still other issues to consider before a positive revenue is generated from the defined business case, such as battery ownership and battery collection, among others [23,24].
Battery performance is another aspect being considered for increased deployment of EVs. Not all Li-ion batteries are equal, differing in the chemical composition of the anode, cathode and doping elements to provide various performance characteristics, such as higher energy density, higher power density, longer lifespan or improved safety. Currently, nickel manganese cobalt oxide (NMC) batteries are preferred by the automotive sector [25] due to their relatively high energy density, acceptable lifespan and safety level. Another chemical composition used by Chinese car manufacturers is Iron phosphate (LFP) that has a lower cost and good lifespan but provides lower energy and power densities compared to NMC. Finally, nickel cobalt aluminum oxide batteries (NCA) provide higher energy and power densities than NMC, but have lower lifespans and safety inconveniences [26]. Due to the different options available for Li-ion batteries, research has been done to analyze the environmental impact of battery manufacturing. Studies have indicated that the preferred NMC batteries perform worse than the other types from an environmental perspective [13,27].
Despite the quite good technical performance of Li-ion batteries that allowed the return of EVs, the cost of the batteries is still too expensive for a massive deployment [28]. Moreover, car manufacturers aim to reach specific energies of approximately 550 Wh/kg to increase the battery capacity and reduce the overall weight of EVs, and in turn eliminate range anxiety concerns of EV owners. Since Li-ion batteries are thought to have achieved their practical specific energy limit [29], which ranges between 100 and 250 Wh/kg, new alternatives for battery chemistry are being considered that have higher practical specific energy limits, such as Li-Sulfur (Li-S) [30], lithium air, and all-solid-state batteries [31].
From the aforementioned alternatives to Li-ion, the research presented in this study focuses on Li-S technology as part of the work conducted under the framework of the HELIS H2020 project [32] that aims to develop Li-S batteries for automotive purposes. This paper first presents the analysis of the Li-S battery ageing tests that were conducted on in-house manufactured Li-S cells (achieving around 300–500 cycles at 80% SoH). From these results, the second life options and possibilities are discussed together with the results for an environmental Life Cycle Assessment (LCA) study. The LCA is conducted on a 50 kWh Li-S battery and uses the results from the ageing tests to define the lifespan of the battery. The work presented here is focused on the analysis of the evolution of the capacity related to the SoH and the efficiency of the cells. The study of the internal mechanisms that lead to degradation, material activation and self-discharge will not be addressed in this paper, but will be included in future work.

2. Materials and Methods

This section is divided into two subsections. The description of the cell ageing tests and how the results will be treated is presented in the first section. The second section presents the environmental LCA methodology.

2.1. Ageing Tests

The ageing tests of the Li-S technology were performed by exposing in-house manufactured coin cells to endurance tests under laboratory conditions in a thermal chamber. Note that these coin cells were part of the second generation of cells resulting from the HELIS project. The cell composition was based on a sulfur-carbon composite cathode and Li-metal anode. The cathode was fabricated using a conventional doctor blade approach, consisting of 80% sulfur-carbon composite, 10% conductive carbon and 10% Polyvinylidene fluoride (PVDF) binder. Electrodes were punched in a disc and dried at 80 °C prior to the manual coin cell assembly. The cells contained 2 mgS/cm2/side with a theoretical capacity of 1675 mAh/gS yielding the final capacity in the range of 1 mAh, although some variability was observed due to the manual manufacturing process. An optimized amount of 1M lithium bistrifluoromethanesulfonimidate (LiTFSI) in 1:1 dimethyl glycol (DME) and dioxolane (DOL) electrolyte [33] was used, resulting in a ratio of about 35 µL/mgS. It is noted here that this ratio was used in the coin cells for project purposes to ensure cell performance, but was reduced when scaling to larger cell sizes.
The testing platform included a Bio-Logic BCS series potentiostat with 24 channels for multiple simultaneous testing, an Angelantoni FM600BT climatic chamber for low temperature testing and a DRY-line VWR oven to regulate high temperatures (Figure 1). At the end of the tests, EC-lab software was used to extract all data for further analysis.
A total of six cells were tested combining different temperatures −10 °C, room temperature and 45 °C) and current (C-rate) conditions (from C/5 to 2C) to determine which (if any) of these factors can be considered the principal ageing factors that accelerate the ageing phenomena that occurs in all types of batteries:
  • Room Temperature (RT), C-rate: 2C (J26)
  • Room Temperature (RT), C-rate: C/10 (provided by SAFT Battery Manufacturer)
  • Temperature −10 °C, C-rate: C/2 (J4)
  • Temperature −10 °C, C-rate: C/5 (J1)
  • Temperature 45 °C, C-rate: 2C (J33)
  • Temperature 45 °C, C-rate: C/5 (J32)
Note that there was only one cell per test due to the channel limitations of the equipment and the duration of the experiments. Although one cell might not be enough to ensure the absolute validity of results, it was preferred to test different scenarios rather than just a few but with a redundancy in the number of cells following the same profiles. It should also be noted that the second cell, cycled at room temperature (RT) and following a 10 h charge/discharge cycle profile, had the particularity to be the only cell manufactured by SAFT, the battery manufacturer in the HELIS project. All the other cells (J1, J4, J26, J32 and J33) were built in the Catalonia Institute for Energy Research (IREC) facilities following manual processes. Furthermore, at –10 °C, the operative capacity of the cells submitted to relatively high rates was residual (less than 10% of the capacity identified at room temperature), being impossible to retrieve reliable information from these tests, which is the reason that the maximum cycling rate at –10 °C was done at C/2 instead of 2C.
All the endurance tests at low C-rates followed non-stop symmetric constant current capacity cycles. That is, charges and discharges, which have the same C-rate (no matter if it is a charge or discharge process) occurred consecutively without any pause between cycles and without having a constant voltage period to achieve a full charge. All charges stopped at a maximum voltage of 2.6 V while discharges stopped when the minimum of 1.9 V was reached. Moreover, the capacity fade presented in the results section are directly extracted from these continuous cycling and not from specific “control cycles.” Note that the continuous constant current cycling allows the batteries to age relatively quickly compared to using constant current-constant voltage strategies, but it goes in detriment of reliability, as the resulting data might present higher dispersion.
On the other hand, due to the particularities of the charge/discharge voltage profile of Li-S, the effective or functional capacity of a cell might dramatically change depending on the C-rate but independently of the ageing of the cell. Consequently, the instant performance of Li-S should be clearly differentiated. Figure 2 (left) shows that the behavior of the discharge of Li-S batteries clearly has three phases, an initial small voltage drop (an abrupt step just after the beginning of a charge or discharge) of about 0.2 V (from 2.6 to 2.4 V), followed by a continuous voltage decrease and, finally, a plateau that has a slight voltage recovery prior to the final descent of voltage until reaching the minimum limit of 1.9 V. This is the common behavior of a Li-S battery as the kinetics of the polysulfides inside the cell are related to voltage [34]. However, when exposed to higher currents (Figure 2 right), the initial voltage drop caused by the internal resistance is much higher (around 0.4 V) forcing the minimum voltage of 1.9 V to be reached during the continuous voltage decrease of the second phase and before entering in the last plateau [35]. In consequence, the functional capacity of the cell is divided by almost 2, and thus should be considered during the ageing analysis.
Additionally, as five of the cells were manufactured in-house following a non-industrialized process, their capacity is substantially lower than the cell built by SAFT (Table 1) and they also have quite a large dispersion between themselves. It is worth to remark that all cells were manufactured using the same active materials and electrolyte and contain the same sulfur loading, the differences observed here are due to the manufacturing process (manual and industrial) and the inherent imperfections linked to the manual processing of the components.
Due to the low capacity and large dispersion, the battery degradation was evaluated by analyzing the evolution of SoH through the endurance cycling tests. In this study, the SoH is calculated as the ratio between the capacity at the current cycle discharge divided by the capacity of the first discharge done by the cell (Equation (1)).
SoH = Capi/Cap,
where Capi is the initial Capacity and Cap is the capacity at the current cycle.
Using this process, the degradation of the battery can be easily compared between the different endurance tests to be able to extract the functional effects of temperature and current intensity to the available capacity. Note that for cells having lower capacity, the small dispersion caused by the measurement equipment is amplified when relating it to SoH. To ease the interpretations of the evolution of SoH results and the trends derived from them, one data point from every 100 cycles is presented in the graphics in the results section (to have fewer overlapping data points in the same graph). Note that the presentation of results as SoH versus cycles instead of SoH versus capacity throughput (Ah) is also clearer due to the relatively important data dispersion of the initial capacity of the in-house manufactured cells. In addition, the study also analyzes the degradation of the battery in terms of efficiency, which is related to the internal resistance increase of the cells [36]. To do so, the study considers the ratio between the total capacity (Ah) charged to the cell divided by the capacity discharged from the cell for each cycle (Equation (2)).
Eff = Ah Charge/Ah Discharge.
To understand the exact evolution of the resistance, pulse tests [37,38], or even more precise methods, such as Electrochemical Impedance Spectroscopy (EIS) [39,40,41], could have been used. However, as the main scope of the study was to evaluate the functional characteristics of the cells and their relation to the End-of-Life, Second Life applications and LCA, it was decided that the SoH and efficiency were enough for this analysis and thus these results were not included in this study. The analysis of the internal mechanisms that explains the exact behavior of cells at every instant will be performed in future work.

2.2. LCA Methodology

LCA is divided into four stages including, Goal and Scope definition, Life Cycle Inventory (LCI), Life Cycle Impact Assessment (LCIA) and Interpretation. The Goal and Scope definition states the overall goal of the study and defines the system boundary, functional unit, and all other methodological choices required to meet the goal. The functional unit describes the function of the product system being assessed and is the unit for which the data is collected. Often the functional unit is scaled to a more appropriate unit for quantifying the outputs of processes within the system boundary that fulfill the function, referred to as the reference flow [6]. The LCI is the data collection step, and the LCIA categorizes the LCI data into impact categories defined in the scope, applies the associated characterization model and quantifies the overall environmental impact for each category assessed. The interpretation stage checks that the LCI and LCIA have met the requirements defined in the goal and scope.
For this study, an environmental attributional LCA was conducted for the production, use and disposal of a 50 kWh Li-S battery in accordance to ISO 14044 [6]. The Li-S battery is based on the composition of the Li-S coin cells manufactured in-house and considers the ageing tests as described in Section 2.1. The goal of the study was to quantify the environmental impact of a Li-S battery for use in an electric vehicle from cradle-to-grave, which includes raw material extraction, materials production, battery manufacturing, use and final End-of-Life disposal (Figure 3). It should be noted that the system boundary of the study does not include transportation, the production of the Battery Management System (BMS), or the production of the electric vehicle.
The functional unit of the LCA is defined as 1 km of driving based on an average of 0.17 kWh/km for EVs [42] and an 85% efficiency [43] that takes into account both the charge/discharge efficiency confirmed in the results section as well as the efficiency of the charger. The reference flow that is commonly applied in LCA studies of EVs is 150,000 km, particularly for comparisons between EVs with Li-ion batteries to ICEVs [44]. Historically, LCA studies conducted on Li-S batteries assumed that the Li-S chemistry would be able to achieve the 150,000 km, however, the degradation curves from laboratory performance tests on Li-S batteries were not included in this assumption. Therefore, another goal of the study was to use the ageing data to determine the total kilometers reached during the lifespan of the battery.
In order to include the actual performance of the Li-S battery in the LCA, an alternative reference flow was thus defined as total km for one Li-S battery. The total km was quantified using ageing test data from laboratory tests on Li-S coin cells to calculate the SoH of the battery per cycle. It should be noted that calendar ageing tests were also conducted on the coin cells, however, these results were not considered in the ageing tests for this study as further investigation is required to determine the relationship, if any, between cycle and calendar ageing for Li-S cells. The end-of-life of the battery was defined as 60% SoH for several reasons further discussed in the results section regarding the ageing test performance.
The LCA was modeled using GaBi Professional software, a tool designed for LCA studies assessing a variety of impact categories. Both GaBi 8 Professional and EcoInvent 3.5 datasets were used in the study. The electricity mix shown in Figure 4. was used for this study and corresponds to the EU-28 grid mix.
A key limitation of this study includes the scaling up from the composition of a coin cell to a battery. However, including laboratory data from Li-S ageing tests in an LCA case study of Li-S batteries is a step forward for the environmental assessment of this technology.

2.2.1. Li-S Battery Manufacturing Inventory Data

The mass of the active material (electrolyte, anode and cathode) in the Li-S coin cells was scaled to the mass of active material required for a 50 kWh Li-S battery based on the gravimetric energy density (GED) and the ratio of total mass to active mass. The GED and active mass were calculated as given in Equations (3) and (4), respectively. As indicated previously, the electrolyte ratio used in the coin cells is 35 µL/mgS for project purposes to ensure proper cell performance. However, since this amount of electrolyte is not optimal and it is assumed that larger cells can reach at least 6 µL/mgS, if not lower, 11.5 µL of electrolyte was estimated as the amount per coin cell for the LCA. It is worth to remark that the electrolyte ratio assumed is closer to the actual for EV-size batteries and provides a more realistic approach for LCA studies. This is further confirmed in [45], where a ratio of 10 µL/mgS is recommended when scaling up from coin cells. Similarly, the quantity of lithium anode in the coin cell is in excess, therefore, the diameter of the Lithium ribbon was assumed to be the same diameter as the cathode. For the active material in the cathode, a 1:1 ratio of carbon to sulfur was used. Table 2 gives the specifications of the coin cells used in scaling up to the 50 kWh battery. The mass of each active material in the battery was calculated using Equations (5) and (6).
G E D   =   C C C M A M   ×   V C C
M A M   =   M E l C C +   M A C C +   M C C C   ,
S c a l i n g   F a c t o r   =   1 x 10 6 M A M ×   E B G E D   ,
M X B   =   M X C C   ×   S c a l i n g   F a c t o r 1000   ,  
where C C C is the capacity (mAh) of the coin cell, V C C is the voltage of the coin cell, M A M is the mass (g) of the active material in the coin cell, M E l C C   ,   M A C C   and   M C C C are the masses (g) of electrolyte, anode and cathode in the coin cell, E B is the energy (kWh) of the battery, and GED is the gravitational energy density (Wh/kg). M X B (kg) and M X C C (g) are the masses in kilograms and grams for X (electrolyte, anode or cathode) in the battery (B) and coin cell (CC), respectively.
The mass of the other battery components, including the cell container, separator, module and pack packaging, and cooling system were taken from a previous LCA study conducted on Li-S batteries [43], which used the BatPac software for sizing Li-ion batteries and adapted it to a Li-S system. Similarly, data estimated in [43] for industry manufacturing of Li-S batteries was used for the energy consumption. Table 3 gives the quantities used for the 50 kWh Li-S battery.

2.2.2. Li-S Battery Use and End-of-Life Inventory Data

The EU-28 grid mix was used for the use phase. Tests for the ageing of coin cells as described in Section 2.1 were used to compute the total amount of kilometers and, thus, extract the energy used during the use phase. To do so, the linear relationship between SoH and number of cycles from the results of the ageing tests served to obtain Equation (7), which was then used to quantify the total use phase energy requirement for each scenario. Three scenarios were defined, being a minimum, average and maximum number of cycles achievable by the battery to reach 60% SoH according to the ageing results for the various cells tested. It should be noted that these scenarios were defined from the cells that cycled for more than 800 cycles during the ageing tests.
E T   = E B i = 1 n ( m n + b ) =   E B ( m n ( n + 1 ) 2 + n b )   ,
where E T is total accumulated energy (kWh), E B is the energy of the battery (kWh), m and b are the slope and intercept of the fit linear curve for SoH versus cycle number, respectively, and n is the cycle number.
Data for the recycling of Li-S batteries was provided by ACCUREC (project partner) who developed a recycling process for Li-S cells that is in compliance with EU-directive 66/2006. This directive sets a minimum recycling efficiency requirement for batteries of 50% of the mass of the battery.

2.2.3. Impact Categories Assessed

The LCA data was aggregated into impact categories and summed to give a total result. The impact categories assessed include resource depletion, acidification, eutrophication, climate change, photochemical ozone formation and energy demand. The characterization model and characterization factors used are defined in Table 4.

3. Results and Discussion

Following the same structure as in Section 2, this section first discusses the results of the ageing endurance tests and then the LCA results.

3.1. Ageing Results

The results obtained from the data analysis are presented together in 
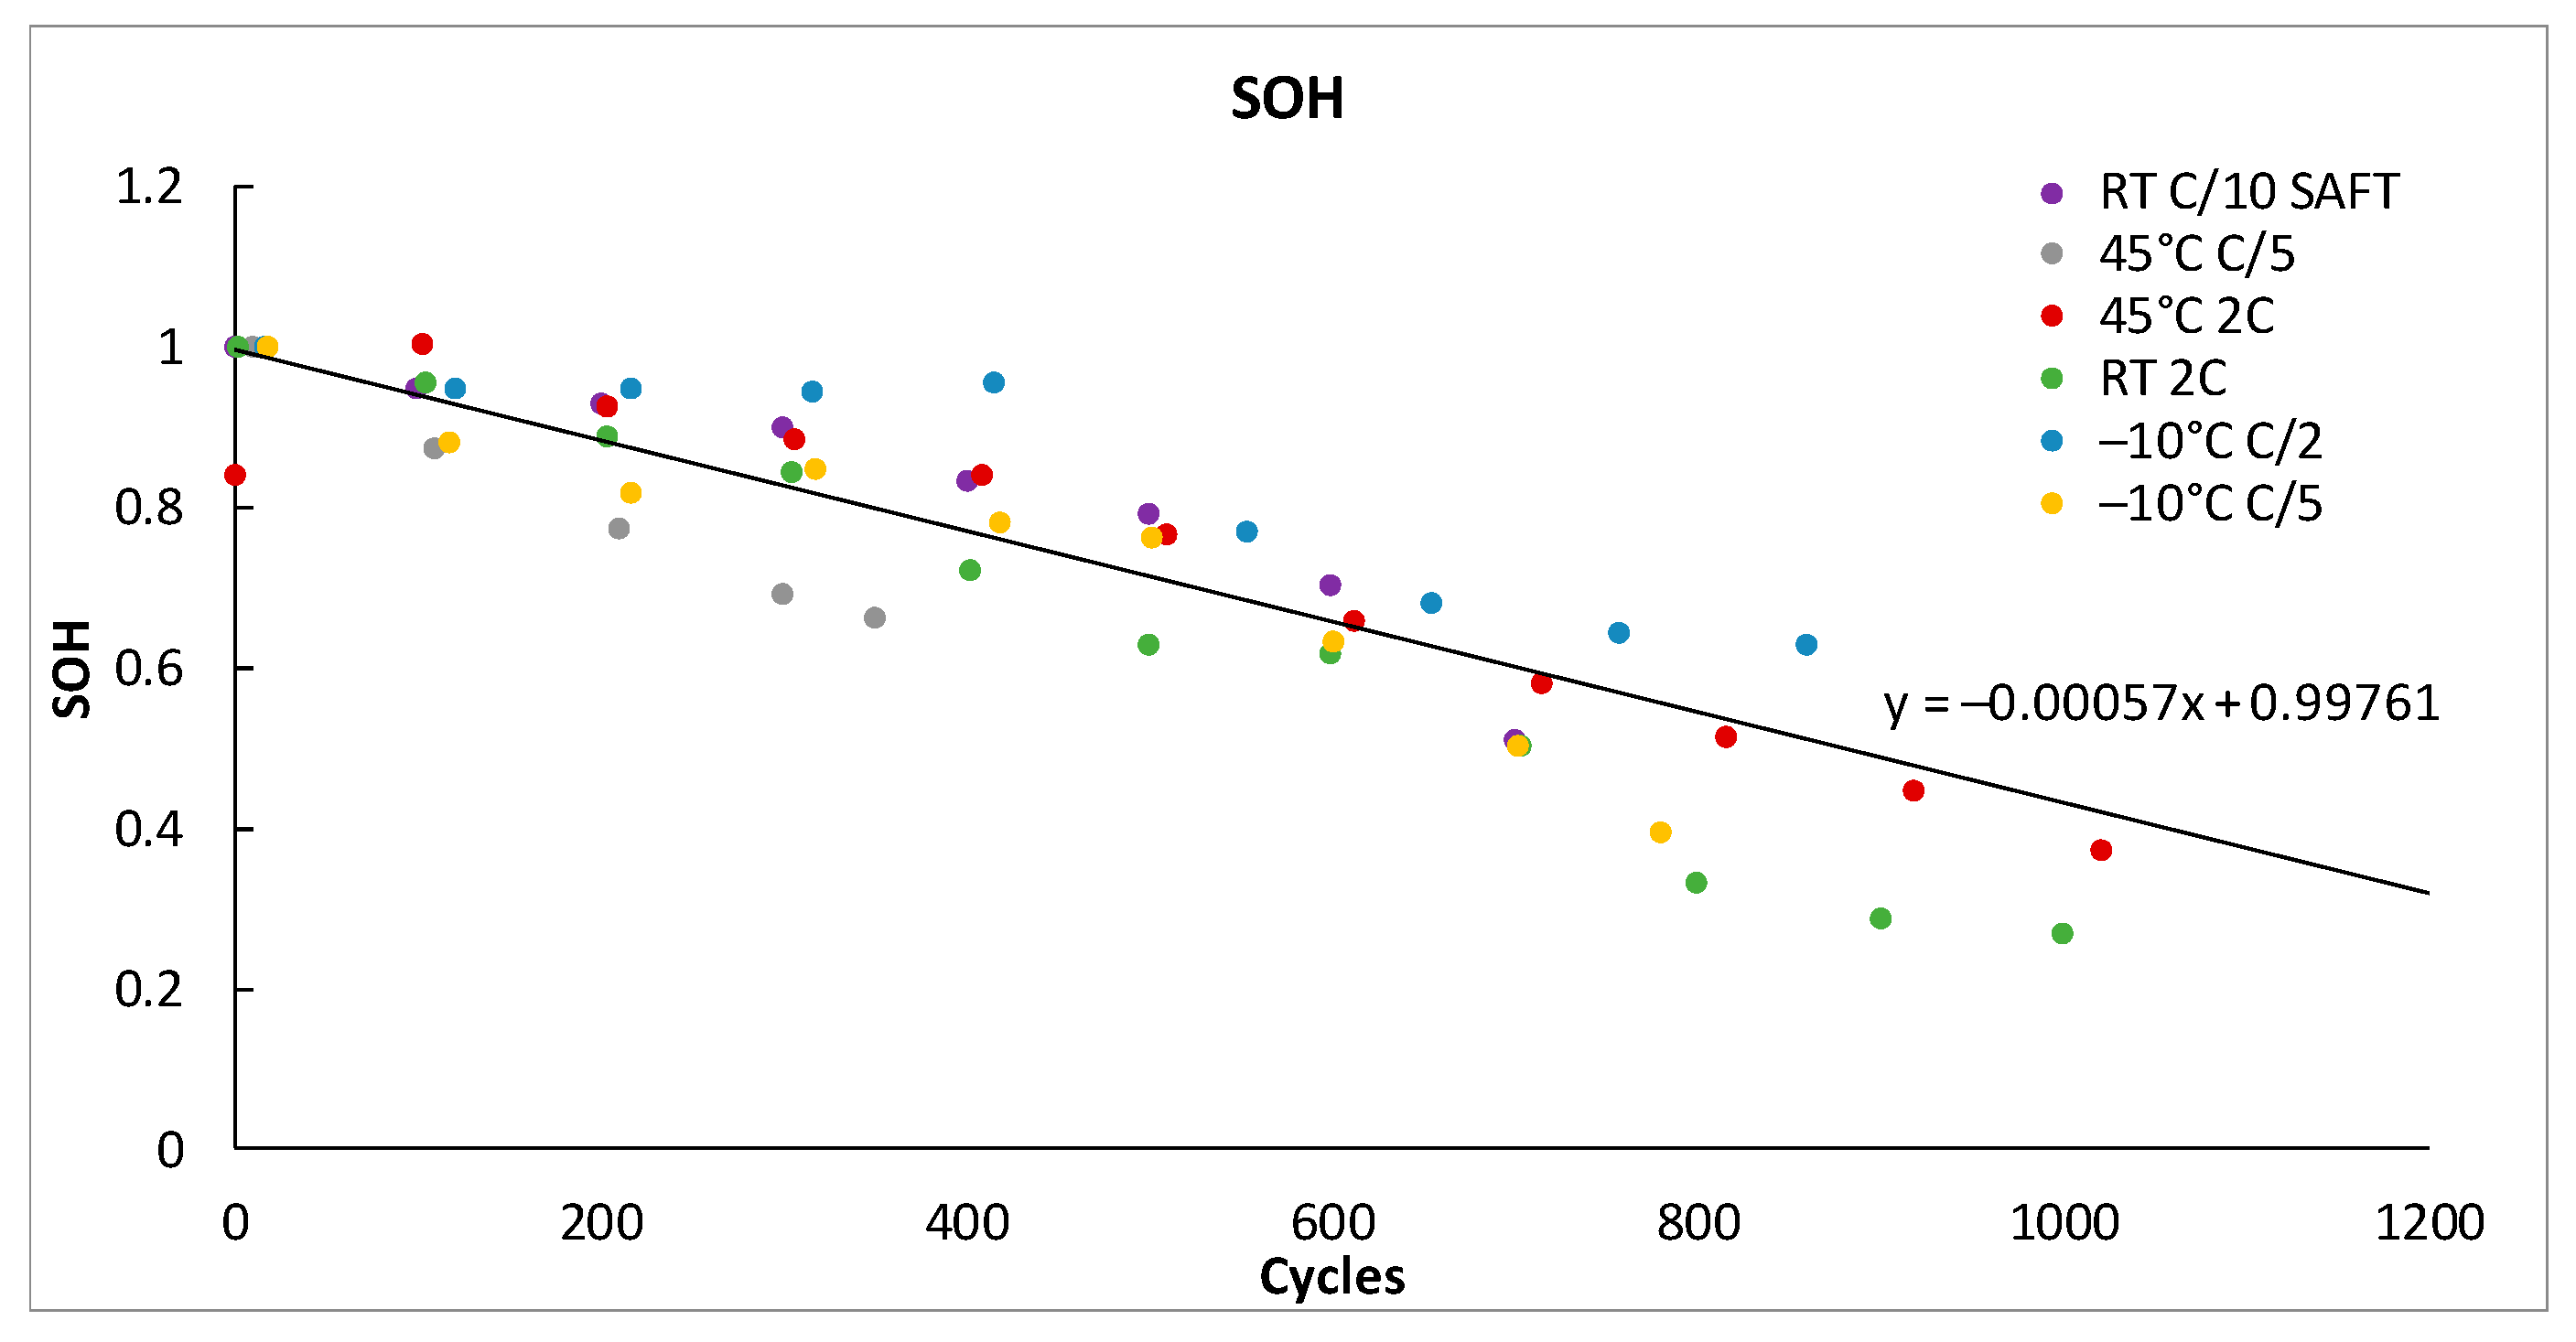
Figure 5 for all the endurance tests to highlight the similarity of the degradation trends (SoH reduction) that all cells follow independently of the cell.
Although there is a large dispersion in the measurements (Figure 5), cells seem to follow a linear degradation of about –0.00057 SoH per cycle on average. This value is close to the values obtained by Shang et al. [46] where, after a first rapid decrease, cells continued with a constant (0.000625 SoH per cycle) capacity decrease for over 200 cycles. Additional relevant information can be extracted from Figure 5, for instance, there seems to be no clear relationship between the C-rate and the acceleration of cell degradation. This is demonstrated by the fact that the cell from SAFT (purple dots), which cycled at C/10 (the lowest current under test) and J33 (red dots), which cycled at 2C (20 times faster) follow almost the same trend. Similarly, temperature also does not appear to be a relevant factor that accelerates the ageing of Li-S cells. This can be observed in the figure by comparing the cells J4 (blue dots), SAFT (purple dots) and J33 (red dots) that cycled at –10 °C, room temperature (RT) and 45 °C respectively, and for which similar degradation trends are obtained.
To clearly state this first impression, Table 5 presents the slope of the linear curve that best fits each cell submitted to endurance tests and the corresponding R square value. Effectively, these three cells (J4, J33 and SAFT) have a slope that is close to the average, reinforcing the idea that temperature and current have no relevant effect on ageing. Notice that the most rapid degradation occurs at C/5 at 45 °C (J32), however, there are too few points to ensure that this trend is going to be sustained after more cycles. In fact, it is worth mentioning that the behavior of the cell cycling at C/5 at –10°C (J4) initially had a similar degradation pattern but then stabilized for some cycles before again decreasing more rapidly. This behavior might indicate that the initial aggressive slope would be softened if cycled for a longer period. Similarly, after more than 600 cycles, cell 26 (cycling at 2C and RT) reaches the 60% SoH and then seems to suffer a substantial drop but in fact it re-stabilizes at 40% SoH.
The differences in capacity fading observed with Li-S cell cycling have also been noted in previous research. The trend that shows an initial linear capacity fade transitioning into a stabilization period and then continuing with a capacity loss was indicated in [47] for cells cycled at C/10 and C/5, where stabilization periods of 150 to 350 cycles were observed. Furthermore, an increase of the capacity during the initial cycles, as observed for cell J33, has been highlighted in [48] for Li-S cells cycled at C/10 and C/5 and temperatures of 20, 30 and 40 °C.
Thus, it seems reasonable to state that Li-S battery ageing does not behave like the Lithium ion in response to changes in temperature and C-rate. In fact, Lithium ion battery ageing is strongly affected by several factors that accelerate the ageing in different ways [49,50]. These factors are Temperature, State of Charge (SoC), C-rate and Depth of Discharge (DoD) [51]. Typically, temperature has an exponential effect on ageing, meaning that the battery lifespan shortens as temperature increases [52,53]. The SoC and C-rate, on the other hand, follow first and second polynomial relations being more severe when the battery remains fully charged or suffers from higher intensive discharges [54,55]. The DoD follows a logarithmic behavior, which reverts in almost no ageing effect during small ripples or cycles that increases rapidly as the DoD increases, becoming relatively stable after 40% DoD [56].
In comparison to the Li-ion ageing behavior, the endurance tests presented in this section indicate that Li-S ageing seems independent of changes in temperature and C-rate confirmed by the linear degradation trends with similar slopes under varying test conditions. However, this statement does not mean that the C-rate and temperature have no effect on Li-S battery performance. In fact, the tested coin cells displayed higher stability when working at higher temperatures and low C-rates but also presented poorer efficiency, as described later in this section. In addition, these results show that the sudden death or ageing knee that typically occurs in Lithium ion batteries [57,58] is not appreciable in Li-S batteries (some cells achieved 40% SoH and continued working).
There is another important aspect to look at related to battery ageing performance for traction purposes, which is the efficiency and loss of power. These two aspects are closely related to the internal resistance of the battery by the Ohm law, the higher the internal resistance, the higher the losses. Lithium ion batteries generally suffer an exponential internal resistance increase as SoH decreases, that is, the internal resistance increase is quite low at the beginning but is more and more noticeable as the battery ages. For instance, a study regarding the battery ageing of real electric vehicles using the internal resistance shows how at 88% SoH, the internal resistance of all the cells in the battery was slightly higher than at the beginning, but at 82% SoH their internal resistance was already 20% higher [59] and it may rise even higher if the SoH goes beyond this point [57], up to 200% at 60% SoH [60].
To analyze what occurs with Li-S, the evolution of the efficiency measured for all cells during the endurance tests versus the SoH (Equation 1) was plotted (Figure 6). Note that the dispersion is relevant due to the constant current cycling method, the particularities of the entrance into the second plateau, and the fact that the efficiency versus SoH is presented in the figure. However, it is difficult to identify any correlation between the evolution of efficiency versus SoH and the temperature or C-rate. The shuttle effect has an important impact on efficiency [61], making Li-S cells less efficient at higher temperatures and at lower C-rates [62]. It should be noted, however, that the cell with a lower efficiency and a quicker efficiency loss is the SAFT cell, which was manufactured following an industrial process. This cell was cycled at a lower C-rate where the self-discharge of the battery might noticeably interfere [63]. Yet, the loss of efficiency through ageing is relatively low decreasing from 99% to 96% in all the cases except for the SAFT cell and cell J33. This is in accordance with the quite stable efficiency values presented in [64], where three cells containing different separators to inhibit the shuttle effect were tested for more than 500 cycles. It further demonstrates that the internal resistance does not seem to increase in an exponential way as occurs with Li-ion batteries.
All these aforementioned issues indicate that, effectively, aged Li-S batteries perform similarly to new batteries but differ in initial capacity. Therefore, from a strictly ageing perspective, it seems that there should not be much difference in using brand new Li-S cells or aged cells apart from the bigger volume of the battery built from re-used cells and an uncertainty of a sudden malfunction of the cell corresponding to a shorter lifespan. However, some of the cells continued working well below a 50% SoH and, in one case (J26), 30% SoH was reached before the test was finally stopped. The stabilization of the capacity fade at below 50% SoH was also observed in previous research on Li-S pouch cells [65], however the number of cycles achieved by these cells was reported to be significantly lower, reaching a 20% capacity fade before 50 cycles. The observed stabilization resulted from the inhibition of polysulfide diffusion caused by similar concentrations of sulfur/polysulfide in the electrolyte and carbon interface being reached [65].
It should be noted that most applications will fail before such a low SoH is reached, and thus, a limit of 60% SoH at the end of the first and second life is acceptable, which is the value used for the LCA discussed in the following section. Furthermore, the preliminary ageing results presented for the few cells studied should be confirmed by future research.
The following recommendations should be considered when using Li-S batteries in stationary applications for both new or re-used batteries:
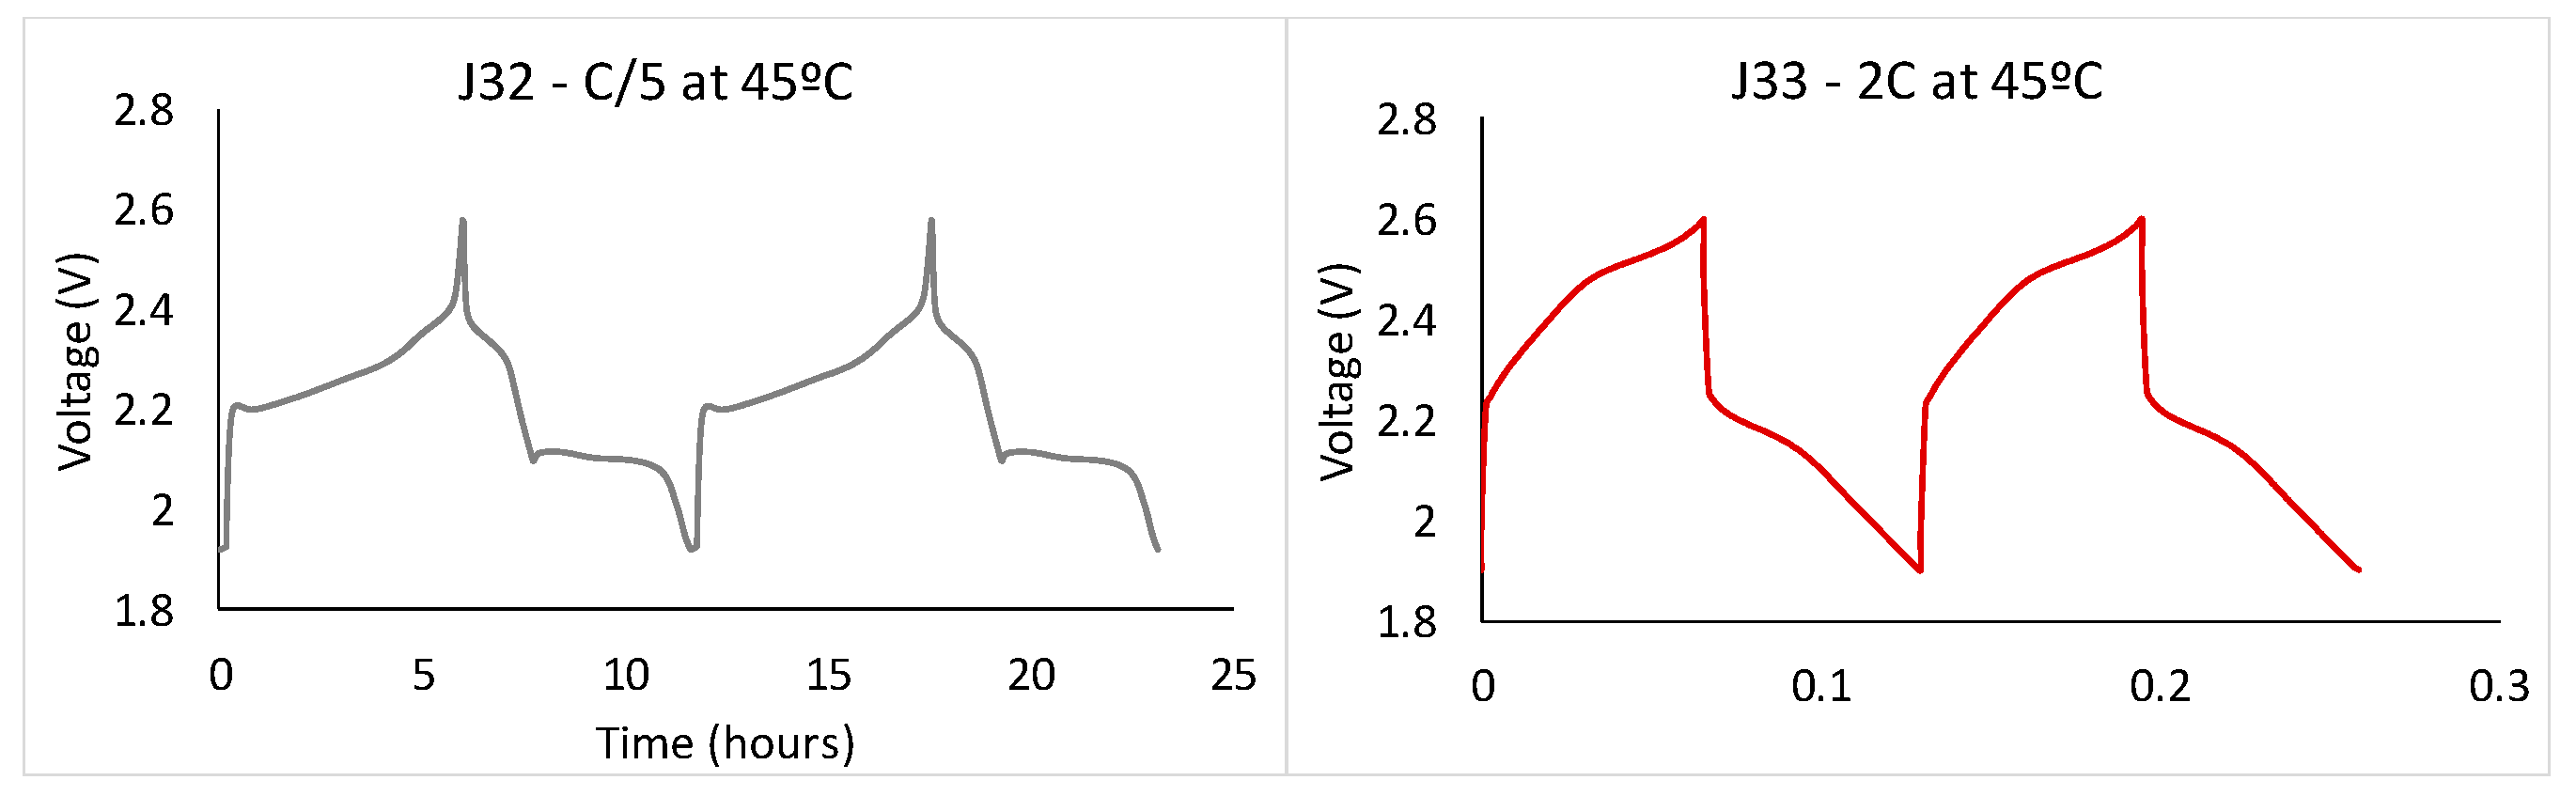
  • A loss of capacity occurs when cycled at high current rates (caused by the impossibility to enter the second plateau shown in Figure 2).
  • Low temperatures result in a sudden decrease in performance of Li-S batteries (at temperatures below 0 °C)
  • High temperatures result in a loss in efficiency (due to an increase of the shuttle effect)
  • Very low C-rates or long durations without use result in a loss in efficiency (due to the shuttle effect)

3.2. Life Cycle Impact Assessment Results and Interpretation

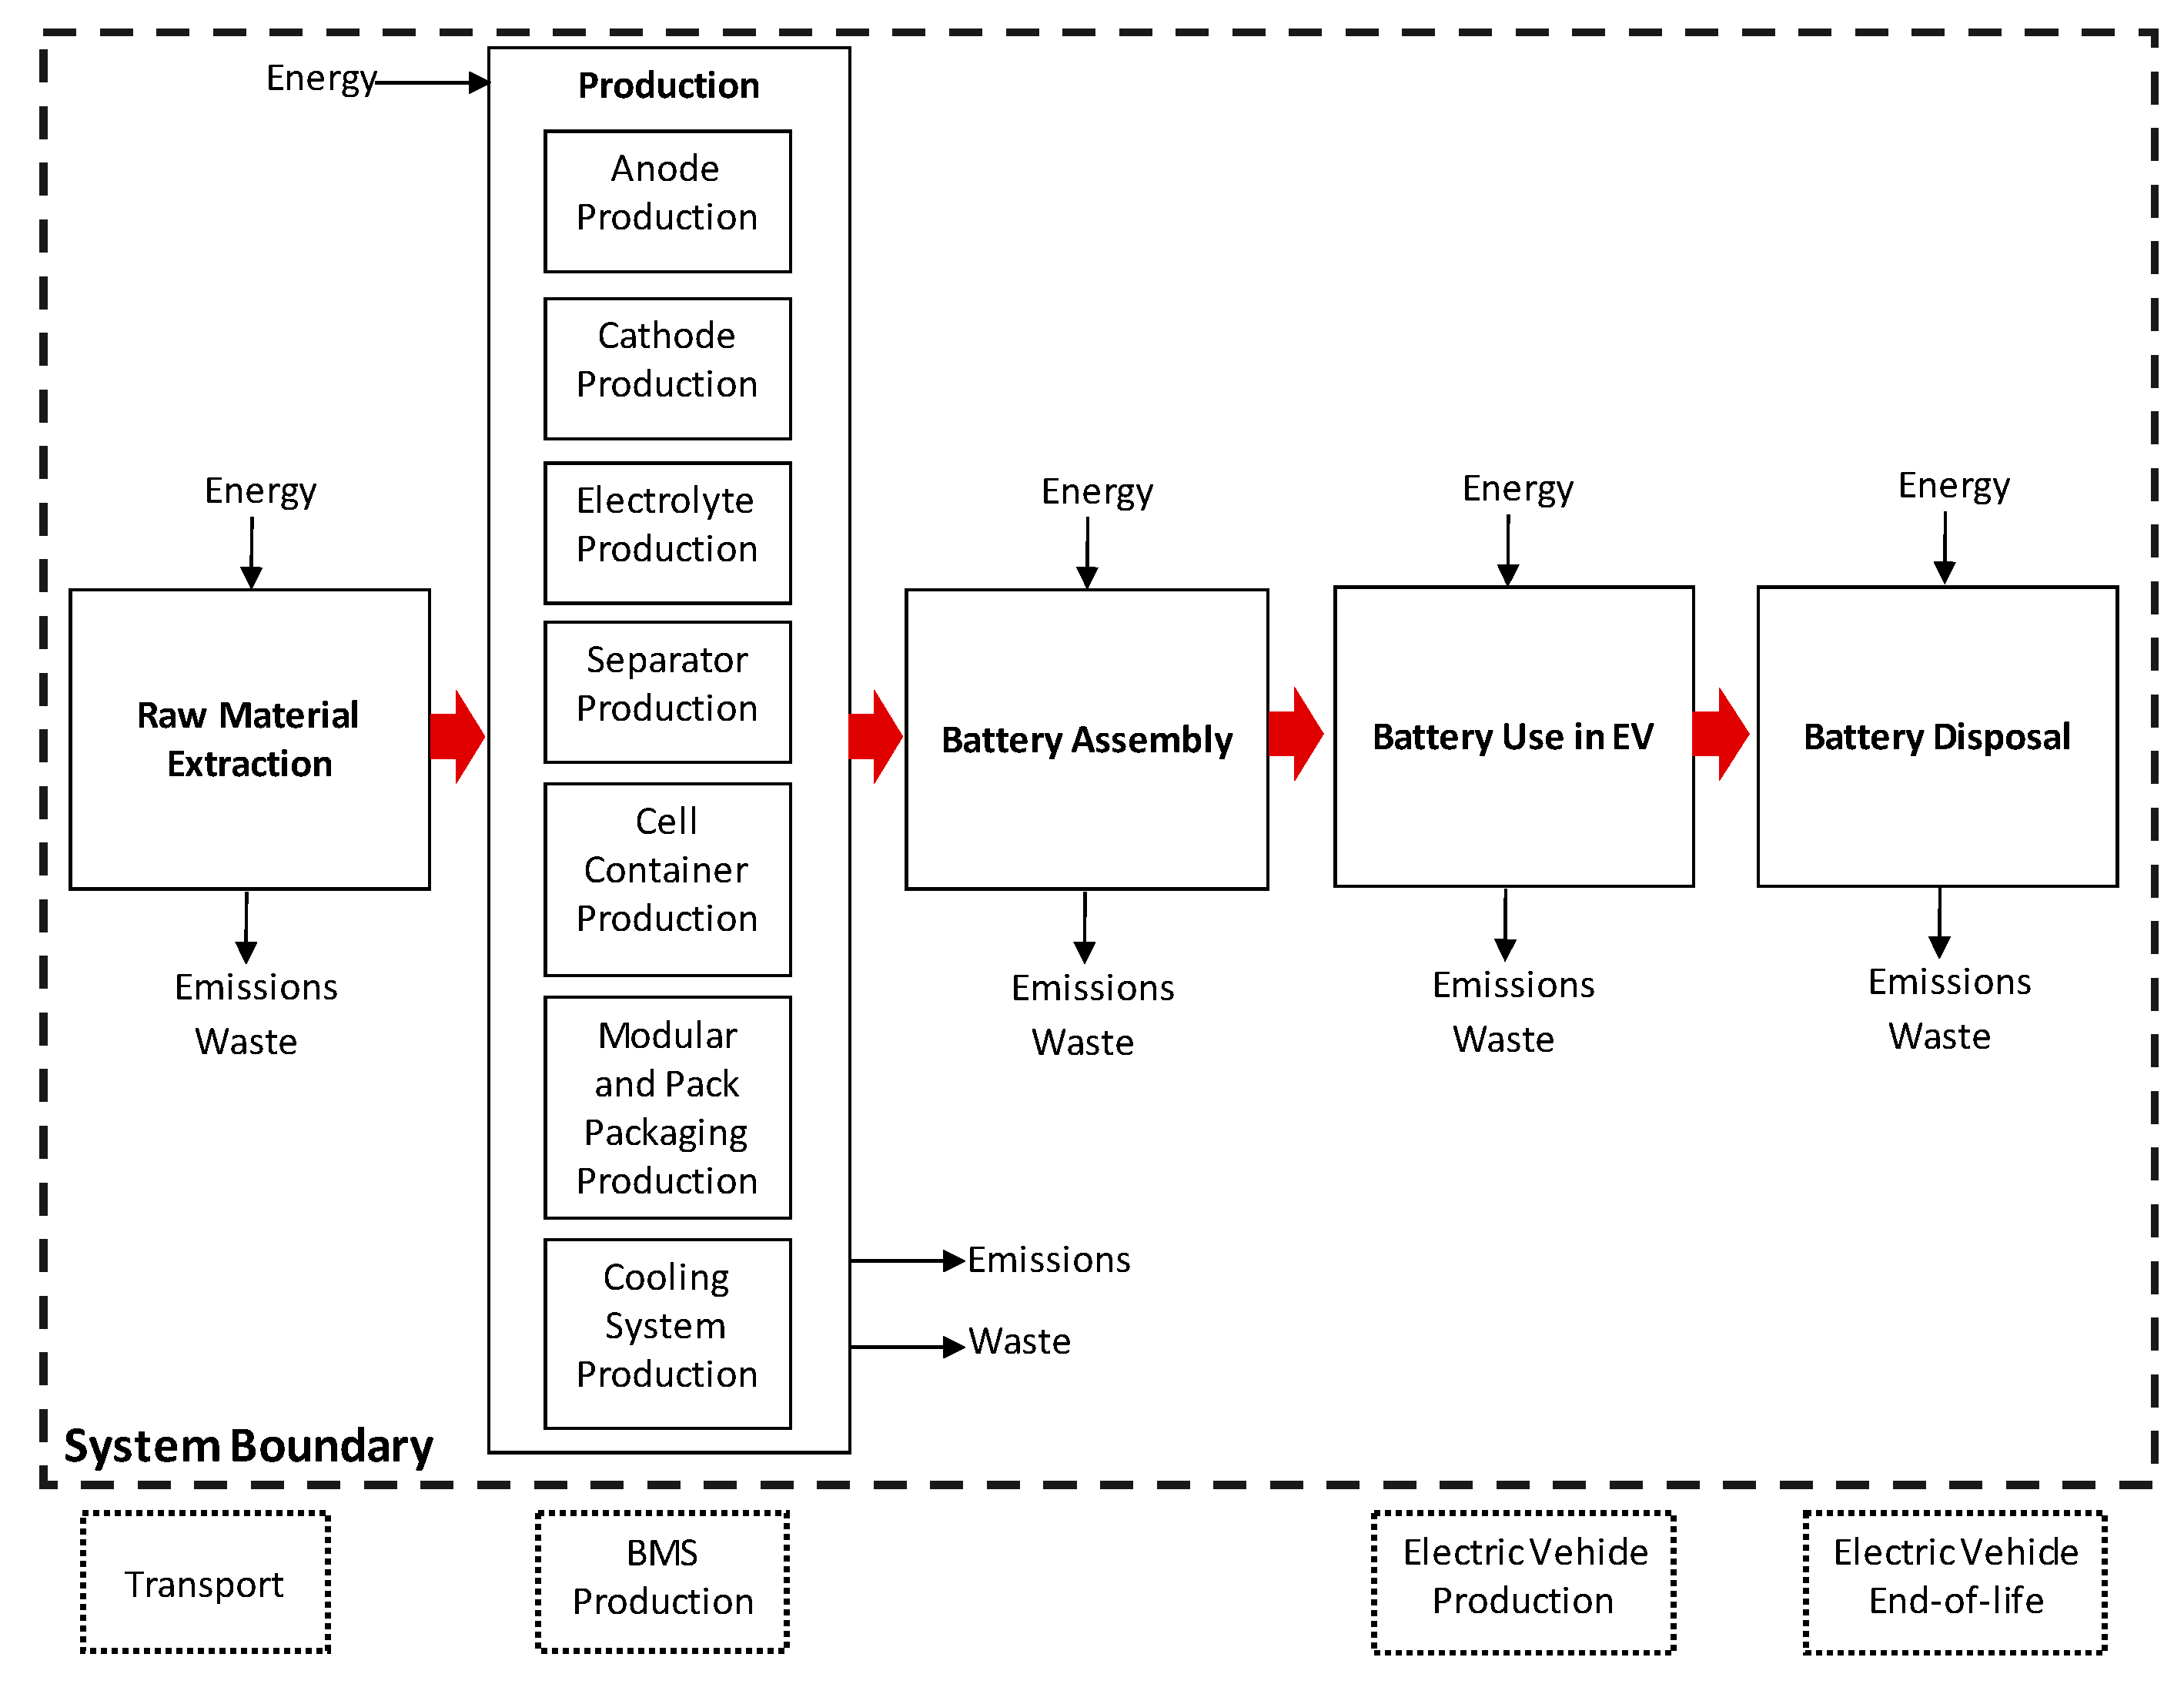
The Life Cycle Impact Assessment results are presented and discussed in this section. For the system boundary defined in Figure 3, the ageing test results from Section 3.1 were used to define three scenarios for the analysis. From Figure 5, the number of cycles achieved by the battery to reach 60% SoH can range from 552 to 912 cycles. The scenarios defined for the use phase are summarized in Table 6. From this table, Scenario 2 is very close to and Scenario 3 exceeds the 150,000 km defined for most LCA studies on EVs, however, Scenario 1 does not quite meet this distance. Particularly for Scenario 1, the options for battery replacement may be considered depending on the End-of-Life of the EV.
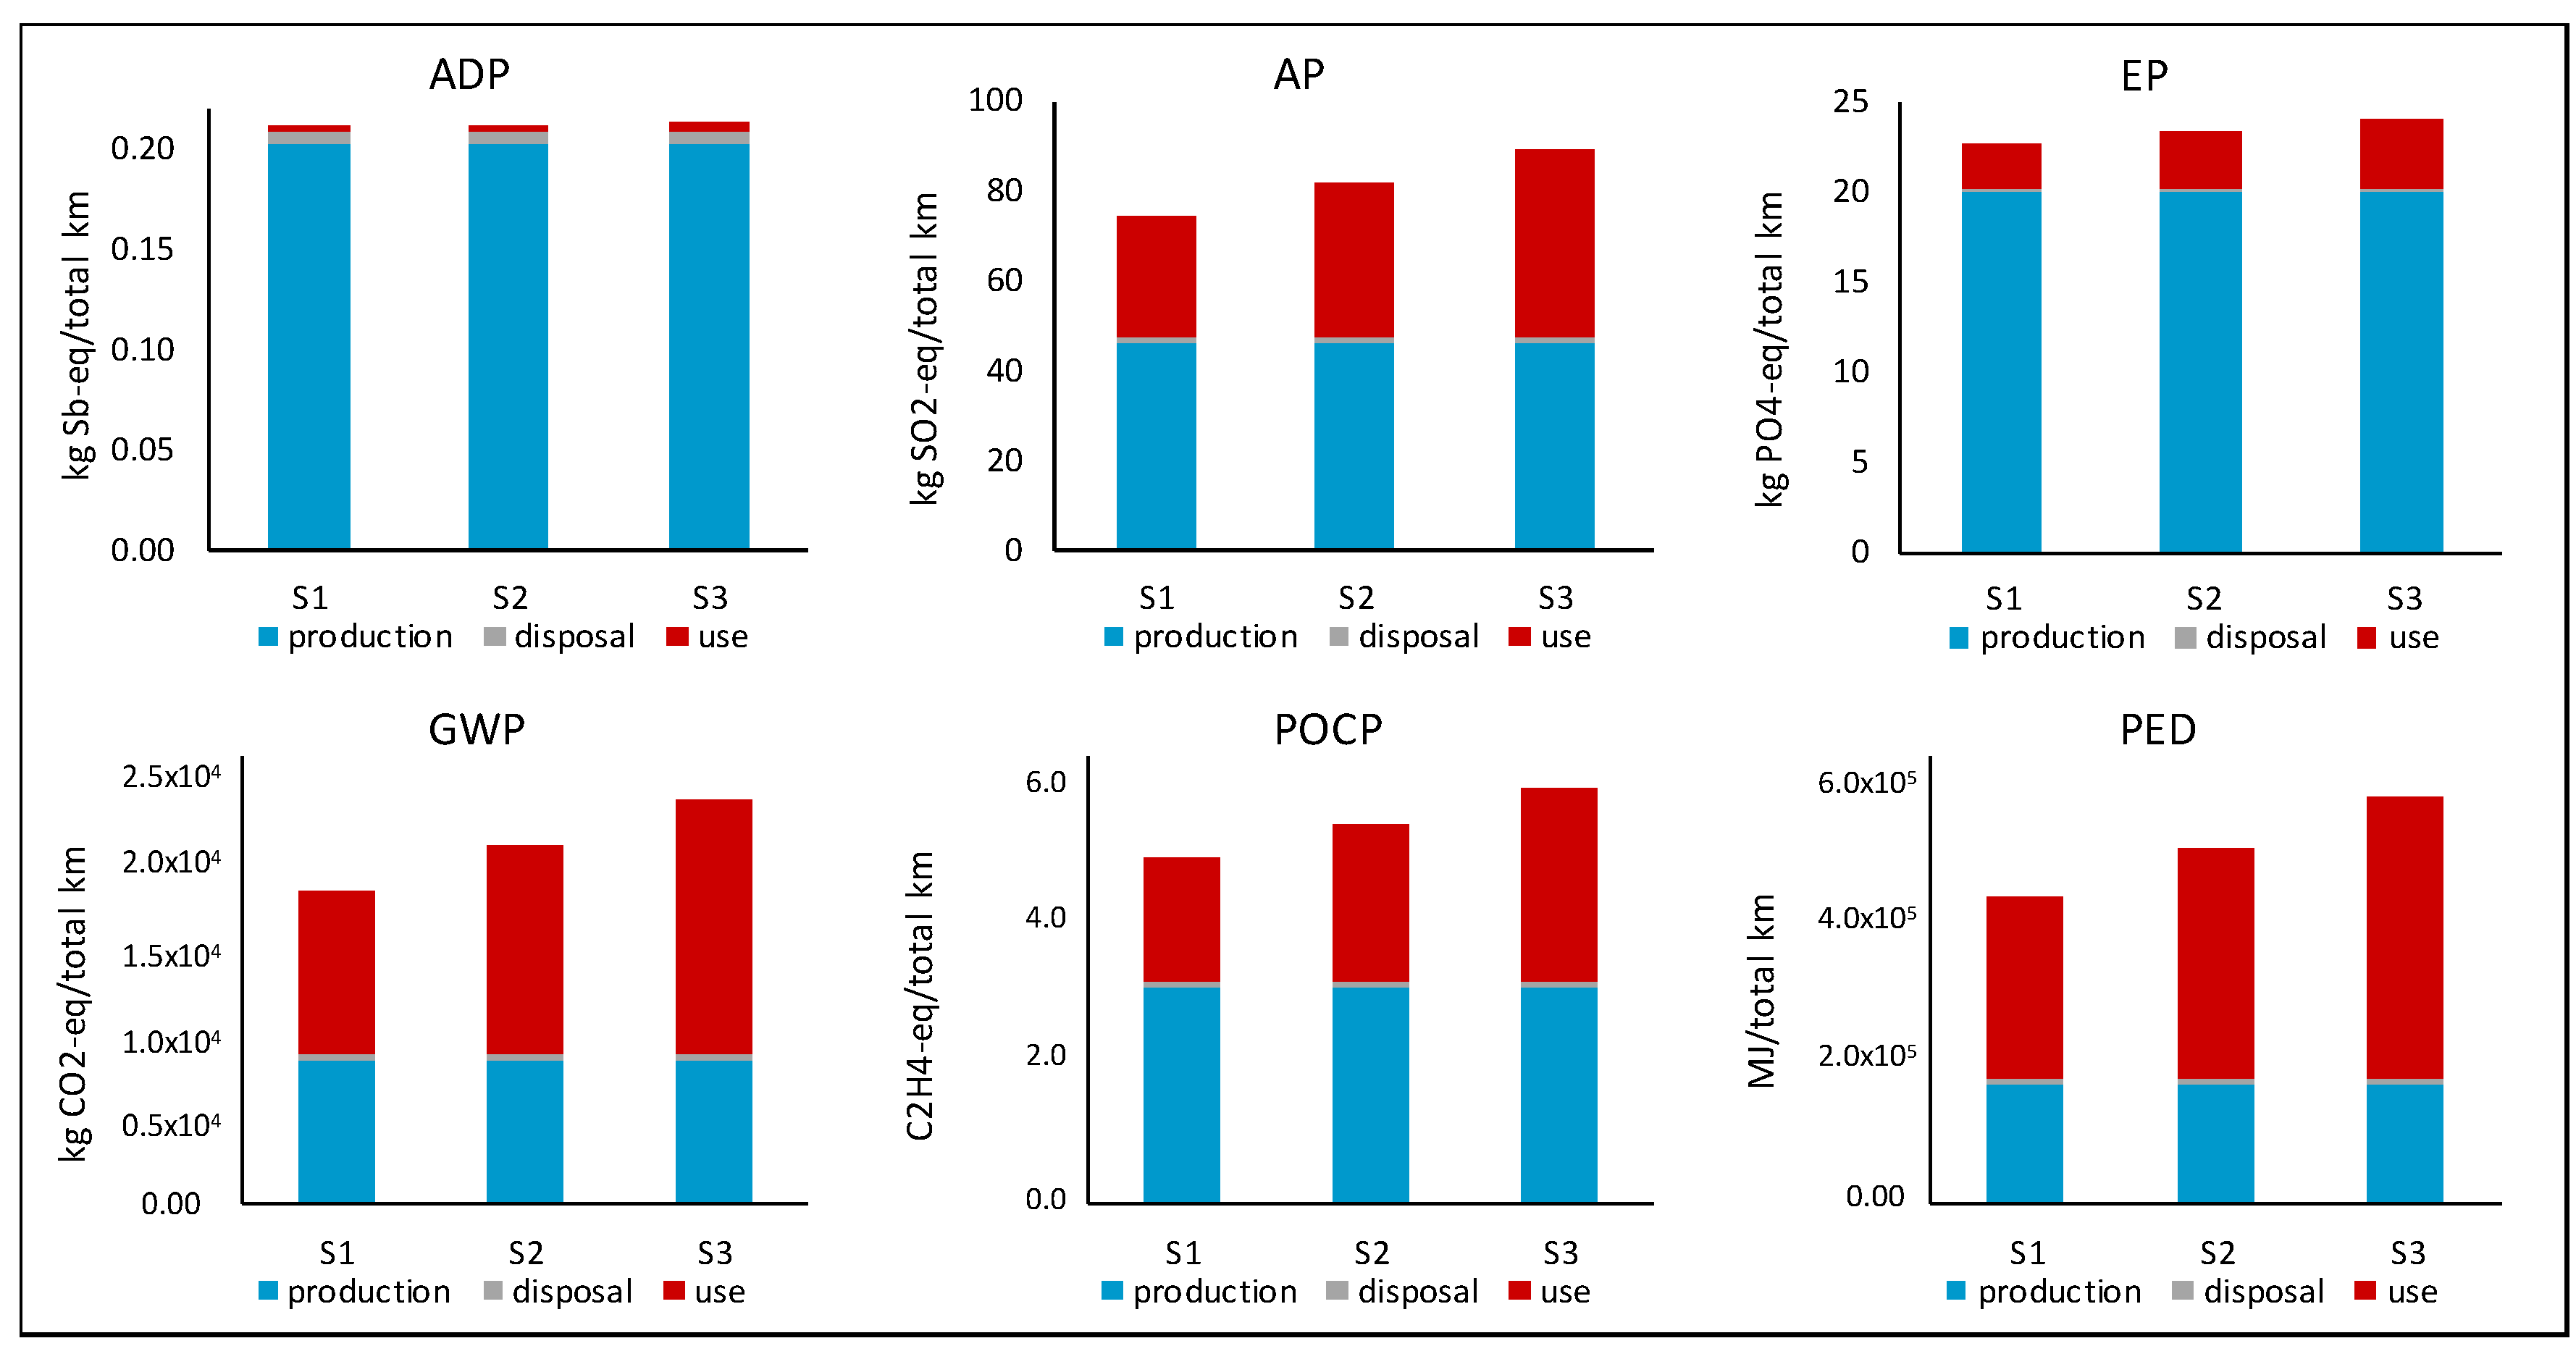
Figure 7 shows the impact per total kilometers achieved for each scenario defined in Table 6 and for all impact categories assessed as described in Table 4. The figure also shows the contribution of the production, use and disposal life cycle stages to the overall result. As can be seen, the production and disposal stages are the same for all scenarios. This is due to the fact that only one battery was considered for each scenario. For the use phase, however, the impact for each scenario differs depending on the quantified energy required as calculated with Equation (7). The energy required is dependent on the total number of cycles the battery is able to achieve before reaching its defined End-of-Life of 60% SoH. Therefore, the life cycle environmental impact of the Li-S battery changes based on the number of cycles (and hence the total kilometers) the battery is able to achieve. However, the amount of this change differs depending on the impact category being assessed. For example, the contribution of the use phase to the ADP elements (referred to as ADP from here forward) is insignificant compared to the production stage and therefore changes in the use phase will not significantly change the overall result.
For all the other impact categories assessed (AP, EP, GWP, POCP, PED), however, the use phase has a more significant contribution to the overall result than seen for ADP. Thus, the result for these impact categories increases with an increase in the number of cycles achieved, as defined in each scenario. It can further be seen for these impact categories that the production phase also has a contribution to the overall result, and thus both the production and use life cycle stages are important for quantification of the overall environmental impact for these impact categories.
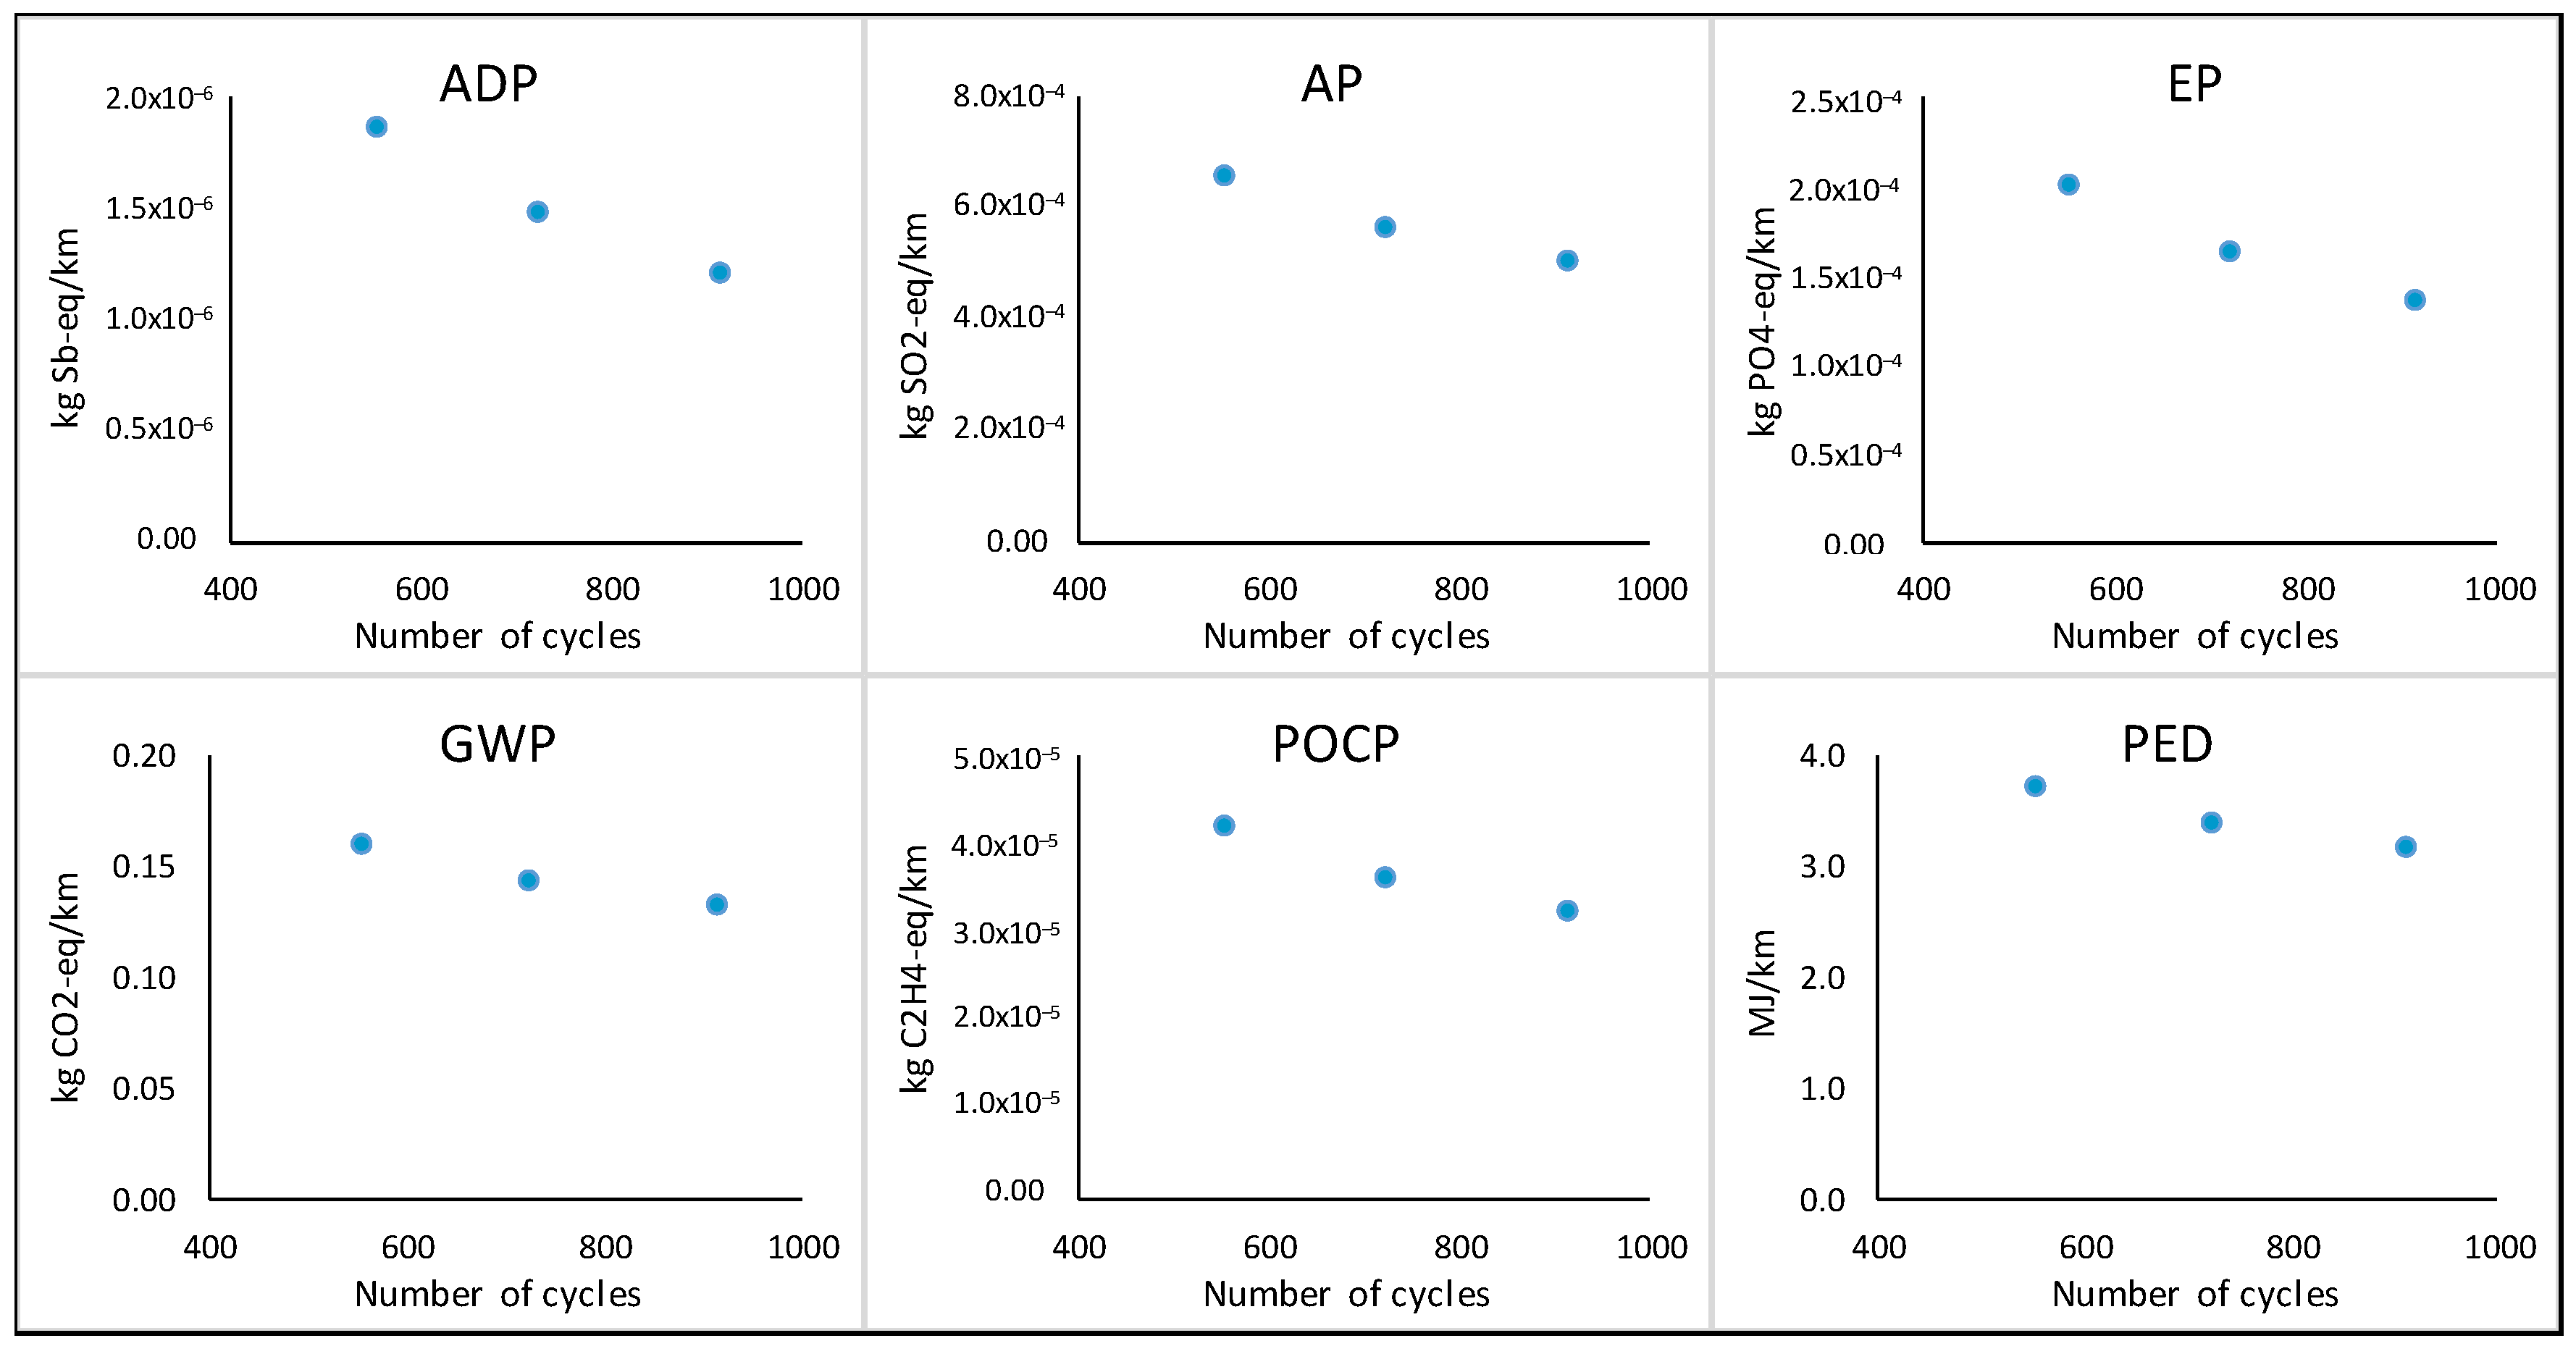
In order to see the environmental benefits of the extended lifespan of the battery due to more cycles being achieved, it is necessary to look at the results per functional unit of 1 km (Figure 8). In Figure 8, the trend clearly shows that as the number of cycles achievable by the battery improves from 552 towards 912 cycles, the impact per km also improves. Table 7 further summarizes the results per functional unit (per km) and per reference flow (per total km for one battery).
Therefore, for the use phase, improvements in the environmental impact will come from extending the lifespan of the battery, as well as from the improvement in efficiencies and decarbonization of the electricity grid mix, as discussed in the introduction. Furthermore, it is shown that one 50 kWh Li-S battery, taking into consideration the effects from cycle ageing, has the potential to reach the 150,000 km reference that is often used in comparative LCA studies for EVs and ICEVs.
Since it was further found that the production phase also contributes to the results (
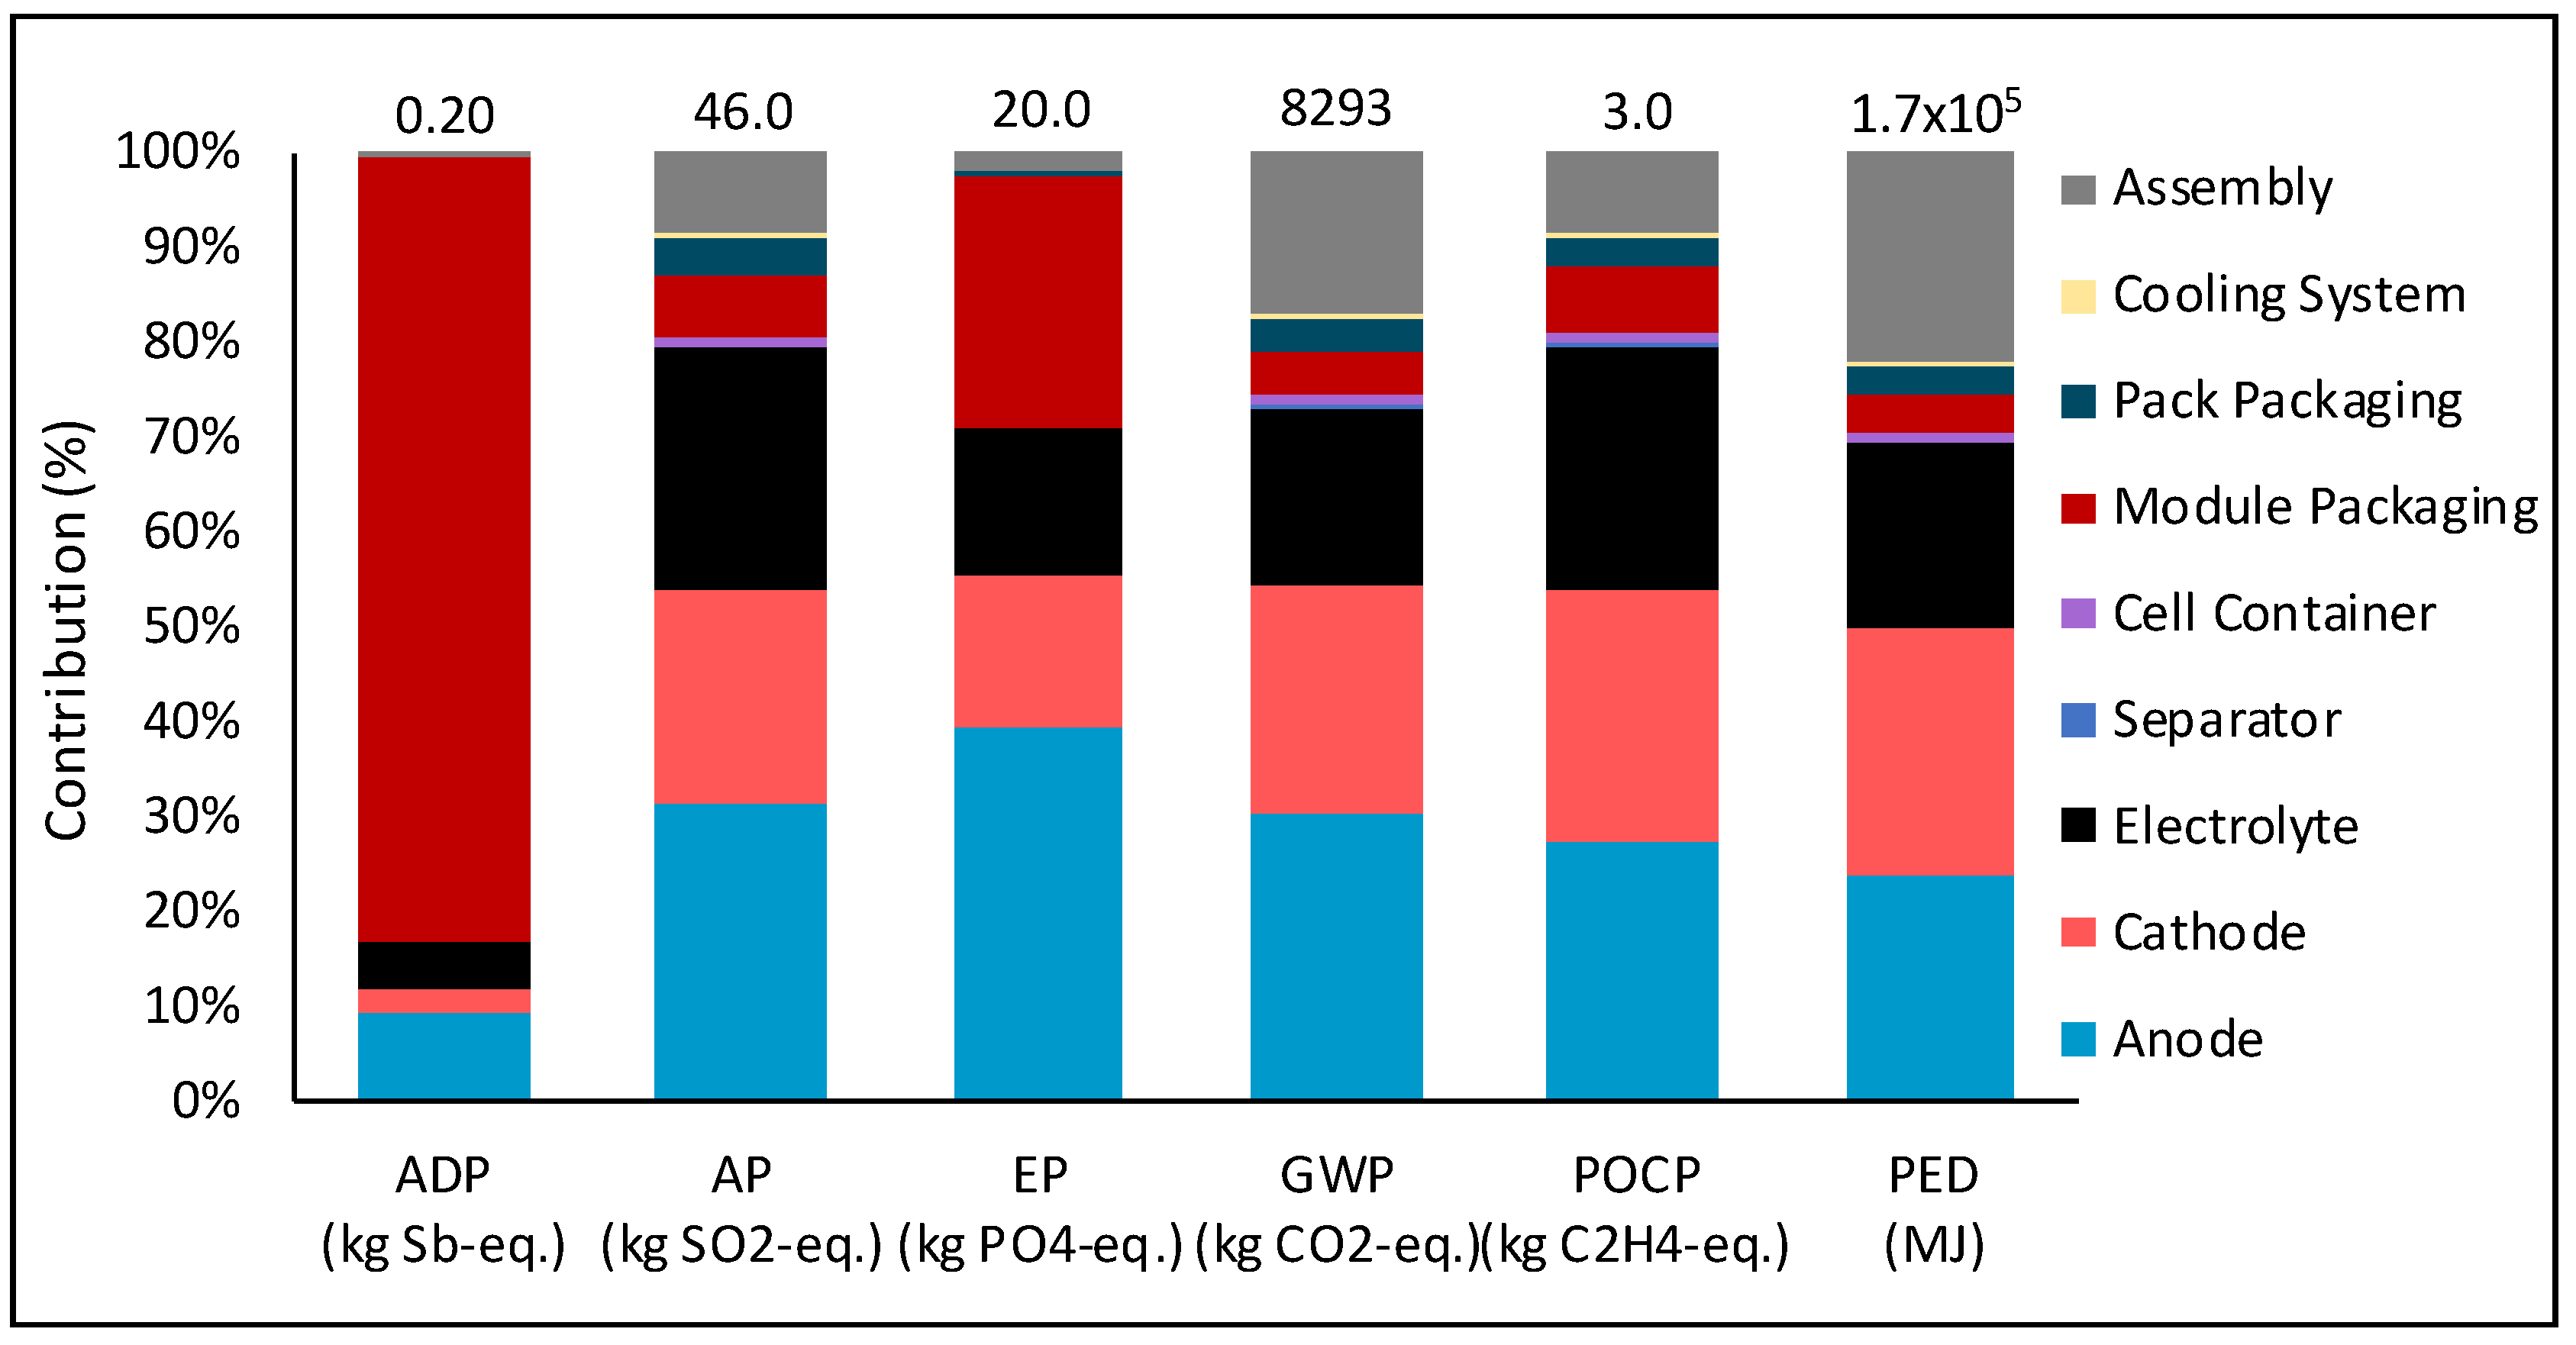
Figure 7), the contribution of the battery components to the production phase was further investigated. Figure 9 shows the percent contribution of each component to the total result due to production of the battery. The material components are defined in the bill of materials in Table 3.
From 
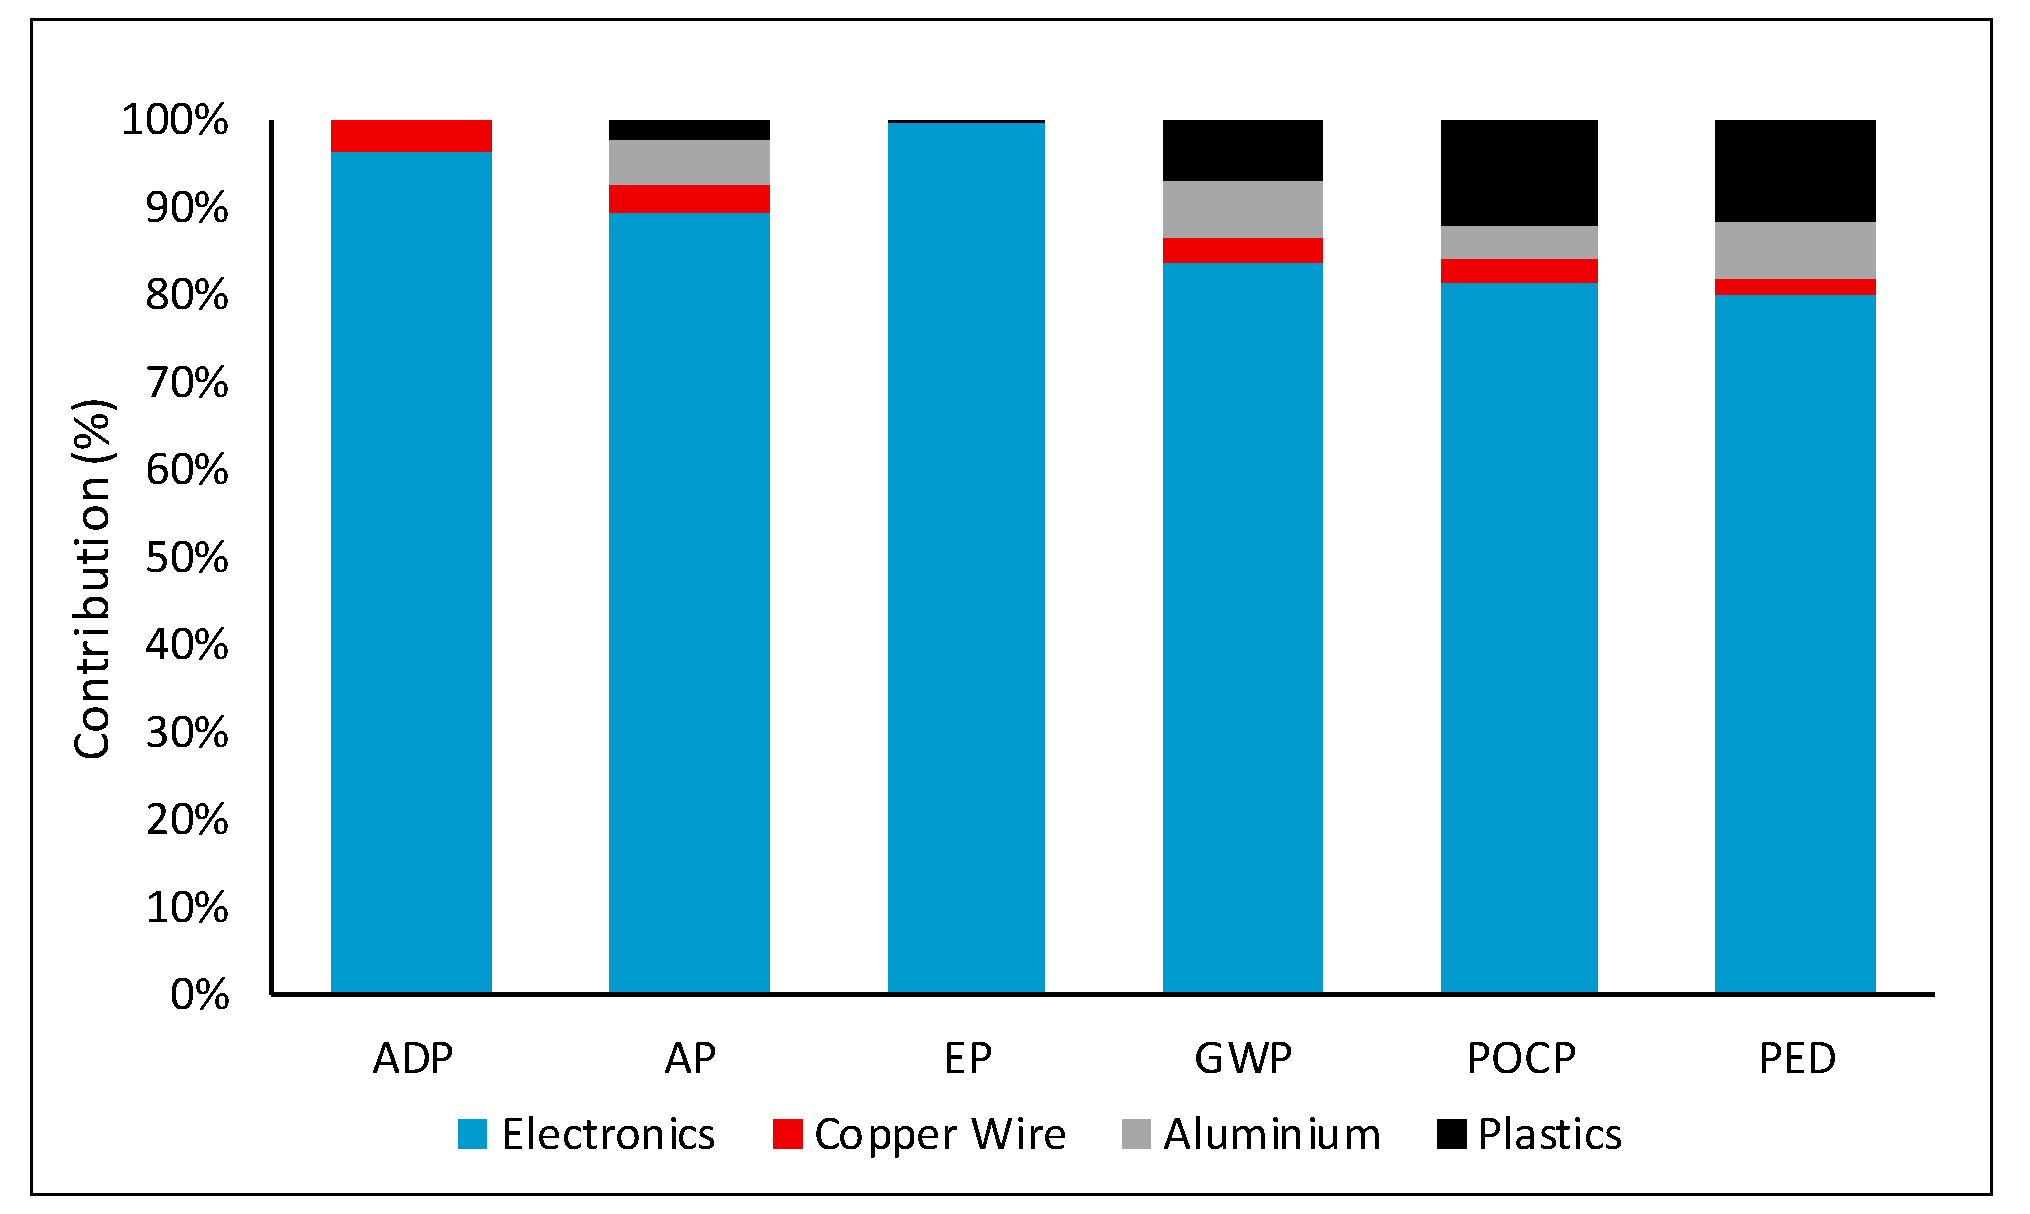
Figure 9., the module packaging contributes significantly to the ADP. The module packaging consists of electronic components, the contribution of which was found to range from 80% to 99% of the total impact of the module packaging production depending on the impact category (Figure 10). A complete list of the components of the module packaging can be found in [43]. Therefore, the main contributing component to the ADP, which was found to come from the production stage (Figure 7), is due to the electronic components in the modular packaging (Figure 9 and Figure 10).
For all other impact categories, the contribution of the active material (cathode, anode and electrolyte) is greater than 70% to the total impact of battery production (Figure 9). This material has been scaled from that in a coin cell with the use of Equations (3)–(6). Therefore, this data should be updated when more tests are conducted on Li-S batteries and more data is available for the composition and performance of larger batteries. This is important as the production of the battery contributes to the overall result for all impact categories, as was seen in Figure 7. Therefore, improvements in this data will influence the overall result for each of the environmental impact categories assessed.

4. Conclusions

This work presented the results for ageing tests conducted on Li-S coin cells. These results were used to discuss the second-life battery applications and were further applied in an environmental attributional LCA case study for the use of a 50 kWh Li-S battery in an electric vehicle.
After analyzing the results from the endurance ageing tests, it seems that Li-S batteries do not follow the same patterns of Li-ion batteries. It was found that the temperature and C-rate seem to produce no acceleration of ageing, and that there is no dramatic change in the ageing tendency as is seen in Li-ion batteries when they reach the “ageing knee” or “sudden death.” For Li-S batteries, the cells either continue to cycle or crash instantaneously, meaning they can no longer absorb or deliver energy. Furthermore, the efficiency of Li-S batteries decreases constantly, that is, an exponential loss of efficiency is not visible which is in contrast to the behavior of Li-ion batteries. From an ageing perspective, these factors make Li-S batteries preferable to Li-ion batteries, as their behavior appears “more predictable” and they seem to be unaltered due to external factors related to the application environment.
In terms of battery second life applications, this may not be foreseen for Li-S batteries. Future batteries are expected to have larger capacities of up to the 50 kWh as described in this study, and thus the End-of-Life of the battery in an EV (first life) could be lower than the targeted 80% SoH (60% or even lower) and still be capable of satisfying all the driving needs up until the car is recycled. Therefore, it is not only the inherent complexities of their normal operability that limits the second life applications, but also both the low SoH at the beginning of the second life corresponding to a lower capacity and the fact that the batteries will be quite old (possibly 15 years old) at the end of the first life. In this duration, newer and more interesting batteries will likely be on the market at reasonable prices.
In terms of the LCA case study conducted for a 50 kWh Li-S battery, it was found that both the production and use stages of the life cycle contribute to the overall environmental impact for all impact categories assessed, except for resource depletion (ADP) where the production stage is the key contributor. For the use phase, three scenarios for the cycle life of the battery were defined based on the ageing test results conducted on Li-S cells. It was found here that the 50 kWh Li-S battery has the potential to achieve the 150,000km usually defined in LCA case studies of EVs. For the production stage of the life cycle, the active material in the battery (anode, cathode and electrolyte) contributes greater than 70% to all impact categories assessed except for resource depletion (ADP) where the electronics in the module packaging is the largest contributor. It is noted here that the data quality for scaling the active material from a coin cell to that in a 50 kWh battery will be improved and should be updated in the LCA as better data from larger batteries is available, along with the efficiencies and driving ranges defined for the Li-S technology. However, in this study it was shown that with improvements in the Li-S technology, the environmental impact per kilometer will improve as the number of cycles the battery achieves during its first life improves. Furthermore, the use of laboratory data for the ageing of Li-S cells in an LCA study is a step forward for the assessment of the environmental impact of this technology.

Author Contributions

Conceptualization, C.C.; Data curation, L.C.C.; Formal analysis, D.W. and L.C.C.; Funding acquisition, C.C.; Investigation, D.W., L.C.C., G.B. and L.T.; Methodology, D.W. and G.B.; Project administration, G.B., C.C .and L.T.; Resources, G.B. and L.T.; Software, G.B.; Supervision, C.C.; Validation, C.C.; Visualization, D.W. and L.C.C.; Writing—original draft, D.W. and L.C.C.; Writing—review and editing, D.W., L.C.C., G.B., C.C. and L.T.

Funding

This research received funding from the European Union’s Horizon 2020 research and innovation programme under Grant Agreement No 666221 (www.helis-project.eu). C. Corchero’s work is supported by the grant IJCI-2015-26650 (MICINN).

Acknowledgments

We would like to acknowledge ACCUREC for their contribution of data for the recycling process of the Li-S cells.

Conflicts of Interest

The authors declare no conflict of interest.

References

  1. Sierzchula, W.; Bakker, S.; Maat, K.; Van Wee, B. The influence of financial incentives and other socio-economic factors on electric vehicle adoption. Energy Policy 2014, 68, 183–194. [Google Scholar] [CrossRef]
  2. Ortar, N.; Ryghaug, M. Should All Cars Be Electric by 2025? The Electric Car Debate in Europe. Sustainability 2019, 11, 1868. [Google Scholar] [CrossRef]
  3. Uribe-Toril, J.; Ruiz-Real, J.; Milán-García, J.; de Pablo Valenciano, J. Energy, Economy, and Environment: A Worldwide Research Update. Energies 2019, 12, 1120. [Google Scholar] [CrossRef]
  4. European Commission Implementation of the Circular Economy Action Plan. Available online: http://ec.europa.eu/environment/circular-economy/index_en.htm (accessed on 28 May 2019).
  5. Nordelöf, A.; Messagie, M.; Tillman, A.-M.; Ljunggren Söderman, M.; Van Mierlo, J. Environmental impacts of hybrid, plug-in hybrid, and battery electric vehicles—What can we learn from life cycle assessment? Int. J. Life Cycle Assess. 2014, 19, 1866–1890. [Google Scholar] [CrossRef]
  6. ISO 14044:2006 Environmental management—Life Cycle Assessment—Requirements and Guidelines; ISO: Geneva, Switzerland, 2006.
  7. Rangaraju, S.; De Vroey, L.; Messagie, M.; Mertens, J.; Van Mierlo, J. Impacts of electricity mix, charging profile, and driving behavior on the emissions performance of battery electric vehicles: A Belgian case study. Appl. Energy 2015, 148, 496–505. [Google Scholar] [CrossRef]
  8. Bradley, T.H.; Frank, A.A. Design, demonstrations and sustainability impact assessments for plug-in hybrid electric vehicles. Renew. Sustain. Energy Rev. 2009, 13, 115–128. [Google Scholar] [CrossRef]
  9. Egede, P.; Dettmer, T.; Herrmann, C.; Kara, S. Life Cycle Assessment of Electric Vehicles—A Framework to Consider Influencing Factors. Procedia CIRP 2015, 29, 233–238. [Google Scholar] [CrossRef]
  10. Faria, R.; Marques, P.; Moura, P.; Freire, F.; Delgado, J.; De Almeida, A.T. Impact of the electricity mix and use profile in the life-cycle assessment of electric vehicles. Renew. Sustain. Energy Rev. 2013, 24, 271–287. [Google Scholar] [CrossRef]
  11. Girardi, P.; Gargiulo, A.; Brambilla, P.C. A comparative LCA of an electric vehicle and an internal combustion engine vehicle using the appropriate power mix: The Italian case study. Int. J. Life Cycle Assess. 2015, 1127–1142. [Google Scholar] [CrossRef]
  12. Jochem, P.; Babrowski, S.; Fichtner, W. Assessing CO2 emissions of electric vehicles in Germany in 2030. Transp. Res. Part A Policy Pract. 2015, 78, 68–83. [Google Scholar] [CrossRef]
  13. Almeida, A.; Sousa, N. Quest for Sustainability: Life-Cycle Emissions Assessment of Electric Vehicles Considering Newer Li-Ion Batteries. Sustainability 2019, 11, 2366. [Google Scholar] [CrossRef]
  14. Cusenza, M.A.; Guarino, F.; Longo, S.; Mistretta, M.; Cellura, M. Reuse of electric vehicle batteries in buildings: An integrated load match analysis and life cycle assessment approach. Energy Build. 2019, 186, 339–354. [Google Scholar] [CrossRef]
  15. Saxena, S.; Le Floch, C.; Macdonald, J.; Moura, S. Quantifying EV battery end-of-life through analysis of travel needs with vehicle powertrain models. J. Power Sources 2015, 282, 265–276. [Google Scholar] [CrossRef] [Green Version]
  16. Shi, X.; Pan, J.; Wang, H.; Cai, H. Battery electric vehicles: What is the minimum range required? Energy 2019, 166, 352–358. [Google Scholar] [CrossRef]
  17. Reinhardt, R.; Christodoulou, I.; Gassó-Domingo, S.; Amante García, B. Towards sustainable business models for electric vehicle battery second use: A critical review. J. Environ. Manag. 2019, 126, 432–446. [Google Scholar] [CrossRef] [PubMed]
  18. Canals Casals, L.; Amante García, B.; Cremades, L. V Electric Vehicle Battery Reuse: Preparing for a Second Life. J. Ind. Eng. Manag. 2017, 10, 266–285. [Google Scholar] [CrossRef]
  19. Gohla-Neudecker, B.; Bowler, M.; Mohr, S. Battery 2nd life: Leveraging the sustainability potential of EVs and renewable energy grid integration. In Proceedings of the 5th International Conference on Clean Electrical Power: Renewable Energy Resources Impact (ICCEP), Taormina, Italy, 16–18 June 2015. [Google Scholar]
  20. Canals Casals, L.; Amante García, B.; Canal, C. Second life batteries lifespan: Rest of useful life and environmental analysis. J. Environ. Manag. 2019, 232, 354–363. [Google Scholar] [CrossRef] [PubMed]
  21. Zhang, C.; Marco, J.; Fai Yu, T. Hardware Platform Design of Small Energy Storage System Using Second Life Batteries. In Proceedings of the 2018 UKACC 12th International Conference on Control (CONTROL), Sheffield, UK, 5–7 September 2018. [Google Scholar]
  22. Lee, K.; Kum, D. Development of cell selection framework for second-life cells with homogeneous properties. Int. J. Electr. Power Energy Syst. 2019. [Google Scholar] [CrossRef]
  23. Pistoia, G.; Liaw, B. Behaviour of Lithium-Ion Batteries in Electric Vehicles; Green Energy Action Alliance: Toronto, ON, Canada, 2018; ISBN 9783319699493. [Google Scholar]
  24. Hossain, E.; Murtaugh, D.; Mody, J.; Faruque, H.M.R.; Haque Sunny, M.S.; Mohammad, N. A Comprehensive Review on Second-Life Batteries: Current State, Manufacturing Considerations, Applications, Impacts, Barriers & Potential Solutions, Business Strategies, and Policies. IEEE Access 2019, 7, 73215–73252. [Google Scholar]
  25. Anderman, M. Assessing the Future of Hybrid and Electric Vehicles: The xEV Industry Insider Report. Adv. Automot. Batter. 2014, 1–161. [Google Scholar]
  26. Olivetti, E.A.; Ceder, G.; Gaustad, G.G.; Fu, X. Lithium-Ion Battery Supply Chain Considerations: Analysis of Potential Bottlenecks in Critical Metals. Joule 2017, 1, 229–243. [Google Scholar] [CrossRef] [Green Version]
  27. Raugei, M.; Winfield, P. Prospective LCA of the production and EoL recycling of a novel type of Li-ion battery for electric vehicles. J. Clean. Prod. 2019, 213, 926–932. [Google Scholar] [CrossRef]
  28. Fang, X.; Peng, H. A Revolution in Electrodes: Recent Progress in Rechargeable Lithium-Sulfur Batteries. Small 2015, 11, 1488–1511. [Google Scholar] [CrossRef] [PubMed]
  29. Barchasz, C.; Molton, F.; Duboc, C.; Leprêtre, J.-C.; Patoux, S.; Alloin, F. Lithium/Sulfur Cell Discharge Mechanism: An Original Approach for Intermediate Species Identification. Anal. Chem. 2012, 84, 3973–3980. [Google Scholar] [CrossRef] [PubMed]
  30. Benveniste, G.; Rallo, H.; Canals Casals, L.; Merino, A.; Amante, B. Comparison of the state of Lithium-Sulphur and lithium-ion batteries applied to electromobility. J. Environ. Manag. 2018, 226, 1–12. [Google Scholar] [CrossRef] [PubMed] [Green Version]
  31. Ding, Y.; Cano, Z.P.; Yu, A.; Lu, J.; Chen, Z. Automotive Li-Ion Batteries: Current Status and Future Perspectives. Electrochem. Energy Rev. 2019, 2, 1–28. [Google Scholar] [CrossRef]
  32. H2020 Helis Project. Available online: https://www.helis-project.eu/ (accessed on 28 May 2019).
  33. Tang, Q.; Shan, Z.; Wang, L.; Qin, X.; Zhu, K.; Tian, J.; Liu, X. Nafion coated sulfur-carbon electrode for high performance lithium-sulfur batteries. J. Power Sources 2014, 246, 253–259. [Google Scholar] [CrossRef]
  34. Propp, K.; Marinescu, M.; Auger, D.J.; Neill, L.O.; Fotouhi, A.; Somasundaram, K.; Offer, G.J.; Minton, G.; Longo, S.; Wild, M.; et al. Multi-temperature state-dependent equivalent circuit discharge model for lithium-sulfur batteries. J. Power Sources 2016, 328, 289–299. [Google Scholar] [CrossRef] [Green Version]
  35. Fotouhi, A.; Auger, D.J.; Member, S.; Propp, K.; Member, S.; Purkayastha, R.; Neill, L.O.; Walus, S. Lithium-Sulfur Cell Equivalent Circuit Network Model Parameterization and Sensitivity Analysis. IEEE Trans. Veh. Technol. 2017, 66, 7711–7721. [Google Scholar] [CrossRef]
  36. Huria, T.; Ceraolo, M.; Gazzarri, J.; Jackey, R. High Fidelity Electrical Model with Thermal Dependence for Characterization and Simula- tion of High Power Lithium Battery Cells. In Proceedings of the Electric Vehicle Conference (IEVC), Greenville, SC, USA, 4–8 March 2012. [Google Scholar]
  37. Schweiger, H.-G.; Obeidi, O.; Komesker, O.; Raschke, A.; Schiemann, M.; Zehner, C.; Gehnen, M.; Keller, M.; Birke, P. Comparison of several methods for determining the internal resistance of lithium ion cells. Sensors (Basel) 2010, 10, 5604–5625. [Google Scholar] [CrossRef]
  38. Kolosnitsyn, V.S.; Kuzmina, E.V.; Mochalov, S.E. Determination of lithium sulphur batteries internal resistance by the pulsed method during galvanostatic cycling. J. Power Sources 2014, 252, 28–34. [Google Scholar] [CrossRef]
  39. Zhu, X.; Wang, Z.; Wang, C.; Huang, L. Overcharge Investigation of Large Format Lithium-Ion Pouch Cells with Li(Ni 0.6 Co 0.2 Mn 0.2)O 2 Cathode for Electric Vehicles: Degradation and Failure Mechanisms. J. Electrochem. Soc. 2018, 165, A3613–A3629. [Google Scholar] [CrossRef]
  40. Wagner, N.; Eneli, H.; Ballauff, M.; Friedrich, K.A. Correlation of capacity fading processes and electrochemical impedance spectra in lithium / sulfur cells. J. Power Sources 2016, 323, 107–114. [Google Scholar]
  41. Stroe, D.I.; Knap, V.; Swierczynski, M.; Schaltz, E. Electrochemical impedance spectroscopy-based electric circuit modeling of lithium-sulfur batteries during a discharging state. IEEE Trans. Ind. Appl. 2019, 55, 631–637. [Google Scholar] [CrossRef]
  42. Canals Casals, L.; Martinez-Laserna, E.; Amante García, B.; Nieto, N. Sustainability analysis of the electric vehicle use in Europe for CO2 emissions reduction. J. Clean. Prod. 2016, 127, 425–437. [Google Scholar] [CrossRef]
  43. Deng, Y.; Li, J.; Li, T.; Gao, X.; Yuan, C. Life cycle assessment of lithium sulfur battery for electric vehicles. J. Power Sources 2017, 343, 284–295. [Google Scholar] [CrossRef] [Green Version]
  44. Hawkins, T.R.; Singh, B.; Majeau-Bettez, G.; Strømman, A.H. Comparative Environmental Life Cycle Assessment of Conventional and Electric Vehicles. J. Ind. Ecol. 2013, 17, 53–64. [Google Scholar] [CrossRef]
  45. Zhang, S.S. Improved cyclability of liquid electrolyte lithium/sulfur batteries by optimizing electrolyte/sulfur ratio. Energies 2012, 5, 5190–5197. [Google Scholar] [CrossRef]
  46. Shang, X.; Guo, P.; Qin, T.; Liu, M.; Lv, M.; Liu, D.; He, D. Sulfur Immobilizer by Nanoscale TiO2 Trapper Deposited on Hierarchical Porous Carbon and Graphene for Cathodes of Lithium–Sulfur Batteries. Adv. Mater. Interfaces 2018, 5, 1–8. [Google Scholar] [CrossRef]
  47. Knap, V.; Stroe, D.-I.; Purkayastha, R.; Walus, S.; Auger, D.J.; Fotouhi, A.; Propp, K. Reference Performance Test Methodology for Degradation Assessment of Lithium-Sulfur Batteries. J. Electrochem. Soc. 2018, 165, A1601–A1609. [Google Scholar] [CrossRef] [Green Version]
  48. Hunt, I.; Zhang, T.; Patel, Y.; Marinescu, M.; Purkayastha, R.; Kovacik, P.; Walus, S.; Swiatek, A.; Offer, G.J. The Effect of Current Inhomogeneity on the Performance and Degradation of Li-S Batteries. J. Electrochem. Soc. 2018, 165, A6073–A6080. [Google Scholar] [CrossRef]
  49. Barré, A.; Deguilhem, B.; Grolleau, S.; Gérard, M.; Suard, F.; Riu, D. A review on lithium-ion battery ageing mechanisms and estimations for automotive applications. J. Power Sources 2013, 241, 680–689. [Google Scholar] [CrossRef] [Green Version]
  50. Vetter, J.; Nov, P.; Wagner, M.R.R.; Veit, C.; Novák, P.; Möller, K.-C.; Besenhard, J.O.; Winter, M.; Wohlfahrt-Mehrens, M.; Vogler, C.; et al. Ageing mechanisms in lithium-ion batteries. J. Power Sources 2005, 147, 269–281. [Google Scholar] [CrossRef]
  51. Baghdadi, I.; Briat, O.; Delétage, J.Y.; Gyan, P.; Vinassa, J.M. Lithium battery aging model based on Dakin’s degradation approach. J. Power Sources 2016, 325, 273–285. [Google Scholar] [CrossRef]
  52. Waldmann, T.; Wilka, M.; Kasper, M.; Fleischhammer, M.; Wohlfahrt-Mehrens, M. Temperature dependent ageing mechanisms in Lithium-ion batteries – A Post-Mortem study. J. Power Sources 2014, 262, 129–135. [Google Scholar] [CrossRef]
  53. Li, J.; Zhang, J.; Zhang, X.; Yang, C.; Xu, N.; Xia, B. Study of the storage performance of a Li-ion cell at elevated temperature. Electrochim. Acta 2010, 55, 927–934. [Google Scholar] [CrossRef]
  54. Ecker, M.; Gerschler, J.B.; Vogel, J.; Käbitz, S.; Hust, F.; Dechent, P.; Sauer, D.U. Development of a lifetime prediction model for lithium-ion batteries based on extended accelerated aging test data. J. Power Sources 2012, 215, 248–257. [Google Scholar] [CrossRef]
  55. Warnecke, A. Ageing effects of Lithium-ion batteries. In Proceedings of the 17th Conference on Power Electronics and Applications, Geneva, Switzerland, 8–10 September 2015. [Google Scholar]
  56. Wikner, E.; Thiringer, T. Extending Battery Lifetime by Avoiding High SOC. Appl. Sci. 2018, 8, 1825. [Google Scholar] [CrossRef]
  57. Martinez-Laserna, E.; Sarasketa-Zabala, E.; Villarreal, I.; Stroe, D.I.; Swierczynski, M.; Warnecke, A.; Timmermans, J.-M.; Goutam, S.; Omar, N.; Rodriguez, P. Technical Viability of Battery Second Life: A Study from the Ageing Perspective. IEEE Trans. Ind. Appl. 2018, 54, 2703–2713. [Google Scholar] [CrossRef]
  58. Ecker, M.; Nieto, N.; Käbitz, S.; Schmalstieg, J.; Blanke, H.; Warnecke, A.; Sauer, D.U. Calendar and cycle life study of Li(NiMnCo)O2-based 18650 lithium-ion batteries. J. Power Sources 2014, 248, 839–851. [Google Scholar] [CrossRef]
  59. Canals Casals, L.; Amante García, B.; Castellà Dagà, S. The electric vehicle battery ageing and how it is perceived by its driver | El envejecimiento de las baterías de un vehículo eléctrico y cómo lo percibe el conductor. Dyna 2016, 91, 188–195. [Google Scholar] [CrossRef]
  60. Canals Casals, L.; Amante García, B.; González Benítez, M. Aging Model for Re-used Electric Vehicle Batteries in Second Life Stationary Applications. In Lecture Notes in Management and Industrial Engineering; Springer International Publishing: Cham, Switzerland, 2017; pp. 139–151. ISBN 978-3-319-51858-9. [Google Scholar]
  61. Moy, D.; Manivannan, A.; Narayanan, S.R. Direct Measurement of Polysulfide Shuttle Current: A Window into Understanding the Performance of Lithium-Sulfur Cells. J. Electrochem. Soc. 2015, 162, A1–A7. [Google Scholar] [CrossRef]
  62. Hofmann, A.F.; Fronczek, D.N.; Bessler, W.G. Mechanistic modeling of polysulfide shuttle and capacity loss in lithium–sulfur batteries. J. Power Sources 2014, 259, 300–310. [Google Scholar] [CrossRef]
  63. Knap, V.; Stroe, D.-I.; Swierczynski, M.; Teodorescu, R.; Schaltz, E. Investigation of the Self-Discharge Behavior of Lithium-Sulfur Batteries. J. Electrochem. Soc. 2016, 163, A911–A916. [Google Scholar] [CrossRef]
  64. Yang, Y.; Zhang, J. Highly Stable Lithium–Sulfur Batteries Based on Laponite Nanosheet-Coated Celgard Separators. Adv. Energy Mater. 2018, 8, 1–9. [Google Scholar] [CrossRef]
  65. Sedlakova, V.; Sikula, J.; Sedlak, P.; Cech, O.; Urrutia, L. A Simple Analytical Model of Capacity Fading for Lithium-Sulfur Cells. IEEE Trans. Power Electron. 2019, 34, 5779–5786. [Google Scholar] [CrossRef]
Figure 1. Image of the testing equipment.
Energies 12 02440 g001
Figure 2. Charge/discharge voltage profile of a cell cycling at C/5 (left) and at 2C (right).
Energies 12 02440 g002
Figure 3. System boundary for the Life Cycle Assessment (LCA) of the 50 kWh Li-Sulfur (Li-S) Battery.
Energies 12 02440 g003
Figure 4. Electricity grid mix used in the LCA (EU-28 mix). Source: Adapted from GaBi Professional Database.
Energies 12 02440 g004
Figure 5. State of Health (SoH) evolution through cycling.
Energies 12 02440 g005
Figure 6. Evolution of the efficiency of the cells in relation to SoH.
Energies 12 02440 g006
Figure 7. Impact per total kilometers achieved for each scenario defined in Table 6 with a breakdown of the contribution from production, disposal and use phases of the life cycle.
Energies 12 02440 g007
Figure 8. Impact per km for each impact category assessed versus the number of cycles achieved during the lifespan of the battery.
Energies 12 02440 g008
Figure 9. Percent contribution of each component to each impact category for the production of the Li-S battery. The numbers at the top of the stacked columns indicate the total value.
Energies 12 02440 g009
Figure 10. Percent contribution of the components of the module packaging to the result for each impact category.
Energies 12 02440 g010
Table 1. Initial capacity of cells.
Cell NumberInitial Capacity (mAh)
J11.97
J41.18
J260.83
J320.92
J330.68
SAFT2.62
Table 2. Inventory data to calculate Scaling Factor.
SpecificationQuantityUnit
Anode ( M A C C ) 0.0064g
Cathode ( M C C C ) 0.0078g
Electrolyte ( M E l C C ) 0.015g
Mass active material ( M A M ) 0.026g
Mass coin cell ( T M C C ) 3.59g
Capacity ( C C C ) 3.3mAh
Voltage ( V C C ) 2.3V
Capacity Density ( C C C M A M ) 128.4Ah/kg
Gravimetric Energy Density (GED)295.4Wh/kg
Energy Li-S Battery ( E B ) 50kWh
Table 3. Bill of materials for the 50 kWh Li-S battery.
Li-S Battery CompositionQuantityUnitData Source
Cathode ( M C B ) 51.4kgEquation (6)
Anode ( M A B ) 42.0kgEquation (6)
Electrolyte ( M E l B ) 75.9kgEquation (6)
Separator6.9kg[43]
Cell container19.6kg[43]
Module packaging22.6kg[43]
Cooling system27kg[43]
Pack packaging41.8kg[43]
Assembly Energy consumption 112,016MJ[43]
1 average value was used.
Table 4. Description of impact categories assessed.
Impact CategoryCharacterization FactorUnit ModelDescription
Resource DepletionAbiotic Depletion Potential (ADP elements)kg Sb-eq.CML 2001- Jan 2016The depletion of reserves due to the unsustainable extraction of non-renewable minerals
AcidificationAcidification Potential (AP)kg SO2-eq.CML 2001- Jan 2016The emission of substances that lead to the change in soil acidity and ecosystem damage
EutrophicationEutrophication Potential (EP)kg PO4−3-eq.CML 2001- Jan 2016The release of nutrients that lead to growth of algae and cyanobacteria and a relative loss in species diversity
Climate ChangeGlobal Warming Potential (GWP)kg CO2-eq.CML 2001- Jan 2016The emission of greenhouse gases that lead to increased radiative forcing and raise in mean global temperature
Photochemical Ozone FormationPhotochem. Ozone Creation Potential (POCP)kg C2H4-eq.CML 2001- Jan 2016The emission of substances that undergo photochemical reactions to form ozone at ground level which leads to human health impacts and ecosystem damage
Energy DemandPrimary energy demand (ren. and non-ren. resources, PED)MJPED, gross calorific valueThe consumption of both renewable and non-renewable primary energy sources measured prior to processing
Table 5. Initial capacity of cells.
Cell IdentifierEndurance TestShare of Capacity Loss per CycleR2
J1C/5 at –10 °C0.0006990.45%
J4C/2 at –10 °C0.0004988.36%
J262C at RT 10.0008097.96%
J32C/5 at 45 °C0.0010099.60%
J332C at 45 °C0.0005889.61%
SAFTC/10 at RT 10.0006188.62%
Average 0.0005774.29%
1 RT = Room Temperature.
Table 6. Battery cycling scenarios from ageing test results
ScenarioNumber of CyclesCell IdentifierAgeing Test E T   ( kWh ) Distance (km)
S1552J262C at RT22,660113,290
S2722-Average 128,790143,955
S3912J4 C/2 at –10 °C35,350176,750
1 average of all tests.
Table 7. Life Cycle Impact Assessment (LCIA) results per functional unit and per reference flow.
Impact CategoryUnitTotal per Functional Unit 1Total per Reference Flow 2
S1S2S3S1S2S3
ADPkg Sb-eq.1.9 × 10−61.5 × 10−61.2×10–60.20.20.2
APkg SO2-eq.6.6 × 10−45.7 × 10−45.1 ×10–474.581.889.5
EPkg PO4–3-eq.2.0 × 10−41.6 × 10−41.4×10–422.823.424.2
GWPkg CO2-eq.0.160.140.1318,19820,76523,504
POCPkg C2H4-eq.4.2 × 10–53.6 × 10–53.2 × 10–54.85.35.7
PEDMJ3.73.43.2423,641490,775562,595
1 Functional unit is 1 km. 2 Reference flow for S1, S2 and S3 is 113,290, 143,955 and 176,750 km, respectively.

