Article

On the Determination of the Aerodynamic Damping of Wind Turbines Using the Forced Oscillations Method in Wind Tunnel Experiments

1
Institute of Steel Construction of the RWTH Aachen, Mies-van-der-Rohe-Straße 1, 52074 Aachen, Germany
2
Center for Wind and Earthquake Engineering of the RWTH Aachen, Mies-van-der-Rohe-Straße 1, 52074 Aachen, Germany
*
Author to whom correspondence should be addressed.
Submission received: 28 May 2019 / Revised: 14 June 2019 / Accepted: 17 June 2019 / Published: 25 June 2019
(This article belongs to the Special Issue Recent Advances in Aerodynamics of Wind Turbines)

Abstract

:
The development of wind turbine technology has led to higher and larger wind turbines with a higher sensitivity to dynamic effects. One of these effects is the aerodynamic damping, which introduces favorable damping forces in oscillating wind turbines. These forces play an important role in the turbine lifetime, but have not yet been studied systematically in detail. Consequently, this paper studies the plausibility of determining the aerodynamic damping of wind turbines systematically through wind tunnel experiments using the forced oscillation method. To this end, a 1:150 scale model of a prototype wind turbine has been fabricated considering Reynolds number effects on the blades through XFOIL calculations and wind tunnel measurements of airfoil 2D-section models. The resulting tower and wind turbine models have been tested for different operation states. The tower results are approximate and show low aerodynamic damping forces that can be neglected on the safe side. The measured aerodynamic damping forces of the operating turbine are compared to existing analytic approaches and to OpenFAST simulations. The measured values, although generally larger, show good agreement with the calculated ones. It is concluded that wind tunnel forced oscillations experiments could lead to a better characterization of the aerodynamic damping of wind turbines.

1. Introduction

Wind energy has become in recent decades one of the main renewable power generating capacities to reduce the emissions of C O 2 . For instance, wind energy was the second largest power generating capacity in the EU in 2016 with 16.7% of the total generated power [1]. This is partly due to the rapid development of wind turbine technology and multi-megawatt horizontal axis wind turbines (HAWT), which has led to higher hub heights and larger rotor diameters [2]. However, as towers get higher, more slender and more flexible, dynamic and aerodynamic aspects play increasingly a decisive role in the wind turbine behavior and therefore their design.
One of these aerodynamic aspects is the aerodynamic damping. The aerodynamic damping is an aeroelastic force which arises from the interaction between the oscillating wind turbine and the wind flowing around it. If high oscillation amplitudes occur, like in the case of tall onshore wind turbines and offshore wind turbines with monopile foundations, the contribution of the aerodynamic damping to the total damping is significant and beneficial, as the total damping is usually increased. This increase of the total damping leads to a reduction of the HAWT’s oscillation amplitudes and fatigue loading at the lower tower sections, which results in a longer lifespan of the turbines and therefore a more economical energy production.
Consequently, some efforts have been made in the recent past to quantify the aerodynamic damping. This has been done, for example, through application of system identification algorithms to full-scale measurements and monitoring data of offshore wind turbines [3,4,5,6], or through the development of analytic closed-forms with different degrees of detail [7,8,9,10]. Yet in general, it is assumed that the aerodynamic damping is already considered by multi-body simulation software used in the design of wind turbines [8,10,11]. This software runs dynamic simulations of the whole wind turbine system in the time domain, which implicitly considers variations of aerodynamic forces due to structure oscillations (i.e., aeroelastic phenomena). In this case, however, aerodynamic forces and aeroelastic effects can be simulated only as faithfully as given by the accuracy and validity of the underlying models. A more detailed explanation about these subjects is presented in the following section.
Although the modeling of wind turbines for wind tunnel tests has been considerably studied and documented in recent years, few to no wind tunnel studies for the determination of the aerodynamic damping of wind turbines are found in the literature. The study presented in this paper aims to change this by proving the plausibility of determining the aerodynamic damping of wind turbines in wind tunnel measurements through forced oscillations tests. The forced oscillations method has been used for decades in civil engineering to determine the aeroelastic properties of bridge decks and for the study of vortex-induced-vibrations (VIV) of circular chimneys and high buildings among others. One of the main advantages of this method is that the oscillation properties and the incoming wind flow are controlled and can be varied and combined in any desired manner. As a result, any of the different parameters involved in the aeroelastic phenomena can be selected, isolated and studied specifically. The novelty of this study lies in the use of the well established forced oscillations method for the determination of the aerodynamic damping of operating wind turbines. This method can contribute to identifying the main parameters on which the aerodynamic damping is dependent, as well as to describe it more accurately.
In the following, Section 2 presents the state-of-the-art of the aerodynamic damping of wind turbines and introduces the forced oscillations method. Section 3 shows the used wind turbine model, test bench and wind tunnel. Section 4 describes the wind tunnel measurements and the analysis methods. Finally, Section 5 and Section 6 show and discuss the obtained results and give recommendations for a following thorough study of the aerodynamic damping of wind turbines through wind tunnel measurements.

2. State-of-the-Art and Previous Studies

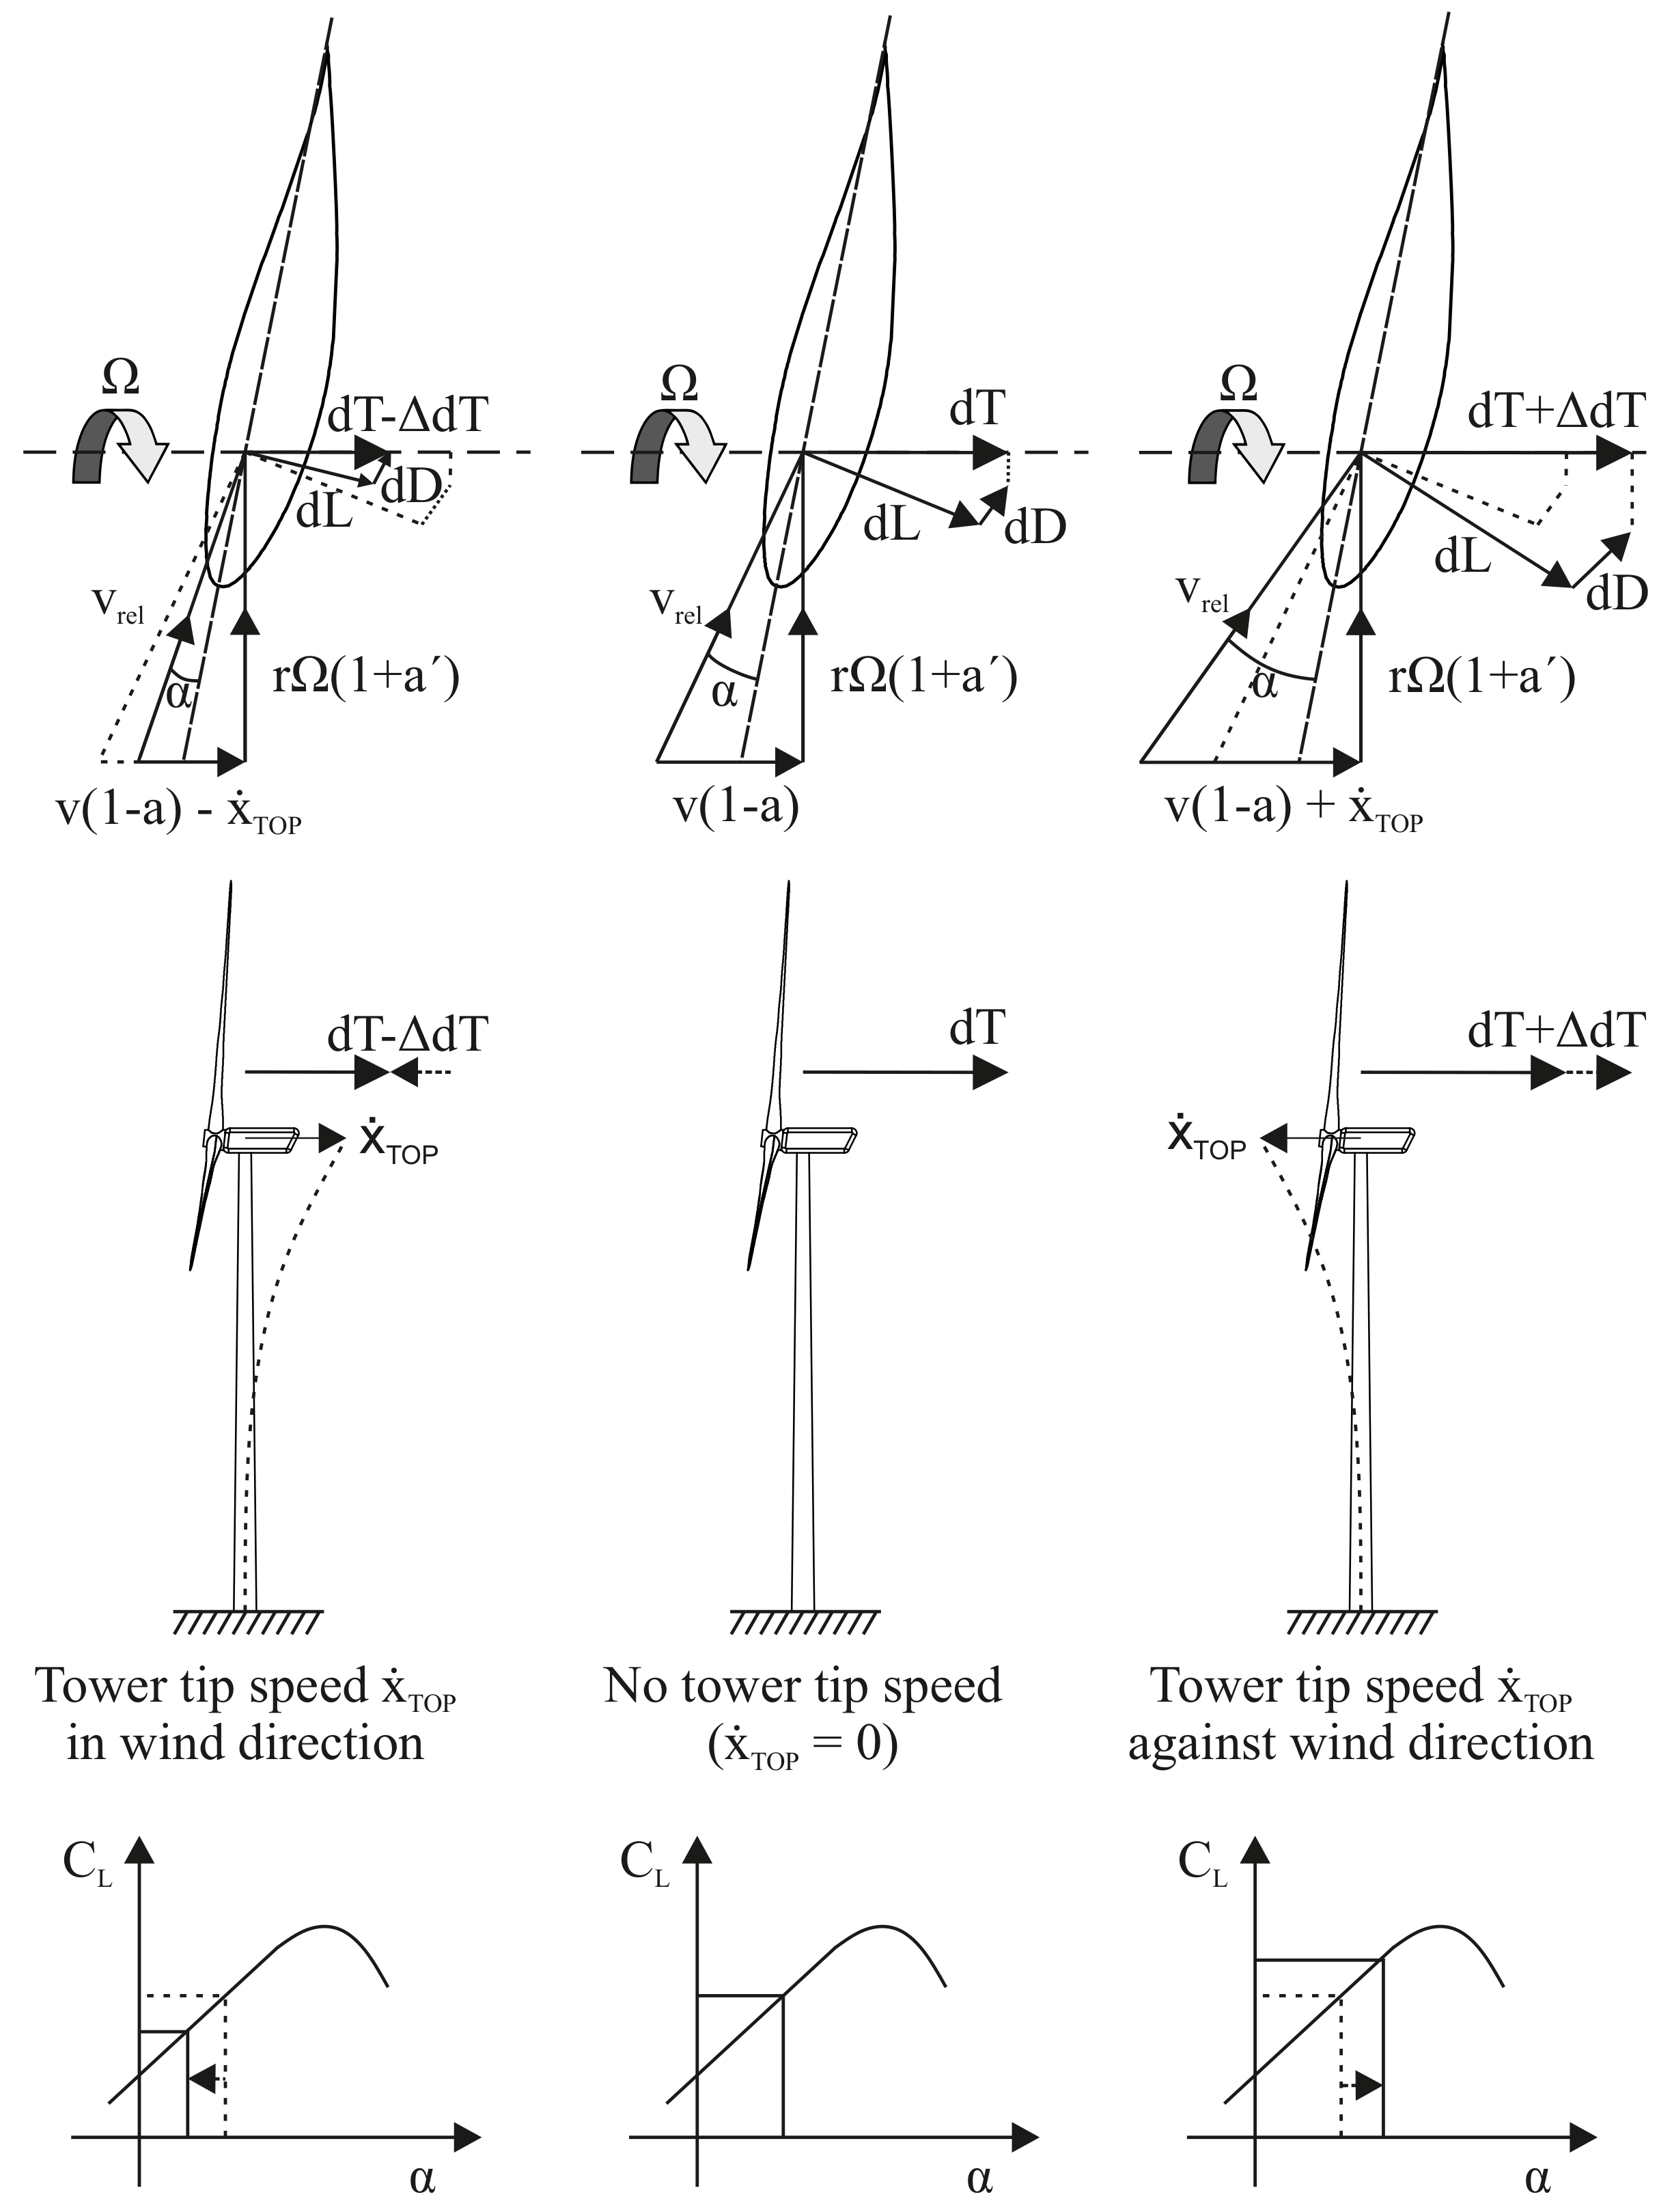
2.1. Aerodynamic Damping of Wind Turbines

The aerodynamic damping is an aeroelastic magnitude that quantifies the fluid forces in phase with the speed of the oscillating body they act on. In the case of operating wind turbines, their oscillation in wind direction causes changes on the relative wind speed acting on the blades, and thus variate the attack angle and instantaneous lift forces. This phenomenon is represented in Figure 1. The magnitude of the aerodynamic forces depends therefore directly on the oscillation speed and amplitude.
As mentioned previously, the increase of tip oscillation amplitudes of wind turbine towers has led to a major relevance of the aerodynamic damping of wind turbines, which has been determined through many different methods in the past.
One of these methods is the analysis of measurement or monitoring data of full-scale turbines using stochastic subspace identification methods or other automated identification routines. For example, Devriendt and Weijtjens [4] used monitoring data of the Belwind offshore wind farm and automated operational modal analysis algorithms to determine values of the fore-aft aerodynamic damping during operation, which increased from approximately 2% to 7% for wind speeds from 1.6 to 22.7 m/s respectively. Using other monitoring data from a single turbine in the north sea in operating state they determined again values around 6–7% [5]. Hansen [6] applied stochastic subspace identification algorithms to the 3-month long measurements of seven strain gauges located in a wind turbine tower and determined an aerodynamic damping of around 13% for the fore-aft mode at high wind speeds (over 10 m/s). Hansen also tried to determine the aerodynamic damping from the decaying response of a previously harmonically excited wind turbine. This method proved less effective due to the difficulty of exciting one unique tower mode [6]. In general, there is a relatively large variation of the values determined through monitoring, which may be due to different turbine characteristics, boundary conditions, determination methods, etc.
Other methods to determine the aerodynamic damping are based strongly on the use of HAWT-specific software. For example, Van der Tempel presented in [12] a method to determine the aerodynamic damping from the variation of aerodynamic axial force in the rotor calculated with a wind turbine simulation program. Kühn also presents in [8] numerical linearization and non-linear time domain simulation (analyzing the tower top decay after an impulse loading) as alternative numerical methods to determine the aerodynamic damping. A detailed explanation of these methods can be found in the literature [8,9].
Finally, some authors have developed analytic closed forms, mostly based on simplifications of blade element momentum theory, which allow a quick estimation of the aerodynamic damping in all operation ranges of the wind turbine. These approaches may be especially useful for structural engineers, who may want to consider aerodynamic damping without having to use necessarily a HAWT-specific software [10]. The first approaches assumed a constant rotation speed of the wind turbine rotor, which allowed for some simplifications on the formulation of the aerodynamic forces and thus a better understanding of the aerodynamic damping. For instance, under the assumption of high tip speed ratios, small incoming inflow angles and negligible drag forces, Garrad [7] derived the following expression for the aerodynamic damping ratio of a blade element:
ξ A D = c A D c c r i t = 1 2 ρ a v Ω c C L α 2 m ω n
where c A D is the aerodynamic damping coefficient, c c r i t is the critical damping constant, ρ a is the air density, v Ω the rotation speed of the blade element, c the blade chord length, C L α the lift coefficient derivative, m the modal mass, and ω n the first natural frequency of the equivalent wind turbine SDOF-system. Thus, in general, the aerodynamic damping of a wind turbine increases with rotation speed, blade chord length and steepness of the lift coefficient curve. Kühn [8] also gave an analytic closed form for the aerodynamic damping under the assumption of constant rotation speed rotors, which as exposed in [9] can be expressed as:
ξ A D , R = N ρ a Ω 4 m ω n r r o o t R C L α c ( r ) r d r
where N is the number of blades and Ω the rotor rotation speed. With additional assumptions, such as a small variation of C L α along angles of attack and blade length, Equation (2) can be simplified to:
ξ A D , R = N ρ a Ω C L α m 1 , b l a d e 4 m ω n
where m 1 , b l a d e is the first order moment of the area of the chord [8]. This expression of the aerodynamic damping can be applied directly in the equation of motion of the wind turbine equivalent SDOF-system.
Most modern high megawatt-wind turbines, however, use pitching strategies to regulate the rotation wind speed. This implies that a change in the incoming wind speed can cause a change in the rotation speed, and thus the assumption of constant rotation speed becomes inaccurate. For this reason, Cerda Salzmann and Van der Tempel [9] developed an approach that considers variable rotation speed rotors through a constant b, which is determined through HAWT-specific software. They found that at high wind speeds the drag coefficient should not be neglected, as its consideration led to 16% higher aerodynamic damping values than those determined neglecting the drag coefficient. They also deduced that the values calculated with the approaches explained above yield an approximate result, and not an upper limit of the aerodynamic damping. The aerodynamic damping ratio as defined in [9] is then rewritten as:
ξ A D , R = Ω ( v ) N ρ a C L α m 1 , b l a d e 4 m ω n
Valamanesh and Myers [10] developed a closed-form approach based on blade element momentum theory to describe the aerodynamic damping of HAWTs in fore-aft and side-to-side directions. Contrary to the approaches explained above, Valamanesh and Myers consider the blades’ drag coefficients C D and the occurrence of large incoming flow angles φ in their formulation. A rigid rotor and a steady, uniform wind perpendicular to the rotor plane are assumed. The aerodynamic damping is then expressed through:
ξ A D = c A D 2 k m = N ( A + B ) 2 k m
where A and B are the components associated to the incoming wind v and the rotor rotation speed Ω , respectively, and defined as:
A = ρ a v ( 1 a ) C L ( α , r ) cos φ ( r ) + C D ( α , r ) sin φ ( r ) c ( r ) d r
B = 1 2 ρ a Ω r ( 1 + a ) C L ( α , r ) α + C D ( α , r ) cos φ ( r ) C D ( α , r ) α C L ( α , r ) sin φ c ( r ) d r
The work of Valamanesh and Myers [10] shows that the aerodynamic damping in fore-aft direction is strongly dominated by the lift coefficient derivative C L α , which is contained in the B-component of the aerodynamic damping coefficient c A D . As a result, a correct determination of the lift coefficient curve is crucial for a correct estimation of the aerodynamic damping in fore-aft direction. Besides, the B-component decays when the wind turbine approaches the cut-out speed, while the A-component grows continuously until the cut-out speed.

2.2. Aerodynamic Damping in Civil Engineering Structures

Another field where aerodynamic damping plays a major role is in the dynamic behavior of bridges. Since the collapse of the Tacoma Narrows in 1940, aeroelastic phenomena affecting light, low-damped, long span bridges have been studied extensively in civil engineering. In this field it is habitual to perform wind tunnel studies of section models of bridge decks to determine their aerodynamic properties and flutter derivatives [13,14,15,16]. The principles behind the methods used in these wind tunnel tests are well established, and their reliability has been well proven over decades. One of these methods is the forced oscillations method, in which the section model is forced to oscillate in a sinusoidal motion, and aeroelastic forces are measured through dynamic force sensors and separated into inertial and damping components according to their phase respect to the measured motion accelerations [17,18,19]. The measured aeroelastic forces are then expressed as aeroelastic force coefficients or flutter derivatives, in most cases according to the semi-empirical approach of Scanlan and Sabzebari [20]. A similar approach was developed by Steckley to measure the aerodynamic damping of chimneys and tall buildings [21,22]. In this approach, the motion-dependent wind forces acting on an oscillating vertical cantilevered structure are expressed through a complex aerodynamic impedance. The real component, which is proportional to the motion displacement, is defined as aerodynamic stiffness α , while the imaginary component, which is proportional to the motion velocity, is defined as aerodynamic damping β . The base moment due to the motion-dependent wind forces can then be described by the following expression:
M b ( t ) = 2 ω 2 M o η α y + β y ˙
with H the structure height, ω the oscillation angular frequency, M o the structure generalized mass, η the ratio of air to structure density ρ a / ρ s , and y and y ˙ the structure’s top oscillation amplitude and speed, respectively. A detailed derivation of the wind forces formulation for a prismatic cylinder can be found in [21]. The aerodynamic stiffness and damping coefficients are usually expressed as normalized curves over the reduced wind velocity v r e d . Through appropriate modifications, Equation (8) can be used to describe the aerodynamic damping of a sinusoidally oscillating wind turbine towers.

3. Wind Turbine Model and Measurement Equipment

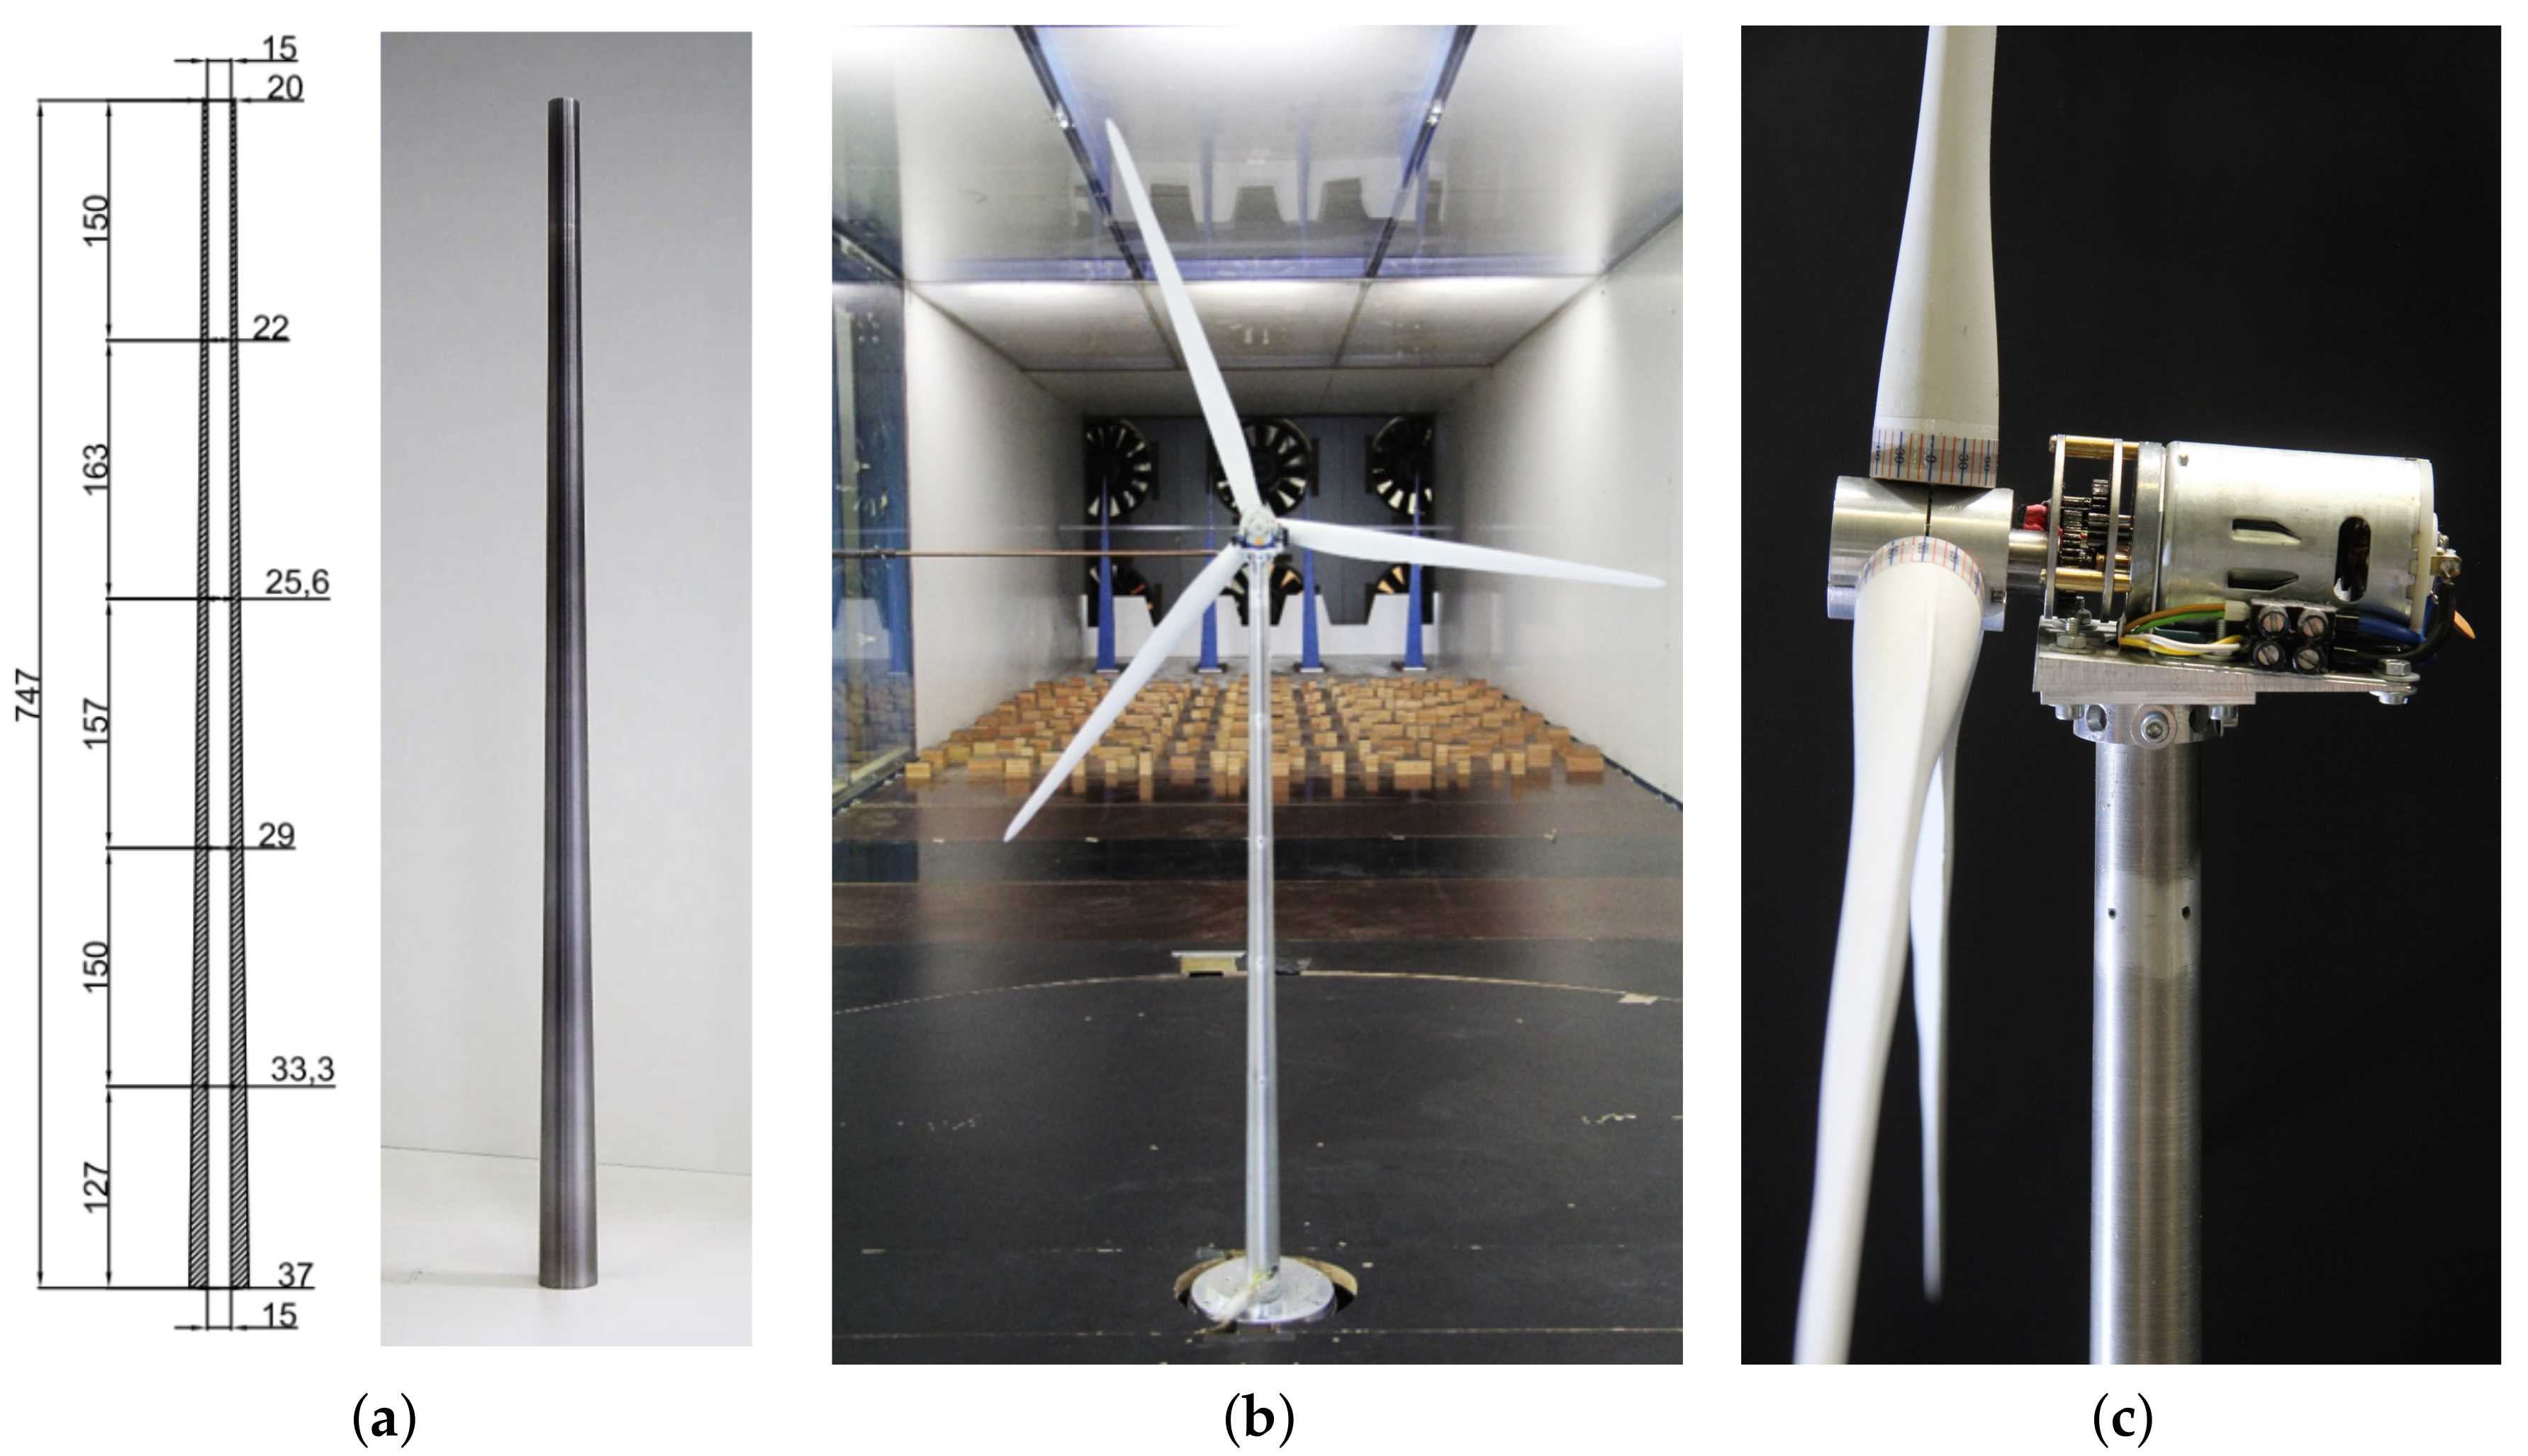
3.1. Wind Turbine Model
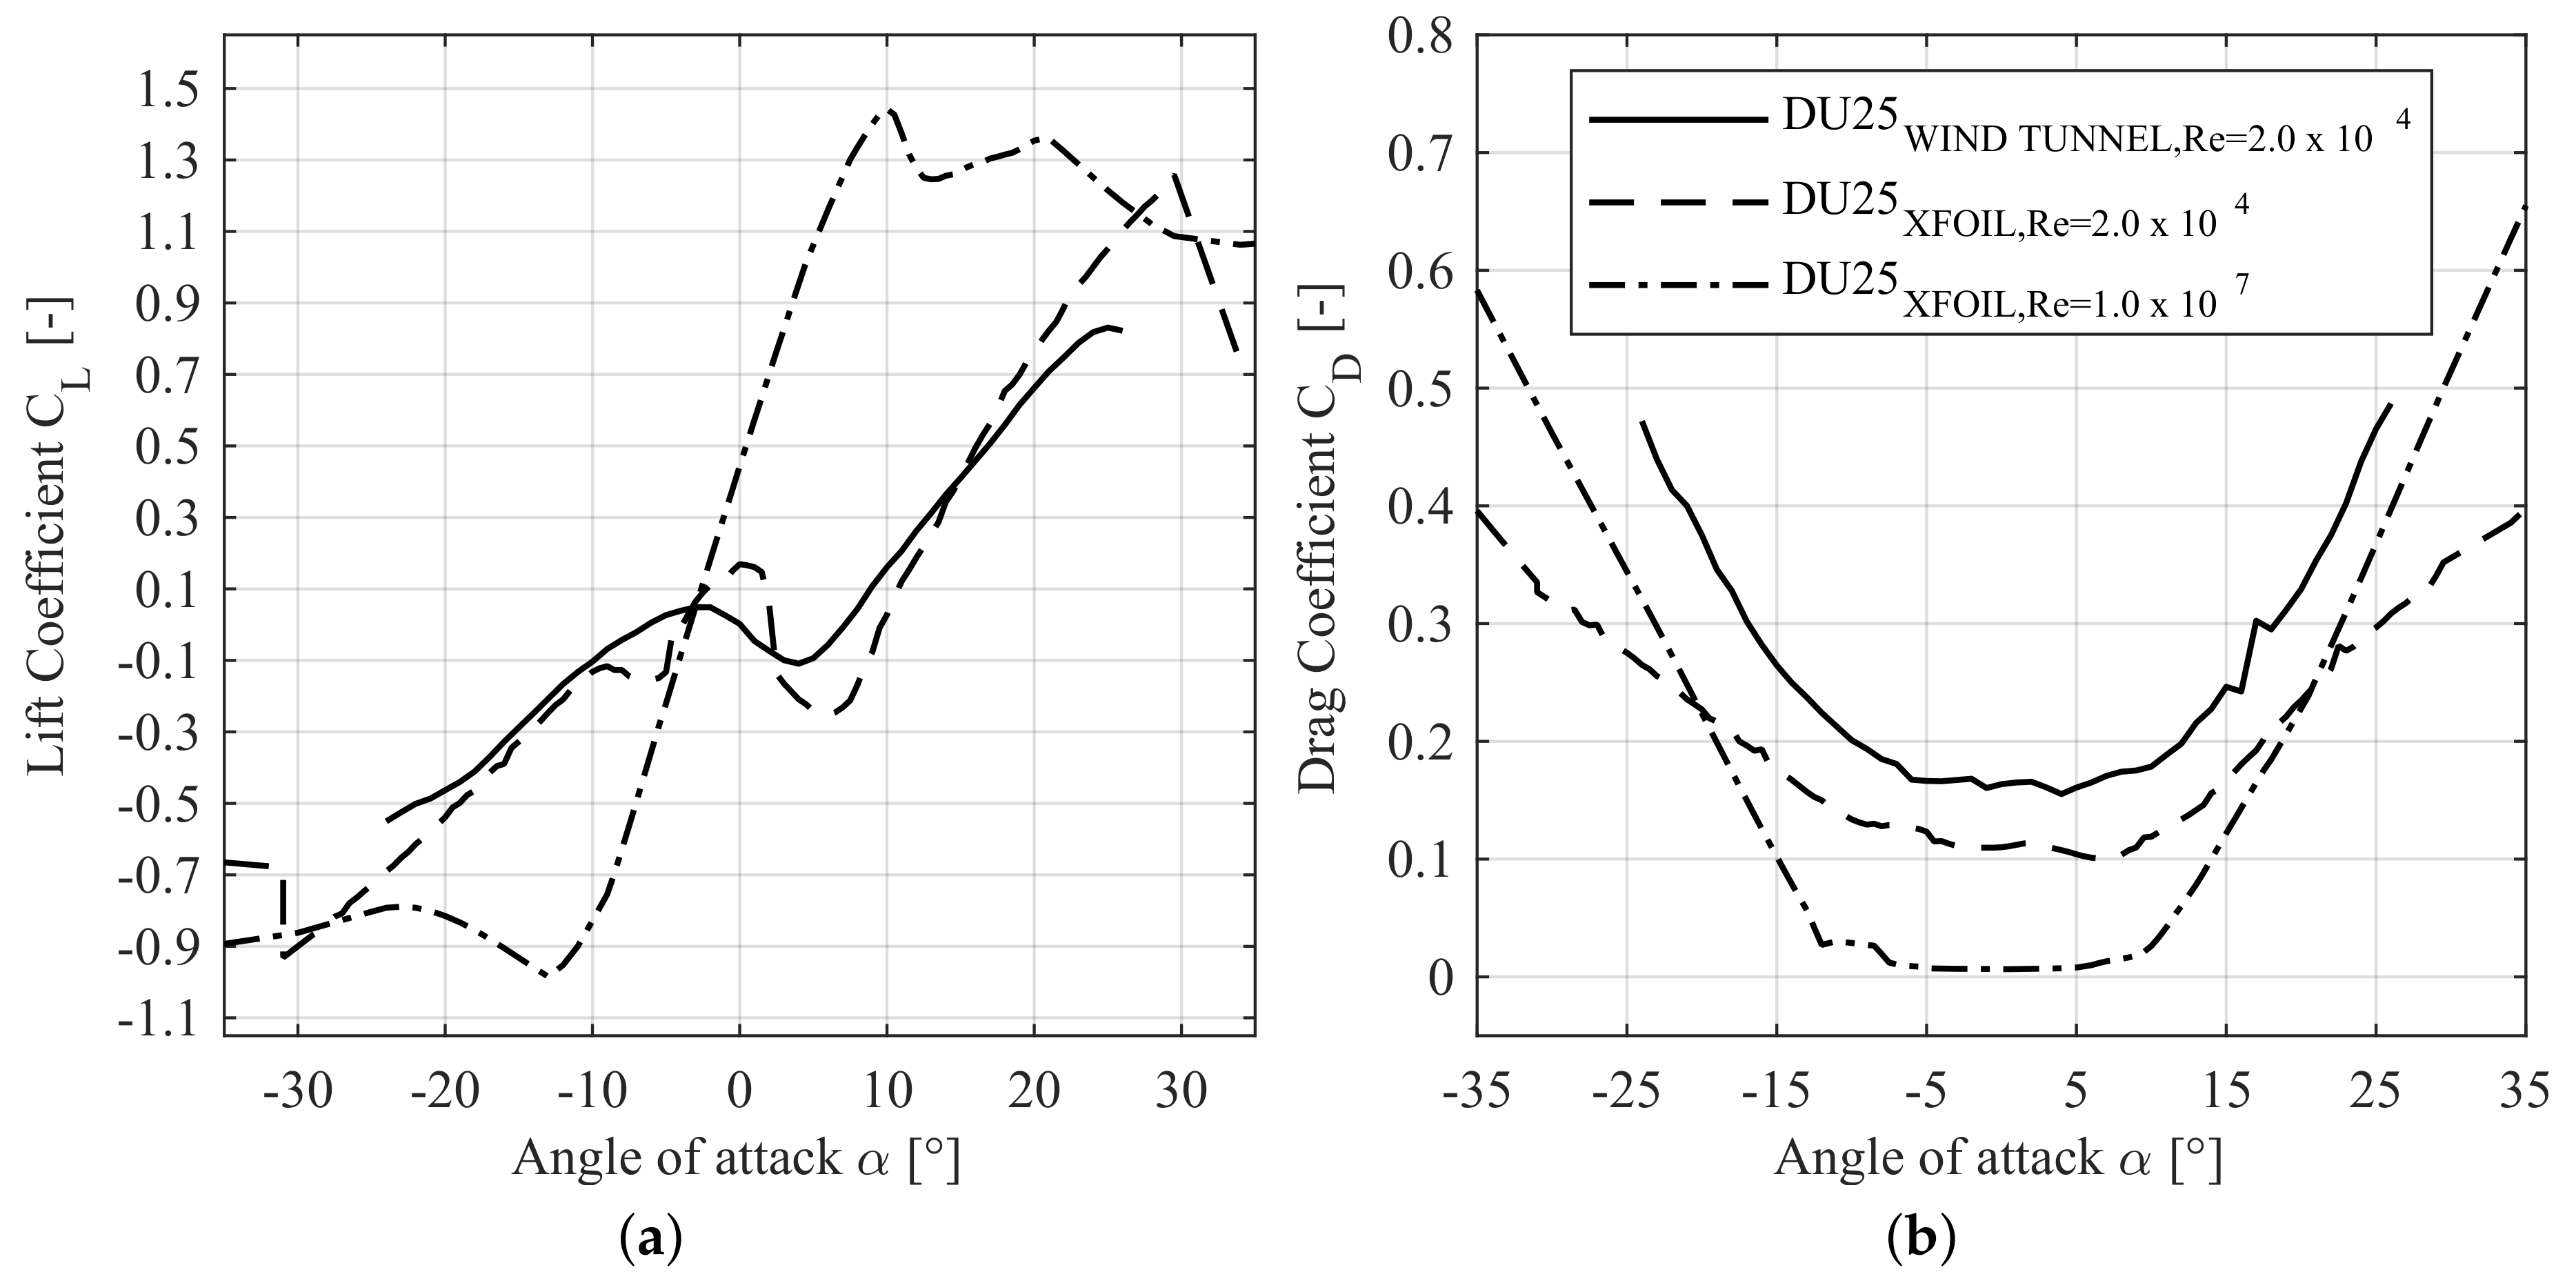
The used wind turbine model was built in the course of the project "Soil-Structure-Drive Train-Interaction of wind turbines" (in the following only BBTI, from the German "Boden-Bauwerk- Triebstrang-Interaktion von Windenergieanlagen", see [23]). In this project a prototype wind turbine was designed to perform an integral study of the influence of Soil-Structure-Interaction (SSI) effects on the drive train of the turbine, as well as on the whole wind turbine dynamic behavior. The prototype wind turbine had a hub height of 115 m, a rotor diameter of 125 m, an average tower diameter of 4.2 m, a first natural fore-aft oscillation frequency of 0.21 Hz, and a generalized mass of 273 tones (73 tones from the tower and 200 from the machine). The blades were defined as in NREL’s 5-MW Reference wind turbine [24,25], although the original control and pitching strategies were slightly modified (see Figure 2).
The wind turbine model was conceived according to the HFFB-approach by Tschanz and Davenport [26,27,28,29], as well as to Steckley’s approach [21]. In general, both approaches require essentially geometric similarity and high model stiffness to avoid resonances of the different model elements during the wind tunnel measurements.
Due to the wind tunnel section width and height of 2.5 m and 1.7 m respectively, a geometric scale λ g = 1 : 150 was chosen. This resulted in a wind turbine model hub height of around 77 cm, a rotor diameter of 83 cm and a blade length of around 42 cm. The tower model was milled from an aluminium tube, and was approximately 750 mm high, had an average diameter of 28 mm, and an exaggerated wall thickness to ensure enough stiffness. The blade models were milled from beech wood, which also ensured light and stiff blade models. The nacelle was replaced by a miniature gear motor, which was controlled through a potentiometer to set the required constant rotation speeds. A hall sensor and three magnets at the base of each blade enabled a precise determination of the rotation speed.
The modeling of an operating wind turbine requires the application of similarity laws [2,30,31,32]. For the tower model, geometric and kinematic similarity were applied, i.e., equal geometry and reduced velocities:
u r e d , M = v M D M f M = v P D P f P = u r e d , P
where the sub-index ‘M’ and ‘P’ stand for ‘Model’ and ‘Prototype’, respectively. Keeping kinematic similarity in forced oscillation tests implied using high model excitation frequencies and low wind speeds to compensate for the geometric scale factor. For the aerodynamic scaling of the wind turbine rotor, the operation properties of the prototype turbine shown in Figure 2 are considered. In order to model the aerodynamic forces and angles of attack on the blade profiles properly, the tip speed ratio must be kept equal in model and prototype, i.e., λ P = λ M . This requires much higher rotation speeds to compensate for the scaled rotor dimensions. For instance, a wind tunnel speed of 20 m/s requires a rotor model rotation speed of 1650 rpm to match the prototype tip speed ratio. Due to model limitations, the maximum achievable rotation speed was around 500 rpm, which made necessary using lower wind speeds during wind tunnel measurements, typically around 5 m/s. Issues concerning dynamic similarity, which imply the matching of Reynolds number, are treated with detail in the following section.
Finally, during the forced oscillation measurements, the ratio of rotor angular speed Ω to structure natural frequencies f n was kept for each operation state, that is:
Ω f n P = Ω f e M
where f e is the model excitation frequency. This ratio required model excitation frequencies such that the model and the prototype had the same reduced velocities in each operation state. The resulting wind turbine model is shown in Figure 3.

3.2. Scale Effects

To ensure a representative behavior of the flow around the model in wind tunnel measurements, the Reynolds numbers in the measurements must match those found in the prototype. Using a scale factor λ g = 1 : 150 , this requires setting wind speeds 150 times higher in the wind tunnel, and rotation speeds around 250,000 rpm. Not only is this impracticable, but it also results in high Mach numbers that alter the aerodynamics of the blades in the wind tunnel measurements [31]. Therefore, dynamic similarity cannot be fulfilled in this case. Classically, if the modeled structure has sharp edges, failing to fulfill Reynolds number similarity is not critical, as the locations of boundary layer separation are well defined (see for example [33,34]). However, the curved sections in the wind turbine tower and blades makes them susceptible to Reynolds number effects. Therefore, previous investigations were performed to try to reduce or correct these effects in both cases.
In the case of the tower model, several wind tunnel measurements were performed on cylinders to determine if it was possible to account for Reynolds number effects using surface roughness modifications. As shown in [35,36], this was most efficiently achieved through dimpled patterns, which forced the flow transition to super-critical flow regimes at Reynolds numbers around R e = 4.7 × 10 4 (instead of the typical Reynolds numbers around R e = 5 × 10 5 ). However, achieving super-critical regimes using dimpled patterns in the tower model with approximate diameter D m = 27 mm would require wind speeds around 27 m/s, which are too high for the operation of the rotor model (see Section 3.1). Therefore, correct aerodynamic scaling of the tower could not be achieved. As seen in the following sections, this did not play a major role in the study results.
Scale effects due to Reynolds number mismatch did, however, play a major role in the aerodynamics of the wind turbine blades. Based on the scaling strategy explained above, the use of wind speeds around 5 m/s and rotor rotation speeds around 400 rpm led to Reynolds numbers in the model blades around R e = 2 × 10 4 , which differ from the Reynolds numbers around R e = 1 × 10 7 from the prototype. It has been stated in the literature, that issues with the behavior of the flow around the rotor blades arise for Reynolds number values below R e = 2 × 10 5 5 × 10 5 [31,37,38,39,40]. To study the flow properties around the model blades at R e = 2 × 10 4 , the polars of a representative blade airfoil, the DU25, were measured in wind tunnel tests using constant section blade models. Alternatively, the polars of the airfoil DU25 were calculated using XFOIL [41] for R e = 2 × 10 4 and R e = 1 × 10 7 (full-scale). The results are shown in Figure 4.
Although inaccuracies are expected when using XFOIL with such reduced Reynolds numbers [31,42], the calculated coefficients showed acceptable agreement with the experimental results. Therefore, the lift and drag coefficients of all blade profiles were calculated with XFOIL and assumed to represent approximately the real lift and drag coefficients of the wind turbine model. The calculated coefficients are shown in Figure 5, and were used for the blade pitch angle correction, as will be explained later.

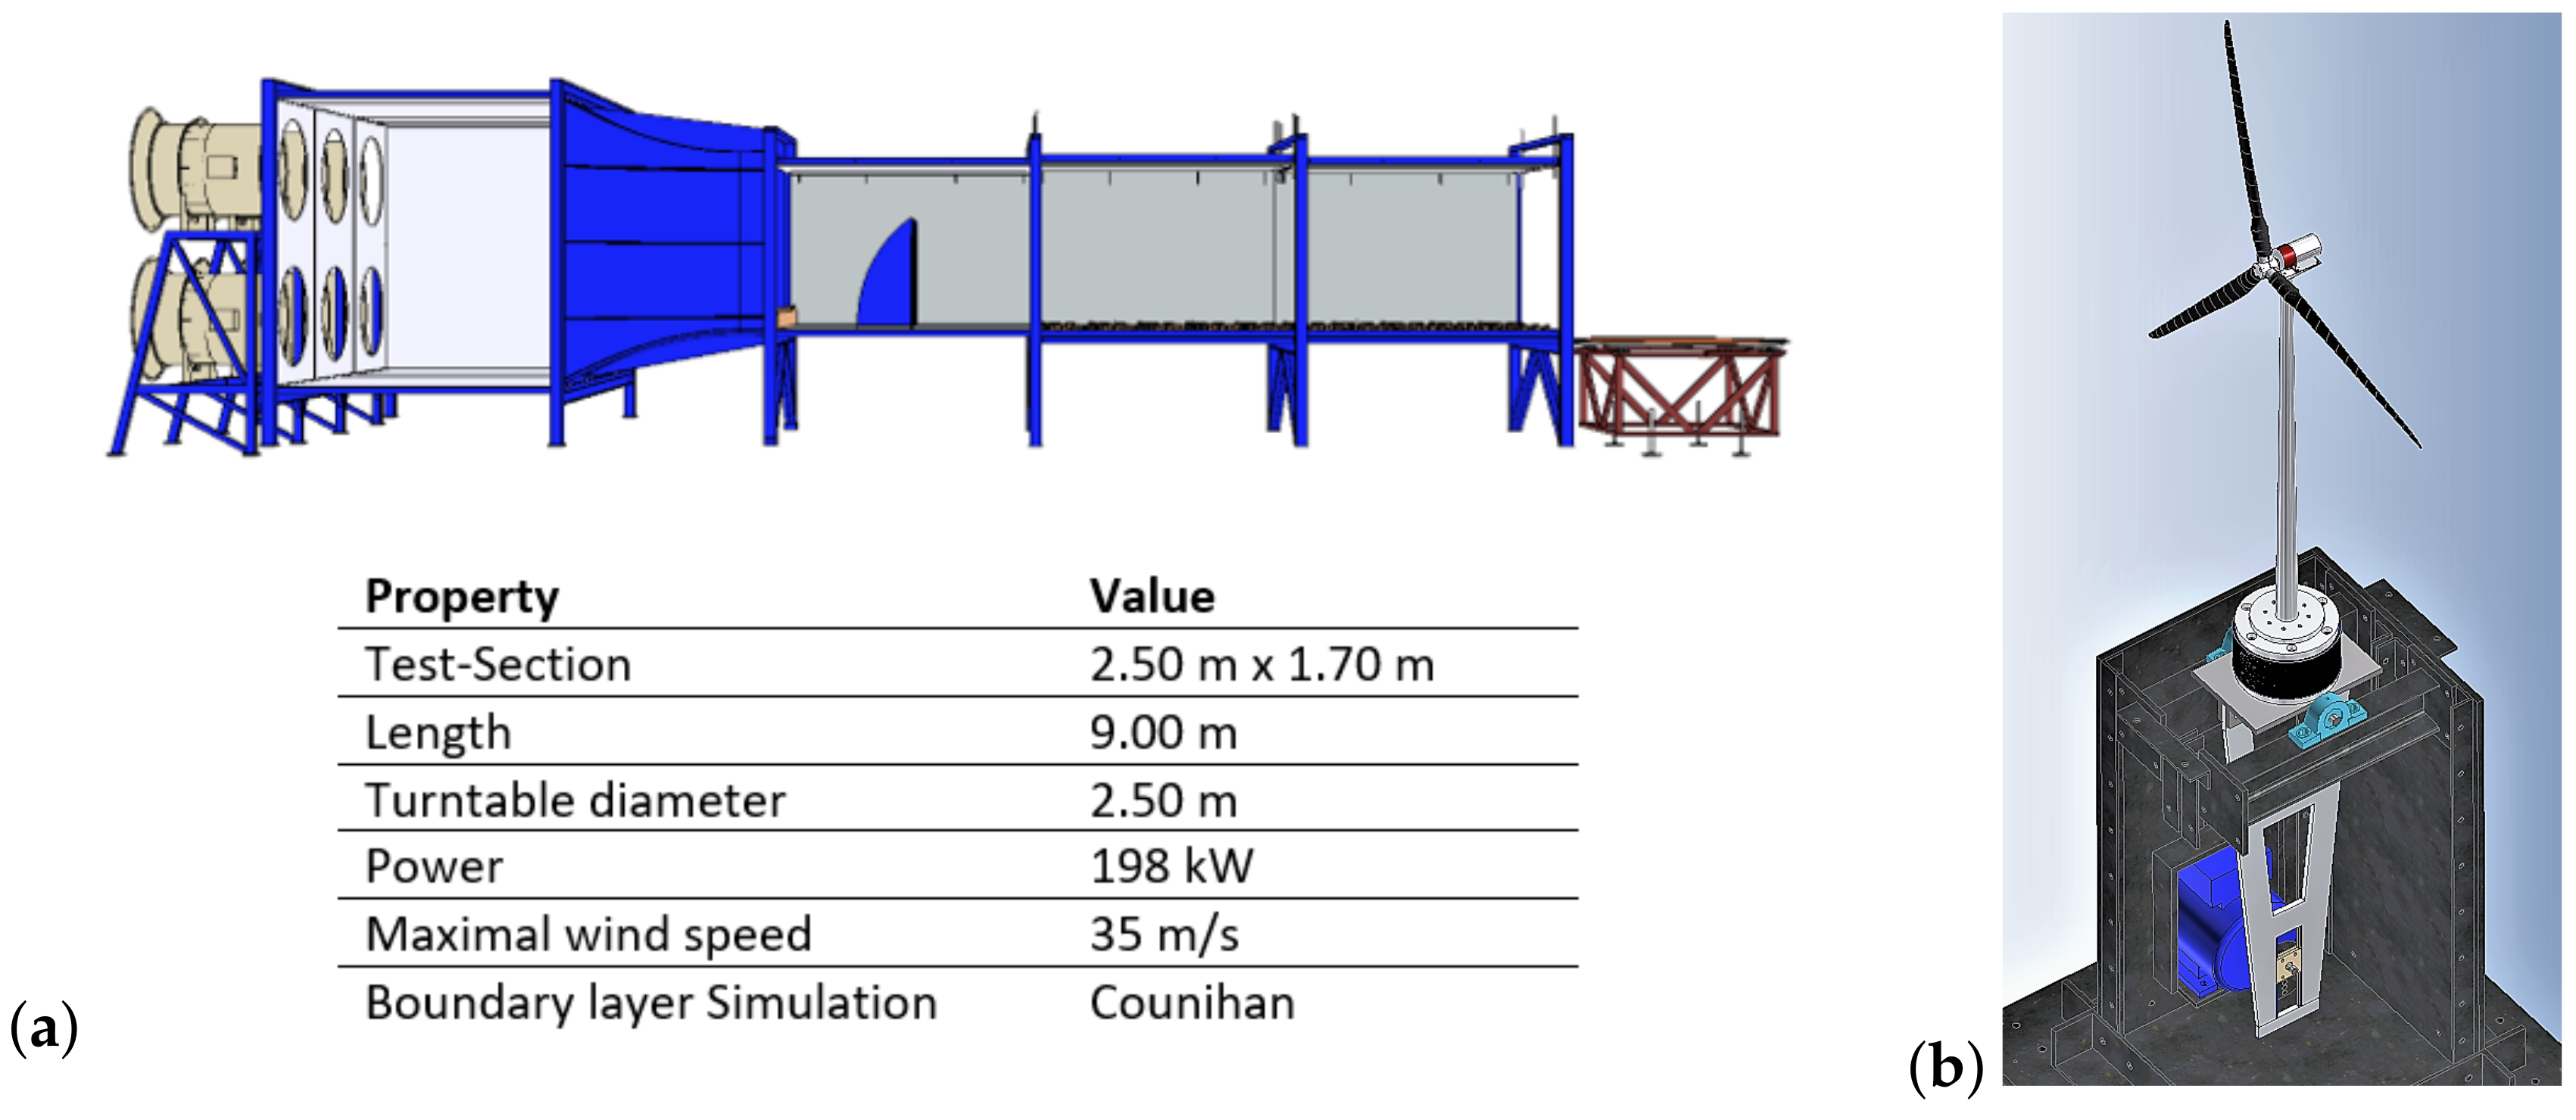
3.3. Test Rig and Wind Tunnel

The experiments took place in the boundary layer wind tunnel of the Center for Wind and Earthquake Engineering of the RWTH Aachen. The main properties of the wind tunnel are summarized in Figure 6a. Previous measurements determined that wind and turbulence profiles could be modeled properly for wind speeds equal or higher than 5 m/s, therefore this was chosen as the minimal wind speed during the wind tunnel tests. During the measurements, a boundary layer wind corresponding to terrain category “I” of the Eurocode [43] (logarithmic wind profile with roughness length z 0 = 0.01 ) was modeled. To perform forced oscillation tests, a test bench was designed to force model sinusoidal pivoting motions. The test bench allowed setting different amplitude and frequency combinations. The forces at the base of the model were measured using a six-axis sensor. In all forced oscillation measurements, an accelerometer was placed within the oscillating system for the posterior spectral analysis. An overview of the test bench is given in Figure 6b.

4. Wind Tunnel Measurements and Evaluation

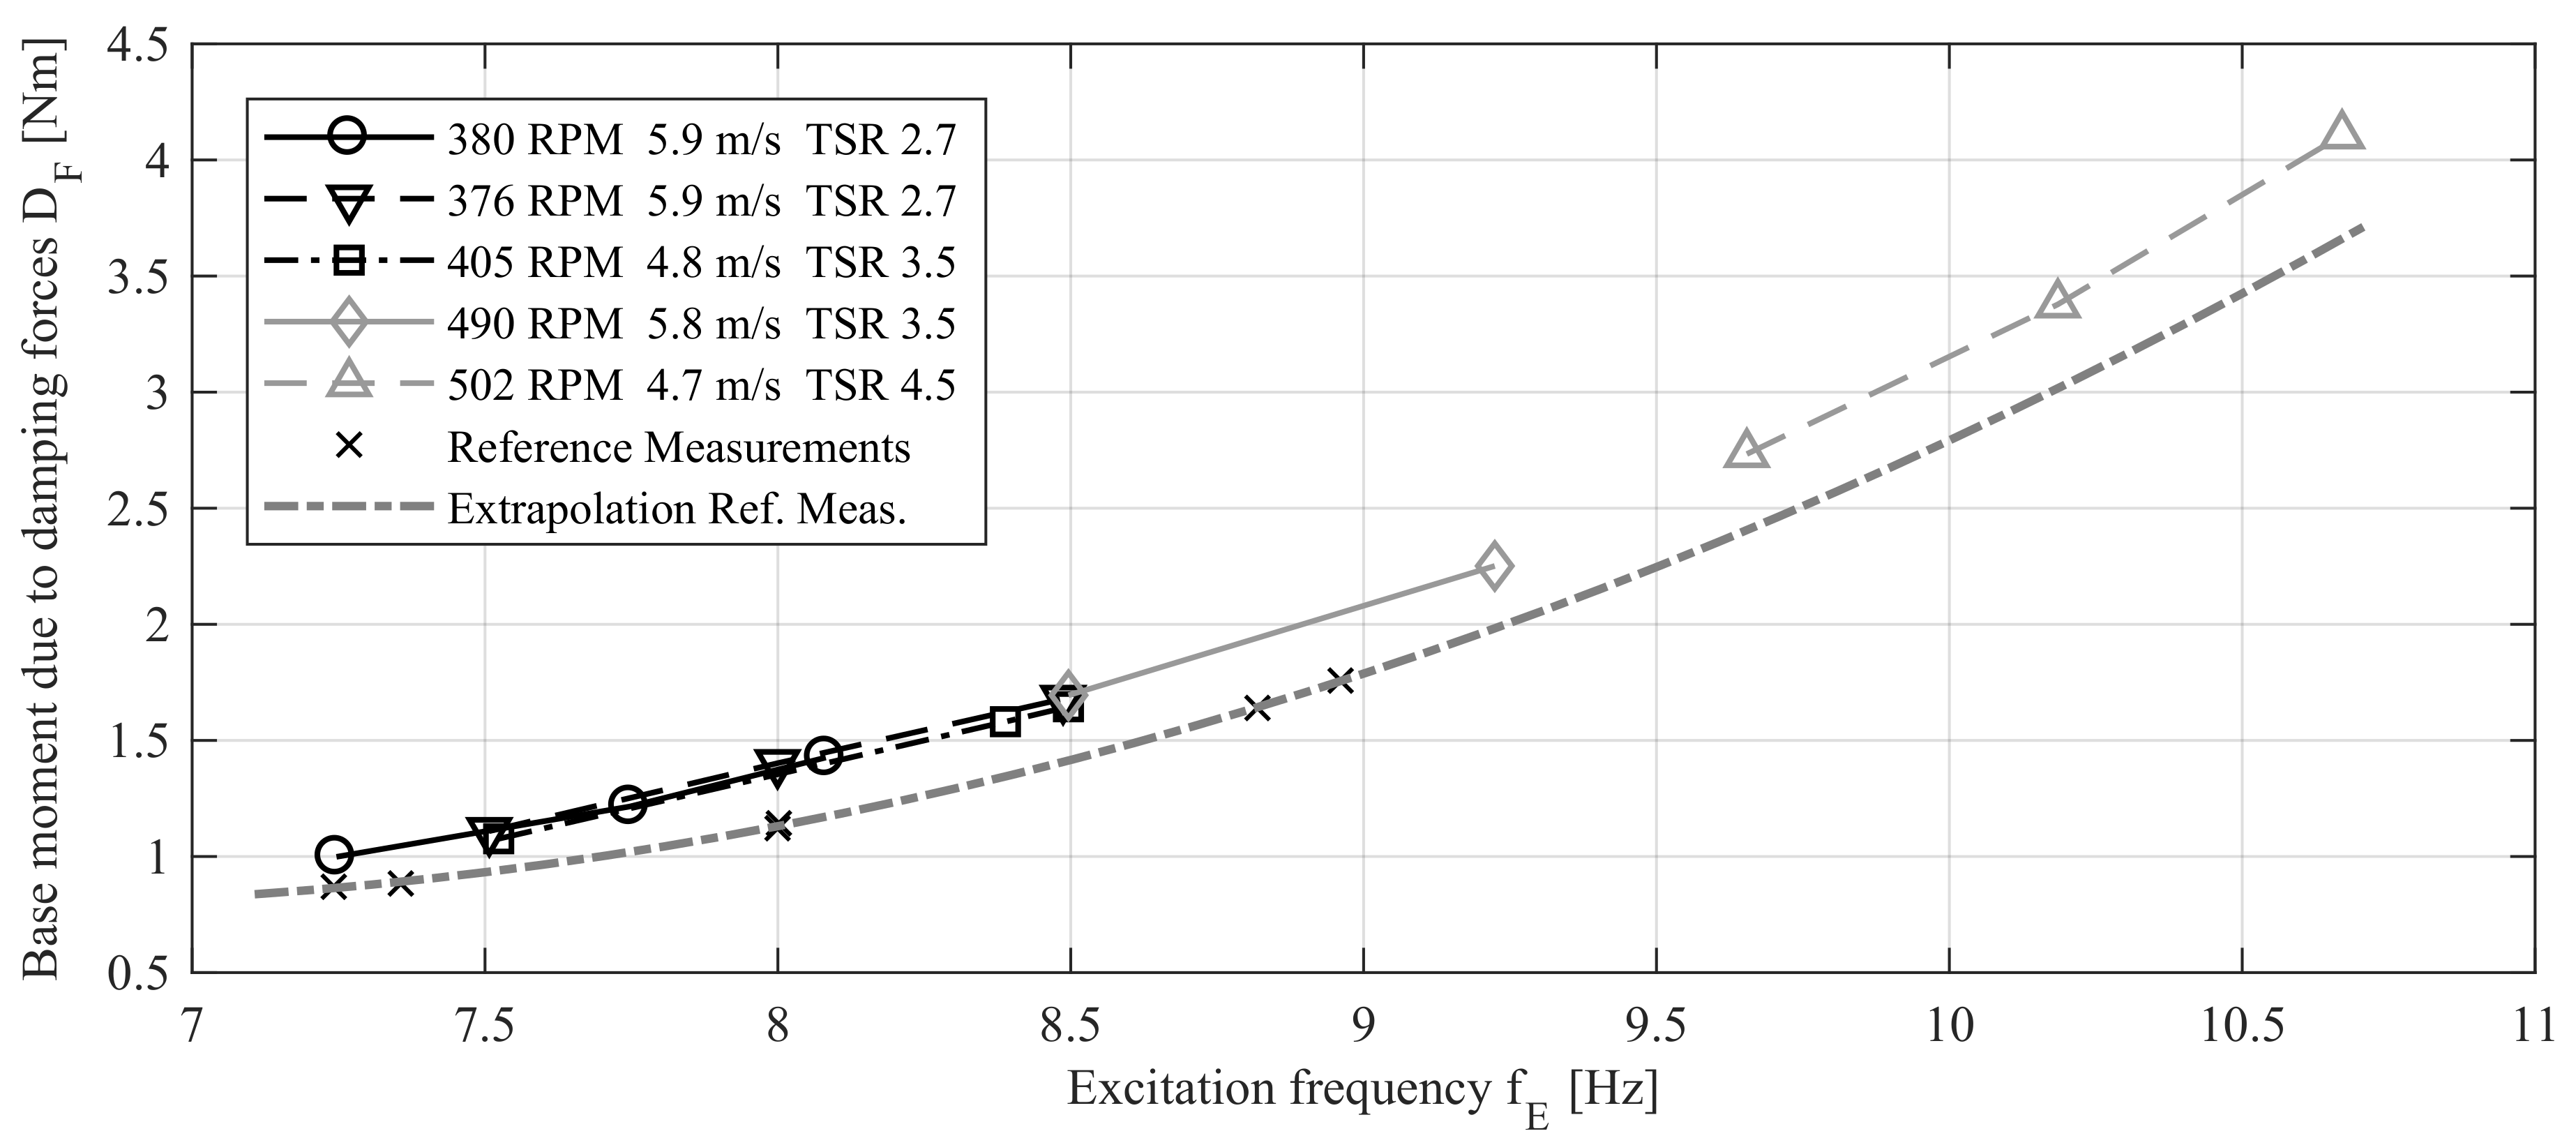
4.1. Forced Oscillation Measurements of the Tower Model

First of all, the aeroelastic properties of the wind turbine tower were determined. Several tests with different tower model diameters (from D = 30 mm until D = 100 mm) and slenderness (from H / D = 12.5 until H / D = 25 ) were performed, but no essential differences were found in the results. The results showed some scatter, probably due to insufficient measurement time, and should therefore be considered as an approximation of the real aeroelastic properties of circular cross-section towers. The measurements were analyzed using spectral methods: the damping and inertial forces were identified through the cross-power spectral density between the measured accelerations and base moments. A more detailed explanation of this proceeding can be found in the literature [18,36]. Equation (8) was further developed to consider circular cross-section structures and sinusoidal motion as follows:
M b ( t ) = 1 6 ρ a π D 2 H 2 ω 2 y ^ α cos ( ω t ) β sin ( ω t )
with ρ a the air density, D the tower average diameter, H the tower height, ω the oscillation angular frequency, and y ^ the structure’s top oscillation amplitude. The results are shown in Figure 8 from Section 5.1.

4.2. Forced Oscillation Measurements of the Wind Turbine Model

The objective in this case was to study the aerodynamic damping of the whole wind turbine at the different operation states defined in Figure 2. During the measurements, the model tip speed ratio λ M , the tower reduced velocity u r e d , and, consequently, the frequency ratio Ω / f were set to match the ones of the corresponding operation state in the prototype.
The usual proceeding would require setting the blades’ pitch angles according to the studied operation state, but due to the studied scale effects on the blades, another pitch strategy was followed. Because the lift coefficient derivative is expected to play a major role in the aerodynamic damping magnitude (see Section 2), priority was given to the similitude between the lift coefficients in the model and in the prototype. By observing Figure 4, it was decided to apply a pitch offset of approximately 17 ° to the model relative to the prototype turbine. The resulting pitch angles are shown in Table 1.
Due to the limited rotor model rotation speed, only tip speed ratios lower than approximately λ = 4.5 could be achieved. After a convergence test, a measurement duration of 300 s was chosen for all measurements. Table 1 shows the aimed operation conditions. Hereby, v P and v M are the wind speeds in prototype and model respectively, Ω P and Ω M are the prototype and model rotor rotation speed respectively, f n , P is the prototype first fore-aft frequency and f e , M is the model fore-aft excitation frequency, and β P and β M are the blade pitch angles in prototype and model respectively.
In forced oscillation measurements a reference measurement is required to differentiate aerodynamic damping from other types of damping acting during the experiments. In this case, the reference measurements were performed with the wind turbine model without rotor rotation, without wind speed, and for several excitation frequencies similar to the ones used during the measurements. The reference measurements were extrapolated to the actual frequencies used in the measurements (see Figure 7). Figure 7 shows the measured damping base moments for the different operating conditions along the used excitation frequencies. These moments are obtained after using spectral methods to identify the moment components in phase with the oscillation speed ([18,19,36]).
It was assumed that an adequate expression for the aerodynamic damping forces must have a similar form to those given by Garrad [7], Kühn [8], Valamanesh and Myers [10], and Van der Tempel [11], which have been briefly exposed in Section 2. First, assuming the damping forces from the tower model to be negligible, the base damping moments were divided by the model hub height to acquire the corresponding damping forces. A geometric factor for the normalization of the measurements is defined as:
ψ G e o m = N 1 2 ρ a i r Ω r r o o t R r c ( r ) d r = N 1 2 ρ a Ω m 1 , b l a d e
with N the number of blades, ρ a the air density, Ω the rotor rotation speed, and m 1 , b l a d e the first order moment of the area of the chord. This factor contains geometric and operation information, and can therefore only be used for equivalent prototype operation conditions (same TSR, same ratio of Ω / f n ). Besides, like some of the previous approaches, it assumes a constant damping coefficient along the whole blade, which is considered an acceptable assumption given the fact that the results will be applied to an equivalent, geometrically identical prototype. Assuming a model aerodynamic damping force of the form D a = c a x ˙ , with c a the wanted aerodynamic damping coefficient and x ˙ the oscillation speed, a normalized aerodynamic damping coefficient c a ¯ can be defined using the geometric factor defined in (12):
c a ¯ = D a x ˙ 1 ψ G e o m = D a 2 π f e y ^ 1 ψ G e o m = D a π f e y ^ N ρ a Ω m 1 , b l a d e
with f e the oscillation excitation frequency and y ^ the tower top oscillation amplitude, which in the tests was around 5 mm. Finally, to achieve the aerodynamic damping coefficient of the prototype, the results are scaled up using the geometric factor of the prototype:
c a , P r o t o t y p e = c a ¯ ψ G e o m , P = D a x ˙ ψ G e o m , P ψ G e o m , M
This value can also be referred to the critical damping and expressed as damping ratio:
ξ a = c a 2 m P ω n = c a 4 m P π f e

5. Results

5.1. Aerodynamic Damping of Wind Turbine Tower

The results of the tower model measurements are summarized in Figure 8. The results express increasing aerodynamic damping with increasing reduced speed as well as an increase of the system stiffness and natural frequency (usually negligible).
The curves are not corrected for Reynolds number effects, and therefore must be treated as an approximation. We believe that the real aerodynamic damping curves may vary slightly, resulting in smaller damping values. For the sake of simplicity, it was assumed for the following calculations that tower aerodynamic damping does not vary due to tower shadow effects.
The measured curves were used to estimate the aeroelastic forces on the tower during the wind turbine model experiments according to Equation (11), and showed to be negligible in comparison to the aeroelastic forces acting on the rotor. An exemplary calculation using Equation (11) is given in Table 2. The three left columns describe the operating state of the turbine, and are common for model and prototype. The three middle columns describe the wind tunnel tests, and assume ρ a = 1.25 kg/m3, D = 0.023 m, H = 0.75 m, y = 0.005 m, as well as the corresponding excitation frequencies given in the table. It can be seen that the values are much smaller than those for the rotor aerodynamic damping (see Table 3). For the prototype in an equivalent situation (three columns on the right), the values ρ a = 1.25 kg/m3, D = 3.5 m, H = 112 m, y = 0.75 m have been assumed. Considering wind turbine moments in the range of 50–150 MNm, the aerodynamic damping of the tower represents around a 0.5–1% of the total base moments. As a result, ignoring the tower aerodynamic damping should not affect noticeably the security and life span of the wind turbine, an thus can be neglected on the safe side.

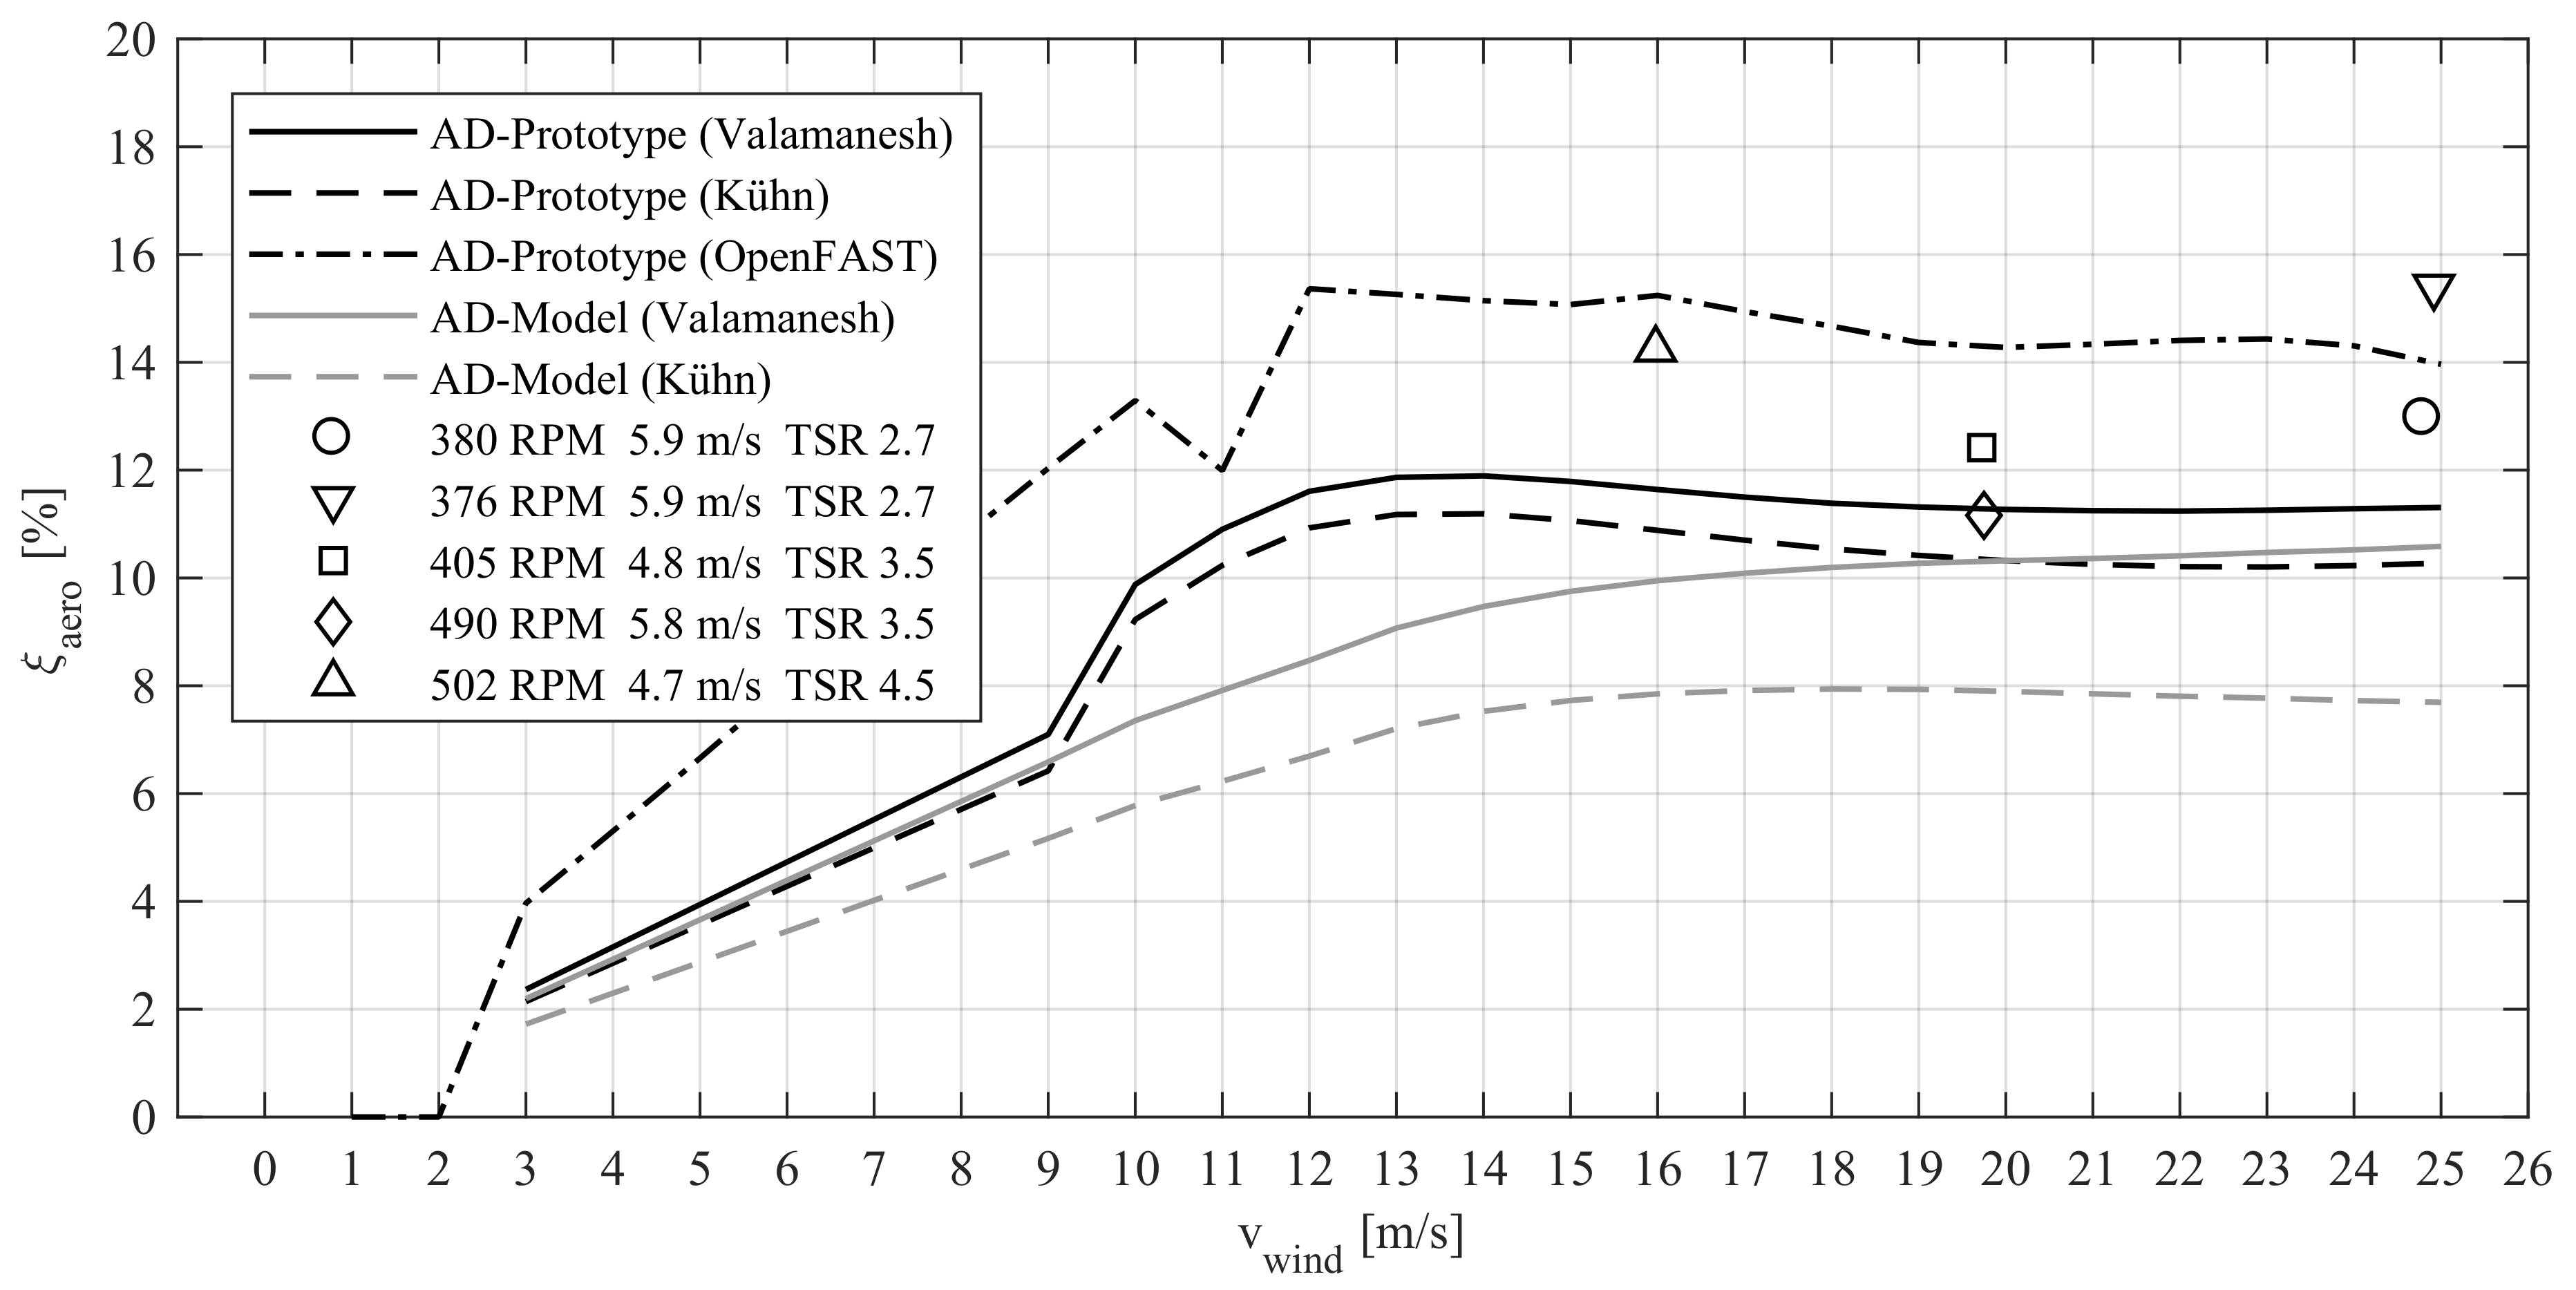
5.2. Aerodynamic Damping of Wind Turbine

The aerodynamic damping of the prototype turbine was calculated for all operation wind speeds according using the analytic expressions of Valamanesh and Myers [10] and Kühn [8]. Additionally, the aerodynamic damping was determined through simulations using the linearization tool of OpenFAST. To this aim, control systems and instationary effects were deactivated, and the structural damping was set to zero. For comparability, the aerodynamic damping of the model turbine (polars as in Figure 5, pitch offset of 17 ° ) is also calculated using the previously mentioned analytic approaches. The calculated, simulated and measured aerodynamic damping values are expressed as critical damping values in Figure 9.
All approaches show a growing aerodynamic damping until around the wind turbine rated speed v r = 11 m/s, and a relatively constant aerodynamic damping above this speed. The reason for this behavior can be most easily derived from Kühn’s aerodynamic damping equation (see Equation (3)), although it is derivable from all expressions given above. In Kühn’s expression, all parameters remain constant for all wind turbine operation states, except the rotor rotation speed Ω , which stays constant only above the rated speed. In this range, the magnitude and direction of the lift forces decrease due to blade pitching, but the value of the lift curve derivative C L α remains relatively constant. Actually, this value is typically almost constant for all angles of attack used in operation, see [7,8].
Considering the prototype wind turbine, the measured values lay principally between the results of the analytic approaches and the openFAST simulation. Regarding the model wind turbine, the measured values are between 5% and 40% larger than the predictions of the analytic approaches. The differences between both analytic approaches are larger for the model wind turbine. This is due to the consideration of, in the case of the model, not negligible drag forces and derivatives in the approach of Valamanesh and Myers.
The obtained damping values are used to estimate the damping base moments of the prototype turbine. For the prototype in equivalent situations to the wind tunnel measurements, the values ρ a = 1.25 kg/m3, H = 112 m, y ^ = 0.75 m, m 1 , b l a d e = 5.94 × 10 3 m3 have been assumed. Considering wind turbine moments in the range of 50–150 MNm, the aerodynamic damping of the tower represents around 6–23% of the total base moments. The results are summarized in Table 3. These forces act in the opposite direction to the oscillation speed, and thus reduce considerably the fatigue damage at the tower base.
Finally, in Figure 10 the measured normalized aerodynamic damping coefficients c a ¯ as defined in Equation (13) are compared to the polars of the airfoil DU25 for prototype’s and model’s Reynolds numbers. The measured damping coefficient values are plotted at high angles of attack as a result of the pitch offset of about 17 ° used in the model during wind tunnel measurements (see Table 1). The measured c a ¯ values have a similar magnitude as the maximum lift coefficient derivative for the prototype’s Reynolds numbers ( R e = 1 × 10 7 ). This explains the similarities between the results of the analytic expressions, where C L α is dominant, and the measured values.
As seen in Figure 9, the measured values are between 5% and 40% larger than the predictions of the analytic approaches. This seems difficult to explain using the lift and drag coefficients’ derivatives at model’s Reynolds numbers ( R e = 2 × 10 4 ). The differences may be due to the different airfoils found in the blade, or to other not considered effects. In any case, this aspect must be further investigated in future wind tunnel measurements.

6. Conclusions and Outlook

The main objective of this study was to determine if it is possible to study the aerodynamic damping of wind turbines and its underlying phenomena through wind tunnel experiments using the forced oscillations method. The results of this study indicate that determining the aerodynamic damping of wind turbines through wind tunnel experiments is indeed possible, even though some issues must be addressed in future studies. In the following, these issues and some important aspects that could be observed during this study are summarized.
First of all, in all analytic approaches the derivative of the airfoil lift coefficient C L / α plays a major role in the determination of the aerodynamic damping. As a consequence, the goodness of the aerodynamic damping determination will depend strongly on the quality of the airfoil polars and on the determination of C L / α . Smooth lift derivative curves like the ones shown in the paper of Valamanesh and Myers [10] are rather uncommon; furthermore, if the polars are determined with software tools like XFOIL, the resulting peaky lift curves cause extreme values in the lift derivatives. For instance, we only obtained similar results to those shown on Valamanesh and Myers [10] when smoothing the lift coefficient curve over 15 ° . This is exemplified in Figure 11, where C L / α has been determined for the airfoil DU25 at Reynolds number R e = 1 × 10 6 . The first C L / α curve was calculated with a 1 ° smoothing, the second one with a 15 ° smoothing.
For the computational determination of the airfoil’s polars at the Reynolds ranges of interest, XFOIL was used. In the future, other methods based on CFD may be considered for the calculation of the polars. It is important to note that, in our opinion, the calculated polars should only be used in preliminary studies, full-scale calculations or predictions of wind tunnel results. For an accurate evaluation and interpretation of scaled wind tunnel measurements, we recommend always measuring in the wind tunnel the polars of the blades that will be used in the measurements.
Secondly, the results showed a high sensitivity to the tests’ oscillation parameters. For instance, the forced oscillations measurements were repeated with slightly higher and lower excitation frequencies than the ones exposed above. In the worst cases, the results varied as much as 20%, as shown in Figure 12. This emphasizes the need of setting as exactly as possible the involved test parameters, as well as the need of long and repeated measurements to account for wind turbulence and measurement inaccuracies. Future measurements should include uncertainty quantifications to better identify critical parameters in the wind tunnel measurements, as well as to quantify the meaningfulness of the results.
Finally, all measurements have been performed at low tip speed ratios due to the model’s large scale factor. In modern multi-megawatt wind turbines, these tip speed ratios are normally found at wind speeds above the rated one. These high wind speeds are scarcer in the wind turbine lifetime, as it can be derived from typical wind speed probability distributions, such as Weibull or Rayleigh probability density functions. Future studies should include measurements at optimal tip speed ratios (under rated wind speeds), ideally larger than λ = 5 . At these ideal tip speed ratios, the aerodynamic damping may be lower than at lower tip speed ratios, as partial flow separation may occur due to operation close to stall, see [9].
Regarding future measurements, some improvements should be considered before performing them.
One of the most critical aspects on wind tunnel testing are scale effects due to non-matching Reynolds numbers. As the profile polars are critical for the aerodynamic damping characterization, their exact determination and their insensitivity to scale effects should be guaranteed in any study. One of the most promising approaches is the use of low-Reynolds blade profiles, which present more stable lift curves in the ranges of interest and whose efficiency has already been proven in scaled wind turbines for wind tunnel experiments (see [44,45]). Extensive studies of these profiles can be found in the literature, where profile polars for Reynolds numbers as low as R e = 30 × 10 3 can be found [46,47,48,49].
Some specific aspects which occurred in this study should be avoided in future ones. For instance, extrapolation of reference measurements as shown in Figure 7 should be avoided. The measurements should be performed under laminar or low turbulence flow, to ensure a uniform loading of the rotor and simplify the studied situation. More measurements should be done for each operation condition, and ideally more operation conditions should be tested. Additionally, measurements of special conditions (pitch error, yawed error, forced false pitch angles) could be performed to prove the validity of the considered analytic approaches.
Correction factors have been used in the project BBTI to account for scale effects, see [23]. This should be avoided in the future, as these factors assume the knowledge of the exact blade behavior, and can introduce additional errors in the results. An exact determination of the blade profile polars should always be prioritized.
The wind turbine model used in this study bases on the reference wind turbine of the BBTI project [23], which is similar to the reference 5MW NREL turbine. Prototypes of future wind turbines aim to larger hub heights and rotor diameters than the ones used in this study, which will probably increase the importance of aerodynamic damping. Future measurements should therefore use wind turbine models based on larger wind turbines, with hub heights and rotor diameters approximately over 140 m and 150 m, respectively.
Finally, future wind tunnel measurements are planned considering the points exposed above. The measurements will be performed using low-Reynolds blade profiles to reduce scale effects and avoid the need of correction factors. Previously to the measurements with the whole wind turbine model, forced oscillation measurements using 2D-section models of the blades’ airfoils will be performed. This will allow an accurate determination of the aeroelastic wind forces on the blades’ profiles depending on oscillation amplitude and frequency, as well as close or over the stall state. While measuring the whole rotor, the involved main parameters, such as tip speed ratio, blade pitch, and forced oscillation amplitude and frequency, will be varied to study their impact on the aerodynamic damping.
In summary, one of the advantages of forced oscillation tests is the possibility to choose each of the dynamic parameters involved in the measurement, such as oscillation frequency and amplitude, tip speed ratio, and rotation to oscillation frequency ratio. This advantage allows studying individually the effect of each dynamic parameter, as well as identifying which parameters are of major relevance for the aerodynamic damping of wind turbines. Future wind tunnel measurements applying systematic variations of these dynamic parameters could facilitate considerably the development of analytic or semi-empirical expressions that describe accurately the aerodynamic damping of wind turbines. This could, one the one hand, allow a more accurate prediction of the wind turbine lifetime and, on the other hand, make possible the development of strategies that increase wind turbines aerodynamic damping, lifetime and profitability.

Author Contributions

Conceptualization, F.K. and R.F.; methodology, R.F. and F.K.; software, R.F.; validation, R.F.; formal analysis, R.F.; investigation, R.F. and F.K.; resources, F.K. and M.F.; data curation, R.F.; writing–original draft preparation, R.F.; writing–review and editing, R.F. and F.K.; visualization, R.F.; supervision, M.F., F.K.; project administration, F.K.; funding acquisition, F.K. and M.F.

Funding

This research was funded by the German Federal Ministry of Economics and Energy (BMWI) according to a decision of the German Federal Parliament with grant number 0325793.

Acknowledgments

The authors of this paper cordially thank the German Federal Ministry of Economics and Energy (BMWI) for the funding of this project.

Conflicts of Interest

The authors declare no conflict of interest.

References

  1. Wind Europe. Wind in Power: 2016 European Statistics; Wind Europe: Brussels, Belgium, 2016. [Google Scholar]
  2. Gasch, R. Windkraftanlagen: Grundlagen, Entwurf, Planung Und Betrieb, 9th ed.; Vieweg + Teubner Verlag: Berlin, Germany, 2016. [Google Scholar]
  3. Devriendt, C.; Jordaens, P.J.; Sitter, G.D.; Guillaume, P. Damping Estimation of an Offshore Wind Turbine on a Monopile Foundation. ET Renew. Power Generat. 2013, 7, 401. [Google Scholar] [CrossRef]
  4. Devriendt, C.; Weijtjens, W. The overall damping of an offshore wind turbine during different operating conditions. In Proceedings of the EWEA Offshore 2015, Copenhagen, Denmark, 10–12 March 2015. [Google Scholar]
  5. Devriendt, C.; Weijtjens, W. Damping of offshore wind turbines. In Proceedings of the Offshore Wind Energy 2017, London, UK, 6–8 June 2017. [Google Scholar]
  6. Hansen, M.H.; Thomsen, K.; Fuglsang, P.; Knudsen, T. Two methods for estimating aeroelastic damping of operational wind turbine modes from experiments. Wind Energy 2006, 9, 179–191. [Google Scholar] [CrossRef] [Green Version]
  7. Garrad, A.D. Forces and Dynamics of horizontal axis wind turbines. In Wind Energy Conversion Systems; Freris, L.L., Ed.; Prentice Hall: New York, NY, USA, 1990; pp. 119–142. [Google Scholar]
  8. Kühn, M.J. Dynamics and Design Optimisation of Offshore Wind Energy Conversion Systems; Report; DUWIND Delft University Wind Energy Research Institute: Delft, The Netherlands, 2001; Volume 2. [Google Scholar]
  9. Cerda Salzmann, D.J.; van der Tempel, J. Aerodynamic damping in the design of support structures for offshore wind turbines. In Proceedings of the Copenhagen Offshore Wind Conference, Delft, The Netherlands, 26–28 October 2005. [Google Scholar]
  10. Valamanesh, V.; Myers, A.T. Aerodynamic Damping and Seismic Response of Horizontal Axis Wind Turbine Towers. J. Struct. Eng. 2014, 140, 04014090. [Google Scholar] [CrossRef]
  11. Van der Tempel, J. Design of Support Structures for Offshore Wind Turbines; Report; DUWIND Delft University Wind Energy Research Institute: Delft, The Netherlands, 2006; Volume 29. [Google Scholar]
  12. Van der Tempel, J. Lifetime Fatigue of an Offshore Wind Turbine Support Structure, Section Offshore Technology & Section Wind Energy; Delft University of Technology: Delft, The Netherlands, 2000. [Google Scholar]
  13. Larsen, A. (Ed.) Aerodynamics of Large Bridges. In Proceedings of the 1st International Symposium on Aerodynamics of Large Bridges, Copenhagen, Denmark, 19–21 February 1992; Balkema: Rotterdam, The Netherlands, 1992. [Google Scholar]
  14. Svensson, H. Cable-Stayed Bridges: 40 Years of Experience Worldwide; Wiley: Hoboken, NJ, USA, 2013. [Google Scholar]
  15. Alan, G.; Davenport Wind Engineering Group. Wind Tunnel Testing: A General Outline; Western: London, ON, Canada, 2007. [Google Scholar]
  16. Tanaka, H. Similitude and modelling in wind tunnel testing of bridges. J. Wind Eng. Indust. Aerodyn. 1990, 33, 283–300. [Google Scholar] [CrossRef]
  17. Scanlan, R.H. Aeroelastic Simulation of Bridges. J. Struct. Eng. 1983, 109, 2829–2837. [Google Scholar] [CrossRef]
  18. Hortmanns, M. Zur Identifikation und Berücksichtigung Nichtlinearer Aeroelastischer Effekte; Stahlbau; Shaker: Aachen, Germany, 1997; Volume H.34. [Google Scholar]
  19. Fontecha, R. Determination of Flutter Derivatives of Bridge Sections Determination of Flutter Derivatives of Bridge Sections based on Wind Tunnel Experiments Under Forced Excitation. Master’s Thesis, RWTH Aachen, Aachen, Germany, 2012. [Google Scholar]
  20. Scanlan, R.H.; Sabzevari, A. Experimental Aerodynamic Coefficients in the Analytical Study of Suspension Bridge Flutter. J. Mech. Eng. Sci. 1969, 11, 234–242. [Google Scholar] [CrossRef]
  21. Steckley, A. Motion-induced Wind Forces on Chimneys and Tall Buildings; Canadian theses = Thèses canadiennes; National Library of Canada: Ottawa, ON, Canada, 1990. [Google Scholar]
  22. Steckley, A.; Vickery, B.J.; Isyumov, N. On the measurement of motion induced forces on models in turbulent shear flow. J. Wind Eng. Indust. Aerodyn. 1990, 36, 339–350. [Google Scholar] [CrossRef]
  23. Feldmann, M.; Jakobs, G.; Klinkel, S.; Butenweg, C.; Kemper, F.; Schelenz, R. Boden-Bauwerk-Triebstrang- Interaktion von Windenergieanlagen: Abschlussbericht; Final Report: 01.01.2015–12.31.2017; RWTH Aachen University: Aachen, Germany, 2018. [Google Scholar]
  24. Jonkman, J.; Butterfield, S.; Musial, W.; Scott, G. Definition of a 5-MW Reference Wind Turbine for Offshore System Development; National Renewable Energy Lab.: Lakewood, CO, USA, 2009. [Google Scholar]
  25. Lindenburg, C. Aeroelastic Modelling of the LMH64-5 Blade. Available online: http://citeseerx.ist.psu.edu/viewdoc/download?doi=10.1.1.475.7675rep=rep1type=pdf (accessed on 25 June 2019).
  26. Tschanz, T. The Base Balance Measurement Technique And Applications to Dynamic Wind Loading to Structures. Ph.D. Thesis, The University of Western Ontario, London, ON, Canada, July 1982. [Google Scholar]
  27. Tschanz, T.; Davenport, A.G. The base balance technique for the determination of dynamic wind loads. J. Wind Eng. Indust. Aerodyn. 1983, 13, 429–439. [Google Scholar] [CrossRef]
  28. Davenport, A.G. The Application of statistical concepts to the wind loading of stuctures. Proc. Inst. Civ. Eng. 1961, 19, 449–472. [Google Scholar] [CrossRef]
  29. Davenport, A.G. The Treatment of Wind Loading on Tall Buildings. In Tall Buildings; Elsevier: Amsterdam, The Netherlands, 1967; pp. 3–45. [Google Scholar] [CrossRef]
  30. Baniotopoulos, C.C.; Borri, C.; Stathopoulos, T. Environmental Wind Engineering And Design Of Wind Energy Structures; CISM Courses and Lectures; Springer: Vienna, Austria; New York, NY, USA, 2011; Volume 531. [Google Scholar]
  31. Burdett, T.A.; van Treuren, K.W. Scaling Small-Scale Wind Turbines for Wind Tunnel Testing. In Proceedings of the ASME Turbo Expo 2012, Copenhagen, Denmark, 11–15 June 2012; ASME: New York, NY, USA, 2012; p. 811. [Google Scholar] [CrossRef]
  32. White, F.M. Fluid Mechanics, 8th ed.; McGraw-Hill: New York, NY, USA, 2016. [Google Scholar]
  33. Irwin, P.A. Full Aeroelastic Model Tests. In Aerodynamics of Large Bridges; Larsen, A., Ed.; Balkema: Rotterdam, The Netherlands, 1992; pp. 125–135. [Google Scholar]
  34. Tanaka, H. Similitude and Modelling in Bridge Aerodynamics. In Aerodynamics of Large Bridges; Larsen, A., Ed.; Balkema: Rotterdam, The Netherlands, 1992; pp. 83–93. [Google Scholar]
  35. Fontecha, R. Determination of aerodynamic Damping and vortex-shedding Correlation Length of Wind Turbine Towers based on Wind Tunnel Experiments with the High Fre-quency Force Balance (HFFB) and Forced-Oscillations Methods. In Proceedings of the EACWE 2017, Liege, Belgium, 4–7 July 2017. [Google Scholar]
  36. Fontecha, R.; Henneke, B.; Kemper, F.; Feldmann, M. Aerodynamic properties of Wind Turbine Towers based on Wind Tunnel Experiments. Proc. Eng. 2017, 199, 3121–3126. [Google Scholar] [CrossRef]
  37. Van Treuren, K.W.; Burdett, T.A. Experimental Testing of Wind Turbines Using Wind Tunnels With an Emphasis on Small-Scale Wind Turbines Under Low Reynolds Numbers. In Aerodynamics of Wind Turbines; Amano, R., Sundén, B., Eds.; WIT Transactions on State of the Art in Science and Engineering; WIT Press: Ashurst, UK, 2014; Volume 1, pp. 67–110. [Google Scholar]
  38. Van Treuren, K.W. Small-Scale Wind Turbine Testing in Wind Tunnels Under Low Reynolds Number Conditions. J. Energy Res. Technol. 2015, 137, 051208. [Google Scholar] [CrossRef]
  39. Evangelista, R.; McGhee, R.J.; Walker, B.S. Correlation of Theory to Wind-Tunnel Data at Reynolds Numbers below 500,000. In Low Reynolds Number Aerodynamics; Mueller, T.J., Ed.; Lecture Notes in Engineering; Springer: Berlin/Heidelberg, Germany, 1989; Volume 54, pp. 146–160. [Google Scholar]
  40. Gao, X.; Hu, J. Numerical research of Reynolds number impact on scale model of wind turbine. In Proceedings of the 2009 World Non-Grid-Connected Wind Power and Energy Conference (WNWEC 2009), Nanjing, China, 24–26 September 2009; pp. 1–4. [Google Scholar] [CrossRef]
  41. XFOIL: Subsonic Airfoil Developement System. 2017. Available online: http://web.mit.edu/drela/Public/web/xfoil/ (accessed on 25 June 2019).
  42. Van Treuren, K.W.; Hays, A. Designing and Testing Small-Scale Horizontal Ais Wind Turbines for the Urban Environment. In Proceedings of the 1st Global Power and Propulsion Forum, Shangai, China, 31 October–1 November 2017. [Google Scholar]
  43. Deutsches Institut für Normung e. V. Eurocode 1: Actions on Structures—Part 1-4: General Actions—Wind Actions; Technical Committee: Brussels, Belgium, 2010. [Google Scholar]
  44. Bottasso, C.L.; Campagnolo, F.; Petrović, V. Wind tunnel testing of scaled wind turbine models: Beyond aerodynamics. J. Wind Eng. Indust. Aerodyn. 2014, 127, 11–28. [Google Scholar] [CrossRef]
  45. Bayati, I.; Belloli, M.; Bernini, L.; Mikkelsen, R.; Zasso, A. On the aero-elastic design of the DTU 10MW wind turbine blade for the LIFES50+ wind tunnel scale model. J. Phys. Conf. Ser. 2016, 753, 022028. [Google Scholar] [CrossRef]
  46. Selig, M.S.; Guglielmo, J.J.; Broeren, A.P.; Giguère, P. Summary of Low-Speed Airfoil Data; SoarTech Publications; SoarTech: Virginia Beach, VA, USA, 1995; Volume 1. [Google Scholar]
  47. Selig, M.S.; Lyon, C.A.; Giguère, P.; Ninham, C.N.; Guglielmo, J.J. Summary of Low-Speed Airfoil Data; SoarTech Publications; SoarTech: Virginia Beach, VA, USA, 1995; Volume 2. [Google Scholar]
  48. Lyon, C.A.; Broeren, A.P.; Giguère, P.; Gopalarathnam, A.; Selig, M.S. Summary of Low-Speed Airfoil Data; SoarTech Publications; SoarTech: Virginia Beach, VA, USA, 1995; Volume 3. [Google Scholar]
  49. Selig, M.S.; McGranahan, B.D. Wind Tunnel Aerodynamic Tests of Six Airfoils for Use on Small Wind Turbines; Techical Report; National Renewable Energy Laboratory: Golden, CO, USA, 2004. [Google Scholar]
Figure 1. Representation of the aerodynamic damping phenomena in wind turbines’ blades (based on [8]).
Energies 12 02452 g001
Figure 2. Tip speed ratio λ , Rotation speed and pitch of prototype wind turbine from cut-in to cut-out wind speeds.
Energies 12 02452 g002
Figure 3. Wind turbine tower model (a), overview of the wind turbine model in the wind tunnel (b), and side-view of nacelle model (c).
Energies 12 02452 g003
Figure 4. Lift (a) and Drag (b) coefficients for the DU25-profile at R e = 2 × 10 4 and R e = 1 × 10 7 according to wind tunnel measurements and XFOIL calculations.
Energies 12 02452 g004
Figure 5. Lift (a) and drag (b) coefficients of the blade model profiles calculated with XFOIL for R e = 2 × 10 4 .
Energies 12 02452 g005
Figure 6. Overview of the wind tunnel (a) and the test bench (b) used for the measurements.
Energies 12 02452 g006
Figure 7. Measured damping forces in forced oscillation tests.
Energies 12 02452 g007
Figure 8. Aerodynamic damping and stiffness in wind direction of the wind turbine tower model.
Energies 12 02452 g008
Figure 9. Calculated aerodynamic damping ratios for prototype and model wind turbine vs. aerodynamic damping ratios measured in the wind tunnel.
Energies 12 02452 g009
Figure 10. Lift and drag coefficient derivatives of airfoil DU25 for Reynolds numbers R e = 2 × 10 4 and R e = 1 × 10 7 compared to measured normalized aerodynamic damping coefficients c a ¯ .
Energies 12 02452 g010
Figure 11. Measured damping forces in forced oscillation tests.
Energies 12 02452 g011
Figure 12. Measured aerodynamic damping ratios using different excitation frequencies.
Energies 12 02452 g012
Table 1. Operation parameters for forced oscillation measurements of wind turbine model.
λ [-] u r e d [-] v P [m/s] Ω P [min−1] f n , P [Hz] β P [ ° ] v M [m/s] Ω M [min−1] f e , M [Hz] β M [ ° ]
2.833.724.8110.2126.463877.68.0
3.527.420.2110.2120.95/6408/4907.8/9.34.0
4.316.916.8110.2116.954979.40.0
Table 2. Calculated theoretical damping base moments due to aerodynamic damping of the tower.
λ P = M [-] u r e d , P = M [-] β [-] v M [m/s] f e , M [Hz] M B , a [Nm] v P [m/s] f n , P [Hz] M B , a [MNm]
2.833.7–3.1567.60.00724.80.210.42
3.527.4–2.555/67.8/9.30.006/0.00920.20.210.34
4.316.9–1.4559.40.00516.80.210.19
Table 3. Calculated theoretical damping base moments due to aerodynamic damping of the rotor.
λ P [-] v P [m/s] Ω P [min−1] f n , P [Hz] y ^ [m] ψ G e o m , P [kg/s] c a , P [kg/s] F T O P [kN] M B , a [MNm]
2.824.8110.210.751.30 × 1041.05 × 105101.111.3
3.520.2110.210.751.30 × 1040.85 × 10584.19.4
4.316.8110.210.751.31 × 1041.03 × 105101.511.4

