Factors Affecting the Uptake of Hybrid and Electric Vehicles in the European Union


1
European Commission, Joint Research Centre, 41092 Seville, Spain
2
Transport Studies Unit, University of Oxford, Oxford OX1 2JD, UK
*
Author to whom correspondence should be addressed.
†
Disclaimer: The views expressed are purely those of the authors and may not in any circumstances be regarded as stating an official position of the European Commission.
Energies 2019, 12(18), 3414; https://0-doi-org.brum.beds.ac.uk/10.3390/en12183414
Submission received: 22 July 2019
/
Revised: 23 August 2019
/
Accepted: 31 August 2019
/
Published: 4 September 2019
(This article belongs to the Special Issue Electric Vehicle Charging: Social and Technical Issues)
Abstract
:This paper explores the factors affecting the uptake of hybrid and electric vehicles in the European Union (EU) using data from two extensive cross-sectional surveys. Each survey consists of 26,500 responses to a questionnaire that combines socio-economic and behavioral aspects. The share of respondents across the EU stating that they would certainly or probably consider purchasing a hybrid or a battery-powered electric vehicle (H&EV) in the near future rose from 32% in 2014 to 37.4% in 2018. There is, however, a high variability among EU member states, as well as across different socio-economic groups. Propensity is highly correlated with income, educational attainment, and urbanization level. In order to address the high degree of collinearity, we applied a machine learning classification model to analyze and explain the interaction between the variables that affected the expressed propensity to purchase such a vehicle. The findings highlight something largely missing from the literature, namely that local conditions and regional variation are a major, if not decisive, factor regarding purchasing choices. Seen from a policy perspective, this conclusion may provide guidance regarding how to support the take up of H&EVs through measures that are tailored to the specific needs at the local level.
1. Introduction
The objective of this paper was to shed light on the socio-demographic characteristics of potential adopters of hybrid and electric vehicles (H&EVs) and to identify the main drivers for such a purchasing decision in Europe. In this study all hybrid and electric vehicles (H&EVs) are included. These include:
- hybrid electric vehicles (HEV),
- plug-in hybrids (PHEV),
- range-extended electric vehicles (E-REV),
- battery powered electric vehicles (BEV), and
- vehicles powered by hydrogen fuel cell technologies (FCEV).
We used data from two extensive user surveys in the European Union (EU) and applied a machine learning classification model in order to evaluate the impact of each respondent’s profile, taking into account the high degree of collinearity among several of the variables that affected their choices.
There are over a million H&EV registered in the European Union but they still constitute only about 2% of the market share between 2010 and 2017 [1]. Despite the promising market growth trends for H&EVs, several barriers are still preventing their more widespread uptake. There have been numerous studies discussing possible factors affecting adoption rates. These range from high purchase cost, to recharging availability, “range anxiety,” and consumer awareness, amongst others. Nevertheless, while most barriers are gradually being removed—as a result of improved technology, lower prices, or expanding infrastructure—the uptake of H&EVs follows diverse patterns across different geographic areas and socio-economic groups.
Most studies on the uptake of electric vehicles are based on intentions of adoption, mainly through stated preference studies. Since the market share of H&EVs is still low, the revealed preferences of users who actually made a purchase are not considered representative. Furthermore, consumer preferences cannot be assumed to be static, particularly over the longer term. Most published work analyzes the characteristics of early adopters, which will probably differ significantly from mainstream users [2]. Once electric vehicles become more commonplace, we can expect the socio-demographic characteristics of potential adopters to alter.
How can we define the socio-demographic dimensions that are relevant to user choices concerning H&EVs? Location plays a role, either with regard to the country of residence or the type of urbanization (urban or rural, central or peripheral) [3]. The adoption of electric vehicles has been shown to depend on a combination of psychological and socio-economic factors expressed as consumer attitudes, environmental attitudes and awareness, symbolism and self-identity, diffusion of innovation, and emotional responses [4]. Using different perspectives, influential factors have been grouped into socio-economic variables, psychological factors, mobility condition, and social influence [5], or demographic, situational, and psychological [6]. From the operational perspective, the characteristics of electric vehicles also affect purchasing decisions. These can relate to charging, “range anxiety,” environmental credentials, and image. Numerous studies also create psychological typologies of users and measure their willingness-to-buy against their responses to questionnaires [7].
Since a large share of the related literature is based on studies regarding willingness-to-buy, it is important to gauge how familiar the prospective buyers are with electric vehicles. In a study of six large European countries, 46% of the respondents declared that they were “not at all familiar” with electric cars, ranging from 35% in Italy to 58% in France [8]. This is not a European only phenomenon; studies in the United States showed that less than half of consumers were able to name a specific plug-in electric vehicle make and model [9], and fewer than 35% of California households were aware of incentives offered for the purchase of electric vehicles [10]. Some early studies suggested that direct experience of electric vehicles is a crucial factor in the conversion of the public from existing skepticism to acceptance and approval [11]. In contrast, a large-scale online survey of consumers in 16 European countries in 2013 indicated that 52% of respondents were aware of both electric and hybrid vehicles [12]; however, the study does not indicate how deep this awareness was.
Cost, principally up-front purchase cost, remains the primary concern of potential buyers in Europe and elsewhere [13]. However, some recent studies are challenging the notion that electric cars are necessarily more expensive. For instance, an analysis of taxes in four European countries (France, Germany, Norway, and the United Kingdom) suggests that ownership costs for electric vehicles are lower than for conventional ones over a four-year period [14].
A well-known fear amongst potential purchasers of electric vehicles is the so-called “range anxiety,” i.e., that they will be left stranded with an empty battery and nowhere to recharge it. It is often cited as the second highest impediment to the adoption of an electric vehicle after that of purchase cost [2,15]. Thus, an adequate infrastructure network in terms of efficient and compatible charging points is a prerequisite for the uptake of electric vehicles. This remains a key concern for potential users and actual vehicle owners in many markets including China, which is the country that has the highest number of electric vehicles [16].
There is far from unanimity in the literature regarding the impact of socio-demographic characteristics on the uptake of hybrid and electric vehicles. Gender analyses suggest that males are by far more enthusiastic adopters of electric vehicles [17]. However, others argue that in China it is females that show the greatest propensity to buy [18], or find no discernible difference between genders [19]. Regarding age and residence, the young and the urban residents are the ones that have been largely identified as most likely to become buyers of electric vehicles [8]. However, Vassileva and Campillo [17] suggest that it is middle-aged men that are the main potential customers. They also highlight that even though 40% of all electric vehicles in Sweden are registered in the county of Stockholm, only 8% are in the city of Stockholm and the rest are in low-density suburbs. Yet other studies indicate that enthusiasm for electric vehicles cuts across age bands [20]. In that case, the combination of age and attitude is a good indicator of potential uptake, suggesting that adopters could be both the young “pioneers” as well as the middle aged “pragmatists.” Studies on the spatial distribution of registered electric vehicles show a great regional variation and one that does not fit easily into an urban/rural dichotomy. For instance, a high proportion of electric vehicles are registered in London but not so in Manchester or Liverpool [21].
Since electric vehicles are perceived as expensive, especially in terms of the initial purchase cost, it is often assumed that higher income groups are those most likely to be adopters. Higher income groups and the wealthier countries would probably adopt the new vehicles earlier, but as electric cars become more plentiful and their relative price falls, income will be less of a decisive factor [22]. However, market shares vary considerably and do not seem to correlate strongly with income per capita [23]. The level of formal education and work status are identified as important in a limited number of studies. In Sweden, 77% of those purchasing electric vehicles had a university degree [17]. Income, level of education, and the number of charging stations per capita have been shown to be significant factors in adoption and, by contrast, age, gender, and employment have been found to be insignificant [24]. Concern about the environment may be more likely to favor the purchase of an electric vehicle as electric vehicles have low tailpipe exhausts [25].
Another aspect often explored is how actions to support the uptake of H&EV influence user choices. The uptake of alternative energy in transport can be enforced through regulations [26,27] or wider public promotional measures [28]. In Norway, the European country with the highest penetration of electric vehicles, tax exemptions have a substantial effect on electric vehicle purchase costs [29] but are accompanied by several incentives such as exemption from road tolling and from paying tickets on most ferries, free use of municipal public parking spaces, and free access to bus lanes [30]. Actions at the local level can be particularly successful in stimulating the uptake of new transport technologies [31].
Overall, the literature on the socio-demographic characteristics of potential adopters of H&EVs is far from unanimous. Different studies have shown age, gender, income, and other variables may or may not significantly affect decision to by an H&EV. Similarly, knowledge of electric vehicles, attitudes towards the environment, and charging infrastructure may also play a defining role. Purchase cost, taxation, and local incentives are also seen as having a significant role.
Why is it important to understand the factors that affect the uptake of H&EVs? Given that these technologies have been identified as promising by policy makers and vehicle manufacturers, a better understanding of their market potential would help all stakeholders formulate suitable policy initiatives and business strategies. Shifting to alternative energy carriers or power drives can reduce fuel consumption and the dependency on conventional fuels [32]. Depending on the fuel mix used for power generation, H&EVs are expected to be an important contributor to the reduction of emissions of greenhouse gases and local pollutants [33]. The uptake of electric vehicles and their contribution to the reductions of emissions are an important step toward improving the sustainability of road transport. In fact, H&EVs are directly relevant to the sustainable development goals of the United Nations, particularly those of affordable and clean energy (goal 7), sustainable cities and communities (goal 11), and climate action (goal 13) [34].
The structure of the paper is as follows: Section 2 describes the methods used, with particular emphasis on the classification models developed. Section 3 describes the data and explores the correlation between the variables. Section 4 discusses the results and identifies the factors that affect user choices. Finally, Section 5 presents the conclusions of the paper.
2. Method
Our approach was based on a classification model that uses the results of two cross-sectional surveys, carried out across all 28 EU member states in 2014 [35] and 2018 [36]. The model predicts whether a respondent is likely to have stated a high propensity to purchase a hybrid or electric car using the respondent’s answers to the other survey questions as independent variables. Since most of the survey questions correspond to socio-economic or behavioral variables, a robust predictive model allows for the identification of the variables that affect this choice the most and can help policymakers and other stakeholders in improving their strategies to increase the market share of new car technologies.
We used the gradient boosting method, a machine learning technique with numerous applications in predictive modelling [37]. The applications of machine learning classifiers in transport are rapidly increasing. For example, Choi and Ahn [38] conducted a multi-level analysis combining individual and urban characteristics regarding model trip preferences, Focas and Christidis [39] analyzed car use, while Cheng et al. [40] developed a mode choice model using a random forest method. Machine learning approaches allow for a higher model precision in modelling user choices than conventional stated preference methods [41].
The main advantages of using a data driven, tree-based approach, as opposed to other discrete choice methods frequently used in the literature (multinomial logit, hybrid choice, or latent class models), are the ability to account for the co-dependence between independent variables and the absence of strict assumptions concerning the model structure and parameters. Moreover, in the particular case of the surveys used here, gradient boosting classifiers allow for the use of categorical variables without assuming proportional odds, i.e., constant distances or monotonous relationships between their values. Machine learning approaches offer a wide range of metrics to estimate model precision, as well as tools for the interpretation of the results. A potential disadvantage of such approaches stems from the nature of the issue to be analyzed: the large number of non-linear tree-like decisions may obscure the physical interpretation of the resulting model [42,43]. Additionally, unless a suitable validation strategy is in place, models that overfit with respect to their underlying data may not generalize well when applied to new data.
The dependent variable of our model was a binary variable (0/1) indicating whether the user had a high propensity to purchase a hybrid or electric vehicle (value = 1) or not (value = 0). The binary variable was a direct transformation of the original multiclass response variable in order to simplify the model and concentrate on the two responses of main interest (high propensity corresponds to “certainly yes” or “probably yes”). The modelling setup followed a 40–40–20% random split of the dataset into training, testing, and validation sets, respectively. This a standard practice in machine learning predictive modelling. The model was trained on the training set and its precision was evaluated using the testing set. The validation set was used for the final evaluation to ensure that the model did not overfit and that it could generalize sufficiently well to previously unseen data. As an evaluation metric, we used AUC (area under the curve), the most frequently used aggregate measure of performance for classification models. AUC is a function of the true positive and false positive rates of the model results and can range from 0 (when predictions are 100% wrong) to 1 (when all predictions are correct). Regarding feature engineering, we created additional variables based on the two-way interaction of categorical variables. The categorical variables, original and engineered, were subsequently transformed into numeric variables using the standard mean likelihood encoding technique (probability of the dependent variable, conditional on each category value).
We constructed two different base models using the variables included in the year 2014 survey (model A) and the year 2018 survey (model B) respectively. The difference between the A and B models was the inclusion in the 2018 survey of four questions concerning Information and Communication Technologies (ICT) use and solutions, online-shopping, and teleworking, which were not present in the 2014 survey, plus the resulting two-way interaction variables.
The train–test–validation procedure was performed in three combinations:
- Model A 2014: questions in the 2014 survey, using 2014 data.
- Model A 2018: questions in the 2014 survey, using 2018 data.
- Model B 2018: questions in the 2018 survey, using 2018 data.
We selected the model gradient boosting hyperparameters based on the highest AUC evaluation score for the validation set in Model B 2018. Applying them in all three model combinations yielded the results presented in Table 1.
All three models achieved a satisfactory level of precision, explaining a considerable part of the variance in user preferences. There were obviously additional factors that influenced the responses and were not covered by the surveys used, but the overall model performance was sufficient for conclusions on certain aspects to be drawn. The stability of the validation set AUC when using different years in model A (0.789 with 2014 data, 0.791 with 2018 data) suggests that the model could be generalized using different datasets and that the relative importance of its variables remained constant between the two points in time.
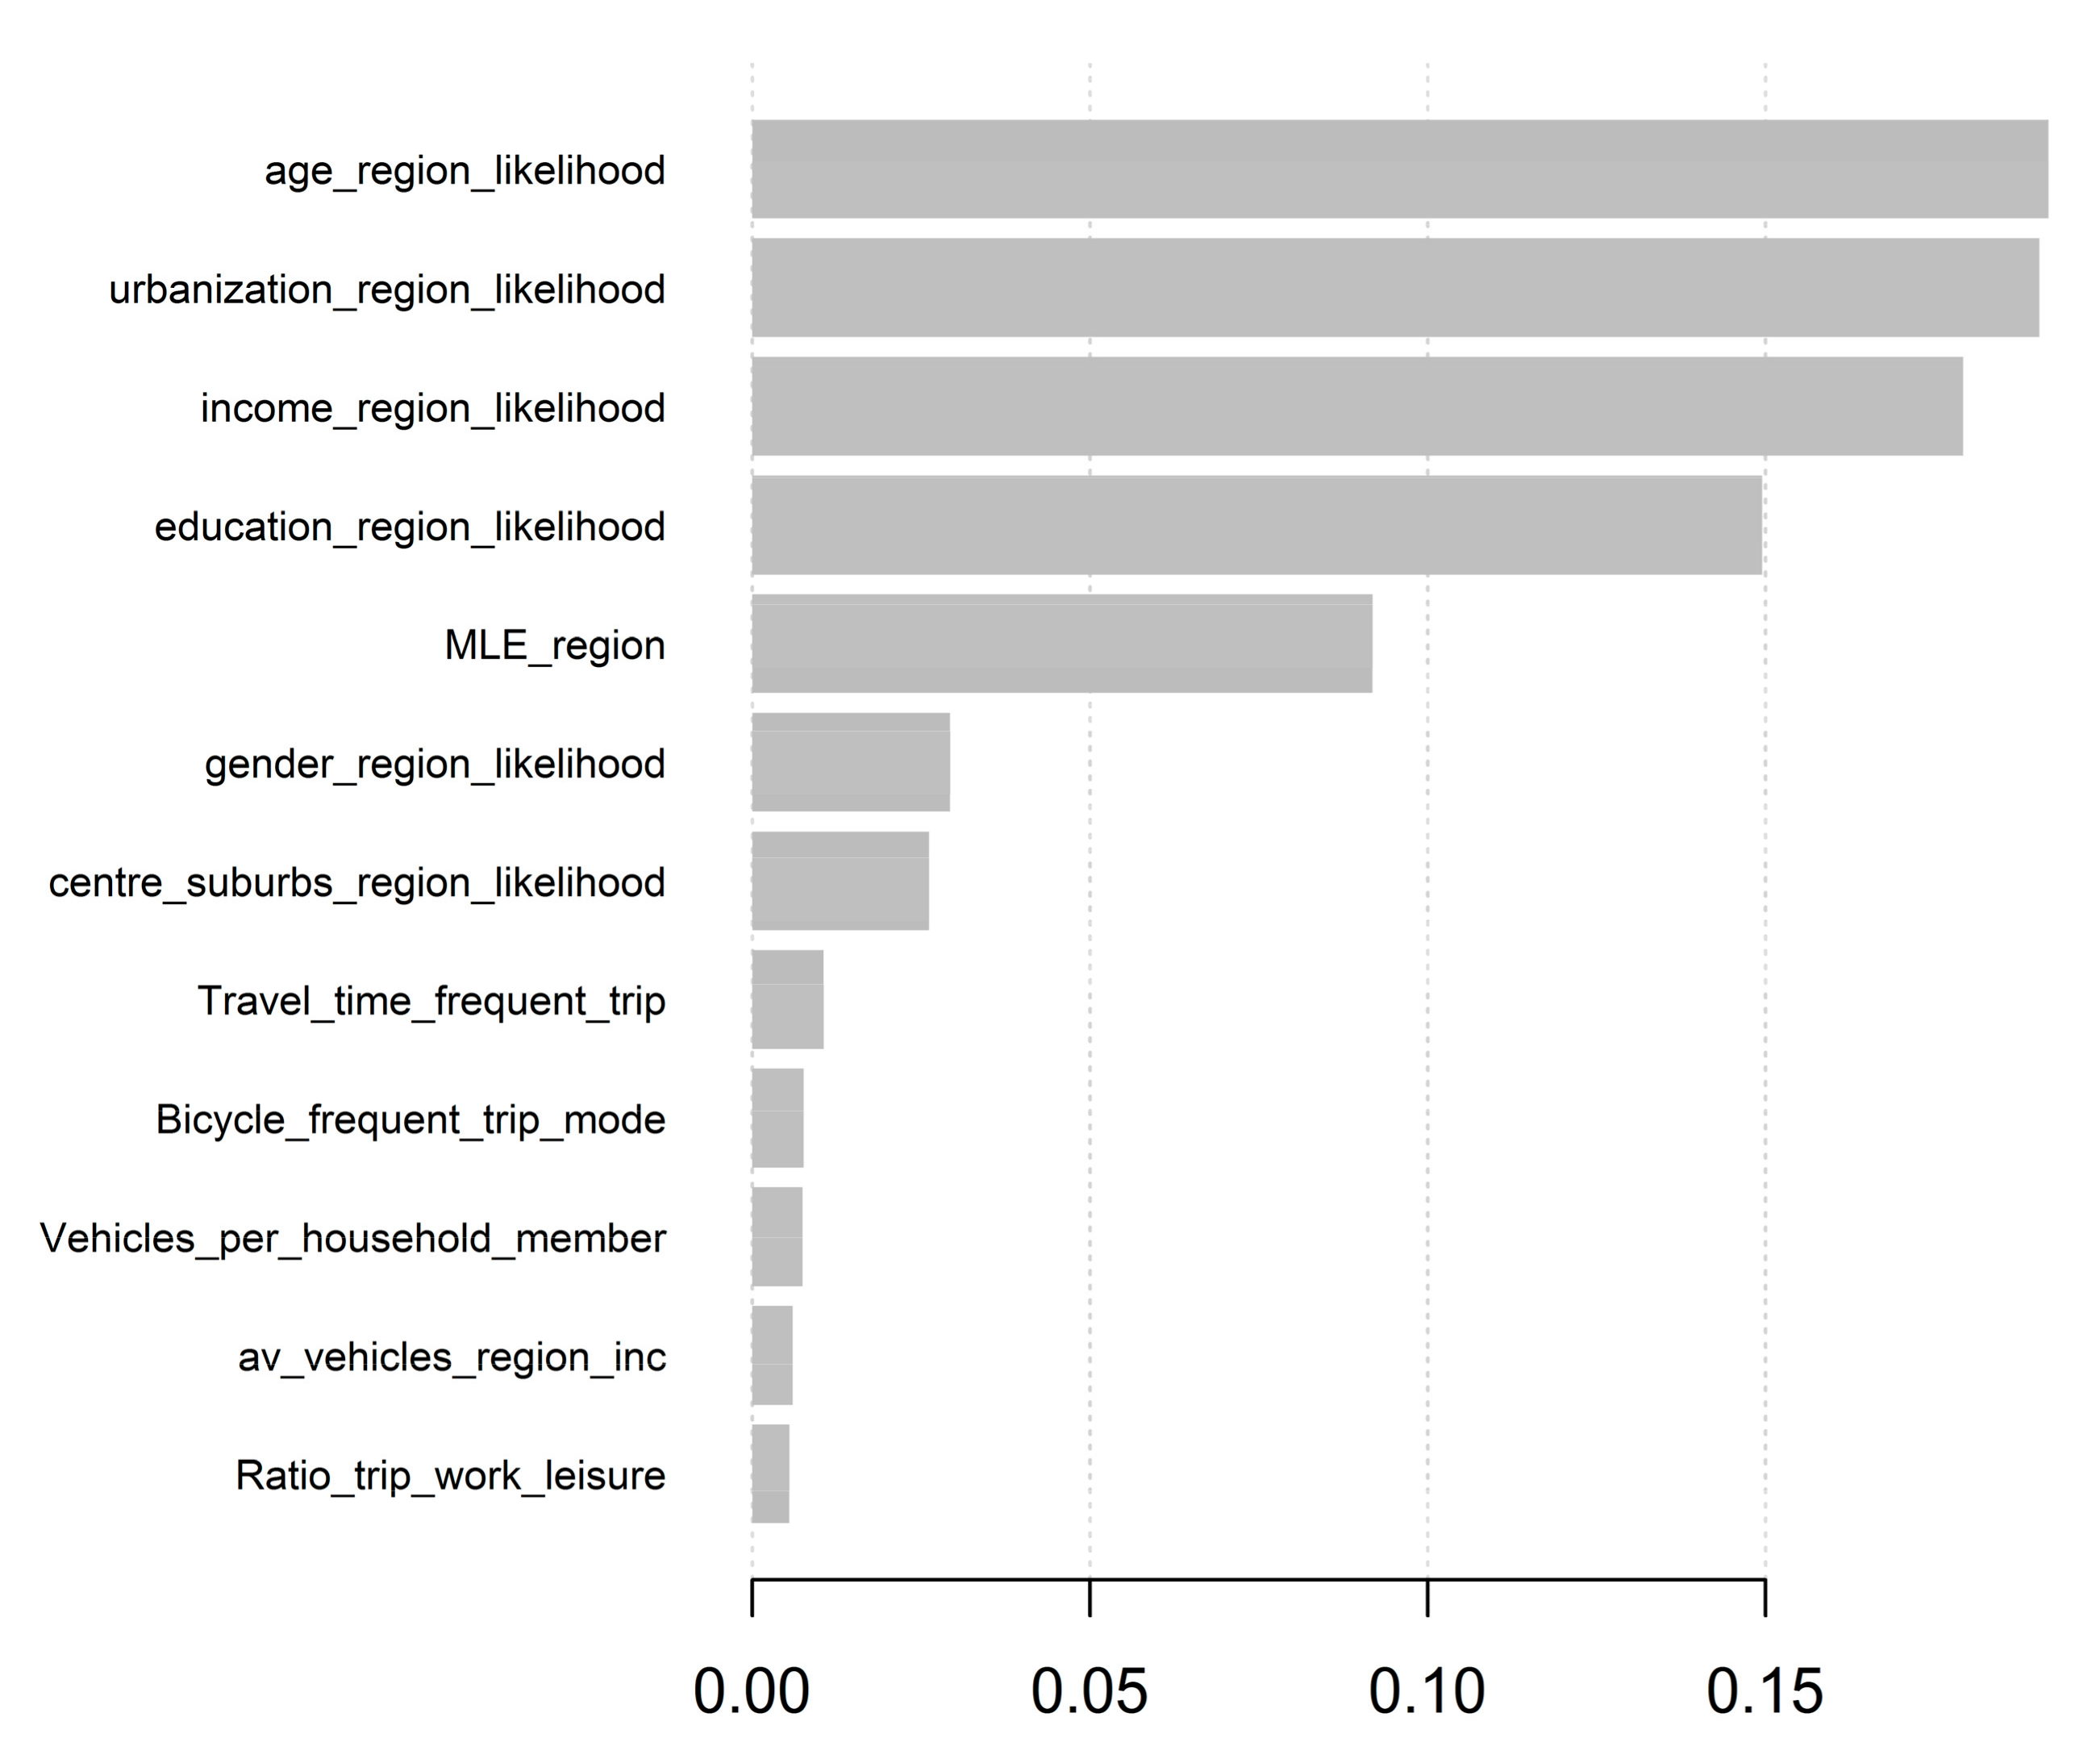
Likelihood by age and income played an important role in all three models, while the importance of the region’s level of education and urbanization declined between 2014 and 2018. The average likelihood at a regional level and at a center/suburb level remained equally important between time points. The importance of gender, already relatively low in 2014, decreased further. The change in the importance of the variables suggests that while the adopter profile remained centered on specific age and income groups and was still dependent on the local conditions of the respondents’ region and urbanization level (Section 3 and Figures 5–7), the concept of H&EVs has become more familiar to respondents in other socio-economic groups. As a result, the variation in the propensity to purchase appeared to decrease between 2014 and 2018.
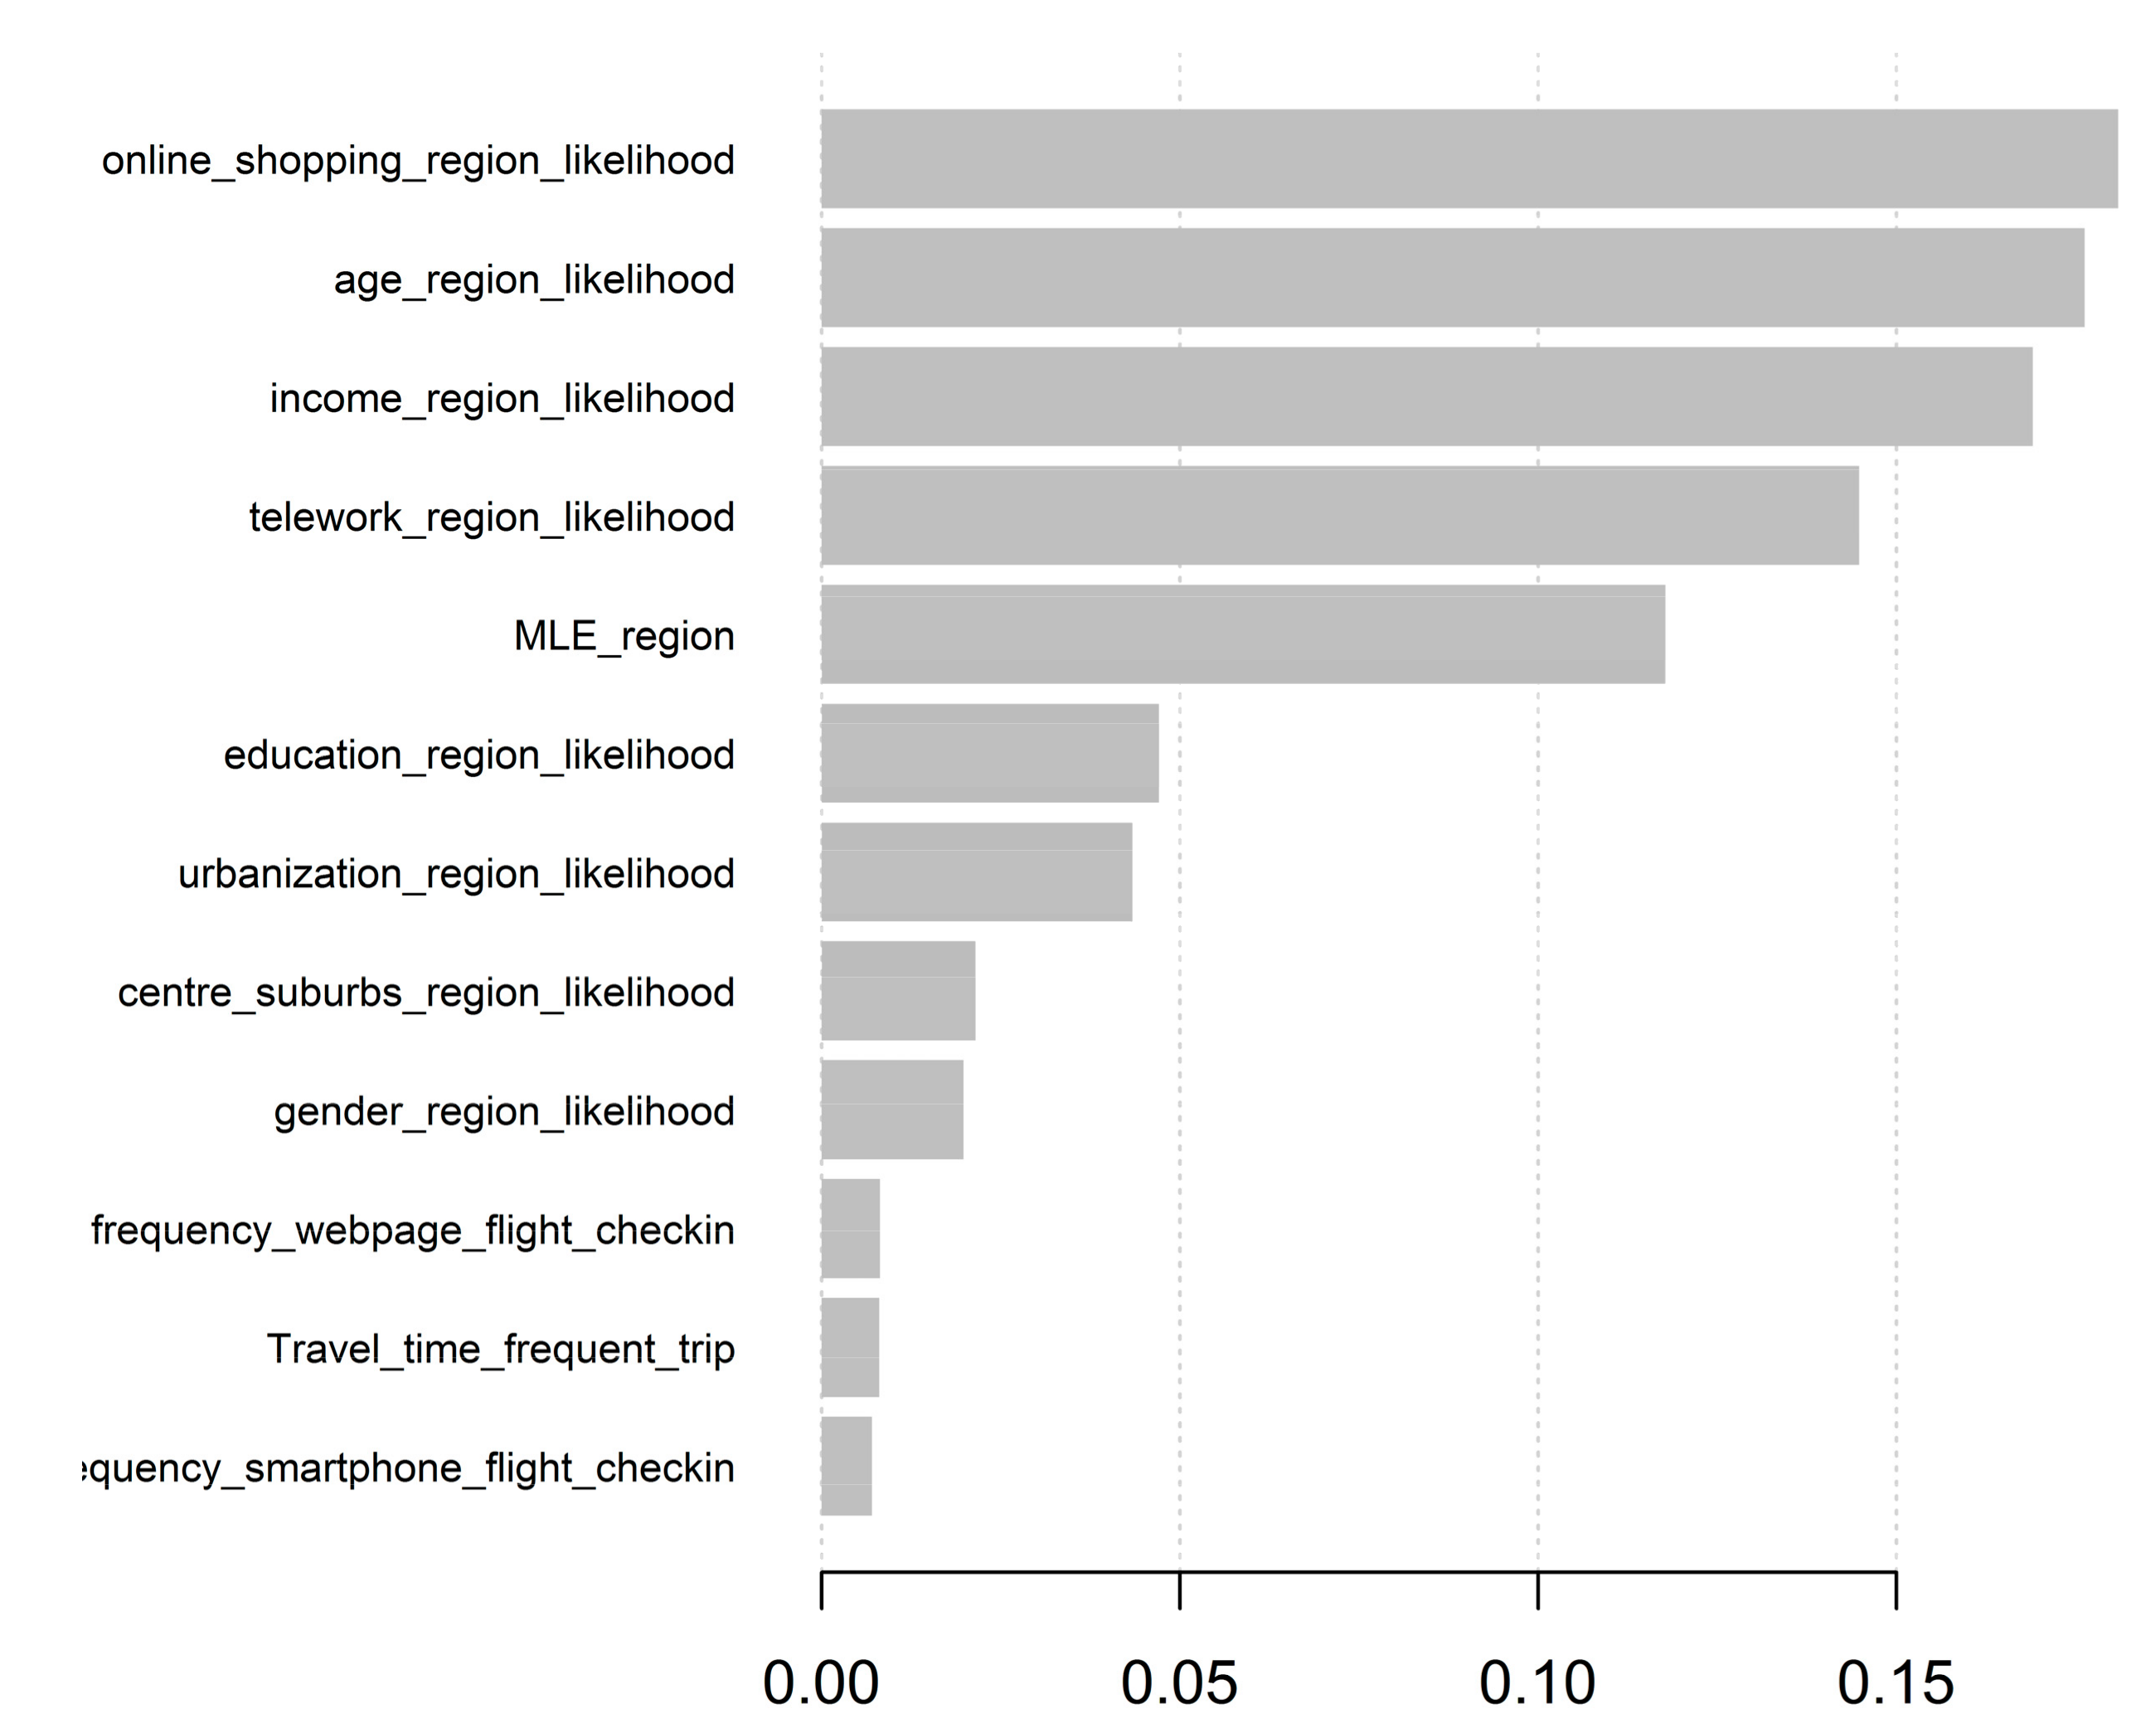
The considerable improvement between model A and model B when using the year 2018 data (AUC from 0.791 to 0.821) could be attributed to the inclusion of the four new questions in the year 2018 survey, which allowed the model to capture additional information that could enrich the interpretation of certain behavioral aspects. The number of variables that were considered as important (i.e., contribute to variance) were 115 in model A. Adding the year 2018 new survey questions and their derived variables increased the number of important variables to 164 in model B.
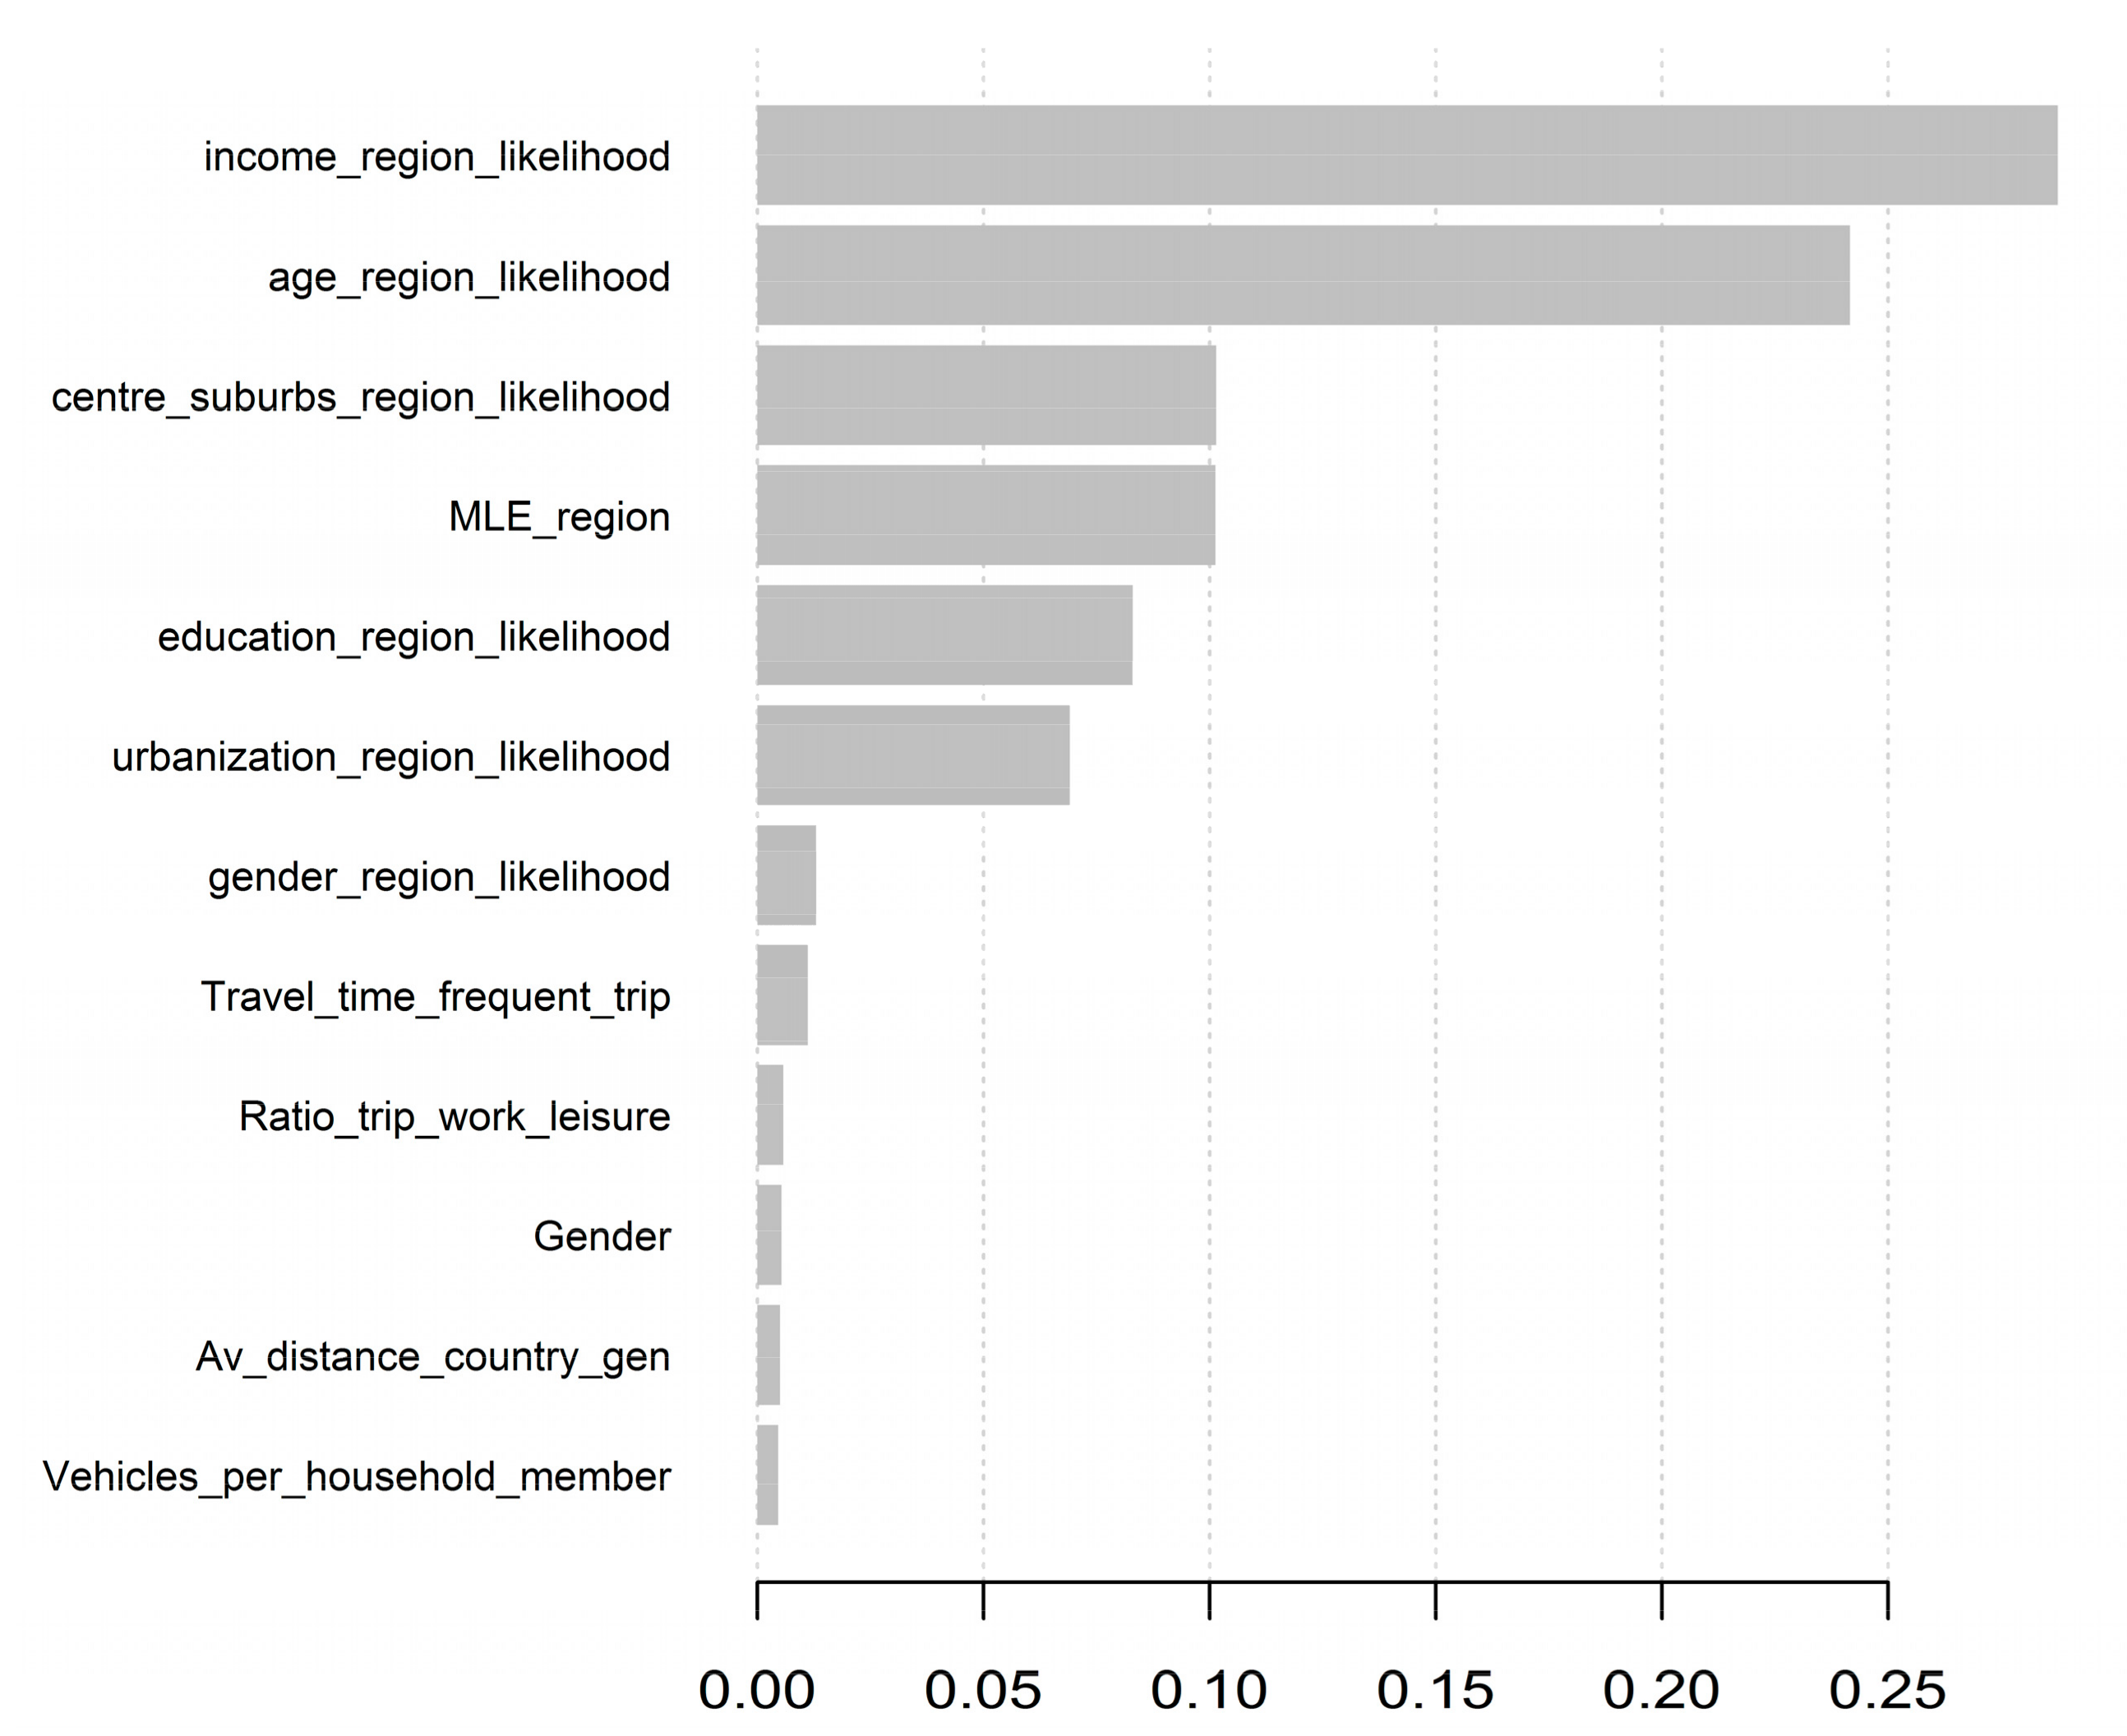
Figure 1, Figure 2 and Figure 3 show the twelve variables with the highest relative importance of the boosted decision trees within each model, ranked in terms of the contribution of each variable to the model. Variable names that include “likelihood” were derived from the mean likelihood encoding (MLE) of category combinations.
3. Survey Structure and Main Variables
The two surveys used the computer aided web interview (CAWI) methodology and aimed to collect information on mobility patterns across Europe. The surveys focused on the use of transport modes for urban and long-distance mobility, as well as the users’ attitudes toward specific policy measures and technologies.
The survey respondents were segmented according to socio-economic characteristics and were asked to fill in the same questionnaire, translated in the local language, divided into four sections [35,36,44]:
- General information on the respondent, e.g., age, gender, living area, and availability of cars and public transport.
- Everyday mobility in terms of mode used, frequency of trips, duration, distance, inter-modality, and judgments on main problems experienced.
- Long-distance trips: between 300 km and 1000 km and over 1000 km by purpose and by mode made in the last 12 months.
- Attitude toward innovative transport services and transport policy issues.
The participants of the survey were selected randomly using target quotas in each country to ensure that the share of individuals in the sample belonging to a certain group was representative of the share of individuals belonging to the same group in the population. The stratification of the sample was based on four variables:
- age and gender
- employment status
- level of education
- region of residence.
The result was a sample of 1000 respondents (500 for Cyprus, Luxembourg, and Malta) in each country that met all four stratification criteria. This meant that the sample was representative of the country’s population and socio-economic conditions. This sampling approach also limited the impact of the known issue of non-representativeness of individuals without access to the Internet. All demographic and socio-economic groups were represented proportionally to their participation in the population, even in the cases where the group’s access to the Internet was significantly lower than that of the overall population.
The variables we used here correspond to a subset of the original survey questions that could be potentially relevant to a user’s decision to purchase a hybrid or electric car. We selected 27 questions used in both the 2014 and 2018 surveys, plus 4 questions that were only used in the 2018 survey. Given the nature of the surveys, the majority of the questions required the user to choose from a limited number of possible answers. The resulting datasets included, as a result, predominantly categorical variables with various levels of cardinality. This data binning approach facilitated respondents to complete the survey and analysts to perform comparisons between a finite number of aggregate categories, but obviously limited the quality of the information provided. The set of variables used and their main characteristics are summarized in Table 2.
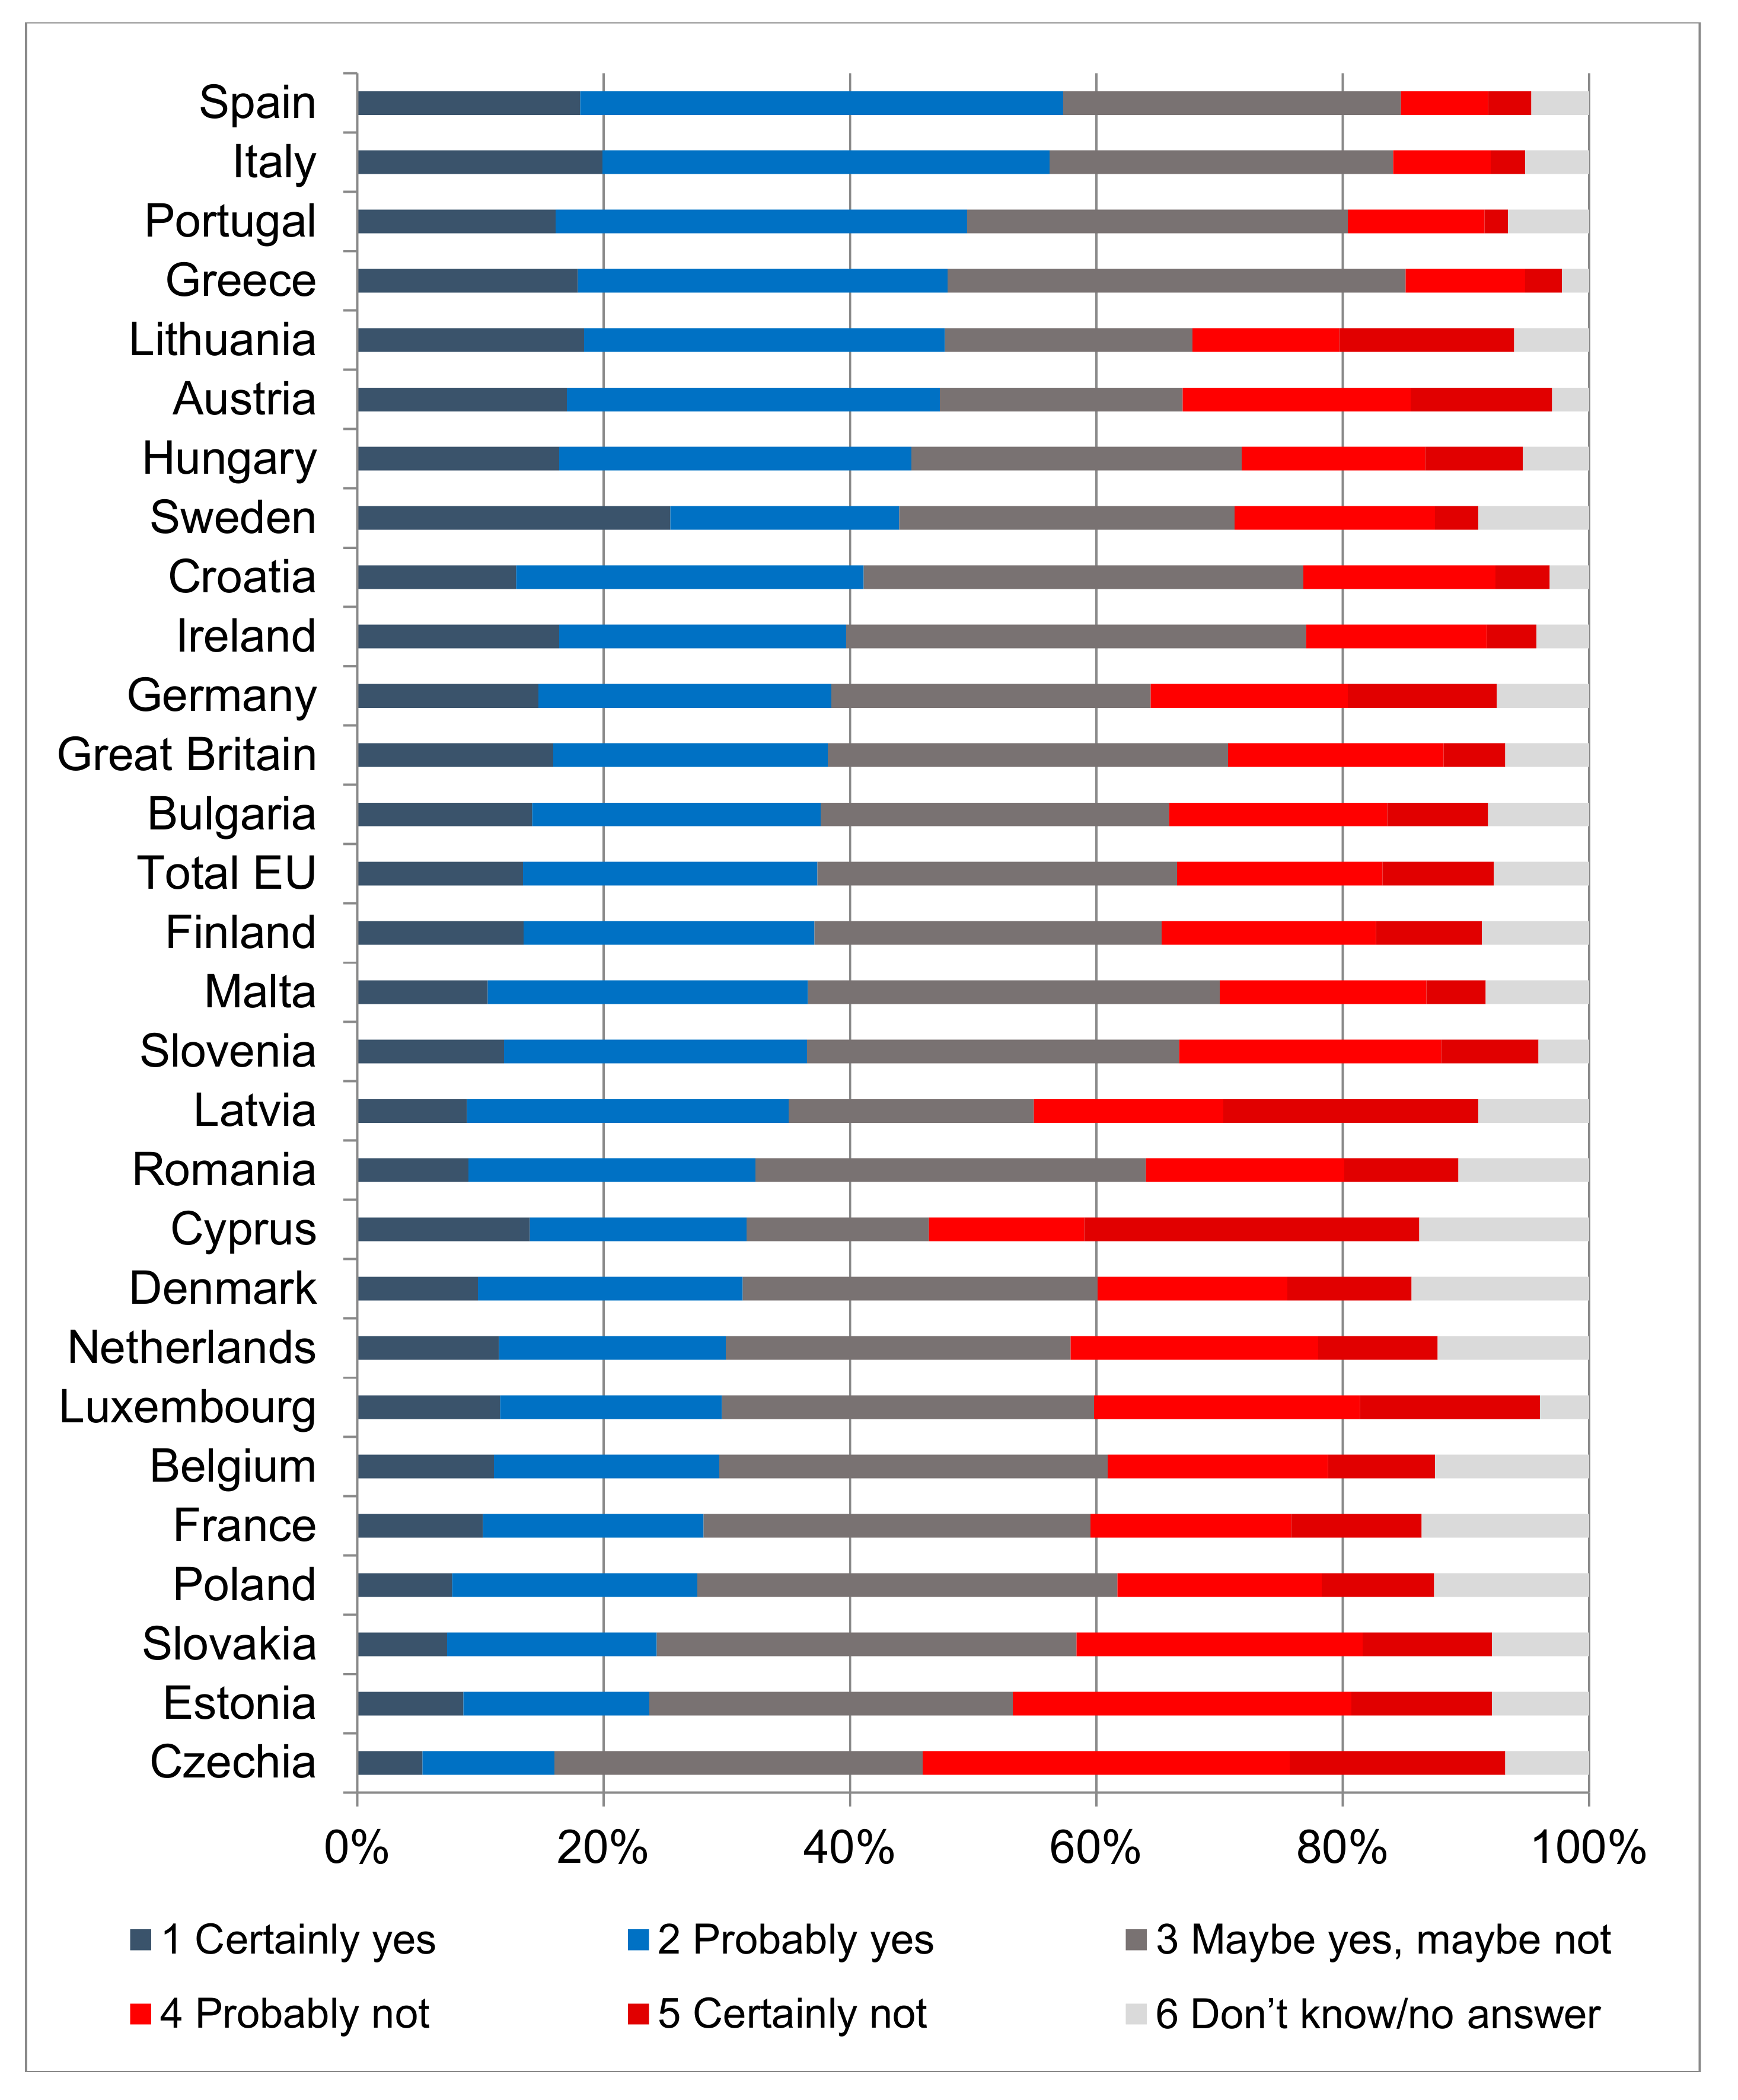
The share of respondents across the EU who would certainly or probably consider purchasing an H&EV in the near future rose from 32% in 2014 to 37.4% in 2018. There was however a high variability among EU member states, with values that ranged from 16% in Czechia to 57% in Spain (Figure 4).
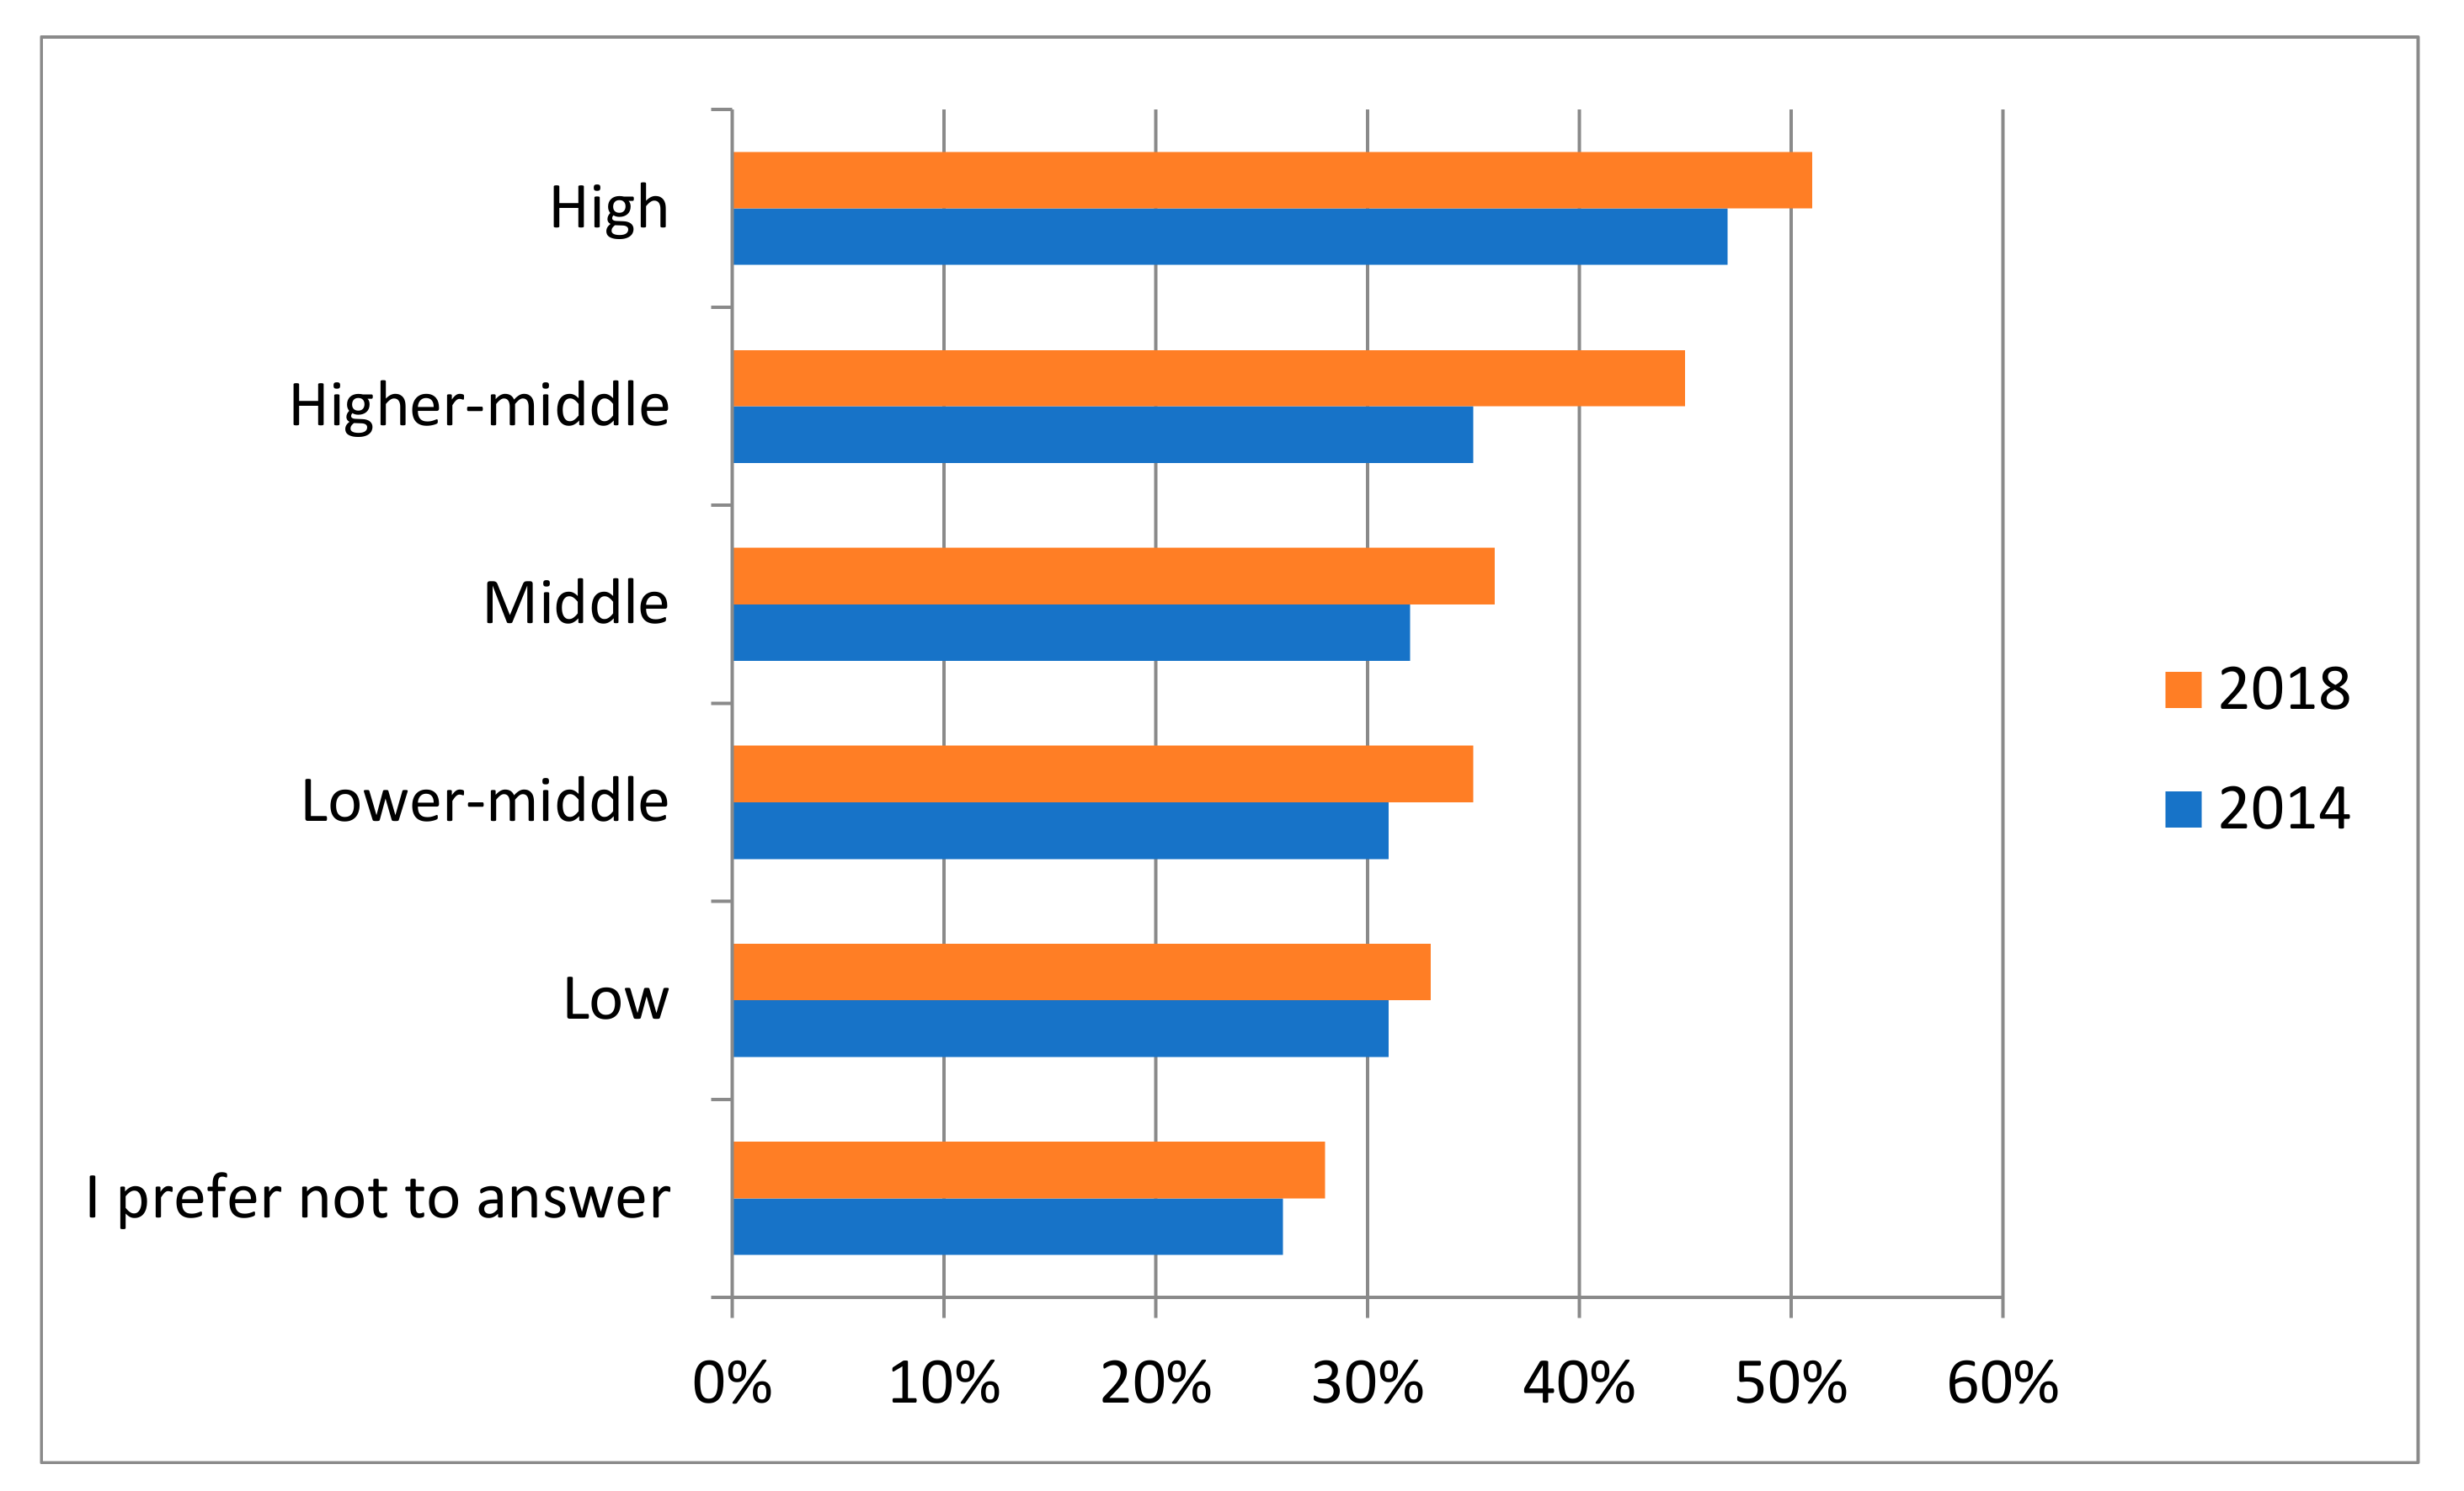
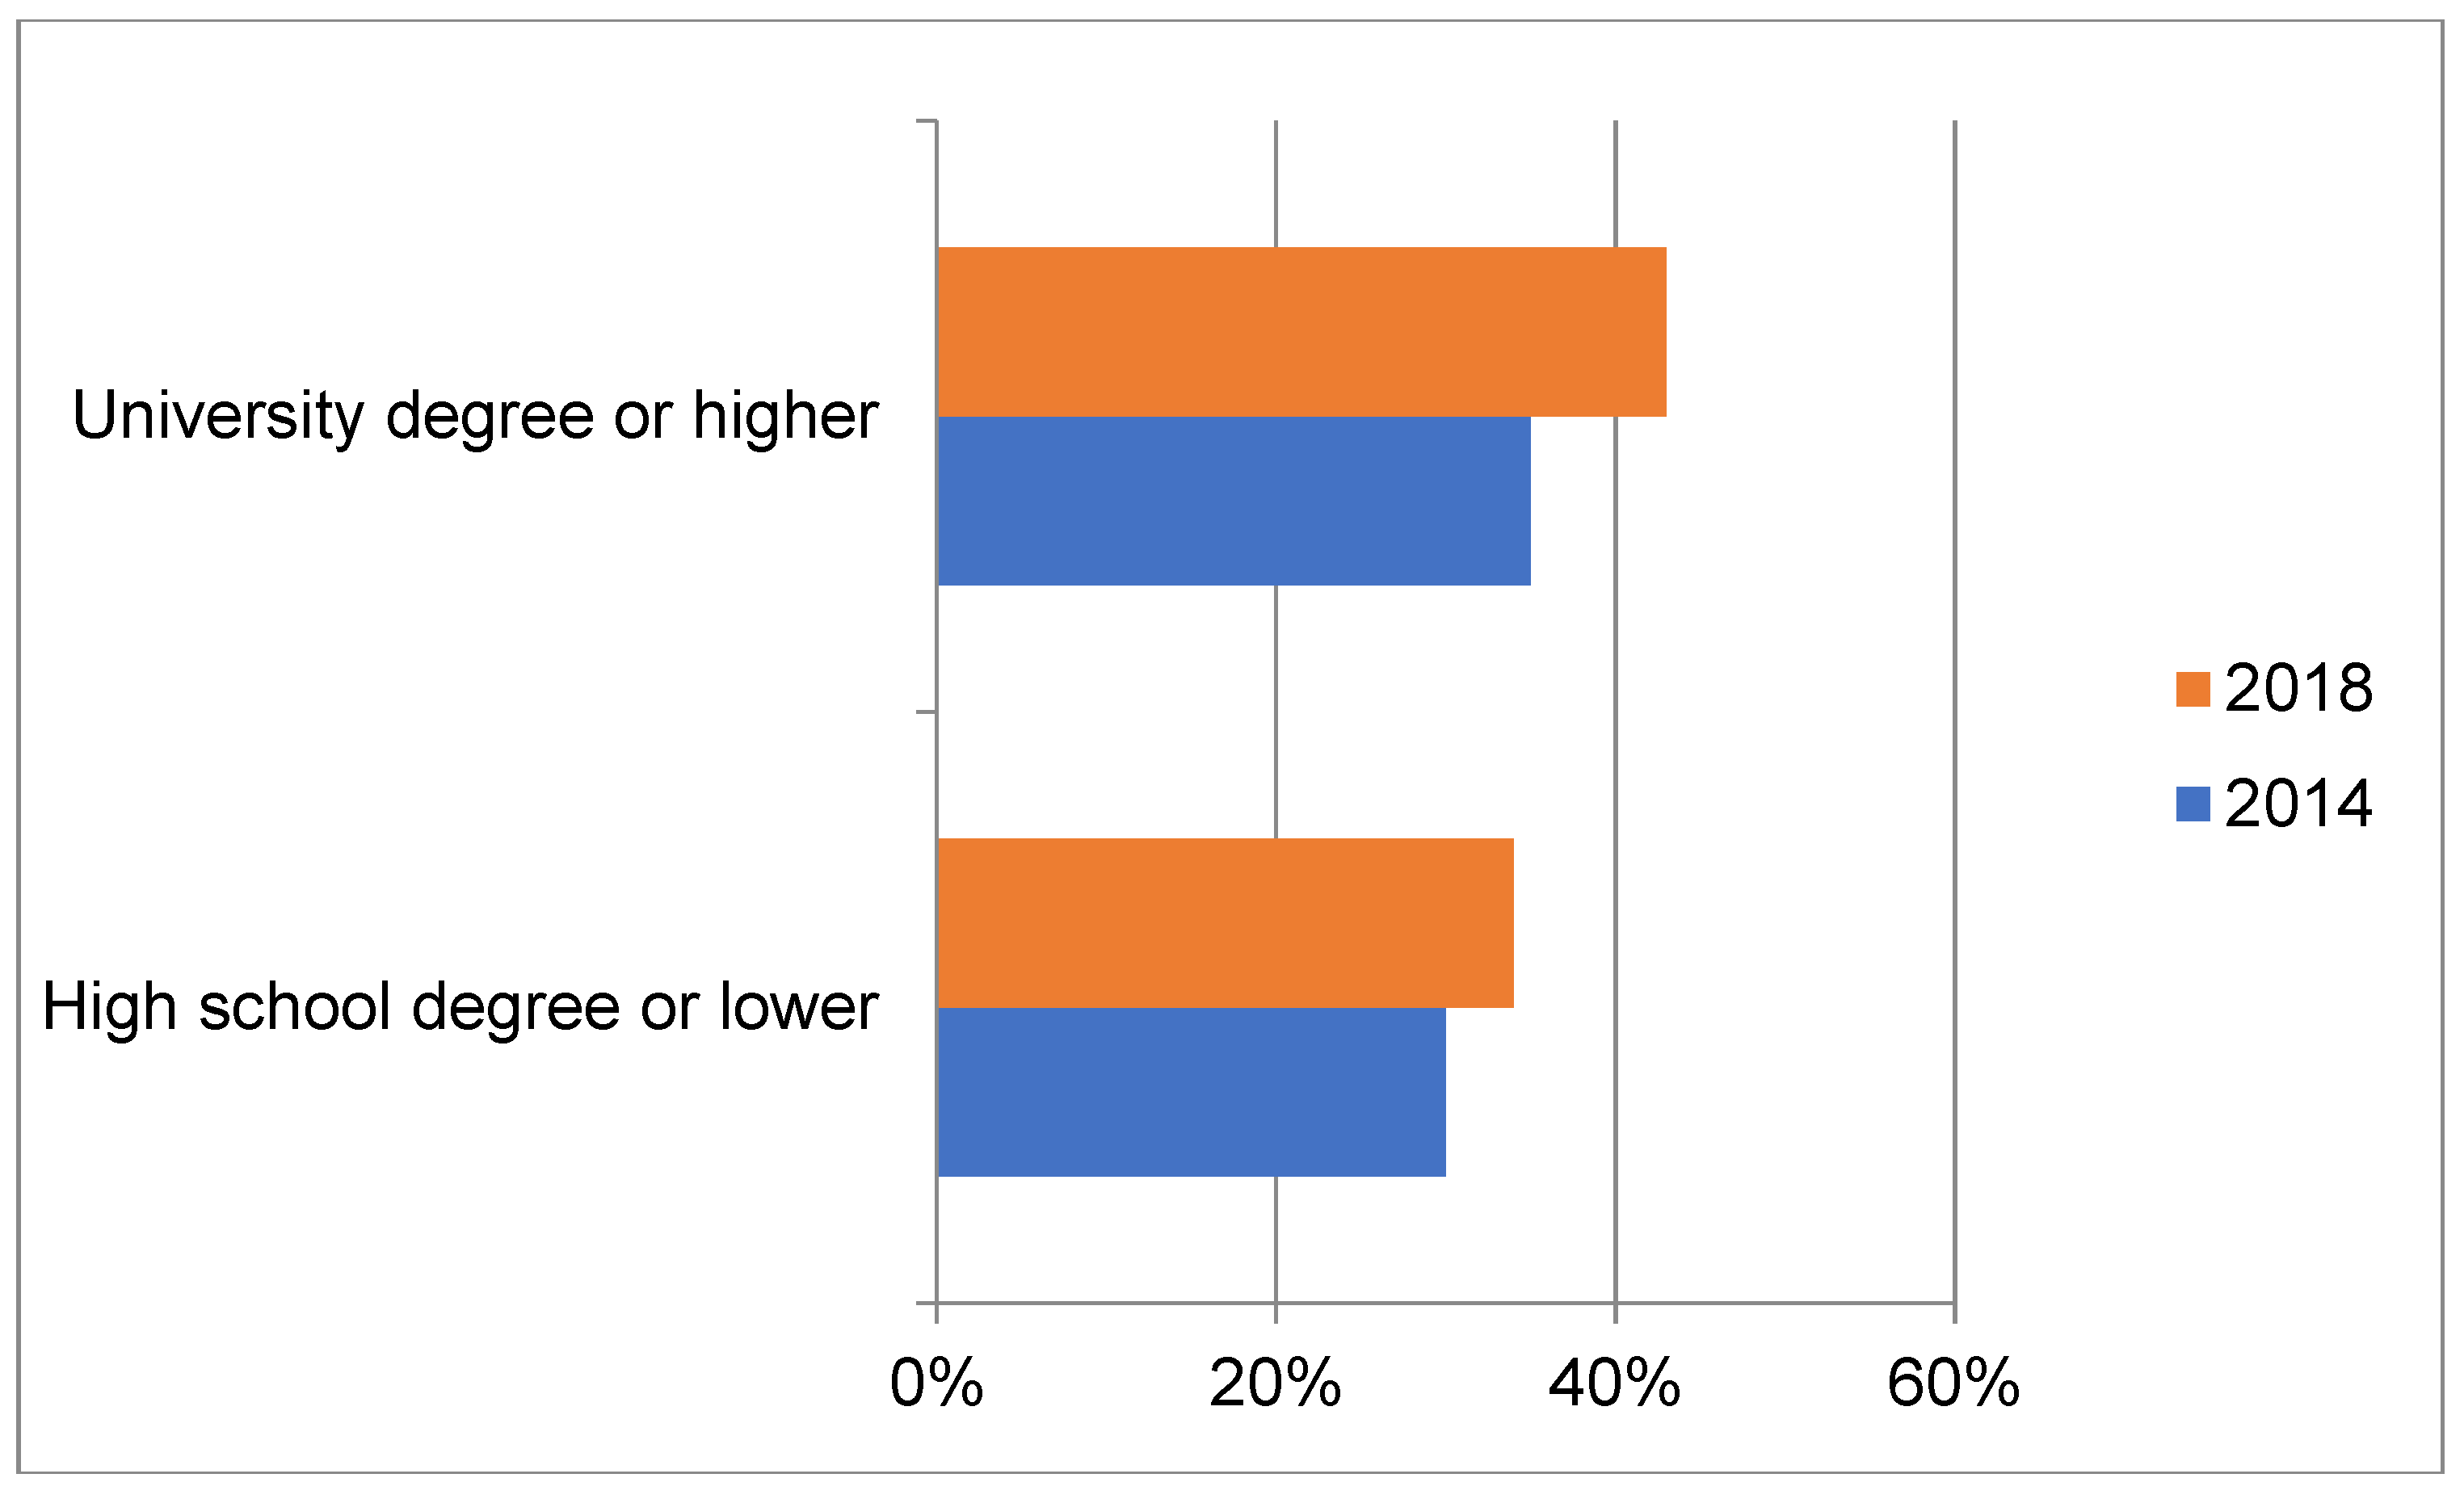
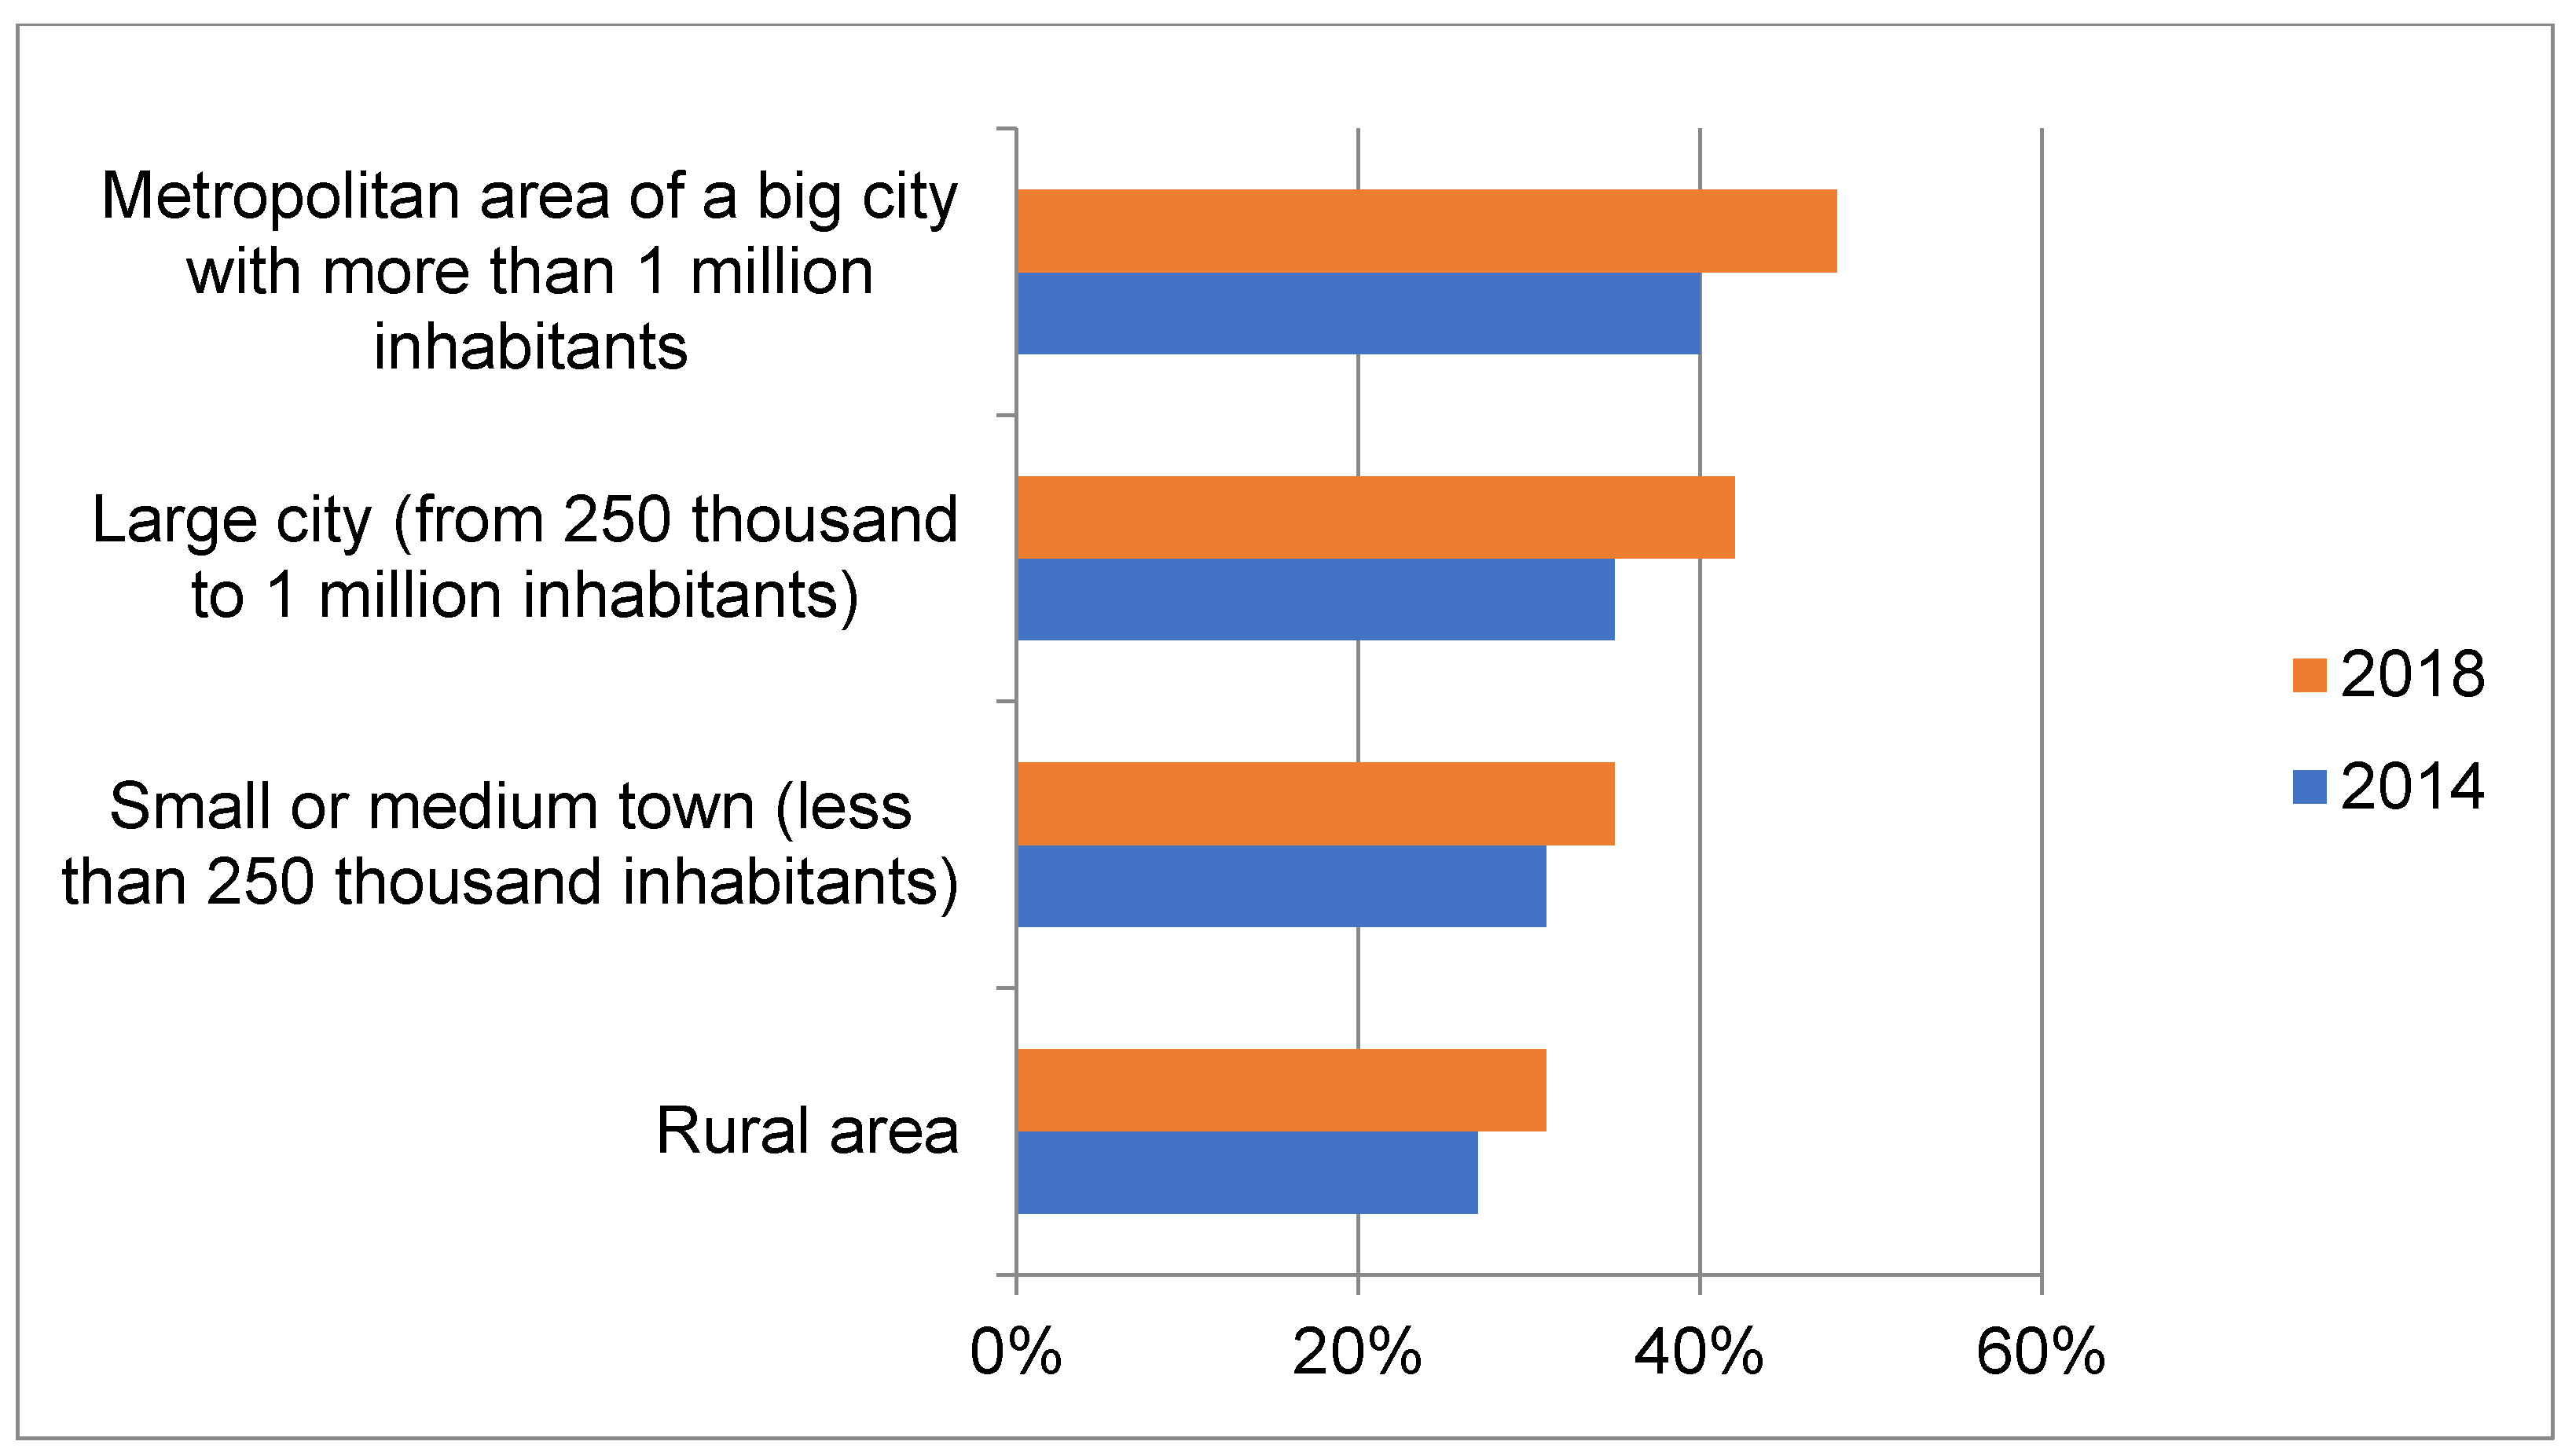
According to the survey’s results, males appeared to have a higher expressed propensity (“certainly yes” or “probably yes”) to purchase an H&EV (35.6% in 2014, 41.3% in 2018) compared to females (28.2% and 33.6%, respectively). In both surveys, there was a higher propensity for the 30–40-year-old age group compared to younger or older respondents. Propensity was correlated with income (Figure 5), educational attainment (Figure 6), and urbanization level (Figure 7). It was however, obvious that these variables, as well as several others included in the surveys, were highly correlated.
The impact of income appeared to be linear: higher income levels showed a higher propensity. Between 2014 and 2018, there was a considerable increase in the propensity of the higher middle-income group, suggesting that the affordability of H&EV was not limited to the higher income levels anymore. The propensity of the higher income group, while still increasing, did so at a slower pace but had already surpassed 50%. The age impact was not linear. The exploratory data suggests that there was a correlation with income (which increased with age) and openness to new technology (which decreased).
Respondents in larger cities (over 250,000, and especially over 1 million) had a higher propensity than respondents in towns and rural areas. The propensity in urban areas also grew faster than that in non-urban areas. The propensity to purchase a hybrid or electric vehicle increased with average travel time and the differences increased in 2018. This may seem counterintuitive given the assumption that H&EVs are less competitive in longer-distance trips [45] but travel time was highly correlated with city size, which was itself positively correlated with the propensity to purchase H&EVs. This hypothesis was further reinforced by the observation that propensity rates for respondents who used the metro or train (modes predominantly available in larger metropolitan areas) as the mode of their most frequent trip were higher than for those using all other mode options.
At first sight, it was not possible to distinguish between the separate impacts of income, age, educational level, area of residence, gender, etc. since many of these variables could be confounding. In addition, the direction of the 5.2% overall change in propensity was reproduced in a rather uniform manner at all variable levels, a pattern that obfuscated possible causal links. It was therefore necessary to explore the data using a methodology that considered the correlation between independent variables and allowed for the evaluation of the impact of each variable accounting for variable interactions.
4. Discussion
The most important variables in both the 2014 and 2018 models corresponded to two-way interactions between socio-economic variables (age, income, etc.) and region (a high cardinality categorical variable). This implies that the respondents’ choices were highly correlated with the average propensity of their corresponding socio-economic group in the specific region. The local conditions for the uptake of hybrid or electric vehicles (which we could interpret as a combination of car and fuel prices, subsidies, access restrictions, other support measures, and charging infrastructure) had a higher impact on the variation of the responses than the socio-economic variables on their own. For example, a high-income respondent in Madrid, the region of Spain’s capital city, would have a higher probability to reply “certainly yes” than a high-income respondent in Andalucía, a Spanish region with a lower population density. The difference in the probabilities could be larger than the differences between two different income levels in Madrid. Apart from the variables that were included in the model and were already accounted for (type of urbanization, income and education levels, trip distances, durations and modes, etc.), there were probably local conditions that influenced these variations. In contrast, the two-way interactions at the country level did not appear as important. Differences between urban profiles within a country could be larger than differences between highly urbanized regions across the European Union. The local conditions seemed to affect more purchasing decisions that those determined at the national level. In the particular example of Madrid, the fact that only “green” vehicles were allowed access to the city center, the extent of local subsidies to H&EVs for taxis, and the ubiquity of charging stations all contributed to the significantly higher propensity than in Andalusia, where both support and exposure to H&EVs was lower.
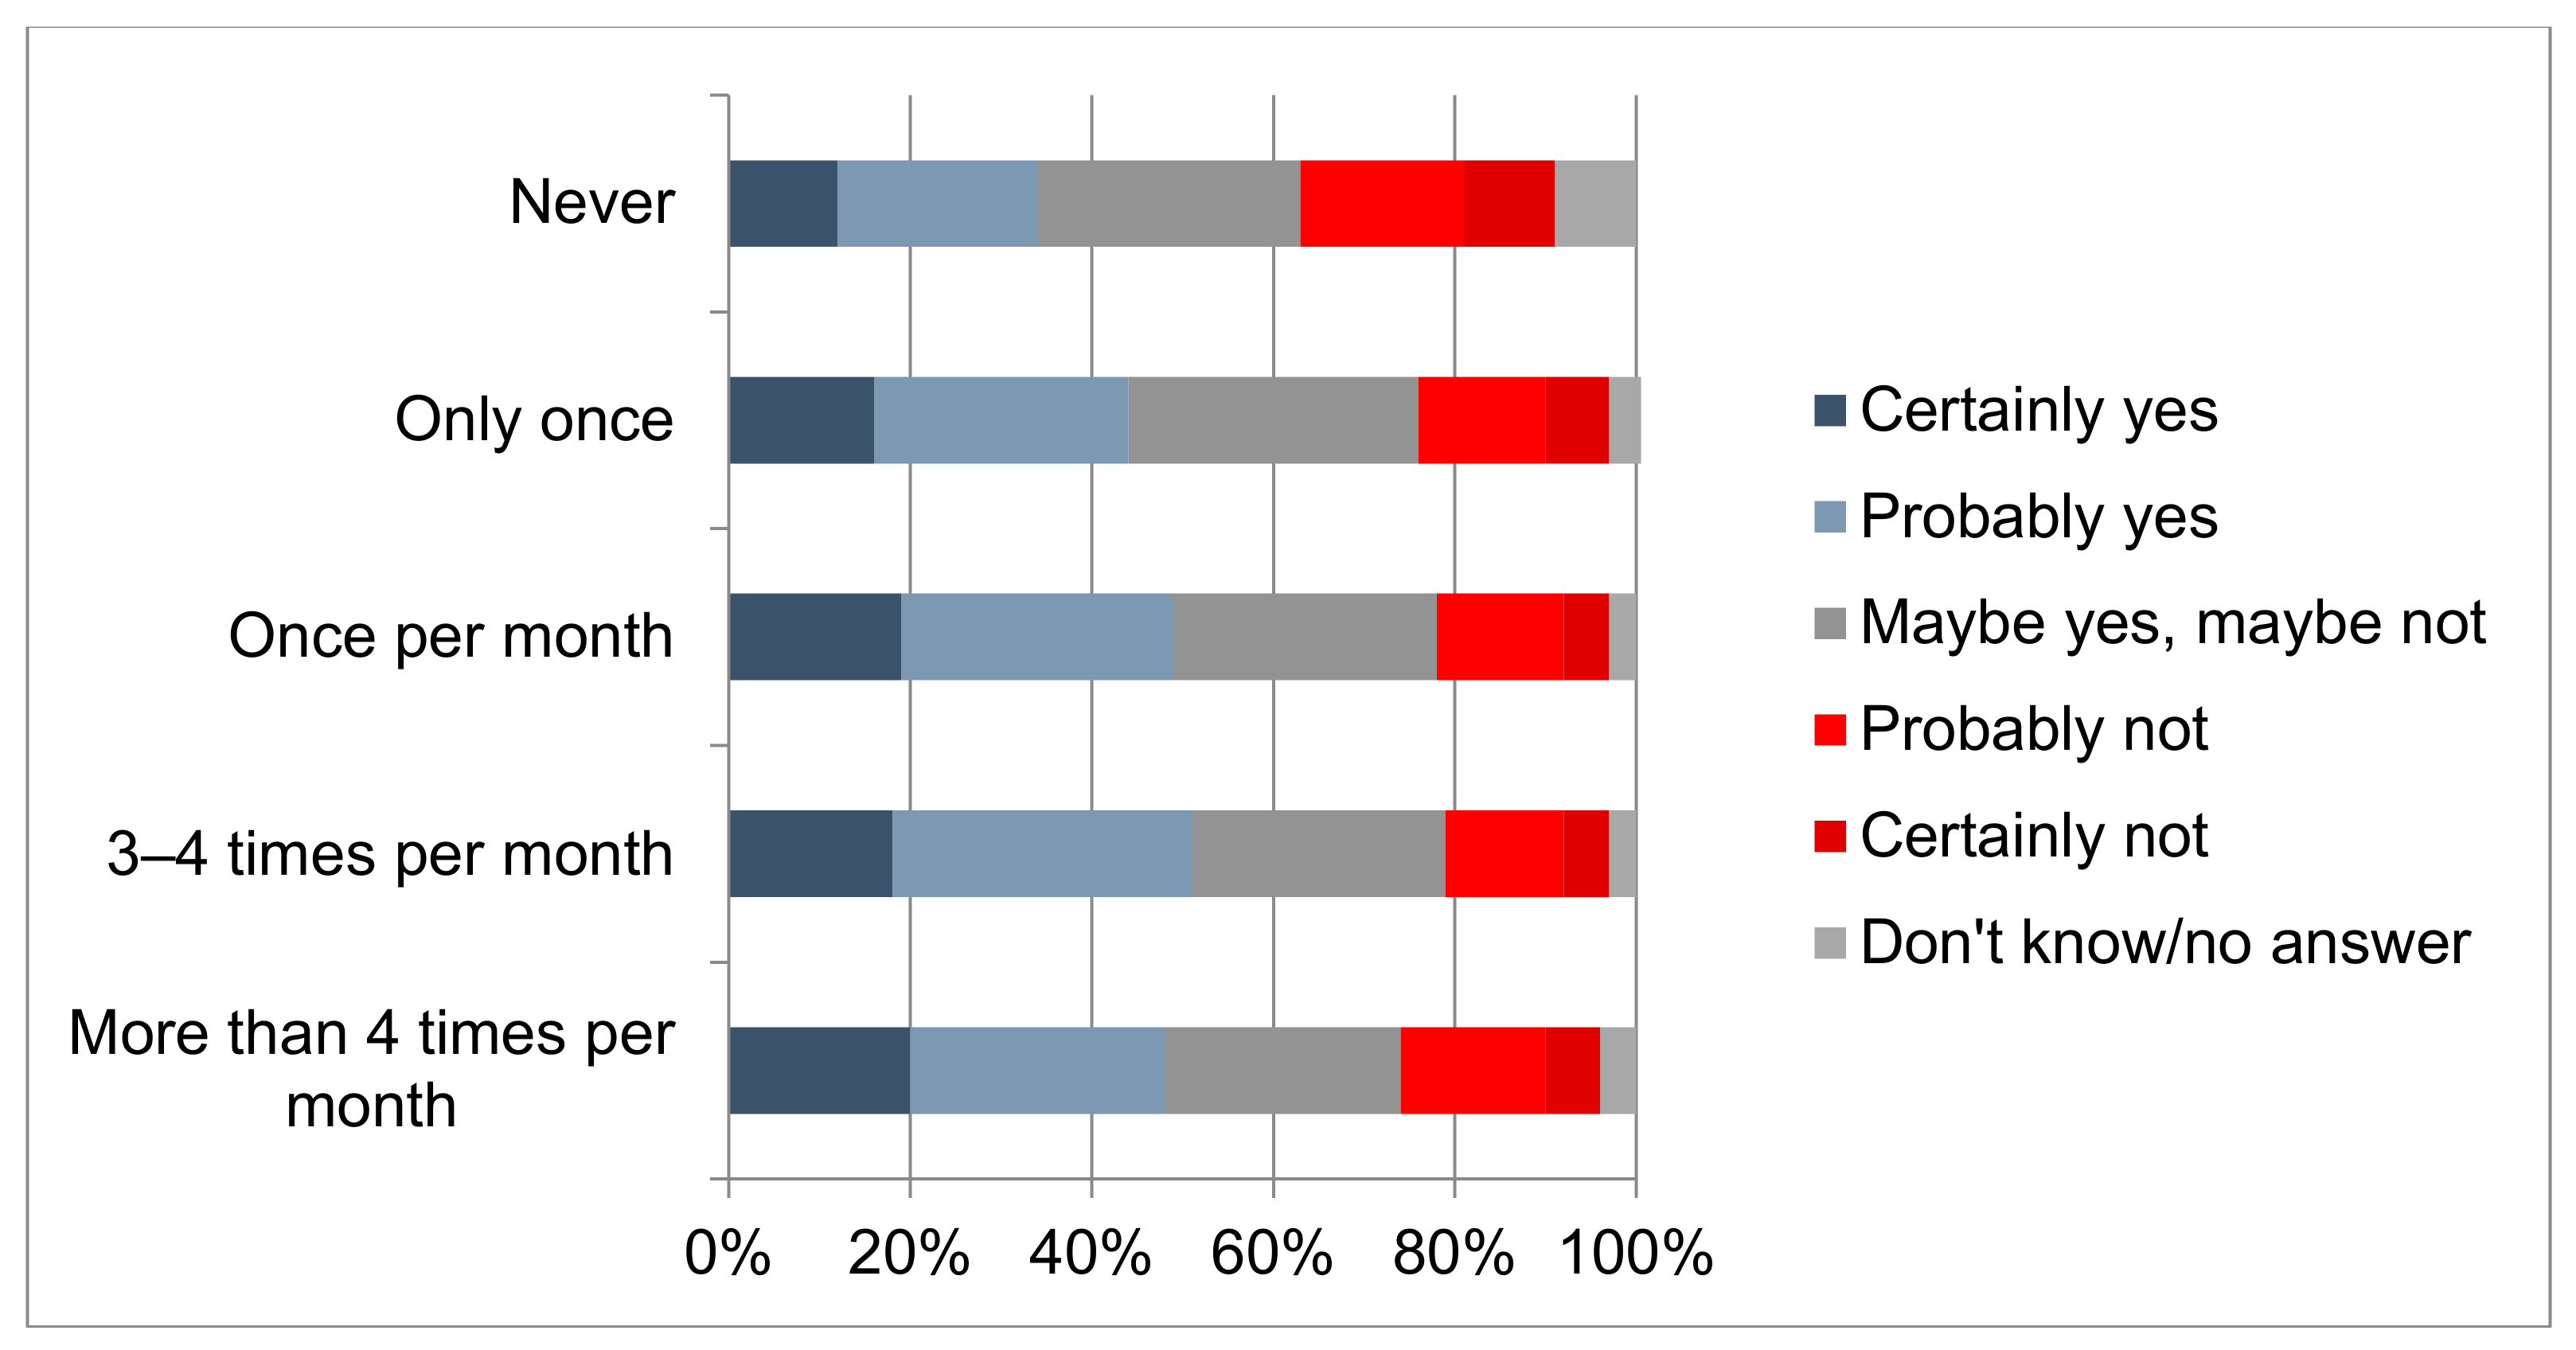
The inclusion of variables related to teleworking and online shopping improved the accuracy of the model significantly, as indicated by the rise in AUC from 0.791 (model A with 2018 data but without new questions) to 0.821 (model B). The relative importance of income and age decreased since the additional variables in model B could better explain a part of the variance. The responses regarding teleworking and online shopping were positively correlated with the propensity to purchase H&EVs (Figure 8 and Figure 9), while being uncorrelated between each other (p-value < 2.2 × 10⁻¹⁶). This suggests that there may have been a behavioral element at work: respondents familiar with other technological or lifestyle innovations may be more prone to use an innovative car technology.
Despite their decreased weight, the variables related to income, age, and education still appeared among those with the highest importance. This supports the point that these variables characterized the early adopters of a new technology. Our data and models suggest that H&EVs became an option for mainstream users too since the propensity for lower income and education levels also increased while the propensity by age became more uniform.
Residing in large urban areas was a significant factor in predicting a higher propensity to buy an H&EV. Gender, employment status, car ownership, current mobility choices, and most other behavioral variables appeared to have a limited weight in the purported decision to purchase an H&EV. In most cases they were correlated with a variable that already explained this choice, especially income and urbanization type, both of which largely affected the respondents’ preferences.
Our models could not directly explain the role of support measures and subsidies since such information was not included in the surveys. An estimation of their impact could be derived implicitly by comparing the propensity rates in regions with strong support measures to those without any. Given the importance of the local factors in the purchasing decisions, it appeared that measures focusing on the regions and socio-economic groups with an already higher propensity to buy tended to be more effective.
5. Conclusions
This paper applied a classification model on the responses from the two cross-sectional surveys on mobility across the EU. The surveys provided useful information on the factors that affected user preferences and the methodology allowed for the identification of the importance of each factor in the users’ choices. The results suggest that the propensity to purchase a hybrid or electric vehicle had increased and that the uptake potential for purchasing a hybrid or electric vehicle rose between 2014 and 2018 across all socio-economic groups. This was probably a result of a larger part of the population being ready to adopt new technologies as the use of such technologies was becoming more known and widespread, infrastructure being progressively installed, purchase costs decreasing, and the market gradually moving in general from the early adopters to the general public.
The stated propensity to purchase a hybrid or electric vehicle in the European Union countries was only somewhat reflected in the actual market share of hybrid and electric passenger vehicles, which, while increasing, still remained relatively low. One can assume that there was be a certain lag, but there were probably additional factors that limited the full uptake potential. Only a subset of those considering a purchase will make one. We can thus surmise that the 13% of respondents that would definitely consider and the 24% that would probably consider, when it came to an actual purchasing decision, decided still not to go for a hybrid or electric vehicle by a large margin. There may well be an optimism bias in the respondents’ responses. They would consider buying a hybrid or electric vehicle but when it was time to purchase, they may find them too expensive, impractical, or unsuitable for other reasons, such as that the car model desired was still not available. Different socio-economic groups will probably have different levels of optimism bias, but we lack the data that would allow us to compare the stated and actual purchase rates for each group.
Our results show that respondents of higher income levels expressed a higher willingness to purchase a hybrid or electric vehicle than those of lower income levels. This can be explained by the high purchase price of electric vehicles, as shown in numerous studies in Europe, e.g., Junquera et al. [46], and their effect on willingness to buy [2]. At the same time, our results imply that prices of H&EVs may be converging toward those of conventional cars, as middle incomes are showing an increasing propensity.
The results from this study highlight something largely missing from the literature: local conditions and regional variation played a major factor, if not decisive, regarding intentions toward acquiring electric or hybrid vehicles in Europe. The heterogeneous spatial pattern of demand for H&EVs was caused by a hierarchy in the factors affecting user choices. The local situation regarding mobility needs and support measures were the principle determinants of market conditions. Within a specific market, individual behavior followed patterns that could be explained by socio-economic variables and openness to innovation.
Seen from a policy perspective, the finding of this study that emphasizes the importance of local factors in H&EV adoption may provide guidance toward supporting the uptake of H&EVs through measures that are tailored to the specific needs at the local level. For example, allowing only green vehicles access to the city center, providing dedicated parking areas, or permitting them to use special high-occupancy-vehicle (HOV) lanes could be some such targeted and efficient incentives.
Author Contributions
Conceptualization, C.F. and P.C.; Data curation, P.C.; Formal analysis, P.C. and C.F.; Methodology, P.C. and C.F.
Funding
This research received no external funding.
Conflicts of Interest
The authors declare no conflict of interest.
References
- Tsakalidis, A.; Thiel, C. Electric Vehicles in Europe from 2010 to 2017: Is Full-Scale Commercialisation Beginning? An Overview of the Evolution of Electric Vehicles in Europe; Technical Report No. EUR 29401 EN; Publications Office of the European Union: Luxembourg, Luxembourg, 2018; ISBN 978-92-79-96719-1. [Google Scholar]
- Coffman, M.; Bernstein, P.; Wee, S. Electric vehicles revisited: A review of factors that affect adoption. Transp. Rev. 2016, 20, 79–93. [Google Scholar] [CrossRef]
- Christodoulou, A.; Christidis, P. Measuring cross-border road accessibility in the European Union. Sustainability 2019, 11, 4000. [Google Scholar] [CrossRef]
- Rezvani, Z.; Jansson, J.; Bodin, J. Advances in consumer electric vehicle adoption research: A review and research agenda. Transp. Res. Part D 2015, 34, 122–136. [Google Scholar] [CrossRef] [Green Version]
- Liao, F.; Molin, E.; van Wee, B. Consumer preferences for electric vehicles: A literature review. Transp. Rev. 2016, 37, 252–275. [Google Scholar] [CrossRef]
- Li, W.; Long, R.; Chen, H.; Geng, J. A review of factors influencing consumer intentions to adopt battery electric vehicles. Renew. Sustain. Energy Rev. 2017, 78, 318–328. [Google Scholar] [CrossRef]
- Schuitema, G.; Anable, J.; Skippon, S.; Kinnear, N. The role of instrumental, hedonic and symbolic attributes in the intention to adopt electric vehicles. Transp. Res. Part A 2013, 48, 39–49. [Google Scholar] [CrossRef]
- Alemanno, A.; Zubaryeva, C.; Pasaoglu, G.; Scarcella, G.; Thiel, C. Attitude of European car Drivers Towards Electric Vehicles: A Survey; European Commission, Joint Research Centre, Institute for Energy and Transport: Milano, Italy, 2012. [Google Scholar] [CrossRef]
- Singer, M. Consumer Views on Plug-In Electric Vehicles—National Benchmark Report; Technical Report No. NREL/TP-5400-67107; National Renewable Energy Laboratory: Lakewood, CO, USA, 2016. Available online: https://www.nrel.gov/docs/fy17osti/67107.pdf (accessed on 4 September 2019).
- Jin, L.; Slowik, P. Literature Review of Electric Vehicle Consumer Awareness and Outreach Activities, Working Paper 2017-3, International Council on Clean Transportation. Available online: https://theicct.org/sites/default/files/publications/Consumer-EV-Awareness_ICCT_Working-Paper_23032017_vF.pdf (accessed on 5 June 2019).
- Burgess, M.; King, N.; Harris, M.; Lewis, E. Electric vehicle drivers’ reported interactions with the public: Driving stereotype change? Transp. Res. Part F 2013, 17, 33–44. [Google Scholar] [CrossRef]
- Bühne, J.A.; Gruschwitz, D.; Hölscher, J.; Klötzke, M.; Kugler, U.; Schimeczek, C. How to promote electromobility for European car drivers? Obstacles to overcome for a broad market penetration. Eur. Transp. Res. Rev. 2015, 7, 30. [Google Scholar] [CrossRef]
- Park, E.; Lim, J.; Cho, Y. Understanding the emergence and social acceptance of electric vehicles as next-generation models for the automobile industry. Sustainability 2018, 10, 662. [Google Scholar] [CrossRef]
- Wappelhorst, S.; Mock, P.; Yang, Z. Using Vehicle Taxation Policy to Lower Transport Emissions: An Overview for Passenger cars in Europe, International Council on Clean Transportation Europe. Available online: https://theicct.org/sites/default/files/publications/EU_vehicle_taxation_Report_20181214_0.pdf (accessed on 5 June 2019).
- Berkeley, N.; Jarvis, D.; Jones, A. Analysing the take up of battery electric vehicles: An investigation of barriers amongst drivers in the UK. Transp. Res. Part D 2018, 63, 466–481. [Google Scholar] [CrossRef]
- Wang, N.; Pan, H.; Zheng, W. Assessment of the incentives on electric vehicle promotion in China. Transp. Res. Part A 2017, 101, 177–189. [Google Scholar] [CrossRef]
- Vassileva, I.; Campillo, J. Adoption barriers for electric vehicles: Experiences from early adopters in Sweden. Energy 2017, 120, 632–641. [Google Scholar] [CrossRef]
- Lin, B.; Wu, W. Why people want to buy electric vehicle: An empirical study in first-tier cities of China. Energy Policy 2018, 112, 233–241. [Google Scholar] [CrossRef]
- She, Z.-Y.; Qing, S.; Ma, J.-J.; Xie, B.-C. What are the barriers to widespread adoption of battery electric vehicles? A survey of public perception in Tianjin, China. Transp. Policy 2017, 56, 29–40. [Google Scholar] [CrossRef]
- Anable, J.; Kinnear, N.; Hutchins, R.; Delmonte, E.; Skippon, S. Consumer Segmentation and Demographic Patterns; Technical Report No. PPR769; Transport Research Laboratory: Wokingham, UK, 2016; ISBN 978-1-910377-51-2. [Google Scholar]
- Morton, C.; Anable, J.; Yeboah, G.; Cottrill, C. The spatial pattern of demand in the early market for electric vehicles: Evidence from the United Kingdom. J. Transp. Geogr. 2018, 72, 119–130. [Google Scholar] [CrossRef] [Green Version]
- Zubaryeva, A.; Thiel, C.; Barbone, E.; Mercier, A. Assessing factors for the identification of potential lead markets for electrified vehicles in Europe: Expert opinion elicitation. Technol. Forecast. Soc. Chang. 2012, 79, 1622–1637. [Google Scholar] [CrossRef]
- Lévay, P.; Drossinos, Y.; Thiel, C. The effect of fiscal incentives on market penetration of electric vehicles: A pairwise comparison of total cost of ownership. Energy Policy 2017, 105, 524–533. [Google Scholar] [CrossRef]
- Javid, R.; Nejat, A. A comprehensive model of regional electric vehicle adoption and penetration. Transp. Policy 2017, 54, 30–42. [Google Scholar] [CrossRef]
- Okada, T.; Tamaki, T.; Managi, S. Effect of environmental awareness on purchase intention and satisfaction pertaining to electric vehicles in Japan. Transp. Res. Part D Transp. Environ. 2019, 67, 503–513. [Google Scholar] [CrossRef]
- Wiesenthal, T.; Leduc, G.; Christidis, P.; Schade, B.; Govaerts, L.; Georgopoulos, P. Biofuel support policies in Europe: Lessons learnt for the long way ahead. Renew. Sustain. Energy Rev. 2009, 13, 789–800. [Google Scholar] [CrossRef]
- Raslavičius, L.; Azzopardi, B.; Keršys, A.; Starevičius, M.; Bazaras, Ž.; Makaras, R. Electric vehicles challenges and opportunities: Lithuanian review. Renew. Sustain. Energy Rev. 2015, 42, 786–800. [Google Scholar] [CrossRef]
- Cansino, J.; Sánchez-Braza, A.; Sanz-Díaz, T. Policy instruments to promote electro-mobility in the EU28: A comprehensive review. Sustainability 2018, 10, 2507. [Google Scholar] [CrossRef]
- Bjerkan, K.; Nørbech, T.; Nordtømme, M. Incentives for promoting battery electric vehicle (BEV) adoption in Norway. Transp. Res. Part D 2016, 43, 169–180. [Google Scholar] [CrossRef]
- Figenbaum, E.; Kolbenstvedt, M. Electromobility in Norway—Experiences and Opportunities with Electric Vehicles; Technical Report No. 1281/2013; Institute of Transport Economics—Norwegian Centre for Transport Research: Oslo, Norway, 2013; ISBN 978-82-480-1465-2. Available online: https://www.toi.no/getfile.php?mmfileid=33828 (accessed on 4 September 2019).
- Pisoni, E.; Christidis, P.; Thunis, P.; Trombetti, M. Evaluating the impact of sustainable urban mobility plans on urban background air quality. J. Environ. Manag. 2019, 231, 249–255. [Google Scholar] [CrossRef] [PubMed]
- Shepherd, S.P.; Pfaffenbichler, P.; Martino, A.; Fiorello, D.; Christidis, P. The effect of oil prices on transport policies for Europe. Int. J. Sustain. Transp. 2008, 2, 19–40. [Google Scholar] [CrossRef]
- Alonso Raposo, M.; Ciuffo, B. The Future of Road Transport—Implications of Automated, Connected, Low-Carbon and Shared Mobility; Technical Report No. 29748 EN; Publications Office of the European Union: Luxembourg, 2019; ISBN 978-92-76-03409-4. [Google Scholar]
- Vandecasteele, I.; Baranzelli, C.; Siragusa, A.; Aurambout, J.P. The Future of Cities—Opportunities, Challenges and the Way Forward; Technical Report No. 29752 EN; Publications Office EU: Luxembourg, 2019; ISBN 978-92-76-03847-4. [Google Scholar]
- Fiorello, D.; Martino, A.; Zani, L.; Christidis, P.; Navajas-Cawood, E. Mobility data across the EU 28 member states: Results from an extensive CAWI survey. Transp. Res. Procedia 2106, 14, 1104–1113. [Google Scholar] [CrossRef]
- Navajas, E.; Christidis, P.; Fiorello, D.; Zani, L. EU Survey on Issues Related to Transport and Mobility; Technical Report No. JRC115858; European Commission, Joint Research Centre: Milano, Italy, 2019. [Google Scholar]
- Chen, T.; Guestrin, G. XGBoost: A scalable tree boosting system, KDD ’16. In Proceedings of the 22nd ACM SIGKDD International Conference on Knowledge Discovery and Data Mining, San Francisco, CA, USA, 13–17 August 2016; pp. 785–794. [Google Scholar]
- Choi, H.; Ahn, Y. A study on possibility of commuting trip using private motorized modes in cities around the world: Application of multilevel model. Transp. Res. Part D Transp. Environ. 2015, 41, 228–243. [Google Scholar] [CrossRef]
- Focas, C.; Christidis, P. Peak car in Europe? Transp. Res. Procedia 2017, 25, 531–550. [Google Scholar] [CrossRef]
- Cheng, L.; Chen, X.; De Vos, J.; Laic, X.; Witlox, F. Applying a random forest method approach to model travel mode choice behavior. Travel Behav. Soc. 2019, 14, 1–10. [Google Scholar] [CrossRef]
- Hagenauer, J.; Helbich, M. A comparative study of machine learning classifiers for modeling travel mode choice. Expert Syst. Appl. 2017, 78, 273–282. [Google Scholar] [CrossRef]
- Gutiérrez De Mesa, E.; Hidalgo, I.; Christidis, P.; Ciscar, J.C.; Vegas, E.; Ibarreta, D. Modeling the impact of genetic screening technologies on healthcare: Theoretical model for asthma in children. Mol. Diagn. Ther. 2007, 11, 313–323. [Google Scholar] [CrossRef] [PubMed]
- Rotoli, F.; Navajas Cawood, E.; Christidis, P. A data envelopment analysis approach for accessibility measures: Simulating operational enhancement scenarios for railway across Europe. Eur. Transp. Res. Rev. 2015, 7, 18. [Google Scholar] [CrossRef]
- Fiorello, D.; Zani, L.; Christidis, P.; Navajas-Cawood, E. EU Survey on Issues Related to Transport and Mobility; Publications Office of the European Union: Luxembourg, 2015; ISBN 978-92-79-49281-5. [Google Scholar]
- Christidis, P.; Hidalgo, I.; Soria, A. Dynamics of the introduction of new passenger car technologies: The IPTS transport technologies model; Technical Report No. EUR 20762; European Commission: Brussels, Belgium, 2003. [Google Scholar]
- Junquera, B.; Moreno, B.; Álvarez, R. Analyzing consumer attitudes towards electric vehicle purchasing intentions in Spain: Technological limitations and vehicle confidence. Technol. Forecast. Soc. Chang. 2016, 109, 6–14. [Google Scholar] [CrossRef]
Figure 1.
Most important variables for model A 2014.

Figure 2.
Most important variables for model A 2018.

Figure 3.
Most important variables for model B 2018.

Figure 4.
Share of replies to question “If you had to purchase a new car in the near future, would you consider purchasing a hybrid or electric car?” (2018 survey).
Figure 4.
Share of replies to question “If you had to purchase a new car in the near future, would you consider purchasing a hybrid or electric car?” (2018 survey).

Figure 5.
Propensity to purchase an H&EV by self-reported income level.

Figure 6.
Propensity to purchase an H&EV by educational attainment.

Figure 7.
Propensity to purchase an H&EV by urbanisation level of area of residence.

Figure 8.
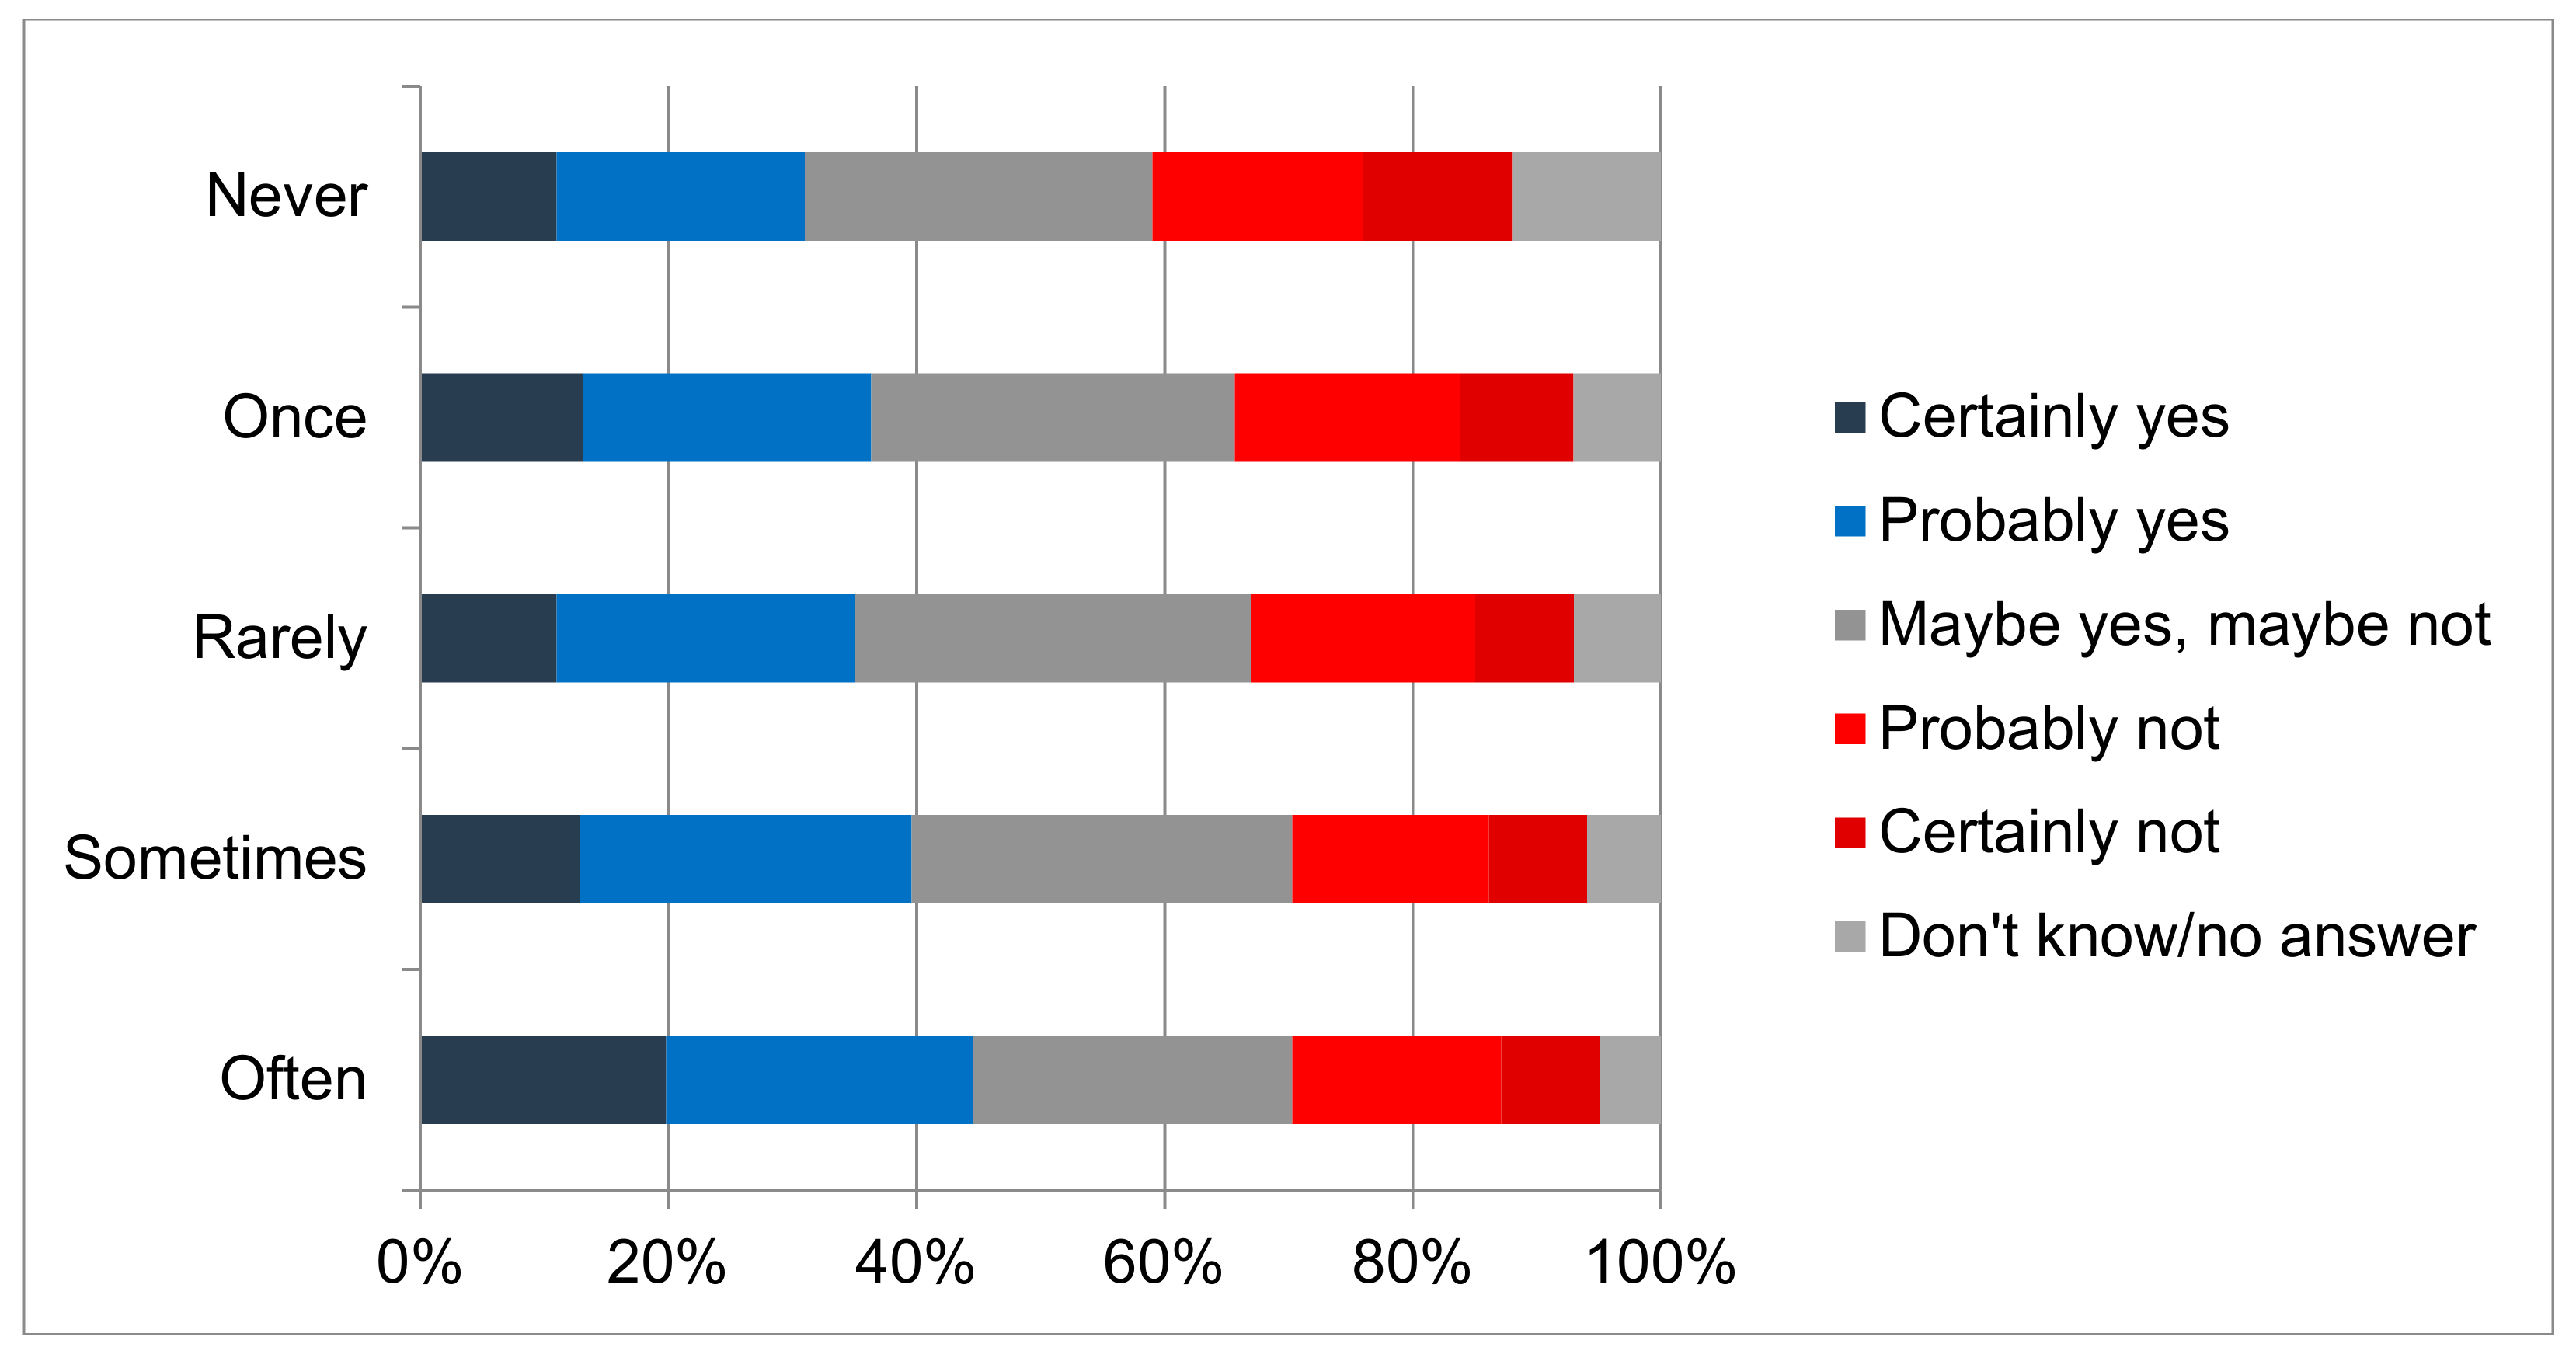
Propensity to purchase a hybrid or an electric car in the near future by frequency of teleworking (2018 survey).
Figure 8.
Propensity to purchase a hybrid or an electric car in the near future by frequency of teleworking (2018 survey).

Figure 9.
Propensity to purchase a hybrid or an electric car in the near future by frequency of online shopping (2018 survey).
Figure 9.
Propensity to purchase a hybrid or an electric car in the near future by frequency of online shopping (2018 survey).


Table 1.
Summary of model results.
| Model | AUC Test | AUC Validation | Number of Observations | Number of Variables |
|---|---|---|---|---|
| Model A 2014 | 0.785 | 0.789 | 19,057 | 115 |
| Model A 2018 | 0.799 | 0.791 | 17,870 | 115 |
| Model B 2018 | 0.824 | 0.821 | 17,870 | 164 |
Table 2.
Survey questions and variable type.
| Question | Variable Type | Number of Category Values/Range |
|---|---|---|
| Consider buying hybrid or electric car | Categorical | 6 |
| Country | Categorical | 28 |
| Gender | Binary | 2 |
| Age | Integer | 18 to 65 |
| Education level | Categorical | 4 |
| Region | Categorical | 396 |
| Employment status | Categorical | 7 |
| Number of household members | Categorical | 7 |
| Income level | Categorical | 6 |
| Urbanization type | Categorical | 4 |
| Center or suburbs | Binary | 2 |
| Driving ability | Categorical | 4 |
| Number of vehicles in household | Integer | 0 to 10 |
| Plan to buy car in near future | Categorical | 5 |
| Car sharing subscription | Categorical | 3 |
| Mode of most frequent trips | Categorical | 12 |
| Destination of most frequent trips | Categorical | 3 |
| Frequency of most frequent trips | Categorical | 3 |
| Number of passengers during last car trip | Integer | 1 to 7 |
| Duration of last trip | Numeric (minutes) | 1 to 120 |
| Distance of last trip | Categorical | 7 |
| Evaluation of multimodal connection | Categorical | 5 |
| Reasons to consider alternative modes | Categorical (multiple answers allowed) | 12 (6 binary options) |
| Number of long-distance trips for work, business, and study in the last 12 months | Integer | 0 to 50 |
| Number of long-distance trips for leisure and personal reasons in the last 12 months | Integer | 0 to 50 |
| Number of medium distance trips for work, business and study in the last 12 months | Integer | 0 to 50 |
| Number of medium distance trips for leisure and personal reasons in the last 12 months | Integer | 0 to 50 |
| Use of ICT applications (only in 2018 survey) | Categorical | 50 (10 categorical variables with 5 choices) |
| Avoidance of problems through ICT (only in 2018 survey) | Categorical | 11 |
| Teleworking to avoid trip to work (only in 2018 survey) | Categorical | 5 |
| Online shopping to avoid trip (only in 2018 survey) | Categorical | 5 |
© 2019 by the authors. Licensee MDPI, Basel, Switzerland. This article is an open access article distributed under the terms and conditions of the Creative Commons Attribution (CC BY) license (http://creativecommons.org/licenses/by/4.0/).
Share and Cite
MDPI and ACS Style
Christidis, P.; Focas, C. Factors Affecting the Uptake of Hybrid and Electric Vehicles in the European Union. Energies 2019, 12, 3414. https://0-doi-org.brum.beds.ac.uk/10.3390/en12183414
AMA Style
Christidis P, Focas C. Factors Affecting the Uptake of Hybrid and Electric Vehicles in the European Union. Energies. 2019; 12(18):3414. https://0-doi-org.brum.beds.ac.uk/10.3390/en12183414
Chicago/Turabian StyleChristidis, Panayotis, and Caralampo Focas. 2019. "Factors Affecting the Uptake of Hybrid and Electric Vehicles in the European Union" Energies 12, no. 18: 3414. https://0-doi-org.brum.beds.ac.uk/10.3390/en12183414
Note that from the first issue of 2016, this journal uses article numbers instead of page numbers. See further details here.