Article

Experimental Investigation on the Energy Consumption, Physical, and Thermal Properties of a Novel Pellet Fuel Made from Wood Residues with Microalgae as a Binder

1
Key Laboratory of Efficient Utilization of Low and Medium Grade Energy, Ministry of Education of China, Tianjin University, Tianjin 300072, China; [email protected] (X.C.); [email protected] (X.S.)
2
School of Mechanical Engineering, Tianjin University, Tianjin 300072, China; [email protected] (W.L.); [email protected] (T.H.); [email protected] (C.B.)
3
Xi’an Raising Urban Heating Develop Group Co., Ltd., Xi’an 710100, China
*
Author to whom correspondence should be addressed.
Submission received: 8 August 2019 / Revised: 30 August 2019 / Accepted: 3 September 2019 / Published: 5 September 2019
(This article belongs to the Section A4: Bio-Energy)

Abstract

:
Co-pelletization of waste biomass and microalgae is an attractive option for using bioenergy efficiently. This work investigates the potential of microalgae as a binder to improve the energy consumption and physical and thermal properties of a novel pellet. Wood waste biomass was blended with microalgae in proportions of 15%, 30%, and 50% to investigate its properties using a single pelleting device and thermodynamic analysis. The results showed that, under the conditions of temperature (80–160 °C), pressure (120–200 MPa), and moisture content (6%–14%), blending microalgae can effectively increase the bulk density and mechanical durability of the pellets by 9%–36% and 0.7%–1.6%, respectively, and can significantly reduce the energy consumption of pelleting by 23.5%–40.4%. Blending microalgae can significantly reduce the energy consumption of pelleting by 23.5%–40.4%. Moreover, when the amount of Chlorella vulgaris powder (CVP) is 50%, a maximum bulk density (BD) of 1580.2 kg/m3, a durability (DU) of 98%, and a minimum energy consumption of 25.2 kJ/kg were obtained under the optimum conditions of temperature (120 °C), pressure (120 MPa), and moisture content (10%), respectively. Besides, the interaction between the microalgae and sawdust does exist, and their effect on the co-combustion process is inhibitive (0–300 °C) and accelerative (300–780 °C). When the amount of microalgae was 15%, the average activation energy of the pellet was a minimum value, which was 133.21 kJ/mol and 134.60 kJ/mol calculated by the Kissinger–Akahira–Sunose method and Ozawa–Flynn–Wall method, respectively. Therefore, the energy consumption, physical, and thermal properties of the novel pellet could be improved and meet the ISO standard (International Organization for Standardization of 17225, Geneva, Switzerland, 2016) by blending 15% of microalgae. Overall, the use of microalgae as a binder can indeed improve pellet quality, and it can be considered a significant way to utilize microalgae in the future.

Graphical Abstract

1. Introduction

Microalgae, as the third generation of bioenergy feedstock, has many important applications in the industrial field, such as water pollution control and flue gas CO2 fixation [1]. With the advantages of a rapid growth period, high photosynthetic efficiency, and strong adaptability to the environment, it is a good raw material for biodiesel production. Currently, from a purely economical viewpoint, worldwide microalgae production is mostly dedicated to the extraction of low-volume, high-value chemicals, such as carotenoids and ω-3 fatty acids, which could be sold at a high price [2]. However, the extraction of such low-volume, high-value chemicals is precluded when microalgae are of interest in effluent treatment for the removal of nitrogen and phosphorus [3]. Therefore, new alternatives must be pursued, such as high-volume, low-value products. In the case of biofuel production, if the net energy ratio (NER = Eproduced/Econsumed) of biorefinery is > 1, the route can be seen to operate cost-effectively. However, when compared with current methods of obtaining biofuels (consisting of several upstream and downstream technologies), the value of NER is generally within the range of 0.20–0.86 [4], that is, none of the known microalgae-based routes can produce biofuels competitively. Thus, it is necessary to reduce production costs significantly to make microalgae-based fuel economically viable [1]. Direct combustion is one of the high-volume, low-value ways of using bioenergy for large-scale use. Pelletization is one of the most important and common methods of preparing biomass fuels. Pelletization turns raw material at a certain temperature and pressure into a regular shape, which can increase the energy density of the biomass raw material by about 4–10 times [5,6].
At present, microalgae solid fuel is an attractive way of using microalgae. Amarasekara et al. [7] examine ways of improving algae pelletization techniques that can be used for superior densification with suitable durability, but without spending an immense amount of energy in the process. Their study provided a way of improving algae-based renewable energy. Another study comprehensively evaluated the potential of microalgae as a pellet fuel. Compared to ISO17225, microalgae are a good raw material for the preparation of pellet fuels [8]. Besides, the protein contained in microalgae is also beneficial to the pelletization of raw materials [9,10]. As predicted by a recent report and our previous studies, microalgae seem to be an excellent binder for biomass pellets [5,9]. Besides, microalgae inheriting a high hydrogen-to-carbon molar ratio could act as hydrogen-donors, and it is possible that blending microalgae could help to produce high-quality fuel [11]. Until now, most reports focus on the co-combustion of microalgae and coal [12], microalgae and paper sludge [13], coal and terrestrial biomass [14], terrestrial biomass and paper sludge [15], or paper sludge and coal [16,17,18]. At present, to our knowledge, few studies focus on the novel bio-pellet co-combustion between microalgae and sawdust blends. Recently, co-pelletization and co-combustion of mixtures with different biomass were examined at the same time by Xiao et al. [19], Yilmaz et al. [20], and Tumuluru et al. [21]. Therefore, it is necessary to combine the co-pelletization and co-combustion to investigate the manufacturability and thermogravimetric analysis of this novel bio-pellet fuel between waste biomass and microalgae blends.
This work investigates the potential of microalgae (Chlorella vulgaris powder, CVP) as a binder to affect the energy consumption, physical, and thermal properties of a novel pellet (Chlorella vulgaris and sawdust blend, CSB). The specific objective of this study is to provide insight into the physical-energy and thermal properties of novel bio-pellet fuel between waste biomass and microalgae blends by co-pelletization and co-combustion experimental investigation.

2. Materials and Methods
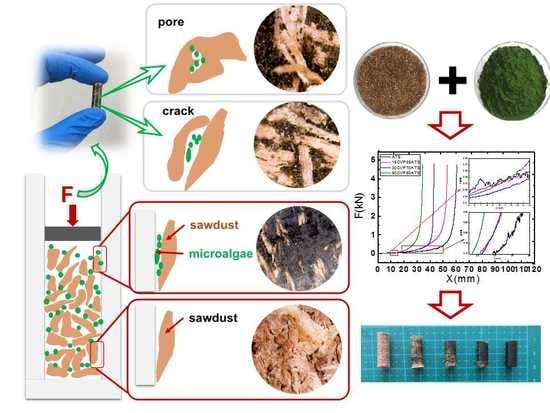
2.1. Materials

The feedstock used in this study included powder of Chlorella vulgaris (Freshwater Algae Culture Collection at the Institute of Hydrobiology (FACHB)-1227) provided by the Freshwater Algae Culture Collection at the Institute of Hydrobiology (FACHB-Collection, Hubei province, China) and apple tree sawdust (ATS) provided by TusHoldings Raising Clean Energy Technology Co., Ltd. in Xi’an city (Shaanxi province, China). The elemental and proximate analysis results of the samples above are shown in Table 1 (on a dry ash-free basis). The samples of Chlorella vulgaris powder and apple tree sawdust were shredded into powder with small molecules (pure CVP less than 200 μm, pure ATS less than 1 mm) and dried at 105 °C for 20 h. The high heating value (HHV, MJ/kg db) was calculated from the elemental compositions using Equation (1) (method verified by Masoud [22]). Then, the low heating value (LHV, MJ/kg db) was determined through Equation (2) (method verified by Miranda [8]).
HHV = 0.3491C(%db) + 1.1783H(%db) + 0.1005S(%db) − 0.10340O(%db) − 0.0151N(%db) − 0.0211A(%db)
LHV = HHV 0.02477 H ( % db ) · 9.011
where, C, H, O, N, S, and A represents carbon, hydrogen, oxygen, nitrogen, sulfur, and ash content of materials, respectively, expressed in dry weight percentage.

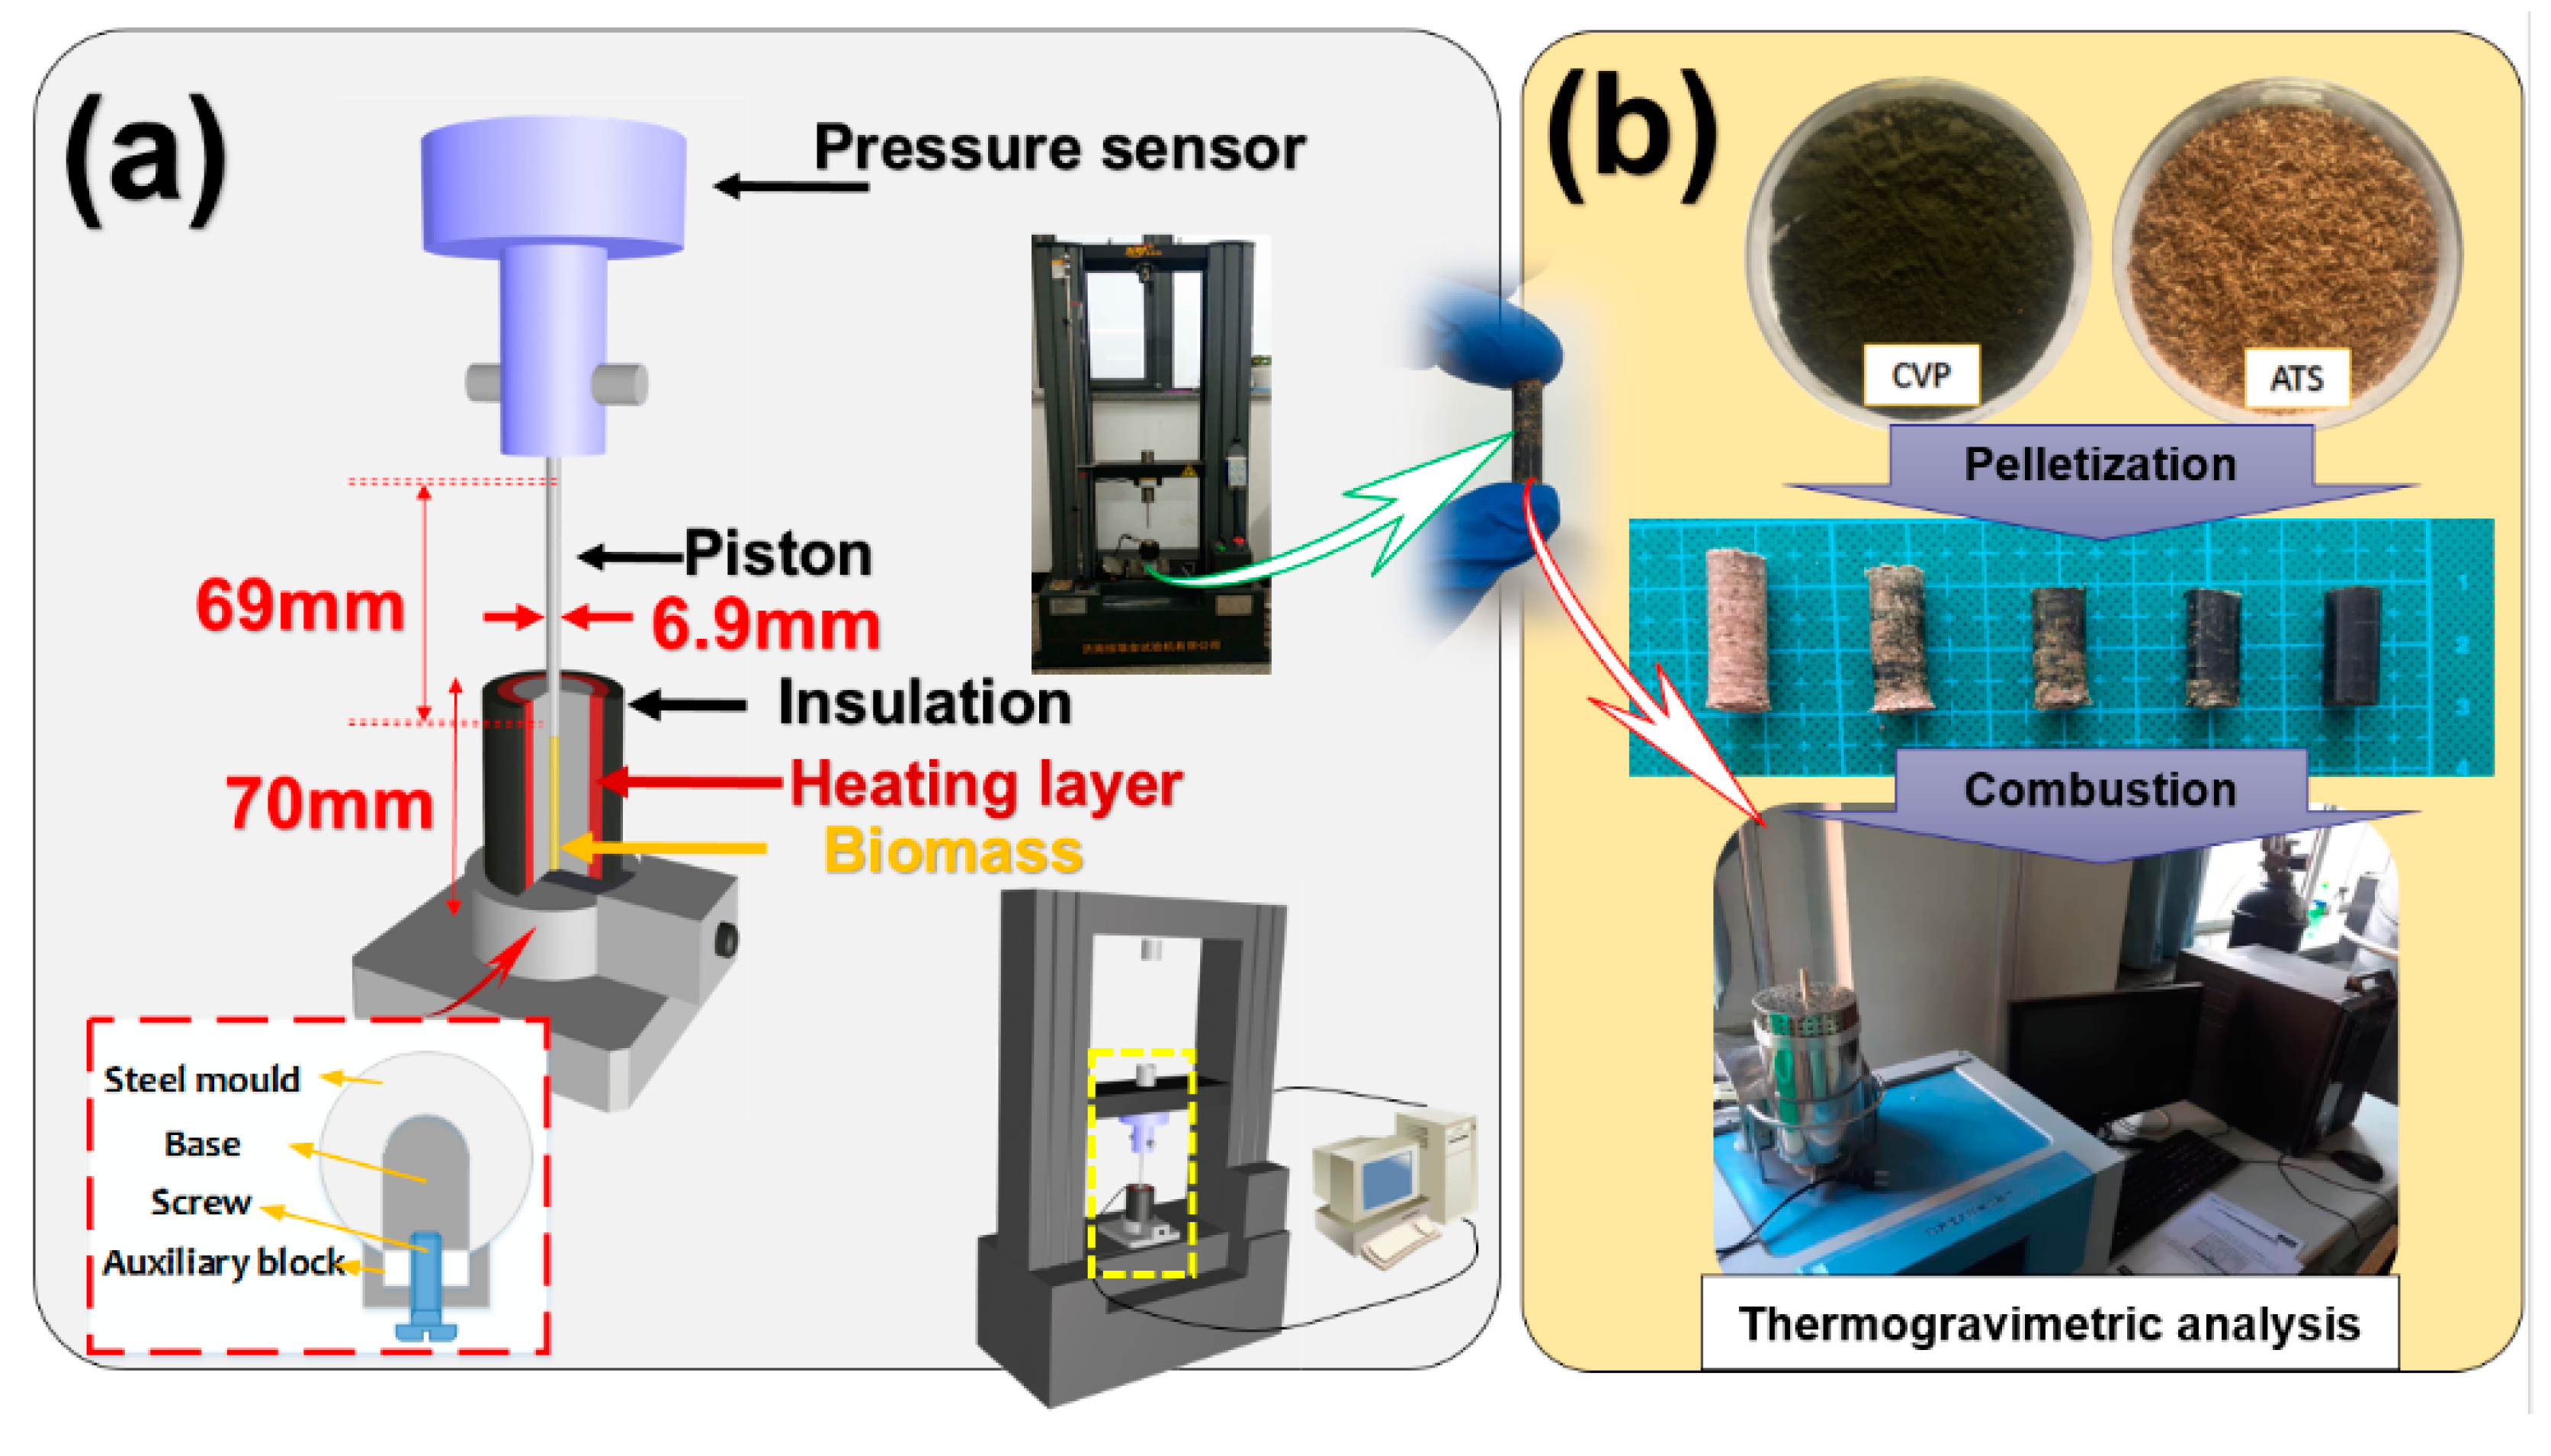
2.2. Pelletization and Sample Preparation

Chlorella vulgaris powder was added to ATS. In the process of pelletization, the additive (CVP) was blended complying with the proportions of 0%, 15%, 30%, and 50% in weight by tumbling for 2 h to achieve proximate homogeneity, separately. The pellet sample (around 1.0 g) was prepared using a single pellet device in Figure 1a. In short, the unit was installed using a cylinder (7.0 mm in inner diameter and 70.0 mm in height) and a piston (6.90 mm in diameter and 90.00 mm in length). The cylinder was wrapped in heating tape with a thermocouple and a temperature controller to preheat the inside cylinder to a certain die temperature, and the end of the piston away from the cylinder was inserted vertically into the pressure sensor [23]. In this study, a pure CVP or ATS mixture filled the cylinder (around 1.0 g) and was compressed at a rate of 2.0 mm/min until the desired pressure was achieved. In particular, the raw mixture was compressed at a rate of 2.0 mm/min until the desired pressure was achieved. The different maximum pressures were 120 MPa, 140 MPa, 160 MPa, 180 MPa, and 200 MPa with a residence time of 30 s. Before the loaded sample was pelleted, the cylinder die was preheated to 120 °C by temperature controller. Then, in Figure 1b, a sample (around 10.0 mg) was analyzed by a thermogravimetric analysis (TGA).
In this study, the raw ATS was pelletized with microalgae powder, a kind of CVP, at three different proportions of 15%, 30%, and 50% by a single pelletization experimental device under different parameters of pressure (120–200 MPa), temperature (80–160 °C), and moisture content (6%–14%). The common experiment (140 MPa, 120 °C, 10%) was controlled. In addition, a pre-experiment was carried out in the early stage of the experiment. Preliminary experiments showed that a small proportional gradient would not bring obvious experimental results, so three different proportions of 15%, 30%, and 50% were chosen to make the experimental results remarkable. Moreover, when the proportion of microalgae is higher than 50%, the number of microalgae will be greater than the amount of wood and the microalgae will not be considered an additive. The price of microalgae is much higher than sawdust. If the proportion of microalgae is more than 50%, it will increase the cost of the pellet. Thus, the samples were prepared as follows: 15CVP85ATS-composed of 15% Chlorella vulgaris powder and 85% apple tree sawdust; 30CVP70ATS-composed of 30% Chlorella vulgaris powder and 70% apple tree sawdust; and 50CVP50ATS-composed of 50% Chlorella vulgaris powder and 50% apple tree sawdust. In addition to the above samples, two reference samples, CVP composed of pure Chlorella vulgaris powder and ATS composed of pure apple tree sawdust, were prepared. These last samples will help understand the co-pelletization and co-combustion behavior of the studied pellet.

2.3. Evaluating Properties of Pellets (Based on ISO 17225)

The elemental and proximate analysis results of the samples were measured using an Elementar Vario Micro cube according to ISO 16948/16994. Moisture content was obtained according to ISO 18134-1/2 and ISO 17225 [24]. The ashes (A, % db.) were obtained according to ISO 18122 [25]. The low heating value (LHV, MJ/kg Wb) was obtained based on ISO 18125 [26]. The mechanical durability (DU, %) of the pellets was determined according to ISO 17831-2:2016-02 standard [27]. The bulk density (BD, kg/m3 Wb) of briquettes was determined according to the method described in the ISO 17828 standard [28].

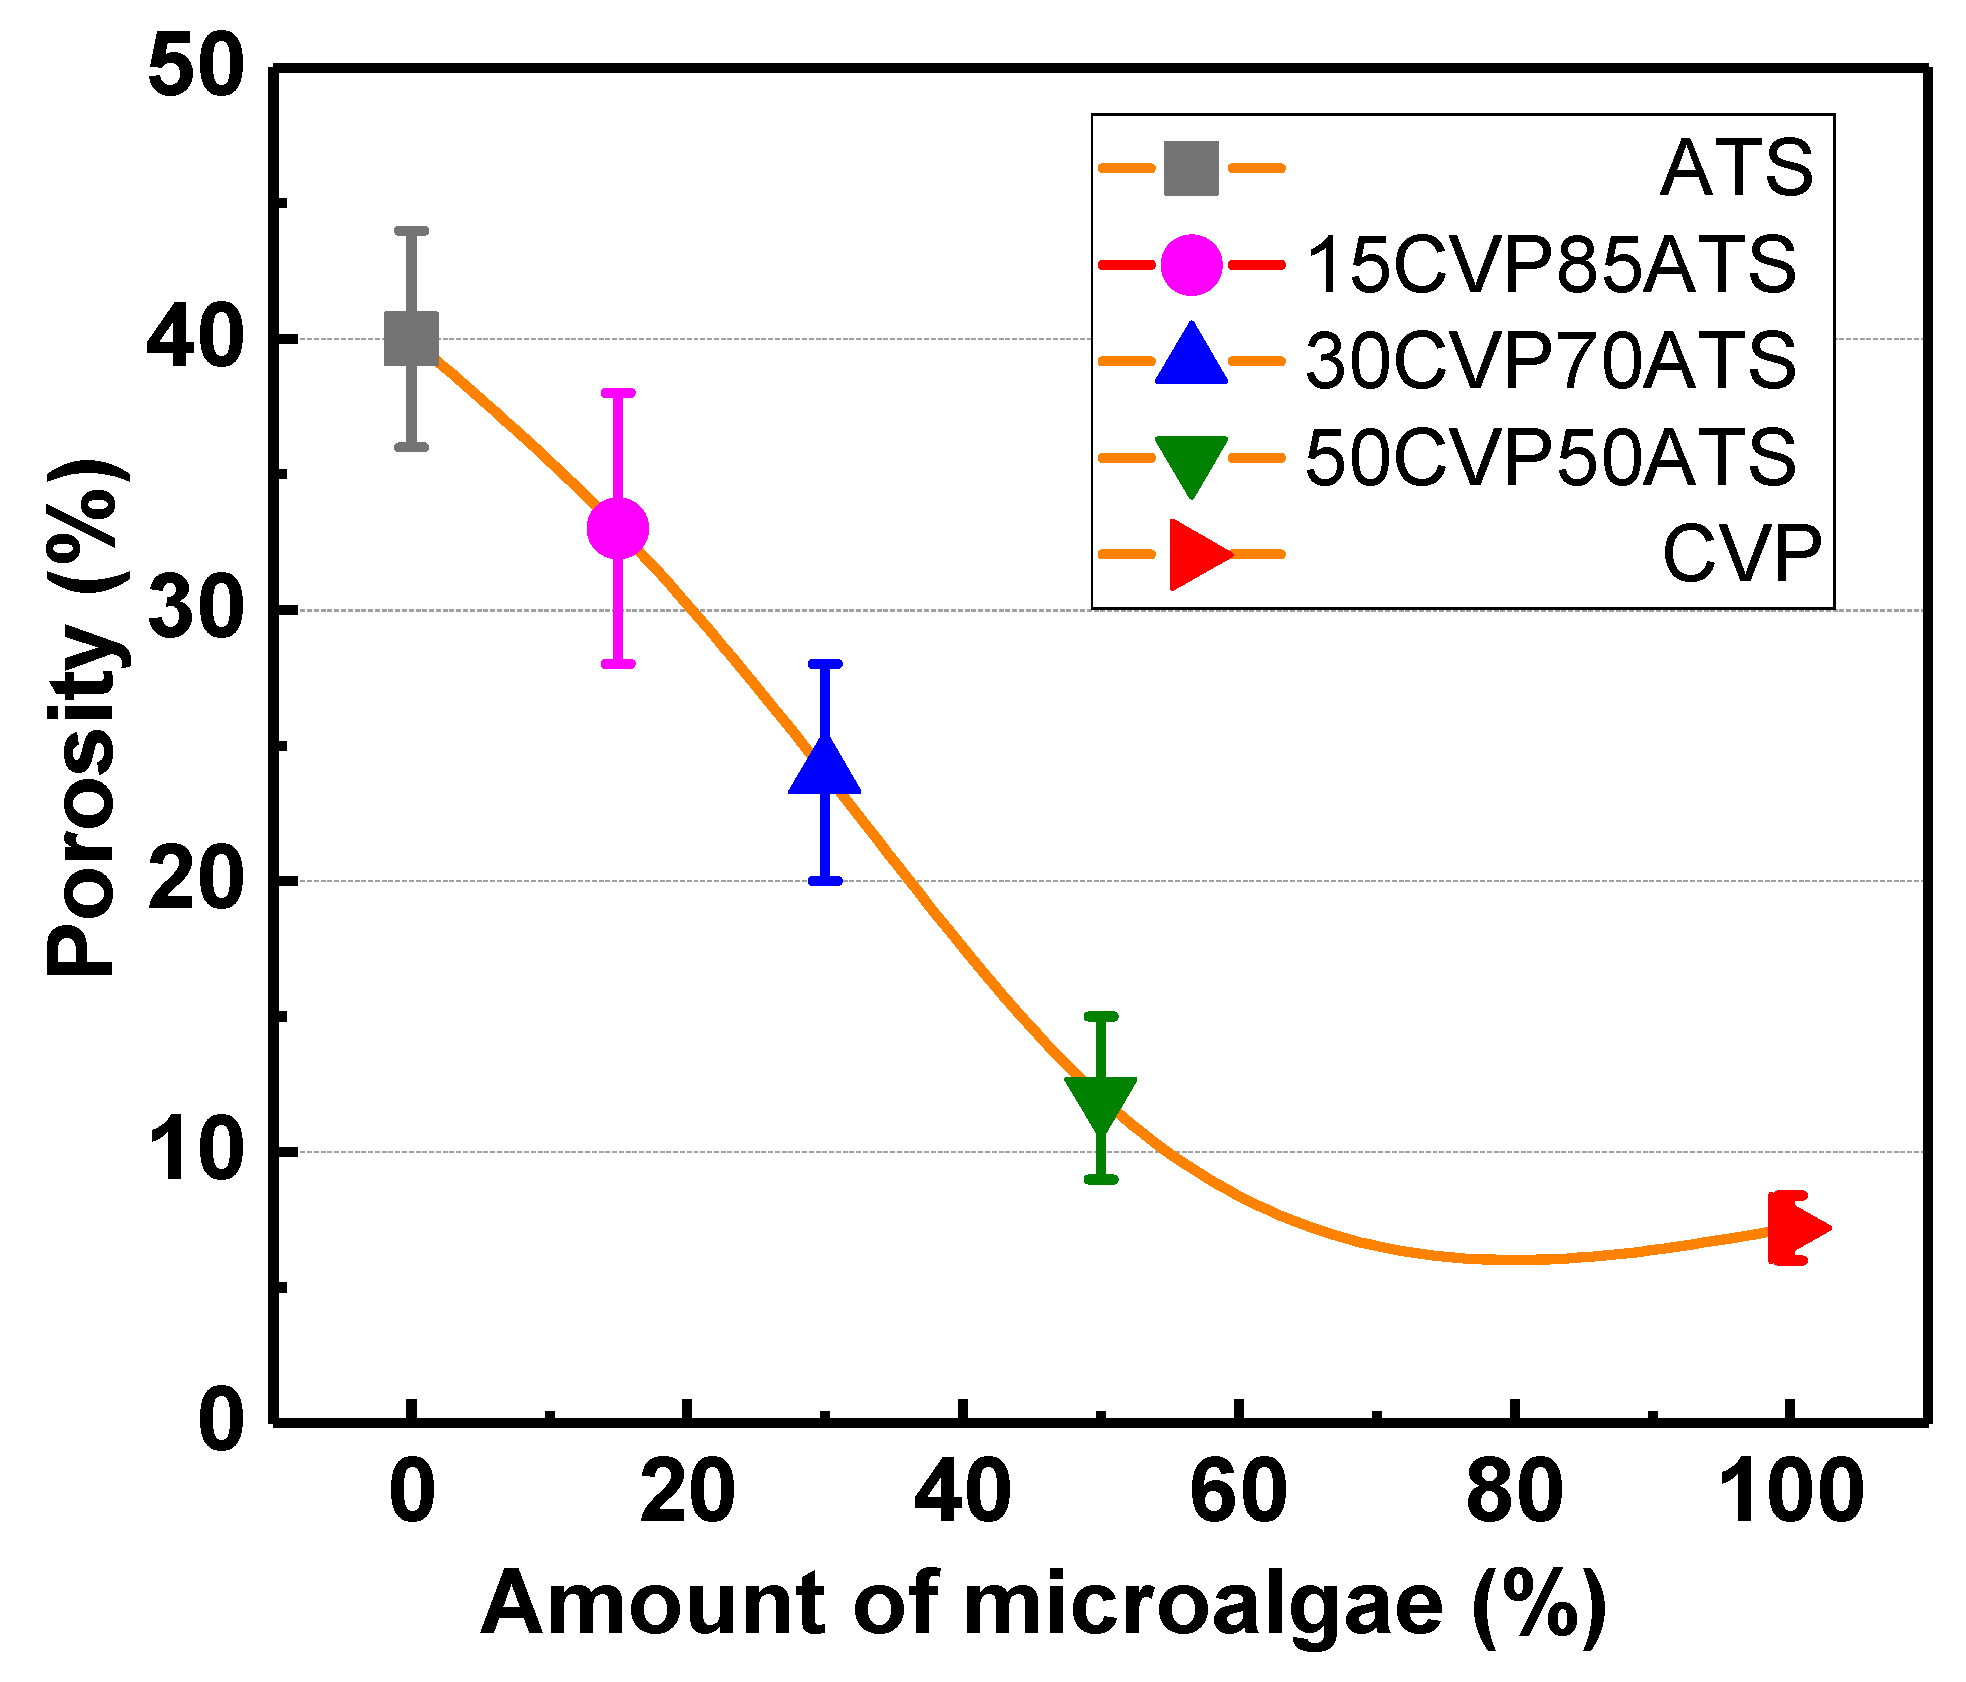
2.4. The Porosity (ϕ0) of Pellets

The particle volume (Vp, mm3) of the raw material was measured using a gas comparison pycnometer (ROOKO-FT-610, China) and each sample was counted three times. The volume of the pellet (V, mm3) was measured using a vernier caliper with a bottom radius of the pellet (r, mm) and a height of the pellet (h, mm). The porosity (ϕ0, %) of the pellet could be calculated using Equation (3):
ϕ 0 = 1 V p π · r 2 · h

2.5. Energy Consumption of Pelletization

The energy consumption (W, kJ/kg) of the pellet during pelletization can be calculated according to previous studies [29,30,31,32,33]. The pressing force (F, kN) and displacement (X, mm) of the pelletization process can be read from the experimental system by a computer, as shown in Figure 1a, in real time, and the energy consumption of the single pellet (m, kg) fuel preparation can be calculated using Equation (4):
W = 0 x F · X m

2.6. Thermogravimetric Experiments

Thermogravimetric analysis was carried out on an HTC-1 thermogravimetry analyzer, which can accurately record the weight loss (TG) and the rate of weight loss (DTG) curves in order to evaluate the combustion characteristics of samples. In each experimental run, around 10 mg sample from different parts of the pellet were loaded into a Al2O3 ceramic crucible, which, to avoid heat and mass transfer limitations, was carried out at heating rates of 10, 20, 30, and 40 °C/min at a temperature ranging from 30 °C to 800 °C. Once the heating temperature reaching 105 °C, it was held for 5 min to remove the free water in the sample. Although the real combustion environment of the fuel was complex and diverse, in order to imitate the air environment and maintain the insert environment, nitrogen and oxygen in a ratio of 8:2 were chosen as the purging gas, with a flow rate of 100 ml/min during thermal analysis. The experiment under given conditions was carried out more than twice in order to guarantee the error of experimental results within ± 5%.

2.7. Kinetic Model

Generally, the reaction rate is expressed by the decomposition rate of samples given by Equation (5):
d α d t = k f ( α )
where f (α) represents the reaction model of degradation and rate constant, and α is conversion, calculated using Equation (6):
α = m i m t m i m
where mi, mt, and m, (mg) refer to initial, instantaneous, and final weights, respectively. The k is the rate constant that can be calculated using Arrhenius equation as Equation (7):
k = A exp ( E R T )
where A is the pre-exponential factor, E (kJ/mol) is the activation energy of the reaction, R is the universal gas constant, 8.314 J/(mol·K), and T(K) is the absolute reaction temperature.
Substituting Equation (7) into Equation (5) gives Equation (8):
d α d t = A exp ( E R T ) f ( α )
where t is the reaction time, A is the pre-exponential factor, E is the activation energy, R is the universal gas constant, T (K) is the absolute reaction temperature, and f (α) represents the reaction model of degradation and rate constant. The heating rate β (°C/min) can be calculated using Equation (9)
β = d T d t
Next, Equation (6) is transformed into Equation (10)
d α d T = A β exp ( E R T ) f ( α )
In this work, the activation energy E (kJ/mol) of the sample was obtained by a model-free method, and the Kissinger–Akahira–Sunose (KAS) and Ozawa–Flynn–Wall (OFW) methods were employed to obtain the activation energy.
According to the KAS method, E (kJ/mol) can be calculated from the slope of the lines generated by the plot of ln (β/T2) versus l/T under given values of α, as shown in Equation (11) [13], and the mean activation energy can be derived from the slope.
ln ( β T 2 ) = ln ( A R f ( α ) E ) E R T
Doyle’s approximation was adopted temperature integration in the OFW method [34]. This method (OFW) was based on Equation (12) [35]:
ln ( β ) = ln ( A R f ( α ) E ) 5.335 1.0516 E R T
where E can be calculated from the slope of the lings generated the plot of ln (β) versus l/T. The mean activation energy can be derived from the slope.

2.8. Statistical Analysis

As mentioned above, pelletization tests and thermogravimetric experiments were repeated at least three times. The data were presented as their range in terms of standard deviation. The calculated standard deviation indicated the level of uncertainty in the experiments.

3. Results and Discussion

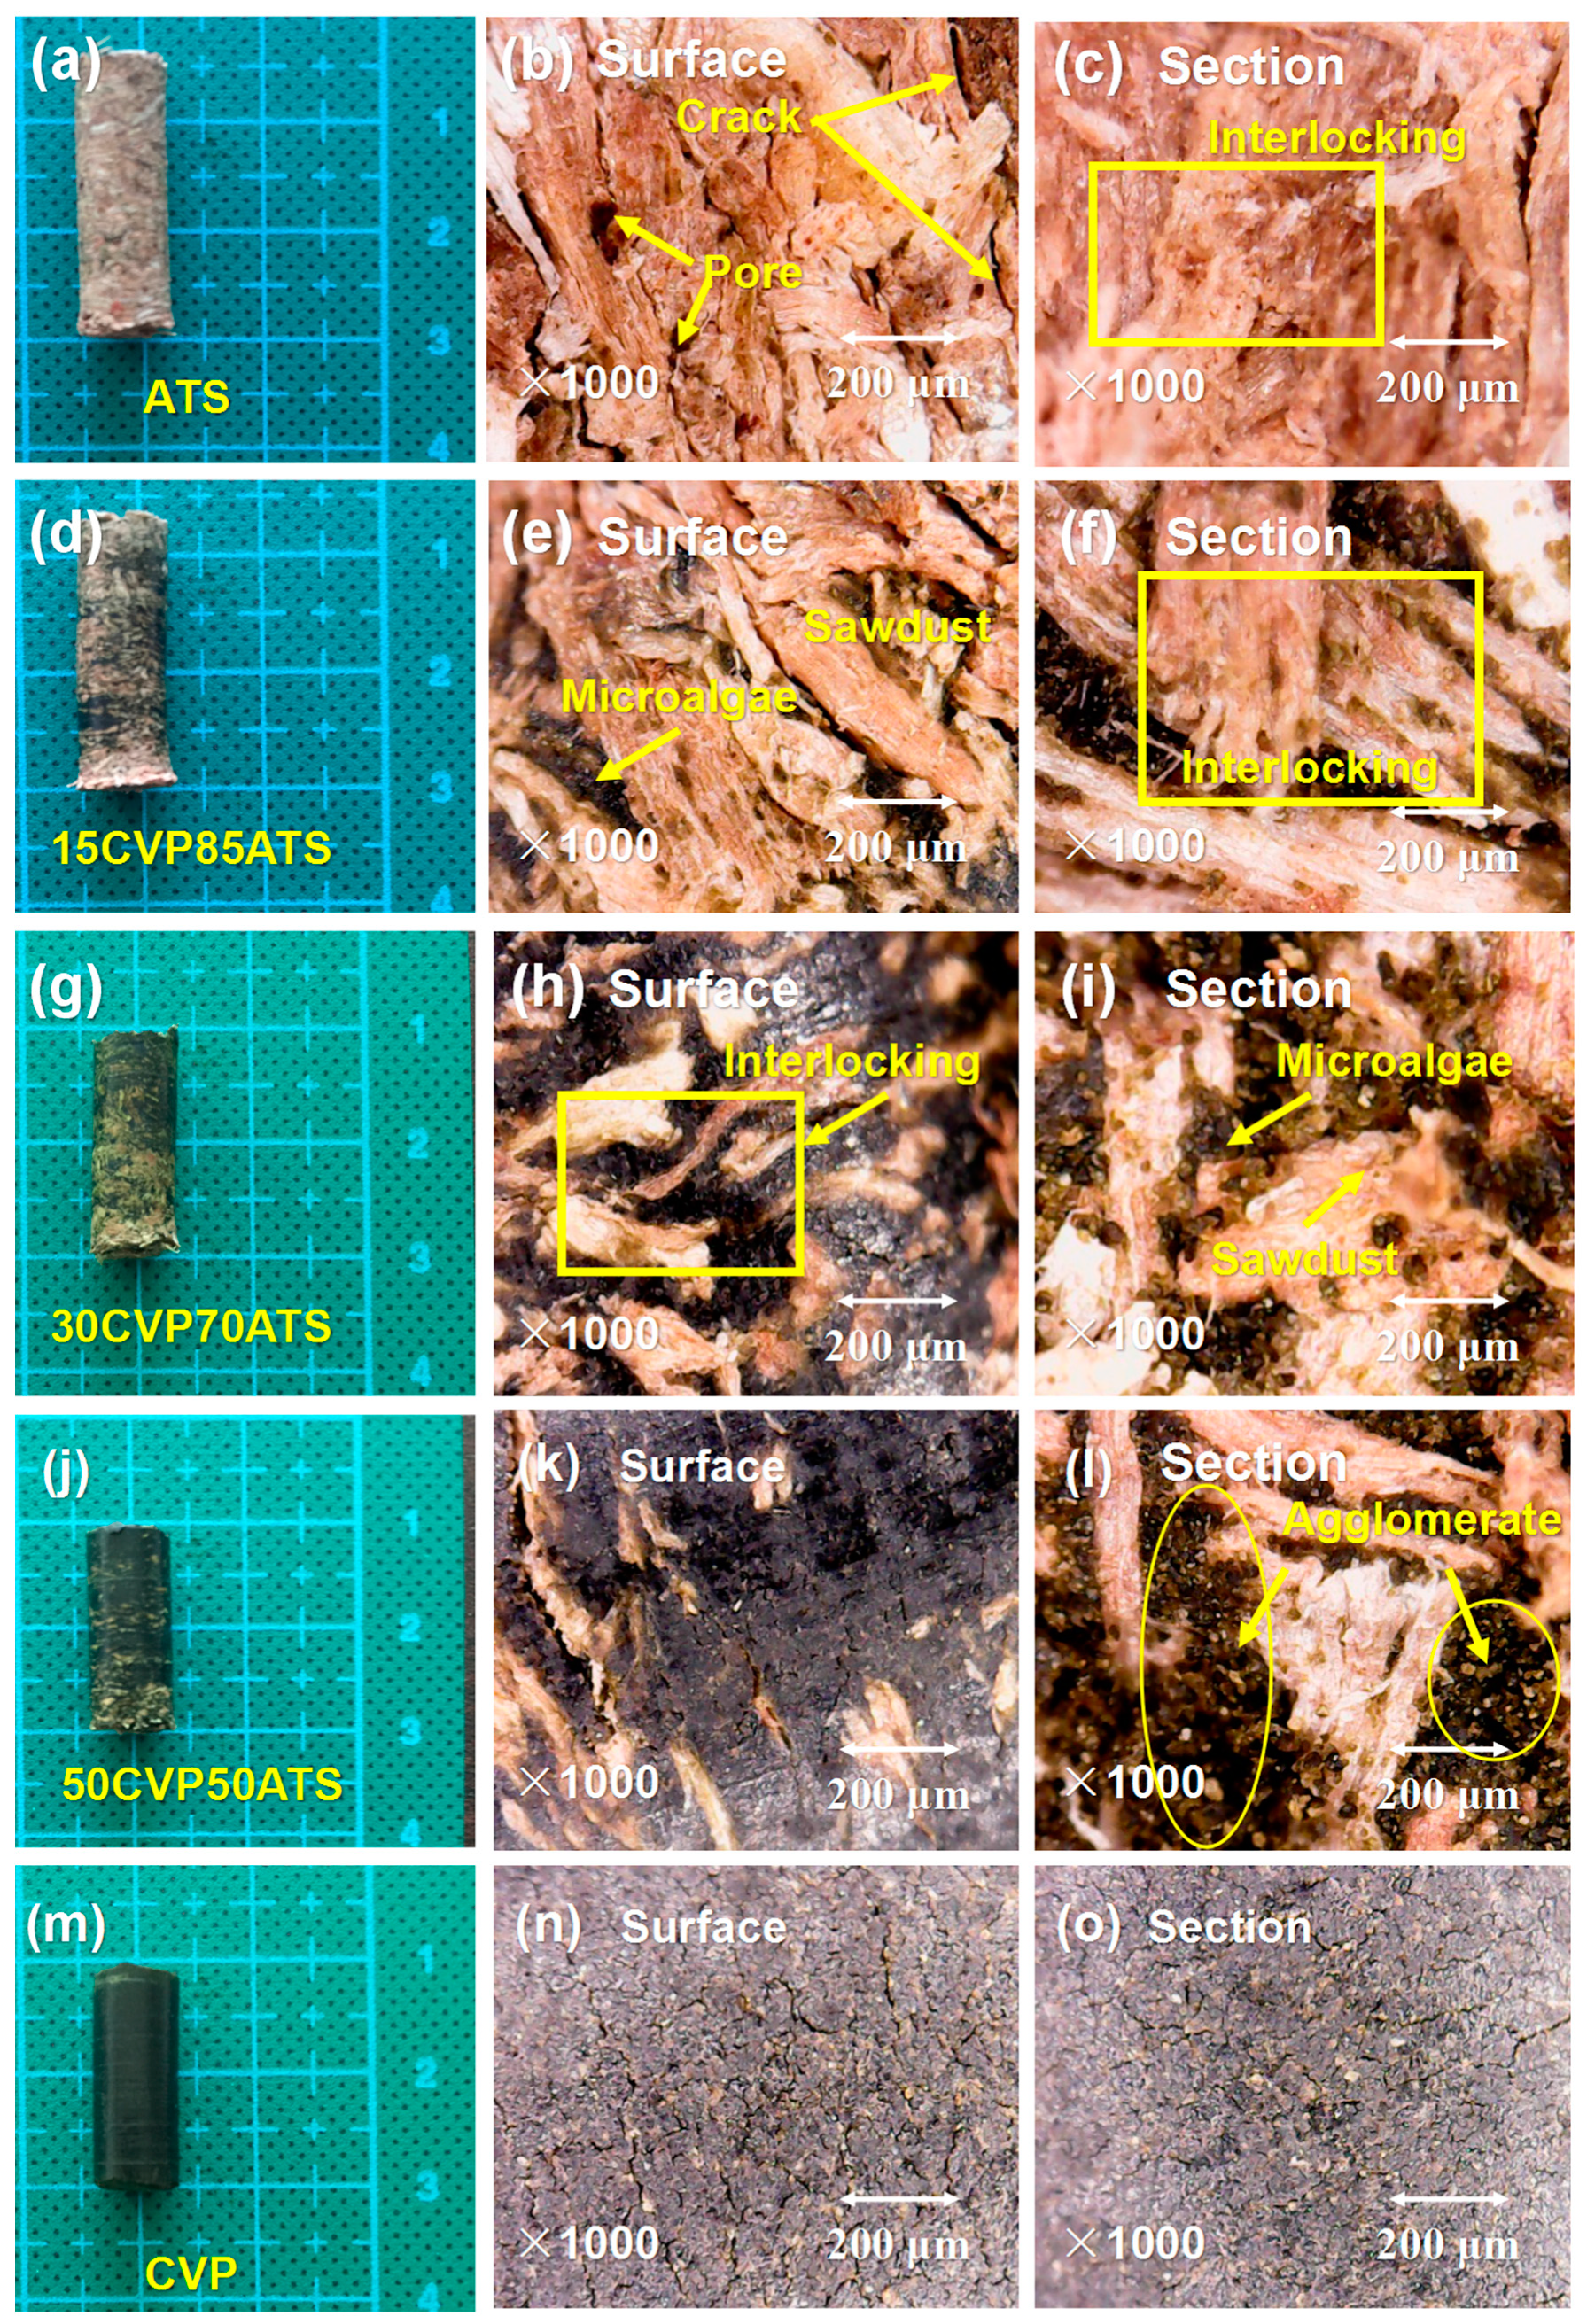
3.1. Effects of Parameters on the Physical Properties of CSBs

According to previous reports, the price of CVP is about $60 per ton, while the price of sawdust is about $21 per ton [36,37]. In other words, the price of the CVP is about three times the price of sawdust. Considering the economics of raw materials, although the high content of CVP (for example, 75% of CVP) seems to improve pellet quality, the proportions of CVP higher than 50% will greatly increase the cost of the pellet fuel. Besides, waste wood is easier to be obtained than microalgae. If the CVP is used directly as a fuel or the microalgae content is higher than the waste wood content, the price of the fuel will not be able to meet the market demand. The content of microalgae in this work is controlled in the range of 0%–50%, mainly considering the feasibility of the cost of fuel. Therefore, in this study, the wood pellet is used as the main object, and the effect of microalgae as an additive (0%–50%) on the quality and energy consumption characteristics of wood pellets was investigated. The physical properties of pellets made from ATS and CVP are shown in Figure 2a–f.

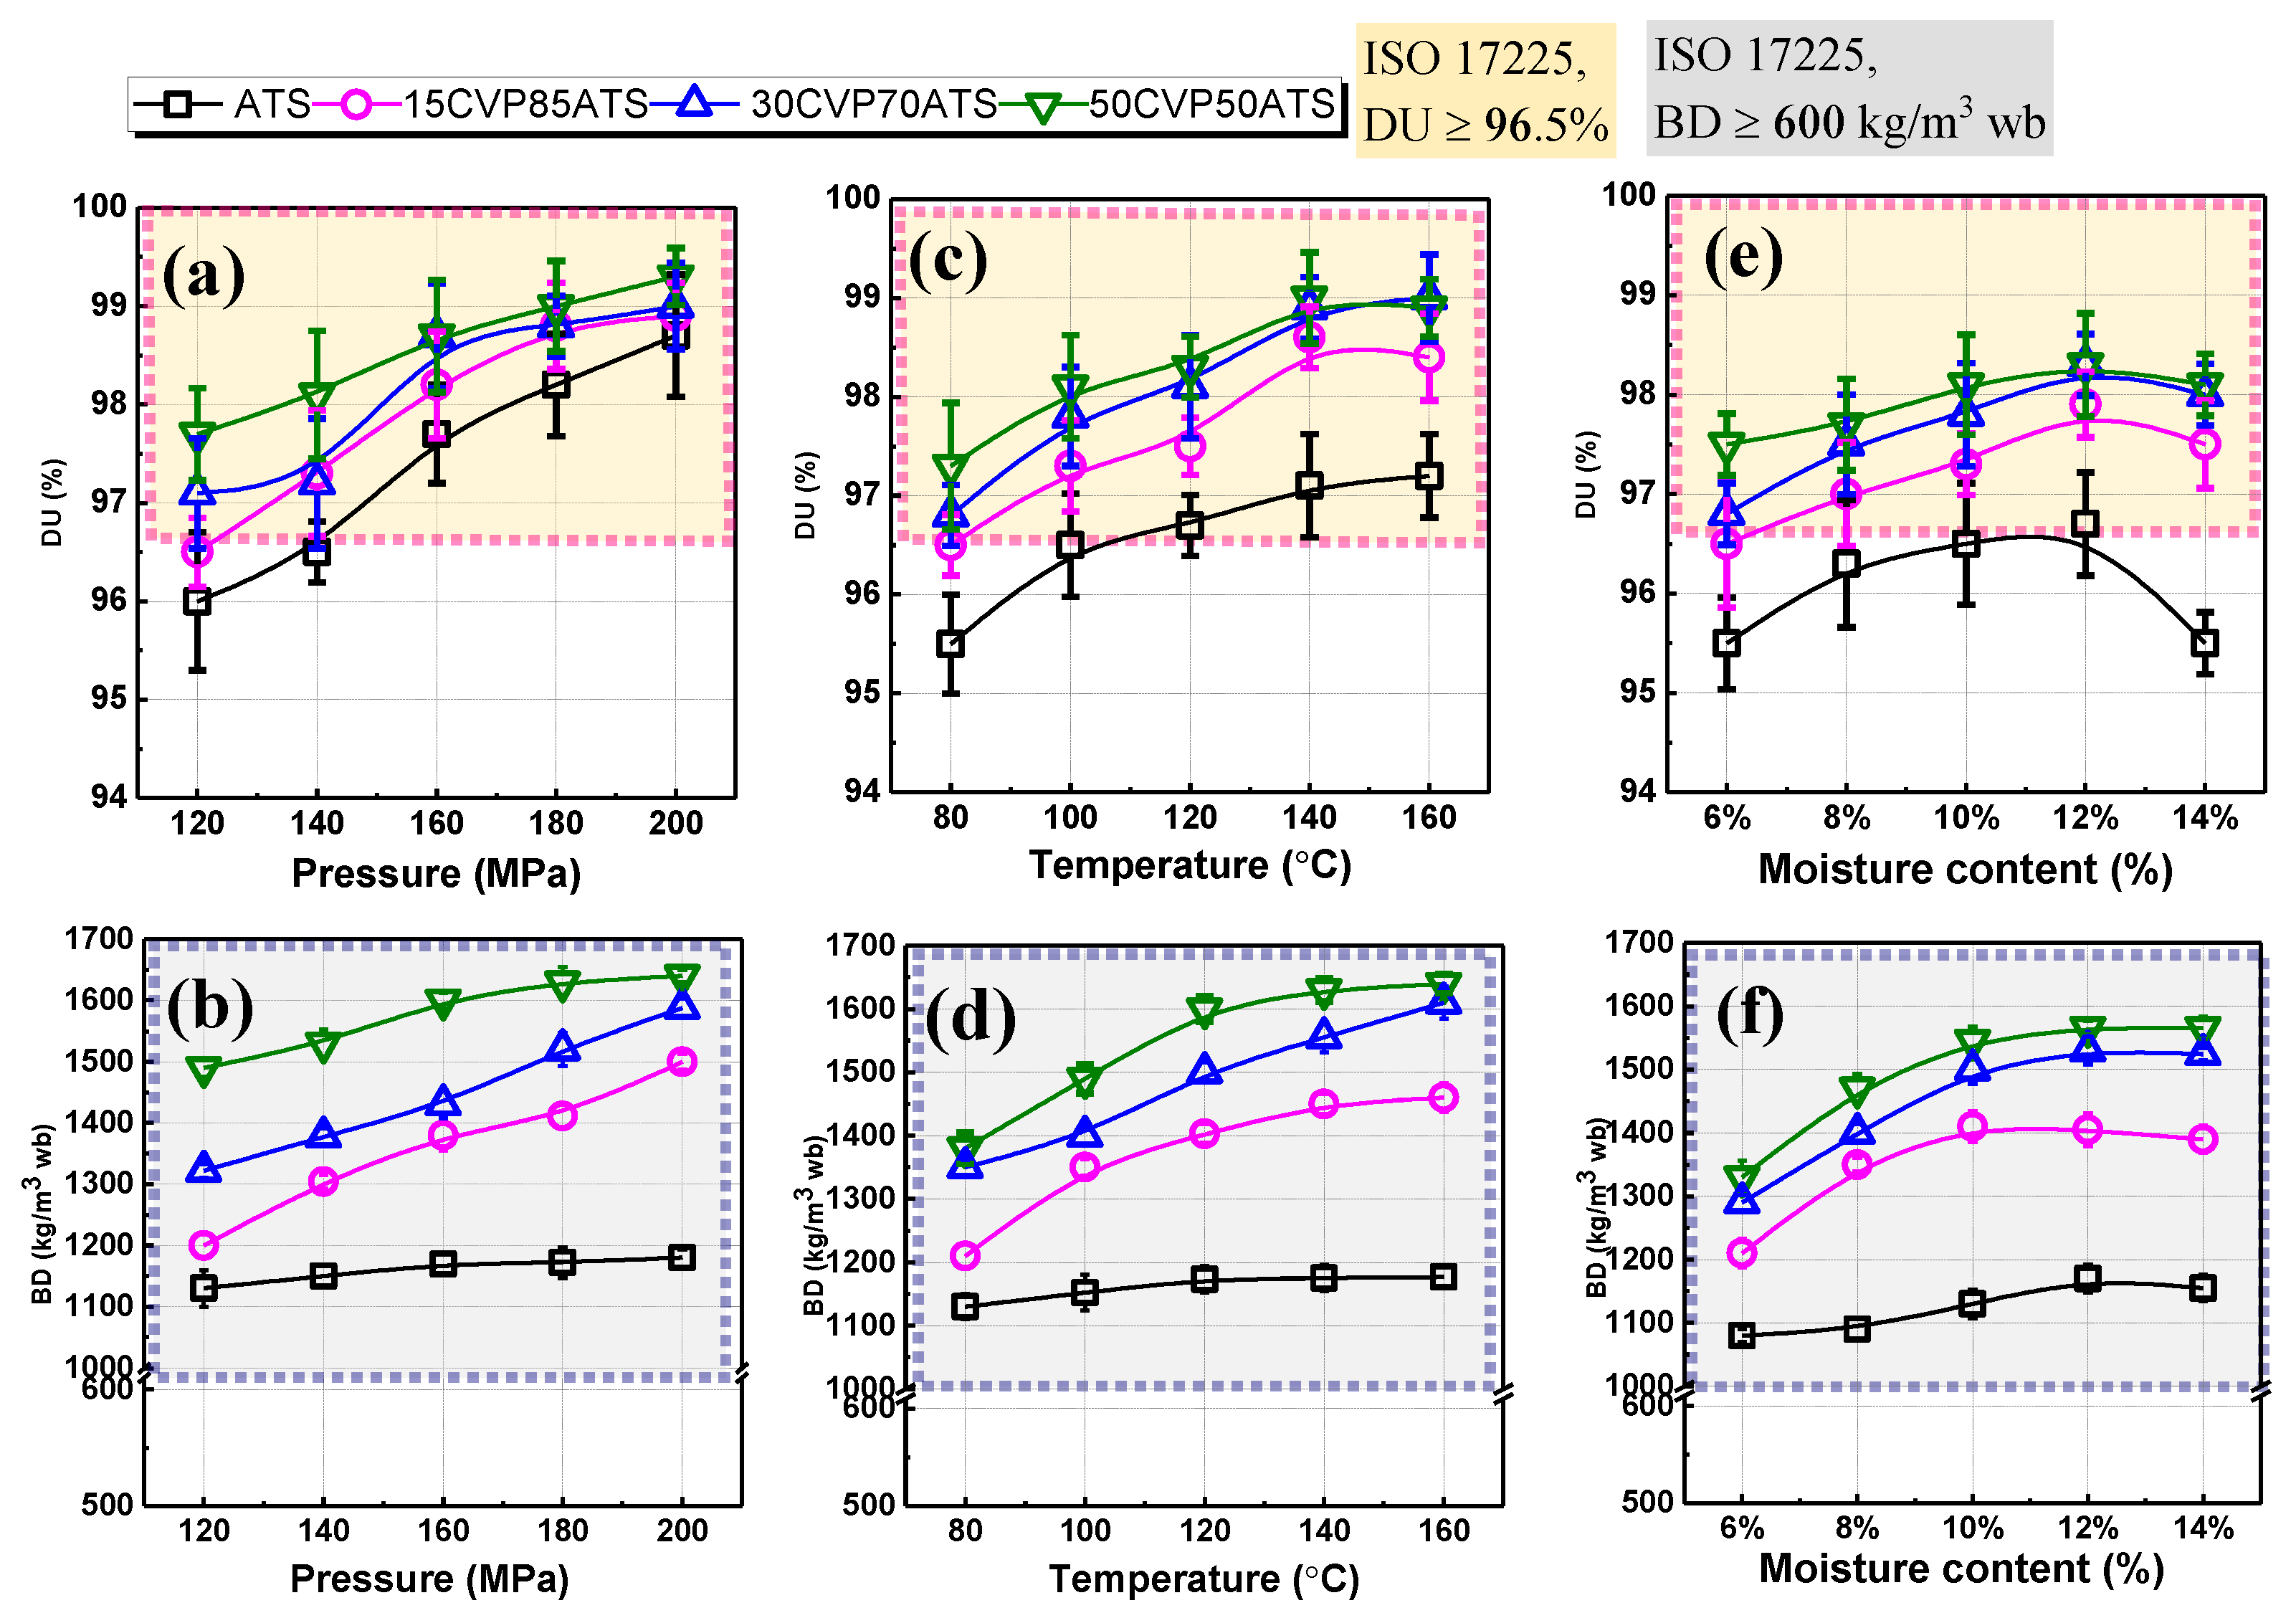
3.1.1. Effect of Pressure on Physical Properties

A comparison of the pellet quality at 100 °C, 10% moisture content with different pressures (120 MPa, 140 MPa, 160 MPa, 180 MPa, and 200 MPa) is presented in Figure 2a,b. The BD of pellets was an important factor during the transporting of the pellets. As shown in Figure 2a,b, all of the CSB pellets had a DU and BD greater than 96.5% and 600 kg/m3, respectively, which means that the requirements of the ISO 17225 standard were met. However, at lower pressures (such as 120 MPa), the ATS pellets had a DU of about 96% of the particles and did not meet the ISO 17225 standard. The DU and BD of all pellets increased continuously with increasing pressure. Previous research showed that the pellet BD increased exponentially with the applied pressure during densification of the palm fiber and shell [38]. It is worth noting that the use of microalgae as an additive can effectively increase the BD and DU of the biomass material. The BD and DU of all CSB pellets were in the range of 1200–1650 kg/m3 and 96.6%–99.1%, respectively, which were higher than all ATS samples. Therefore, the CSB prepared under 120 MPa conditions could meet ISO 17225. Considering that large pressures increase energy consumption, 120 MPa might be the optimal manufacturability parameter.

3.1.2. Effect of Temperature on Physical Properties

The effect of different die temperatures (80–160 °C) on the pellet characteristics is shown in Figure 2c,d. The data were obtained from the experiments carried out at 120 MPa, 10% of moisture content, and all of the CSB pellets had DU and BD greater than 96.5% and 600 kg/m3, respectively, which means that the requirements of the ISO 17225 standard were met. Firstly, as the die temperature increased to the range of 80–120 °C, the pellet BD and DU of the sample increased. Furthermore, it was clearly shown that the die temperature had little effect on the pellet BD of the sample from 120 °C to 160 °C. For ATS, the effect of lignin softening is the primary type of binding [15]. For biomass materials, glass transition occurred between 50 °C and 113 °C. Similar to the effect of temperature on the pellet DU, according to the previous researches, Jiang et al. [15,39] found that the sludge contains proteins that act as binders between sawdust particles. Kaliyan et al. [40] also reported that proteins have the potential to act as interparticle binder for pellet fuel. Therefore, based on the Table 1 and previous studies, it can be speculated that proteins contained in microalgae can acts as a natural binder. According to previous reports, the lignin and protein contained in the raw materials did not act as binders at lower die temperatures [7]. As shown in Figure 2c, when the temperature was lower than 120 °C, DU increased, and at lower temperatures (e.g., 80–100 °C), the DU of the ATS was about 96%–96.4%, which was lower than the minimum required by ISO 17225 (≥96.5%). This is mainly due to insufficient protein for a natural binder in ATS. This seems to hinder the effective reduction of energy consumption. Thus, it could be concluded that the die temperature of 120 °C seemed to be a better manufacturability parameter for CSBs.

3.1.3. Effect of Moisture Content on Physical Properties

As shown in Figure 2e,f, the effect data of moisture content on the pellet characteristics were obtained from the experiments carried out at 120 MPa, 100 °C. The BD of samples increased initially, with the moisture content increasing from 4% to 10%, and then moisture content had little effect on the BD of samples from 10% to 14% for CSBs. Moreover, the ATS had a DU value of 96.6%–96.7% only when the moisture content was 10%–12%, and the DU value was less than the minimum value (96.5%) required by the ISO 17225 when the water content was less than 10% and greater than 12%. The DU of pellets demonstrated a similar trend, which peaked at a moisture content of around 8%–10%. Therefore, the appropriate moisture content for pellets was around 10%. In other words, moisture content above or below this range results in lower-quality pellets. This phenomenon is consistent with previous studies showing that BD and DU (similar to hardness) of densified products have a peak in optimal moisture content levels. Besides, the glass transition temperature of lignin would improve in lower moisture conditions [41]. This was the reason that the BD and DU of the pellets were poor for extreme-level moisture conditions. Thus, these reasons may be due to the fact that good-quality CSB pellets can be produced at optimal levels (around 10%) in this study.

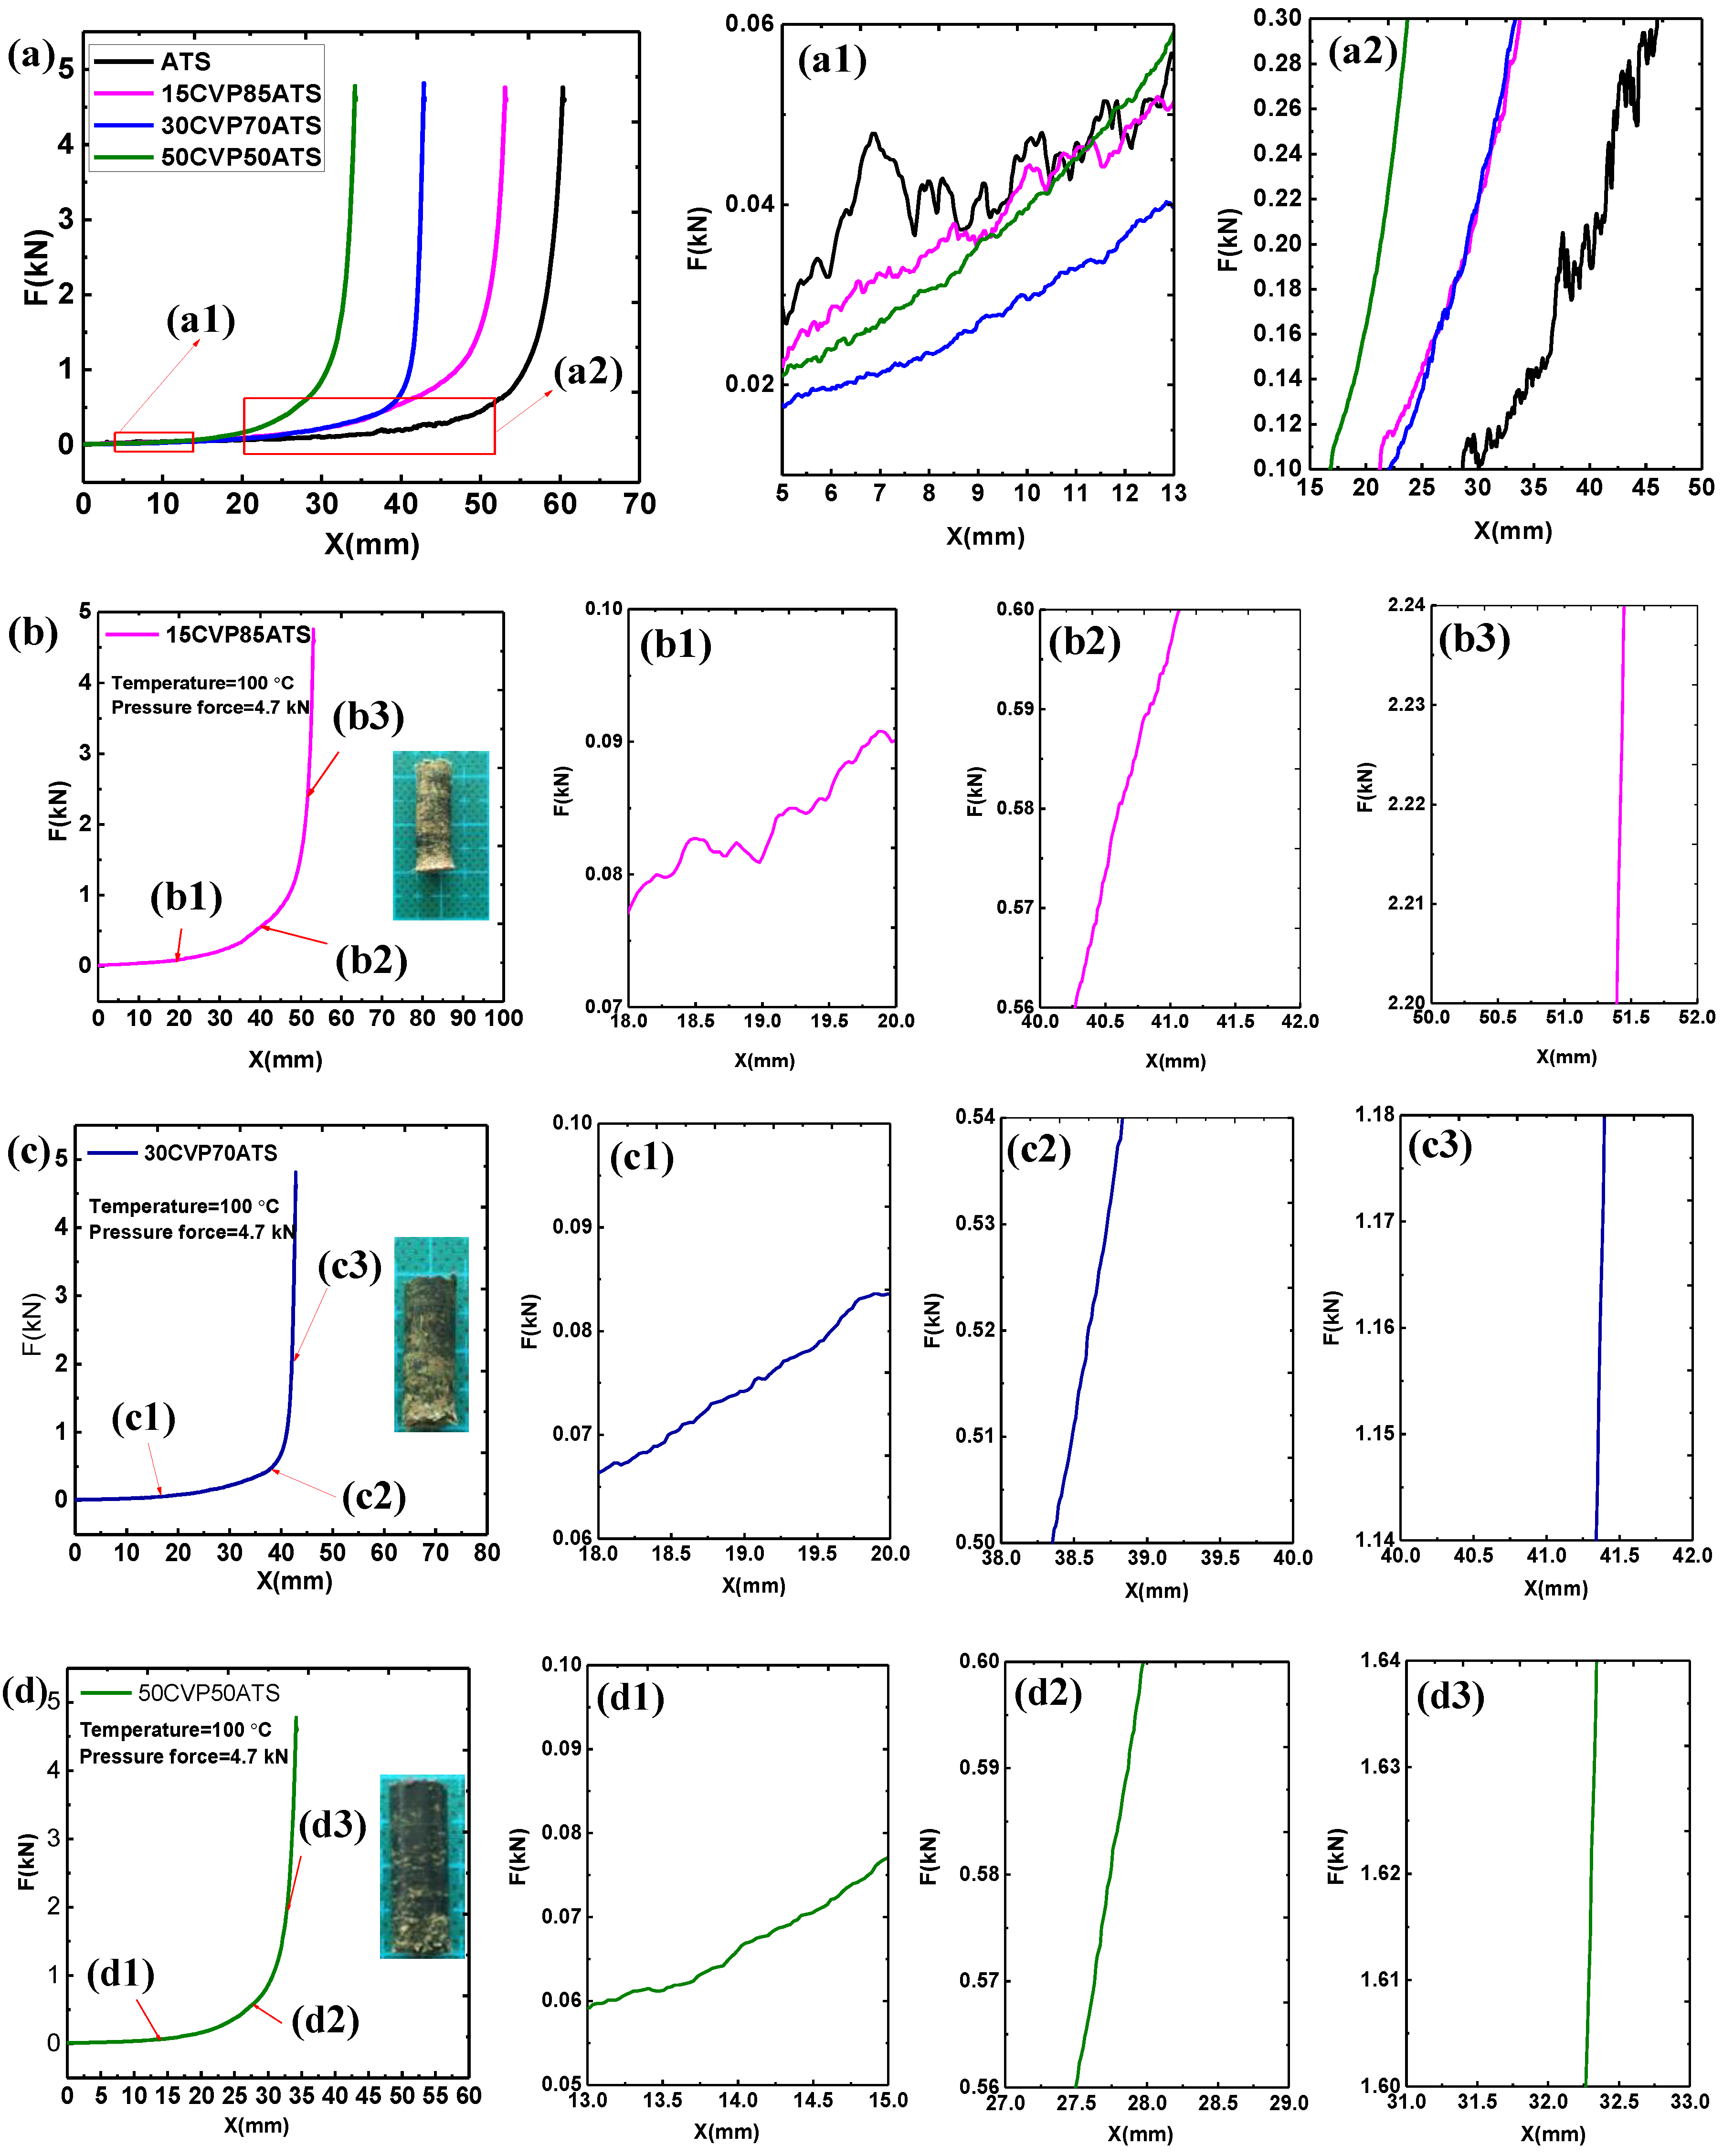
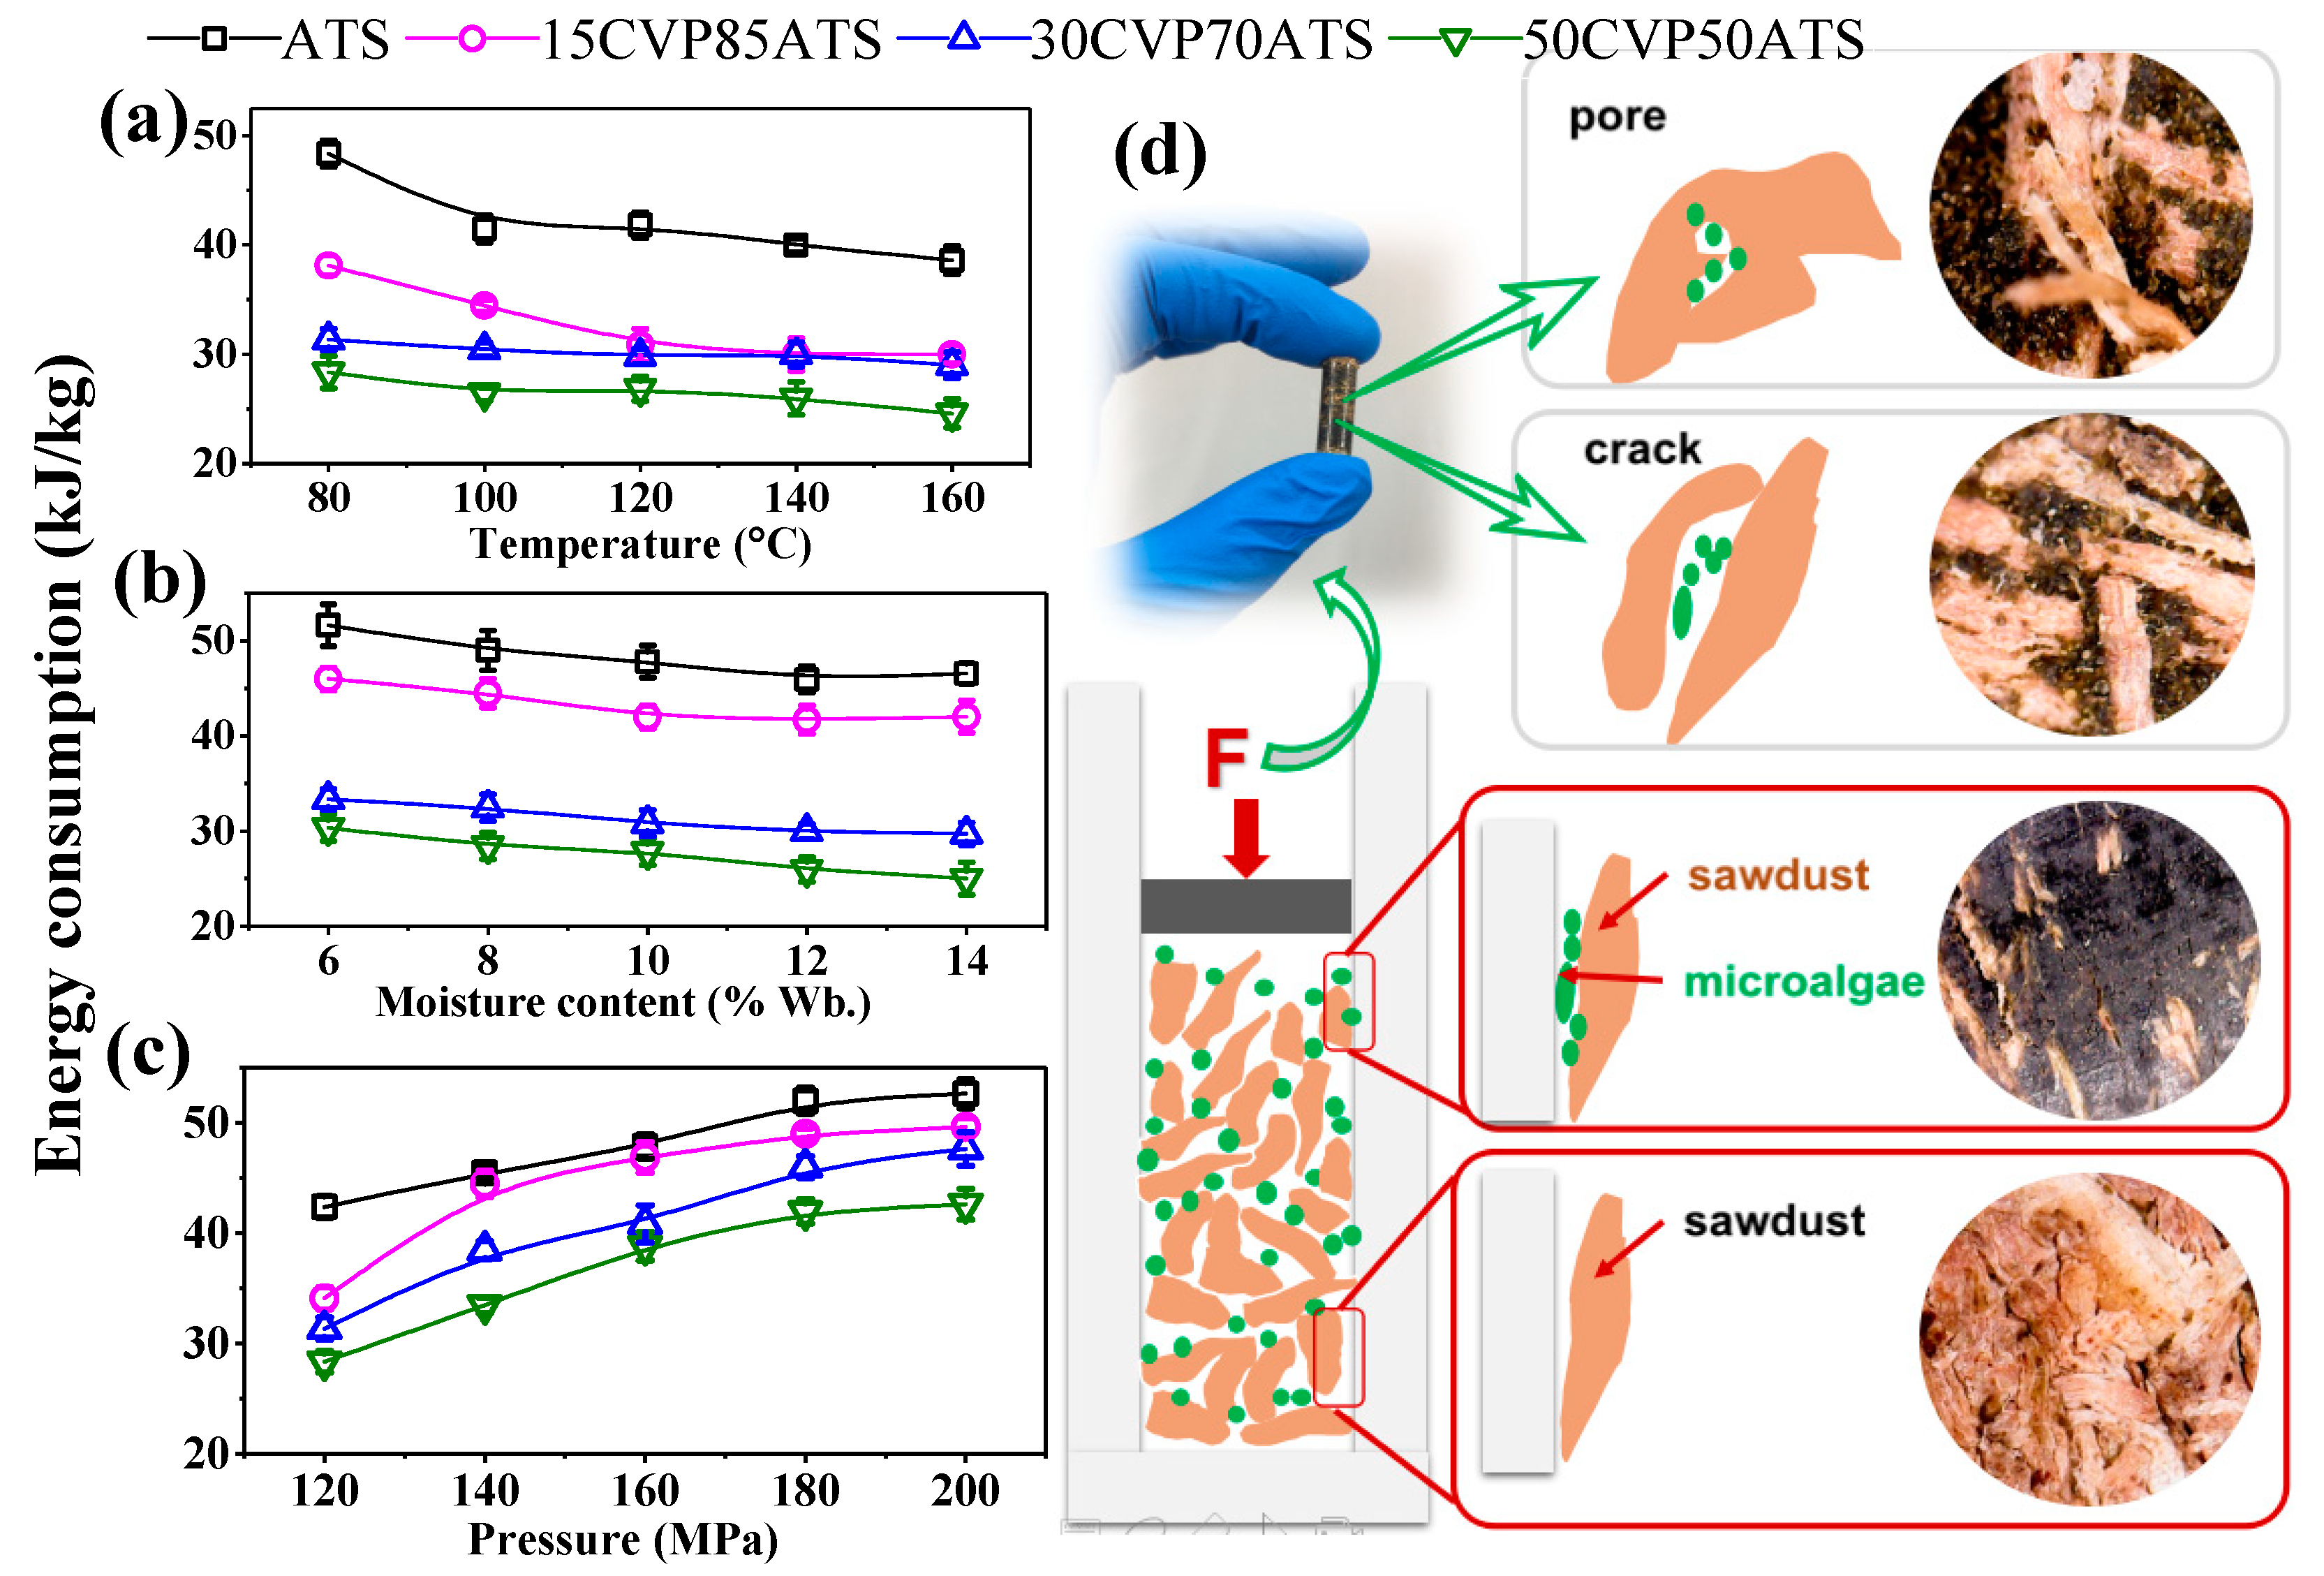
3.2. Insight into the Energy Consumption of CSBs During Co-Pelletization

A description and explanation of the co-pelletization between CVP and ATS in three different ratios of 3/17, 3/7, and 1/1 are shown in Figure 3a–d under a maximum force of 120 MPa, temperature of 100 °C, and a moisture content of 10%.
As shown in Figure 3(a,a1,a2), the samples’ pelleting process of displacement and force was similar to an exponential curve. As shown in Figure 3b–d, based on these graphs, the compression of samples consisted of three regions, particle rearrangement, particles’ agglomeration, and elastic-plastic deformation, which was similar to the pelleting process of straw [11]. During the I stage (applying force 0–0.2 kN), the sample particles completed their rearrangement phase. During the II stage (applying force about 0.2–0.6 kN), the particles experienced agglomeration to condense into a larger particle. By applying a force up to about 1 kN, the particles experienced a plastic-elastic deformation (III stage). Finally, by further increasing the force to the maximum set point of 3.5 kN the pellet density was increased. However, compared with the wood and straw biomass pelletization process, the three stages of samples mixed with microalgae exhibited the least difference. When the percentage of microalgae added was 15%, compared with pure ATS, the force value was more gradual in the I and II stages, but there was still a difference from the third stage. When the percentage of microalgae reached 50%, the curve of three stages only had the difference of the slope, and force jitter of ATS had been eliminated in the I and II stages. For ATS, it was more difficult to agglomerate among particles in the mold than CSBs in Figure 3(a,a1,a2). This phenomenon seems to be due to the greater surface energy of the microalgae particles, which is easier to agglomerate than the wood-chip particles [5].
According to Equation (3), the energy consumption in CSB pelletization was fully calculated, and the result is shown in Figure 4. Since microalgae contain more proteins and other extracts, as shown in Table 1, which are helpful in reducing the energy consumption of pelleting, the energy consumption of CSB pellets decreased gradually with the increase of microalgae. In Figure 4a–c, the energy consumption of samples decreased with the increasing of the CVP blending ratio. That phenomenon can be explained: Blending CVP caused rolling friction rather than sliding friction between the material and the mold, as shown in Figure 4d. A comparison of the energy consumption at 100 °C, 10% of moisture content with different pressures (120 MPa, 140 MPa, 160 MPa, 180 MPa, and 200 MPa) is presented in Figure 4a. The energy consumption of the sample increased with the increase in pressure. However, under the same pressure conditions, the addition of CVP can effectively reduce the pelleting energy consumption, and the addition ratio is proportional to the reduction of energy consumption. Much of the previous research showed that higher density and low energy consumption of pellets has less dependence on the pressure with co-pelletization with sludge [15,39,42], palm oil mill [43], and so on. In Figure 4b, the effect data of moisture content on the energy consumption were obtained from the experiments carried out at 120 MPa, 100 °C. According to a previous report by Kaliyan and Morey, a thin film of water around the particles exhibited bonds via capillary sorption between particles [41]. It can be concluded that the water in the pellet structure enhanced hydrogen bonding and solid bridges among particles, resulting in the decreasing of pellets’ energy consumption with the increasing of moisture [44,45]. However, when the moisture content reached a certain value, the energy consumption reduction due to moisture lubrication was not significant. When the moisture content was increased from 10% to 12%, the energy consumption did not change significantly. In all, the moisture content was highly consistent with the trend of ATS and all CSBs pellets. As shown in Figure 4c, the data were obtained from the experiments carried out at 120 MPa, 10%. When the temperature was lower than 120 °C, the curing of ATS was similar to 15CVP85ATS. However, when the die temperature reached 120 °C, the energy consumption of CSBs showed no reduction, indeed even a slight increase. This phenomenon occurred because the protein was bound to the surface of the mold at higher temperatures (140–160 °C), and the material increased force for the mold inner-surface with the increase of the pellet density. Thus, the better manufacturability parameters of temperature (120 °C), pressure (100 MPa), and water content (10%) were obtained. Under those manufacturability parameters, the bulk density, durability, and energy consumption of ATS and CSBs are listed in Table 2. The sample for TG-DTG will be prepared under those parameters. Results show that blending microalgae could effectively increase the density and durability of the pellets by 9%–36% and 0.7%–1.6%, respectively, and could significantly reduce the energy consumption of pelleting by 23.5%–40.4%.

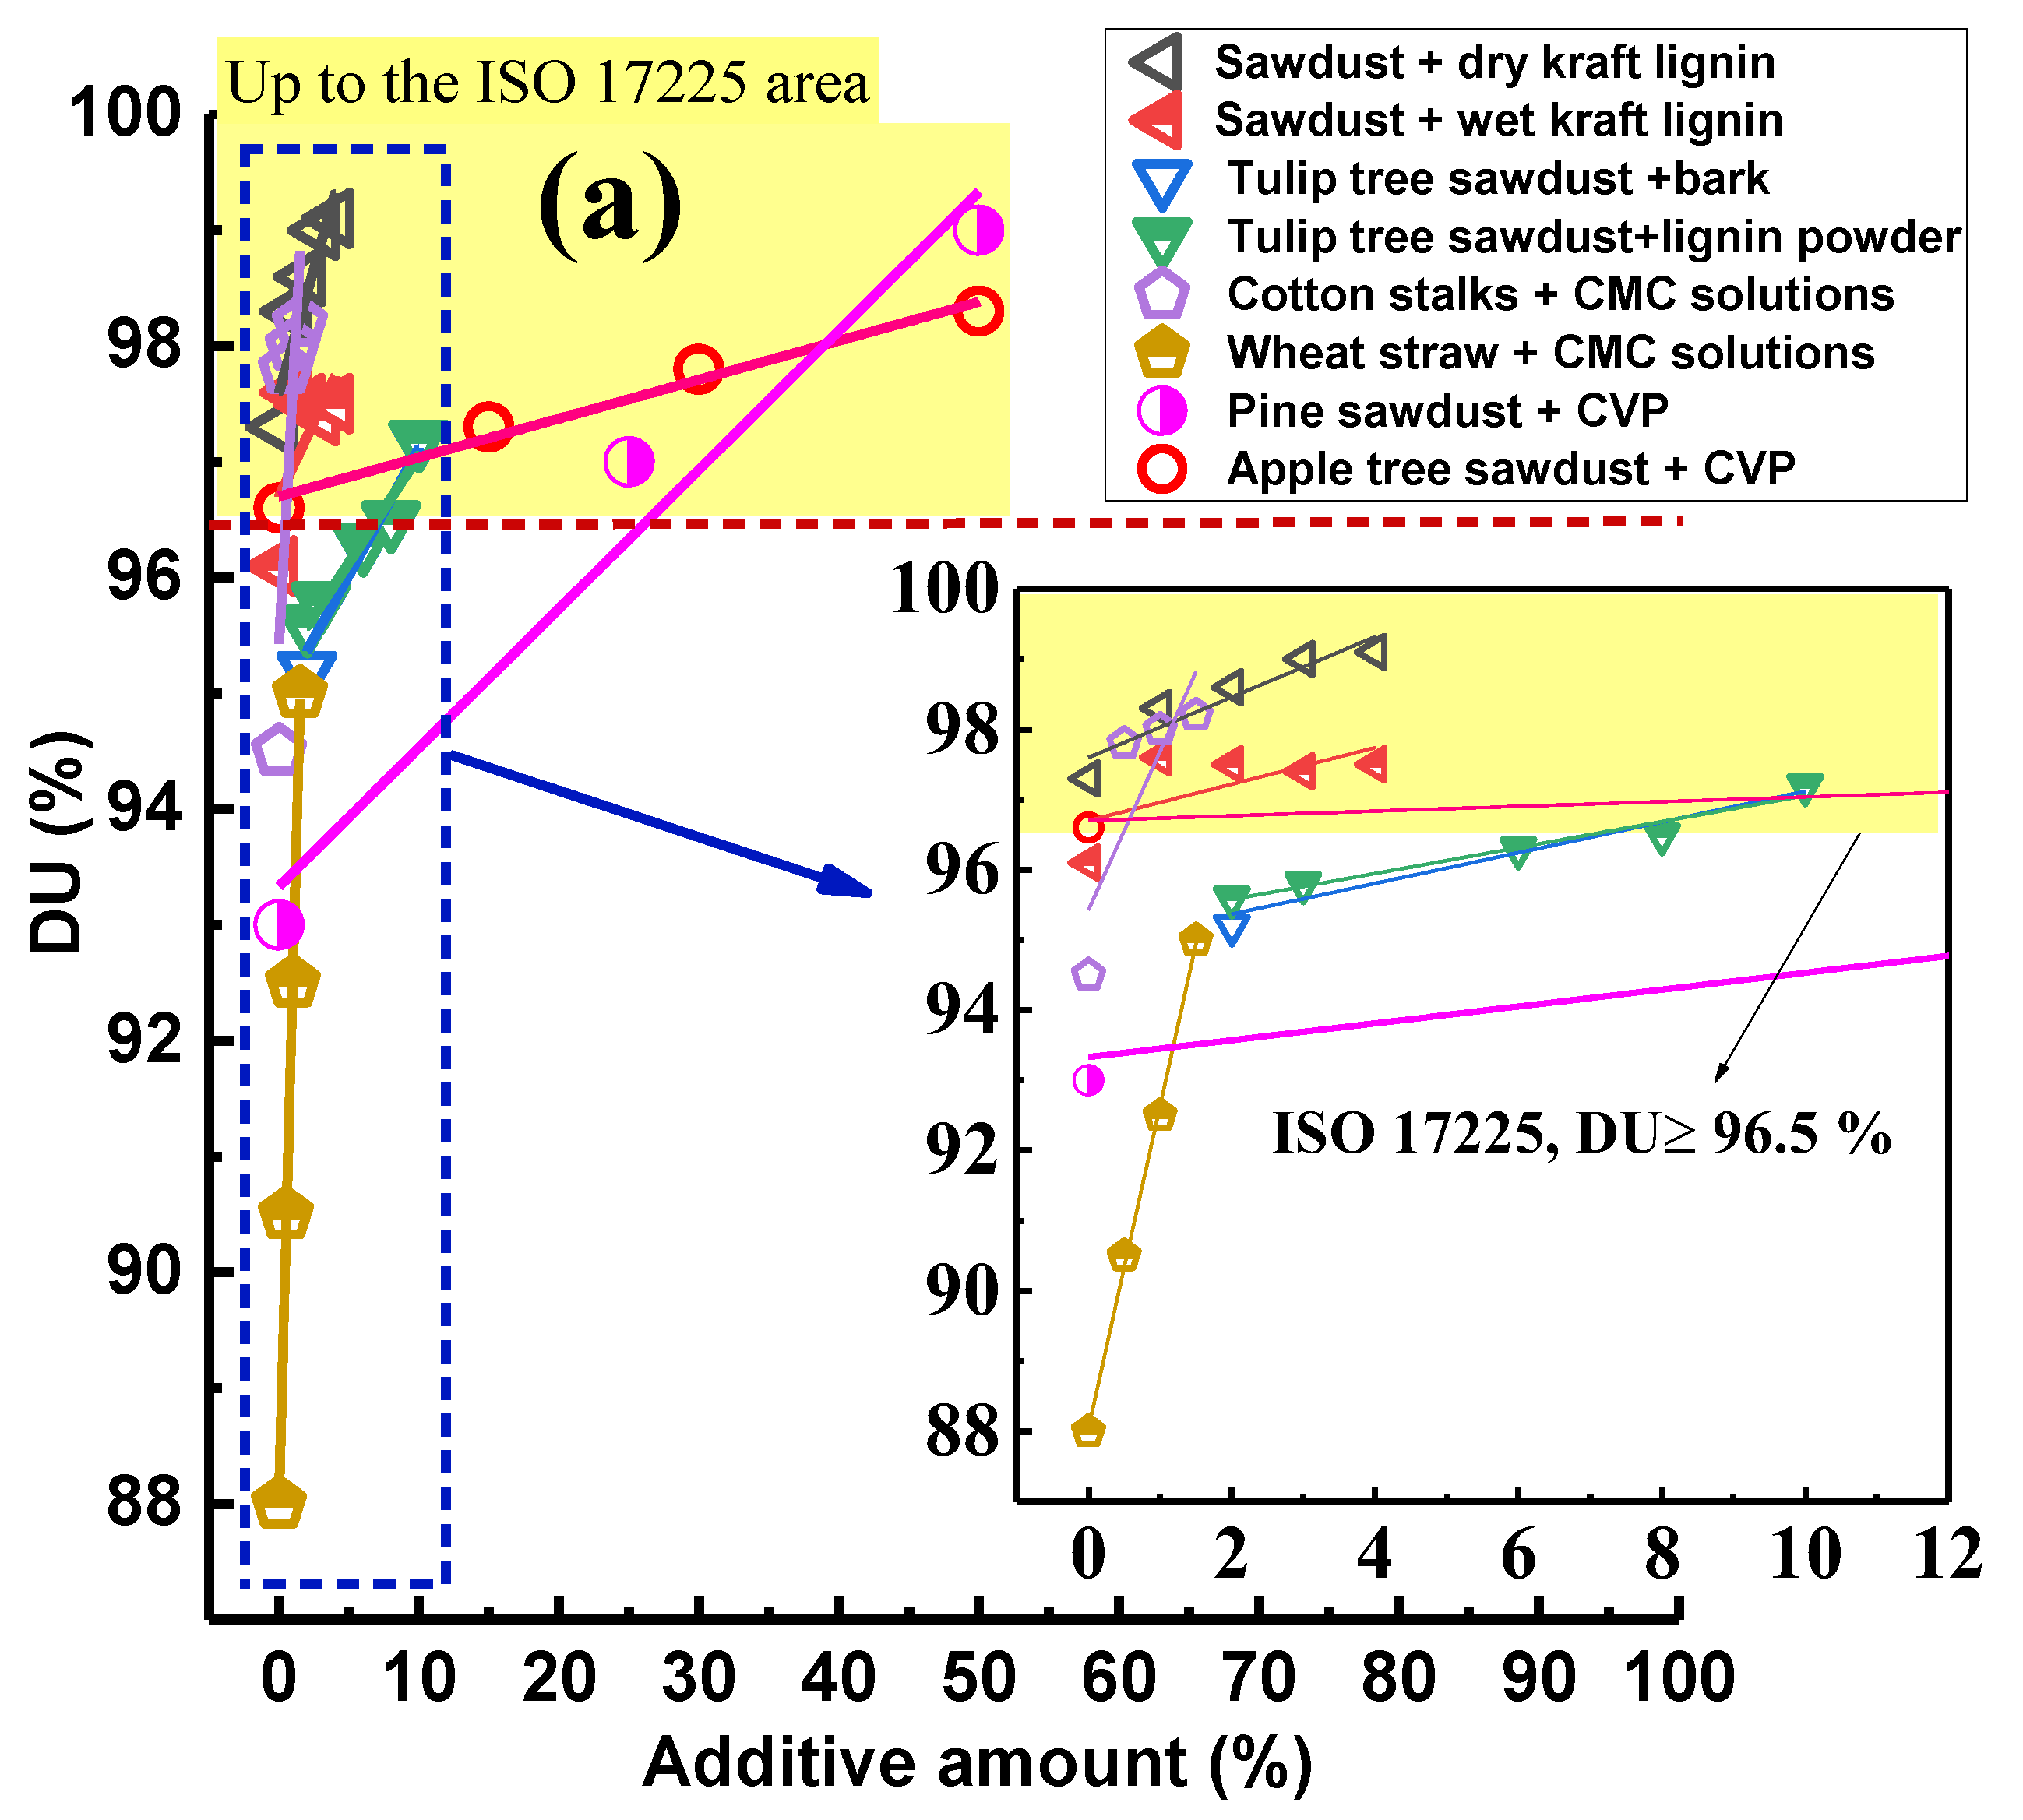
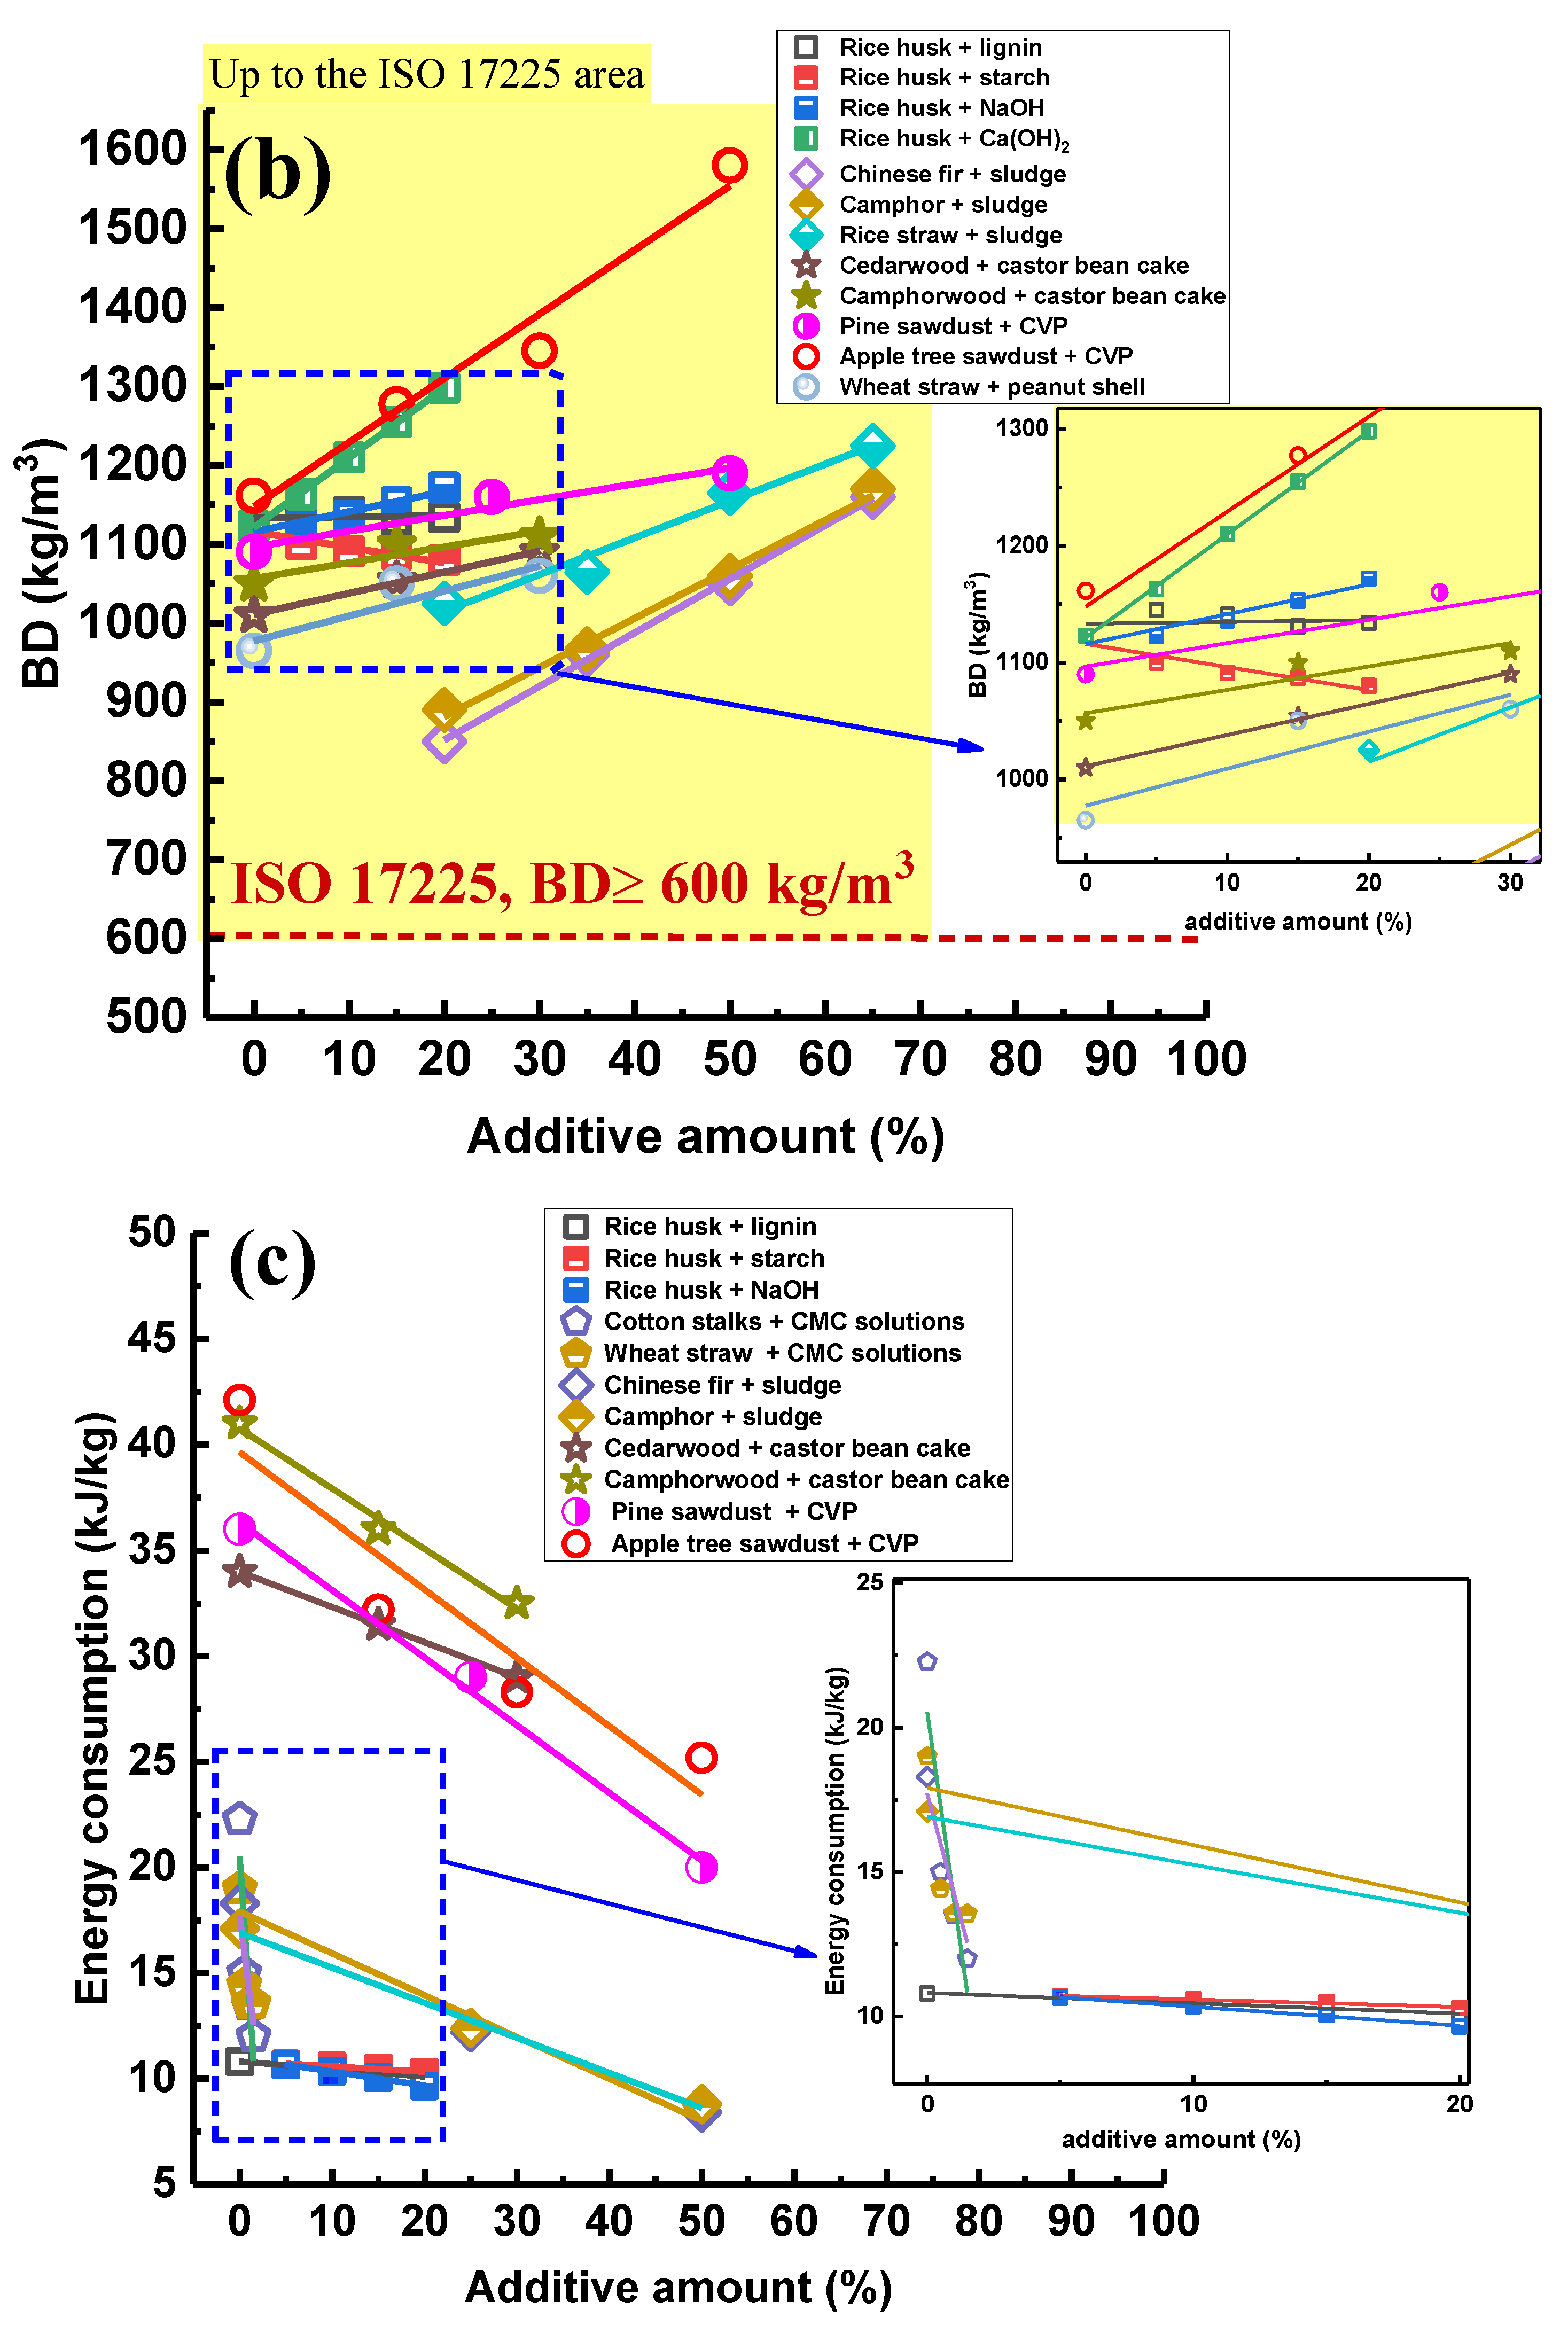
3.3. Analysis of the Potential of Microalgae Compared with Other Binders

As shown in Figure 5a–c, the variety of DU, BD, and energy consumption of bio-pellets made from different biomass raw and binders was presented. In Figure 5a, as the number of different additives increased, the DU of all bio-pellets increased linearly. This was similar to the relationship between the BD of bio-pellets and the additive amount shown in Figure 5b. This phenomenon seems to be due to the additive filling in the gap between the raw material particles, from which more biomass quality per unit volume is obtained, and thus the BD of bio-pellets becomes larger [5,39]. On the other hand, the additives also cause more solid bridges between the biomass particles and help to increase the DU of bio-pellets [39,46]. In addition, it can be seen that both the DU and BD of bio-pellets with microalgae as an additive met the requirements of the ISO standard (17225). In particular, compared to other binders, the BD of bio-pellet mixed microalgae was higher, which would help to increase the density. In Figure 5c, as the binder amount increased, the energy consumption changes of biomass pellet fuel were similar. Both show that, as the binder increased, its energy consumption decreased. The energy consumption trends of CSBs made in this work were similar to those of a cedarwood pellet mixed castor bean cake and camphorwood pellet mixed castor bean cake [47]. The reason is mainly due to the high oil content of both microalgae and a castor bean cake. In addition, as shown in Figure 4d, the shape of the microalgae particles was microspherical, which causes rolling friction rather than sliding friction between the material and the mold. This is beneficial for reducing energy consumption during pelletization. In addition, the CVP, due to the small size of its particles (less than 0.02 mm), is more likely to enter the pores and cracks between ATS particles, making it easier to form intermolecular forces, solid bridges, and mechanical interlocks. Thus, the biomass pelleting process seems to become easier by blending CVP. Considering the high cost of microalgae (CVP), the addition of CVP was 15%, which can meet the demand for improving ATS pelletization. In addition, Figure 5 shows very good mechanical properties for the blends with high CVP content. Further, it might be possible to use lower compression and still meet the requirements of ISO 17225.
In addition, Hosseinizand at al. [5] prepared a pellet using a mixture of microalgae and pine sawdust (made in North Vancouver, British Columbia, Canada). Pine pellets are softwood pellets, and apple trees pellets are hardwood pellets. In present, hardwood pellets and softwood pellets have been the focus of several researchers [53,54]. Moreover, Holm et al. found that hardwood pellets are more difficult to squeeze out of the mold than softwood pellets, and hardwood pellets get stuck easily in the press mold [53]. Marvin et al. [55] found that pelletizing beech (hardwood) requires more energy than pine (softwood). That is, the energy consumption of hardwood pellets is higher than that of softwood pellets, and the energy consumption of hardwood pellets needs more attention [54]. Recently, it has been shown that the pelleting energy consumption of hardwood may be reduced by mixing with softwood and adhesive materials [15,42,53]. In Figure 5c, the pelleting energy consumption of ATS (hardwood) and pine sawdust (softwood) were around 47 kJ/kg and 36 kJ/kg, respectively, and the pelleting energy consumption of ATS pellets was nearly 20% higher than pine pellets. Adding 50% of microalgae, for example, can reduce pelleting energy consumption by up to 40%. Thus, adding microalgae is a very promising method for reducing the energy consumption of hardwood pellets, such as ATS. In Figure 5a,b, the durability and bulk density of ATS pellets were generally higher than that of pine pellet by adding microalgae. The porosity is a physical quantity that reflects the internal pores of a substance. Currently, the porosity is widely used to evaluate pellet fuels, according to previous research [56,57], the lower the porosity, the more closely the internal particles are combined and the greater durability and bulk density. The research of Holm et al. shows that hardwood particles bind more tightly than softwood particles [53]. In other words, the porosity of softwood pellet is greater than that of hardwood pellet. The effect of proportion of microalgae on the porosity of ATS pellets is shown in Figure 6. The porosity of ATS pellets (40%) was generally lower than that of pine pellet (45%). When the proportion of microalgae increased from 0% to 50%, the porosity of ATS pellets decreased from 40% to 12%, whereas that of pellets made from pine sawdust decreased from 45% to 14% [5]. In other words, microalgae could effectively reduce the porosity of softwood and hardwood pellets. When the same proportion of microalgae was added, the porosity of ATS pellets was always lower than that of pine pellets. As shown in Figure 6, the porosity of the CVP pellets was significantly lower than that of the ATS pellets. In other words, with the increase of the CVP content, the porosity of the samples decreased. On the one hand, the increase in the absolute amount of CVP and decrease of ATS amount was indeed one of the reasons for the reduction of porosity. On the other hand, Figure 7a–o shows the views obtained during the study of the surface of mixed pellets (CSB) using a digital microscope. The microstructural analysis showed that there were many pores and cracks in ATS pellets, but CVP pellets did not appear in Figure 7a–c,m–o. As shown in Figure 7d–f, the microscopic image showed that CVP was a tiny microsphere that filled the gap between the wood particles. Thus, the number of cracks and pores in CSB pellets significantly decreased. This phenomenon was also the reason why the porosity of fuel reduced and the durability of fuel improved. This phenomenon provides a mechanism for Hosseinizand et al. [5]. Therefore, by comparing this study to the research of Hosseinizand et al. [5], the bulk density and durability of hardwood pellets mixed with CVP are better than that of softwood pellets mixed with CVP. By adding less CVP to hardwood pellets, higher BD and DU as well as lower energy consumption for grain treatment can be obtained. Overall, the microalgae play a positive role in the pelletization of hardwood and softwood. In particular, the addition of CVP to hardwood can achieve higher DU (96.6%–98.8%) and BD (1161.4–1580.2 kg/m3). Besides, according to previous studies, strong bonding between the particles occurs during the pelletization process. As shown in Table 1, the CVP contains more carbohydrates (such as polysaccharides). When it comes to the interaction and bonding among the polysaccharides, two types may probably occur. The first is to form multiple non-covalent bonds (Van der Waals bonds and hydrogen bonds) in the pellet during the pressing process. When surfaces rich in hydroxyl groups are pressed together, multiple hydrogen bonds are formed among the surfaces [54]. The second is to form a covalent bond during the condensation or dehydration step (ester, acetal, etc.). When surfaces rich in hydroxyl groups are pressed together, dehydration forms covalent bonds (ethers, esters, hemiacetals, etc.) and this cross-links the surfaces [54]. Besides, most of the lignin molecules in ATS may be covalently linked to polysaccharides [58], which are also one of the important factors contributing to the enhancement of binding strength. During the pelletization of CSBs, the proteins contained in the microalgae may also act to form a strong bond [40]. A study by Stenfan et al. [54] found that the physical properties of lignin and some extracts change at high temperatures, and in the process, they become glassy that increases the likelihood of forming strong bonds. During the pelletization of CSBs, a part of the extracts and polysaccharides in the microalgae may have melted, and the higher DU of the CSBs pellets may be explained by the fact that these materials fill the gap between the particles, increasing the adhesion and cohesion [40,59]. In particular, the free water contained in the material enhances the ability of the material to fill the gap between the particles [40]. Considering the high pelleting energy consumption of hardwood, the co-pelletization between microalgae and hardwood is more promising, and microalgae performed remarkably well in reducing the energy consumption of hardwoods. In the future, other biomass matrix materials can be extended to co-pelletizing with microalgae, which seems to be another significant way of utilizing microalgae.

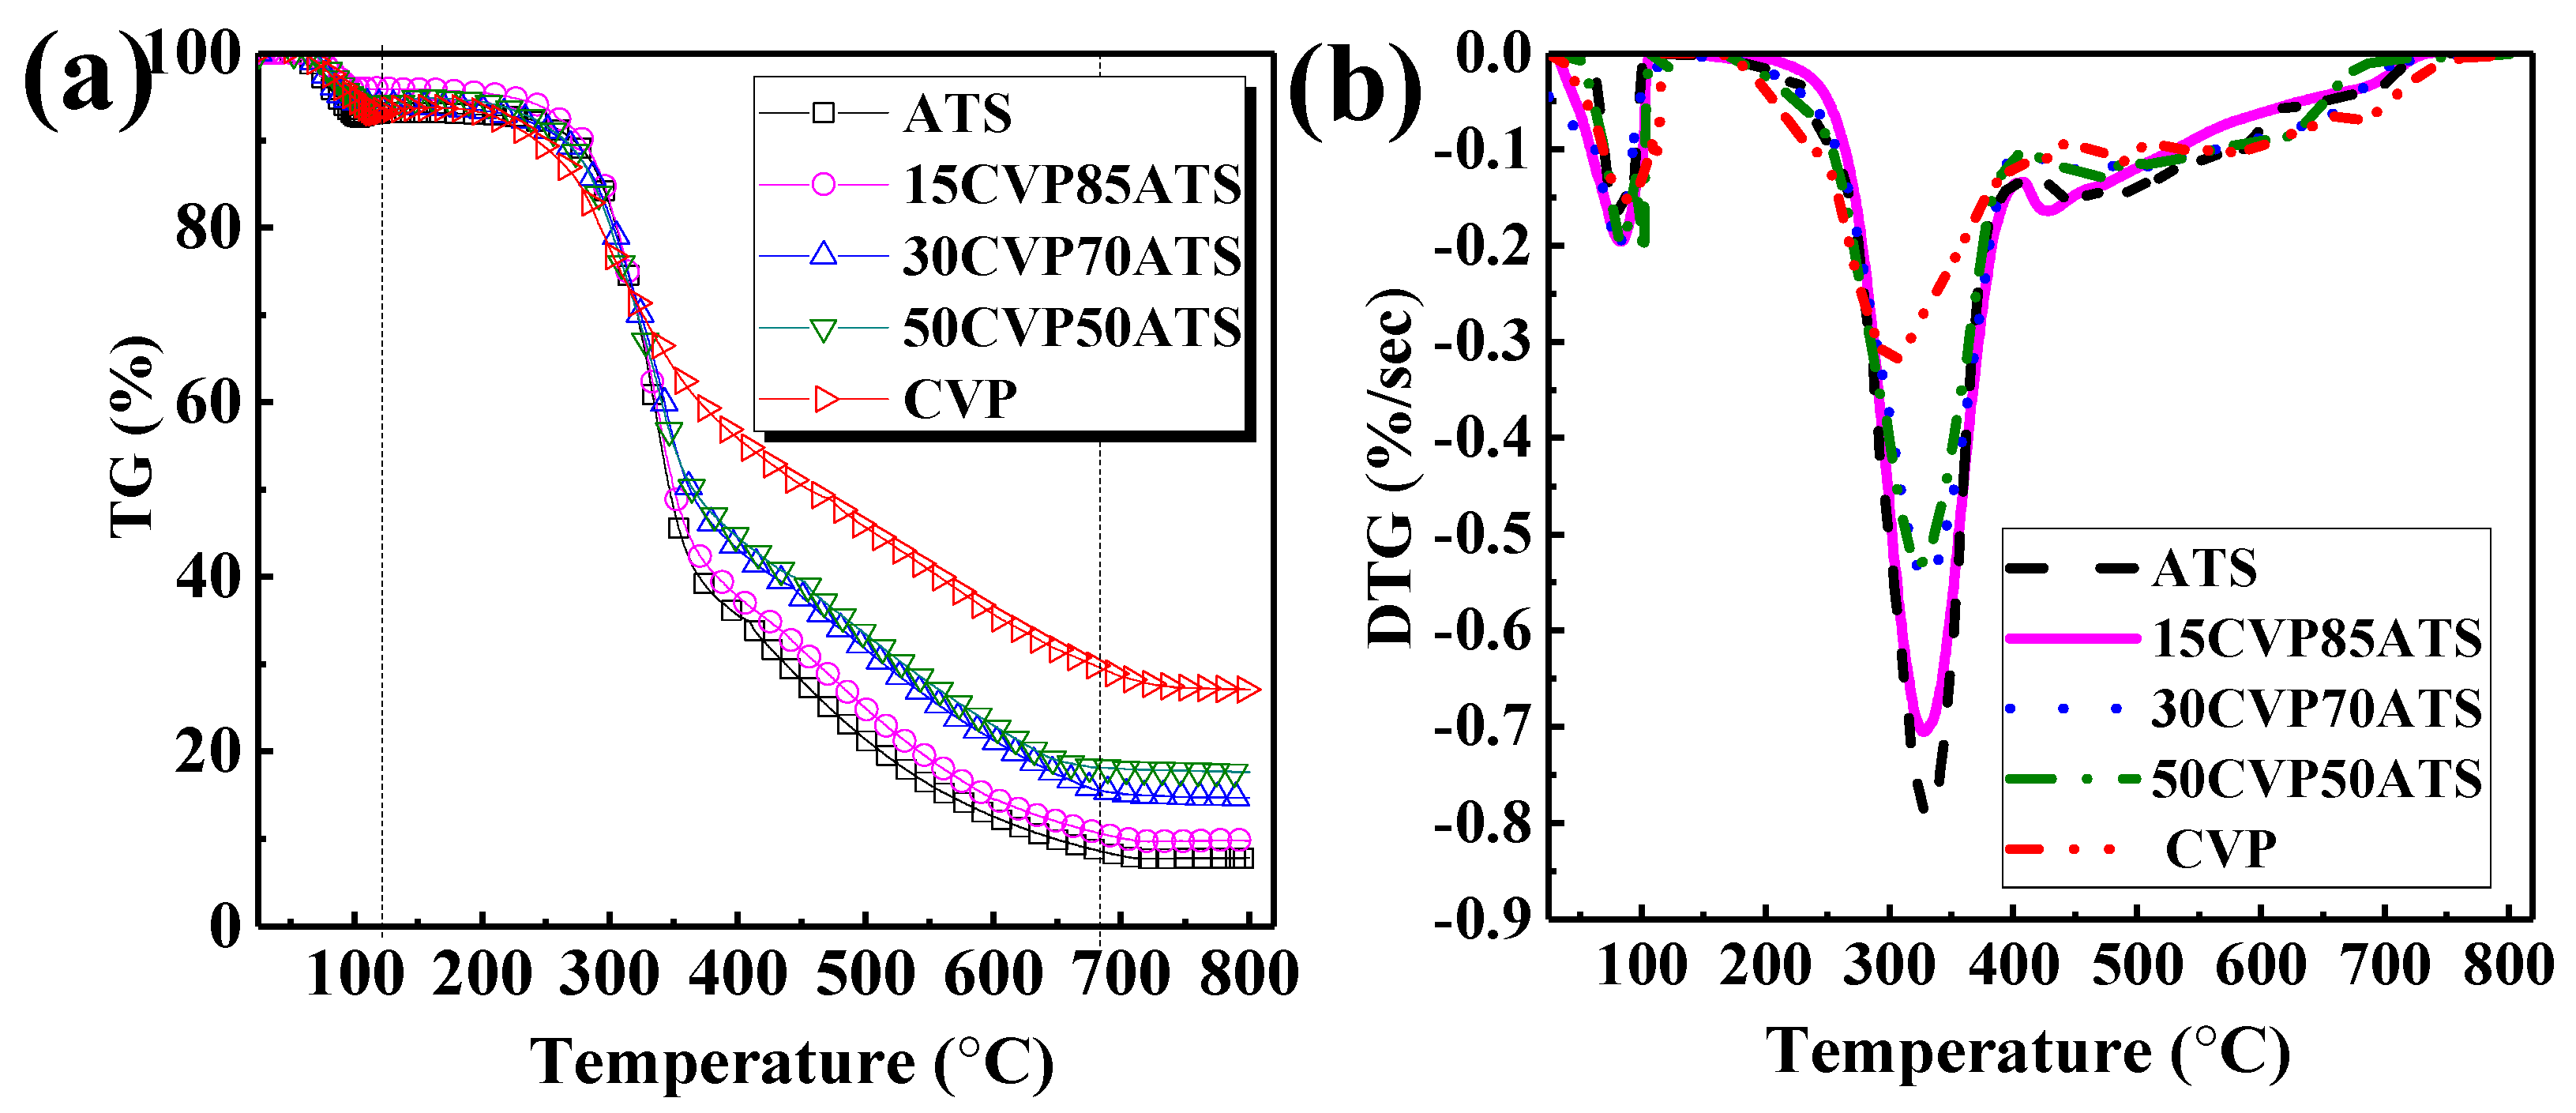
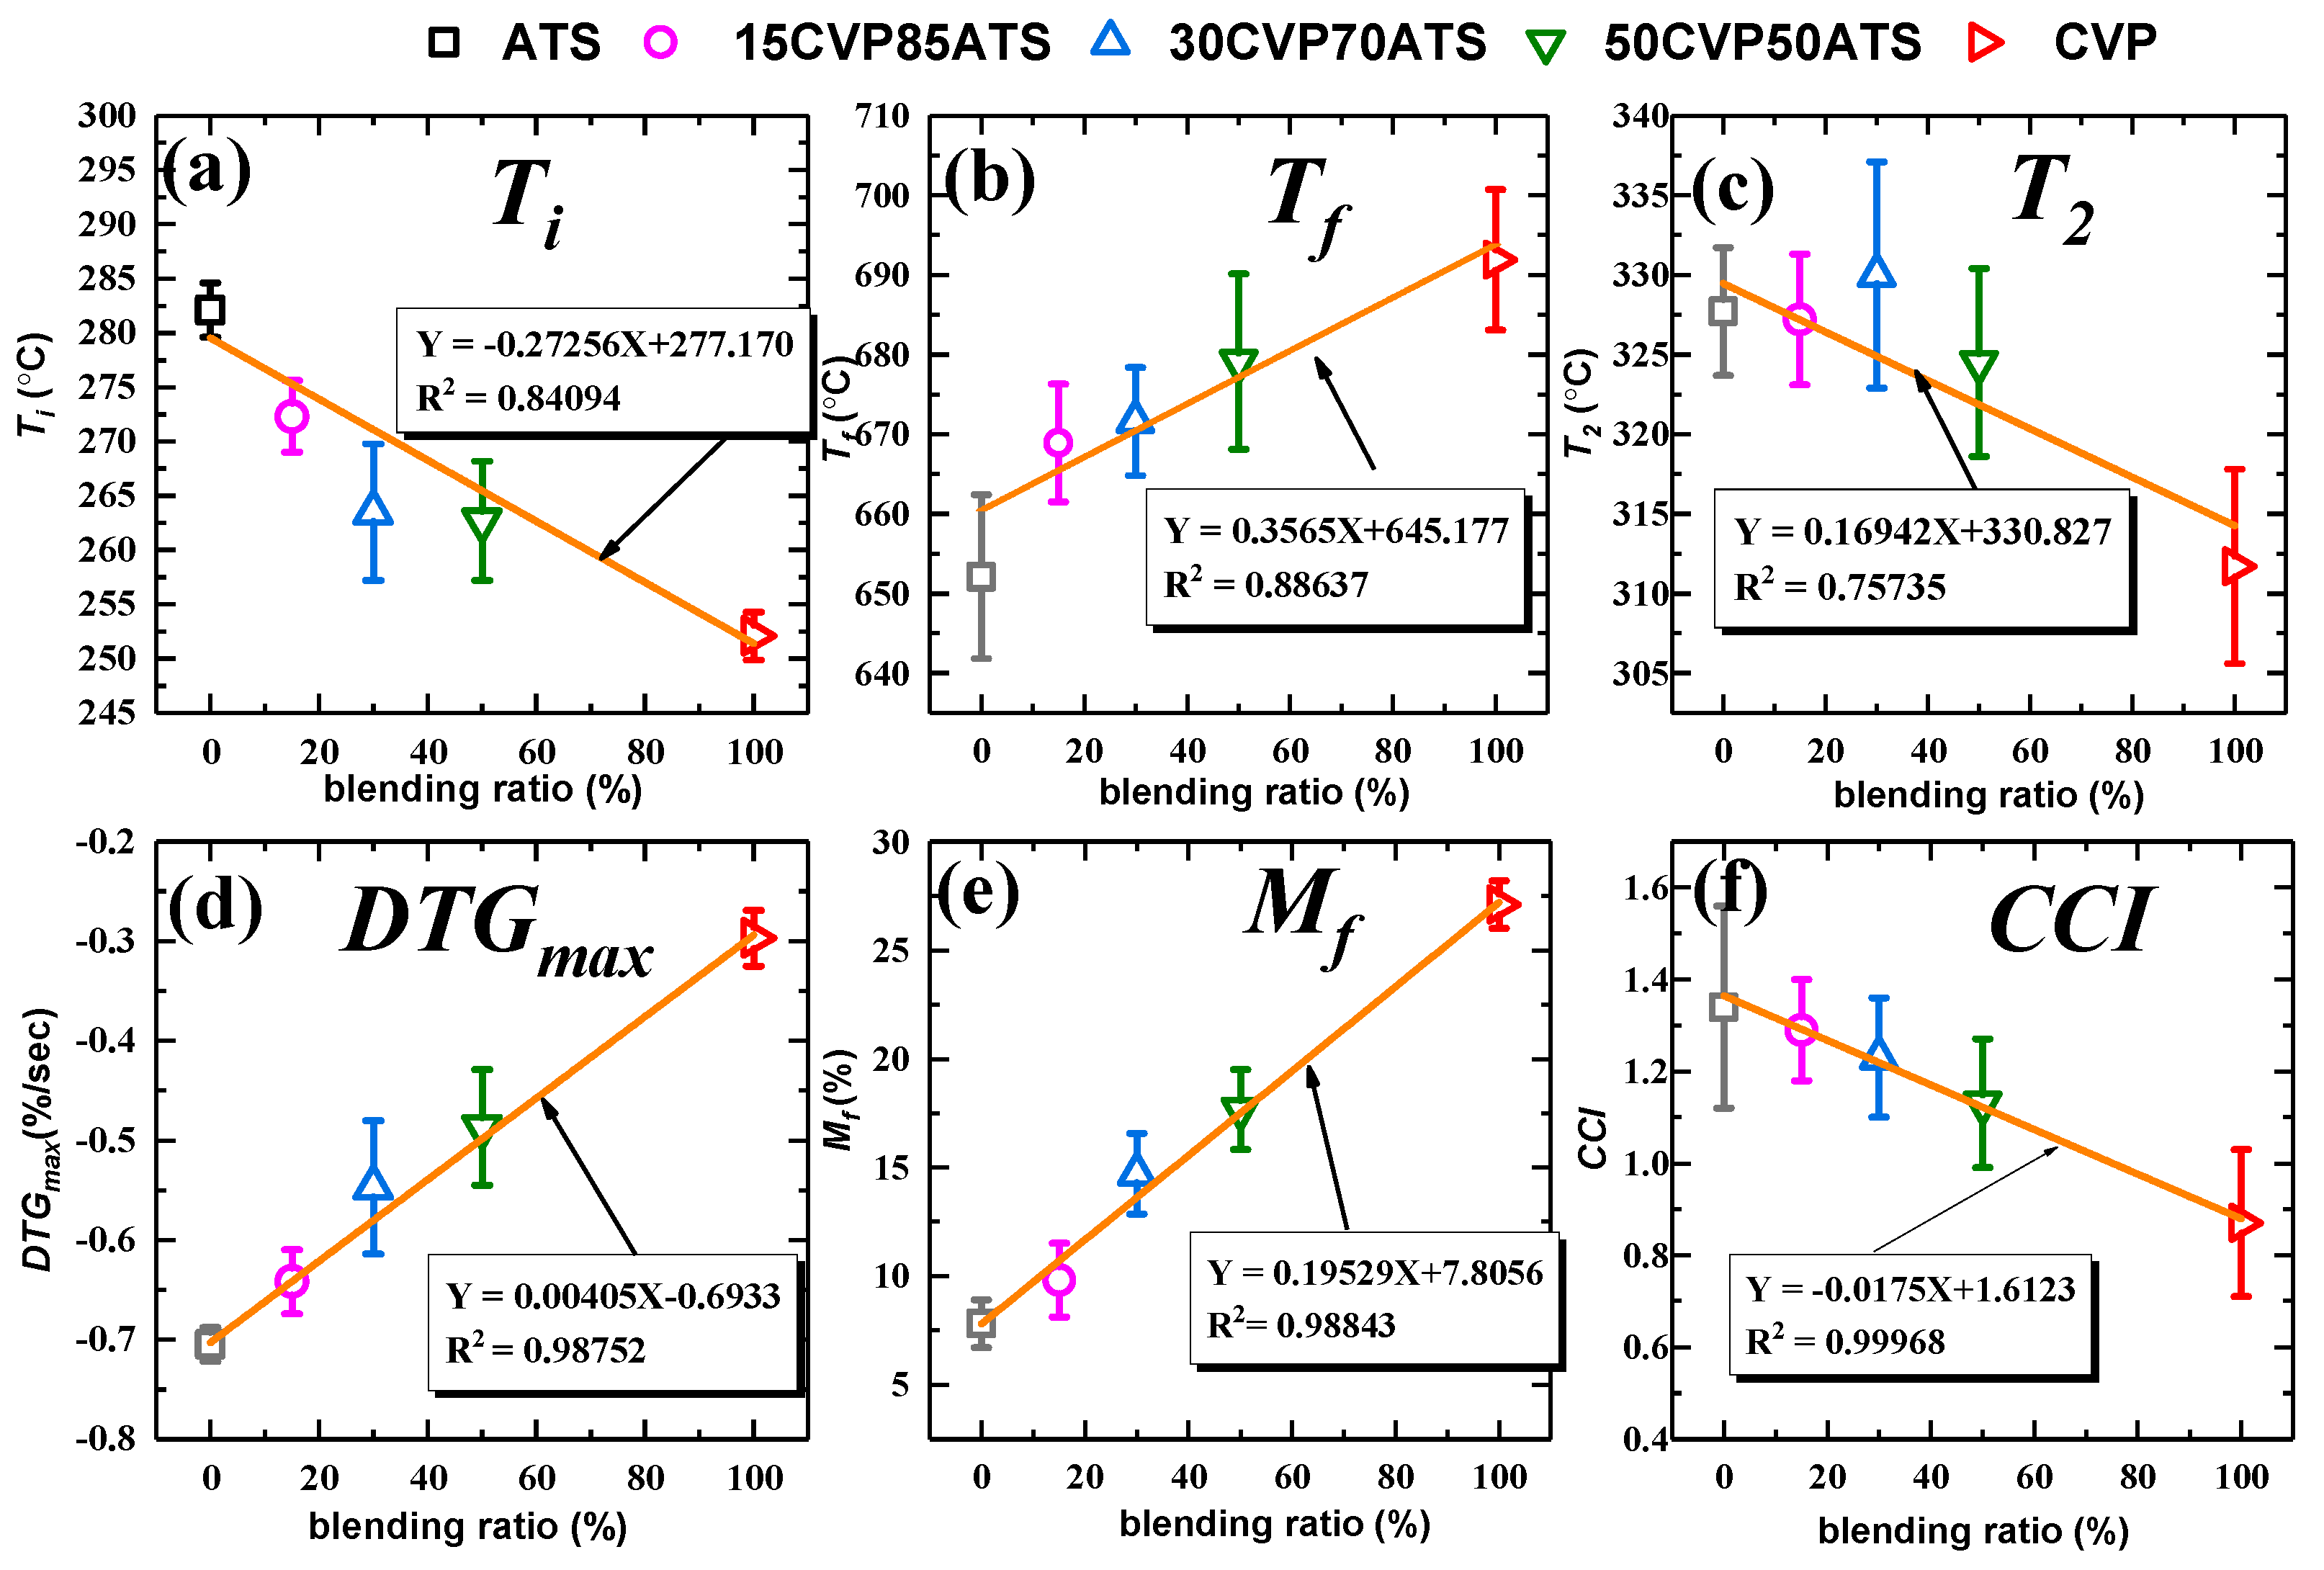
3.4. Thermal Characterization of CSBs

A description and explanation of the combustion of CVP and ATS at a heating rate of 30 °C/min were shown in Figure 8a,b with the TG curves and DTG data curves.
In Figure 8a,b, the DTG plots were alike, with two clear peaks each, and the vertical coordinates were also equivalent to the reaction rate. The Ti and the burnout temperature of ATS were 282.1 °C and 652.1 °C, respectively. The Tf of CVP was close to ATS, which indicated that ATS contained nonflammable materials and was roughly consistent with CVP combined with the materials listed in Table 1. The proximate and ultimate analysis results, as well as the LHV, of ATS and CVP, are listed in Table 1. As seen in Table 1, proximate analysis results for ATS had a high amount of volatile matter content (68.95%), which could be considered suitable for the combustion process. According to a previous report [60], ATS collected from Fuji and Elstar usually had high ash levels (5.77% ± 2.46%). On a dry ash-free basis, the orchards (planting ATS, 5.30%) were usually treated with phytosanitary substances and fertilizers that influence the presence of heavy metals in the wood. Then, as shown in Table 1, microalgae were mainly formed by proteins, carbohydrates, and lipids [1,13]. However, the volatile matter of CVP was 10.6% higher than that of ATS, which was mainly caused by the fact that the ignition temperature of CVP was about 30 °C lower than ATS. Exceeding 700 °C, there still existed a slight weight loss in the DTG curve, which was mainly due to the decomposition of inorganic minerals, such as calcium carbonate [61].
As shown in Figure 8a,b, all TG and DTG curves of the blends laid between the individual fuels. The increasing blending ratio increased the maximum value (DTGmax) over the experimental temperature interval. The process could be better understood with reference to previous research, which is an enhancement of volatile matter release. Comparing the DTG profiles of CSB, three peaks were presented and the lowest one was about to appear with an increase in the amount of microalgae added. This phenomenon is similar to that discussed in previous research [12,13], in which the increasing blending ratio of CVP makes the lowest peaks apparent. The comprehensive combustion index (CCI) can be calculated using Equation (13) [13]:
C C I = D T G m a x D T G m e a n T i 2 T f
In order to fully understand the thermal properties of CSB, the tendency of Ti, Tf, Mf, T2, DTGmax, and CCI was illustrated in Figure 9a–f. The Ti, Tf, and T2 of CSB decreased with the increasing blending ratio, and the DTGmax, CCI, and Mf increased with the increasing blending ratio.
In Figure 9a–f, some correlation coefficients (R2) had a high fitting degree between 0.933 and 0.998. This phenomenon was similar to many other researchers in case of coal-biomass co-combustion [11]. Moreover, the ignition temperature (T1) sharply decreased as the blending ratio went beyond 15%, which can be deemed the turning point of flammability that makes samples burn earlier, so the addition of CVP, especially between 15% and 30%, can effectively reduce the ignition temperature, which is consistent with previous research [9,10]. However, the Tf of CSBs increased as the blending ratio went beyond 15%, which showed that the best blending ratio might be ≤15% because it hindered the samples from burning more violently as the blending ratio > 15%. The reason for this phenomenon is the presence of lipids in microalgae, which generally have combustion temperatures of higher than 500 °C, delaying the burnout of the blend. This has been previously reported by Tahmasebi et al. [62]. Therefore, a blending ratio = 15% might be the right ratio according to Ti and Tf. The Mf and DTGmax were aligned well with blending ratio, with their correlation coefficients up to 0.98843 and 0.98752, respectively. The CVP ration (15%–50%) in the blends also decreased the intensity of the second peak (−0.642%/sec to −0.487%/sec) and increased the value of Mf (9.81% to 17.67%), that is, the larger the content of CVP, the slower the mass loss rate and the higher the residual mass of the CSB. However, the fitting degree of T2 was not unexpected, which may be due to the uneven mixing of fuel in the pelletization. As shown in Figure 9a–f, at a blending ratio of 15%, TG and DTG curves of 15CVP85ATS were similar to those of ATS at a temperature of 25–800 °C. However, the maximum mass loss rate decreased with the increase of the blending ratio, especially 30%–50%, indicating that the reactivity would be reduced due to the presence of CVP in this range. Besides, the index CCI of CSB was almost linear (correlation coefficient R2 = 0.99968). Therefore, the thermal properties of CSB did not improve all the time with an increase of microalgae, and the blending ratio of 15% (15CVP85ATS) inherited the advantages of the original sample (ATS) and had a lower ignition temperature.

3.5. Influence of Heating Rate on the Co-Combustion of CSBs

Table 3 shows the characteristic parameters of 15CVP85ATS at different heating rates during the co-combustion process. Obviously, when the β increased from 20 to 40 °C/min, the temperature of the second peaks at a heating rate of β = 20, 30, and 40 °C/min were 321.7 °C, 327.2 °C, and 329.2 °C, respectively. Thus, the tendency occurs commonly for many fuels, like microalgae and coal [12], microalgae and paper sludge [13], coal and terrestrial biomass [14], terrestrial biomass and paper sludge [63], or paper sludge and coal [16,17,18], and so on. The ignition temperature (Ti) also increased with the increase of heating rate. From observation and previous reports, this phenomenon can be explained by the fact that the entire process of decomposition was delayed with the increasing of the β [13].
Besides, DTGmax increased with increasing β, that is, when reaching a certain ambient temperature, the higher β had a shorter time. The relatively large temperature difference between the sample surface and the sample particle core caused a stronger heat transfer. Thus, combustion intensity could be enhanced by increasing the heating rate [12]. Therefore, as shown in Table 3, the residual mass at a heating rate of 20, 30, and 40 °C/min was 10.78%, 9.81%, and 8.37%, respectively, indicating that the effect of heating rate on the residual mass was insignificant.

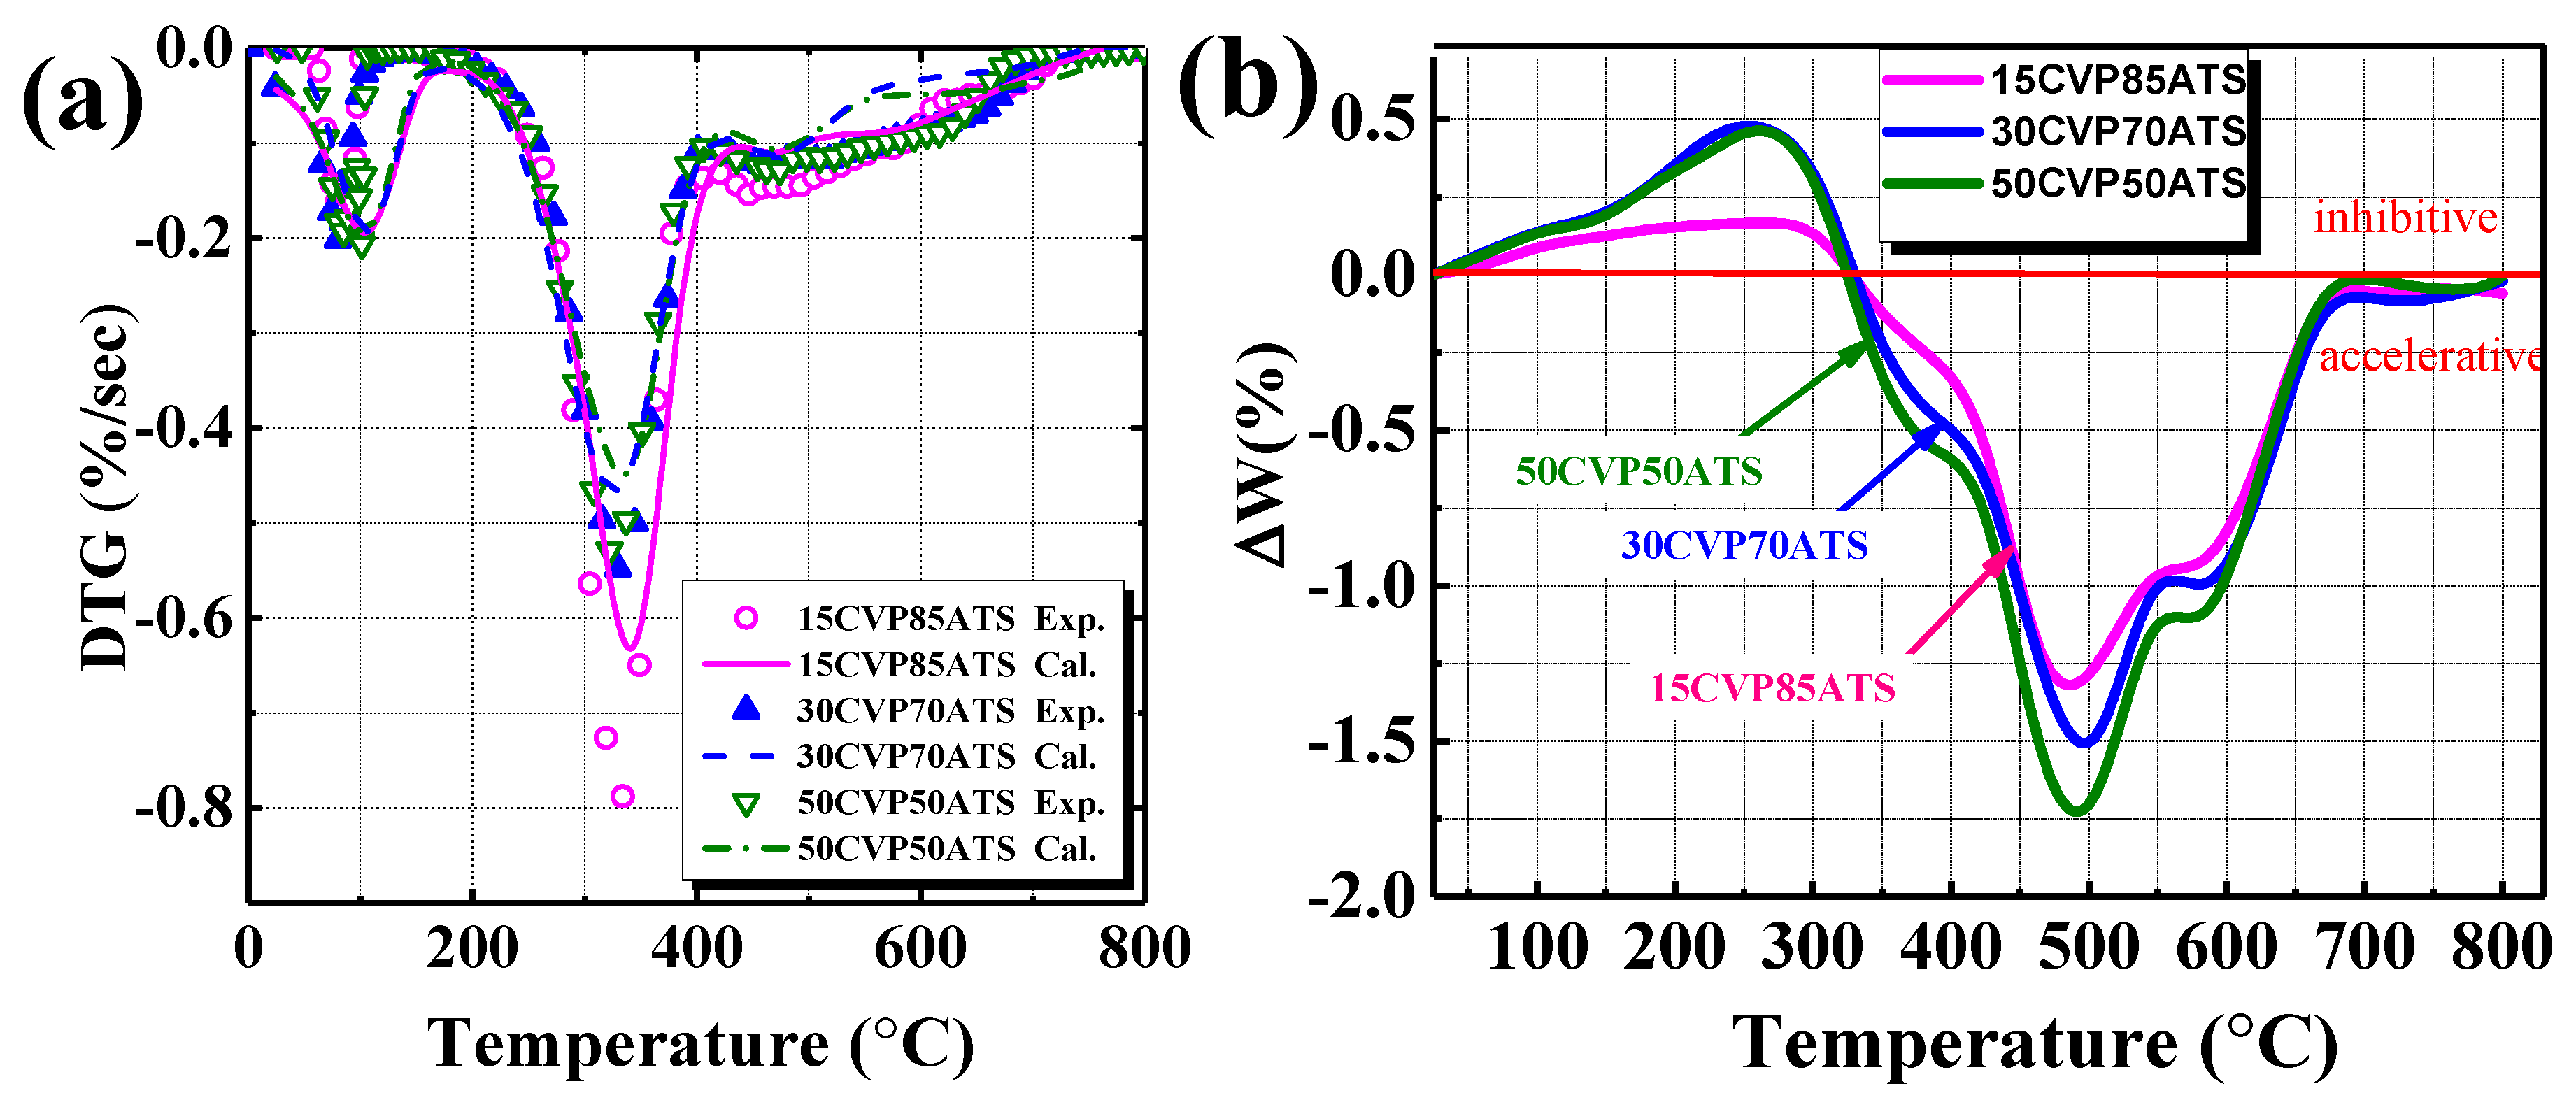
3.6. Thermal Characterization of Interaction Between CVP and ATS

In order to better understand the synergistic interaction between CVP and ATS, the theoretical TG/DTG curves of the blends were calculated by the average weight loss values experimental (Wexperimental, %) compared with the average weight loss values calculated (Wcalculated, %) of the individuals. Therefore, the interaction between CVP and ATS could be modeled using Equation (14) [12]:
W c a l c u l a t e d = x C V P W C V P + x A T S W A T S
In addition, the degree of interaction (ΔW, %) with co-combustion can be calculated using Equation (15) [26,27,28]:
Δ W = W e x p e r i m e n t a l W c a l c u l a t e d
As shown in Figure 10a–b, all the curves exhibited a noticeable gap below 300 °C. Then, when the temperature was between 390 °C and 800 °C, the deviation trend between curves fluctuated with an increase of temperature, hence, the accelerative (synergistic) or inhibitive interaction occurred during the co-combustion process. All the ΔW curves peaked when the temperature was lower than 300 °C. However, two troughs of all the ΔW appeared when the temperature was higher than 300 °C. Clearly, the deviation maximum value of all samples was around 630 °C. As a result, the interaction between the CSBs did exist, and their effect on the co-combustion process was inhibitive (0–300 °C) and accelerative (300–780 °C).
Currently, the mechanism of the inhibitive (0–300 °C) and accelerative (300–780 °C) effect between the CVP and ATS during co-combustion (30–800 °C) is seldom investigated. However, according to previous research [63,64,65], wood particles (around 0.25 mm) took 25%–88% longer to dry than chip particles (1–5 mm). The enlarged pores and cracks in cell walls, and the strong Van der Waals force between the CVP particles, caused large-scale agglomeration of CVP, which seems to be inhibitive (0–300 °C). At 30–300 °C, the loss of both water and light volatile compounds occurred; the tiny CVP particles blocked the pores of ATS molecules through which volatile matter and water generated by sawdust decomposing moved, and thus hampered the desiccation of sawdust. Similar results were also reported in a previous study [12]. After moisture release, the content of volatile matter in CVP was higher than that of ATS, as shown in Table 1. The combustion of volatile matter generated enormous heat, which promoted char burning of ATS, whose decomposition occurred at higher temperature [11,22]. This was also the case for the concentrations of volatile gas around ATS, so ignition temperature of the blend was decreased and the accelerative effect of CSB was increased as the proportion of CVP increased. As shown in Figure 10, the DTG curve showed the superposition of different reactions, however, the main decomposition region of the lignin was below 500 °C. According to a study by Dinesh Mohan et al. [66], the reason for this phenomenon seems to be due to the decomposition of lignin in the temperature range of 280–500 °C. Besides, the similar DTG curve of woody biomass decomposition can be found in previous study. In particularly, according to the previous report by Ondro et al [67], the mass loss in the temperature range of 250–500 °C is ascribed to the combination of a total hemicellulose and cellulose decomposition with partial lignin decomposition, and the decomposition of remaining lignin and the combustion of char residues [68]. Aromatic compounds produced by char oxidation require higher temperatures to become all oxidation ashes [19,34]. Meanwhile, according to Table 1, the char oxidation of CVP proceeds at higher temperatures than char oxidation of ATS. Thus, the burnout temperature of CSB increased with the increasing blending ratio of CVP. Besides, the ash of CVP might behave as a catalyst [61]. Those phenomena can explain why the cause of the accelerative (synergistic) effect gradually increased to around 1.47% between CVP and ATS at around 500 °C. As a result, the synergistic interaction in the co-combustion process of ATS and CVP were thought to be the result of the combined action of components, and the co-combustion of ATS and CVP could implement the co-processing of two solid phases.

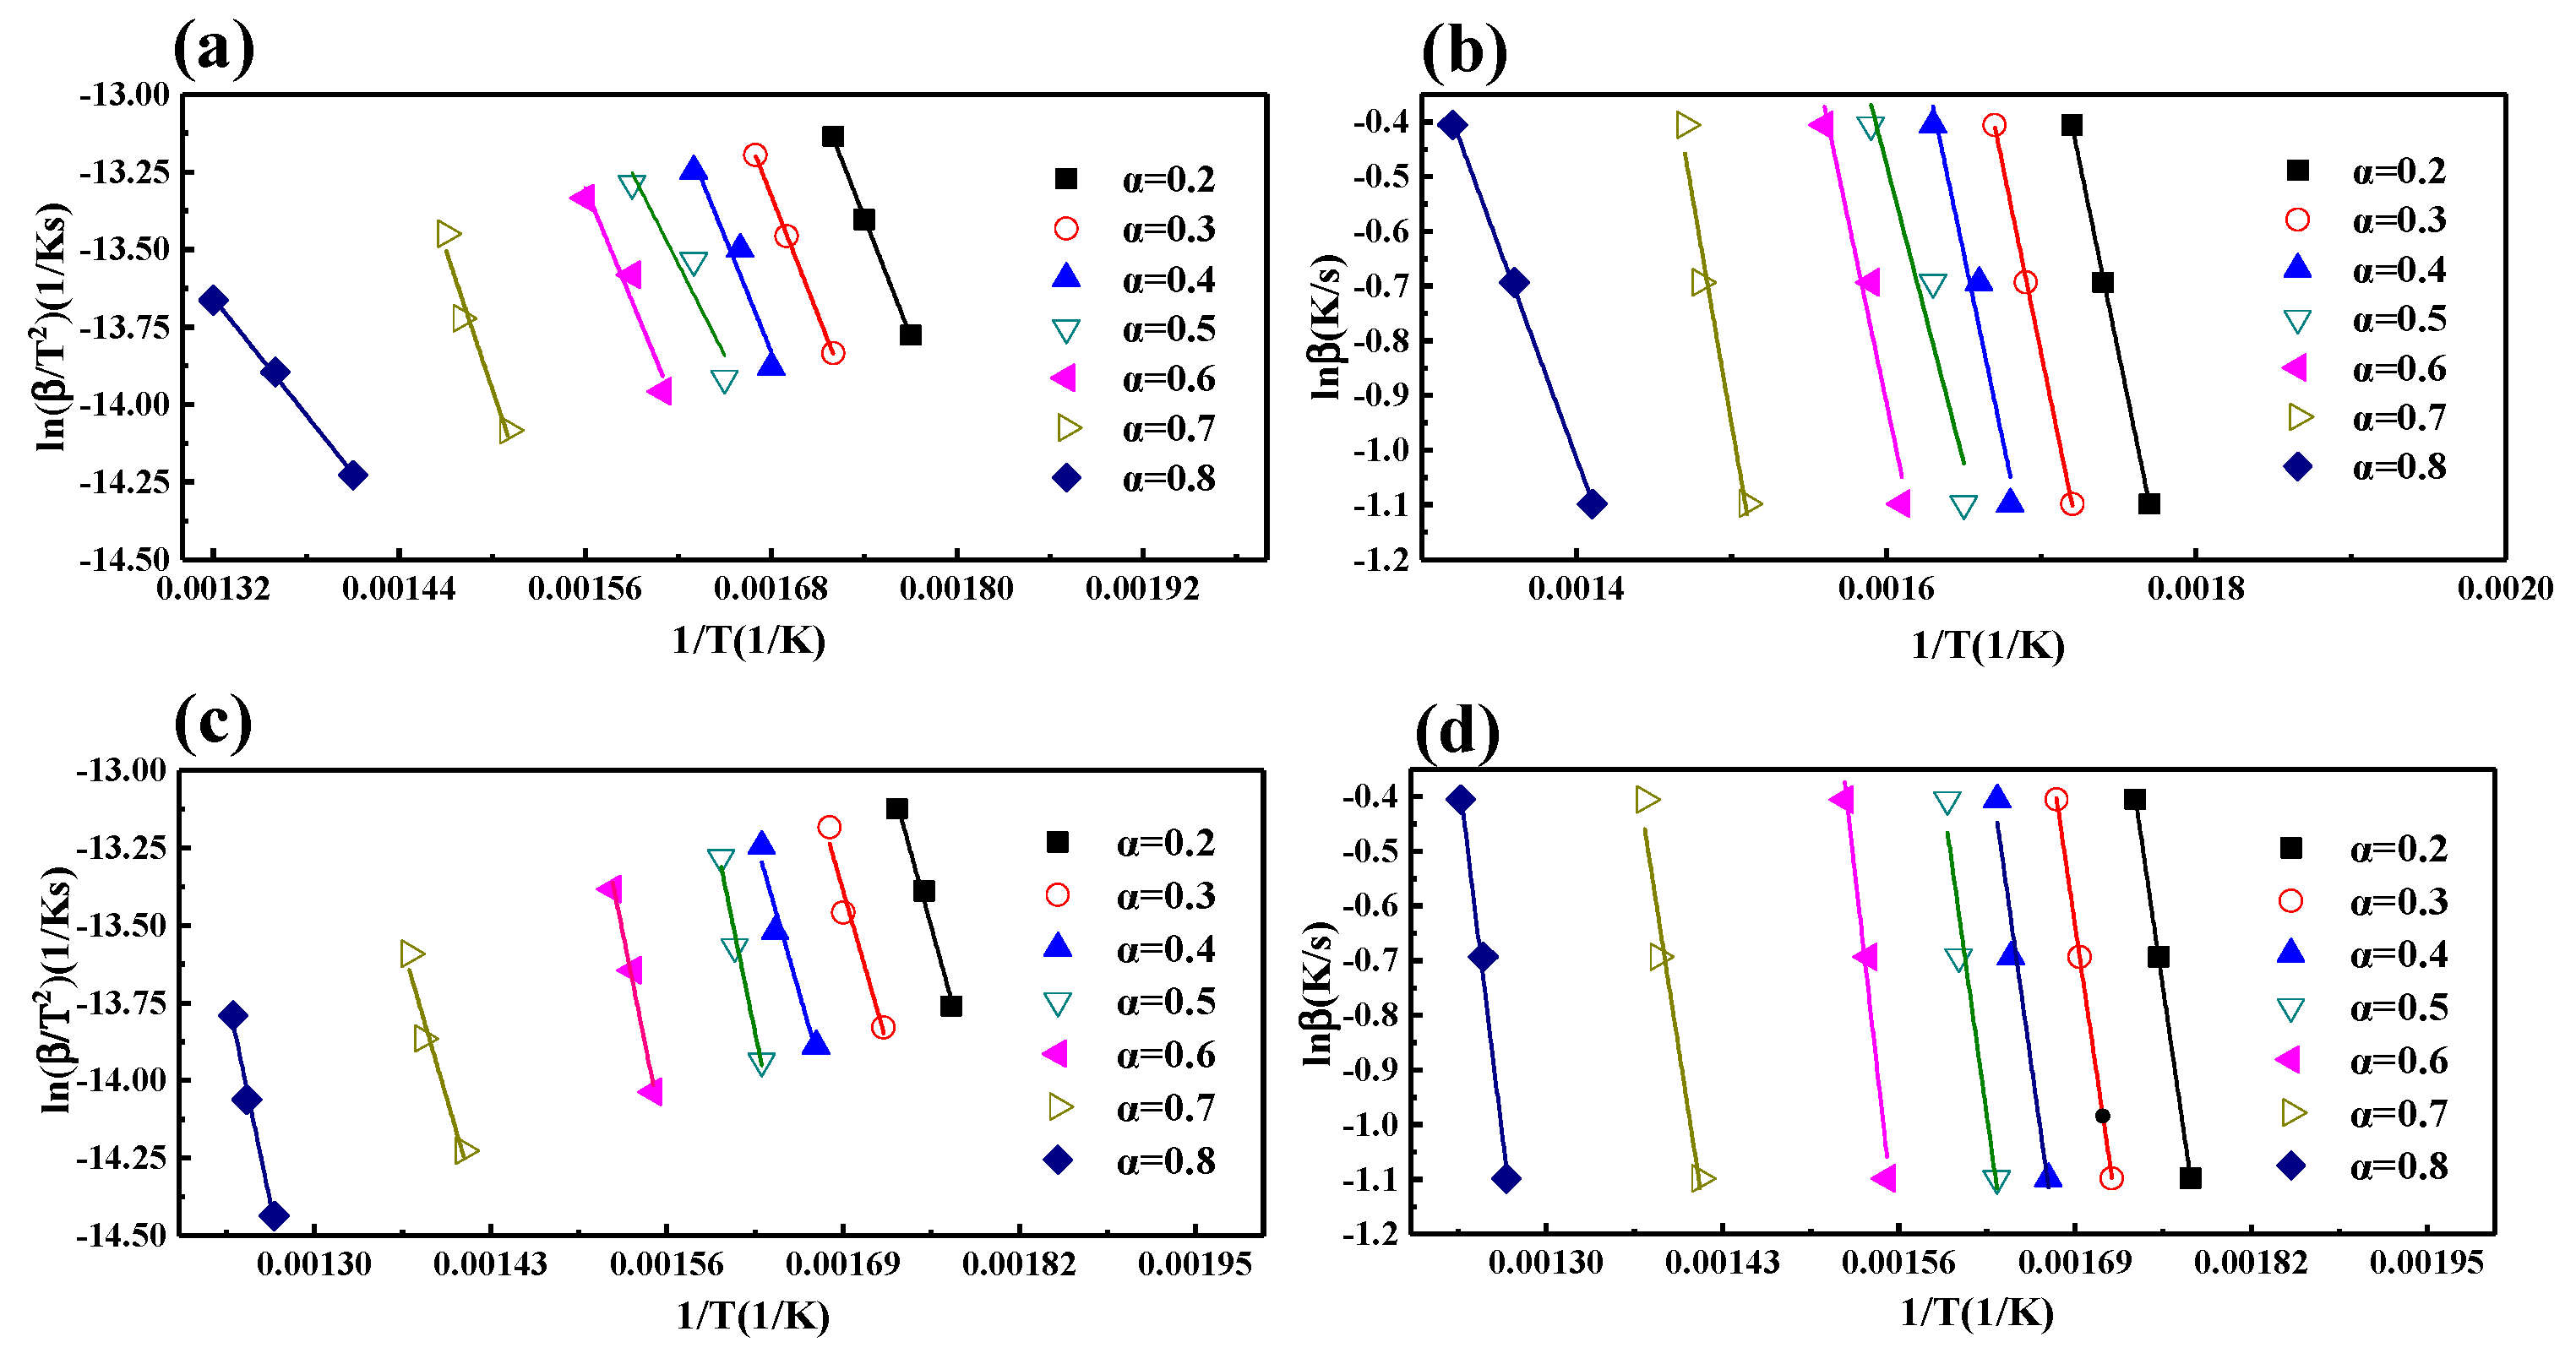
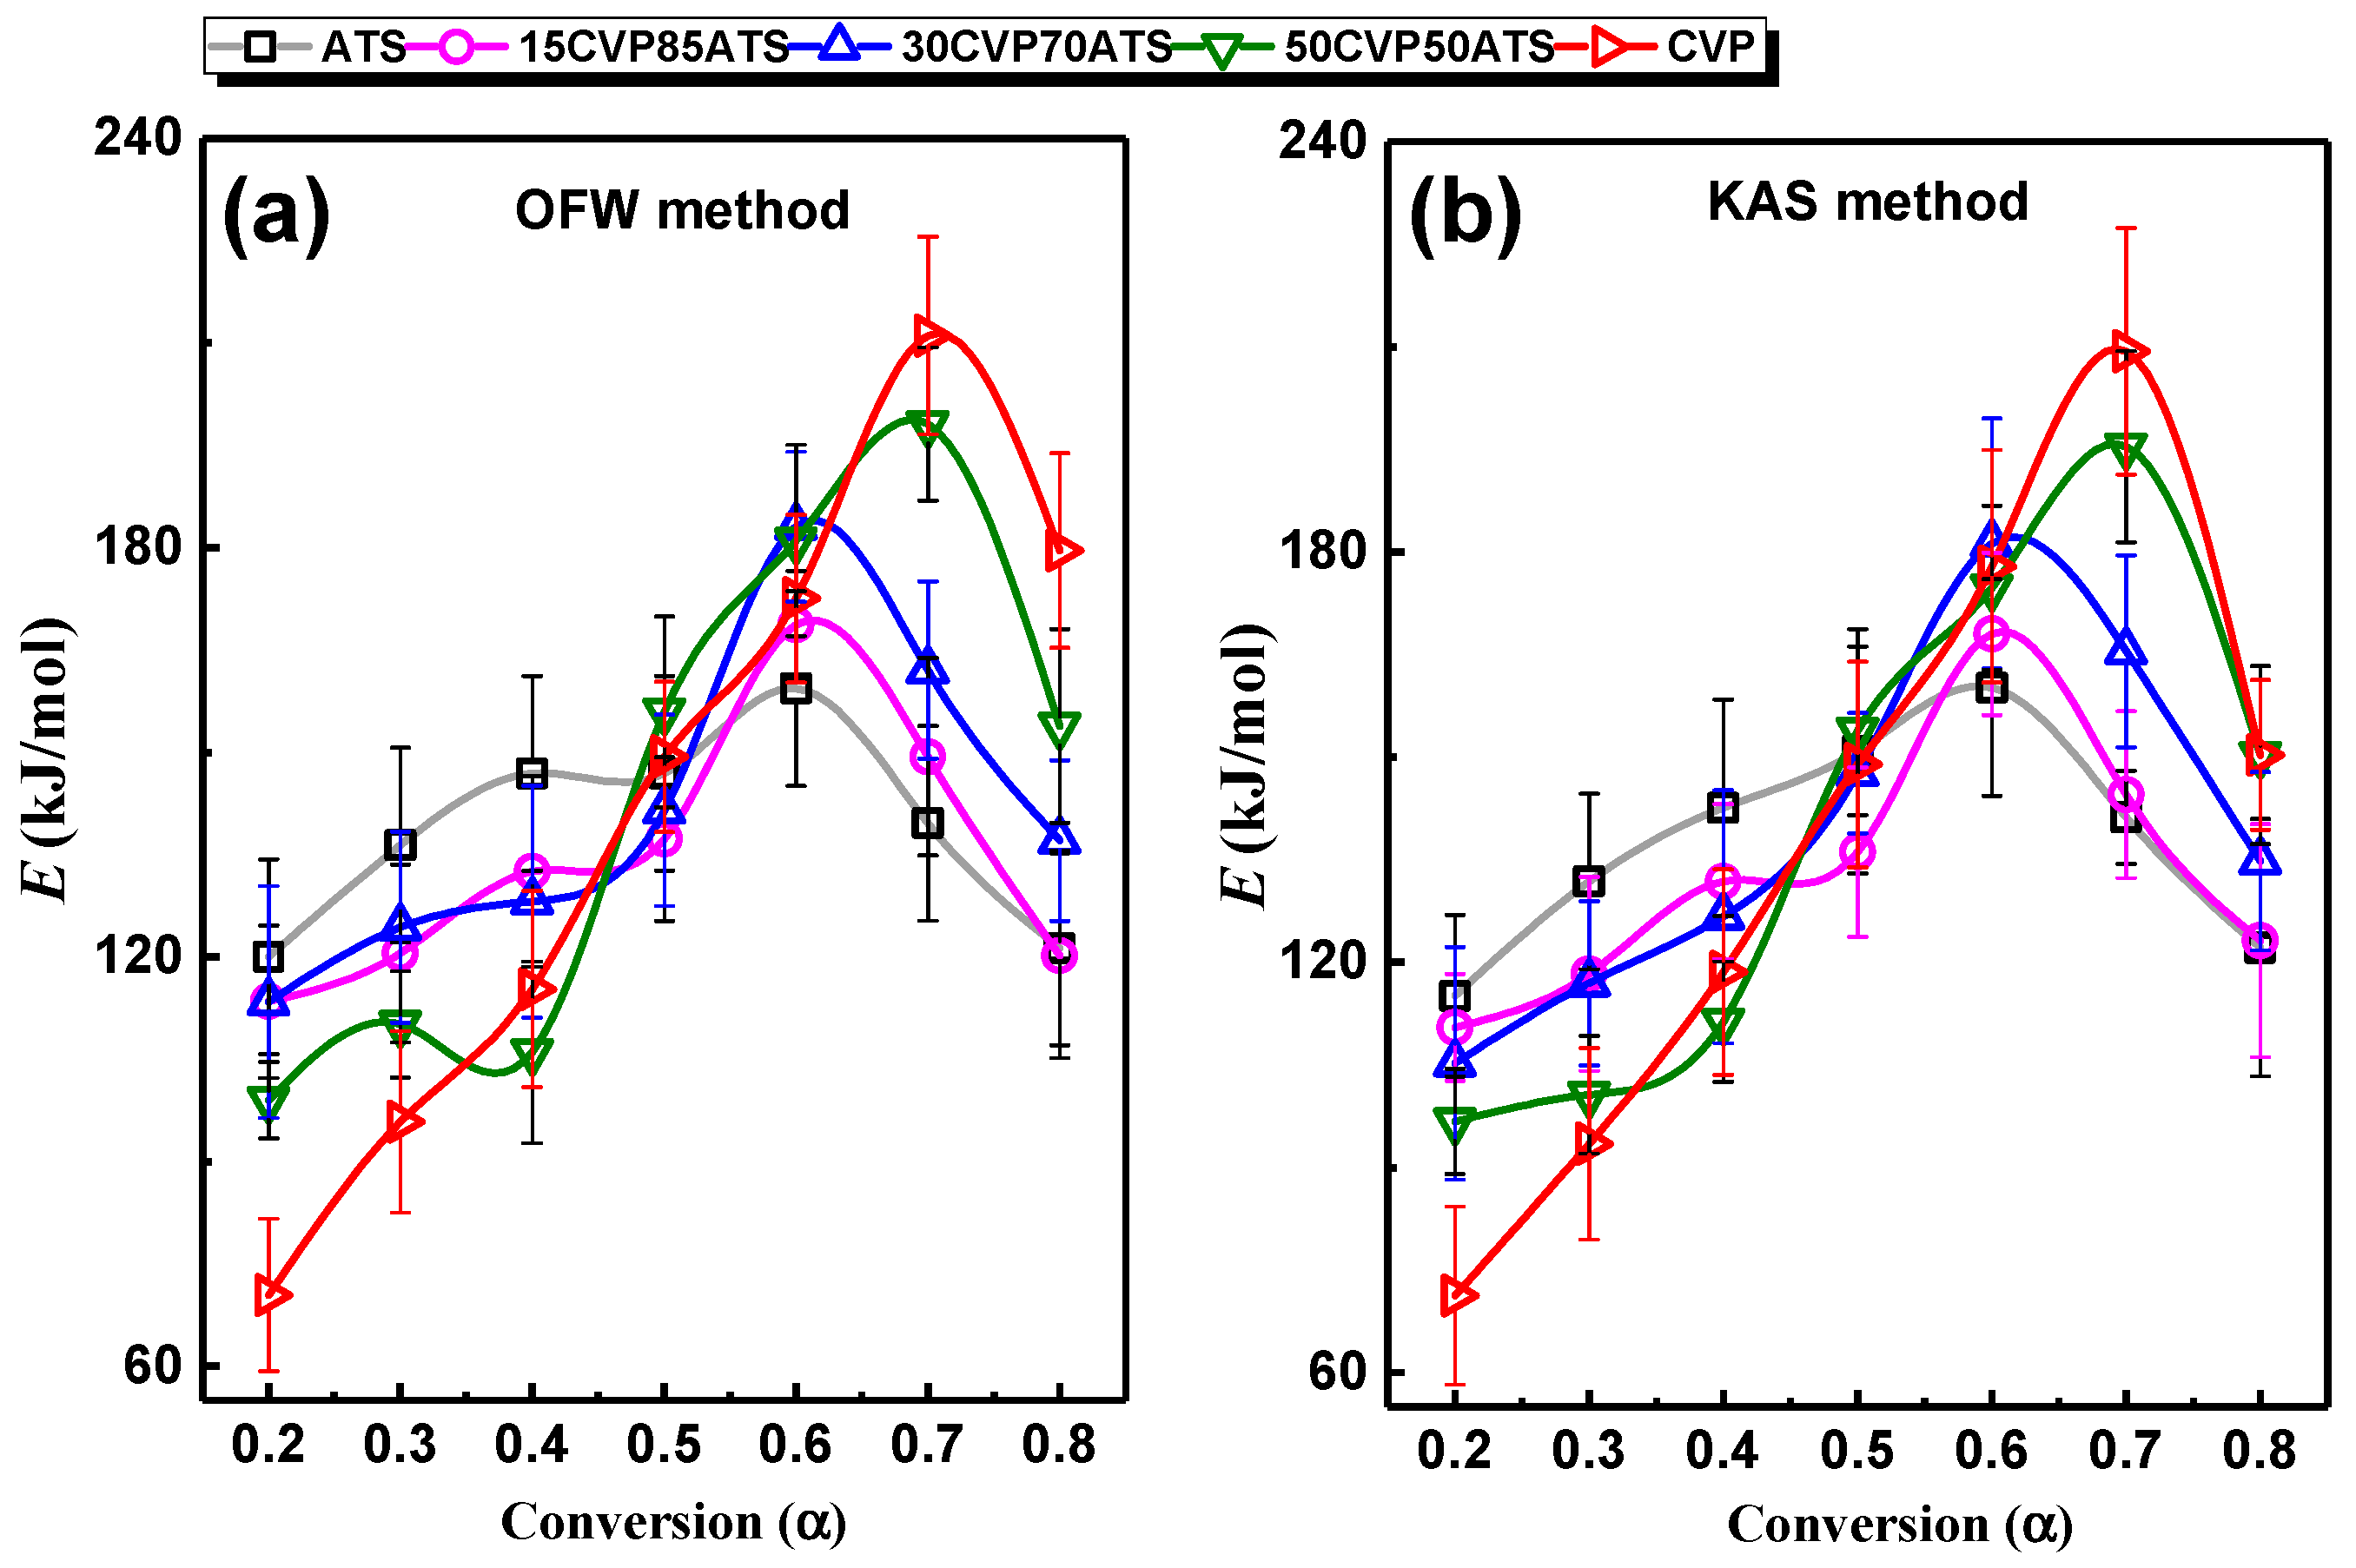
3.7. Kinetic Analysis of CSBs

According to Equations (11) and (12), these E values were calculated at β = 20, 30, and 40 °C/min by the KAS and the OFW with selected values of α (0.2–0.8; all the E values are listed in Appendix A Table A1). As shown in Figure 11a–d, the R2 of all curves were fitted well. Therefore, it could be assumed that the results were acceptable.
Figure 12a,b show the α versus E relationship of ATS, CVP, and all CSBs. The corresponding α of ATS blended with CVP had a similar trend to that of biomass without CVP. For a different blending ratio of CVP, the E averages were from 137.71 to 142.86 kJ/mol by KAS and from 138.66 to 142.02 kJ/mol by OFW, and it was found that within α = 0.2–0.8, the E values of CSB decreased at first and then increased with the increase of the blending ratio. Only a slight variation of E was observed for CSBs with α = 0.2 by KAS and OFW, which might be due to the large-scale agglomeration of the CVP accumulate on the molecules’ surface and filled the pores and cracks of ATS particles. However, a considerable decrease of E in Figure 12a,b was noted for CSBs with α = 0.3–0.5, which might be due to the protein in CVP, as shown in Table 1 [7]. These could be ascribed to the high protein contents in CVP, which has relatively high nitrogen content leading to activation energy difference [7,66]. A considerable decrease of E could explain the accelerative of co-combustion presented in Figure 9. The residual oil in CVP could significantly reduce the E for ATS in combustion at around 600 °C. In addition, blending CVP could increase the E of raw ATS with α = 0.5–0.8. This might be caused by the ash of CVP that covered the surface of CSBs and inhibited the volatile gases and heat release, and the phenomenon was similar to that reported by Cao et al. [47]. The results show that blending CVP could reduce the activation energy of ATS with α = 0.3–0.5. As shown in Table A1, the initial E of ATS was a little higher than that of CSB. Combined with the foregoing data about comprehensive ignition temperature, it was why the Ti of ATS was higher than that of CVP. At the same time, the final E value of CVP was higher than that of ATS, suggesting that CVP needed a higher temperature to burn out. This corresponds to the data in Figure 9.

3.8. Energy Efficiency Perspective of the Pellet

From the perspective of energy efficiency, the energy consumption of the pelletization process accounts for 65%–70% of the total energy consumption of the whole manufacturing process [69], and reducing the energy consumption of the pelletization process is an effective way to improve the energy efficiency of the pellet. In this work, as shown in Figure 5c, blending CVP could effectively reduce energy consumption in the pelletization process by up to 40%. In other words, blending CVP can save the energy consumption of the whole manufacturing process by about 26%–28%, which is very significant for improving energy efficiency. At present, biodiesel production is regarded as one of the important ways to utilize biomass, including animal feces, leather residues, microalgae, etc. [36,70]. However, according to the previous study, the energy efficiency of producing biodiesel from microalgae is very low. There are some shortcomings in the traditional microalgae biofuel processing pathway. For example, the microalgae biomass oil extraction requires a higher energy input, and its energy consumption accounts for nearly 57% of the total energy demand [71]. In this study, the co-pelletization of microalgae and wood residues was proposed to improve the economic sustainability of the overall system. On the one hand, the use of microalgae as a binder can be considered a significant way of utilizing microalgae, and co-pelletization of other biomass matrix materials with microalgae can be studied in the future. On the other hand, it seems promising that exploring the left-over microalgae waste could be used as a binder in the same way combined with economic cost factors. At present, to efficiently extract energy from pellets, the research regarding vegetal biomass has focused on high-efficiency combustion technology [72,73,74]. For example, Lazaroiu et al. [72,73] have shown that pitcoal-wood biomass briquettes can be stably burned in a modified 55 KW boiler. Besides, Lazaroiu et al. [74] achieved solid biomass hydrogenation combustion, which injecting hydrogen-rich gas (HRG) into the air is beneficial to the stability of the flame. Moreover, according to previous research, the direct burning of wood pellets for regional energy supply has been widely used [75,76]. Katers et al. [76] found that the energy consumption of obtaining wood pellets is about 56% of the total energy provided by direct burning of wood pellets. Neri et al. [75] investigated that the utilization of wood residues for energy production meets the European Union targets in small communities in Italy. Although the energy conversion efficiency of the wood pellet is low, wood pellets are widely used as a substitute for fossil energy. In all, blending CVP could increase the physical and thermal properties of wood pellets, and blending CVP could result in energy savings of about 26%–28% in the whole manufacturing process. That is to say, from the viewpoint of energy efficiency, the CSBs pellets are far superior in energy efficiency to wood pellets. In the lab, this work demonstrates that the novel pellet is a very promising fuel. In the future, considering the work of Lazaroiu et al. [70,72,74], further improvements in the manufacture and combustion of the novel pellets on an industrial scale should be a very promising task.

4. Conclusions

In this work, the potential of microalgae as a binder to affect the energy consumption physical, and thermal properties of a novel pellet (Chlorella vulgaris and CSB) were investigated using a single pelletization experimental device and TG-DTG. The following conclusions were drawn from this study:
1)
Increasing the temperature (80–160 °C) and pressure (120–200 MPa) could effectively increase the BD and DU of the novel pellets and blending microalgae could effectively increase the physical properties of the pellets. Moreover, the moisture content had an optimal value for the physical properties of the novel pellets. Blending microalgae could significantly reduce the energy consumption of pelleting by 23.5%–40.4%. Moreover, when the amount of CVP was 50%, a maximum BD of 1580.2 kg/m3, a DU of 98%, and a minimum energy consumption of 25.2 kJ/kg were obtained under the optimum conditions of temperature (120 °C), pressure (120 MPa), and moisture content (10%), respectively.
2)
The combustion experiment showed that the co-combustion interaction between the CVP and ATS did exist, and their effect on co-combustion process was inhibitive (0–300 °C) and accelerative (300–780 °C). Blending CVP could increase the Mf, Tf, and DTGmax and decrease T2, ICC, and Ti.
3)
The kinetic analysis showed that the minimum average E value of a pellet was obtained when the blending ratio of microalgae was 15%, which was 133.21 kJ/mol and 134.60 kJ/mol calculated by the KAS and OFW methods, respectively. Therefore, considering the co-pelletization and co-combustion of CSBs, blending 15% of microalgae could be considered an excellent way to improve the properties of CSBs.
4)
Thus, the quality of a bio-pellet like ATS could effectively be improved by using microalgae as a binder. The novel bio-pellet fuel made from waste biomass and microalgae blends is a promising option for biofuel production.

Author Contributions

Conceptualization, J.Y.; Data curation, T.H.; Funding acquisition, J.Y.; Investigation, X.C., X.S., C.B. and W.L.; Methodology, X.C. All authors actively participated in writing the article; X.C. and J.Y. contributed equally to the work.

Funding

This work is supported by the Natural Science Foundation of China (No. 50876073) and Natural Science Foundation of Tianjin City, China (No.13JCYBJC19000).

Acknowledgments

The authors wish to thank the Tianjin talent development special support program for high-level innovation and entrepreneurship team. We also thank to Jiang and Tian He from Tianjin University of Technology for their helpful comments during this work.

Conflicts of Interest

The authors declare no conflict of interest.

Nomenclature

List of Abbreviations:
TGAThermogravimetric analysisATSApple tree sawdust
CVPChlorella vulgaris powder15CVP85ATSComposed of 15% CVP and 85% ATS
KASKissinger–Akahira–Sunose method30CVP70ATSComposed of 30% CVP and 70% ATS
OFWOzawa–Flynn–Wall method50CVP50ATSComposed of 50% CVP and 50% ATS
CSBChlorella vulgaris and sawdust blendLHVthe low heating value
HHVthe high heating value
List of Symbols:
VVolatile mattersTAbsolute reaction temperature (°C)
FcFixed carbon βHeating rate (°C/min)
AAshTGThermogravimetric data (%)
BDBulk density (kg/m3 Wb)DTGFirst derivative data of TG (%/sec)
DUMechanical durability (%)CCIComprehensive combustion index
WEnergy consumption (kJ/kg)DTGmaxMaximum mass loss rate (%/sec)
FPressing force (kN)DTGmeanAverage mass loss rate (%/sec)
XDisplacement (mm)TiIgnition temperature (°C)
αConversionTfBurnout temperature (°C)
miInitial weights (mg)MfResidual mass (%)
mtInstantaneous weights (mg)T1Temperature of the first peak (°C)
mFinal weights (mg)T2Temperature of the second peak (°C)
kRate constantWexperimentalWeight loss values experimental (%)
APre-exponential factor WcalculatedWeight loss values calculated (%)
EActivation energy of the reactionxCVPProportion of CVP (%)
RConstant, 8.314 J/ (mol·K)xATSProportion of ATS (%)
ϕ0Porosity of pellet (%)ΔWDegree of interaction

Appendix A

Table A1. The E values at β = 20, 30, and 40 °C/min by KAS and OFW.
SamplesαKAS MethodOFW Method
E (kJ/mol)R2E (kJ/mol)R2
ATS0.2115.080.99918120.020.99941
0.3131.830.99974136.410.99948
0.4142.630.89562146.930.91083
0.5150.870.87344146.930.89874
0.6160.170.8922159.390.91083
0.7141.220.9215139.590.93359
0.8122.170.9969121.340.99773
Average137.71-138.66-
15CVP85ATS0.2110.490.99313113.480.90887
0.3118.310.92862120.550.93547
0.4131.840.98243132.560.98422
0.5136.110.95988137.320.96446
0.6168.030.92623168.70.99607
0.7144.50.91053149.360.98132
0.8123.20.9062120.20.97536
Average133.21-134.60-
30CVP70ATS0.2105.230.97168113.430.99964
0.3116.980.97362124.380.9998
0.4126.680.921128.180.95306
0.5147.70.98045141.510.91316
0.6181.260.98139183.090.93694
0.7165.490.92352162.070.9294
0.8134.80.92318137.070.98387
Average139.73-141.39-
50CVP50ATS0.296.710.9324799.060.97914
0.3100.650.94912110.150.92945
0.4111.310.98741106.060.97082
0.5153.880.9903155.960.9833
0.6174.80.98008181.050.91383
0.7195.420.95383198.120.98519
0.8150.320.96674153.860.97334
Average140.44-143.47-
CVP0.271.240.9062170.440.90621
0.393.460.9454695.840.94546
0.4118.580.99395115.320.99395
0.5148.940.94908149.350.94908
0.6177.880.93399172.560.93399
0.7209.360.98784211.060.98784
0.8180.580.94417179.600.96417
Average142.86-142.02-

References

  1. Raheem, A.; Prinsen, P.; Vuppaladadiyam, A.K.; Zhao, M.; Luque, R. A review on sustainable microalgae based biofuel and bioenergy production: Recent developments. J. Clean. Prod. 2018, 181, 42–59. [Google Scholar] [CrossRef]
  2. Park, C.; Heo, K.; Oh, S.; Kim, S.B.; Lee, S.H.; Kim, Y.H.; Kim, Y.; Lee, J.; Han, S.O.; Lee, S.; et al. Eco-design and evaluation for production of 7-aminocephalosporanic acid from carbohydrate wastes discharged after microalgae-based biodiesel production. J. Clean. Prod. 2016, 133, 511–517. [Google Scholar] [CrossRef]
  3. Ou, L.; Thilakaratne, R.; Brown, R.C.; Wright, M.M. Techno-economic analysis of transportation fuels from defatted microalgae via hydrothermal liquefaction and hydroprocessing. Biomass Bioenergy 2015, 72, 45–54. [Google Scholar] [CrossRef]
  4. Hess, D.; Quinn, J.C. Impact of inorganic contaminants on microalgal biofuel production through multiple conversion pathways. Biomass Bioenergy 2018, 119, 237–245. [Google Scholar] [CrossRef]
  5. Hosseinizand, H.; Sokhansanj, S.; Lim, C.J. Co-pelletization of microalgae Chlorella vulgaris and pine sawdust to produce solid fuels. Fuel Process. Technol. 2018, 177, 129–139. [Google Scholar] [CrossRef]
  6. Krizan, P.; Matus, M.; Soos, L.; Beniak, J. Behavior of Beech Sawdust during Densification into a Solid Biofuel. Energies 2015, 8, 6382–6398. [Google Scholar] [CrossRef] [Green Version]
  7. Amarasekara, A.; Tanzim, F.S.; Asmatulu, E. Briquetting and carbonization of naturally grown algae biomass for low-cost fuel and activated carbon production. Fuel 2017, 208, 612–617. [Google Scholar] [CrossRef]
  8. Miranda, M.T.; Sepulveda, F.J.; Arranz, J.I.; Montero, I.; Rojas, C.V. Physical-energy characterization of microalgae Scenedesmus and experimental pellets. Fuel 2018, 226, 121–126. [Google Scholar] [CrossRef]
  9. Cui, X.; Yang, J.; Lei, W.; Huang, T.; Wang, P.; Jia, C. Recent progress in research and application of DBBF additive in preparation and combustion process. Huagong Jinzhan/Chem. Ind. Eng. Prog. 2017, 36, 1247–1257. [Google Scholar]
  10. Muazu, R.I.; Stegemann, J.A. Biosolids and microalgae as alternative binders for biomass fuel briquetting. Fuel 2017, 194, 339–347. [Google Scholar] [CrossRef]
  11. Guo, F.; Zhong, Z. Optimization of the co-combustion of coal and composite biomass pellets. J. Clean. Prod. 2018, 185, 399–407. [Google Scholar] [CrossRef]
  12. Chen, C.; Ma, X.; He, Y. Co-pyrolysis characteristics of microalgae Chlorella vulgaris and coal through TGA. Bioresour. Technol. 2012, 117, 264–273. [Google Scholar] [CrossRef]
  13. Peng, X.; Ma, X.; Xu, Z. Thermogravimetric analysis of co-combustion between microalgae and textile dyeing sludge. Bioresour. Technol. 2015, 180, 288–295. [Google Scholar] [CrossRef]
  14. Arteaga-Perez, L.E.; Vega, M.; Rodriguez, L.C.; Flores, M.; Zaror, C.A.; Casas Ledon, Y. Life-Cycle Assessment of coal-biomass based electricity in Chile: Focus on using raw vs torrefied wood. Energy Sustain. Dev. 2015, 29, 81–90. [Google Scholar] [CrossRef]
  15. Jiang, L.; Yuan, X.; Li, H.; Chen, X.; Xiao, Z.; Liang, J.; Leng, L.; Guo, Z.; Zeng, G. Co-pelletization of sewage sludge and biomass: Thermogravimetric analysis and ash deposits. Fuel Process. Technol. 2016, 145, 109–115. [Google Scholar] [CrossRef]
  16. Magdziarz, A.; Gajek, M.; Nowak-Wozny, D.; Wilk, M. Mineral phase transformation of biomass ashes—Experimental and thermochemical calculations. Renew. Energy 2018, 128, 446–459. [Google Scholar] [CrossRef]
  17. Rybak, W.; Moron, W.; Ferens, W. Dust ignition characteristics of different coal ranks, biomass and solid waste. Fuel 2019, 237, 606–618. [Google Scholar] [CrossRef]
  18. Chen, G.; Wang, X.; Li, J.; Yan, B.; Wang, Y.; Wu, X.; Velichkova, R.; Cheng, Z.; Ma, W. Environmental, energy, and economic analysis of integrated treatment of municipal solid waste and sewage sludge: A case study in China. Sci. Total Environ. 2019, 647, 1433–1443. [Google Scholar] [CrossRef]
  19. Xiao, Z.; Yuan, X.; Jiang, L.; Chen, X.; Li, H.; Zeng, G.; Leng, L.; Wang, H.; Huang, H. Energy recovery and secondary pollutant emission from the combustion of co-pelletized fuel from municipal sewage sludge and wood sawdust. Energy 2015, 91, 441–450. [Google Scholar] [CrossRef]
  20. Yilmaz, E.; Wzorek, M.; Akcay, S. Co-pelletization of sewage sludge and agricultural wastes. J. Environ. Manag. 2018, 216, 169–175. [Google Scholar] [CrossRef]
  21. Tumuluru, J.S. Pelleting of Pine and Switchgrass Blends: Effect of Process Variables and Blend Ratio on the Pellet Quality and Energy Consumption. Energies 2019, 12, 11987. [Google Scholar] [CrossRef]
  22. Asadieraghi, M.; Daud, W.M.A.W. In-depth investigation on thermochemical characteristics of palm oil biomasses as potential biofuel sources. J. Anal. Appl. Pyrolysis 2015, 115, 379–391. [Google Scholar] [CrossRef]
  23. Cao, L.; Yuan, X.; Jiang, L.; Li, C.; Xiao, Z.; Huang, Z.; Chen, X.; Zeng, G.; Li, H. Thermogravimetric characteristics and kinetics analysis of oil cake and torrefied biomass blends. Fuel 2016, 175, 129–136. [Google Scholar] [CrossRef]
  24. ISO. ISO 18134-1/2 Solid Biofuels—Determination of Moisture Content—Oven Dry Method—Part 1/2; ISO: Geneva, Switzerland, 2015. [Google Scholar]
  25. ISO. ISO 18122, Solid Biofuels. Determination of Ash Content; ISO: Geneva, Switzerland, 2015. [Google Scholar]
  26. ISO. ISO 18125, Solid Biofuels—Determination of Calorific Value; ISO: Geneva, Switzerland, 2017. [Google Scholar]
  27. ISO. ISO 17831-1, Solid Biofuels. Determination of Mechanical Durability of Pellets and Briquettes; ISO: Geneva, Switzerland, 2015. [Google Scholar]
  28. ISO. ISO 17828, Solid Biofuels—Determination of Bulk Density; ISO: Geneva, Switzerland, 2015. [Google Scholar]
  29. Song, X.; Yang, Y.; Zhang, M.; Zhang, K.; Wang, D. Ultrasonic pelleting of torrefied lignocellulosic biomass for bioenergy production. Renew. Energy 2018, 129, 56–62. [Google Scholar] [CrossRef]
  30. Li, G.; Liu, C.; Yu, Z.; Rao, M.; Zhong, Q.; Zhang, Y.; Jiang, T. Energy Saving of Composite Agglomeration Process (CAP) by Optimized Distribution of Pelletized Feed. Energies 2018, 11, 2382. [Google Scholar] [CrossRef]
  31. Tauro, R.; Serrano-Medrano, M.; Masera, O. Solid biofuels in Mexico: A sustainable alternative to satisfy the increasing demand for heat and power. Clean Technol. Environ. Policy 2018, 20, 1527–1539. [Google Scholar] [CrossRef]
  32. Paredes-Sanchez, J.P.; Lopez-Ochoa, L.M.; Lopez-Gonzalez, L.M.; Las-Heras-Casas, J.; Xiberta-Bernat, J. Energy utilization for distributed thermal production in rural areas: A case study of a self-sustaining system in Spain. Energy Convers. Manag. 2018, 174, 1014–1023. [Google Scholar] [CrossRef]
  33. Pereira, M.F.; Nicolau, V.P.; Bazzo, E. Exergoenvironmental analysis concerning the wood chips and wood pellets production chains. Biomass Bioenergy 2018, 119, 253–262. [Google Scholar] [CrossRef]
  34. Sun, Y.; Bai, F.; Lu, X.; Jia, C.; Wang, Q.; Guo, M.; Li, Q.; Guo, W. Kinetic study of Huadian oil shale combustion using a multi-stage parallel reaction model. Energy 2015, 82, 705–713. [Google Scholar] [CrossRef]
  35. Lopez, R.; Fernandez, C.; Fierro, J.; Cara, J.; Martinez, O.; Sanchez, M.E. Oxy-combustion of corn, sunflower, rape and microalgae bioresidues and their blends from the perspective of thermogravimetric analysis. Energy 2014, 74, 845–854. [Google Scholar] [CrossRef]
  36. Hernández, D.; Solana, M.; Riaño, B.; García-González, M.C.; Bertucco, A. Biofuels from microalgae: Lipid extraction and methane production from the residual biomass in a biorefinery approach. Bioresour. Technol. 2014, 170, 370–378. [Google Scholar] [CrossRef]
  37. Timmons, D.; Mejía, C.V. Biomass energy from wood chips: Diesel fuel dependence? Biomass Bioenergy 2010, 34, 1419–1425. [Google Scholar] [CrossRef]
  38. Faizal, H.M.; Shamsuddin, H.S.; Heiree, M.H.M.; Hanaffi, M.F.M.A.; Rahman, M.R.A.; Rahman, M.M.; Latiff, Z.A. Torrefaction of densified mesocarp fibre and palm kernel shell. Renew. Energy 2018, 122, 419–428. [Google Scholar] [CrossRef]
  39. Jiang, L.; Liang, J.; Yuan, X.; Li, H.; Li, C.; Xiao, Z.; Huang, H.; Wang, H.; Zeng, G. Co-pelletization of sewage sludge and biomass: The density and hardness of pellet. Bioresour. Technol. 2014, 166, 435–443. [Google Scholar] [CrossRef]
  40. Kaliyan, N.; Morey, R.V. Natural binders and solid bridge type binding mechanisms in briquettes and pellets made from corn stover and switchgrass. Bioresour. Technol. 2010, 101, 1082–1090. [Google Scholar] [CrossRef]
  41. Kaliyan, N.; Morey, R.V.; Schmidt, D.R. Roll press compaction of corn stover and perennial grasses to increase bulk density. Biomass Bioenergy 2013, 55, 322–330. [Google Scholar] [CrossRef]
  42. Jiang, L.; Yuan, X.; Xiao, Z.; Liang, J.; Li, H.; Cao, L.; Wang, H.; Chen, X.; Zeng, G. A comparative study of biomass pellet and biomass-sludge mixed pellet: Energy input and pellet properties. Energy Convers. Manag. 2016, 126, 509–515. [Google Scholar] [CrossRef]
  43. Alberto Garcia-Nunez, J.; Tatiana Rodriguez, D.; Andres Fontanilla, C.; Elizabeth Ramirez, N.; Silva Lora, E.E.; Frear, C.S.; Stockle, C.; Amonette, J.; Garcia-Perez, M. Evaluation of alternatives for the evolution of palm oil mills into biorefineries. Biomass Bioenergy 2016, 95, 310–329. [Google Scholar] [CrossRef]
  44. Kaliyan, N.; Morey, R.V. Densification characteristics of corn cobs. Fuel Process. Technol. 2010, 91, 559–565. [Google Scholar] [CrossRef]
  45. Kaliyan, N.; Morey, R.V. Constitutive model for densification of corn stover and switchgrass. Biosyst. Eng. 2009, 104, 47–63. [Google Scholar] [CrossRef]
  46. Bai, X.; Wang, G.; Gong, C.; Yu, Y.; Liu, W.; Wang, D. Co-pelletizing characteristics of torrefied wheat straw with peanut shell. Bioresour. Technol. 2017, 233, 373–381. [Google Scholar] [CrossRef]
  47. Cao, L.; Yuan, X.; Li, H.; Li, C.; Xiao, Z.; Jiang, L.; Huang, B.; Xiao, Z.; Chen, X.; Wang, H.; et al. Complementary effects of torrefaction and co-pelletization: Energy consumption and characteristics of pellets. Bioresour. Technol. 2015, 185, 254–262. [Google Scholar] [CrossRef]
  48. Ahn, B.J.; Chang, H.; Lee, S.M.; Choi, D.H.; Cho, S.T.; Han, G.; Yang, I. Effect of binders on the durability of wood pellets fabricated from Larix kaemferi C. and Liriodendron tulipifera L. sawdust. Renew. Energy 2014, 62, 18–23. [Google Scholar] [CrossRef]
  49. Si, Y.; Hu, J.; Wang, X.; Yang, H.; Chen, Y.; Shao, J.; Chen, H. Effect of Carboxymethyl Cellulose Binder on the Quality of Biomass Pellets. Energy Fuels 2016, 30, 5799–5808. [Google Scholar] [CrossRef]
  50. Berghel, J.; Frodeson, S.; Granstrom, K.; Renstrom, R.; Stahl, M.; Nordgren, D.; Tomani, P. The effects of kraft lignin additives on wood fuel pellet quality, energy use and shelf life. Fuel Process. Technol. 2013, 112, 64–69. [Google Scholar] [CrossRef]
  51. Hu, Q.; Shao, J.; Yang, H.; Yao, D.; Wang, X.; Chen, H. Effects of binders on the properties of bio-char pellets. Appl. Energy 2015, 157, 508–516. [Google Scholar] [CrossRef]
  52. Li, H.; Jiang, L.; Li, C.; Liang, J.; Yuan, X.; Xiao, Z.; Xiao, Z.; Wang, H. Co-pelletization of sewage sludge and biomass: The energy input and properties of pellets. Fuel Process. Technol. 2015, 132, 55–61. [Google Scholar] [CrossRef]
  53. Holm, J.K.; Henriksen, U.B.; Hustad, J.E.; Sorensen, L.H. Toward an understanding of controlling parameters in softwood and hardwood pellets production. Energy Fuels 2006, 20, 2686–2694. [Google Scholar] [CrossRef]
  54. Frodeson, S.; Henriksson, G.; Berghel, J. Pelletizing Pure Biomass Substances to Investigate the Mechanical Properties and Bonding Mechanisms. BioResources 2018, 13, 1202–1222. [Google Scholar] [CrossRef]
  55. Masche, M.; Puig-Arnavat, M.; Jensen, P.A.; Holm, J.K.; Clausen, S.; Ahrenfeldt, J.; Henriksen, U.B. From wood chips to pellets to milled pellets: The mechanical processing pathway of Austrian pine and European beech. Powder Technol. 2019, 350, 134–145. [Google Scholar] [CrossRef]
  56. Marrugo, G.; Valdes, C.F.; Gomez, C.; Chejne, F. Pelletizing of Colombian agro-industrial biomasses with crude glycerol. Renew. Energy 2019, 134, 558–568. [Google Scholar] [CrossRef]
  57. Azargohar, R.; Nanda, S.; Kang, K.; Bond, T.; Karunakaran, C.; Dalai, A.K.; Kozinski, J.A. Effects of bio-additives on the physicochemical properties and mechanical behavior of canola hull fuel pellets. Renew. Energy 2019, 132, 296–307. [Google Scholar] [CrossRef]
  58. Lawoko, M.; Berggren, R.; Berthold, F.; Henriksson, G.; Gellerstedt, G. Changes in the lignin-carbohydrate complex in softwood kraft pulp during kraft and oxygen delignification. Holzforschung 2004, 58, 603–610. [Google Scholar] [CrossRef]
  59. Dai, X.; Theppitak, S.; Yoshikawa, K. Pelletization of Carbonized Wood Using Organic Binders with Biomass Gasification Residue as an Additive. Energy Fuels 2019, 33, 323–329. [Google Scholar] [CrossRef]
  60. Winzer, F.; Kraska, T.; Elsenberger, C.; Koetter, T.; Pude, R. Biomass from fruit trees for combined energy and food production. Biomass Bioenergy 2017, 107, 279–286. [Google Scholar] [CrossRef]
  61. Yuan, T.; Tahmasebi, A.; Yu, J. Comparative study on pyrolysis of lignocellulosic and algal biomass using a thermogravimetric and a fixed-bed reactor. Bioresour. Technol. 2015, 175, 333–341. [Google Scholar] [CrossRef]
  62. Tahmasebi, A.; Kassim, M.A.; Yu, J.; Bhattacharya, S. Thermogravimetric study of the combustion of Tetraselmis suecica microalgae and its blend with a Victorian brown coal in O-2/N-2 and O-2/CO2 atmospheres. Bioresour. Technol. 2013, 150, 15–27. [Google Scholar] [CrossRef]
  63. Huang, Z.L.; Li, H.; Yuan, X.Z.; Lin, L.; Cao, L.; Xiao, Z.H.; Jiang, L.B.; Li, C.Z. The energy consumption and pellets’ characteristics in the co-pelletization of oil cake and sawdust. RSC Adv. 2016, 6, 19199–19207. [Google Scholar] [CrossRef]
  64. Rezaei, H.; Yazdanpanah, F.; Lim, C.J.; Lau, A.; Sokhansanj, S. Pyrolysis of ground pine chip and ground pellet particles. Can. J. Chem. Eng. 2016, 94, 1863–1871. [Google Scholar] [CrossRef]
  65. Rezaei, H.; Sokhansanj, S.; Lim, C.J. Minimum fluidization velocity of ground chip and ground pellet particles of woody biomass. Chem. Eng. Process. 2018, 124, 222–234. [Google Scholar] [CrossRef]
  66. Mohan, D.; Pittman, C.U., Jr.; Steele, P.H. Pyrolysis of wood/biomass for bio-oil: A critical review. Energy Fuels 2006, 20, 848–889. [Google Scholar] [CrossRef]
  67. Tomáš, O.; Ivan, V.; Tomáš, H. Non-isothermal kinetic analysis of the thermal decomposition of spruce wood in air atmosphere. Res. Agric. Eng. 2018, 64, 41–46. [Google Scholar] [CrossRef] [Green Version]
  68. Orfão, J.J.; Antunes, F.J.; Figueiredo, J.L. Pyrolysis kinetics of lignocellulosic materials—Three independent reactions model. Fuel 1999, 78, 349–358. [Google Scholar] [CrossRef]
  69. Adams, P.W.R.; Shirley, J.E.J.; Mcmanus, M.C. Comparative cradle-to-gate life cycle assessment of wood pellet production with torrefaction. Appl. Energy 2015, 138, 367–380. [Google Scholar] [CrossRef] [Green Version]
  70. Lazaroiu, G.; Mihaescu, L.; Negreanu, G.; Pana, C.; Pisa, I.; Cernat, A.; Ciupageanu, D. Experimental Investigations of Innovative Biomass Energy Harnessing Solutions. Energies 2018, 11, 3469. [Google Scholar] [CrossRef]
  71. Dasan, Y.K.; Lam, M.K.; Yusup, S.; Lim, J.W.; Lee, K.T. Life cycle evaluation of microalgae biofuels production: Effect of cultivation system on energy, carbon emission and cost balance analysis. Sci. Total Environ. 2019, 688, 112–128. [Google Scholar] [CrossRef]
  72. Lazaroiu, G.; Mihăescu, L.; Prisecaru, T.; Oprea, I.; Pîşă, I.; Negreanu, G.; Indrieş, R.; Popa, V.I. Combustion of pitcoal-wood biomass brichettes in a boiler test facility. Environ. Eng. Manag. J. 2008, 7, 595–601. [Google Scholar] [CrossRef]
  73. Lazaroiu, G.; Oprea, I.; Mihaescu, L.; Prisecaru, T.; Pisa, I.; Negreanu, G.; Mocanu, C.R. Biomass briquettes from pitcoal-wood: Boiler test facility combustion case study. J. Environ. Prot. Ecol. 2012, 13, 1070–1081. [Google Scholar]
  74. Lazaroiu, G.; Pop, E.; Negreanu, G.; Pisa, I.; Mihaescu, L.; Bondrea, A.; Berbece, V. Biomass combustion with hydrogen injection for energy applications. Energy 2017, 127, 351–357. [Google Scholar] [CrossRef]
  75. Neri, E.; Cespi, D.; Setti, L.; Gombi, E.; Bernardi, E.; Vassura, I.; Passarini, F. Biomass residues to renewable energy: A life cycle perspective applied at a local scale. Energies 2016, 9, 922. [Google Scholar] [CrossRef]
  76. Katers, J.F.; Snippen, A.J.; Puettmann, M.E. Life-cycle inventory of wood pellet manufacturing and utilization in Wisconsin. For. Prod. J. 2012, 62, 289–295. [Google Scholar] [CrossRef]
Figure 1. (a) Single pelletization experimental device and (b) TGA sample preparation process.
Energies 12 03425 g001
Figure 2. Physical properties of ATS and Chlorella vulgaris and sawdust blends (CSBs; 15CVP85ATS, 30CVP70ATS, and 50CVP50ATS) based on ISO 17225 (common experiment: 140 MPa, 120 °C, 10%): (a,b) Relationship between bulk density (BD), mechanical durability (DU), and pressure, (c,d) relationship between BD, DU, and temperature, and (e,f) relationship between BD, DU, and moisture content.
Energies 12 03425 g002
Figure 3. Pelletization process at a force of 120 MPa (4.7 N), temperature of 90 °C, and moisture content of 12% of (a,a1,a2) ATS, (b,b1,b2,b3) 15CVP85ATS, (c,c1,c2,c3) 30CVP70ATS, and (d,d1,d2,d3) 50CVP50ATS.
Energies 12 03425 g003
Figure 4. (ac) Energy consumption of the CSB pellet, and (d) co-pelletization interaction of ATS and CVP.
Energies 12 03425 g004
Figure 5. Effect of blending different binder amounts on physical properties of different biomass pellet fuels: (a) The DU [5,48,49,50], (b) the BD [5,42,46,47,51,52,53], and (c) the energy consumption [5,46,47,49,51,52] of a bio-pellet.
Energies 12 03425 g005aEnergies 12 03425 g005b
Figure 6. The relationship between porosity and microalgae addition.
Energies 12 03425 g006
Figure 7. Sample appearance, surface (×1000), and section (×1000) under parameters of temperature (120 °C), pressure (100 MPa), and moisture content (10%): (ac) ATS, (df) 15CVP85ATS, (gi) 30CVP70ATS, (jl) 50CVP50ATS, and (mo) CVP.
Energies 12 03425 g007
Figure 8. (a) Thermogravimetric, and (b) DTG curves of all samples (CSB) heated at a rate of 30 °C/min.
Energies 12 03425 g008
Figure 9. (a) The relationship between Ti and CSBs; (b) the relationship between Tf and CSBs; (c) the relationship between T2 and CSBs; (d) the relationship between DTGmax and CSBs; (e) the relationship between Mf and CSB; and (f) the relationship between CCI and CSBs.
Energies 12 03425 g009
Figure 10. (a) Experiment and calculation DTG curve, and (b) variation profiles of ΔW (TG) of different CSBs (β = 30 °C/min).
Energies 12 03425 g010
Figure 11. (a) The linear correlation of 30CVP70ATS by Kissinger–Akahira–Sunose (KAS); (b) the linear correlation of 30CVP70ATS by Ozawa–Flynn–Wall (OFW); (c) the linear correlation of ATS by KAS; and (d) the linear correlation of ATS by OFW.
Energies 12 03425 g011
Figure 12. Relationship between the E and different α determined by (a) OFW and (b) KAS.
Energies 12 03425 g012
Table 1. Comprehensive analysis result of apple tree sawdust (ATS) and Chlorella vulgaris (CVP; %, on dry ash-free basis).
PropertiesApple Tree SawdustMicroalgae (Chlorella vulgaris)
Proximate analysis (%)
V77.08 ± 0.7179.76 ± 0.62
A5.30 ± 0.166.81 ± 0.21
Fc17.62 ± 1.2413.43 ± 0.81
Ultimate analysis (%)
C45.32 ± 0.0249.13 ± 0.12
H5.635 ± 0.217.26 ± 0.11
O48.11 ± 0.1433.96 ± 0.16
N0.89 ± 0.039.12 ± 0.08
S0.044 ± 0.010.53 ± 0.05
LHV (MJ/kg)10.01 ± 0.1211.01 ± 0.02
HHV (MJ/kg)17.41 ± 0.4221.90 ± 0.47
Macromolecular analysis (%)
Cellulose42.83 ± 0.12-
Hemicellulose25.37 ± 0.12-
Lignin25.78 ± 0.12-
Lipid-10.66 ± 0.12
Protein-11.61 ± 0.12
Carbohydrate (Polymer)-26.23 ± 0.12
Table 2. Sample physical properties under parameters of temperature (120 °C), pressure (100 MPa), and moisture content (10%).
SampleBD (kg/m3)ErrorDU (%)ErrorW (kJ/kg)Error
ATS1161.4±5.3%96.6±1.3%42.1±3.3%
15CVP85ATS1277.3±6.1%97.3±1.9%32.2±3.1%
30CVP70ATS1345.3±4.4%97.8±1.4%28.3±4.7%
50CVP50ATS1580.2±5.2%98.3±2.2%25.2±4.2%
Table 3. Characteristic parameters of 15CVPS85ATS at different heating rates.
Heating Rate (°C/min)Ti (°C)Tf (°C)T1 (°C)T2 (°C)DTGmax (%/sec)Mf (%)
20271.1674.483.4321.7−0.57410.78
30272.3668.985.3327.2−0.6429.81
40280.5664.685.9329.2−0.6688.37

