Improvement of Digestate Stability Using Dark Fermentation and Anaerobic Digestion Processes


1
DIEF—Department of Industrial Engineering, University of Florence, via Santa Marta 3, 50139 Florence, Italy
2
DESTEC—Department of Energy, Systems, Territory and Construction Engineering, University of Pisa, via C.F. Gabba 22, 56122 Pisa, Italy
*
Author to whom correspondence should be addressed.
Energies 2019, 12(18), 3552; https://0-doi-org.brum.beds.ac.uk/10.3390/en12183552
Submission received: 29 July 2019
/
Revised: 6 September 2019
/
Accepted: 15 September 2019
/
Published: 17 September 2019
(This article belongs to the Special Issue Biohydrogen Production Technologies and Application)
Abstract
:This paper assessed the effect of dark fermentation, the fermentative phase in a two-stage anaerobic digestion system, in terms of digestate biostabilization efficiency. The digestates analyzed in this study were obtained from a pilot-scale system in which two different substrates were used in order to simulate both the digestion and co-digestion process. Biostabilization performances were evaluated by measuring the specific oxygen uptake rate (SOUR) of the outgoing digestates. This index allowed us to define the degree of effectiveness in terms of stabilization of organic matter, between the traditional anaerobic digestion process and the two-stage configuration. Considering the traditional process as a reference scenario, the results highlighted an increase in biological stability for the two-stage co-digestion process, consisting of a dark fermentation stage, followed by an anaerobic digestion one. Digestates biostabilization efficiency increased up from 6.5% to 40.6% from the traditional one-stage configuration to the two-stage one by improving the anaerobic digestion process through a preliminary fermentative stage. The advantages of the two-stage process were due to the role of dark fermentation as a biological pre-treatment. Considering the partial stability results related to the second stage, biological stability was improved in comparison to a single-stage process, reaching an efficiency of 42.2% and 55.8% for the digestion and co-digestion scenario respectively. The dark fermentation phase allowed for a higher hydrolysis of the substrate, making it more easily degradable in the second phase. Results demonstrated better biostabilization performances of the outgoing digestates with the introduction of dark fermentation, resulting in more stable digestates for both the digestion and co-digestion process.
1. Introduction
In order to develop a sustainable-resource-efficient future and reduce environmental pressures such as greenhouse gas emissions, the European Union has promoted legislation that has had an impact on waste management, with the aim of closing the material loop [1]. Considering the Circular Economy Package Action Plan promoted by the European Union [1], waste generation should be minimized by increasing the value of products as much as possible, turning waste into resources for new purposes [2,3]. Most of the municipal waste produced in the EU is organic (about 39.8 million tons) [4], therefore the effectiveness of the treatment applied to organic substances is of fundamental importance [5]. In this context, anaerobic digestion (AD) is considered an interesting technology for bio-waste valorization, due to its potential to convert biodegradable materials into bio-fuels and bio-based products [6]. The effectiveness of anaerobic digestion is measured in terms of the biological stability of the output materials. If an output is stable, it means that it is not able to generate further residual impacts, such as climate-changing gases and leachates. Therefore, the optimization of biological processes through the assessment of the biological stability of process outputs is becoming increasingly important [7]. Nowadays, a significant capacity of AD technology is in the wastewater treatment sector for the treatment of wastewater sludge. However, co-digestion of sludge and biodegradable waste has received more interest, because it represents a strategic approach in wastewater and waste management [8]. In fact, AD technology provides useful process outputs as biogas, a renewable source of energy that can be used in cogeneration plants as an alternative to fossil fuels [9], and also digestate, a residual organic matter with high fertilizer and organic amendment properties that can be applied in agriculture as a substitute for synthetic fertilizers [10].
From the perspective of process optimization, the production of bio-hydrogen through a two-stage AD process is considered to be a promising solution [11,12,13,14,15]. In the two-stage configuration, the traditional AD process is divided into two reactors connected in series to each other in dark conditions. In the first reactor, namely, the dark fermentation (DF) reactor, the fermentative phase is performed and a hydrogen-rich biogas is produced with a release of volatile fatty acids (VFAs) in the digestate. The methanogenic phase is carried out in the second reactor, where the residual organic matter and VFAs are converted into a methane-rich biogas [16]. In addition to splitting the AD process in two stages, another possibility for improving AD efficiency is the biological treatment of different biodegradable substrates simultaneously, called the co-digestion process, which contributes to energy production enhancement and nutrient recycling [8,17,18,19]. Food waste, in particular the organic fraction of municipal solid waste, and wastewater sludge, represent two-optimal substrates for the co-digestion process due to their wide availability in the municipality and their synergistic characteristics in providing an important contribution to the digestion process [20]. Previous studies have investigated the role of DF in a two-stage AD process in terms of bio-fuel production. The first fermentative stage can be seen as a biological pre-treatment step that improves biogas production in the following AD stage [16]. In fact, in addition to producing hydrogen-rich biogas, the DF stage contributes to improving the hydrolysis of the feedstock by supplying readily available organic matter into the AD reactor, resulting in an increase of methane production [21,22,23,24,25]. As regards anaerobic digestate and the influence that a two-stage AD process has on it, the information concerning digestates’ biological stability is still limited and further investigation is needed in terms of biostabilization efficiency. To the best of the authors’ knowledge, this work is the first study to assess the stability of DF digestates, in comparison to the traditional AD process.
Nowadays, the application of digestate in agriculture as organic fertilizer faces many barriers, due to different national fertilizer regulations within the European Union, which vary especially according to the feedstock treated in the AD process. Therefore, the EU Fertilizer Regulation aims to define a homogeneous regulatory framework in line with the circular economy model, to promote the use of fertilizers obtained from bio-waste recycling [26]. Based on that, digestates need to comply with chemical, physical and biological standards, depending on the feedstock used. Biological stability is a characteristic of digestate that should be considered in assessing the possibility of using it in agriculture as an organic amendment for balancing the soil humus content [27]. This feature defines the content of readily biodegradable matter in an organic matrix and its degree of decomposition and also allows for evaluating the treatment efficiency of AD plants in terms of environmental impacts reduction [28]. Stability is typically evaluated by respirometric methods, but there are no standard European procedures for its assessment and each country uses its own rules [29]. Among the several methods for measuring biological stability (self-heating test, Dynamic Respirometric Index), respirometric tests that measure the oxygen uptake rate during microbial respiration activity are considered the most suitable for its estimation [7,30]. The specific oxygen uptake rate (SOUR) test is considered a short, indirect and reliable aerobic assay to assess biological stability. It is a measure of oxygen consumption during microbial respiration activity of a solid matrix suspended in an aqueous solution. Oxygen dispersion in the liquid phase is guaranteed by means of a continuous stirring and an intermitted aeration. The dissolution of the sample in a liquid state avoids the oxygen transfer limitation due especially to the structure and moisture content of the sample [31,32]. The bulk of the research has focused its attention on the evaluation of digestate stability of a traditional AD process and of other matrices in terms of cumulative oxygen demand in 20 hours (OD20). Tambone et al. [27,33] showed OD20 values for biologically untreated matrices i.e., ingestates and household organic waste of 243 ± 8 mgO2 g DM−1 20 h−1 and 233 ± 39 mgO2 g DM−1 20 h−1 respectively. Scaglia et al. [34] studied sewage sludge stability through the SOUR test, obtaining an average value of 91 ± 8 mgO2 g DM−1 20 h−1 for untreated sludge and 30 ± 2 mgO2 g DM−1 20 h−1 for anaerobically treated sludge. Orzi et al. [28] reported the results of the stability index of several ingestates and digestates coming from a full-scale thermophilic AD plant, which were on average equal to 264 ± 40 mgO2 g DM−1 20 h−1 and 95 ± 16 mgO2 g DM−1 20 h−1 respectively. Other results were reported by Tambone et al. [35] and Schievano et al. [36]. Nevertheless, information on the biological stability of the digestate obtained by a two-stage AD system is still limited.
Based on the above background, considering the influence of DF in biogas production, its effect on digestate stability should also be evaluated. The main purpose of this study is to compare the biological stability of the outgoing digestate obtained from a one-stage and two-stage AD system. Experiments were performed in semi-continuous pilot scale reactors, employing different substrates as feeding. Different scenarios were carried out in order to develop both the traditional AD process and the two-stage process, where the preliminary DF stage was added. Anaerobic performances were estimated in terms of digestate stabilization and evaluated through the SOUR test.
2. Materials and Methods
Experiments were carried out with two distinct feedstocks in order to perform both the digestion and co-digestion process. In addition, the tests were analyzed in two different configurations. For the evaluation of the conventional one-stage AD process, which represents the reference scenario, the methanogenic reactor was performed alone. Subsequently, the DF reactor was connected in series with the AD reactor with the aim of estimating the process in a two-stage system. In the study of Baldi et al. [21], a detailed description of the experimental set-up is shown, as well as the operational conditions for the continuous stirred tank reactors (CSTR) pilot-scale tests.
2.1. Feedstock and Digestate
Food waste (FW) and wastewater sludge (WWS) were used as substrates in the experimental tests, both separately and mixed together, with the aim of simulating a digestion or co-digestion system. The FW was collected by sampling about 10 tons of source-separated organic waste coming from a kerbside collection system in a Tuscan municipality (Italy). The sample was immediately treated in a food processor (Philips, Problend 6, Amsterdam, The Netherlands) for five minutes at maximum speed, diluted with tap water and stocked in a freezer at −4 °C until use. Concerning WWS, around 200 liters of aerobic sludge from the aerobic unit of a municipal WWTP were collected. The sample was stored in plastic tanks and refrigerated at 4 °C until use. In order to depict a wet digestion technology, the food waste sample was diluted with the aim of achieving a slurry, with a total solid (TS) content of 5% by weight. Therefore, the thawed FW slurry was mixed with tap water or WWS to simulate, respectively, the digestion and co-digestion trials. In both experiments, the ratio of FW to water or WWS was about 1:5 by weight [21].
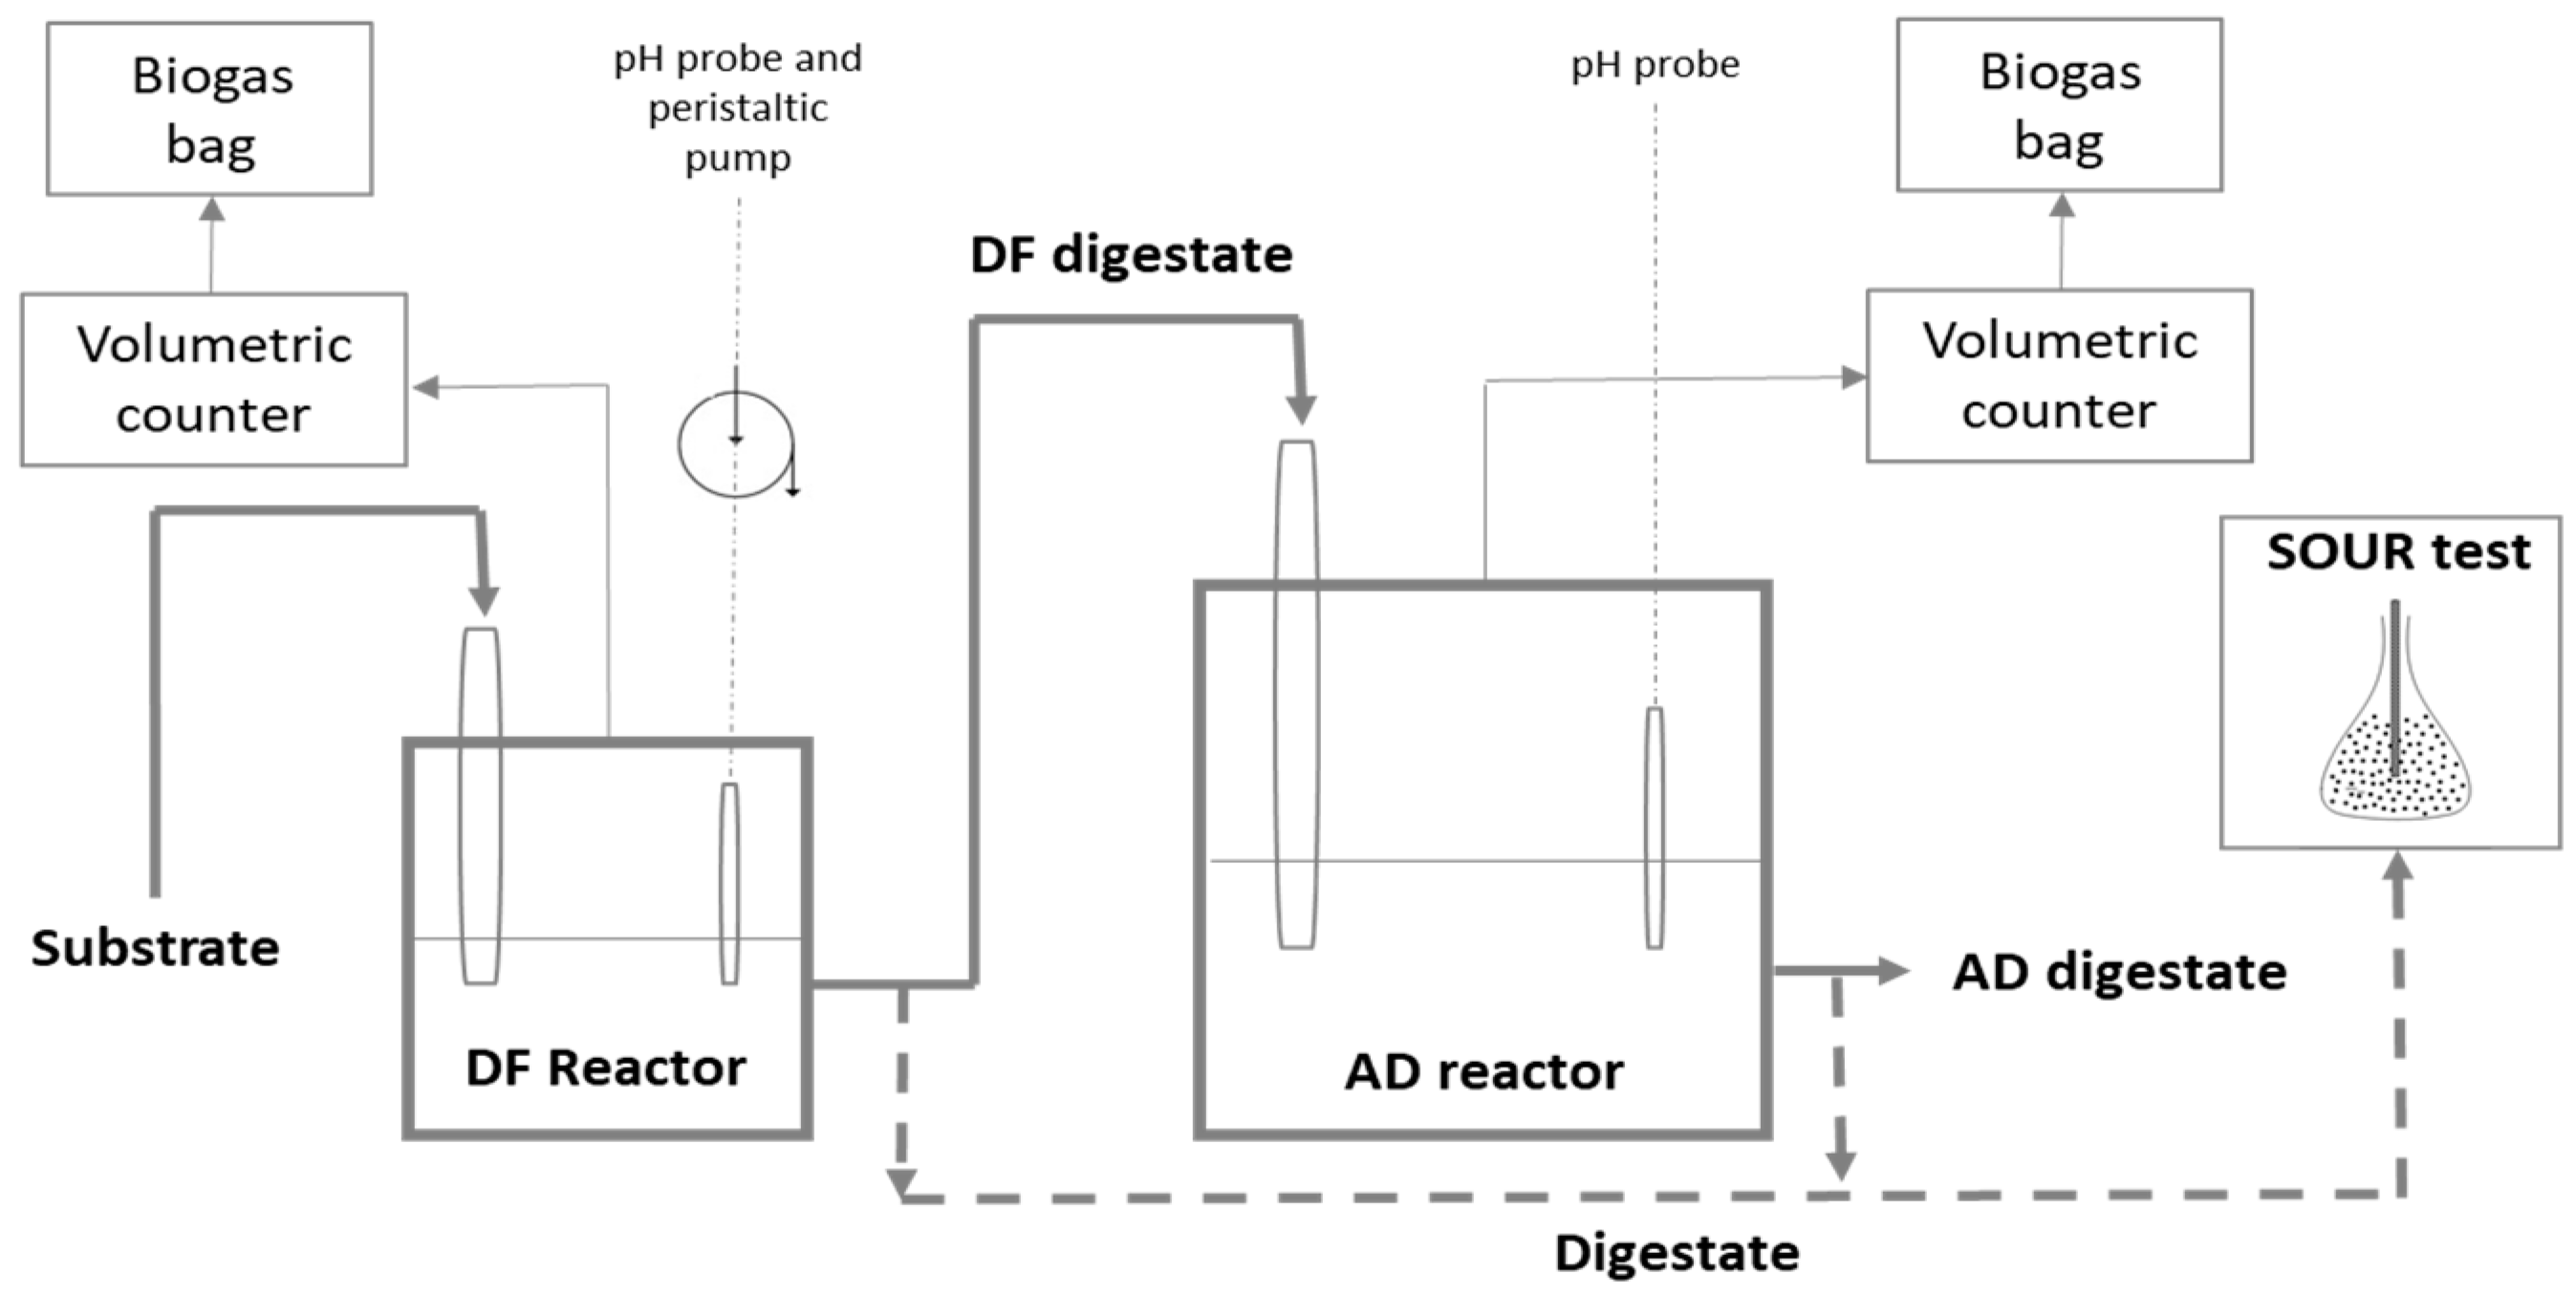
The digestate was taken from a pilot-scale system made of stainless steel (AISI 316) reactors operating under mesophilic conditions (37 °C ± 1). The one-stage and two-stage AD processes were carried out by means of two continuous stirred tank reactors (CSTR) adopted for performing the fermentative and methanogenic stages in dark conditions. The fermentation stage (DF) was evaluated using a 6 L reactor, while for the methanogenic stage a 20 L reactor was used (working volume of 3 L and 12 L respectively for DF and AD). The reactors were fed daily with feedstock through a syringe, with a capacity of 200 mL, and subsequently, the same amount of digestate was collected. In the traditional one-stage configuration, the methanogenic reactor ran alone and therefore only the digestate coming from the AD reactor was sampled. In the two-stage process, the DF and AD were connected in series and only the outgoing digestate of the DF reactor was turned into the substrate for the subsequent AD tank. Two different digestates were collected in this configuration: the outgoing digestate of both the DF and AD rectors (Figure 1). After sampling, the digestate was centrifuged at 35,000 rpm for 30 minutes (Beckman Coulter, Allegra 25R Centrifuge, Brea, California, USA) and the solid phase was then stored in a freezer at −4 °C until analysis.
Summarizing, the substrates characterized by the sole FW (S1) and the mixture of FW and WWS (S2), were used respectively as feeding in the digestion and co-digestion configurations. The other samples constituted the outgoing digestates obtained from the DF and AD reactor. Table 1 shows the analyzed samples, their origins and time of process for treatment.
Each experimental trial was performed during the steady-state condition that corresponds to a period of three HRTs of anaerobic digestion reactor.
Analytical characterization of the substrates and digestates were performed in order to provide a detailed description of the media. Results are shown in Table 2.
2.2. Biological Stability Index: SOUR Determination
In accordance with the purpose of this study, the biological stability of each digestate was assessed through the evaluation of the SOUR index in order to evaluate the AD process efficiency in terms of stabilization improvement. The SOUR index was measured for each substrate and digestate collected during the experimental test, according to the methods proposed by Lasaridi and Stentiford [37] and modified by Adani et al. [38].
To perform the SOUR test, a 2.5 g (wet weight) sample was defrosted and taken, diluted with 500 mL of distilled water and mixed for approximately 30 s by means of a food blender (Problend 6, Philips, Amsterdam, The Netherlands). After mixing, the solution was further diluted with another 500 ml of distilled water and placed in a 1-liter bottle. To ensure optimal nutrient and pH conditions for process development, buffer and nutrients solutions were introduced in the aqueous blend. In particular, MgSO4, CaCl3 and FeCl3 solutions were made in accordance with the standard procedures for the biological oxygen demand (BOD) test [39] and 5 mL of each were added to the bottle. Furthermore, 1.1 mL of ATU (allylthiourea) and 15 mL of phosphate buffer solution were added to avoid nitrogenous oxygen demand and maintain a neutral pH value of the order of 7.0. The flask was placed on a magnetic stirrer (Velp Scientifica, AREX Digital PRO, Monza Brianza, Italy) which allows for a continuous mixing (250 rpm) and a constant solution temperature of 30 °C. The aqueous suspension was intermittently aerated through a fish-tank air pump following the sequence of aeration/reading of 20 min/15 min, in order to supply the oxygen consumed by the biomass during the test. During the reading period, a dissolved oxygen (DO) probe (Mettler Toledo, InPro6000, Optical O2 Sensors, Columbus, OH, USA) measured changes in the DO concentration in the solution. The signals coming from the DO probe were acquired by an automatic data acquisition system (LabView, National Instruments, Austin, TX, USA) that also controls the air pumping system.
The SOUR measure (mg O2 × gTVS−1 × h−1), represents the maximum oxygen consumption rate recorded during the overall experimental test. The SOUR value was calculated by the DO concentration drops measured during the reading cycle, using the following equation and according to the raw DO data analysis proposed by Lasaridi and Stentiford [40]:
|Smax| is the maximum slope of DO consumption expressed in absolute terms (mg O2 × l−1 × h−1) and measured during the experimental period, V is the volume of the aqueous suspension (l), m is the wet mass of the sample (g), TS and TVS are, respectively, the total solids (wet basis) and total volatile solids (dry basis) content expressed in decimal fraction.
The respirometric test was performed over an experimental period of 20 hours and the cumulative oxygen demand (OD20) was also evaluated. The OD20 is calculated (using Excel) as the integral expressed by the subtended area of the O2 consumption curve obtained from the same data used to determine the SOUR index [40].
The biodegradability test was carried out in duplicate for each sample.
2.3. Analytical Methods
Each feedstock and digestate was monitored during the overall experimental period and analytically characterized. TS and TVS content and pH were measured according to standard methods [41]. Total organic carbon (TOC) was obtained as reported in EN ISO 13127 [42], ammonia and VFAs were measured as stated according to APHA [43] and US EPA [44] respectively. C, H, N content were obtained following EN 15407 [45] and Ca, Mg, Na, P and S were measured according to EPA 6010 D [46] and EN 13657 [47]. Finally proteins, lipids, cellulose and carbohydrates were measured in accordance with the European Commission regulations 2009/152/EC [48]. Lignin content was determined with the method proposed by Martillotti et al. (1987) [49].
2.4. Statistical Analysis
In order to verify the agreement between the SOUR and OD20 results, the Welch’s t-test was applied to each of the tested configurations to identify significant differences between the AD statistical populations. The comparison was made in pairs between the input feedstocks (S1 and S2), in the one-stage and two-stage AD processes.
3. Results and Discussion
3.1. Feedstock and Digestate Characterization
In order to provide a detailed description of the media, an analytical characterization of the feedstocks and digestates was carried out. The results are reported in Table 2 in terms of averages and standard deviations.
Based on the above results, the pH values were in the optimal range for the implementation of the AD process. In particular, it can be observed that in the fermentative reactor (S1.2_DF and S2.2_DF) the pH was in the acidic range of 5–6, which is optimal for the development of dark fermentation, according to the literature [12,50,51]. Referring to the methanogenic reactor, pH was measured around neutral values, typical of a conventional digestion process [52].
The analytical characterization of the media suggests a decrease of organic matter content during the AD digestion process. In fact, considering the content of TVS and TOC, it can be seen that these parameters drop during both the digestion and co-digestion processes. The organic matter content will be discussed in more detail in the following section, in terms of biological stability through the assessment of the stability index.
As concerned the macromolecules, carbohydrates were the main element of FW, unlike proteins, which were the main component of WWS. The carbohydrates and proteins contents measured in the feedstocks were lower than other findings in the literature [53,54], which is due to the dilution carried out in this work. Regarding the macromolecules content in the digestates, the results showed a significant reduction, especially for the digestion configuration, due to the degradation of the matrix during the AD process.
Concentrations of light metals, such as calcium, magnesium, sodium, potassium and sulfur are important for the improvement of the DF and AD processes, although considerable contents of these may inhibit the process behavior [55]. Considering the inhibitory threshold of metal ions in the feedstocks, as recorded in previous studies [56,57], the light metals contents of the feedstocks analyzed were measured below these values. In addition, ammonia content is considered another parameter that may inhibit the process. In fact, a high concentration of ammonia (above 1500 mg/L) could cause toxicity to the anaerobic bacteria and therefore inhibit methane production [4]. Several inhibitory thresholds were determined in the literature [58,59]. However, ammonia content of FW and WWS used in this study was found in a range that prevents process inhibition.
The results regarding acids highlight a significant production of VFAs during the dark fermentation phase. This result indicates that a proper hydrolysis process was developed in the fermentative stage with the release of VFAs in the liquid solution [25]. Therefore, VFAs concentration in the DF digestate of the two configurations was significant. A high content of VFAs is also evaluated for the AD digestate related to the digestion process of the sole FW. This result is correlated with the operational condition used to perform the experimental tests. To meet the experimental requirement, comparing the scenarios and ensuring the same conditions, a fixed OLR for the methanogenic reactor was maintained in each configuration. However, this fact determined that the HRT of the methanogenic reactor in a one-stage configuration was not sufficient for completing the degradation process, resulting in high VFAs and organic matter content.
As regards the digestates obtained from the co-digestion process, P2O5, K2O and CaO content of the organic matrices was also measured according to the EU Fertilizer Regulation in order to assess fertilizer and amendment properties. The high concentration of these parameters compared to the limits set by the EU Regulation confirms the optimal fertilizer and amendment characteristics of the digestate.
3.2. Biological Characterization
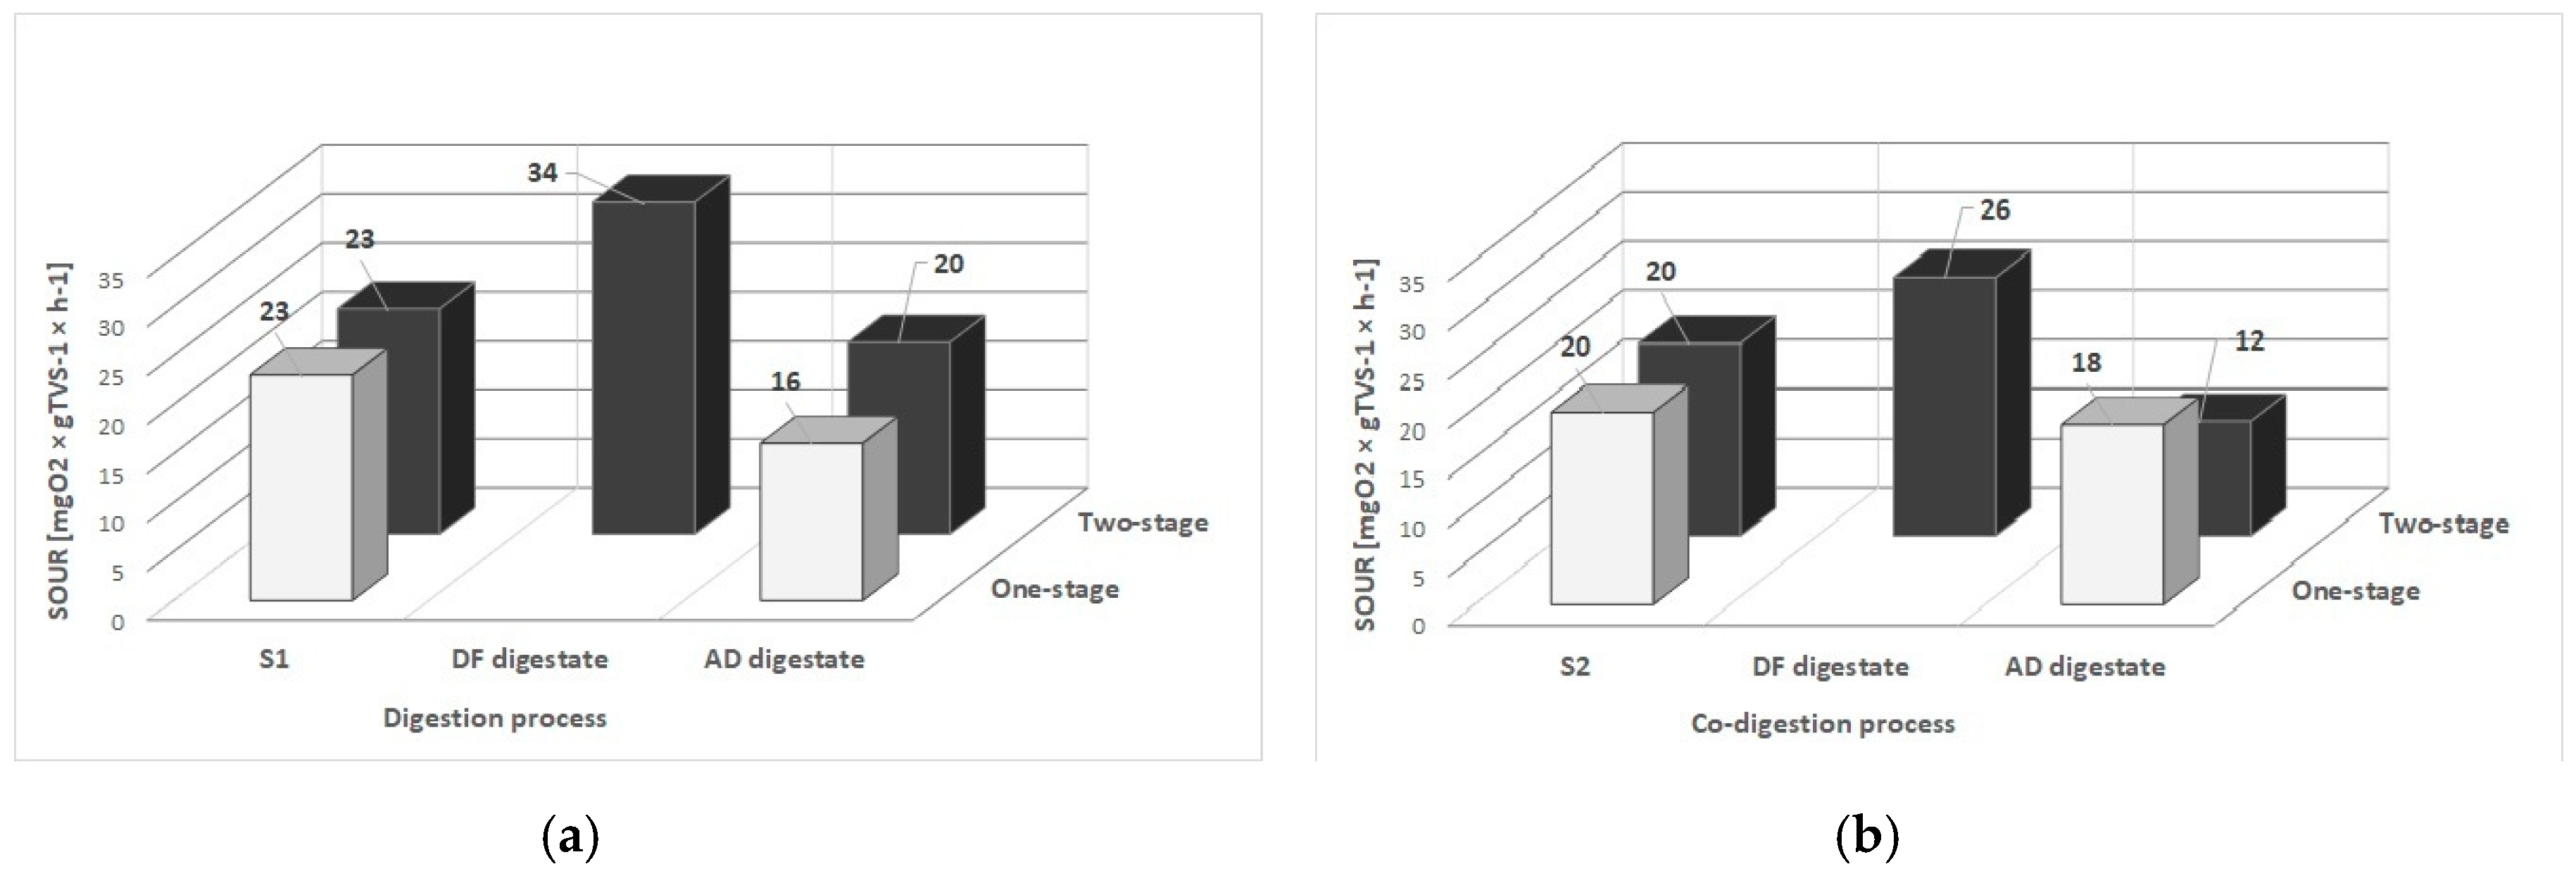
The average results of biological stability obtained by measuring the SOUR and OD20 indexes are reported in Table 3. Figure 2 shows the SOUR indexes in the different steps of the AD configuration analyzed for both the digestion and co-digestion process. The trend of the SOUR index during the different phases of the process indicates the stabilization efficiency of the process through the evaluation of biostabilization parameters. For this reason, the SOUR index was evaluated for each sample collected during the experimental tests.
SOUR values were assessed for the substrates used in the two configurations analyzed, that is, S1 for the digestion of the sole FW and S2 for the co-digestion of FW and WWS. Based on the results presented in Table 3 and Figure 2, the mean SOUR values of these samples were quite similar and equal to 23 ± 13 mgO2 × gTVS−1 × h−1 and 20 ± 1 mgO2 × gTVS−1 × h−1 for S1 and S2 respectively, corresponding to an OD20 index of 252 ± 92 mgO2 × gTVS−1 × 20 h−1 for S1 and 156 ± 28 mgO2 × gTVS−1 × 20 h−1 for S2. As mentioned in the section on feedstock and digestates, S1 was obtained by diluting FW with tap water and S2 with WWS. Since the feeding slurry was to have a TS content of 5% to simulate a wet AD process, in S2, the percentage of FW was less than S1. WWS is an organic matrix already partially biodegraded during the aerobic treatment in the WWTP. Therefore, the organic carbon available within S2 was slightly lower than S1, which resulted in lower SOUR values. These values are consistent with Adani et al. [38] who found SOUR values for organic matrices sampled from a full-scale process of 19 mgO2 × gTVS−1 × h−1. Schievano et al. [36] and Tambone at al. [27] studied different organic raw materials for the AD process obtaining an average range for OD20 values of 30–410 mgO2 × gTS−1 × 20 h−1.
The biological stability test on the collected matrices was assessed when the steady state of the process was reached. S1.1_AD and S2.1_AD represent the digestate take from the methanogenic reactor during one-stage configuration. In both one-stage configurations, the SOUR index decreased for the outcoming digestate to 16 ± 6 mgO2 × gTVS−1 × h−1 and 18 ± 0 mgO2 × gTVS−1 × h−1 respectively for S1.1_AD and S2.1_AD, meaning that biological stabilization improved. The corresponding cumulative oxygen demand values were, respectively, 107 ± 51 mgO2 × gTVS−1 × 20 h−1 and 112 ± 21 mgO2 × gTVS−1 × 20 h−1 in line with the literature amounts [27,33,34].
As concerned the two-stage configuration, the SOUR index was evaluated for both the DF and AD digestates. Regarding the digestate coming from the DF reactor, it can be observed that the stability index decreases and therefore the SOUR values increase. The higher SOUR values obtained for the DF digestates output, equal to 34 ± 11 mgO2 × gTVS−1 × h−1 and 26 ± 4 mgO2 × gTVS−1 × h−1 for S1 and S2 respectively, were related to the greater production of VFAs in the first DF reactor. The complex molecules present in the substrate, such as carbohydrates, proteins and lipids, were degraded in this first stage and reduced to simpler molecules. This preliminary treatment improves the presence of available biodegradable substrate in the DF digestate which reduces the biological stability measured at this intermediate stage with SOUR values of 34 ± 11 mgO2 × gTVS−1 × h−1 and 26 ± 4 mgO2 × gTVS−1 × h−1 respectively for S1.2_DF and S2.2_DF. After the preliminary phase, the DF digestate is turned into the feeding substrate for the AD reactor and the available biodegradable matter is then stabilized by the methanogenic bacteria which result in a reduction of the biological stability index.
Concerning statistical analysis, it can be observed that only in the two-stage co-digestion configuration the SOUR value of the AD digestate is statistically different from other populations. Welch test results confirm that DF in co-digestion introduces a significant modification in terms of process stability. The other populations are not statistically different, as indicated by the same apex letter in Table 3.
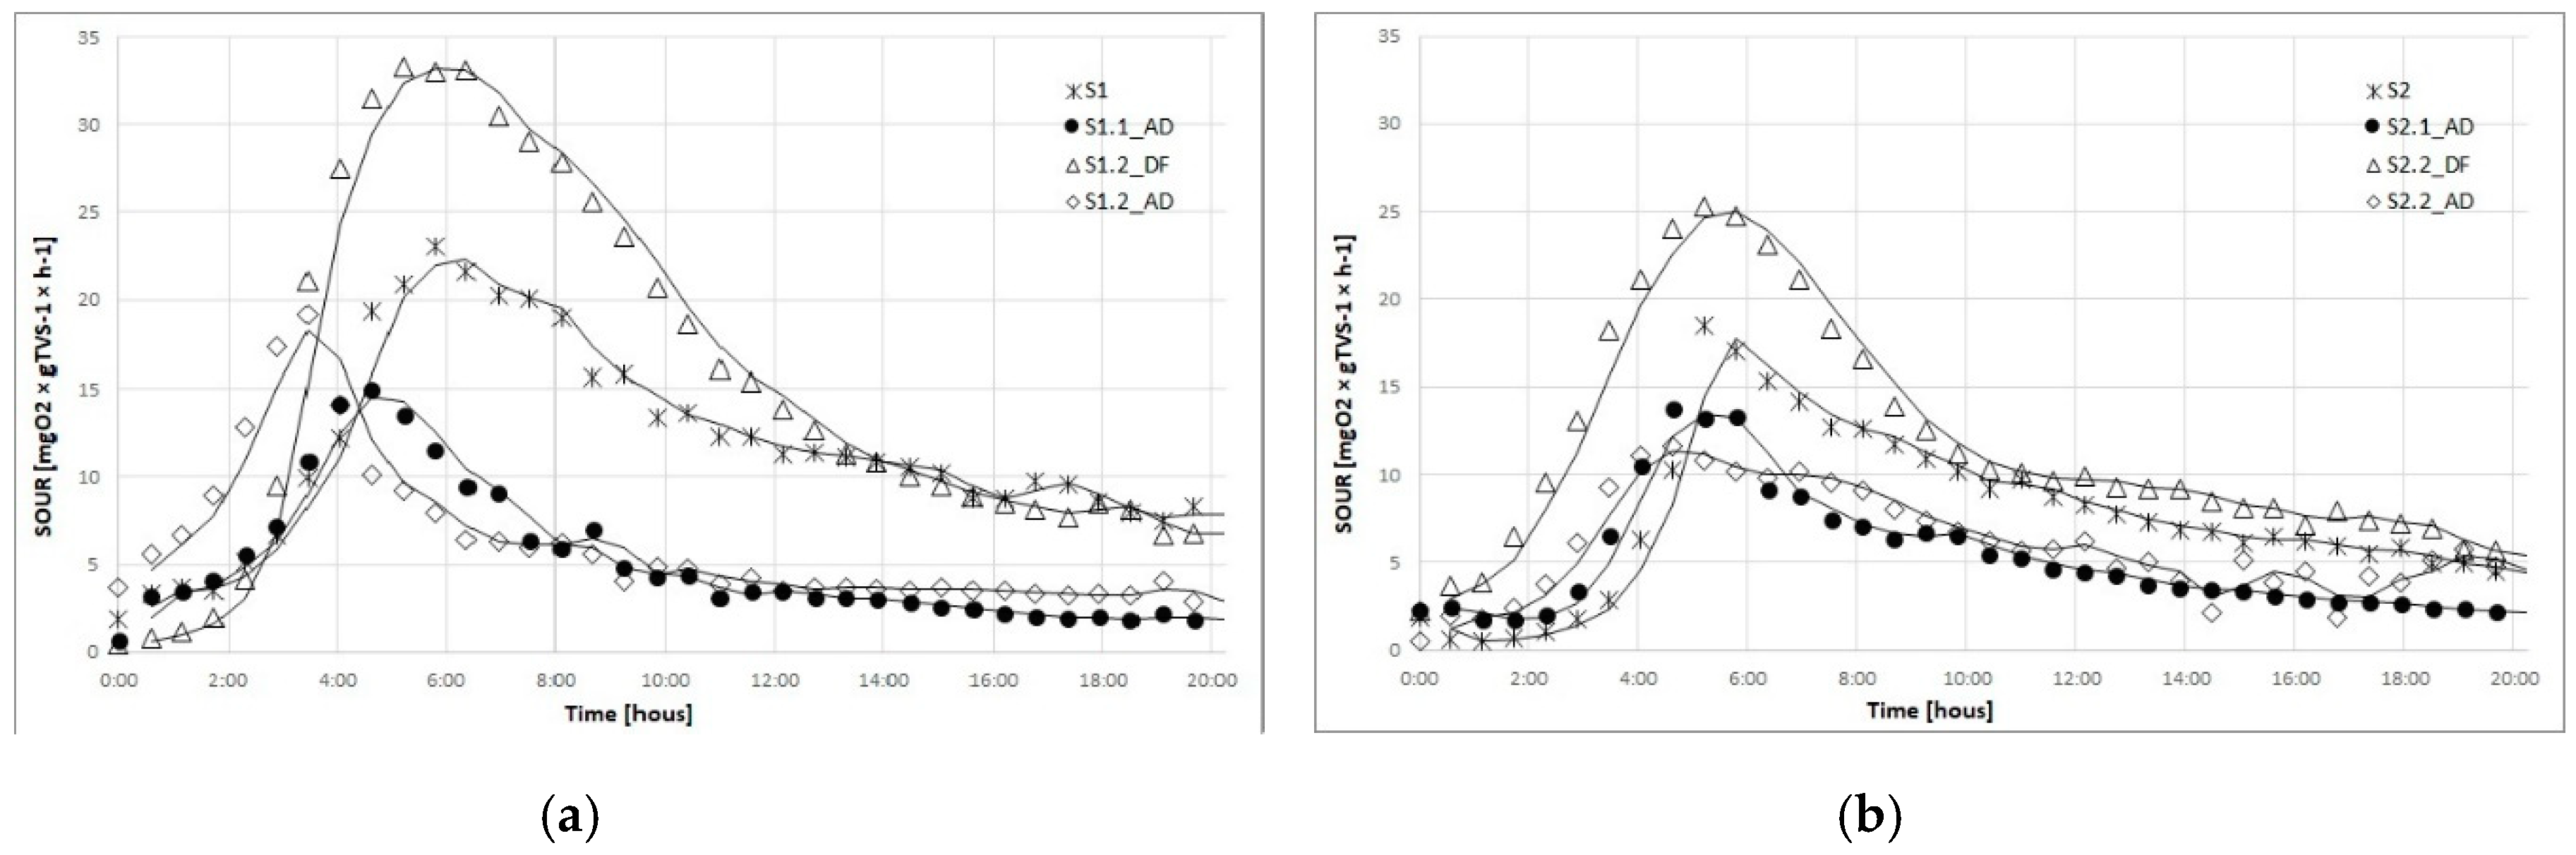
For a better evaluation of the SOUR index behavior during each step of the digestion and co-digestion process, Figure 3 shows the trend of the stability index during the two experimental configurations.
As expected, the maximum rate of oxygen demand (represented by the SOUR value) is achieved within 2 to 8 h of the experiment period. The time required to get to the maximum depends on the stability of the materials, typically characterized by an oxygen demand curve with an initial lag phase and a subsequent exponential increase before reaching the maximum [40]. In Figure 2 it can be observed that microbial respiration for S1.2_DF and S2.2_DF reaches maximum SOUR after rapid exponential growth and has the highest peaks due to the available biodegradable substrate. The other samples show a similar SOUR trend.
3.3. Effect of Dark Fermentation on Digestate Stability
The influence of DF on the AD process by splitting the traditional process into two phases has shown an enhancement in biogas production and methane content. As reported in the study of Baldi et al. [21], an increase in specific gas production in the two-stage digestion and co-digestion process was assessed compared to the traditional AD process. In particular, the specific methane production in the two-stage system improved from 453.1 ± 28.2 NLCH4 × kgTVS−1 × d−1 to 482.1 ± 24.0 NLCH4 × kgTVS−1 × d−1 for the digestion configuration, and from 298.0 ± 24.5 NLCH4 × kgTVS−1 × d−1 to 423.3 ± 30.9 NLCH4 × kgTVS−1 × d−1 for the co-digestion one. Furthermore, an additional hydrogen-rich biogas of about 12.6 ± 5.0 NLH2 × kgTVS−1 × d−1 and 8.6 ± 4.8 NL H2 × kgTVS−1 × d−1 was also produced for the digestion and co-digestion configuration respectively. This improvement in bio-fuel production was mainly due to the increase in the feedstocks hydrolysis during the preliminary DF stage [21,25]. Concerning the assessment of the DF effect on digestate stability, Table 4 shows the process performances expressed in terms of biological stabilization and TVS removal efficiency.
Considering the one-stage system as a reference scenario, stabilization efficiency and TVS removal was assessed for both the digestion and co-digestion process, in order to compare them with the performance obtained with the introduction of DF as a preliminary stage. The stabilization efficiency, which is the estimated decrease of SOUR values in the traditional AD process, is equal to 30.3% and 6.5% for digestion and co-digestion, respectively, with a corresponding TVS removal efficiency of 67.0% and 61.0%.
As concerns the two-stage scenario, process performances were evaluated with reference to the first stage (DF) and the second one (AD). As mentioned above, in the DF stage, a reduction in terms of biological stability was found, due to the increase of the biodegradable matter available in DF digestate, with a resulting increase of SOUR and OD20 values compared to the input feedstock. Based on this, the stabilization efficiency is a negative value of −47.4% and −34.3% for digestion and co-digestion, respectively. Subsequently, the AD process involves the degradation of the residual organic matter content by raising the biostabilization of the digestate.
Table 4 shows the results of the two-stage scenario expressed both in relation to each individual step of the AD process (in bold) and in relation to the overall process. As expected, the results demonstrate a reduction in stabilization efficiency and a slight TVS removal in the first stage. However, the wide availability of readily biodegradable matter in the DF digestate led to better degradation in the subsequent AD stage, with a stabilization efficiency of about 42.2% and 55.8% for the digestion and co-digestion configurations, respectively. The first value corresponds to a TVS removal efficiency of 62.5% and the second to 54.5%. Concerning the overall performance of the two-stage system, the results are 14.8% and 40.6% in terms of biological stabilization for the digestion and co-digestion scenarios. The best performances found in the two-stage co-digestion process compared to the digestion of the sole FW were due to the buffer capacity of the WWS present in S2. In fact, the increase in the system’s buffer capacity guaranteed maintaining the process stability by counteracting the acidification of the media, due to VFAs production and then also determining preferable performances in terms of stabilization efficiency [60,61]. Based on that, the DF stage seems to influence only the co-digestion system, leading to better results in terms of organic matter degradation. However, the partial results suggest that the introduction of DF as a preliminary stage enhances the performances in the methanogenic reactor due to previous hydrolysis of the substrates.
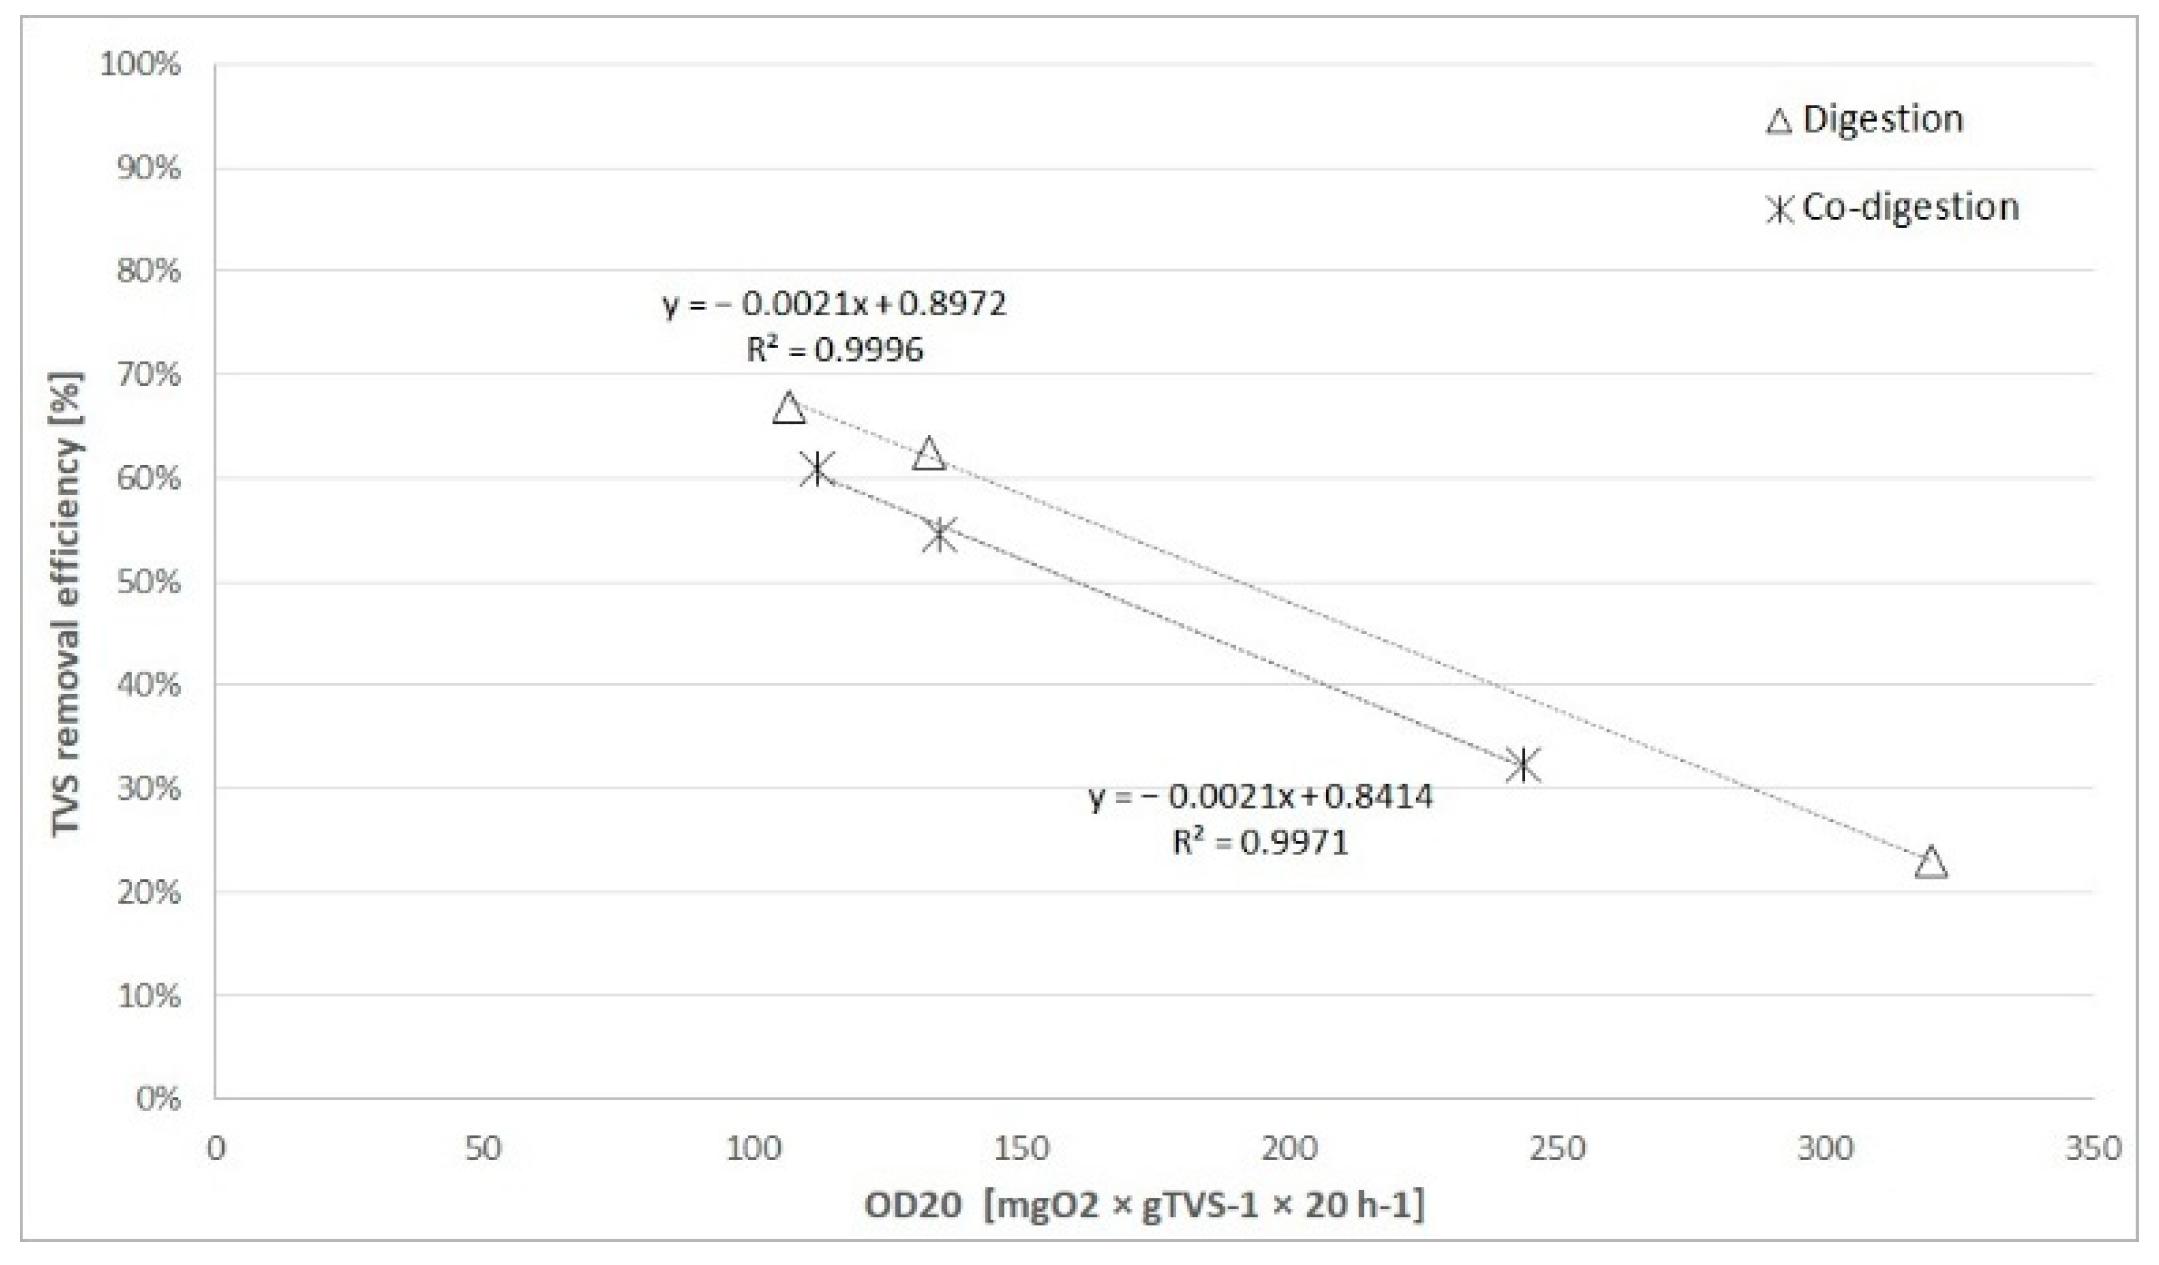
The results concerning the stabilization efficiency were estimated by the SOUR index, which is directly related to the OD20 index. Figure 4 shows the correlation between TVS removal efficiency and OD20 values. The TVS removal efficiency results are linearly correlated with OD20 (r = 0.99) for both the digestion data and the co-digestion one. Since OD20 is the measure of the oxygen consumed by the aerobic microorganism for degrading the organic carbon in a short period of time, high OD20 values correspond to unstable materials that therefore influence the removal efficiency of TVS. The best TVS removal efficiency values were determined for the samples with lower OD20 values and hence, with greater biological stability.
4. Conclusions
The co-digestion of FW and WWS demonstrated the best results in the two-stage configuration in terms of biostabilization efficiency. The introduction of the DF stage improved the biological stability of the output digestate as compared to the traditional one-stage AD process. Concerning the overall two-stage process, results showed a decrease in SOUR and OD20 indices, resulting in a stabilization efficiency of 40.6%, which is higher than the 6.5% efficiency found in the one-stage system. The highest biological stability of the digestate coming from the two-stage configuration was due to the better hydrolysis of the substrates, determined by using DF as a preliminary biological treatment for the traditional AD process. Furthermore, the improvement of the biostabilization efficiency in co-digestion was greater than the configuration with the sole FW as substrate, due to the presence of WWS, which improved the buffer capacity of the system and the stability of the process.
In the two-stage system, the enhancement of the VFAs content in the DF digestate provided a large amount of readily biodegradable matter available for the subsequent AD stage. Concerning the stability improvement, evaluated only in relation to the second stage of the process, it reached an efficiency of 42.2% and 55.8% for the digestion and co-digestion respectively, which is higher than that assessed in the conventional process, with values equal to 30.3% and 6.5%. In conclusion, the two-stage system improved the stabilization of the outgoing AD digestate, thanks to the role of DF as a biological pre-treatment that allows better degradation of the substrate, making it more easily degradable for methanogenic bacteria.
Author Contributions
Conceptualization, E.A. and I.P.; Data curation, I.P.; Formal analysis, I.P.; Funding acquisition, I.P.; Investigation, E.A.; Methodology, E.A. and I.P.; Project administration, I.P. and G.F.; Resources, E.A. and I.P.; Software, E.A. and I.P.; Supervision, G.F.; Validation, E.A., I.P. and G.F.; Visualization, I.P.; Writing—original draft, E.A.; Writing—review and editing, I.P. and G.F.
Funding
This research was carried within the BIO2ENERGY project supported by the MIUR-Regione Toscana DGRT 1208/2012 and MIUR-MISE-Regione Toscana DGRT 758/2013 PAR FAS 2007-2013 in sub-program FAR-FAS 2014 (Linea d’Azione 1.1).
Conflicts of Interest
The authors declare no conflict of interest.
References
- European Commission. Closing the Loop—An EU Action Plan for the Circular Economy. Communication from the Commission to the European Parliament, the Council, the European Economic and Social Committee and the Committee of the Regions; EU: Brussels, Belgium, 2015; Volume 2. [Google Scholar]
- Webster, K. What might we say about a circular economy? Some temptations to avoid if possible. World Future J. Gen. Evol. 2013, 69, 542–554. [Google Scholar] [CrossRef]
- EEA. The Circular Economy and the Bioeconomy Partners in Sustainability; EEA: Copenhagen, Denmark, 2018. [Google Scholar]
- ISPRA—Istituto Superiore per la Protezione e la Ricerca Ambientale. Rapporto Rifiuti Urbani Ed. 2018; ISPRA: Rome, Italy, 2018. [Google Scholar]
- Pecorini, I.; Olivieri, T.; Bacchi, D.; Paradisi, A.; Lombardi, L.; Corti, A.; Carnevale, E. Evaluation of gas production in a industrial anaerobic digester by means of biochemical methane potential of organic municipal solid waste components. In Proceedings of the 25th International Conference on Efficiency, Cost, Optimization and Simulation of Energy Conversion Systems and Processes—ECOS 2012, Houston, TX, USA, 26–29 June 2012; Volume 5, pp. 173–184. [Google Scholar]
- Iacovidou, E.; Ohandja, D.G.; Voulvoulis, N. Food waste co-digestion with sewage sludge—Realising its potential in the UK. J. Environ. Manag. 2012, 112, 267–274. [Google Scholar] [CrossRef] [PubMed]
- Scaglia, B.; Acutis, M.; Adani, F. Precision determination for the dynamic respirometric index (DRI) method used for biological stability evaluation on municipal solid waste and derived products. Waste Manag. 2011, 31, 2–9. [Google Scholar] [CrossRef] [PubMed]
- Nghiem, L.D.; Koch, K.; Bolzonella, D.; Drewes, J.E. Full scale co-digestion of wastewater sludge and food waste: Bottlenecks and possibilities. Renew. Sustain. Energy Rev. 2017, 72, 354–362. [Google Scholar] [CrossRef] [Green Version]
- Baccioli, U.; Ferrari, A.; Pecorini, L.; Marchionni, I.; Susini, A.; Desideri, C. Feasibility analysis of a biogas-fuelled trigeneration plant operating with a mGT. In Proceedings of the 31st International Conference on Efficiency, Cost, Optimization, Simulation and Environmental Impact of Energy Systems, ECOS, Vila Flor Palace, Guimarães, Portugal, 17–22 June 2018; University of Minho: Braga, Portugal, 2018. [Google Scholar]
- Möller, K.; Müller, T. Effects of anaerobic digestion on digestate nutrient availability and crop growth: A review. Eng. Life Sci. 2012, 12, 242–257. [Google Scholar] [CrossRef]
- Cavinato, C.; Bolzonella, D.; Pavan, P.; Fatone, F.; Cecchi, F. Mesophilic and thermophilic anaerobic co-digestion of waste activated sludge and source sorted biowaste in pilot- and full-scale reactors. Renew. Energy 2013, 55, 260–265. [Google Scholar] [CrossRef]
- Chinellato, G.; Cavinato, C.; Bolzonella, D.; Heaven, S.; Banks, C.J. Biohydrogen production from food waste in batch and semi-continuous conditions: Evaluation of a two-phase approach with digestate recirculation for pH control. Int. J. Hydrog. Energy 2013, 38, 4351–4360. [Google Scholar] [CrossRef] [Green Version]
- Micolucci, F.; Gottardo, M.; Bolzonella, D.; Pavan, P. Automatic process control for stable bio-hythane production in two-phase thermophilic anaerobic digestion of food waste. Int. J. Hydrog. Energy 2014, 39, 17563–17572. [Google Scholar] [CrossRef]
- Pecorini, I.; Ferrari, L.; Baldi, F.; Albini, E.; Galoppi, G.; Bacchi, D.; Vizza, F.; Lombardi, L.; Carcasci, C.; Ferrara, G.; et al. Energy recovery from fermentative biohydrogen production of biowaste: A case study based analysis. Energy Procedia 2017, 126, 605–612. [Google Scholar] [CrossRef]
- Liu, D.; Liu, D.; Zeng, R.J.; Angelidaki, I. Hydrogen and methane production from household solid waste in the two-stage fermentation process. Water Res. 2006, 40, 2230–2236. [Google Scholar] [CrossRef]
- De Gioannis, G.; Muntoni, A.; Polettini, A.; Pomi, R. A review of dark fermentative hydrogen production from biodegradable municipal waste fractions. Waste Manag. 2013, 33, 1345–1361. [Google Scholar] [CrossRef] [PubMed]
- Cavinato, C.; Giuliano, A.; Bolzonella, D.; Pavan, P.; Cecchi, F. Bio-hythane production from food waste by dark fermentation coupled with anaerobic digestion process: A long-term pilot scale experience. Int. J. Hydrog. Energy 2012, 37, 11549–11555. [Google Scholar] [CrossRef]
- Cavinato, C.; da Ros, C.; Pavan, P.; Cecchi, F.; Bolzonella, D. Treatment of waste activated sludge together with agro-waste by anaerobic digestion: Focus on effluent quality. Water Sci. Technol. 2014, 69, 525–531. [Google Scholar] [CrossRef] [PubMed]
- Da Ros, C.; Cavinato, C.; Pavan, P.; Bolzonella, D. Winery waste recycling through anaerobic co-digestion with waste activated sludge. Waste Manag. 2014, 34, 2028–2035. [Google Scholar] [CrossRef] [PubMed]
- Xie, S.; Wickham, R.; Nghiem, L.D. Synergistic effect from anaerobic co-digestion of sewage sludge and organic wastes. Int. Biodeterior. Biodegrad. 2017, 116, 191–197. [Google Scholar] [CrossRef]
- Baldi, F.; Pecorini, I.; Iannelli, R. Comparison of single-stage and two-stage anaerobic co-digestion of food waste and activated sludge for hydrogen and methane production. Renew. Energy 2019, 143, 1755–1765. [Google Scholar] [CrossRef]
- Lee, D.Y.; Ebie, Y.; Xu, K.Q.; Li, Y.Y.; Inamori, Y. Continuous H2 and CH4 production from high-solid food waste in the two-stage thermophilic fermentation process with the recirculation of digester sludge. Bioresour. Technol. 2010, 101, S42–S47. [Google Scholar] [CrossRef] [PubMed]
- Luo, G.; Xie, L.; Zhou, Q.; Angelidaki, I. Enhancement of bioenergy production from organic wastes by two-stage anaerobic hydrogen and methane production process. Bioresour. Technol. 2011, 102, 8700–8706. [Google Scholar] [CrossRef] [PubMed] [Green Version]
- Voelklein, M.A.; Jacob, A.; Shea, R.O.; Murphy, J.D. Assessment of increasing loading rate on two-stage digestion of food waste. Bioresour. Technol. 2016, 202, 172–180. [Google Scholar] [CrossRef] [PubMed]
- de Gioannis, G.; Muntoni, A.; Polettini, A.; Pomi, R.; Spiga, D. Energy recovery from one- and two-stage anaerobic digestion of food waste. Waste Manag. 2017, 68, 595–602. [Google Scholar] [CrossRef]
- European Commission. Circular Economy Package. Proposal for a Regulation of the European Parliament and of the Council Laying down Rules on the Making Available on the Market of CE Marked Fertilising Products and Amending Regulations (EC) No 1069/2009 and (EC) No 1107/2009; European Commission: Brussels, Belgium, 2016; Volume 1069, pp. 1–74. [Google Scholar]
- Tambone, F.; Genevini, P.; D’Imporzano, G.; Adani, F. Assessing amendment properties of digestate by studying the organic matter composition and the degree of biological stability during the anaerobic digestion of the organic fraction of MSW. Bioresour. Technol. 2009, 100, 3140–3142. [Google Scholar] [CrossRef]
- Orzi, V.; Cadena, E.; D’Imporzano, G.; Artola, A.; Davoli, E.; Crivelli, M.; Adani, F. Bioresource Technology Potential odour emission measurement in organic fraction of municipal solid waste during anaerobic digestion: Relationship with process and biological stability parameters. Bioresour. Technol. 2010, 101, 7330–7337. [Google Scholar] [CrossRef] [PubMed]
- Cabañas-Vargas, D.D.; Sánchez-Monedero, M.A.; Urpilainen, S.T.; Kamilaki, A.; Stentiford, E.I. Assessing the stability and maturity of compost at large-scale plants. Ingeniería 2005, 9, 25–30. [Google Scholar]
- Adani, F.; Lozzi, P.; Genevini, P. Determination of Biological Stability by Oxygen Uptake on Municipal Solid Waste and Derived Products. Compost Sci. Util. 2001, 9, 163–178. [Google Scholar] [CrossRef]
- Giraldi, D.; Iannelli, R. Measurements of water content distribution in vertical subsurface flow constructed wetlands using a capacitance probe: Benefits and limitations. Desalination 2009, 243, 182–194. [Google Scholar] [CrossRef]
- Scaglia, B.; Erriquens, F.G.; Gigliotti, G.; Taccari, M. Precision determination for the specific oxygen uptake rate (SOUR) method used for biological stability evaluation of compost and biostabilized products. Bioresour. Technol. 2007, 98, 706–713. [Google Scholar] [CrossRef] [PubMed]
- Tambone, F.; Scaglia, B.; D’Imporzano, G.; Schievano, A.; Orzi, V.; Salati, S.; Adani, F. Assessing amendment and fertilizing properties of digestates from anaerobic digestion through a comparative study with digested sludge and compost. Chemosphere 2010, 81, 577–583. [Google Scholar] [CrossRef]
- Scaglia, B.; D’Imporzano, G.; Garuti, G.; Negri, M.; Adani, F. Sanitation ability of anaerobic digestion performed at different temperature on sewage sludge. Sci. Total Environ. 2014, 466–467, 888–897. [Google Scholar] [CrossRef] [PubMed]
- Tambone, F.; Orzi, V.; Zilio, M.; Adani, F. Measuring the organic amendment properties of the liquid fraction of digestate. Waste Manag. 2019, 88, 21–27. [Google Scholar] [CrossRef] [PubMed]
- Schievano, A.; Scaglia, B.; D’Imporzano, G.; Malagutti, L.; Gozzi, A.; Adani, F. Prediction of biogas potentials using quick laboratory analyses: Upgrading previous models for application to heterogeneous organic matrices. Bioresour. Technol. 2009, 100, 5777–5782. [Google Scholar] [CrossRef] [PubMed]
- Lasaridi, K.E.; Stentiford, E.I. Respirometric Techniques in the Context of Compost Stability Assessment:Principles and Practice. In The Science of Composting; Springer: Dordrecht, The Netherlands, 1996; pp. 274–285. [Google Scholar]
- Adani, F.; Gigliotti, G.; Valentini, F.; Laraia, R. Respiration Index Determination: A Comparative Study of Different Methods. Compost Sci. Util. 2003, 11, 144–151. [Google Scholar] [CrossRef]
- APHA (American Public Health Association); AWWA (American Water Works Association); WEF (Water Environment Federation). 5210 biochemical oxygen demand (Bod). Stand. Methods Exam. Water Wastewater 2001, 5000, 2–13. [Google Scholar]
- Lasaridi, K.E.; Stentiford, E.I. A simple respirometric technique for assessing compost stability. Water Res. 1998, 32, 3717–3723. [Google Scholar] [CrossRef]
- APHA. American Public Health Association. Standard Methods for the Examination of Water and Wastewater, 18th ed.; APHA: Washington, DC, USA, 2006. [Google Scholar]
- EN ISO 13137. EN ISO 13137:2002 Characterization of Waste—Determination of Total Organic Carbon (TOC) in Waste, Sludges and Sediments; EN: Brussels, Belgium, 2002. [Google Scholar]
- APHA—American Public Health Association. APHA 4500 NH3 B/C—Ammonia-Selective Electrode Method; APHA: Washington, DC, USA, 2012. [Google Scholar]
- US EPA. Method 8315A (SW-846): Determination of Carbonyl Compounds by High Performance Liquid Chromatography (HPLC), Revision 1; US EPA: Washington, DC, USA, 1996. [Google Scholar]
- EN 15407. EN 15407:2011 Solid Recovered Fuels—Methods for the Determination of Carbon (C), Hydrogen (H) and Nitrogen (N) Content; EN: Brussels, Belgium, 2011. [Google Scholar]
- EPA 6010 D. Inductively Coupled Plasma—Optical Emission Spectrometry; EPA: Washington, DC, USA, 2014. [Google Scholar]
- EN 13657. EN 13657:2004 Characterization of Waste—Digestion for Subsequent Determination of Aqua Regia Soluble Portion of Elements; EN: Brussels, Belgium, 2004. [Google Scholar]
- European Commission. European Commission Regulation 2009/152/EC of 27 January 2009 Laying Down the Methods of Sampling and Analysis for the Official Control of Feed. J. Eur. Union 2009, 1–54. Available online: https: //publications.europa.eu/en/publication-detail/-/publication/72709682-c5e2-42a4-948d-1877344bb582/language-en (accessed on 17 September 2019).
- Martillotti, F.; Antongiovanni, M.; Rizzi, L.; Santi, E.; Bittante, G. Metodi di Analisi per gli Alimenti D’impiego Zootecnico; Quaderni metodologici n. 8 ; CNR-IPRA: Rome, Italy, 1987. [Google Scholar]
- Favaro, L.; Alibardi, L.; Lavagnolo, M.C.; Casella, S.; Basaglia, M. Effects of inoculum and indigenous microflora on hydrogen production from the organic fraction of municipal solid waste. Int. J. Hydrog. Energy 2013, 38, 11774–11779. [Google Scholar] [CrossRef]
- Alibardi, L.; Cossu, R. Composition variability of the organic fraction of municipal solid waste and effects on hydrogen and methane production potentials. Waste Manag. 2015, 36, 147–155. [Google Scholar] [CrossRef] [PubMed]
- APAT. Agenzia per la Protezione Dell’ambiente, and e per i servizi Tecnici. Digestione Anaerobica Della Frazione Organica dei Rifiuti Solidi—Manuali e Linee Guida 13/2005; APAT: Hyderabad, India, 2005. [Google Scholar]
- Yeshanew, M.M.; Frunzo, L.; Pirozzi, F.; Lens, P.N.L.; Esposito, G. Production of biohythane from food waste via an integrated system of continuously stirred tank and anaerobic fixed bed reactors. Bioresour. Technol. 2016, 220, 312–322. [Google Scholar] [CrossRef] [PubMed] [Green Version]
- Chu, C.F.; Li, Y.Y.; Xu, K.Q.; Ebie, Y.; Inamori, Y.; Kong, H.N. A pH- and temperature-phased two-stage process for hydrogen and methane production from food waste. Int. J. Hydrog. Energy 2008, 33, 4739–4746. [Google Scholar] [CrossRef]
- Bundhoo, M.A.Z.; Mohee, R. Inhibition of dark fermentative bio-hydrogen production: A review. Int. J. Hydrog. Energy 2016, 41, 6713–6733. [Google Scholar] [CrossRef]
- Elbeshbishy, E.; Dhar, B.R.; Nakhla, G.; Lee, H. A critical review on inhibition of dark biohydrogen fermentation. Renew. Sustain. Energy Rev. 2017, 79, 656–668. [Google Scholar] [CrossRef]
- Srikanth, S.; Mohan, S.V. Regulatory function of divalent cations in controlling the acidogenic biohydrogen production process. RSC Adv. 2012, 2, 6576–6589. [Google Scholar] [CrossRef]
- Sterling, M.C., Jr.; Lacey, R.E.; Engler, C.R.; Ricke, S.C. Effects of ammonia nitrogen on H 2 and CH 4 production during anaerobic digestion of dairy cattle manure. Bioresour. Technol. 2001, 77, 9–18. [Google Scholar] [CrossRef]
- Salerno, M.B.; Park, W.; Zuo, Y.; Logan, B.E. Inhibition of biohydrogen production by ammonia. Water Res. 2006, 40, 1167–1172. [Google Scholar] [CrossRef] [PubMed]
- Polizzi, C.; Alatriste-mondragón, F.; Munz, G. The role of organic load and ammonia inhibition in anaerobic digestion of tannery fl eshing. Water Resour. Ind. 2018, 19, 25–34. [Google Scholar] [CrossRef]
- Rajagopal, R.; Massé, D.I.; Singh, G. Bioresource Technology A critical review on inhibition of anaerobic digestion process by excess ammonia. Bioresour. Technol. 2013, 143, 632–641. [Google Scholar] [CrossRef] [PubMed]
Figure 1.
Schematic representation of experimental set-up.

Figure 2.
Stability index trend during one-stage and two-stage AD systems. Digestion process (a) and Co-digestion process (b) are reported.
Figure 2.
Stability index trend during one-stage and two-stage AD systems. Digestion process (a) and Co-digestion process (b) are reported.

Figure 3.
SOUR trend during the two configurations studied: digestion process (a) and co-digestion process (b).
Figure 3.
SOUR trend during the two configurations studied: digestion process (a) and co-digestion process (b).

Figure 4.
Correlation between OD20 and TVS removal efficiency for the digestion and co-digestion process.
Figure 4.
Correlation between OD20 and TVS removal efficiency for the digestion and co-digestion process.


Table 1.
Feedstocks and digestates samples studied. Process time depends on the operational condition, which is based on maintaining an organic loading rate (OLR) in the anaerobic digestion (AD) reactor, equal to 2.5 kgTVS/m3 × d, as defined in the study of Baldi et al. [21].
Table 1.
Feedstocks and digestates samples studied. Process time depends on the operational condition, which is based on maintaining an organic loading rate (OLR) in the anaerobic digestion (AD) reactor, equal to 2.5 kgTVS/m3 × d, as defined in the study of Baldi et al. [21].
| Process | Origins | Digestion (FW) | Co-Digestion (FW + WWS) | ||
|---|---|---|---|---|---|
| Sample | Process Time (days) | Sample | Process Time (days) | ||
| - | Substrate | S1 | 0 | S2 | 0 |
| One-stage | AD digestate | S1.1_AD | 17 | S2.1_AD | 17 |
| Two-stage | DF digestate | S1.2_DF | 3 | S2.2_DF | 3 |
| AD digestate | S1.2_AD | 12.8 | S2.2_AD | 11.9 | |
Table 2.
Feedstocks and digestates characterization. Averages and standard deviations are presented (n = 2).
Table 2.
Feedstocks and digestates characterization. Averages and standard deviations are presented (n = 2).
| Parameters | FW | WWS | S1.1_AD | S1.2_DF | S1.2_AD | S2.1_AD | S2.2_DF | S2.2_AD |
|---|---|---|---|---|---|---|---|---|
| pH | 3.80 ± 0.00 | 7.10 ± 0.00 | 6.04 ± 0.30 | 5.22 ± 0.26 | 7.61 ± 0.38 | 7.30 ± 0.37 | 5.84 ± 0.29 | 7.29 ± 0.36 |
| TS (% w/w) | 12.75 ± 10.11 | 2.10 ± 0.20 | 4.00 ± 1.00 | 4.00 ± 1.00 | 2.00 ± 1.00 | 2.00 ± 1.00 | 4.00 ± 1.00 | 2.00 ± 1.00 |
| TVS (% w/w) | 10.93 ± 7.78 | 1.56 ± 0.40 | 1.10 ± 0.10 | 0.80 ± 0.10 | 0.70 ± 0.10 | 0.60 ± 0.10 | 1.00 ± 0.10 | 0.90 ± 0.10 |
| TOC (%C w/w) | 5.95 ± 5.73 | 1.20 ± 0.20 | 1.90 ± 0.29 | 1.67 ± 0.25 | 0.67 ± 0.10 | 0.70 ± 0.20 | 1.60 ± 0.20 | 0.60 ± 0.20 |
| Ammonia (mgN/L) | 580 ± 550 | 341 ± 47 | 763 ± 110 | 540 ± 81 | 1429 ± 210 | 783 ± 78 | 404 ± 40 | 721 ± 72 |
| Acetic acid (mg/Kg) | 1639 ± 963 | 830 ± 120 | < 25 | 2429 ± 364 | < 25 | < 25 | < 2 5 | 145 ± 25 |
| Propionic acid (mg/Kg) | < 40 | 390 ± 71 | 499 ± 76 | 1371 ± 204 | < 25 | < 25 | 210 ± 31 | 118 ± 25 |
| Butyric acid (mg/Kg) | - | - | 98 ± 15 | 2846 ± 440 | < 25 | < 25 | 625 ± 93 | < 25 |
| Valeric acid (mg/Kg) | - | - | 925 ± 140 | 3251 ± 480 | < 25 | < 25 | 1043 ± 160 | < 25 |
| C (% TS) | 40.20 ± 5.94 | 58.90 ± 4.30 | 46.60 ± 7.00 | 48.00 ± 7.20 | 37.30 ± 5.60 | 35.00 ± 5.10 | 40.75 ± 6.25 | 28.00 ± 4.50 |
| H (% TS) | 6.65 ± 1.20 | 6.40 ± 0.50 | 6.90 ± 1.00 | 7.40 ± 1.10 | 5.25 ± 0.79 | 4.50 ± 0.50 | 5.50 ± 0.75 | 3.5 ± 0.50 |
| N (% TS) | 3.15 ± 0.35 | 7.50 ± 0.90 | 4.44 ± 0.67 | 4.80 ± 0.72 | 10.90 ± 1.60 | 9.00 ± 1.00 | 4.75 ± 0.50 | 3.50 ± 0.50 |
| C: N | 12.74 ± 0.46 | 7.85 ± 1.31 | 10.00 ± 1.50 | 10.00 ± 1.50 | 3.00 ± 0.45 | 4.00 ± 0.60 | 9.00 ± 1.40 | 9.00 ± 1.40 |
| Ca (mg/L) | 2660 ± 2,178 | 703 ± 85 | 729 ± 100 | 773 ± 100 | 591 ± 100 | 415 ± 100 | 631 ± 100 | 557 ± 100 |
| Mg (mg/L) | 378 ± 299 | 109 ± 25 | 100 | 103 ± 100 | 115 ± 100 | 109 ± 100 | 133 ± 100 | 153 ± 100 |
| Na (mg/L) | 945 ± 559 | 121 ± 27 | 3087 ± 250 | 1224 ± 100 | 923 ± 100 | 417 ± 100 | 1500 ± 230 | 1718 ± 260 |
| P (mg/L) | 383 ± 180 | 84 ± 21 | 147 ± 22 | 193 ± 28 | 200 ± 30 | 119 ± 17 | 155 ± 23 | 158 ± 23 |
| S (mg/L) | 191 ± 90 | 189 ± 86 | 90 ± 50 | 81 ± 50 | 67 ± 50 | 141 ± 50 | 100 ± 50 | 214 ± 50 |
| Proteins (% w/w) | 2.45 ± 2.05 | 0.90 ± 0.10 | 0.80 ± 0.10 | 0.70 ± 0.10 | 0.30 ± 0.10 | 0.70 ± 0.10 | 1.00 ± 0.20 | 1.00 ± 0.20 |
| Lipids (% w/w) | 2.10 ± 2.55 | 0.30 | 0.19 ± 0.02 | 0.43 ± 0.07 | 0.04 ± 0.01 | 0.01 ± 0.01 | 0.17 ± 0.03 | 0.03 ± 0.01 |
| Carbohydrates (% w/w) | 4.70 ± 3.82 | 0.10 | 1.10 ± 0.10 | 1.30 ± 0.20 | 0.30 ± 0.10 | 0.10 ± 0.10 | 0.90 ± 0.10 | 0.10 ± 0.10 |
| Cellulose (% w/w) | 2.25 ± 1.06 | 0.10 ± 0.00 | 0.30 ± 0.03 | 0.50 ± 0.10 | < 0.10 | 0.10 ± 0.10 | 0.30 ± 0.10 | 0.10 |
| Lignin (% w/w) | 2.60 3.25 | 0.30 ± 0.00 | 0.30 ± 0.10 | 0.30 ± 0.10 | 0.10 ± 0.10 | 0.30 ± 0.10 | 0.50 ± 0.10 | 0.60 ± 0.10 |
Table 3.
Specific oxygen uptake rate (SOUR) and OD20 indexes. Results are reported as averages and standard deviation (n = 2). The apex letters indicate the result of the statistical analysis performed with Welch t-test (values are not statistically different when p > 0.05). The same letters indicate that the populations are not statistically different.
| Digestion (FW) | |||
| Process | Sample | SOUR [mg O2 × gTVS−1 × h−1] | OD20 [mg O2 × gTVS−1 × 20 h−1] |
| - | S1 | 23 ± 13 a | 252 ± 92 c |
| One-stage | S1.1_AD | 16 ± 6 a | 107 ± 51 c |
| Two-stage | S1.2_DF | 34 ± 11 | 320 ± 77 |
| S1.2_AD | 20 ± 5 a | 133 ± 59 c | |
| Co-Digestion (FW + WWS) | |||
| Process | Sample | SOUR [mg O2 × gTVS−1 × h−1] | OD20 [mg O2 × gTVS−1 × 20 h−1] |
| - | S2 | 20 ± 1 a | 156 ± 28 c |
| One-stage | S2.1_AD | 18 ± 0 a | 112 ± 21 c |
| Two-stage | S2.2_DF | 26 ± 4 | 244 ± 25 |
| S2.2_AD | 12 ± 0 b | 135 ± 12 c | |
Table 4.
Process efficiency expressed in terms of biological stabilization and total volatile solids (TVS) removal.
Table 4.
Process efficiency expressed in terms of biological stabilization and total volatile solids (TVS) removal.
| Process | Stage | Digestion (FW) | Co-Digestion (FW + WWS) | ||
|---|---|---|---|---|---|
| Stabilization (%) | TVS Removal (%) | Stabilization (%) | TVS Removal (%) | ||
| One-stage | AD | 30.3 | 67.0 | 6.5 | 61.0 |
| Two-stage | DF | −47.4 | 23.0 | −34.3 | 32.3 |
| AD | 42.2 | 62.5 | 55.8 | 54.5 | |
| DF + AD | 14.8 | 69.4 | 40.6 | 71.5 | |
© 2019 by the authors. Licensee MDPI, Basel, Switzerland. This article is an open access article distributed under the terms and conditions of the Creative Commons Attribution (CC BY) license (http://creativecommons.org/licenses/by/4.0/).
Share and Cite
MDPI and ACS Style
Albini, E.; Pecorini, I.; Ferrara, G. Improvement of Digestate Stability Using Dark Fermentation and Anaerobic Digestion Processes. Energies 2019, 12, 3552. https://0-doi-org.brum.beds.ac.uk/10.3390/en12183552
AMA Style
Albini E, Pecorini I, Ferrara G. Improvement of Digestate Stability Using Dark Fermentation and Anaerobic Digestion Processes. Energies. 2019; 12(18):3552. https://0-doi-org.brum.beds.ac.uk/10.3390/en12183552
Chicago/Turabian StyleAlbini, Elena, Isabella Pecorini, and Giovanni Ferrara. 2019. "Improvement of Digestate Stability Using Dark Fermentation and Anaerobic Digestion Processes" Energies 12, no. 18: 3552. https://0-doi-org.brum.beds.ac.uk/10.3390/en12183552
Note that from the first issue of 2016, this journal uses article numbers instead of page numbers. See further details here.