1. Introduction
Since they were first reported as a promising novel photovoltaic (PV) technology [
1], the perovskite solar cells (PSCs) showed impressive technological growth, especially concerning the improvement of photoconversion efficiency. Thanks to their remarkable versatility, the possibility to tune the energy band gap, and the opportunity to make tandem solar devices with other photovoltaic technologies (e.g., silicon-based solar cells, copper indium gallium selenide -CIGS- solar cells), PSCs gained a leading role among the last generation photovoltaics. Recently, they broke a new laboratory photoconversion efficiency record by reaching 25.2% photoconversion efficiency [
2]. This value overcomes those recorded for thin-film PV, as well as the record obtained by multi-crystalline silicon solar cells [
3].
The technology development of PSC has already led to the fabrication of some perovskite solar module (PSM) prototypes [
4,
5,
6,
7,
8]. Nowadays, the industrialization and commercialization phase of these devices is at the center of the scientific debate [
9,
10,
11].
However, for a final mass production of this innovative technology, several limitations must be overcome in the next future [
12]. Researchers must increase the stability of some chemical compound used in the cell [
13,
14], improve the scalability of manufacturing processes and techniques [
15,
16], and reach adequate environmental performances [
17,
18,
19,
20]. Concerning the last issue and in order to assess the sustainability of the devices based on PSCs, it is pivotal to investigate the environmental hotspots of their potential industrial production, which is already at an early-stage development [
21,
22]. One of the most powerful methods available to perform environmental sustainability assessment is provided by the life cycle assessment (LCA), as recommended by the European Commission [
23,
24]. The LCA analytical approach allows an outlining of the environmental profile of products, processes, or services across all life cycle stages, modeling its interaction with the environment and considering all steps from raw material extraction to the end-of-life (EoL) phase [
25]. PSCs should undergo such environmental evaluation to be classified as a sustainable technology. A fair number of LCA studies on PSCs have been published in the scientific literature to date [
26,
27,
28,
29,
30,
31,
32,
33].
The reported results vary consistently depending on the methodological choices and assumptions made by authors, thus generating confusion about the environmental consequences connected with the implementation of PSC technology. In this context, the usefulness of LCA in informing the stakeholders and/or in supporting the scientific community in the development of PCS technology toward environmental sustainability is limited.
The primary goal of this study was to perform a critical review and an in-depth harmonization of LCA studies on PSCs available in the literature. The objective was to align the methodological approaches, the LCI datasets, and the LCIA methods, as well as to highlight the environmental hotspots of PSC production processes.
2. Methodological Approach of This Study
The LCA is a standardized methodology suitable for assessing the environmental performance of a product, a process, or an activity. Furthermore, it can be managed as a systematic analysis performed to determine and quantify all the resources used (input flows of raw materials, energy, water, etc.) during the whole life cycle of a product, process, service, or supply chain useful to evaluate the potential environmental impacts caused by consumption, emissions, and waste generation (output flows). The LCA approach is important to identify opportunities for improvement of the eco-profile of the investigated system. This representation, usually defined as the cradle-to-grave approach, represents the more extended and beneficial approach that can be implemented for a complete LCA. Other options are the cradle-to-gate or the gate-to-gate approaches that can be set up depending on the focus of the.
According to the guidelines provided by the ISO 14040 family standards [
34,
35], the LCA analysis is divided into four phases: Goal and scope definition, life cycle inventory (LCI) analysis, life cycle impact assessment (LCIA), and interpretation of results. Throughout the first phase the system model is defined, specifying the methodological elements (system boundaries, quality of data, functional unit, cut-off criteria, etc.) which refer all input and output flows. The second phase outlines each product system by quantifying all the input and output flows for each stage in the life cycle. The impact assessment phase quantifies the relative magnitude of the system’ impact from an environmental point of view. Finally, in the interpretation phase, recommendations and conclusion are outlined based on the scientific findings to support the overall improvement of the system.
As previously described, we performed the harmonization of LCI datasets and LCIA methods reported in the literature. In fact, the massive amount of different results and findings already published in the literature do not allow for an exhaustive assessment of the environmental footprint associated with the numerous PSC configurations. In this context, the present paper focused on the harmonization of previous LCA studies, aiming at establishing a homogenized methodological framework. This allowed for a consistent comparison of results obtained by different studies and the definition of baseline information useful for the development of new LCA analyses on PSCs.
Among all the LCA studies of PSC published in literature so far, we limited ourselves to studies on the single junction PSC and did not consider papers dealing with PSC/silicon solar cells. As a further criterion to collect high-quality information, we decided to select only the studies reporting detailed model systems and complete life cycle inventories (i.e., raw materials and energy input and output flows) of the manufacturing process of the cell [
26,
27,
28,
29,
30,
31]. The selected studies and the related PSC configurations investigated therein are reported in
Table 1.
A careful inspection of the six papers reported in
Table 1 allowed to us point out the high degree of diversity of the LCI datasets. This is mainly due to the variety of PSC configurations and fabrication processes which have been proposed during recent years. Indeed, the early development stage of PSC technology has led to the development of a multitude of cell components, structures, and manufacturing procedures that, in turn, determine a large number of combinations. Therefore, as LCI datasets available in the literature are referred to the lab-scale fabrication of different cell configurations, they show a wide variability in featuring energy and material input and output flows, both in terms of type and quantity of employed materials.
The harmonization procedure focused on the rebuilding of the LCIs reported in the studies listed in
Table 1 and on the alignment and update of the environmental footprint evaluation. Each input and output flow was recreated with an updated version of the LCA database and all the environmental profiles were recalculated with the most updated version of the LCIA method defined by the Joint Research Centre—European Commission, namely the ILCD 2011 method [
36]. The latter has been developed based on a detailed examination of several LCIA methods, models, and indicators and is now widely recommended for the environmental footprint calculation of systems located in the European area.
All calculations were performed with the SimaPro software version 8.5.2 [
37], and the main database used for gathering secondary data and average information was the Ecoinvent version 3.4 [
38].
In order to harmonize all the datasets, the different assumptions concerning the LCI building phase implemented in the selected LCA studies were modified and aligned as follows:
All the manufacturing processes were considered to take place in the same geographical context. Thus, all the input and output flows were deemed to be located in the European area.
All secondary data were taken from the Ecoinvent database, employing average European production flows as the primary selection criterion. When such averages were missing and the Ecoinvent production flows referred only to specific European manufacturing procedures, global average production flows were chosen.
Product system models built for raw materials that are involved in all the PSCs’ LCI (such as fluorine-doped tin oxide (FTO) glass) are the same for all the configurations.
When some specific data and information concerning a product were missing (such as for the Spiro-MeOTAD compound in the study by Alberola-Borràs et al.), we modelled meta-datasets which were calculated as the average of the same product system models employed in the LCIs of the other studies.
3. Harmonization of the Selected Studies
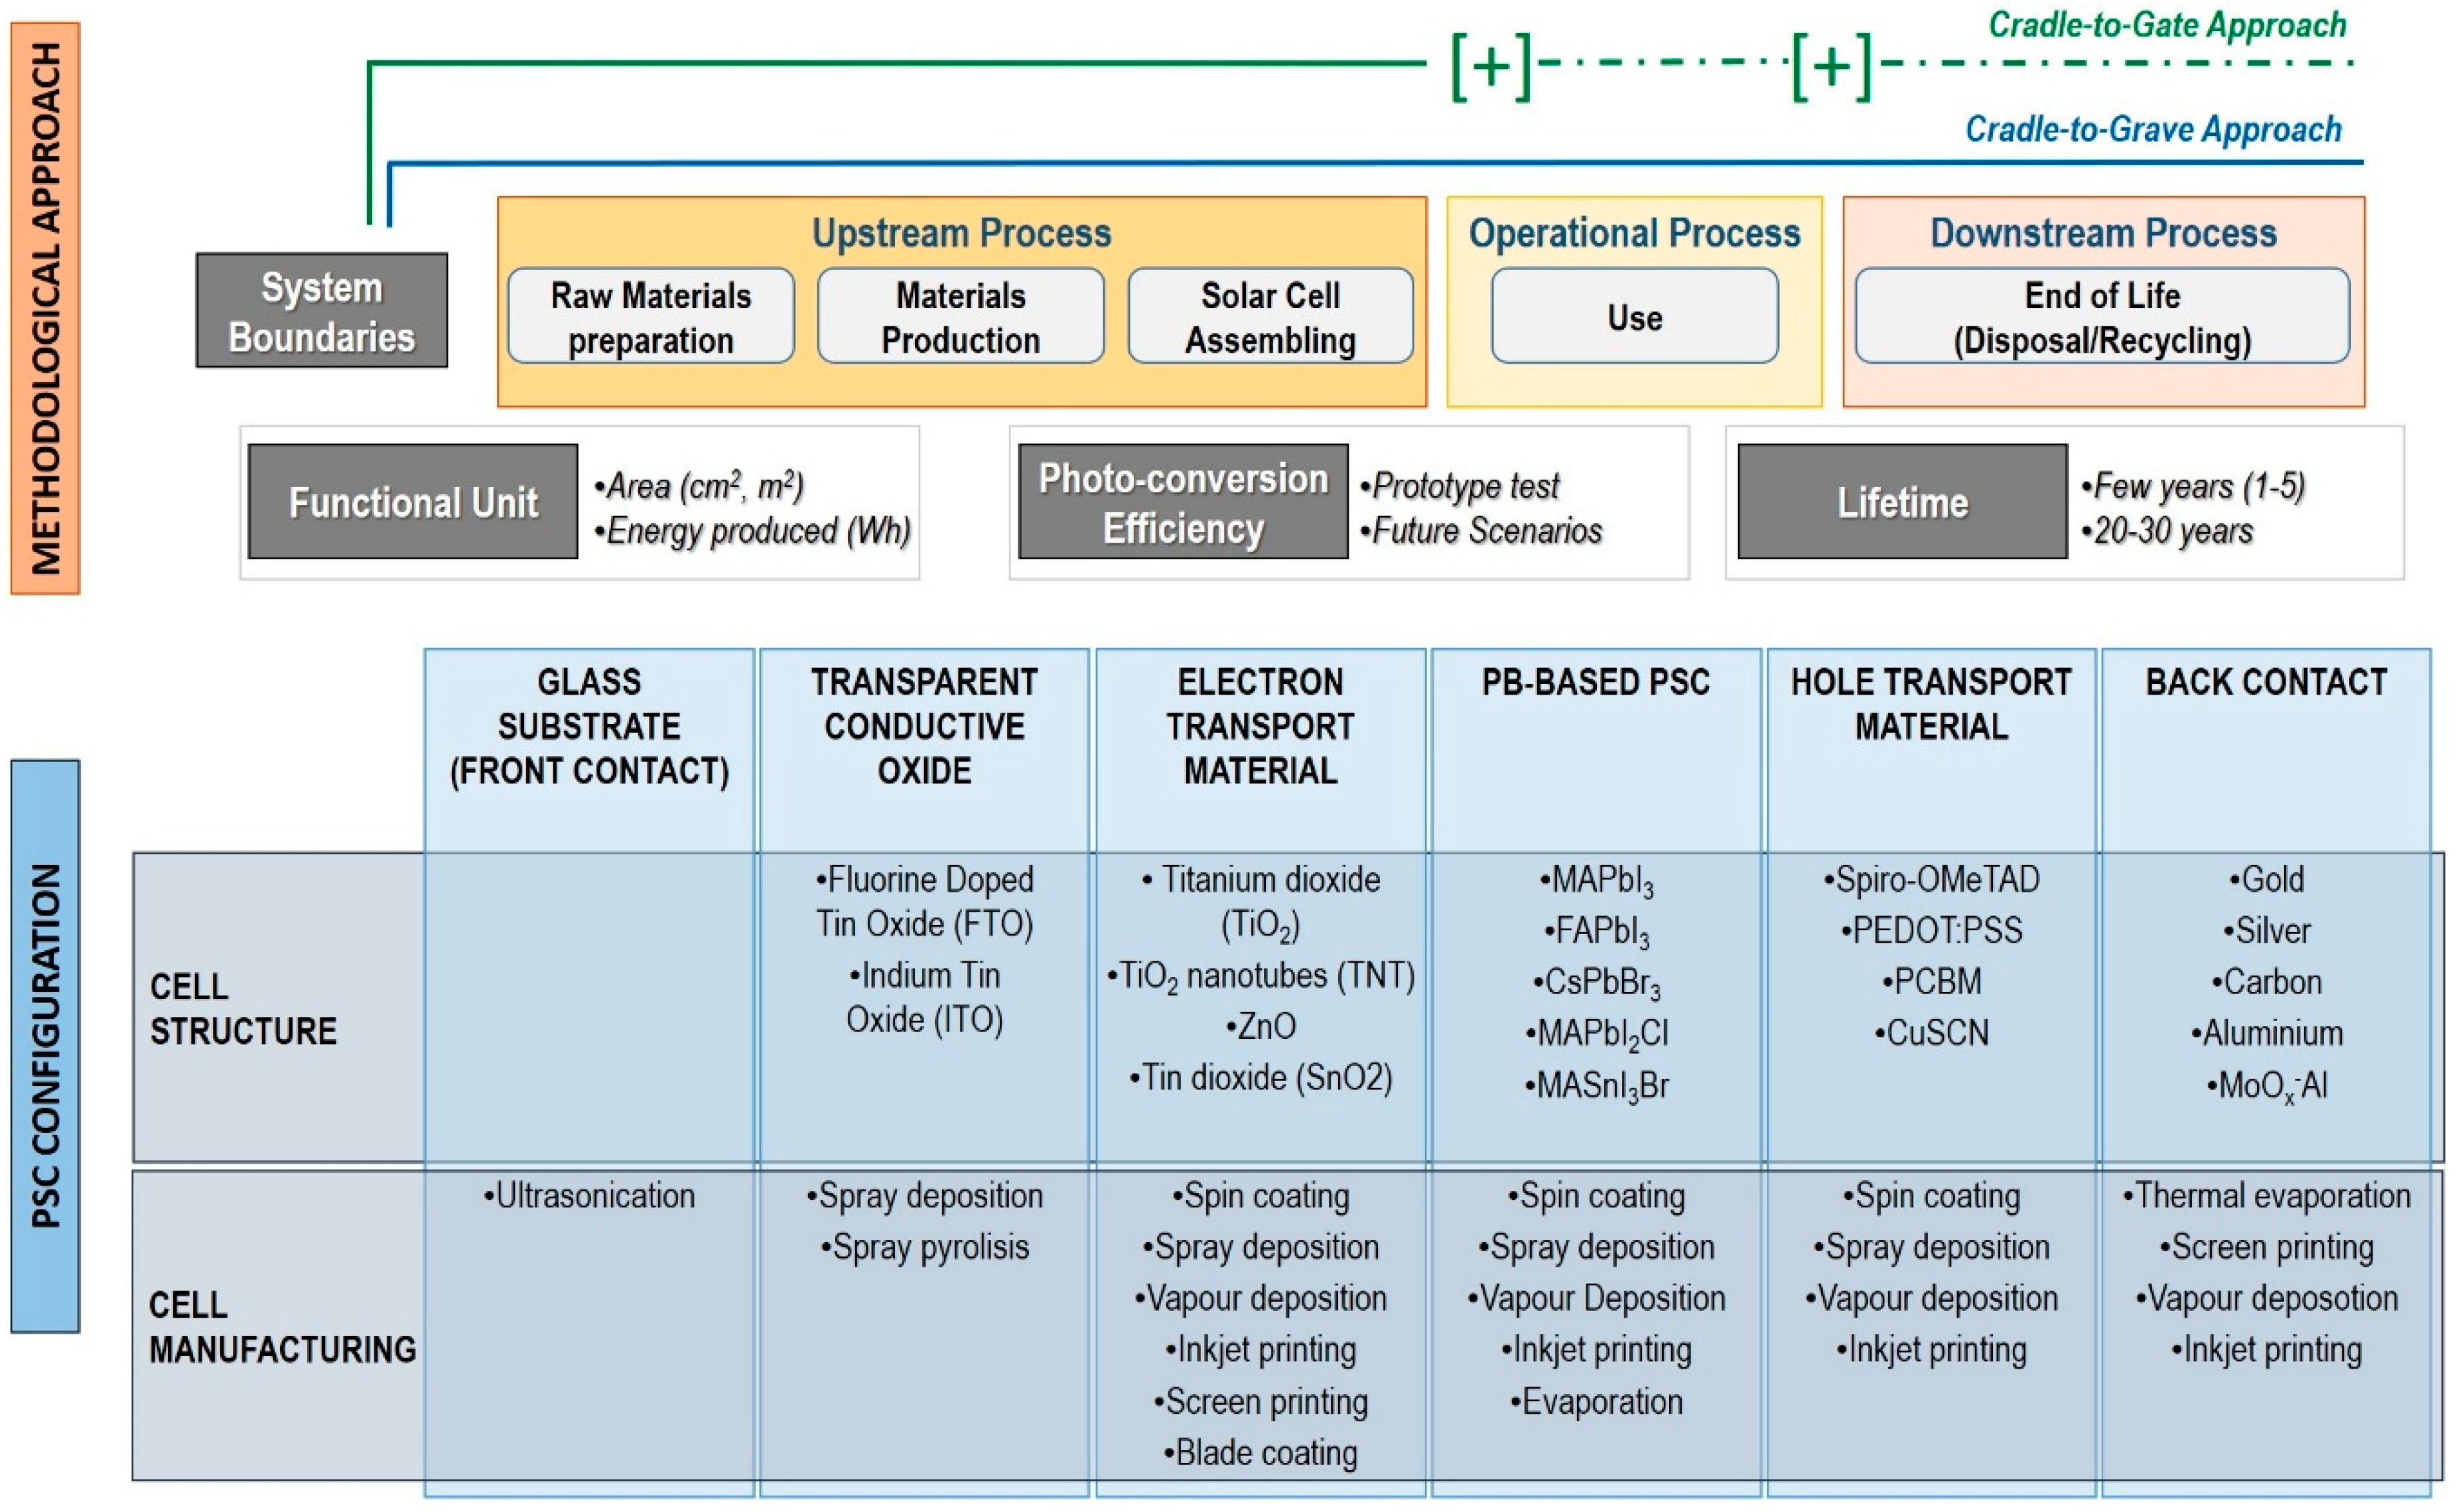
3.1. System Boundaries
In LCA, a product system is defined as a set of various subcomponents, namely processes and flows. The system boundaries describe which subset of the overall collection of processes and flows of the product system life cycle is part of the study according to the scope and goal stated in the first phase of an LCA study.
In the papers reported in
Table 1, the selected system boundaries are very different from one study to another (
Figure 1). Indeed, some of the studies investigated the environmental impacts connected to the manufacturing process without considering the operative and End-of-Life phases of the system (i.e., as in the cradle-to-gate approach). Other studies drew the system boundaries to include the manufacturing and operative stages, thus setting several technical parameters for the PSCs (such as photoconversion efficiency, lifetime, active area, degradation rate) that are required to assess the potential electricity production of photovoltaic devices (i.e., cradle-to-gate approach). Finally, other studies also considered the EoL phase by making some
a priori assumptions, thus modelling processes concerning the potential disposal and recovery modalities for the PSC technology (i.e., cradle-to-grave approach).
In the harmonization procedure employed in this work, only the manufacturing phase of the PSCs was considered, thus applying a cradle-to-gate approach. Given the very early stage of development of this PV technology, this approach was taken in order to reduce the uncertainty of the results. In fact, although a complete life cycle analysis should be evaluated to obtain a fair comparison of different options, the modelling of prospective scenarios for operational and End-of-Life phases at this level would not add reliable information for the purpose of the comparison developed in this study. All the raw materials employed in the production process of a PSC were modelled and included in this study.
3.2. Functional Unit
The functional unit is the reference flow to which all the product systems modelled during the LCI phase are referred. It must be representative of a quantifiable function of the product, process, or service under study to allow for the comparison among different LCA studies. Its choice is directly connected with the outlined system boundaries.
There were two functional units reported in the LCA studies published in the considered literature, as shown in
Figure 1. They are the area of the cell or module (for the manufacturing phase) and the amount of electricity produced (for the operative and disposal phases). By setting the system boundaries of our analysis with a focus on the manufacturing phase, we consequently selected the area of PSC (1 cm
2) as the functional unit. The studies employing this dimensional functional unit (1 m
2) had to apply a linear scale-up starting from primary or secondary data referring to the production of a PSC (1 cm
2). Thus, the choice of 1 cm
2 as the functional unit forced us to scale down some of the functional units reported in LCA studies that modelled the LCA for the production of 1 m
2 of perovskite solar module [
26,
30]. Moreover, in all those cases, a linear scale-down of all the input and output flows was performed by changing the functional unit.
3.3. LCIA Methods
In the LCIA phase, the environmental burdens connected with all the LCI data are identified and evaluated. The aim is to assign a value judgment to the energy and material input and output flows data collected in the inventory in order to assess the magnitude of their critical effects on impact categories. This task is generally addressed by summing up the whole environmental load in a few clear LCIA indicators. each one focusing on a different environmental issue.
LCA papers reported in
Table 1 applied several LCIA methods (
Figure 1) such as the ILCD 2011 Midpoint [
36], the CML-IA [
39], the Eco-indicator 99 [
40], TRACI [
41], and the IPCC 2013 [
42]. Here, the chosen LCIA method for the harmonization procedure was the ILCD 2011 Midpoint, in accordance to the European Commission Recommendation [
43] and Communication [
44] on the use of the Product Environmental Footprint (PEF) to measure and communicate the life cycle environmental performance. The 16 impact categories included in the ILCD 2011 method are:
climate change
ozone depletion
human toxicity non-cancer effect
human toxicity cancer effect
particulate matter
ionizing radiation Human Health
ionizing radiation Ecosystem (interim)
photochemical ozone formation
acidification
terrestrial eutrophication
freshwater eutrophication
marine eutrophication
freshwater ecotoxicity
land use
water resource depletion
mineral fossil and renewable resource depletion
Among these impact categories, the ionizing radiation ecosystem (interim) and the water resource depletion were not taken into account for the harmonization procedure, following the suggestion reported in the PEF category rules (PEFCR) document [
43]. Furthermore, in order to evaluate all the energy consumption associated with PSC manufacturing, the single-issue method cumulative energy demand (CED) was employed [
45] as well. The CED indicator quantifies the whole energy requirement during the system life cycle. Its measuring unit is theMJ equivalent of primary energy and it accounts for both direct energy (like electricity and thermal energy) and indirect energy contributions (embodied energy of materials).
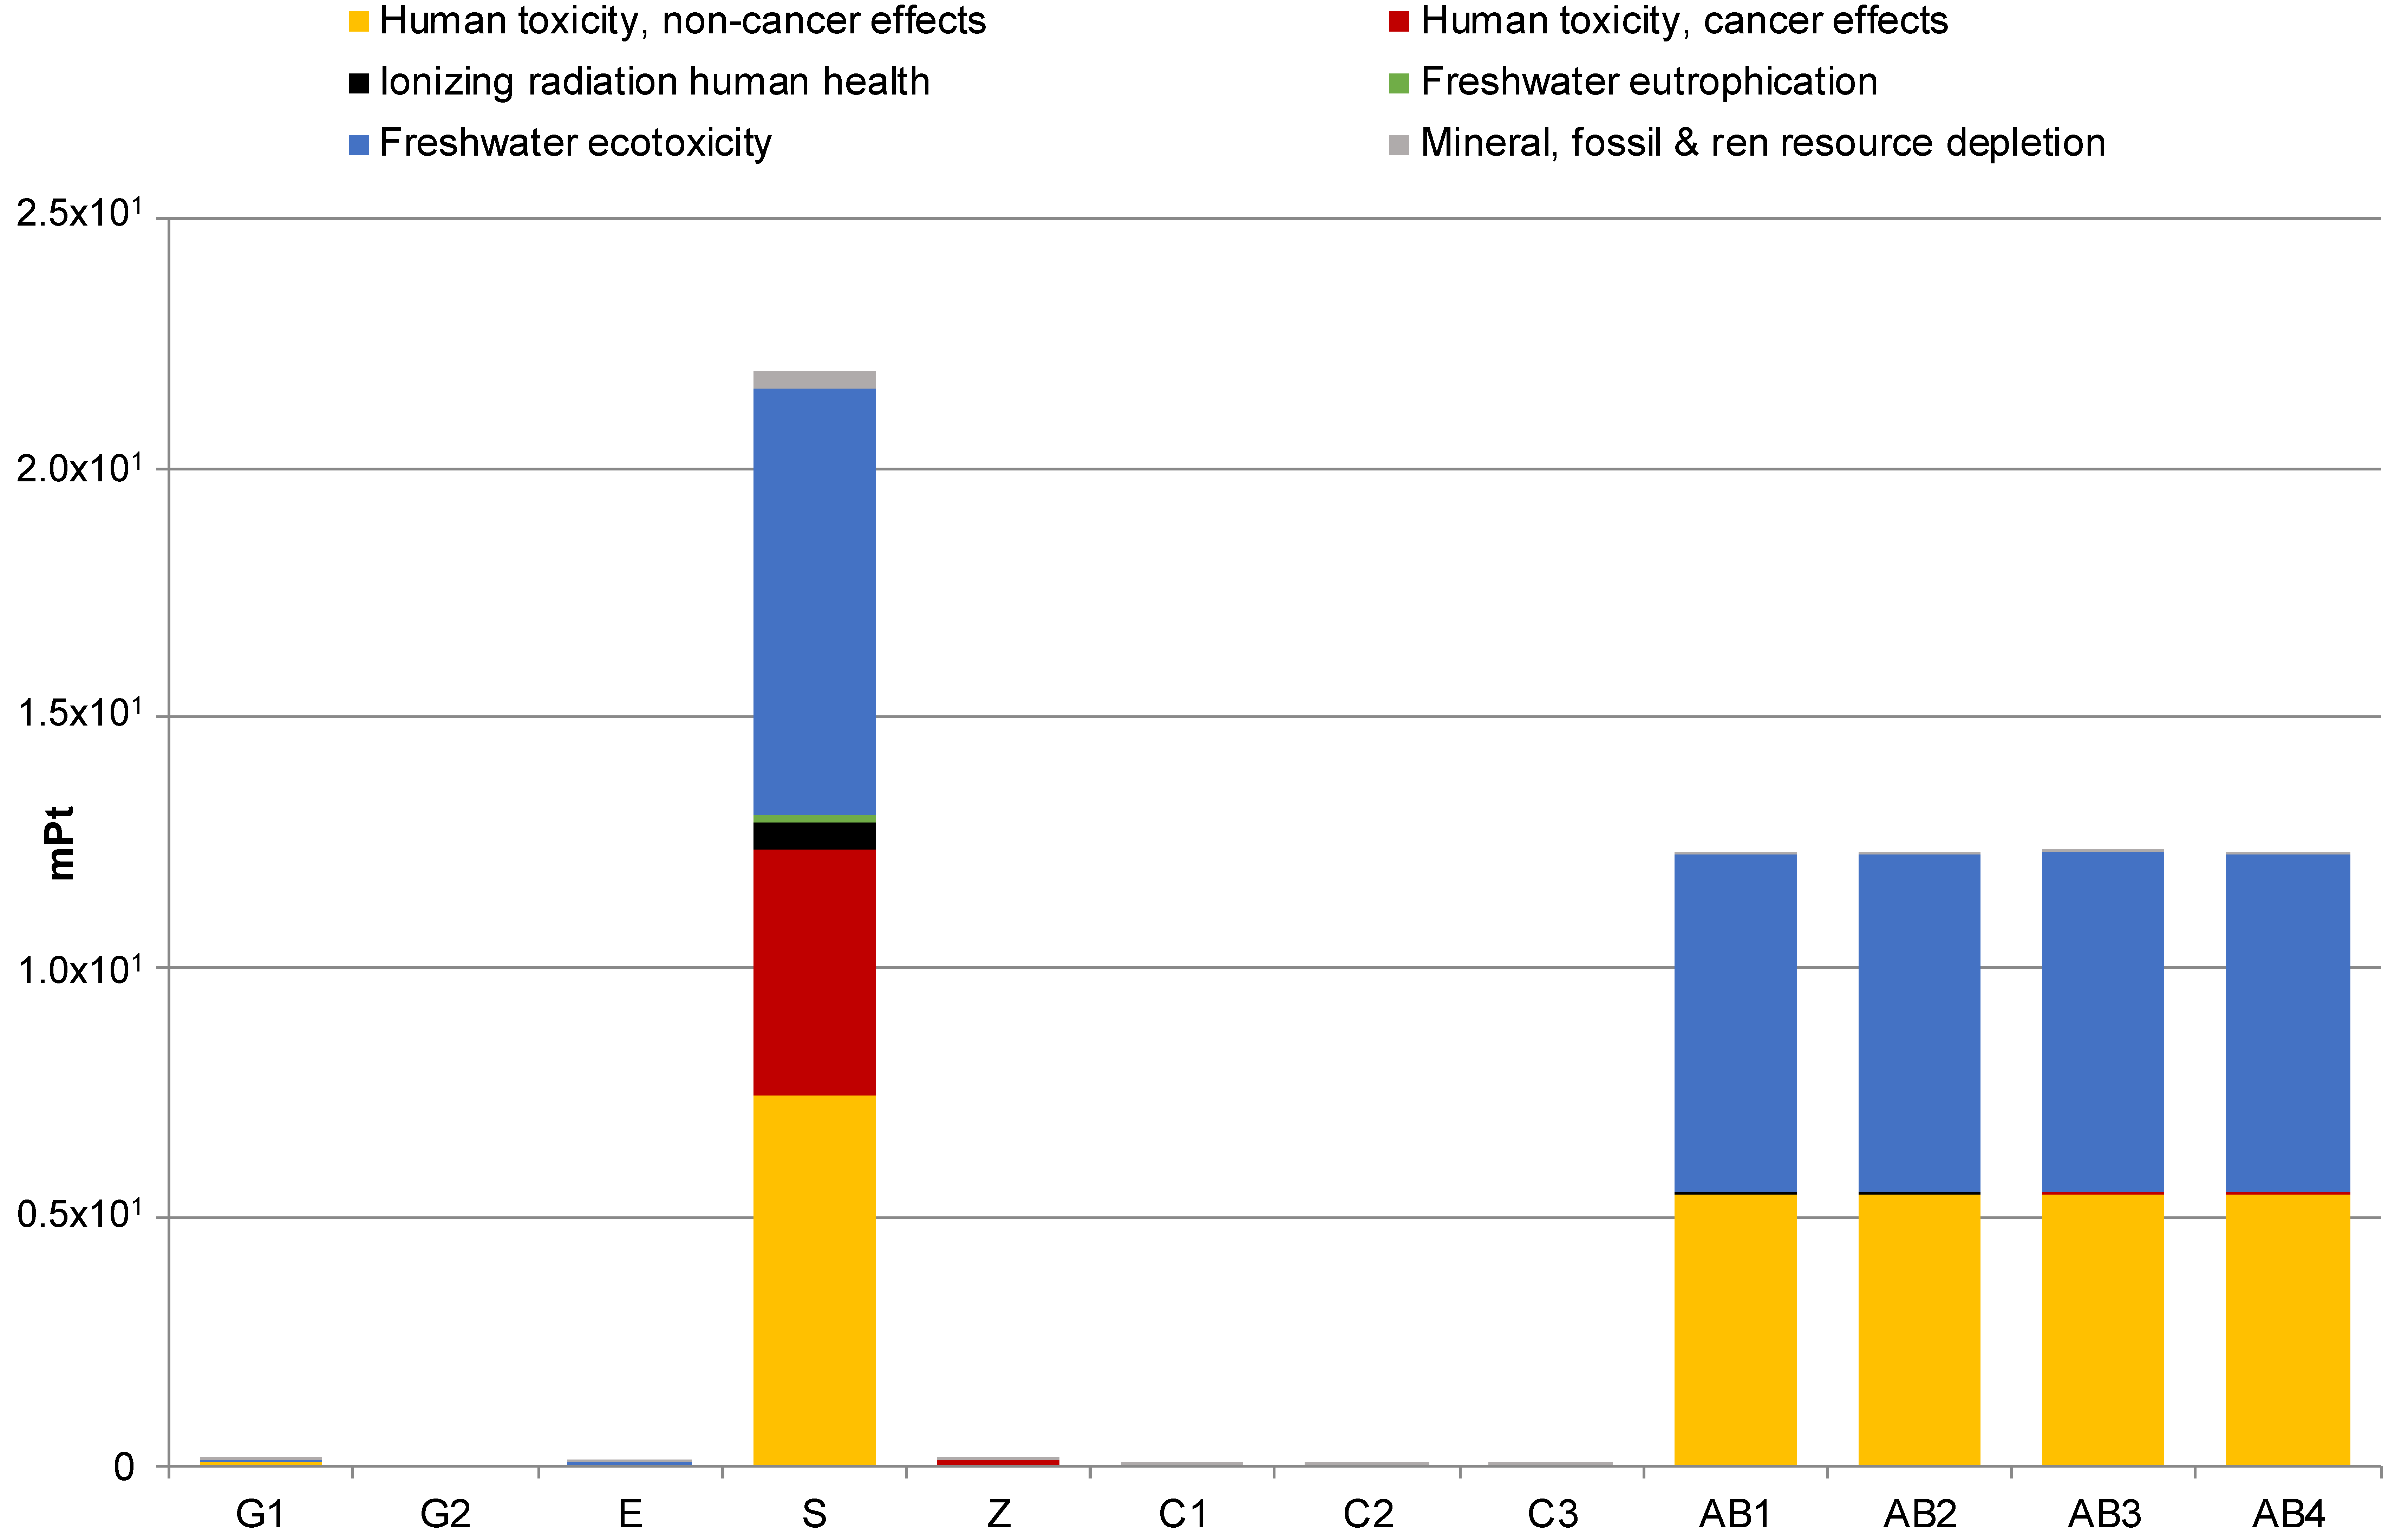
4. Results
The comparison among the environmental profiles of the 12 different PSC configurations investigated in the selected LCA studies and calculated with ILCD 2011 method is shown in
Figure 2.
The graph in
Figure 2 clearly shows that among the PSC configurations analyzed, five of them have an extremely high environmental impact [
28,
31]. This is due to the PSC device structures, which are characterized by various raw materials usage and manufacturing procedures. In detail, the S configuration [
28] reports an amount of gold in the back contact that is two orders of magnitude higher than in the other studies. Furthermore, the AB1-4 configurations [
31] have a direct metallic zinc (Zn) emission into the water that leads to a remarkable environmental load on categories dealing with toxicity.
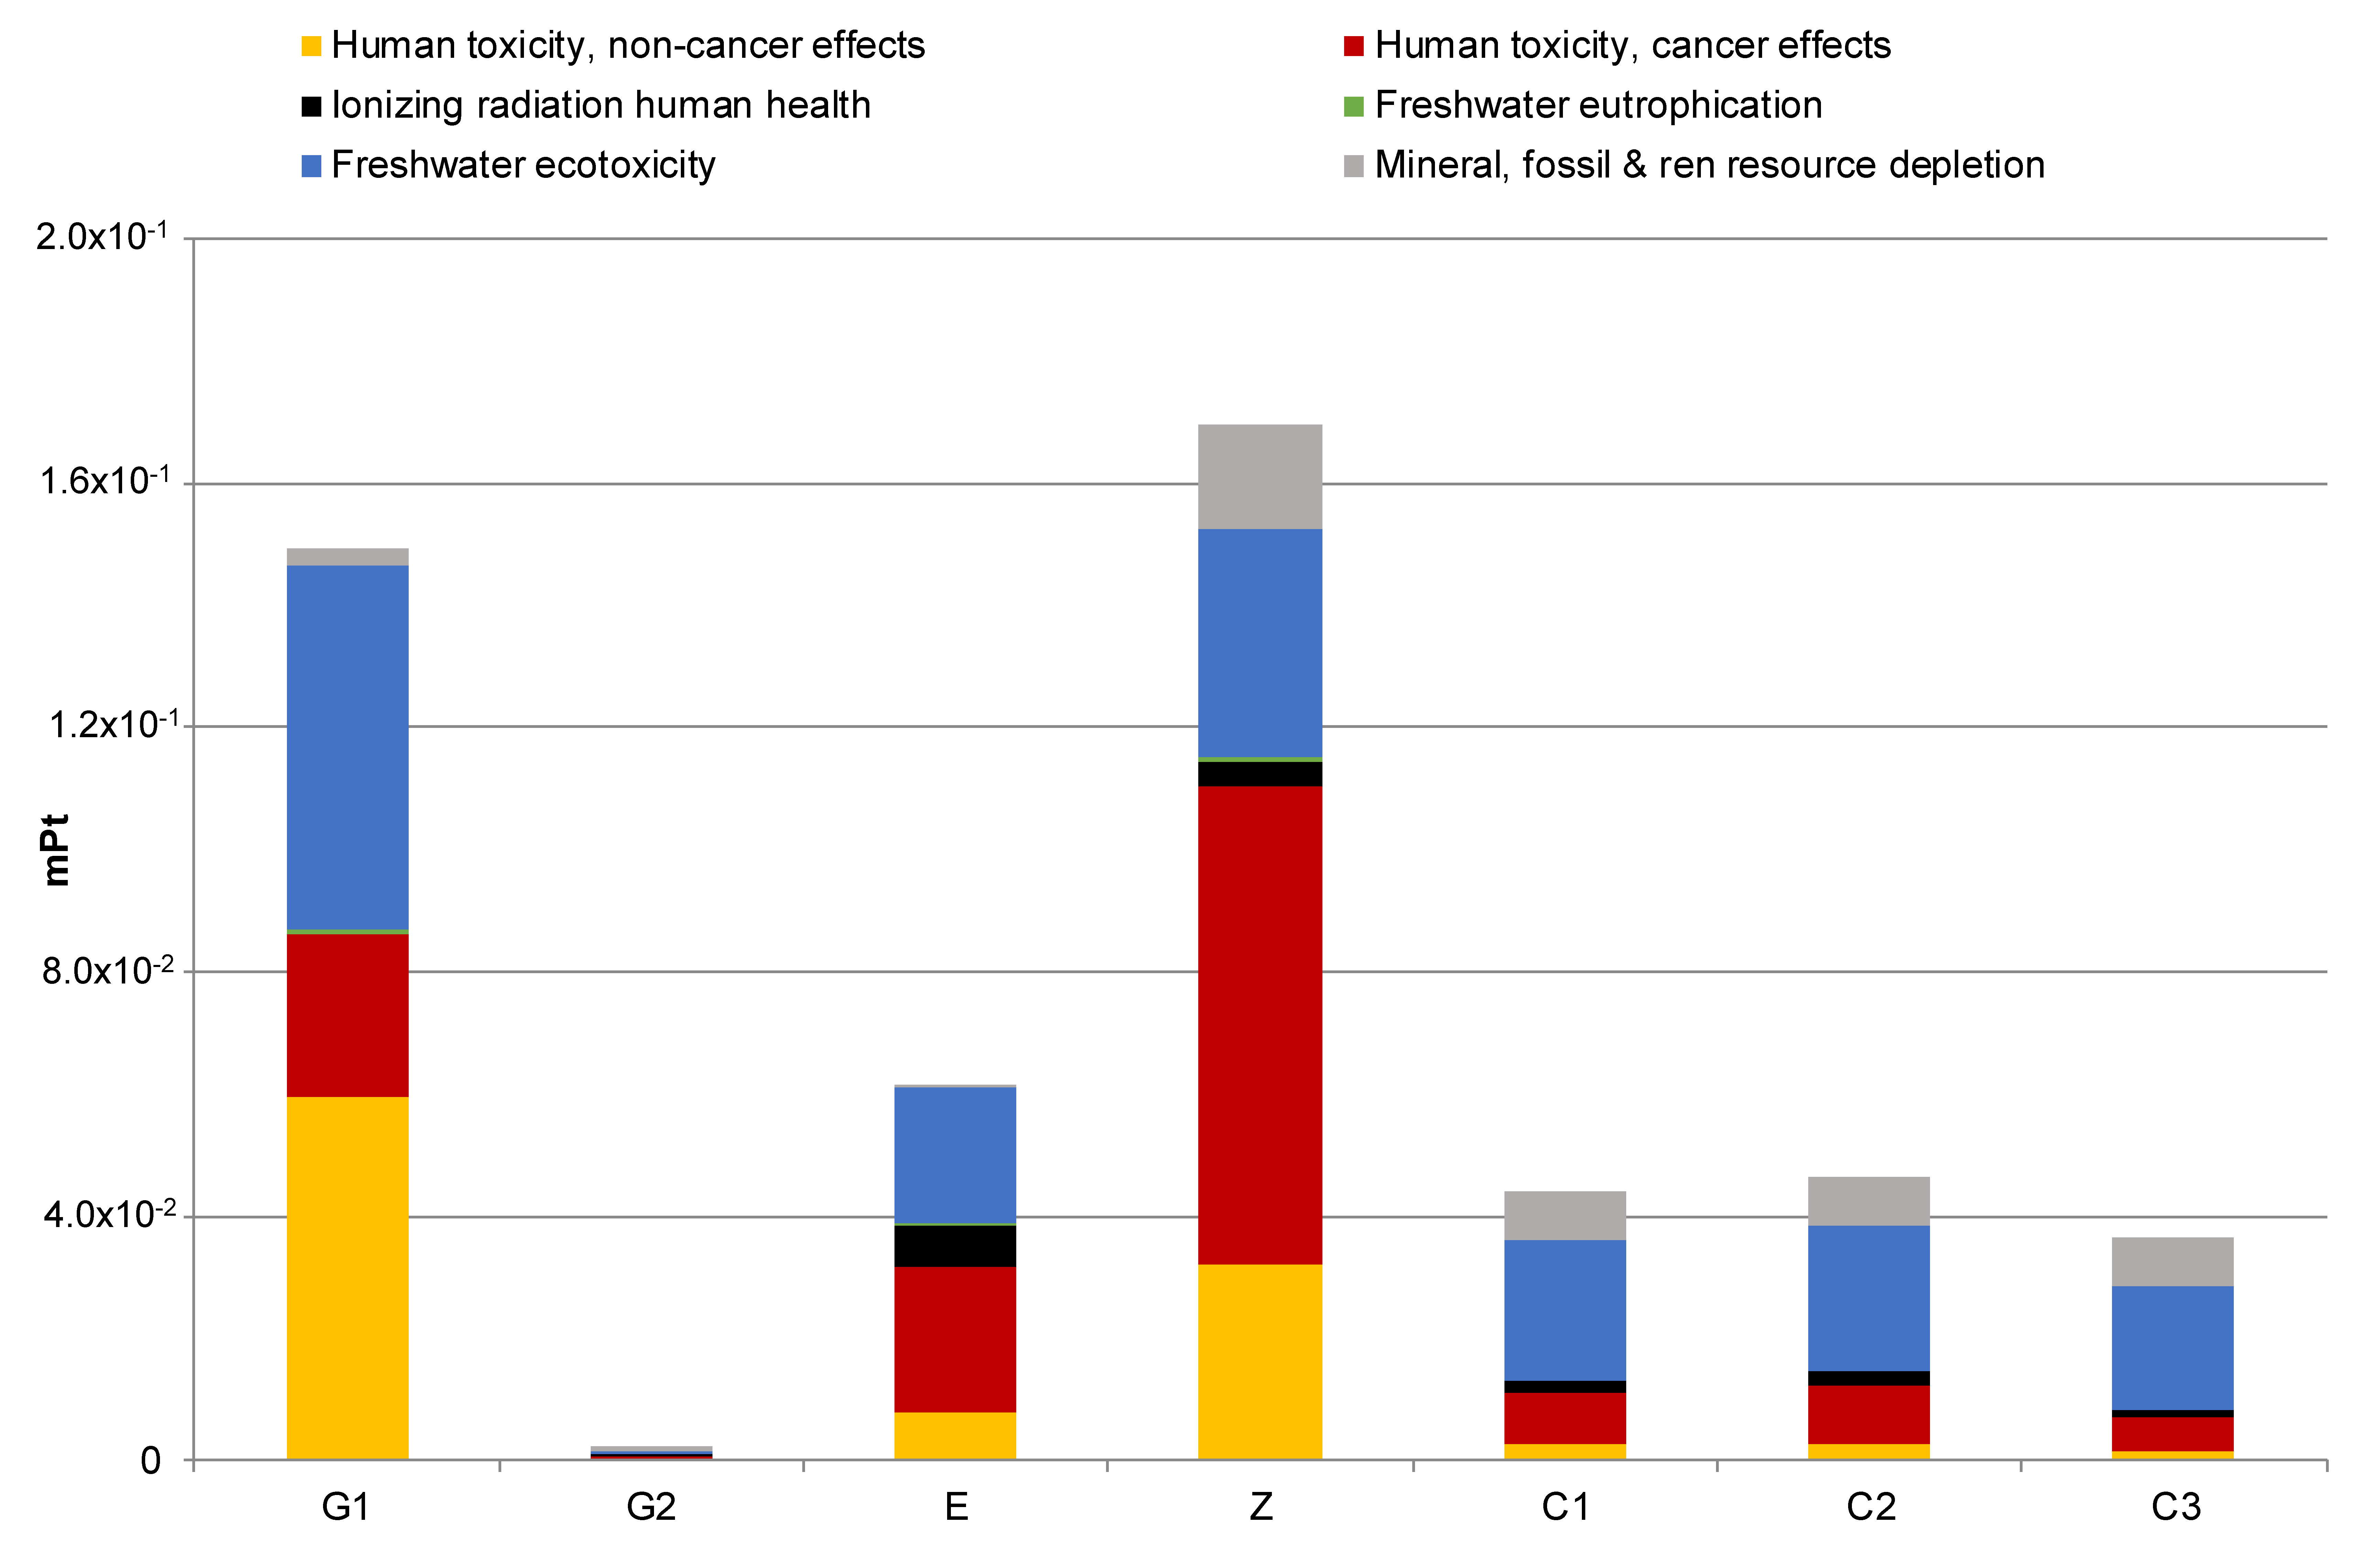
The graph in
Figure 3 shows the differences among the environmental impacts of the seven PSC configurations whose profiles are undetectable in
Figure 2.
The G1 and Z configurations reported in [
26,
29] have a high impact on the environmental categories that deal with toxicity issues. Concerning G1, the gold used as back contact has the highest load on the environmental profile of the cell, followed by direct electricity consumption and the solar glass (see
Figure S1 in SI). Regarding the Z configuration, the consumption of organic solvents and eluents (mainly diethyl ether) used in the synthesis of the TiO
2 nanotubes (TNT) electron transport layer (ETL) shows a remarkable environmental impact, followed by disposal (incineration) of average residues, the metal use (Pt), the iodine employment, and the electricity and water consumption [
29] (see
Figure S2 in SI). The G2 configuration [
26] shows the lowest environmental profile due to the replacement of gold with silver and TiO
2 with ZnO, respectively. These technological implementations correspond to an environmental benefit that overcomes the increase of the impact due to the employ of indium tin oxide (ITO) instead of the FTO glass.
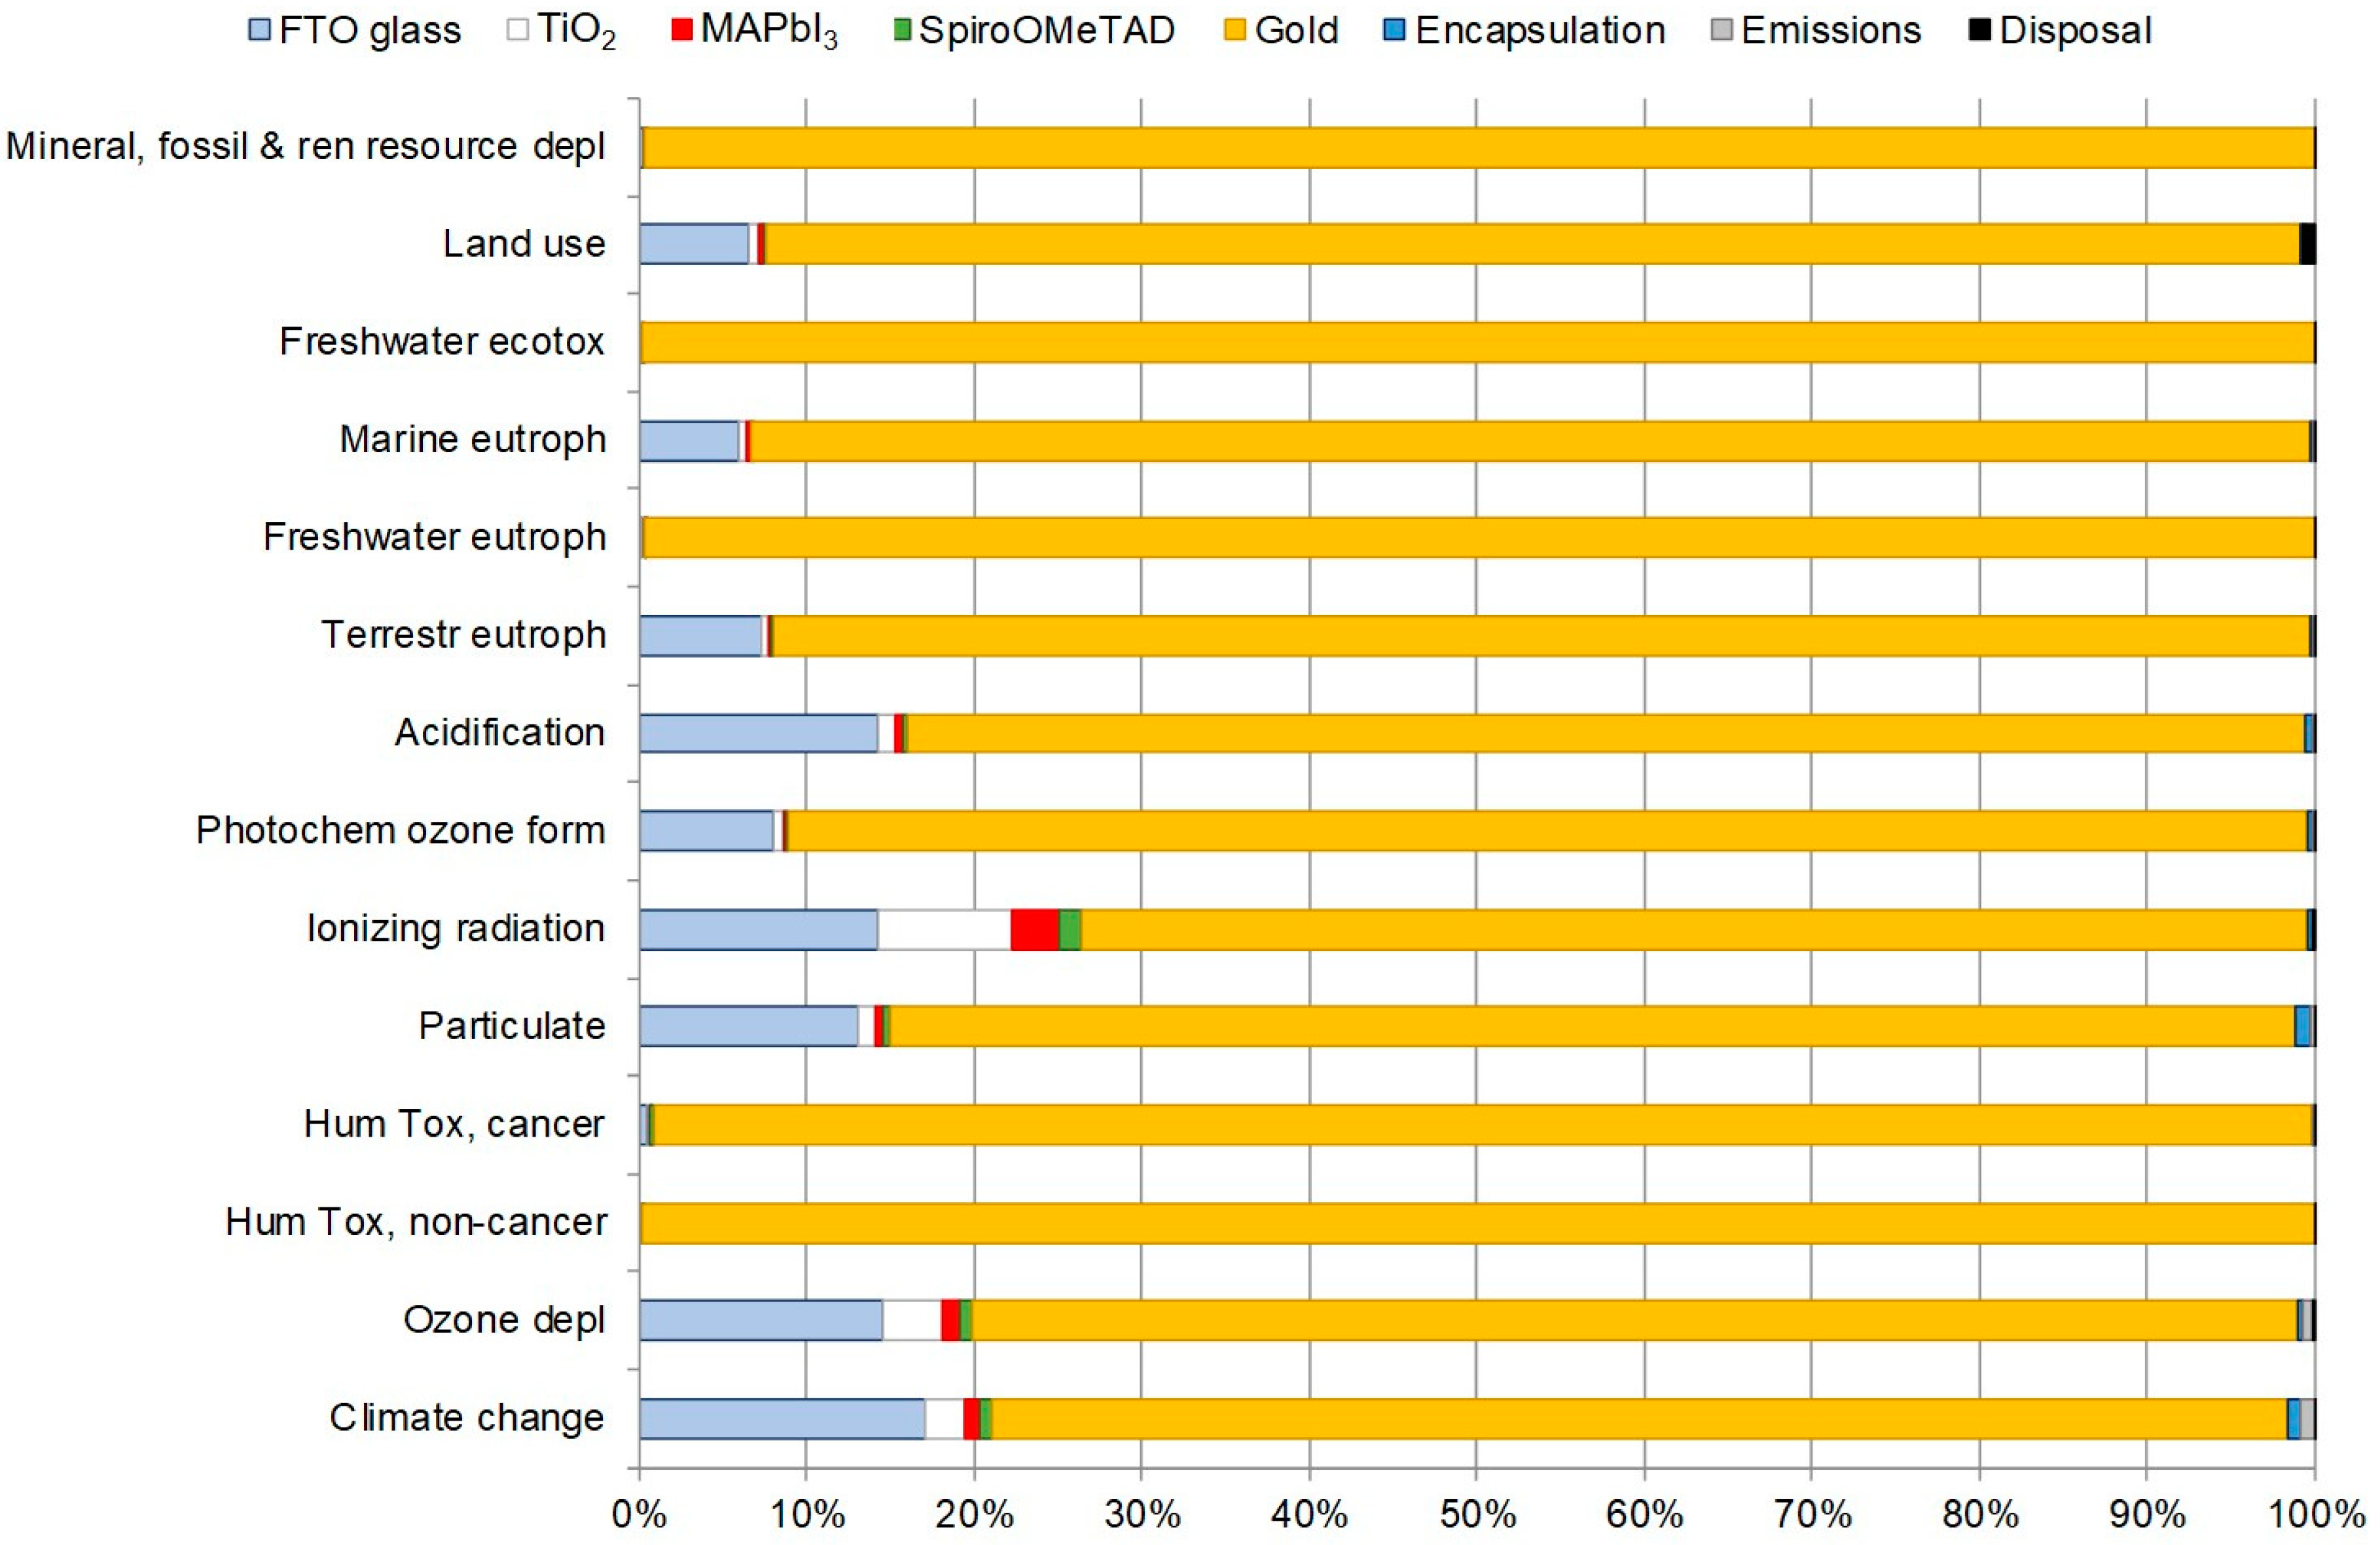
By analyzing the PSC configurations (
Table 1) and the environmental profiles shown in
Figure 3, the highest impact of the G1 and Z configurations appear to be mainly related with the manufacturing procedure and the materials used for the ETL, as well as with the metal used for the back contact. In order to investigate to what extent the unit processes and input flows contribute to the environmental profile of each PSC, a detailed inspection of the impacts connected with the manufacturing phase was performed with the characterization step of the LCIA method. In
Figure 4, the results for the G1 configuration [
26] are shown in detail as it is the most common configuration reported in the literature and can therefore be taken as a reference.
It is evident from
Figure 4 that the large impact is given by gold that is used as raw material for the back contact. This is mainly due to the environmental burden of the upstream processes employed for the production of gold.
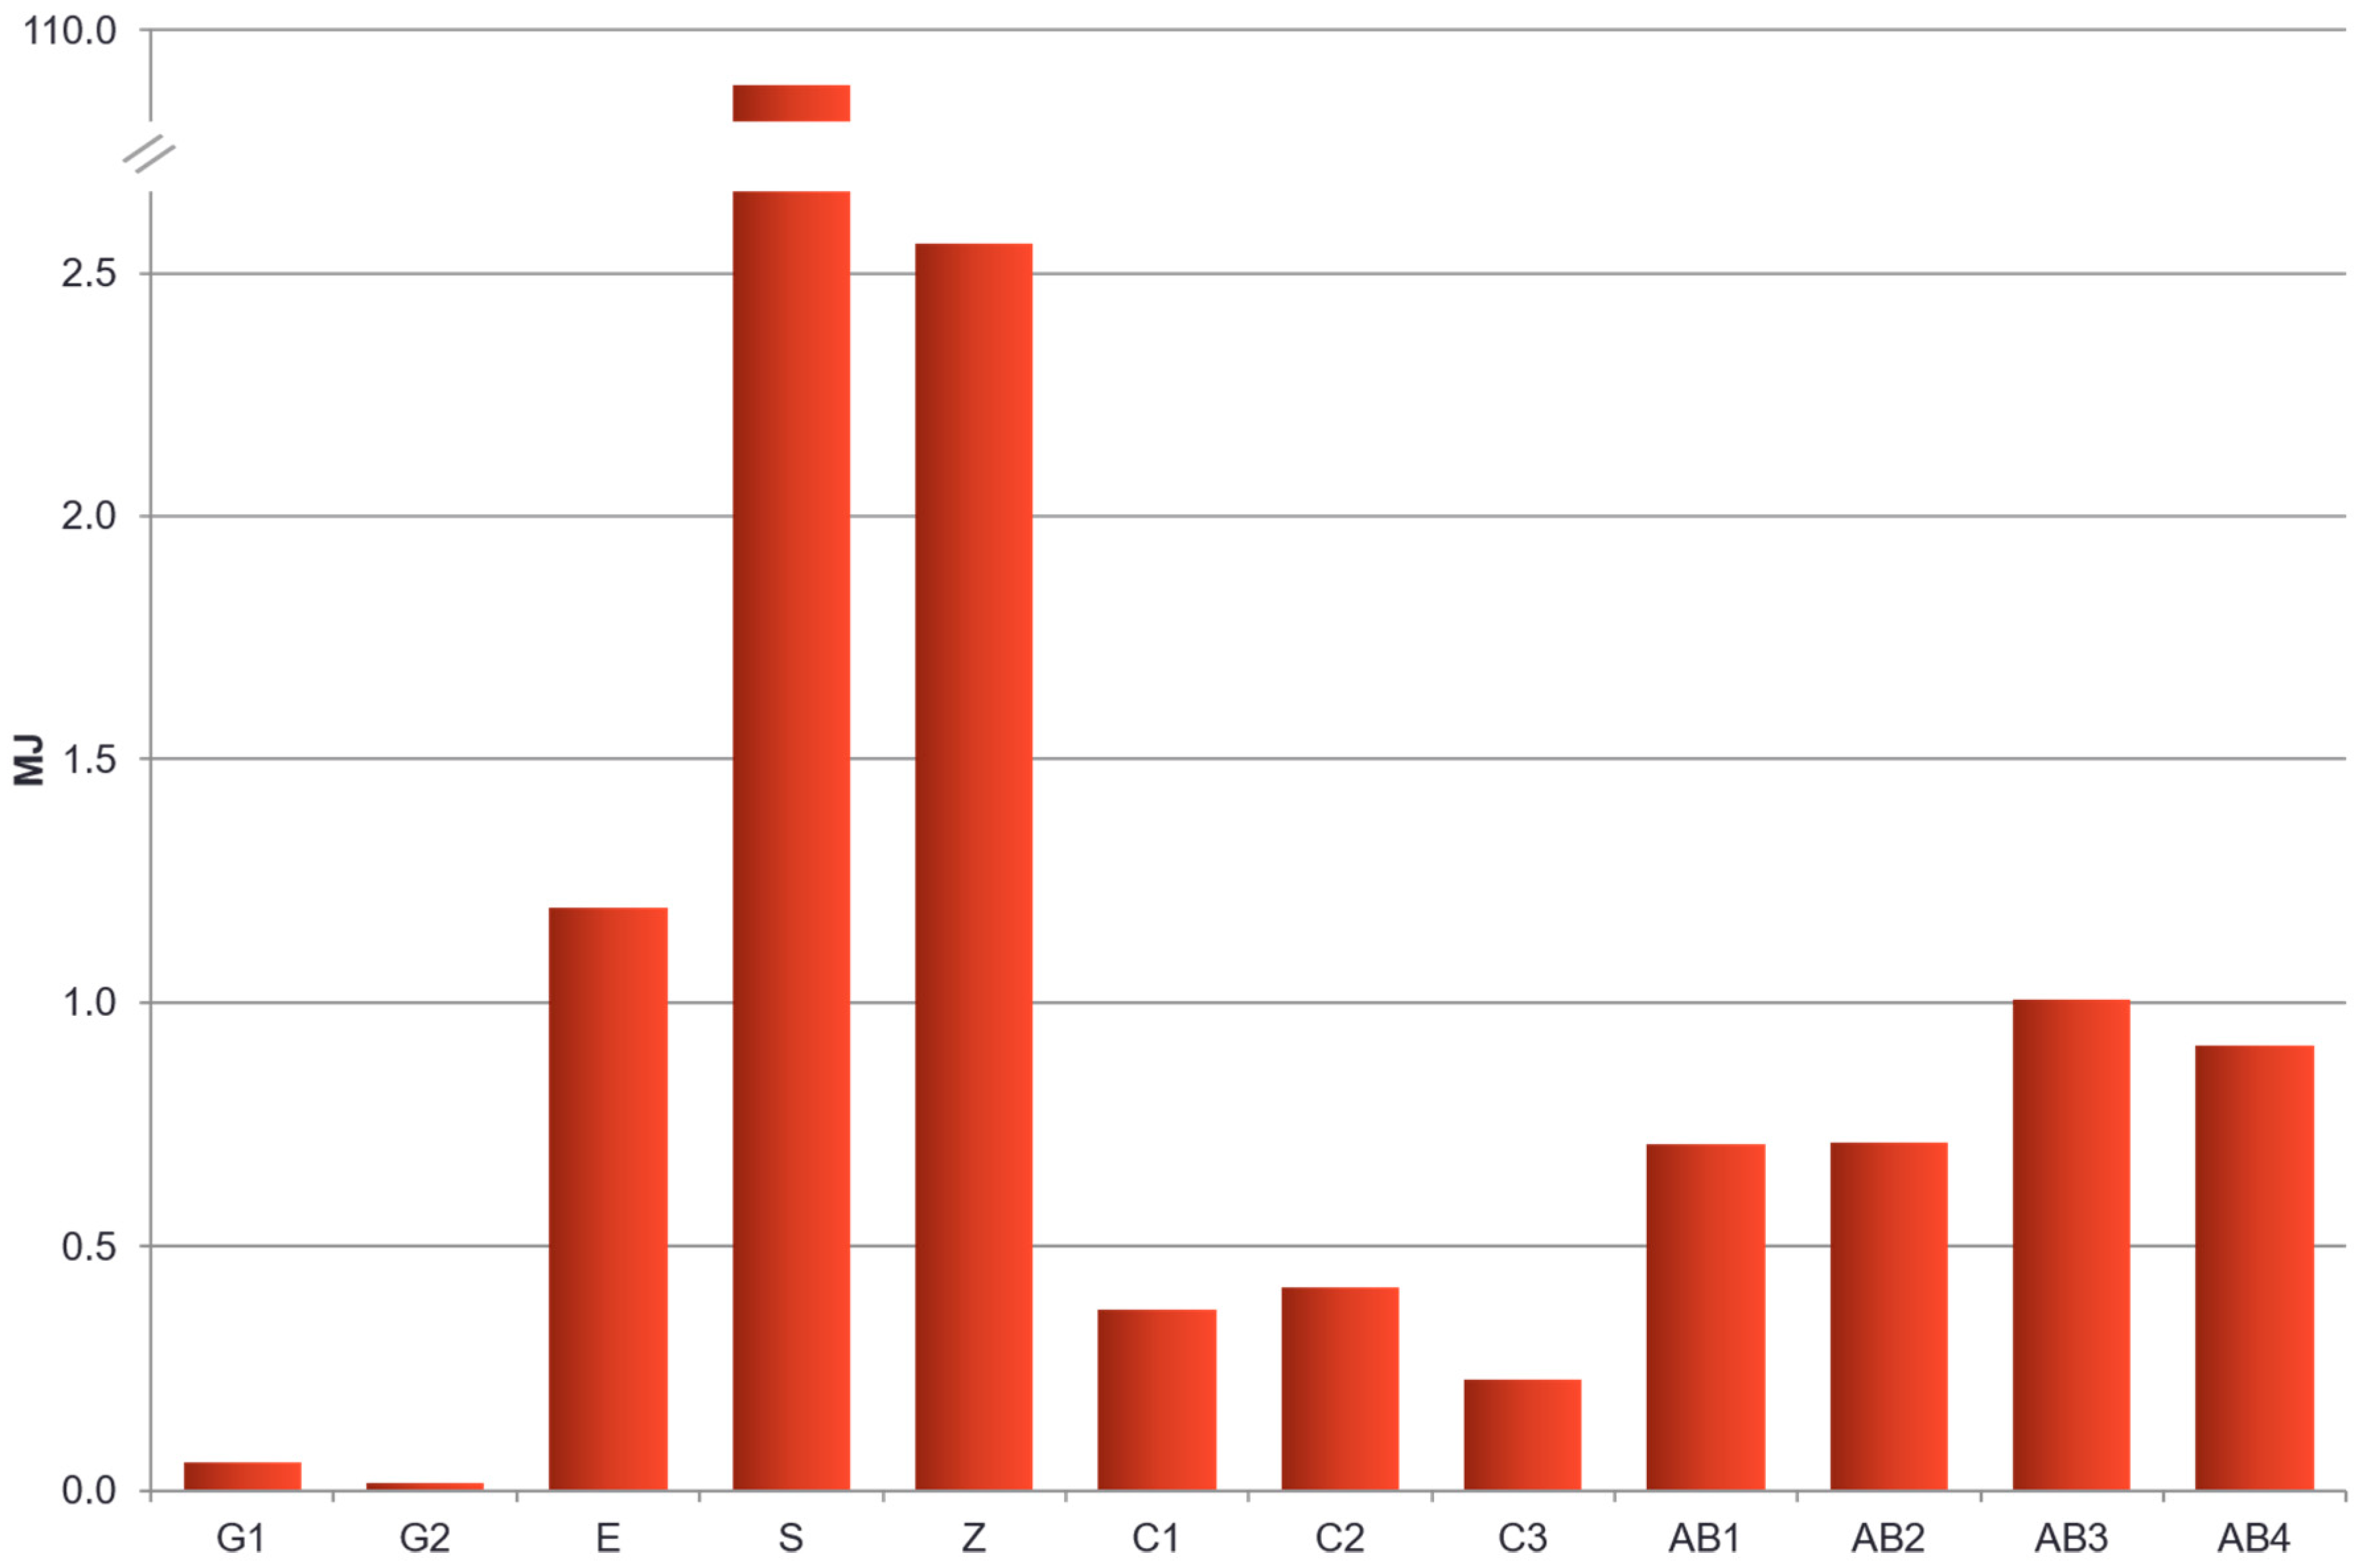
The comparison of the environmental profiles of PSC configurations, calculated with the CED—Single Score impact assessment method, is shown in
Figure 5.
The calculated CED indicator value for the S configuration [
28] is clearly out of scale compared to the results obtained for the other solar cells. This is due to direct LCI energy input flows that are about two or three orders of magnitude higher than for the other PSC configurations. The sum of all the energy input flows for the S configuration gives a total value of 104.86 MJ. Truthfully, in the paper that reports S configuration [
28], there are no clear indication of the reason why the manufacturing of a PSC is so energy intensive.
Analyzing the contributions to the CED of each unit processes and input flow, the most relevant impact is caused by the direct electricity consumption during the manufacturing of the PSCs (see
Table S1 in SI). Despite that, the G1 and Z configurations [
26,
29] show a different behavior: The employment of gold as the back contact in the G1 cell and the consumption of organic solvents and eluents in the Z cell are the most energy-intensive processes of the respective PSC configurations.
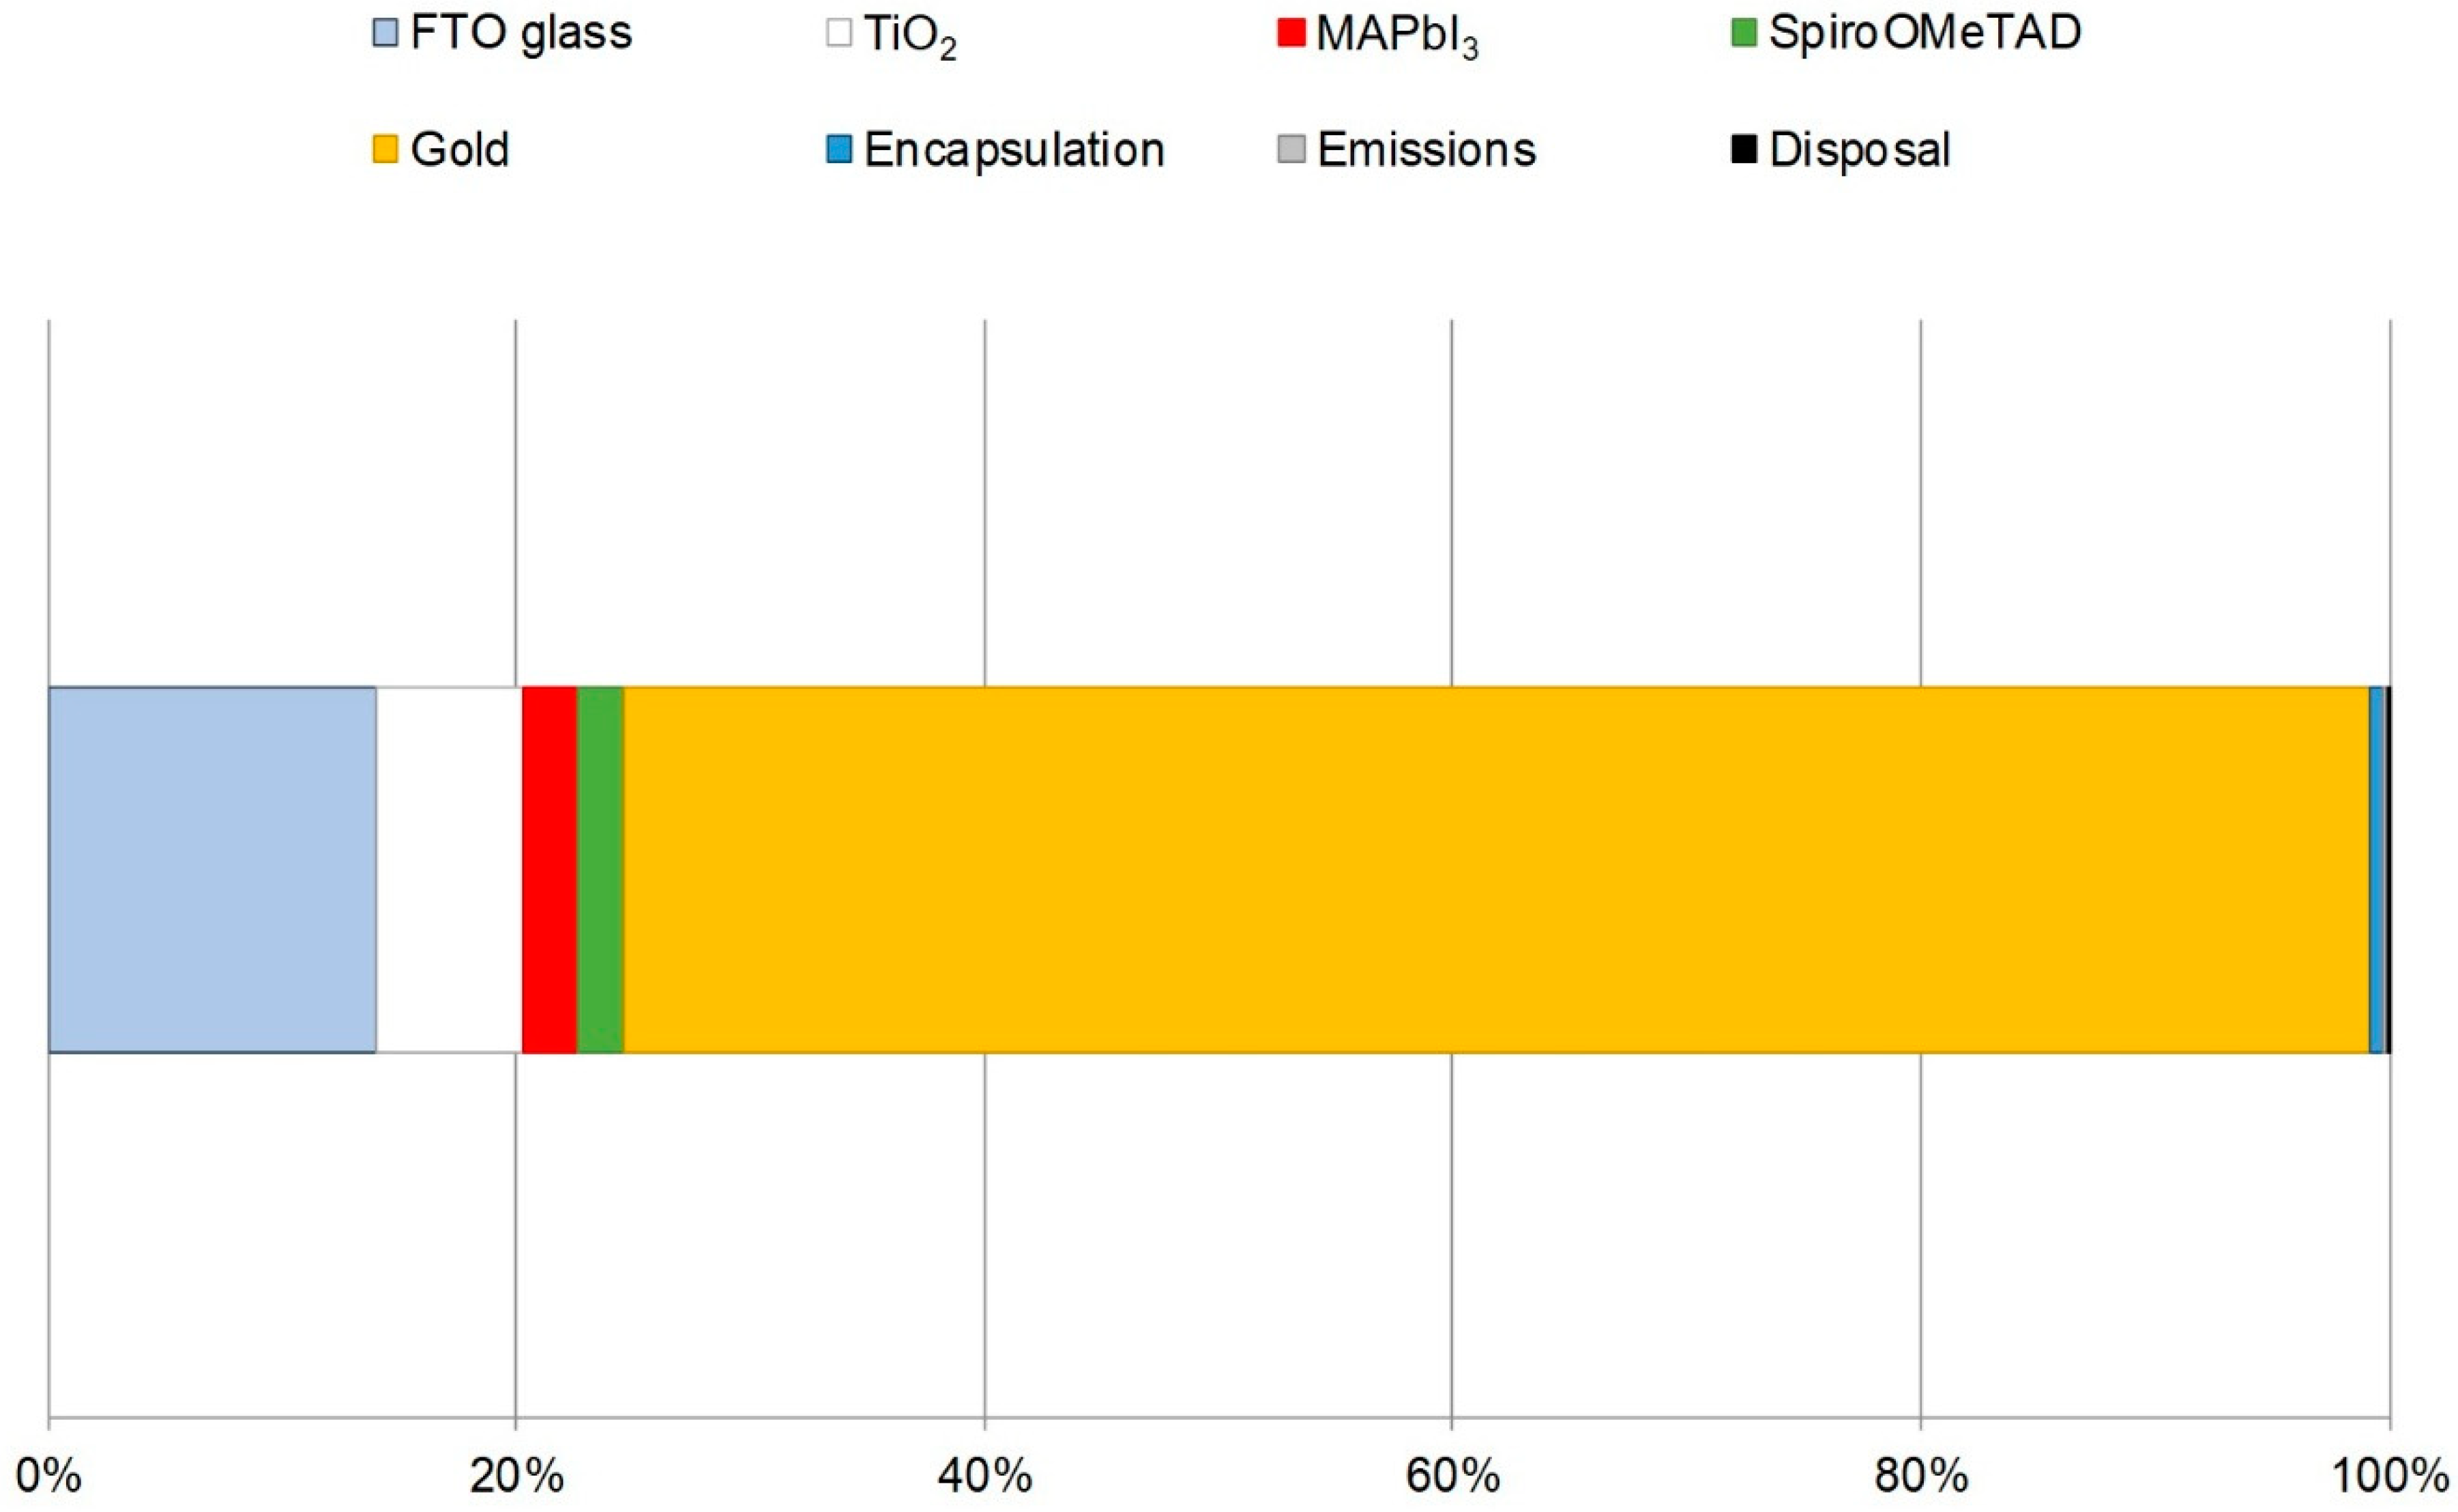
In
Figure 6, the graph reports the CED profile calculated for the G1 configuration [
26], which is potentially better for future industrial development than the Z configuration.
The impact of gold deposition is remarkable due to the high energy embedded in the material. The gold production process in the Ecoinvent database considers all the upstream input and output flows related to all the steps characterizing its life cycle, such as ore extraction, metal purification, and ingot manufacturing. Other materials seem to have limited loads on the PSC environmental profile, except solar glass and ETL, and this is valid both for the CED and ILCD 2011 methods.
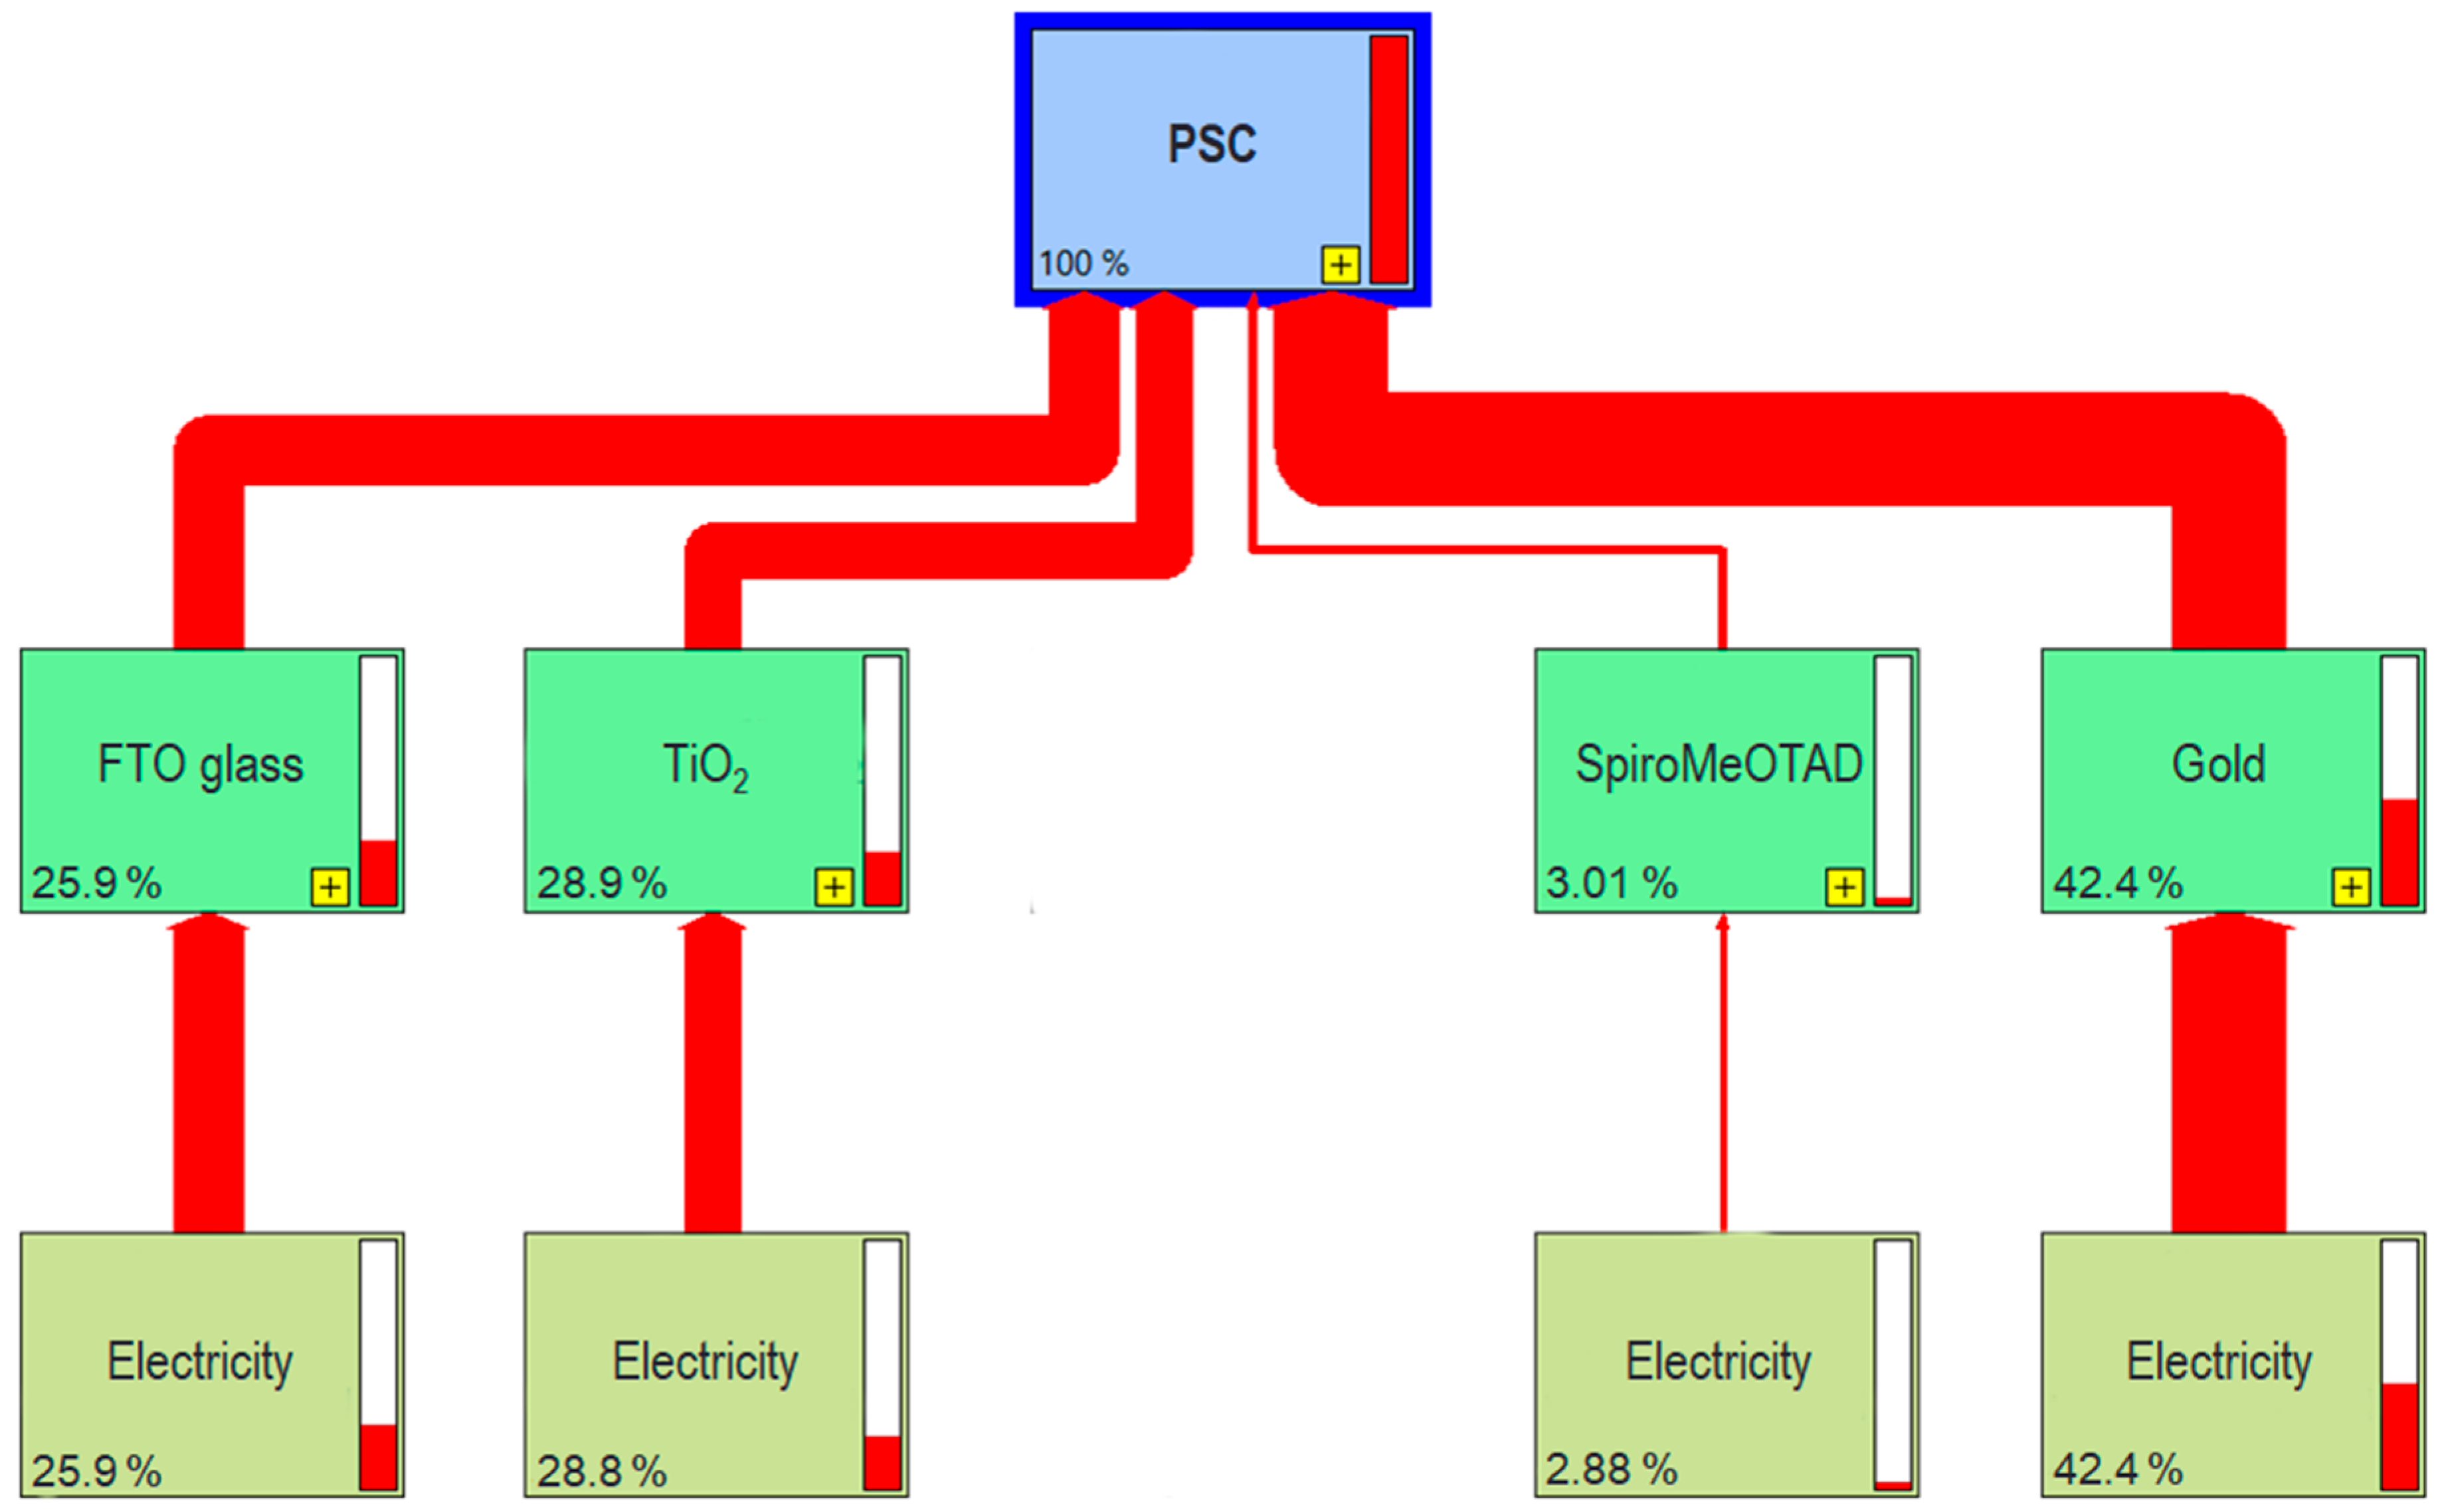
Calculating the burden of the direct electricity consumption during the manufacturing processes of the G1 configuration with the CED method, the most energy-intensive processes are the FTO glass substrate preparation, the TiO
2 electron layer deposition, and the gold back contact deposition (
Figure 7).
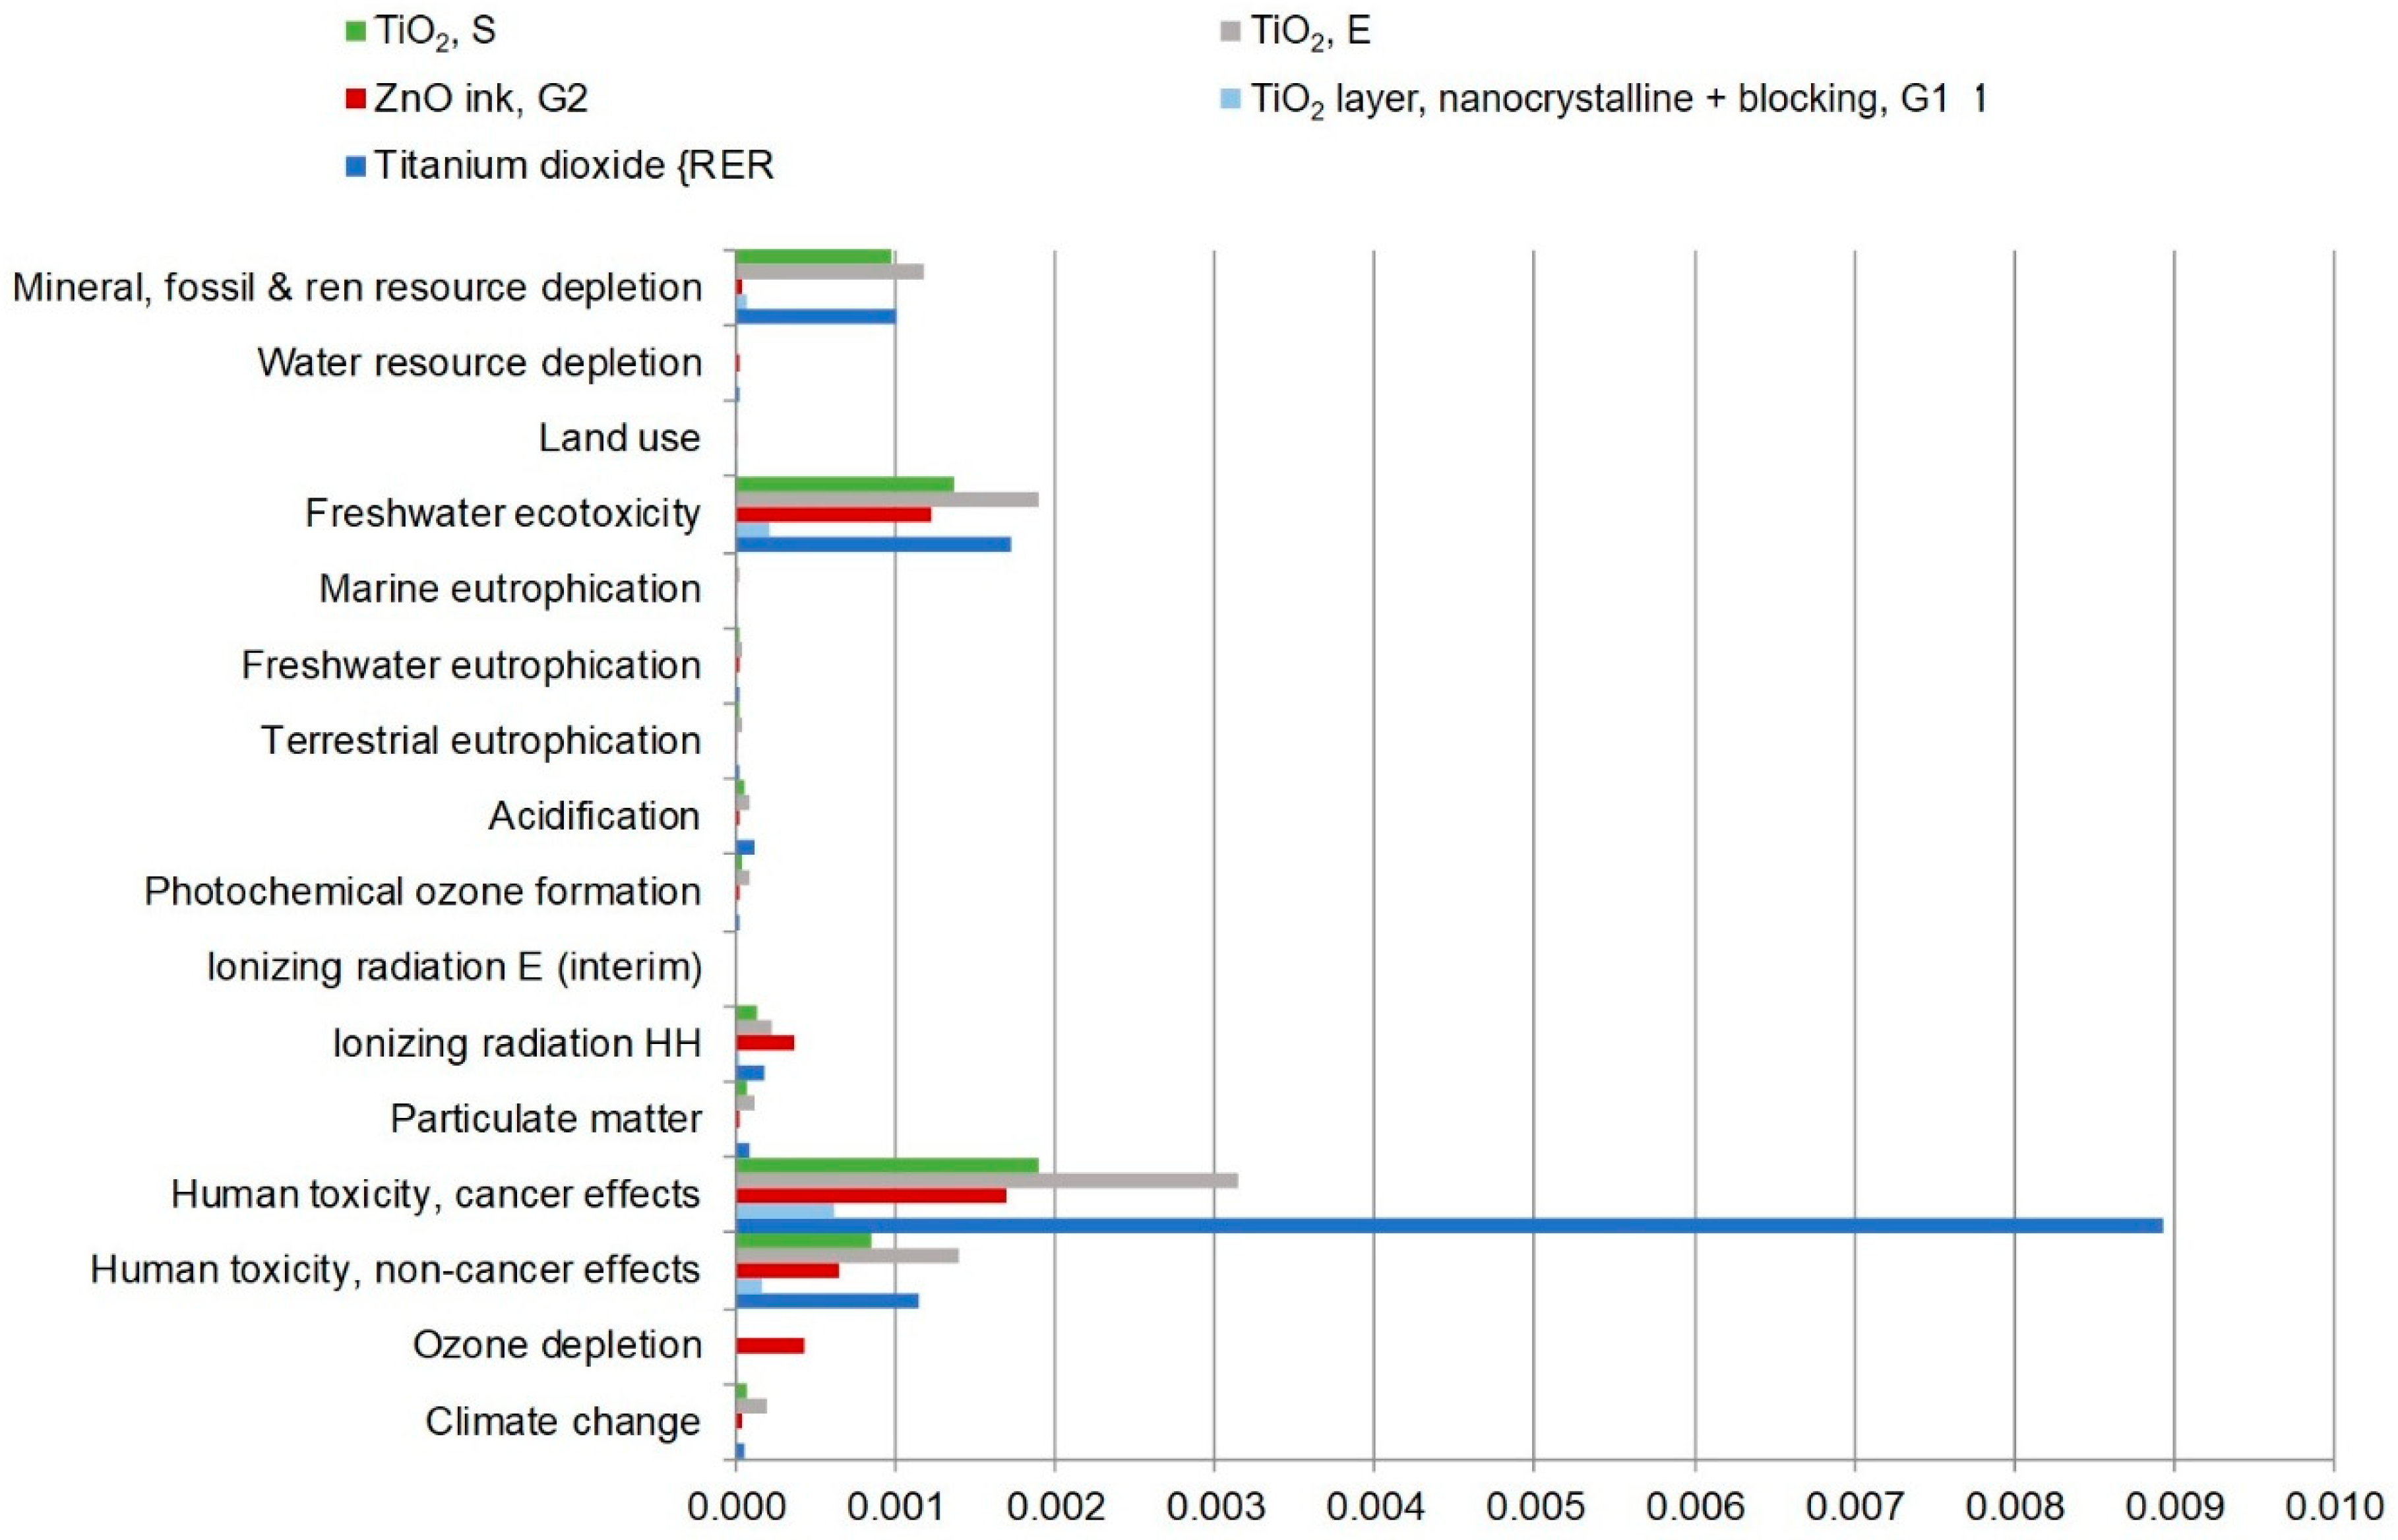
Besides the calculation of the environmental profile of the PSC configurations and their comparison, the potential environmental impact connected with the use of materials the manufacturing procedures employed in the cells fabrication should also be investigated. Such assessment, performed in the framework of the harmonization procedure, is useful for the identification of the environmental hotspots in the first life cycle stage of the PSC technology.
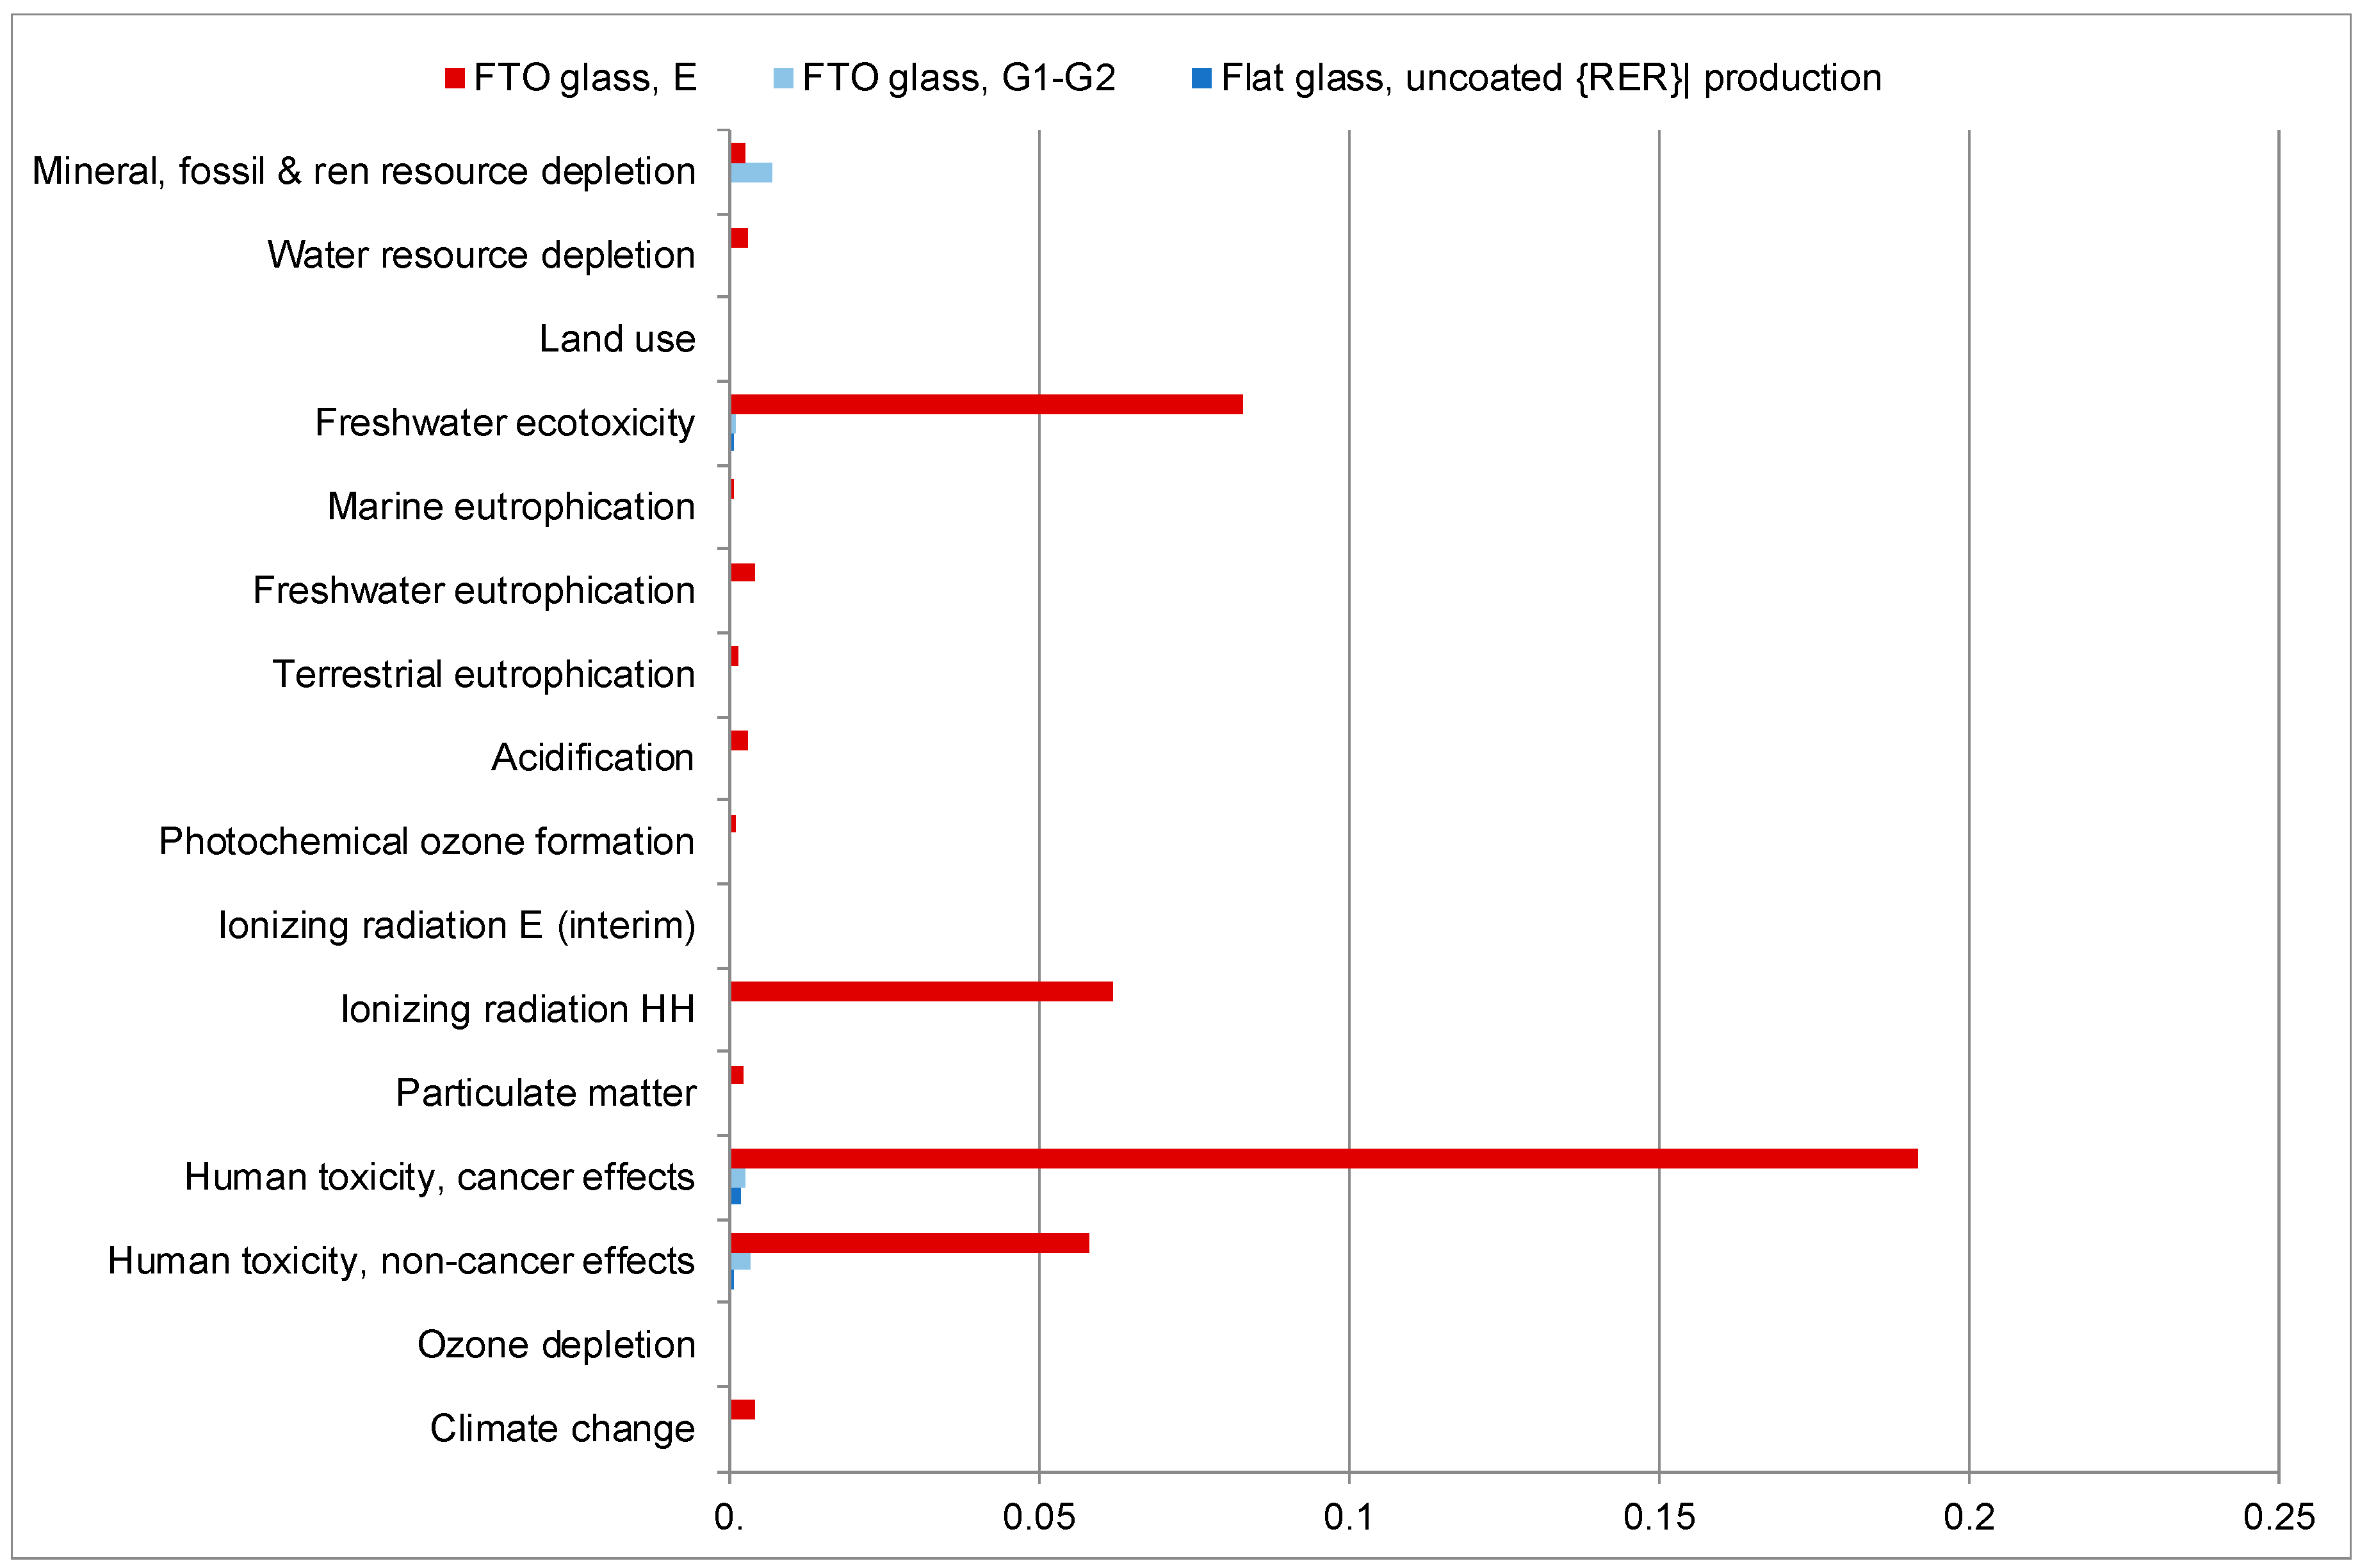
4.1. FTO Glass Substrate
Two LCA studies reported specific data and information concerning the production process of the FTO glass [
26,
27]. Other studies assumed that the Ecoinvent process called
Solar glass,
low-iron {
RER}|
production can be taken as a reliable proxy for the FTO glass. However, this process is equal to
Flat glass,
uncoated {
RER}|
production, so the assumption made by several LCA studies excludes
a priori the environmental burdens caused by the materials and the energy consumption related to the glass coating process with FTO. In
Figure 8, the comparison between the FTO glass modeled by the LCA studies [
26,
27] and the uncoated glass process taken from the Ecoinvent database is shown.
A high consumption of electricity characterizes the production process of FTO glass modelled by Espinosa et al. [
27] for the E configuration due to the oxygen plasma treatment process used for FTO deposition. The high energy requirement leads to a remarkable environmental impact, higher than the other two processes for all the environmental impact categories. The environmental load of the FTO glass manufacturing procedure employed in the G1 configuration [
26] is correlated with the usage of tin in the FTO compound. This results in the calculation of a non-negligible impact, higher than the glass production taken from the Ecoinvent.
4.2. ETL Deposition
The calculation of the environmental profiles of the different ETL deposition processes reported in the selected LCA studies is shown in
Figure 9.
The environmental profile of the ETL deposition of the S configuration reported by Serrano-Lujan et al. [
28] shows a remarkable impact due to a high energy consumption (see
Table S2 in SI). In order to appreciate the differences among the environmental profiles of the PSCs’ configurations, the results obtained for the system model described by Serrano-Lujan et al. [
28] for the S configuration are not discussed here.
The impact of ETL deposition described by Celik et al. [
30] is mainly caused by the presence of Sn in the SnO
2. This affects the whole environmental profile, especially the category mineral, fossil & renewable resource depletion. Alberola-Borràs et al. [
31] reported an ETL deposition featuring a high energy consumption due to the spin-coating, heating, and annealing of TiO
2 for the AB1-4 configurations. The environmental burdens associated to the deposition process of the Z configuration [
29] are mainly related to the energy consumption during TNT deposition (19.6%) and production (24.5%). The synthesis of TNT-film accounts for 79.6% of the whole environmental impact of the TNT-based deposition procedure. The impact of titanium as raw material in the TNT-film synthesis is the highest after that connected with the energy consumption. Concerning the E configuration [
27], the highest environmental impact is related to the use of electricity during the spin-coating process. The authors reported a synthetic procedure for TiO
2 production, but this was not considered in the harmonization procedure because the TiO
2 present in the updated version of the Ecoinvent database is taken as an input flow for all the PSC configurations.
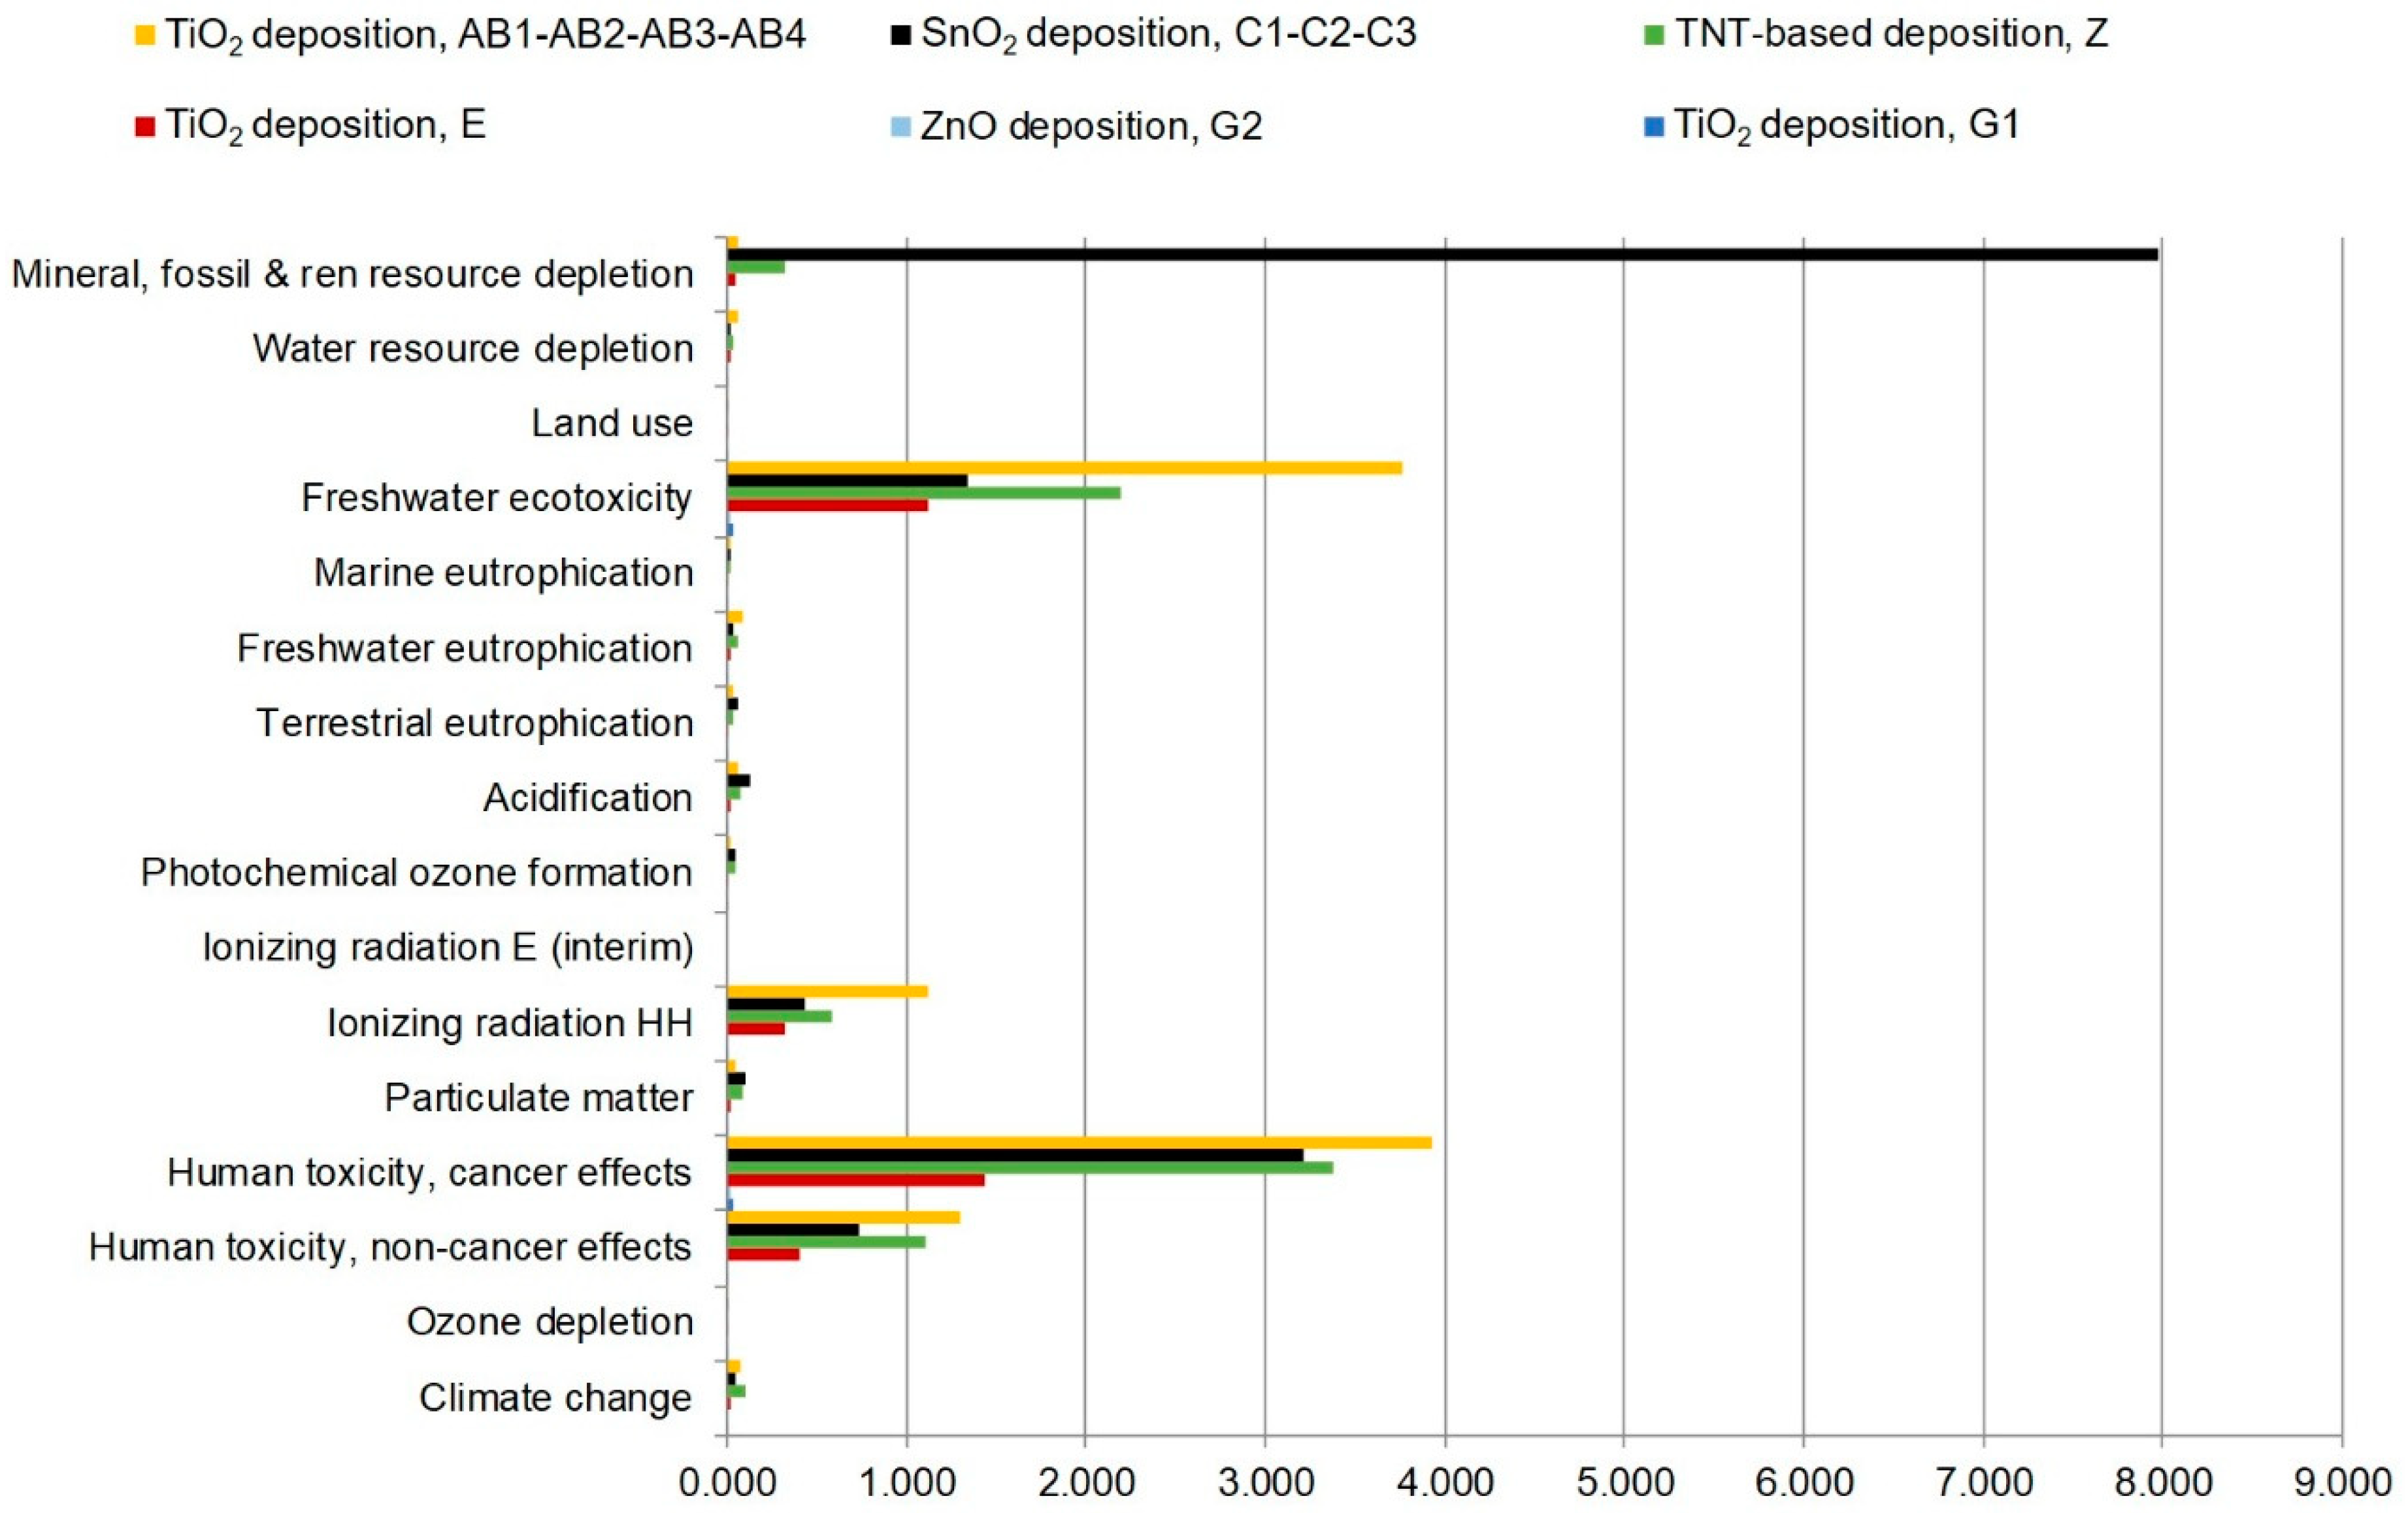
4.3. ETL Production
In order to investigate to which extent the raw materials affect the environmental profile of the ETL deposition techniques reported in
Figure 9, a comparison among the production processes of ETL described in the LCA studies is shown in
Figure 10. The functional unit is the production of 1 g of ETL.
The SnO
2 employed in the C1-C2-C3 configuration [
30] as a raw material is not reported in
Figure 10 because the LCI data provided by the authors are specific for the production of 1 m
2 of perovskite solar module. Thus, it was not possible to make robust assumptions to support the modeling of SnO
2 required for a 1 cm
2 of PSC.
The impact of TNT production [
29] overwhelms the environmental profile of other ETM manufacturing procedures, including the TiO
2 process taken from Ecoinvent database (see
Table S3 in SI). Besides TNT, other ETM production processes exhibit environmental advantages compared with the TiO
2 process present in the database (
Figure 10). In particular, TiO
2 manufacturing process employed in the G1-G2 configurations [
26] shows a very low environmental impact, even if it is the only process that takes TiO
2 as a direct input flow from the database. Concerning other ETM, the use of TiCl
4 as a precursor for the synthesis of TiO
2 is the main source of the impact of the process employed in the E [
27] and S [
28] configurations. The electricity consumption is the principal source of impact in the ZnO production process reported for the G2 configuration [
26], and the use of TiO
2 of the Ecoinvent database shows the higher load on the environmental profile of the TiO
2-based ETM employed in G1 configuration [
26].
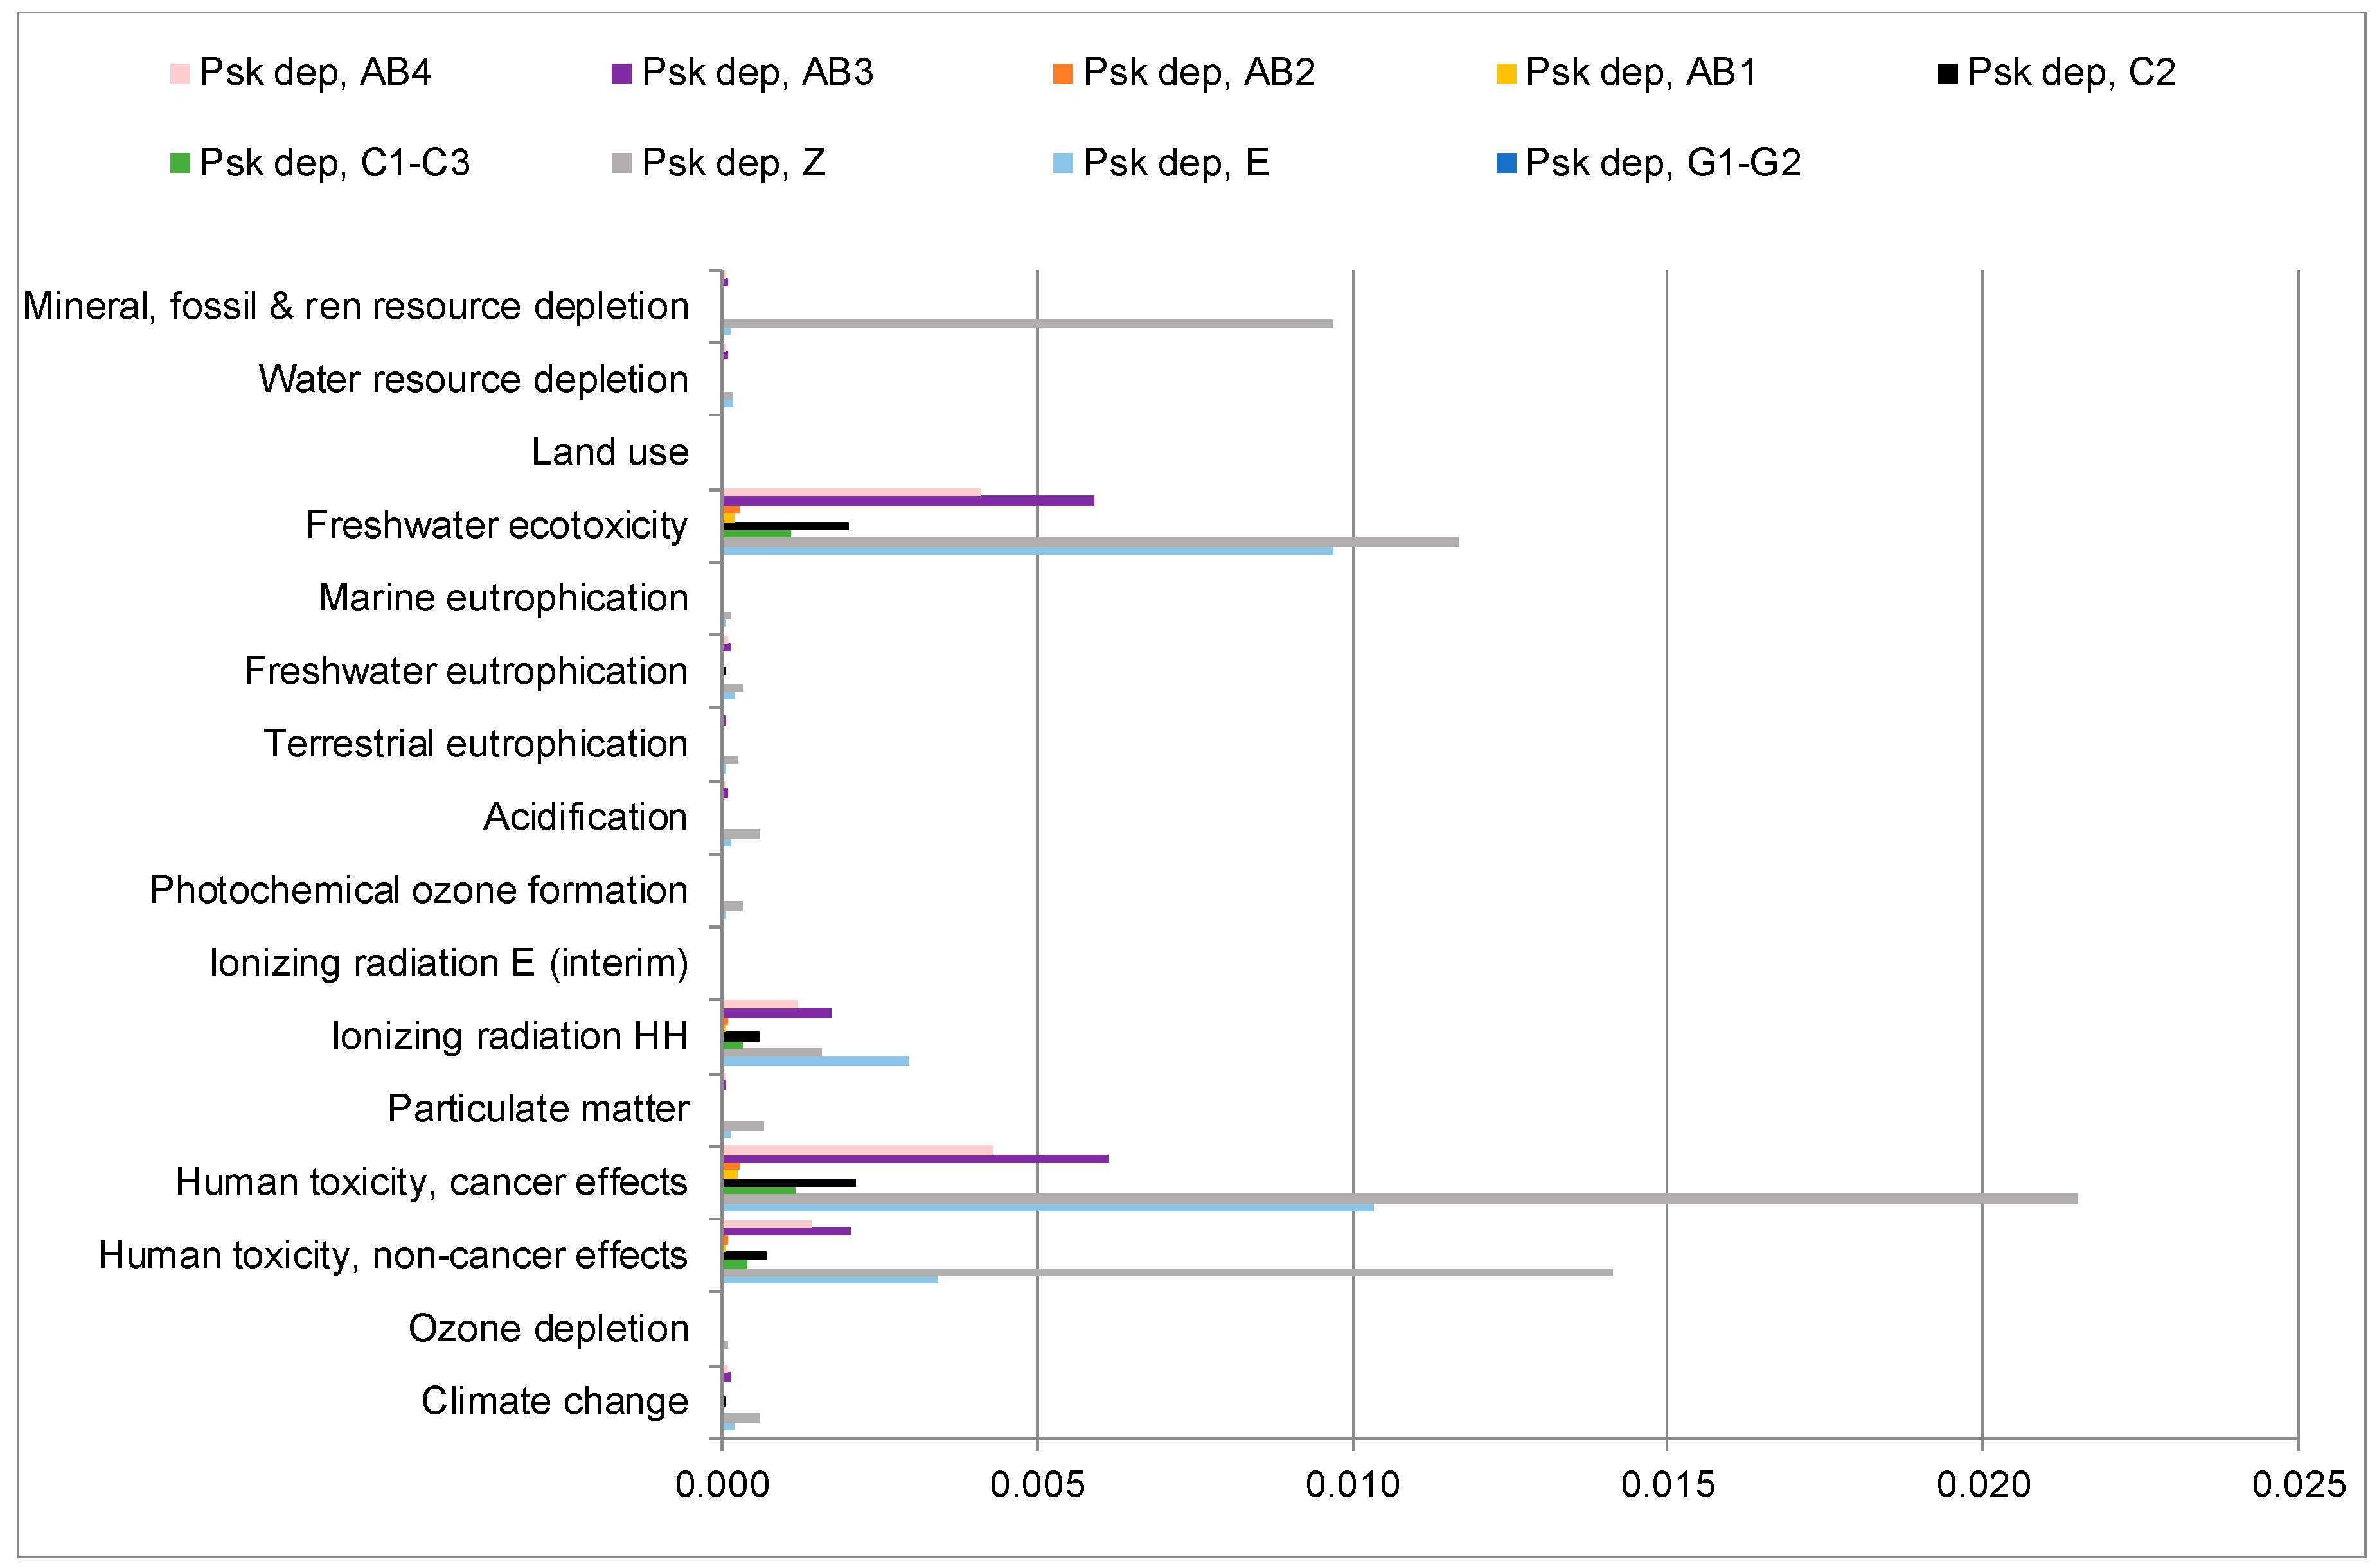
4.4. Perovskite Deposition
In
Figure 11, the comparison among the lead-based perovskite deposition processes is provided. In order to magnify the differences resulting from the analysis, the environmental profile of perovskite deposition employed in the S configuration [
28] is not reported here (see
Table S4 in SI). Indeed, the results of the analysis show that the Sn-based perovskite deposition technique reported by Serrano-Lujan et al. [
28] has a remarkable environmental impact due to direct energy consumption.
The environmental impact calculated for the G1-G2 [
26] and AB1-AB2 [
31] PSC configurations is very limited. The main reason is the low energy and materials consumption during the perovskite deposition process. Regarding G1-G2 configuration [
26], a PbI
2 spin-coating deposition followed by sintering and dipping in methylammonium iodide CH
3NH
3I in isopropanol is reported.
The deposition process employed by Alberola-Borràs et al. [
31] is a spin-coating technique for AB1-4 PSC configurations. Thus, there are some little changes in the procedure steps and the materials used. However, the direct consumption of energy for the spin-coating is the major cause of environmental impact for all configurations. The amount of organic solvent (i.e., diethyl ether) consumed during the synthesis of perovskite compound has a remarkable load on the environmental profile of the Z PSC configuration and leads to a high impact on the toxicity-related categories.
The energy used during the perovskite vapor deposition step reported by Espinosa et al. [
27] represents the process that produces a high burden on the PSC environmental profile. It is the same for the C1-C3 and C2 configurations described by Celik et al. [
30], and the energy requirement causes the highest impact for both deposition methods, solution-based spray for C1-C3 and under vacuum vapor-based for C2.
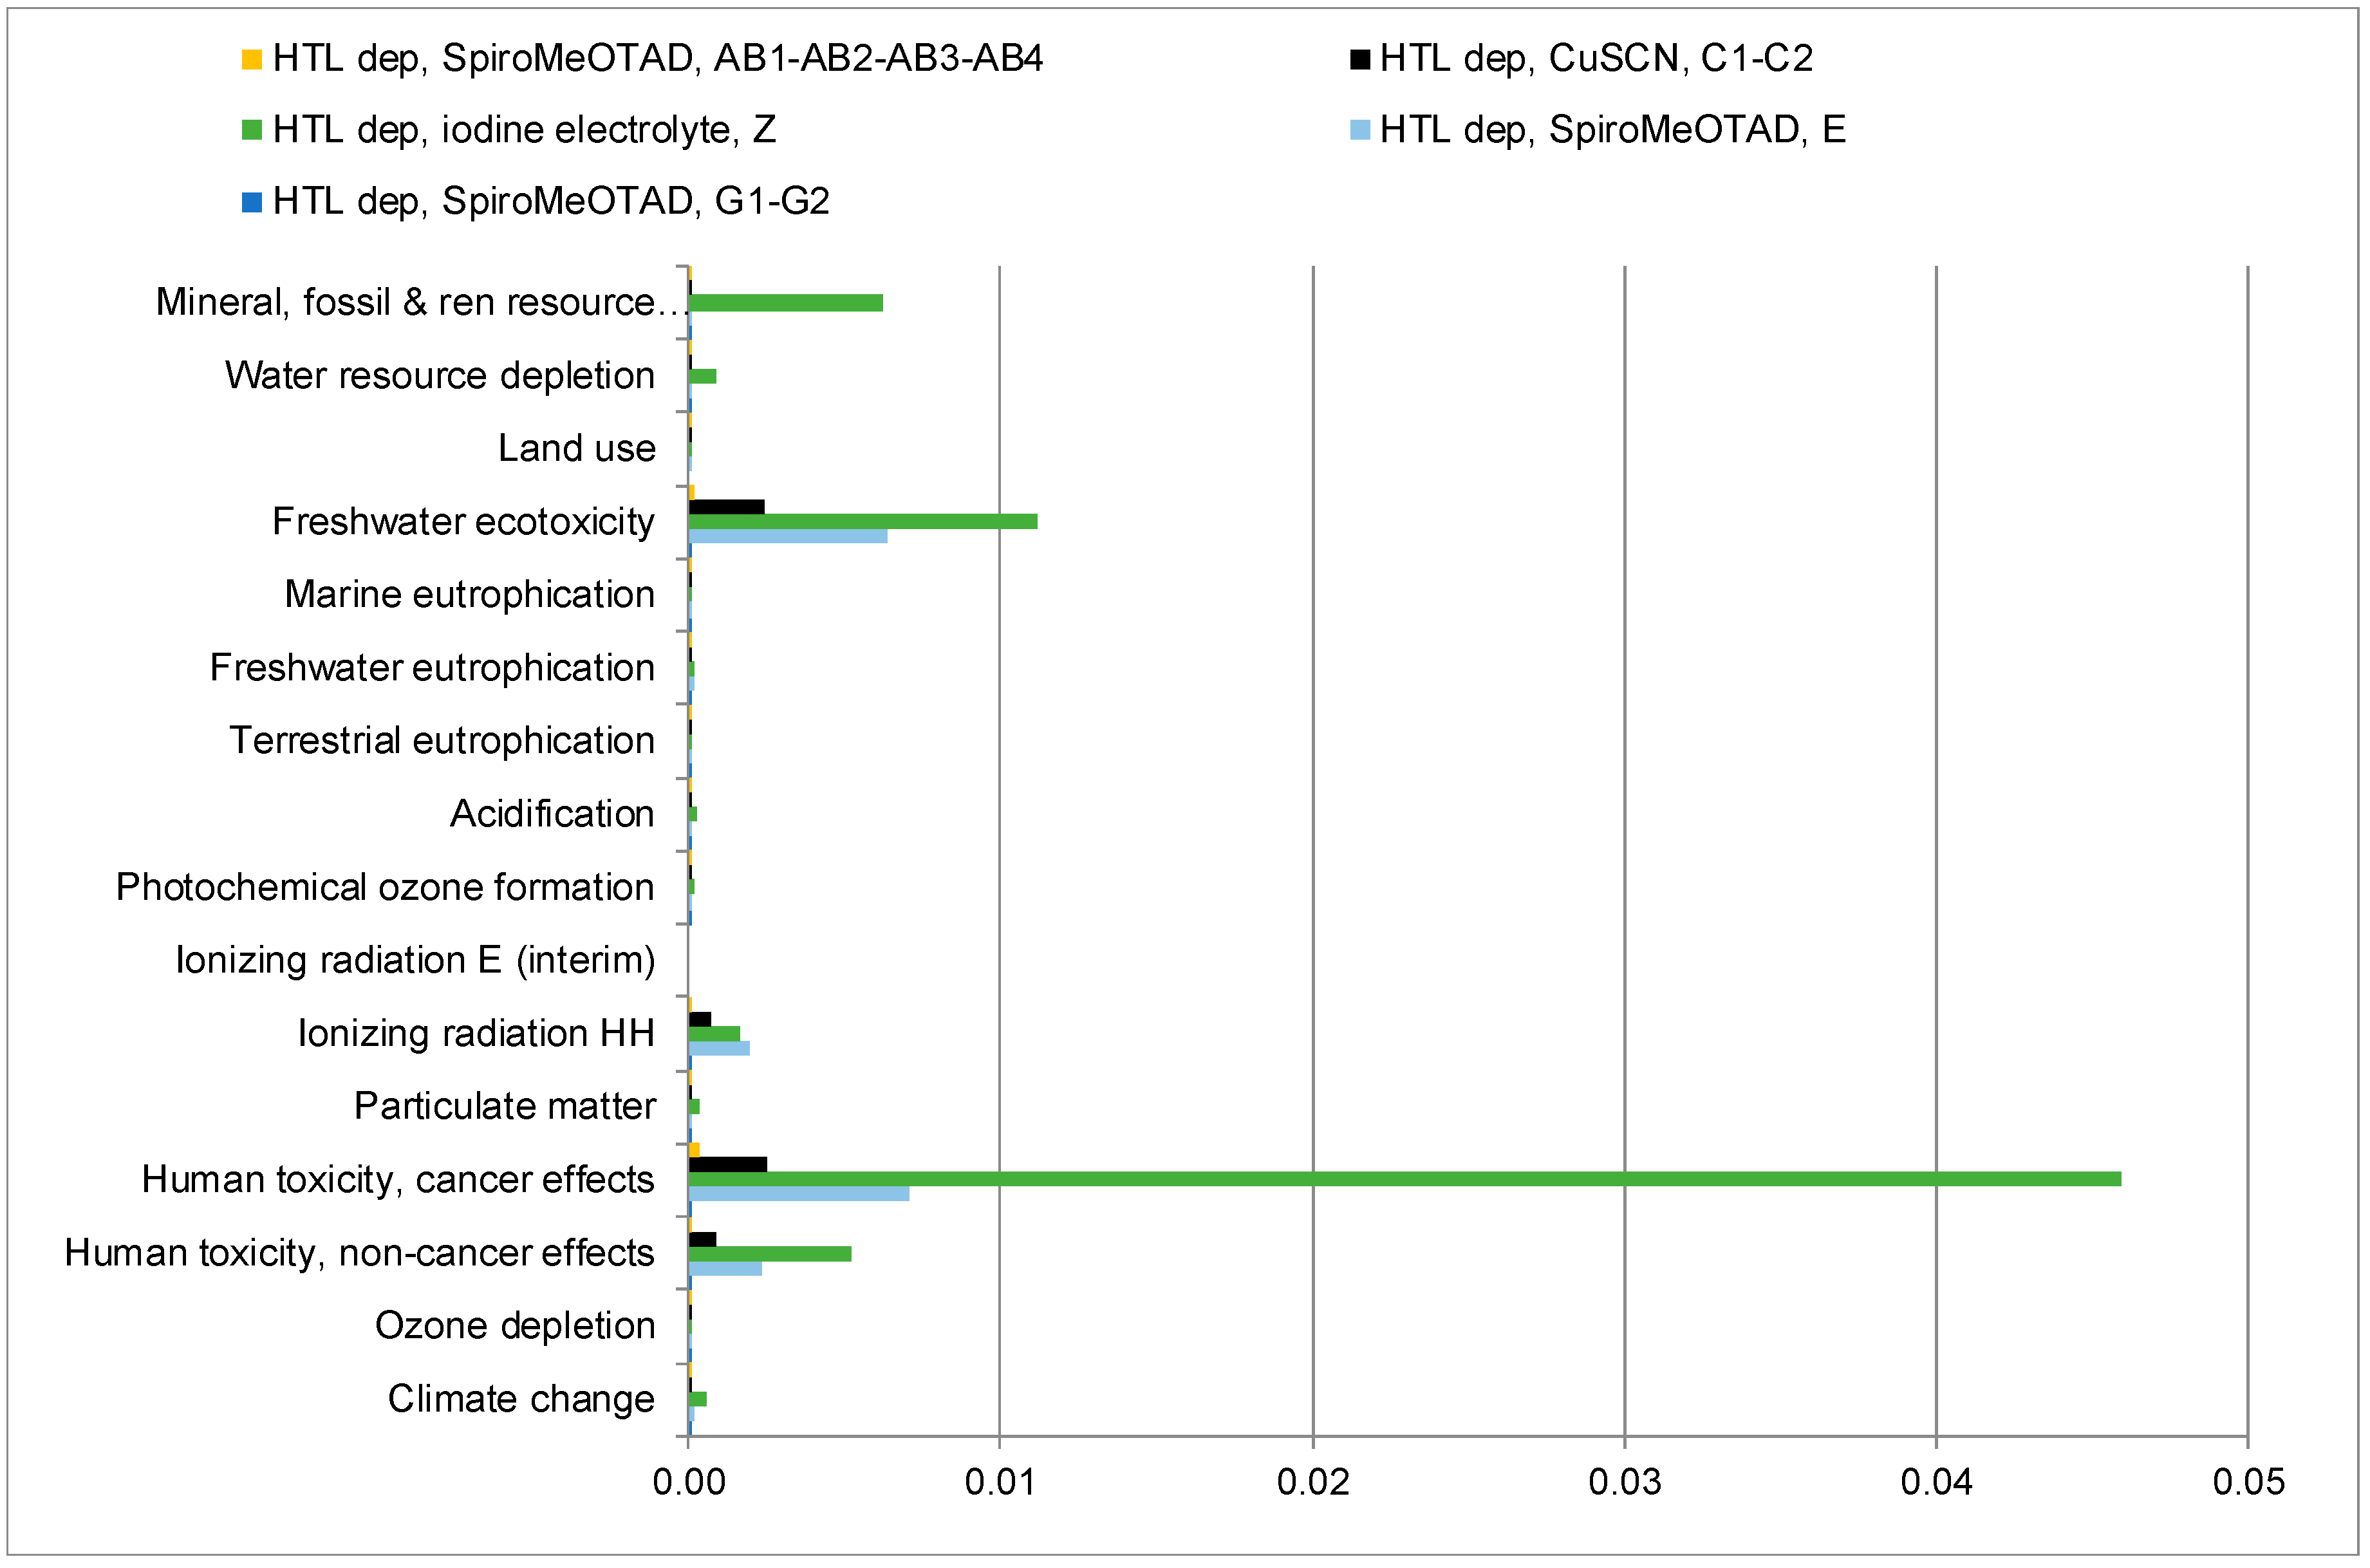
4.5. HTL Deposition
The results reported in
Figure 12 allow the assessment of the major contributions to the environmental profiles of the hole transport layer (HTL) deposition methods. The comparison among HTL depositions described in the selected LCA studies again shows that the impact obtained for the S configuration of [
28] overwhelms the other processes due to the high energy consumption (see
Table S5 in SI). Thus, their environmental profiles are not included in
Figure 12.
The use of the iodine electrolyte shows a significant impact due to the synthetic procedure of LiI employed in the Z configuration [
29]. In particular, the waste treatment is responsible for the substantial environmental burden on the process. Furthermore, the employment of iodine as a raw material has a considerable impact compared to raw materials used in other HTL deposition procedures.
The consumption of energy during the processes is the most critical contribution on the environmental profile of other HTL depositions, despite the different techniques described in the selected studies (e.g., Gong et al. for G1-G2, Espinosa et al. for E, and Alberola-Borràs et al. for AB1-4 modelled a spin-coating deposition process, while Celik et al. C1-3 reported a screen-printing procedure).
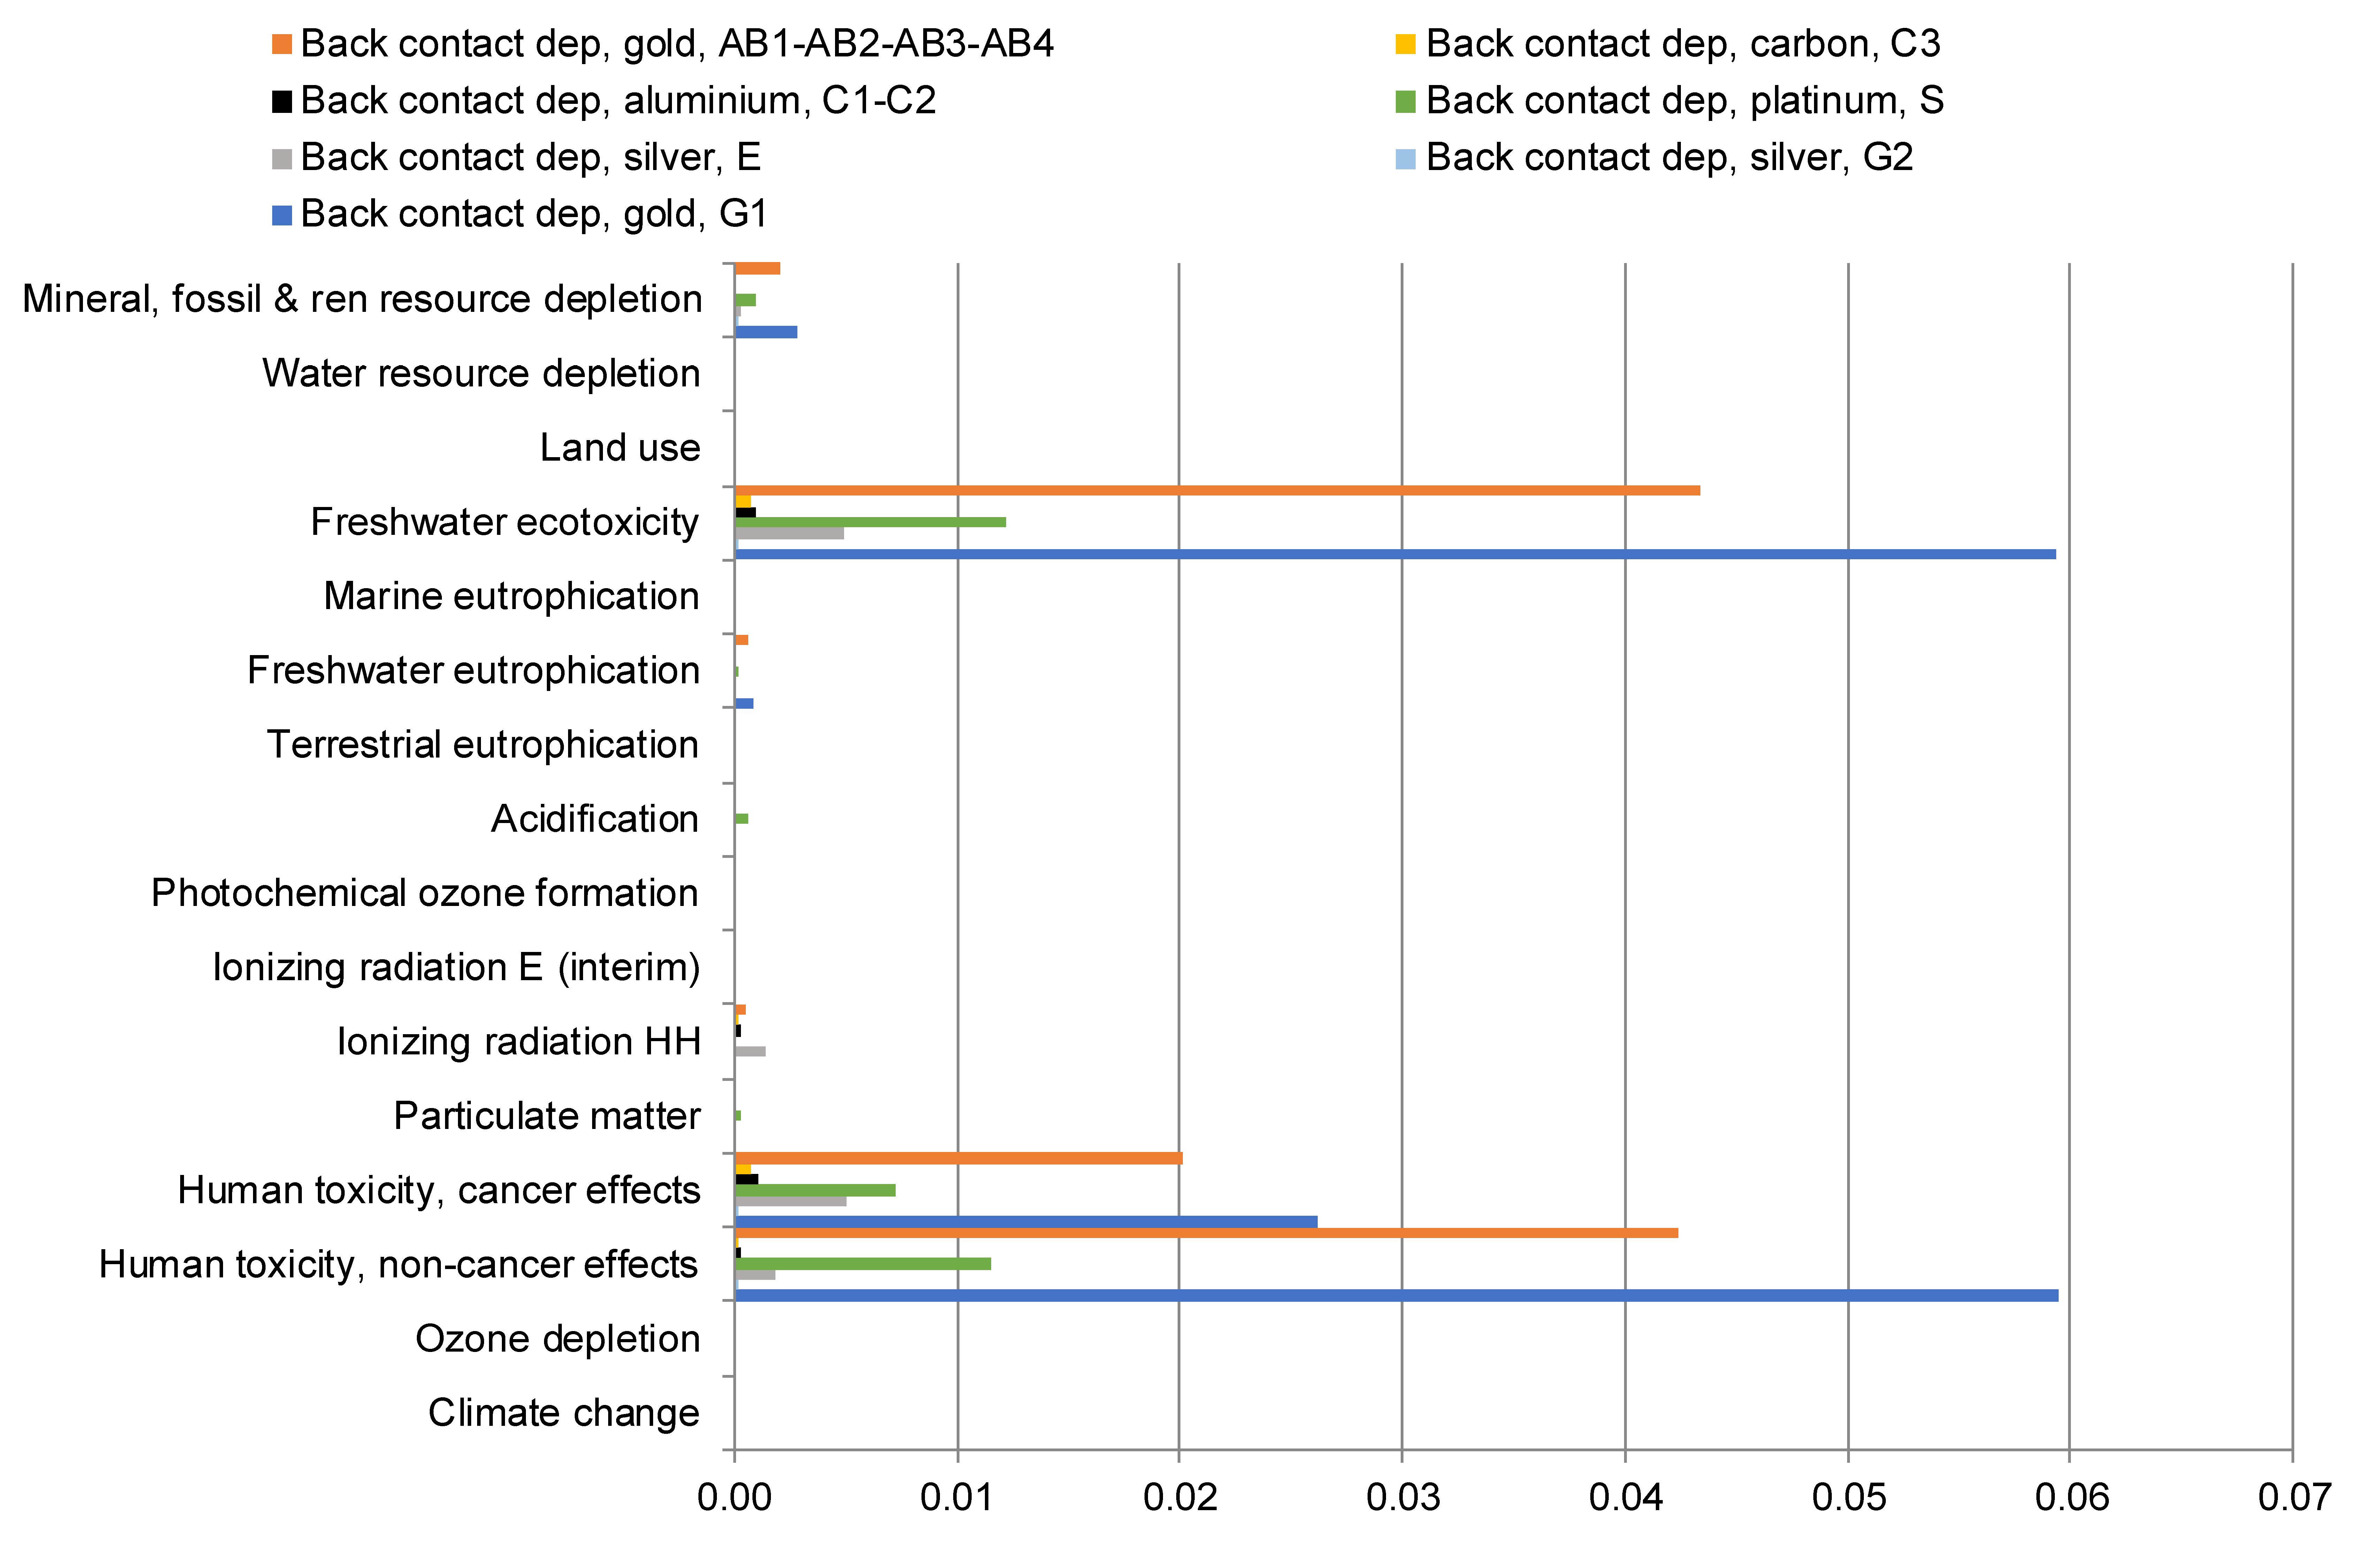
4.6. Back Contact Layer Deposition
As stated in
Section 4, employing gold as the metal for back contact layer production leads to a massive load on the environmental profile of the whole PSC, and this is essentially due to the upstream production processes of gold that are present in the database. The large amount of gold reported by Serrano-Lujan et al. [
28] leads to the calculation of an impact value that is basically out of scale, so it is not included in following
Figure 13 (see
Table S6 in SI for further details).
Despite the PSC configuration containing gold, the employment of Pt in the back contact of the Z configuration reported by Zhang et al. [
29], the use of silver in the G2 configuration described by Gong et al., and the energy consumption of the other back contact deposition processes exhibits a considerable contribution on the environmental profiles.
Concerning the employed techniques, Gong et al. [
26] for G1 and G2, Espinosa et al. for E [
27], and Alberola-Borràs et al. for AB1-4 [
31] considered the deposition if gold and silver layer by thermal evaporation, whereas Celik et al. [
30] reported an under vacuum evaporation for C1 and C2 PSC configurations.
5. Discussion
The results of the harmonization of the selected six LCA studies investigated in this work allowed us to identify the main environmental hotspots of the manufacturing phase of the PSC technology. The most critical raw materials used in the cells resulted to be the metals employed to manufacture the back contact (in particular gold), the conductive solar glass, and the ETL (mainly TiO2 and TNT, due to the high consumption of organic compounds during their synthesis and preparation). Other materials, like lead-based perovskite and hole transport layer, seem to have limited load on the environmental footprint of PSC due to the minimal quantities of this metal present in the cell.
The PSC manufacturing processes that show the highest environmental impact are the back contact deposition, the ETL deposition, and glass substrate preparation.
The energy demand calculated with the CED impact assessment method is directly related with the use and consumption of the raw materials. However, looking at the direct energy requirement of the PSC manufacturing procedure reported in the analyzed LCA studies, several improvements could be obtained in the FTO glass substrate preparation, in the ETL production and deposition, and all the various deposition procedures (i.e., perovskite, back contact, and hole transport material).
One of the most relevant issues discussed in LCA studies on PSC is their toxicity. As also detected by the harmonization performed in this work, despite the relatively low calculated impact of lead, the presence of such metal highly contributes to the toxicity-related environmental categories of the ILCD 2011 method. Indeed, the human toxicity non-cancer effect, the human toxicity cancer effect, and the freshwater ecotoxicity categories show the highest contribution to the environmental profiles of PSCs. In this context, it should be underlined that the high impact shown by these toxicity-related environmental categories is mainly due to the inherent uncertainty of the USEtox model [
46,
47,
48] (explicitly declared by developers) employed by the ILCD 2011 method. In detail, the characterization of the inorganic compounds’ toxicity (in particular, heavy metals) is affected by a high uncertainty in the definition of their environmental mechanism models. In fact, in the USEtox method, they are defined “as interim” and their characterization factors should be employed cautiously. Basically, the USEtox model is useful to identify the 10 or 20 main compounds or processes that have a non-negligible load on the toxicity-related environmental categories, but a further precise analysis should be carried out in order to investigate their fate, exposure, and effects (i.e., ecotoxicological analysis).
Nevertheless, the results provided by the papers published in the literature, should be taken with care in order not to underestimate the problem related to the toxicity and the potential environmental impact of lead. The most common statement combined with the results of the LCA analysis is that the presence of lead in the PSCs is not a relevant environmental hotspot due to the very low amount of lead contained in the perovskite compounds [
26,
27,
28,
29,
30,
31]. However, some studies reported that the emission of PbI
2 in water could lead to a high level of pollution in the surrounding areas of the site of production or use [
17,
18,
19,
20]. The absence of the specific characterization factor for PbI
2 and the high uncertainty in the toxicity modelling of inorganic compound in the USEtox model, together with the lack of primary data concerning the direct emission of lead, PbI
2, and other lead-based compounds that may occur during the whole life cycle of PSC, do not allow a proper evaluation of the real toxicological risk of production and use of PSCs technology.
6. Conclusions
The harmonization of LCA studies on PSCs performed in this study allowed us to outline an environmental ranking of the profiles of PSCs configurations in their manufacturing phase, and, most importantly, to identify the material and energy flows that more contribute to the technology profiles in terms of environmental impact. Results obtained from the harmonization highlight that, especially from the electricity consumption point of view, there is much room for improvement of production processes.
It is noteworthy that the analysis of environmental risk issues associated with the use of large-scale PSCs is one of the main aspects that should need to be addressed. In this context, it is essential that LCA analysts continue to work supporting the technological development of PSC from the earliest stages and that comprehensive life cycle data inventories of primary data are made public and accessible in order to maximize the scientific efforts to minimizing the environmental impact of novel PV technologies.
More importantly, LCA should be used in synergistic way with other methodological and toxicological tools that can properly contribute to assess all environmental impacts linked with the introduction in the market of this promising photovoltaic technology.

 ,
, 


