Article

Performance Analysis of Direct Injection Diesel Engine Fueled with Diesel-Tomato Seed Oil Biodiesel Blending by ANOVA and ANN

1
School of Engineering and Technology, Central Queensland University, Rockhampton, Queensland 4702, Australia
2
School of Bio System Engineering, Shiraz University, Shiraz 71454, Iran
*
Author to whom correspondence should be addressed.
Submission received: 9 September 2019 / Revised: 31 October 2019 / Accepted: 19 November 2019 / Published: 21 November 2019

Abstract

:
Biodiesel is an alternative fuel for diesel engine. Considering the differences between diesel and biodiesel fuels, the engine condition should be modified based on the fuel or fuel blends to achieve optimum performance. This study presented a performance analysis of a direct-injected (DI) diesel engine with a dynamometer fueled with diesel-tomato seed biodiesel (TSOB) blends employing ANOVA and universal nonlinear model based on ANN. The experiments were carried out under conditions of some independent variables including different engine loads (0, 50, 100%) and speed (1800, 2150, and 2500 rpm) for four diesel-biodiesel combinations (B0, B5, B10, and B20). In this research, the effect of these factors on dependent variables including power, torque, SFC, FC, and Exhaust Gas Temperature (EGT) are investigated. Duncan′s multi-domain test at a significance level of R < 0.01 shows that the highest and lowest of the torque and power are produced from B5 and B20, respectively. These results show that the lowest EGT of 613 K is related to B20 and the highest EGT is related to B5 and B10. The regression models showed that the torque decreases with increasing the engine speed and biodiesel percentage. These results also show that the highest and the lowest SFC is related to B0 and B20, respectively. The ANN model shows high capability of predicting the engine performance parameters and emissions, without running costly and time-consuming experiments with the histogram error of 0.004 and R = 0.96. It also proved that ANN is a non-linear model of choice to deal with these data, instead of multivariate linear regression employed for preliminary analysis.

1. Introduction

Biodiesel is readily available (geographically independent) and is an environmentally-friendly source of fuel. Biodiesel is comprised of mono-alkyl esters of long-chain fatty acids that are made from renewable natural sources such as vegetable oils or animal fats, and it is very similar to diesel. Tomatoes are used to produce products such as puree, juice, tomato sauce, and tomato paste. The remaining residue and waste contain skin, seeds, and other parts. It is not suitable for human consumption and is commonly used as animal feed [1]. Tomato seed is the major waste of the tomato paste industry and is considered to be about 71–72% by weight of the total waste produced in this industry [2]. Also, poor quality tomatoes are separated as waste during the sorting process in the factory. In addition, pulp dry weight of the waste is tomato seed, which contains an average of 29% protein and 22% fat [3]. Tomato waste may be consumed in animal nutrition or used in plant fertilizers [4]. Another study has indicated that seed contains about 24% oil [5]. In another study, tomato seed was found to contain 18–23% oil, which can be used to make biodiesel [6,7]. Biodiesel is compatible with conventional diesel and could be mixed with any ratio of diesel for running an engine [8,9]. The main differences between biodiesel and diesel are lower calorific value and the source from which these products are derived, and the manufacturing process behind their production, which limit the oxygen content. The amount of oxygen in diesel is zero, while it is 10 to 12% in biodiesel, and this reduces the energy density as well as reduces the emissions of suspended particles. Biodiesel is considered a clean fuel; however, research shows that biodiesel has a large Cetane Index which reduces the ignition time, but, on the other hand, its Lower Heating Value (LHV) is lower than that of diesel and thus produces lower power in the engine [10,11,12]. Renewability, lower amounts of combustion pollutants are one of the most important reasons for choosing the biodiesels as a substitute for diesel [13]. Approximately, one-third of the world′s fossil fuels are consumed in internal combustion engines (ICEs), which emit harmful exhaust gases and are the main reasons for environmental pollution. Diesel engines operate relatively more efficiently than petrol engines. The current and future regulation of pollution requires exploration of fuels to produce cleaner source of energy. Using biodiesels as alternative fuels in diesel engines has advantages including reducing or eliminating the sulfur dioxide, carbon monoxide, and unburnt hydrocarbons in exhaust gases. In general, the oxygen that exists in the biodiesel molecule causes more complete combustion and reduction of environmental pollution. Limitation of available fossil fuels, the excessive increase of environmental pollutants caused by fossil fuels, depended on countries of fossil fuel exported and its derivatives, as well as other limiting factors, have led to an increasing research approach towards renewable fuels and their applications [14]. Although there are many research studies available on engine performance and emissions testing using different types of biodiesels, limited research is available on biodiesel produced from waste tomato seeds [15]. However, the main purpose of this paper is to progress a computational model, with presenting an ANN model by which one can predict the engine performance parameters and component wear of the engine fueled with any hypothetical mixture of D-TSOB at any engine speed and load, without doing real tests and spending too much time and money. This study tested, assessed, and simulated the potential of the D-TSOB blends as an alternative fuel for the CI engines, which has not been studied earlier. For this, performance analysis of a DI diesel engine, with the dynamometer, fueled with four D-TSOB blends at three loads and speeds, a total of 36 different engine conditions, were experimentally measured. Multivariate analysis was done based mainly on ANOVA, although the multivariate linear regression was employed for preliminary analysis. The ANN model with three input and six output variable parameters was generated. The ANN model allows a variety of profits to be assessed and be a guide for engine industrialists, biodiesel makers, biodiesel users and policy makers. Some of these benefits include developing engine technology, dropping injurious gas emissions, and rising fuel efficiency, sustainability and optimum uses of biodiesels as an engine fuel. However, further research can be done on CFD model development on combustion and emission characteristics of CI engines.

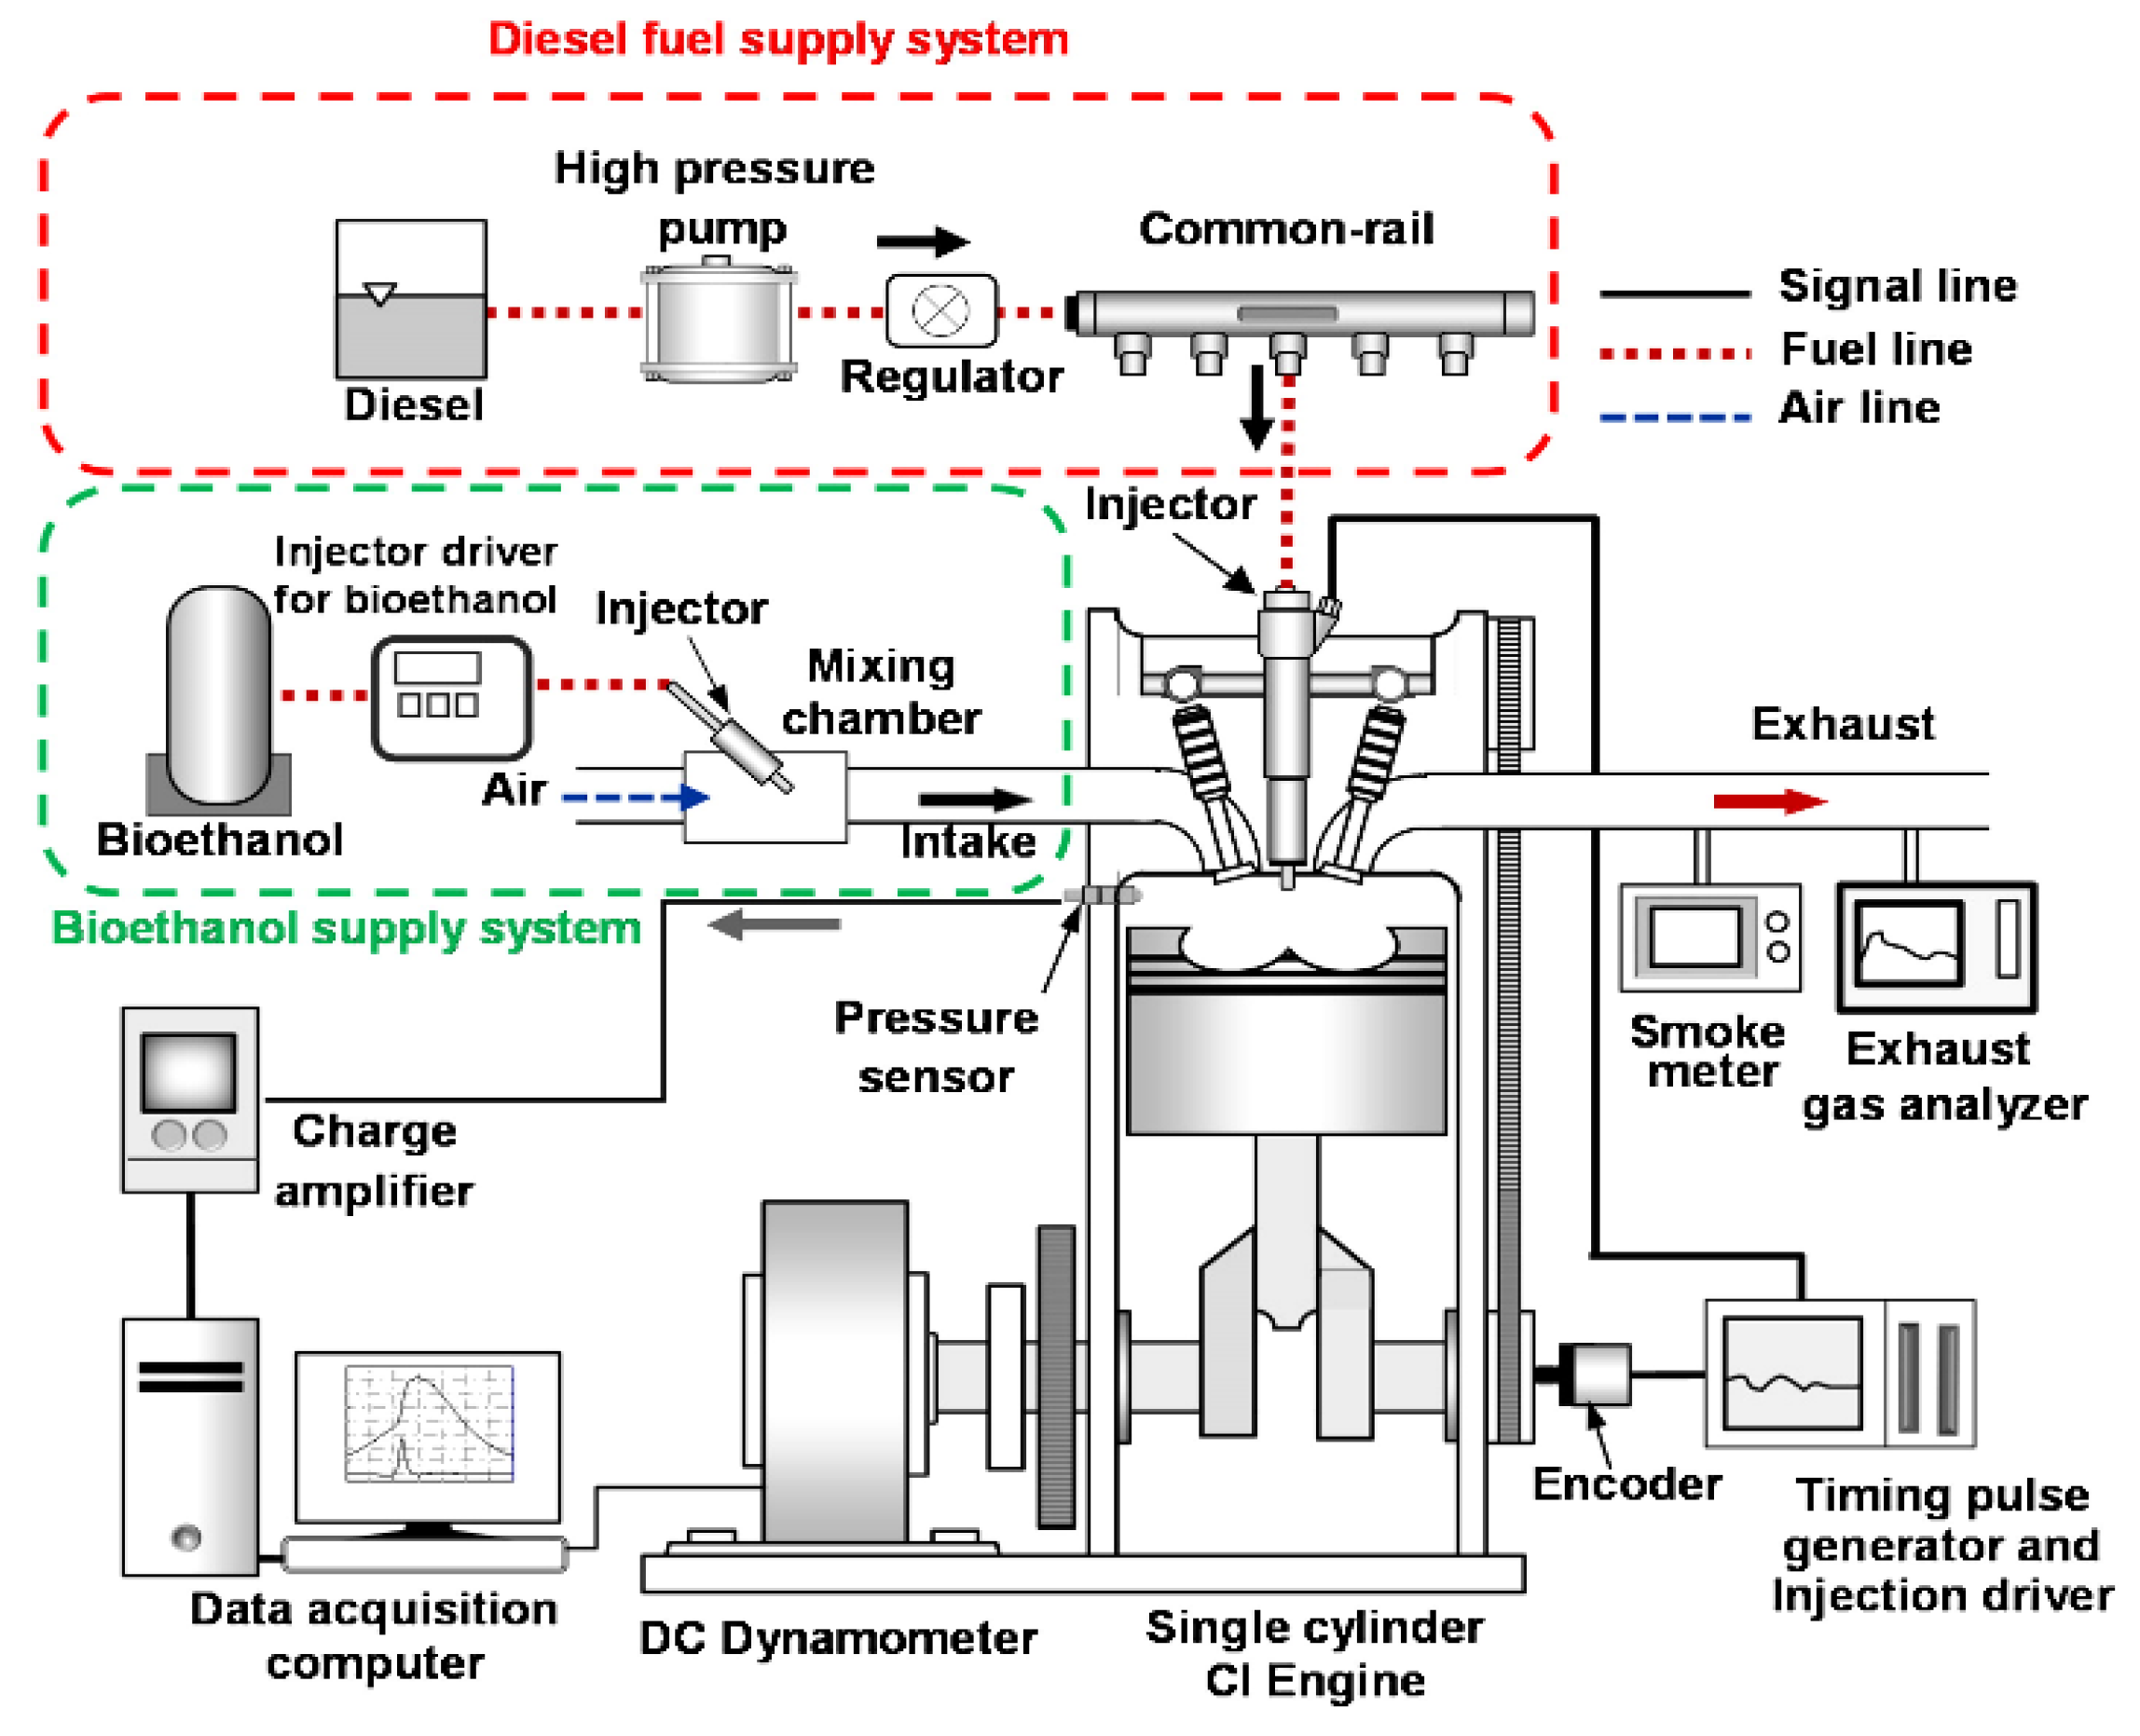
2. Material and Methods

The biodiesel fuel used in this study was methyl ester obtained from seed waste oil of the tomato. The properties of the TSOB according to the American Society for Testing Materials (ASTM) standard, including density, viscosity, flash point, pour point, Cetane Index, etc., were measured by the independent chemical laboratory Alborz Tadbir Karan in Iran; and are shown in Table 1.
In this research, biodiesel and diesel were mixed at various volumetric ratios. These fuel blends contain 5%, 10%, and 20% volumetric biodiesel and are expressed as B5, B10, B20, respectively. Pure diesel (B0) was used as a control fuel. The mentioned biodiesel and diesel blends were tested in a diesel engine at zero loads, 50% full load and 100% full load and at 1800, 2150 and 2500 rpm speeds. The WE400 Eddy current dynamometer manufactured by Mobtakeran Pars Andish, was used to measure the torque, rotational speed and power of a single-cylinder air-cooled 3LD 510 (DI) diesel engine with a maximum 12 hp capacity, manufactured by Italian company “Lombardini”. WE400 Eddy Current Engine Dyno provides low-inertia, air- or water-cooled operation for testing engines up to 54 hp (40 kW), 130 Nm and 8000 rpm. To measure FC in kg/h, and Exhaust Gas Temperature (EGT) in K the Dina Engine Fuel Consumption Measurement System and AVL DISMOKE 480 BT, with measurement accuracy ±8% kg and ±5 K were used, respectively. Moreover, the technical features and characteristics of the engine are shown in Table 2.
In conjunction with engine torque measurement, EGT was simultaneously recorded. The fuel mass rate was measured in kg/h by a fuel measuring system. The Brake SFC of the engine was calculated by dividing the fuel mass rate by engine power. These experiments were carried out based on a short-term test, as a factorial experiment in a completely randomized design (CRD). For each test, the engine was initially turned on for about 10 min, after the engine achieved a stable state and was ready to test, data was recorded. During the experiments, in order to increase the accuracy of data analyzing, cylinder pressure information for 50 working cycles were recorded on the computer automatically. Schematic of a Control devices of a one-cylinder engine parameters and dynamometer is shown in Figure 1. Finally, the averages of these 50 cycles of data were used in the analysis of the experimental results by SPSS software version 18.

3. Results and Discussion

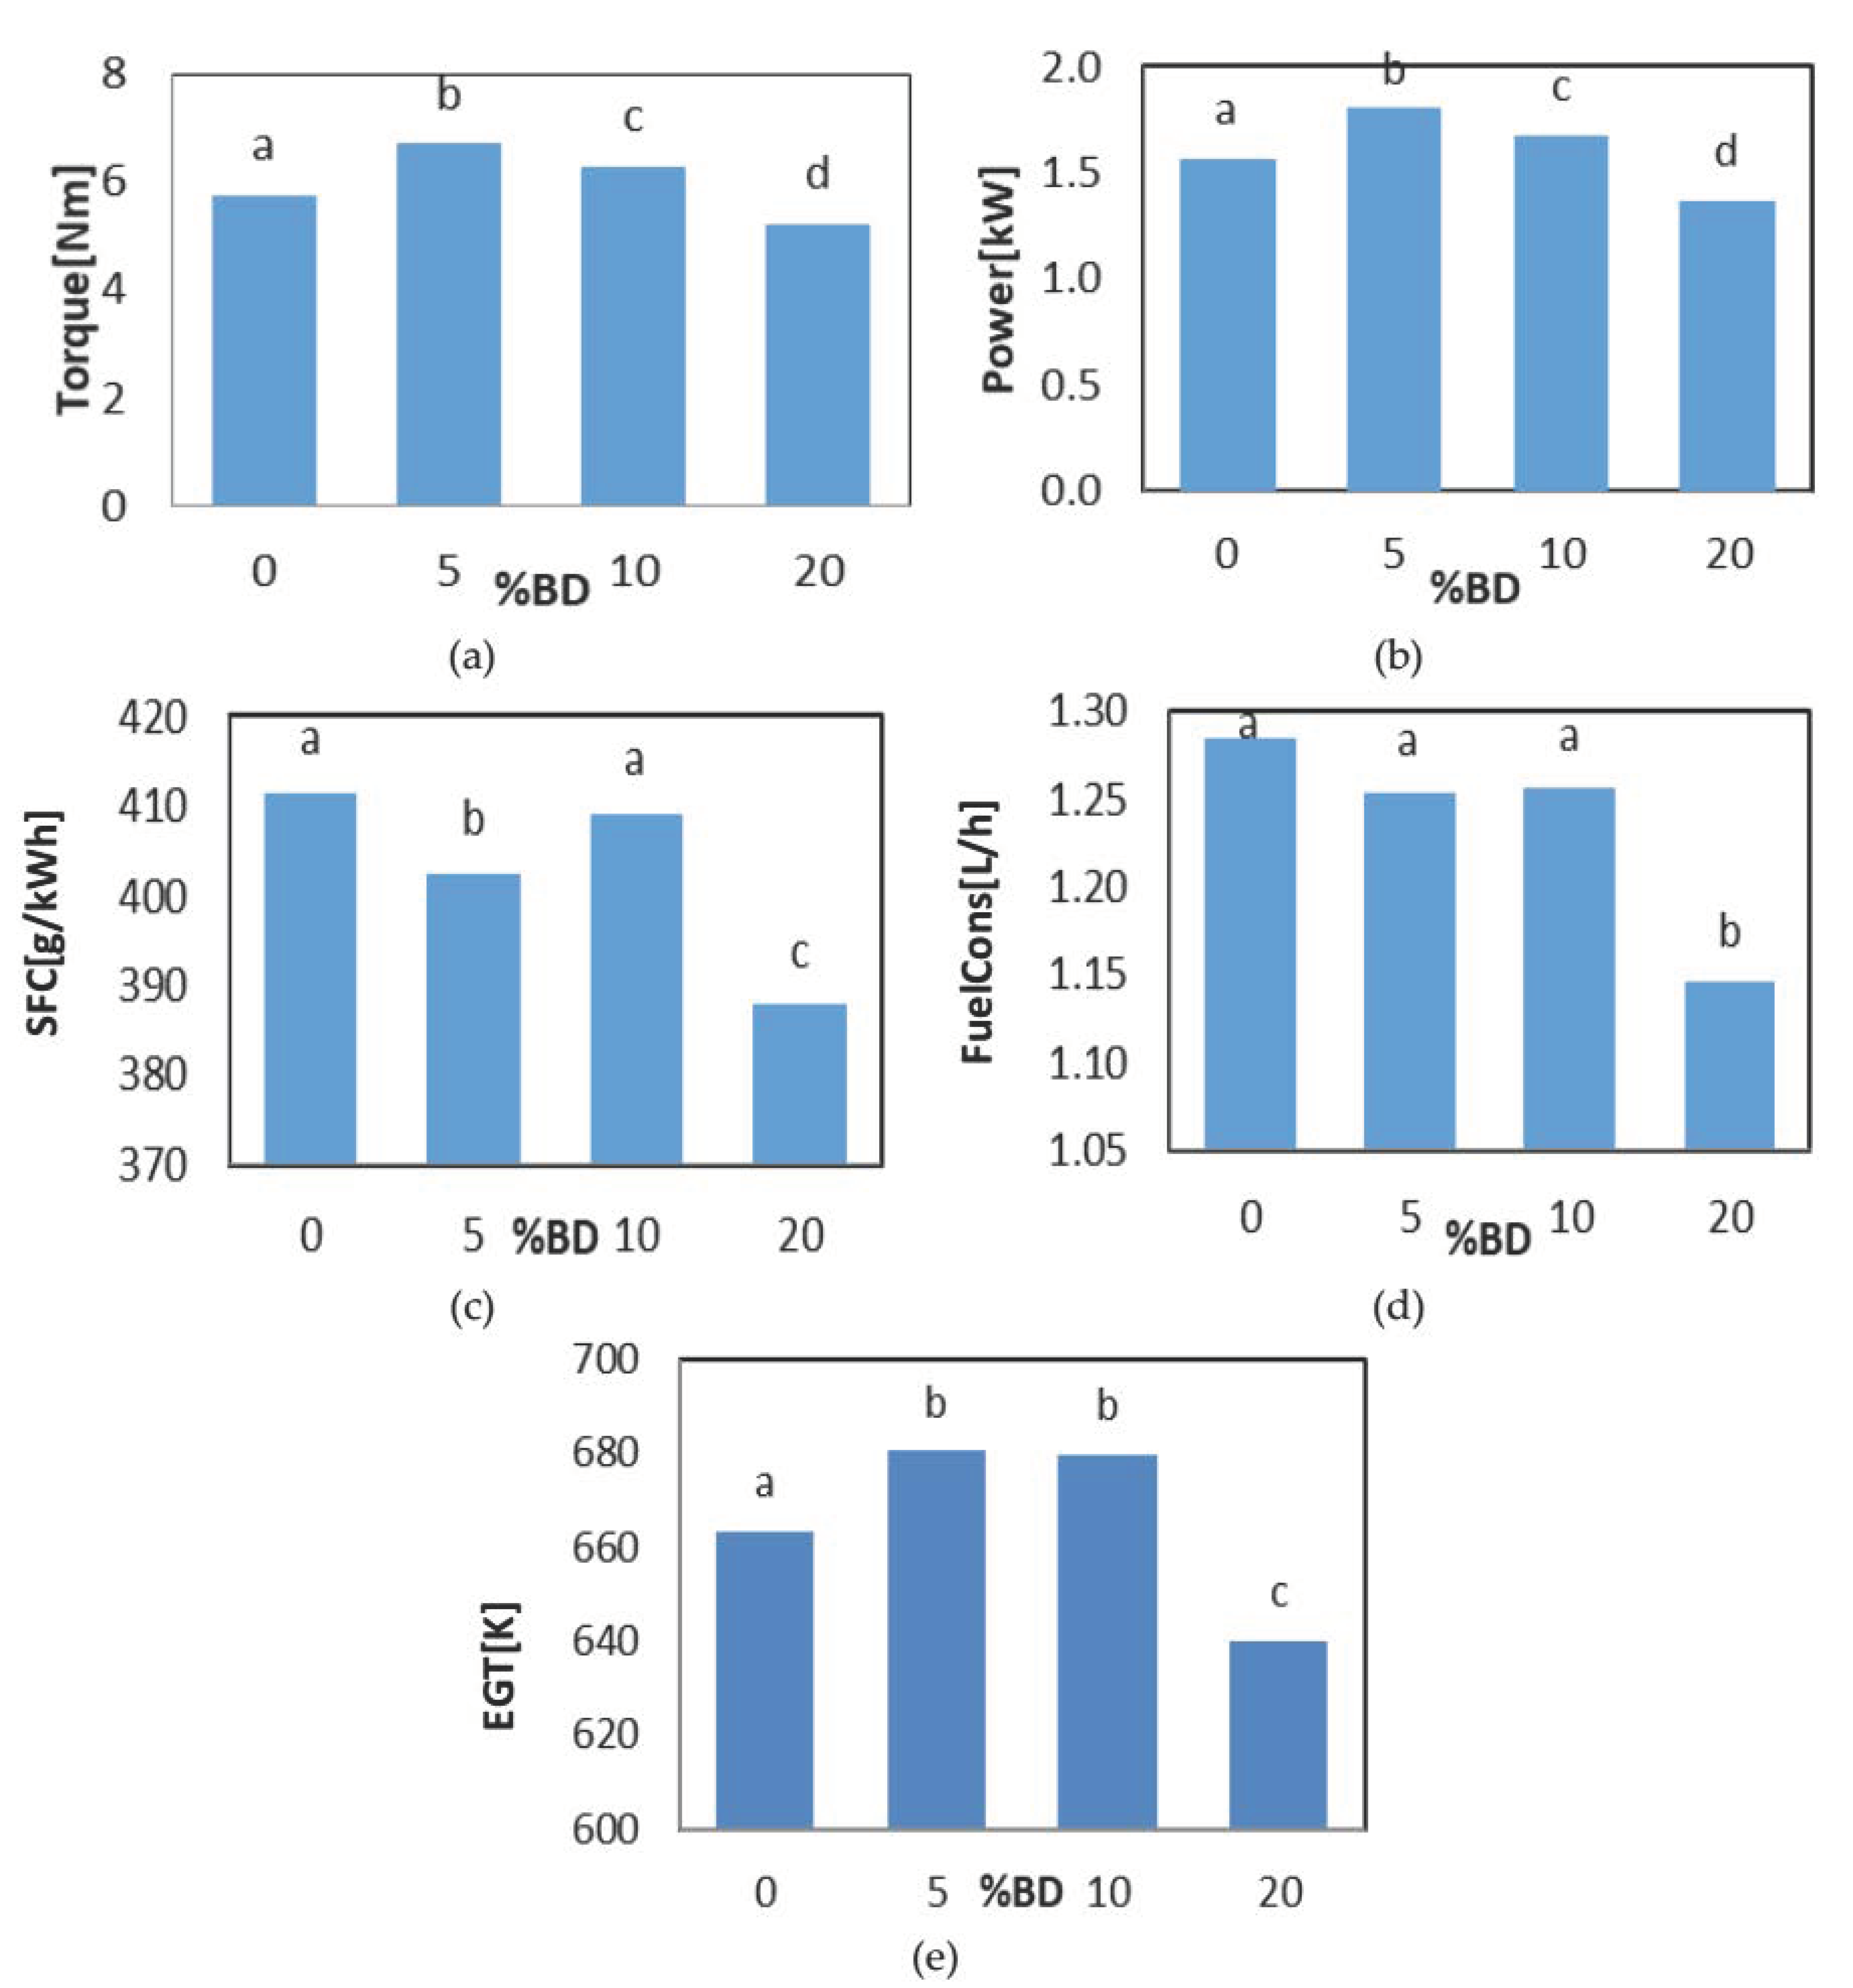
3.1. ANOVA Using Post Hoc Duncan Multi-Domain Test

The Post Hoc Duncan multi-domain test results of the engine performance characteristics are shown in Figure 2. Figure 2a,b show the highest amount of torque and power, respectively, produced from fuel which contained 5% biodiesel and the lowest amount of torque was produced from the B20 fuel. Fuel B5 produces 12% more torque than diesel. The B20 produced 6% less torque than diesel. Figure 2b, also shows that fuel B5 produced 3% more power than diesel and B20 produced 13% less power than diesel. The reason for increased power from biodiesel is its oxygen content and high FC, as well as the low LHV of waste oil biodiesel, which can be the cause of decreased power [16]. Murillo et al. [17] reported that, at full load, B20 biodiesel power is reduced by 14.7% compared to diesel and they also concluded that the biodiesel LHV is 13.5% less than diesel [18]. Also mentioned in a review study that, in the use of biodiesel fuel with a low percentage of diesel, the power decreases slightly, and this reduction is not tangible for vehicle drivers. Figure 2c indicates that the highest SFC is in the B0 and B10 and the lowest SFC is related to B20, which is 6% less than that for the pure diesel. In the engine SFC, density has a direct impact, and the LHV of the fuel has a reverse effect. Therefore, for same load, that fuel blend will have the lowest SFC which has both low density and high LHV (i.e., the desired state between diesel and biodiesel). The reason for the reduction of FC in the fuel mixture with 20% biodiesel is due to the greater effect of increasing the density compared to the LHV depletion on FC [19].
Figure 2d shows the effect of biodiesel fuel percentage in diesel and biodiesel blends on the rate of FC. Duncan′s test showed that B20 has the lowest fuel flow rate than others blends. The results of calculating the FC rate in different test states indicate that, in order to produce the same power by increasing the biodiesel percentage in diesel and biodiesel blends, the FC rate is reduced. The cause of reduction of FC rate by increasing the biodiesel percentage in diesel and biodiesel blends up to 20% by volume is the improvement of combustion condition with the desired state of viscosity and density of the fuel blend [20]. As shown in Figure 2e, by increasing the percentage of biodiesel in fuel blends, the EGT increases up to around 10% for B10 and then decreases with the further increasing of biodiesel percentage in fuel blends up to B20 which is around 613 K. The increase in EGT of B10 fuel blend is due to increased cylinder pressure caused by the 10% biodiesel percentage in the fuel blend, and, with further increasing of biodiesel percentage, the cylinder pressure decreases and consequently it reduces the EGT [19]. This can be indicated that at higher loads, more fuel is injected, resulting in a higher rate of heat release and higher EGT [21]. Also, at higher loads, the lower heating value of biodiesel leads to higher BSFC, injecting more fuel to meet the power requirements [22]. Increasing the biodiesel fuel percentage increases cylinder pressure; thereby, increases the EGT. However, with a higher percentage of biodiesel, the cylinder pressure decreases and, as a result, reduces the EGT [23].

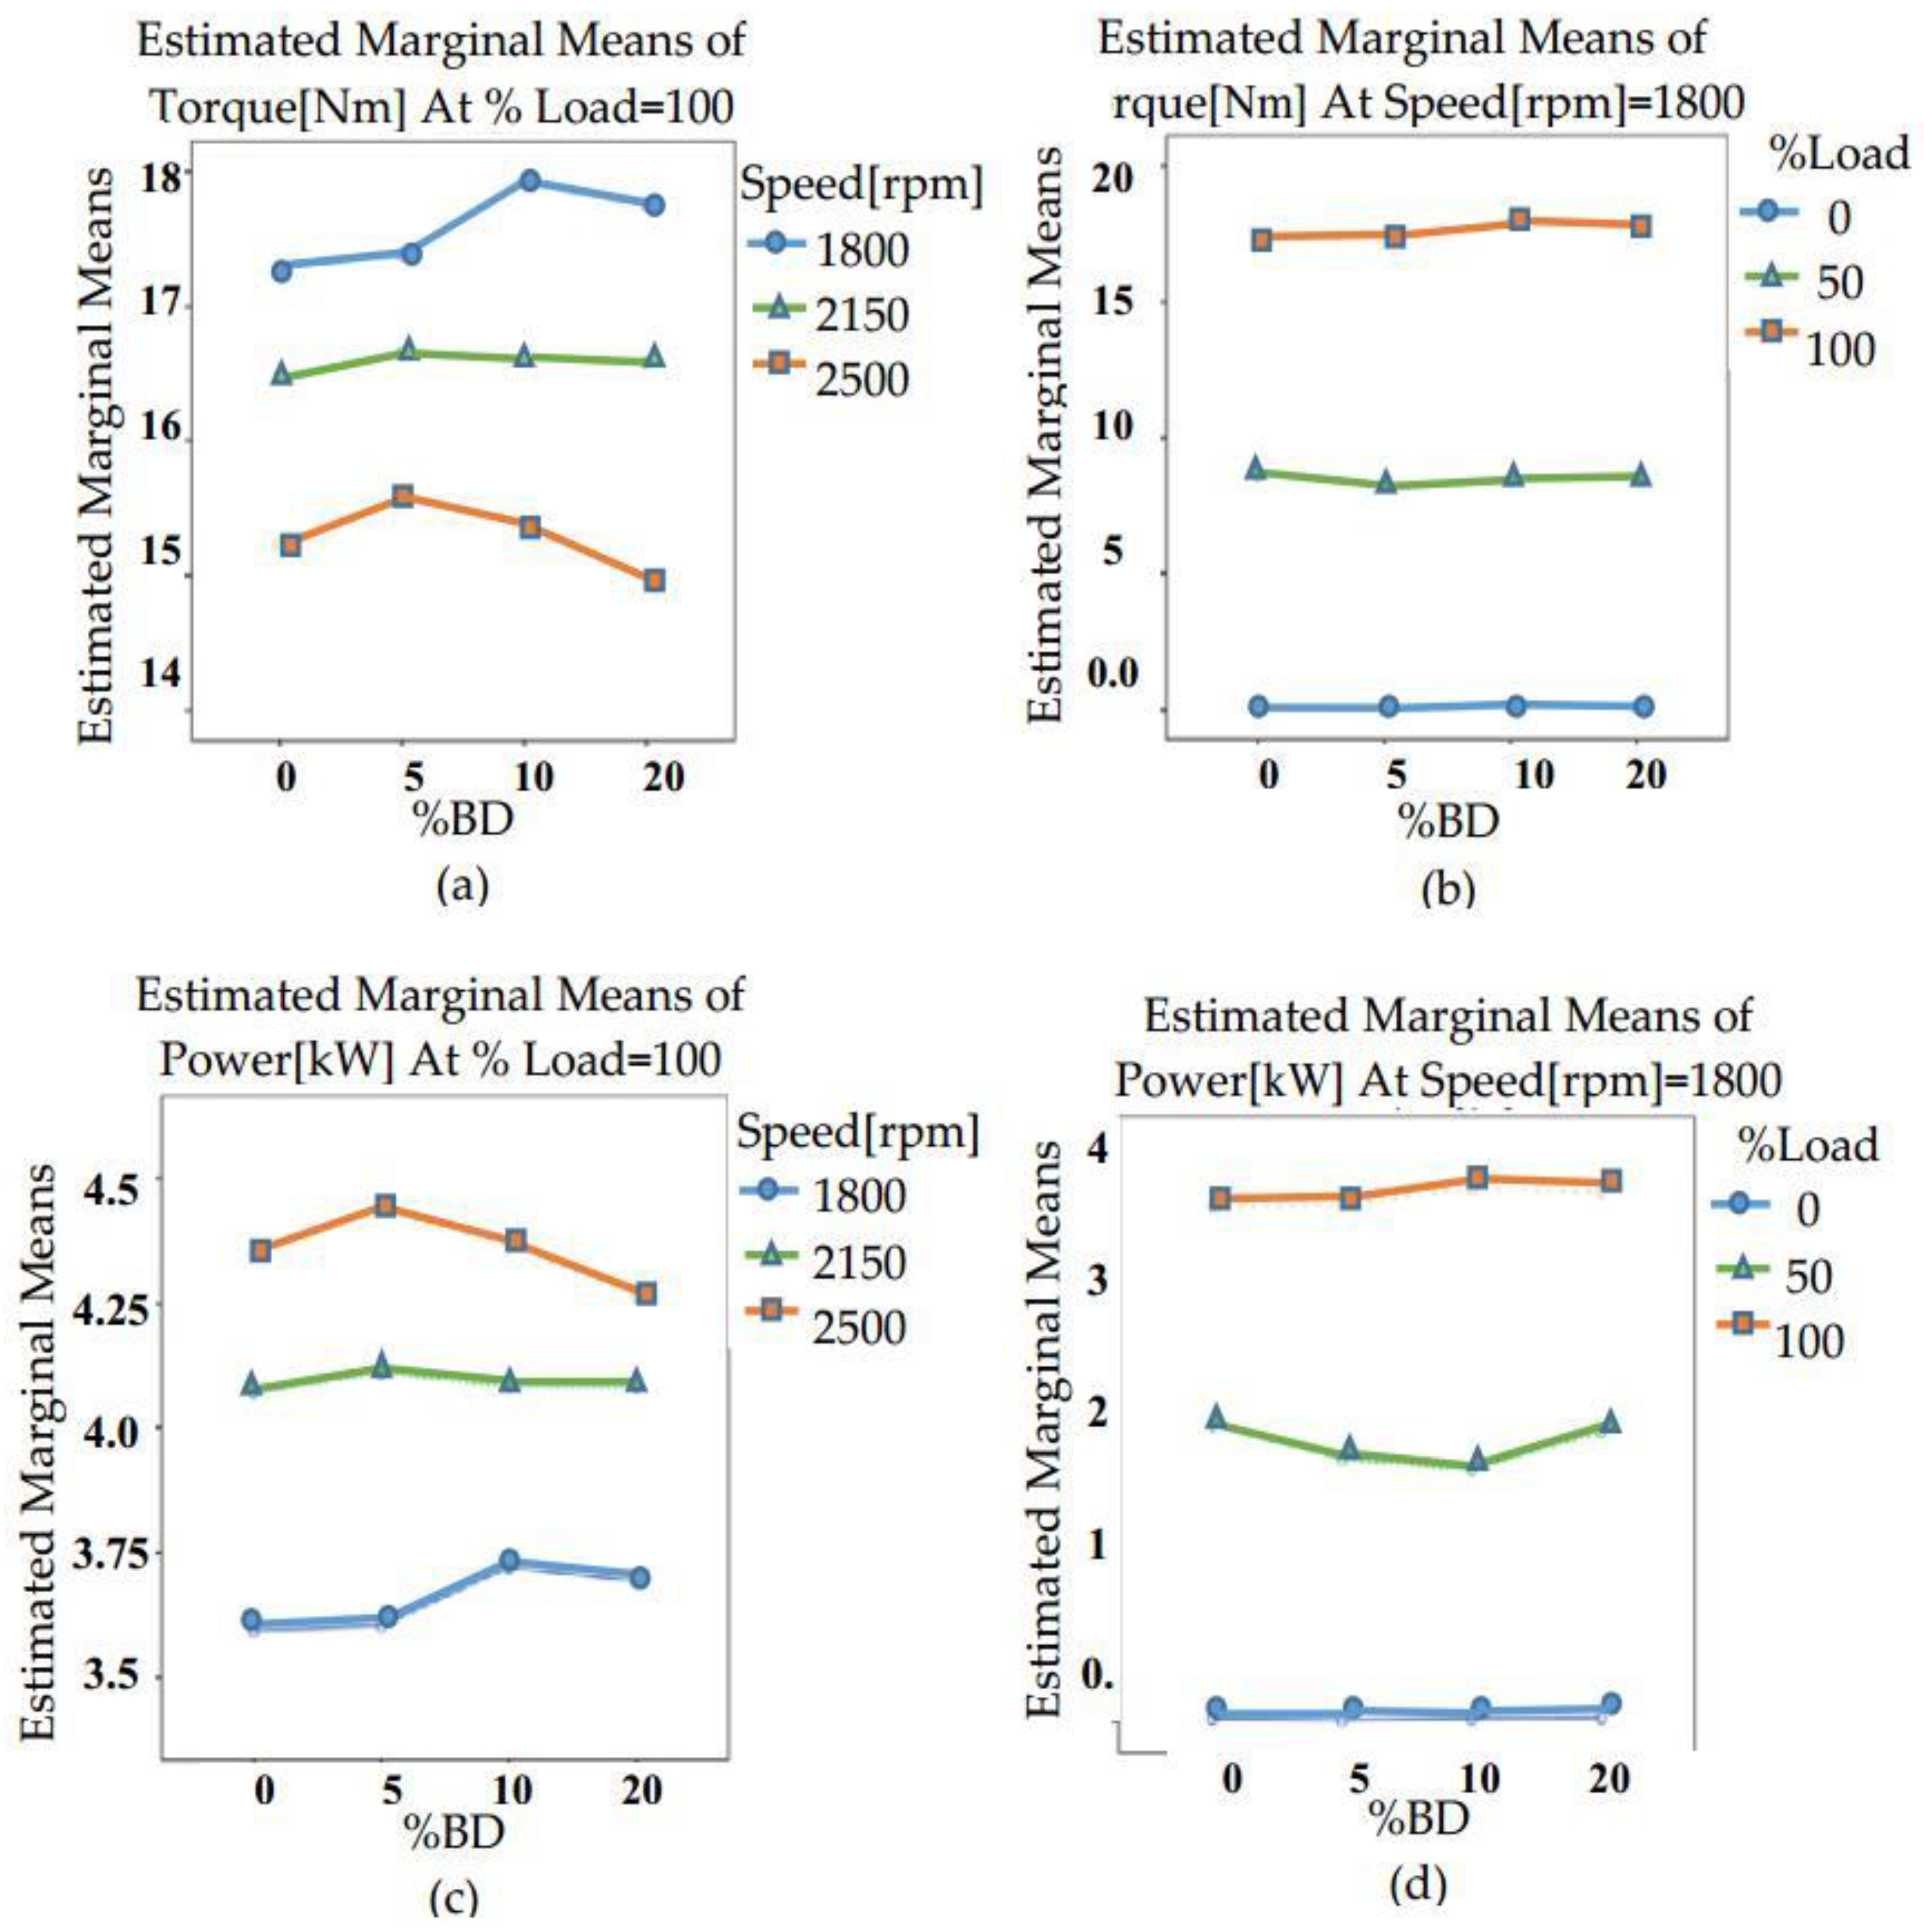
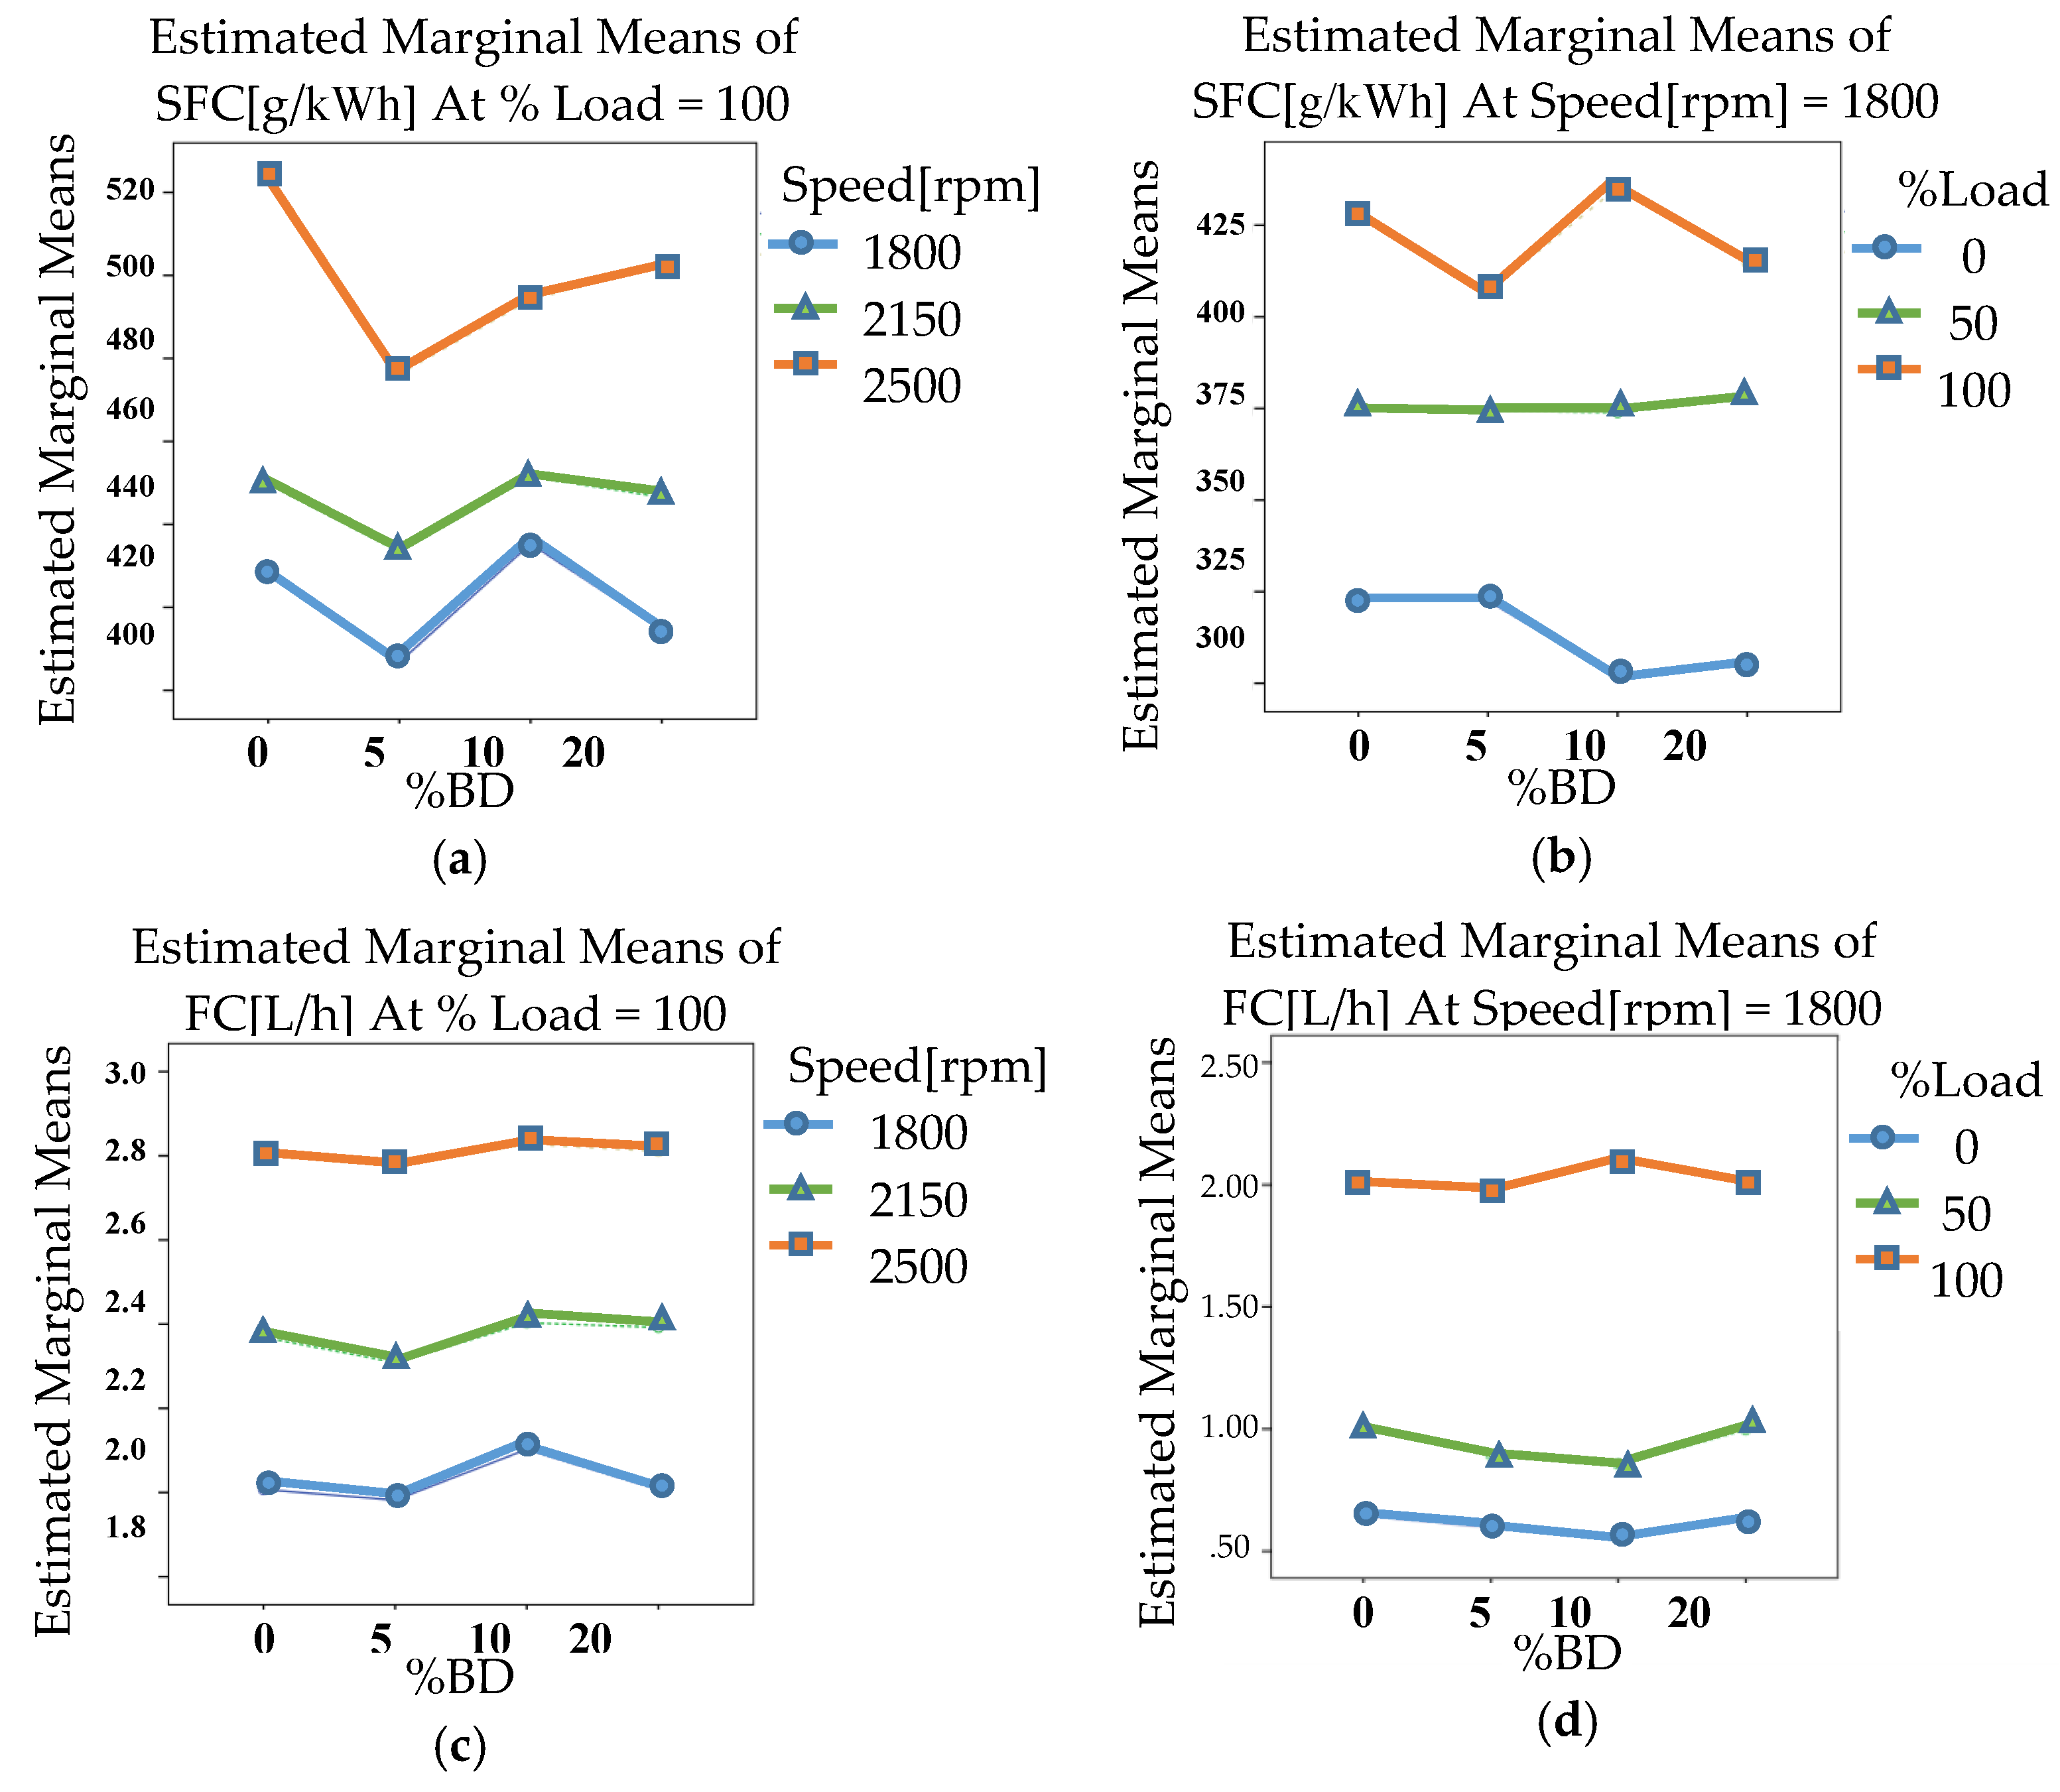
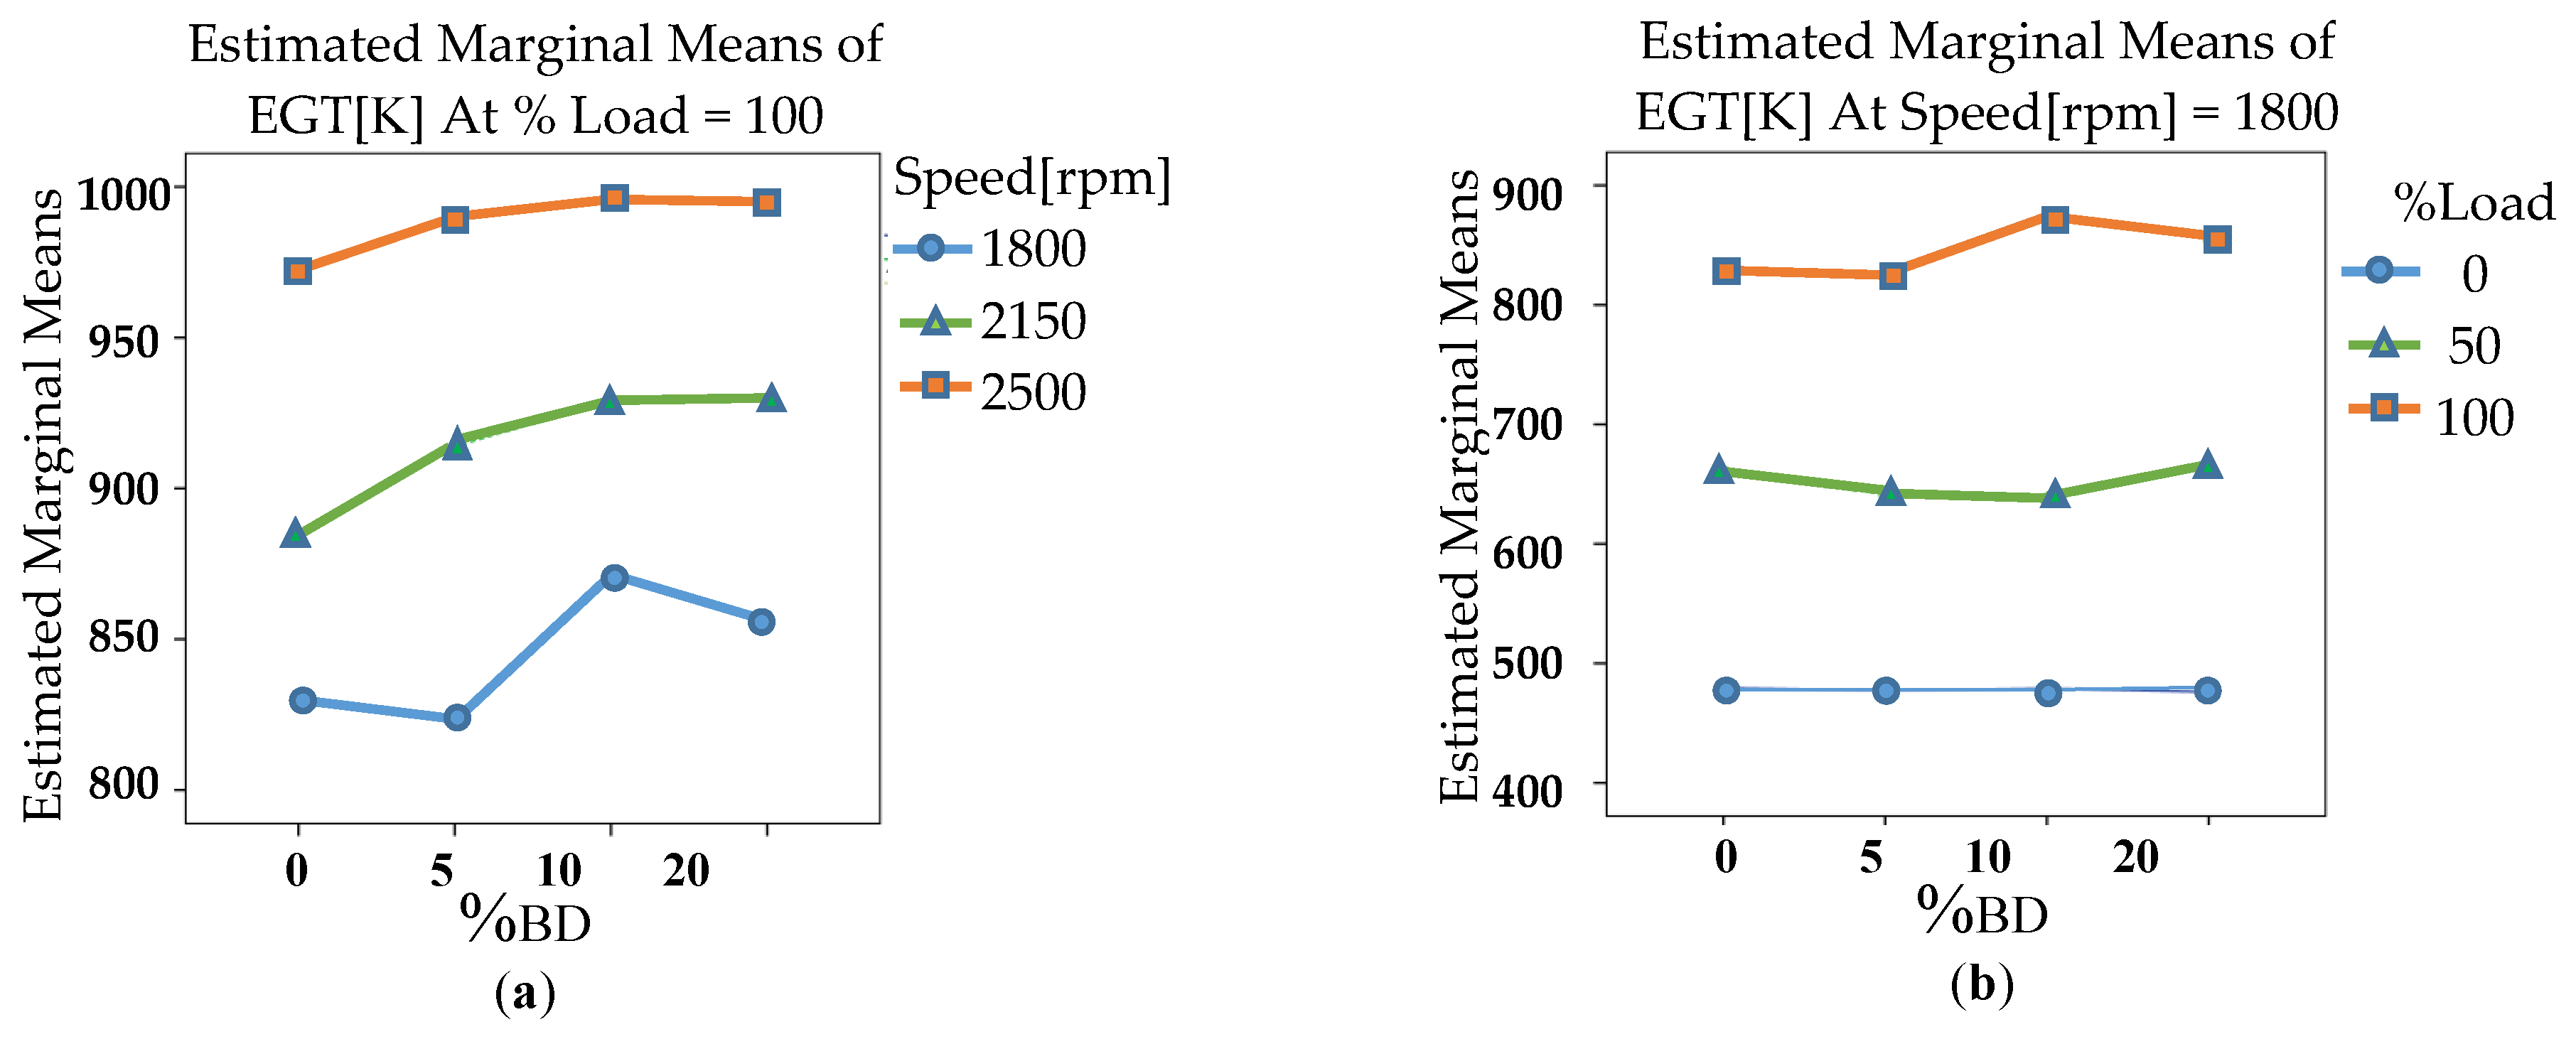
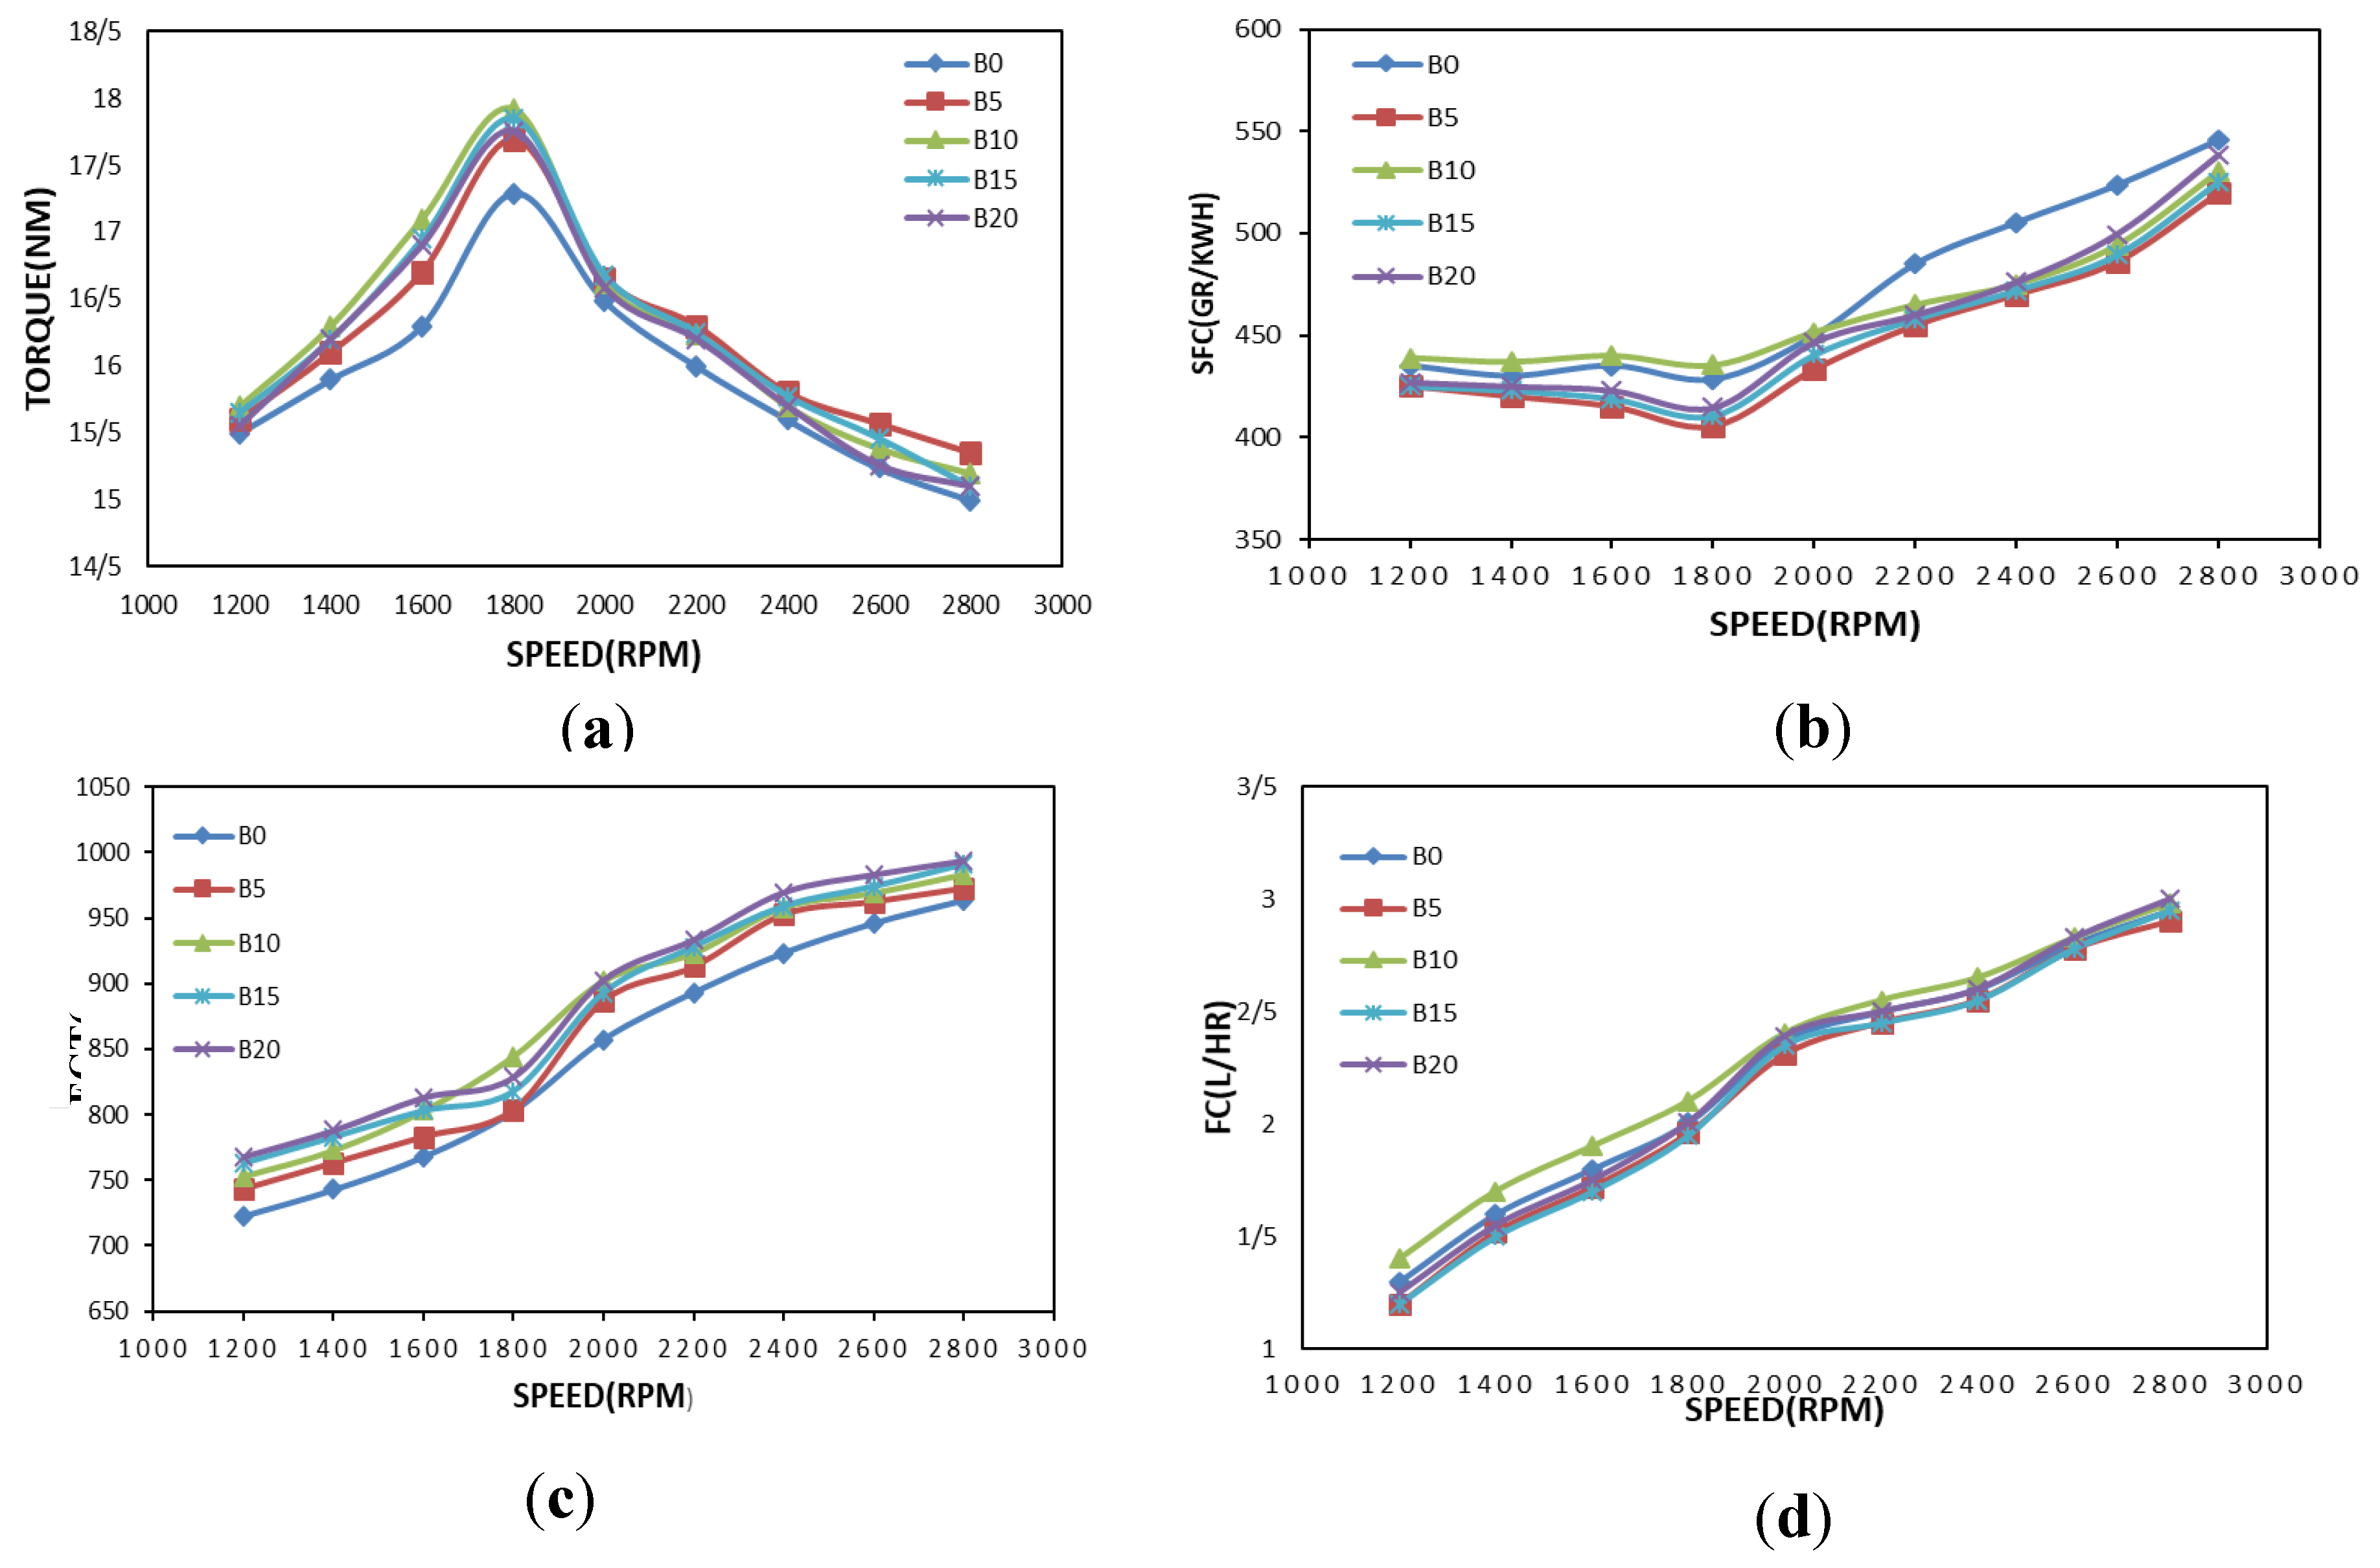
3.2. Effect of Speed, Load and %BD Variations on Engine Performance

The test results presented in Figure 3, Figure 4 and Figure 5 show the trend of changes in engine performance variables based on changes in speed, load and %BD. The Estimated Marginal Means in these figures indicate the mean response for each factor, adjusted for any other variables in the model. Figure 3a, shows the average torque variations at maximum constant load according to engine speed variations, for all the different ratios of diesel and biodiesel blends. It can be seen that the highest torque occurs at 1800 rpm; therefore, the 1800 rpm was considered as the basis speed. Investigating the variations of the mean torque at maximum load and different rpm rotation speeds, Figure 3a, also shows that at 1800 rpm, the torque increases with the increase of biodiesel percentage up to B10, but then decreases for the B20. Figure 3b shows that, at constant 1800 rpm, the torque increases with the increasing load on the engine torque and the torque changes that occur under different loads do not respond to changes in the percentage of biodiesel and are almost on horizontal lines. Figure 3c shows that, at the maximum constant load, the power production increases with the increase of speed. The highest power increase is related to B5 at 2500 rpm in which power increases by 15%. This is due to incomplete filling of the cylinder during the intake stroke at higher speeds although the valves are fully open [24,25,26,27]. There is not enough time for air intake and subsequently raising the cylinder pressure, which leads to the reduction of combustion pressure.
Consequently, the inertia of the moving parts increases, and the engine torque is lower than the expected value [24,26]. Figure 3d shows that, at constant 1800 rpm, the power produced remains almost constant for all the biodiesel blend ratios. Although properties of the biodiesel fuel (LHV, oxygen content, Cetane number, density, and viscosity) have a contradictory effect on the maximum engine power, empirical experiments indicate that the addition of 5, 10, and 20% of biodiesel to diesel does not have a significant effect on engine brake power [13].
Figure 4a shows that, by keeping the load constant at full load, the SFC increases with the increase in engine speed. And for all speeds, with an increase of biodiesel ratio from 0% to 5%, the SFC decreases. The highest decrease of SFC can be seen at 2500 speed with a 10% value from B5 to B0. Considering the indirect impact of biodiesel on FC due to its low LHV compared to pure diesel it seems that fuel B5 provides the SFC in optimum conditions for the engine performance at maximum rpm. Labeckas and Slavinskas [28] claimed that SFC is higher for biodiesel compounds and reported that this increase can be attributed to the fact that the biodiesel heat value is 12.5% less than diesel. Due to the high viscosity and high density of biodiesel and the lack of appropriate injection pressure for fuel atomization at 2500 rpm speed, combustion is performed incompletely and the SFC is dropped with increasing biodiesel in the blend. At this engine speed, the fuel injection pressure increased in comparison with lower engine speeds, so that the pressure required for proper atomization of biodiesel, was provided. The proper atomization of biodiesel with its oxygen content has improved the quality of combustion. Lujan et al. [29] also argue that the reason for the increase of SFC is the low biodiesel LHV and its high viscosity and density.
Figure 4b indicates that by keeping the rpm constant at 1800 rpm, at full load the SFC has the most changes and fluctuations. These changes are such that the SFC of B5 is reduced by 3% compared to pure diesel, then the same percentage increases in B10 and again decreases by 3% from B20 to B10. By increasing the engine load, AFR and the equivalence ratio (λ) are reduced (the fuel and air blend get richer), the SFC also increases [30,31,32]. Figure 4c shows that the FC increases at constant full load condition by increasing the engine speed (rpm). For all speeds, the FC decreases with the increasing of biodiesel volume from B0 to B5, but the FC increases for B10. The variations in FC relative to the increase of biodiesel percentage at 2150 rpm are the same as for 1800 rpm. The increase of biodiesel percentage, due to its higher density and lower LHV than diesel, increases the density of the fuel blend on the one hand and reduces its thermal energy on the other hand. Increasing the density of fuel blend increases the FC mass and decreasing the LHV of the fuel decreases the released energy and, as a result, the FC will be increased [20]. Figure 4d shows that, by keeping the rpm constant at 1800 rpm, the FC rate increases with the increase of load. This figure also indicates that the difference between FC at 100% load with its values at 50% of full load is about 50%. This value, in comparison with the difference between the FC values between 0–50% of the full load, is about 30%. The great difference between the FC values between 50% and 100% of the full load is due to the engine reaching the smoke point resulting in incomplete combustion at 100% load and the further increasing of FC [23]. Basically, due to the high viscosity and low LHV of biodiesel fuel, its fuel injection does not perform well, which causes incomplete combustion, and the engine consumes more fuel to compensate for the power loss [22,33].
Figure 5a, shows that, at maximum constant load, EGT will increase by the increasing of rpm and at both 2150 rpm and the maximum speed of 2500 rpm, with increasing the biodiesel percentage, the changes in the EGT compared to the increase of biodiesel percentage are the same and have an increasing trend. The reason is that EGT from the engine is related to the quality of fuel combustion. The presence of biodiesel in the diesel will improve its physical properties to some extent and result in better fuel combustion. The higher Cetane Index of biodiesel, unlike the effect of viscosity, decreases the delay of ignition time. Therefore, after injecting the fuel into the combustion chamber, the amount of fuel prepared for the pre-mixed combustion will be low, and as a result, the maximum pressure inside the cylinder, followed by the temperature of the initial burnt gases also decreases slightly. Experimental results show that, using values of less than 20% biodiesel by volume, the effect of Cetane Index is more than viscosity effect on the delay of ignition, and the sum of their effects results in improving combustion quality which causes to increase the combustion chamber pressure and EGT of the engine [34]. Figure 5b shows that, at constant 1800 rpm, EGT for all different ratios of fuel increases with the increase of load. This plot indicates that at no-load and 50% of full-load state, the changes of EGT remain almost constant with the biodiesel ratios variation which is about 443 K and 643 K, respectively. The relatively large difference between the values of EGT at 100% full load compared to these values at 50% of the full-load is due to the engine operating conditions. In this case, the engine reaches the smoke limit, and thus incomplete combustion happens [23].

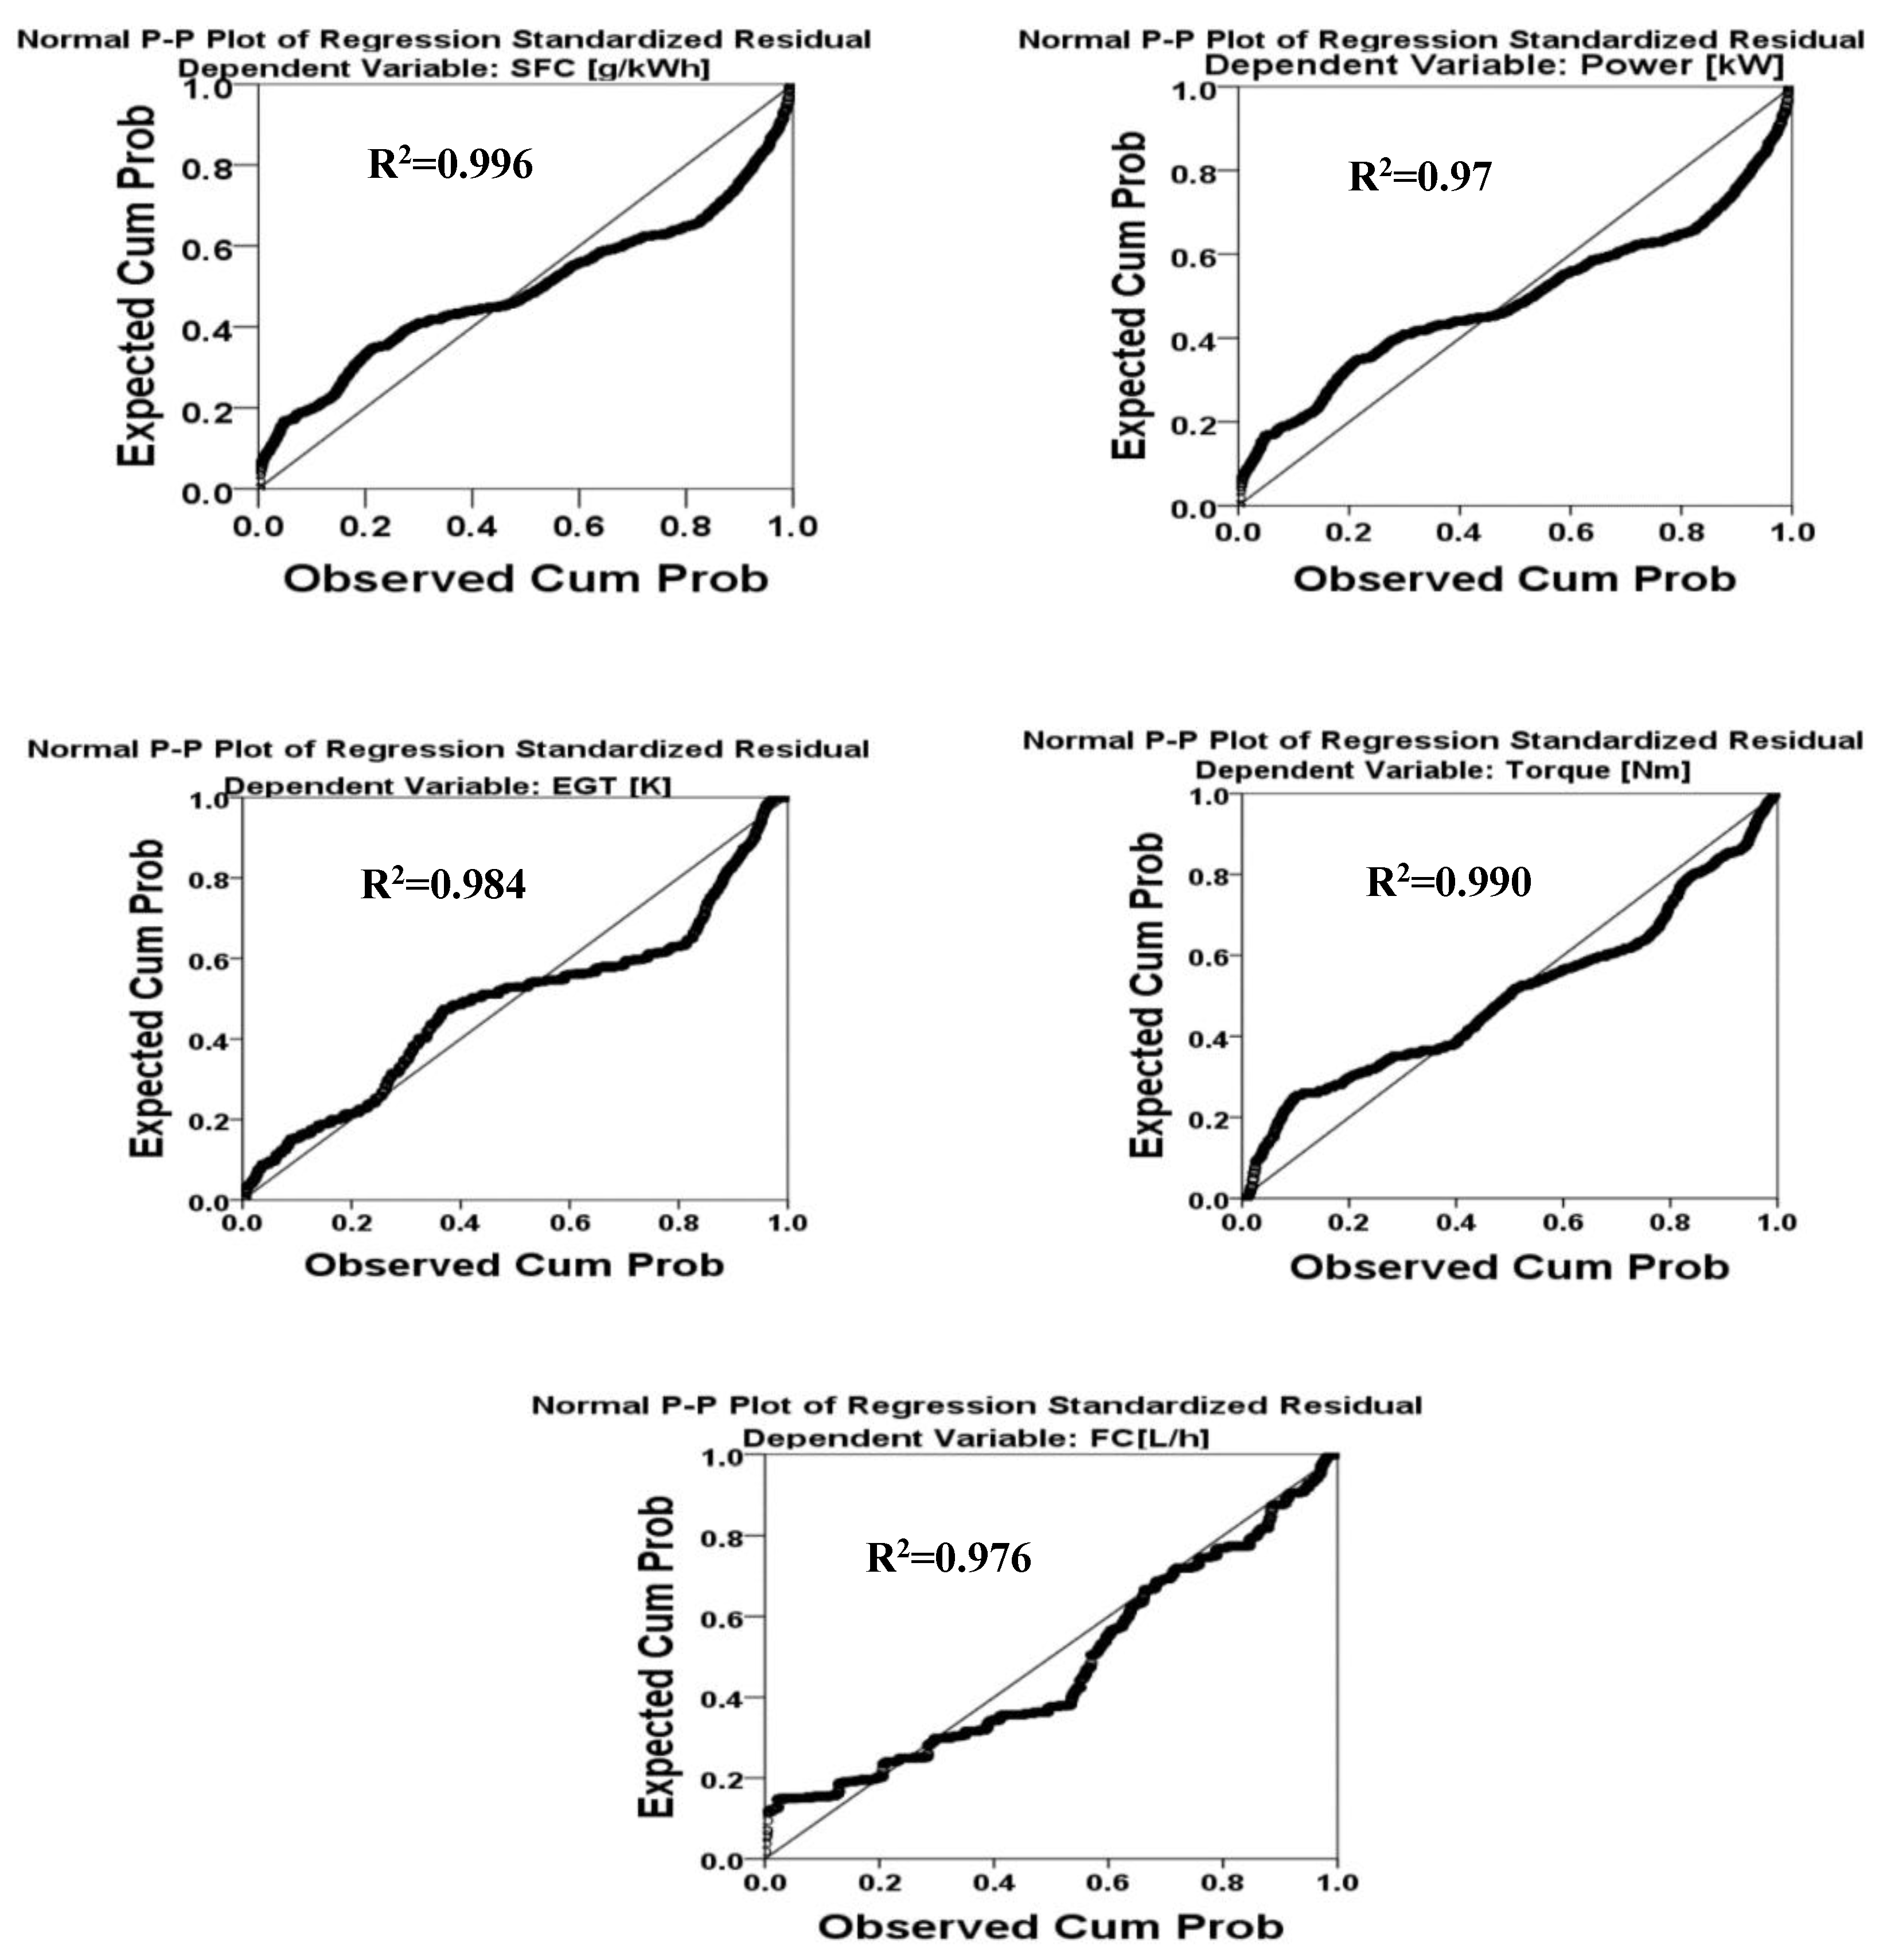
3.3. Regression Analysis of Parameters

The errors of the data obtained from the engine tests were initially analyzed, and the correlation test of variables and the linear test and the effect of the independent variables, namely the percentage “S” (rpm), “L”, “%BD”, “T” (Nm), “P” (kW), “SFC” (g/kWh), “FC” (L/h), “EGT” (K), were then performed. For each of these dependent variables, a linear multivariate regression model was developed based on the independent variables. To establish the relationship between the mentioned independent and dependent variables, their correlation was examined using an ANOVA.

3.3.1. Performance Evaluation Model

The data were randomly divided into two parts: training and testing information. 80% of the data was used for model training, and 20% of the data were considered for model testing. The RMSE average criterion was used to evaluate regression models. For each parameter with the lowest RMSE and the highest conversion efficiency was selected and analyzed. The predicted values were performed against the values around the first quadrant (y = x) [35]. The comparison between actual values and predicted values by the linear regression model for each parameter for training and testing data is shown separately in Figure 6, In each figure, the measured values are on the X-axis, and the predicted values are on the Y-axis, and, if these two are equal, the line drawn is exactly the first half quadrant. As shown in the figures, the coefficient of determination was obtained as R2 > 0.95 in all comparisons, and that demonstrates the acceptability and efficiency of the models [36].

3.3.2. Engine Performance Prediction Equations Based on the Independent Variables

For predicting engine performance, Equations (1)–(5), can be used. In these linear equations, the value and positive or negative sign of the coefficient of the independent variables are very important. This means that the larger these coefficients, the greater is the impact. In addition, the positive or negative coefficient means the direct or indirect effect on the engine performance. On the other hand, as the positive coefficient of the independent variable increases, the dependent variable also increases and for the negative coefficient is the opposite trend is observed. Furthermore, Standard Error of the Estimate for all equation are provided.

Torque

Linear Equation (1), indicates that (%BD), (L) have positive and (S) has negative effects on (T). Due to the lower LHV of the BD compared to diesel, with increasing (%BD), the LHV of the blend decreases. This reason reduces the (T), when using BD and its blends with diesel [37]. However, regarding the (L) coefficient, it can be said that this parameter has the highest impact on the (T).
T = 2.538 − 0.005 (%BD (+ 0.164 (L) − 0.001 (S)
Standard Error of the Estimate: 0.56351.

Power

Linear Equation (2), indicates that (%BD), (L) and (S) have positive effects on (P). The main reason for this behavior is the high viscosity and low thermal capacity of biodiesel compared to the diesel [38]. The (L) has the highest impact on (P). When high (L) were applied, due to increase in AFR, the extra values of oxygen caused complete combustion, which resulted in improving the (P) [39].
P = −1.228 − 0.001 (%BD) + 0.041 (L) + 0.001 (S)
Standard Error of the Estimate: 0.36654.

SFC

Linear Equation (3), indicates that (L) and (S) have positive and (%BD) has negative effects on (SFC). The reasons for this are the lower LHV of biodiesel than diesel and thus producing lower brake torque for equal FC and higher density of biodiesel than diesel per fuel injection into the combustion chamber by mass [40]. In other words, the highest SFC is in pure diesel, and the lowest SFC is obtained in the fuel ratio of 20%. About the (L) and (S), it can be said that the incremental frictional loses of the engine at high rpm. Therefore, with increased engine speed and friction, more fuel should be consumed to generate constant torque [41].
SFC = 35.150 − 0.112 (%BD) + 1.045 (L) + 0.154 (S)
Standard Error of the Estimate: 41.68695.

FC

Linear Equation (4), indicates that (L) and (S) have the positive effects on (FC), however, since the coefficient of (L) is larger than that of (S), its effect is also higher. Since the diesel fuel is pumped to the engine cylinder on a volumetric basis and the density of the BD blend is higher than that of diesel, therefore, a larger mass flow rate for the same fuel volume is pumped to the engine, resulting in an increase in torque and power [42]. The equation also specifies that the (%BD) have no effects on FC, and with changing the (%BD) does not change at all. It can be derived from the diagram in Figure 4c, since in the constant rpm of 1800, with the changes on the %BD, the graph is almost horizontal, and when the load is 100% constant and %BD increases, the lines of all speeds are almost horizontal. That is why (%BD) is not included in the equation.
FC = − 0.622 +0.014 (L) + 0.001 (S)
Standard Error of the Estimate: 0.36202.

EGT

Linear Equation (5), indicates that (%BD), (L) and (S) have positive effects on (EGT). The (L), due to having a weight coefficient of 3.710, has the highest impact on the EGT. Regarding the effects of (%BD) on the properties of exhaust gas emission, it has been observed that due the higher LHV of diesel than BD, when using diesel, the EGT is higher than that of BD and with increasing the (S), due to the increase in the amount of injected fuel to the combustion chamber, the EGT also increases [43].
EGT = 133.281 + 0.273 (%BD) + 3.710 (L) + 0.172 (S)
Standard Error of the Estimate: 32.67043.

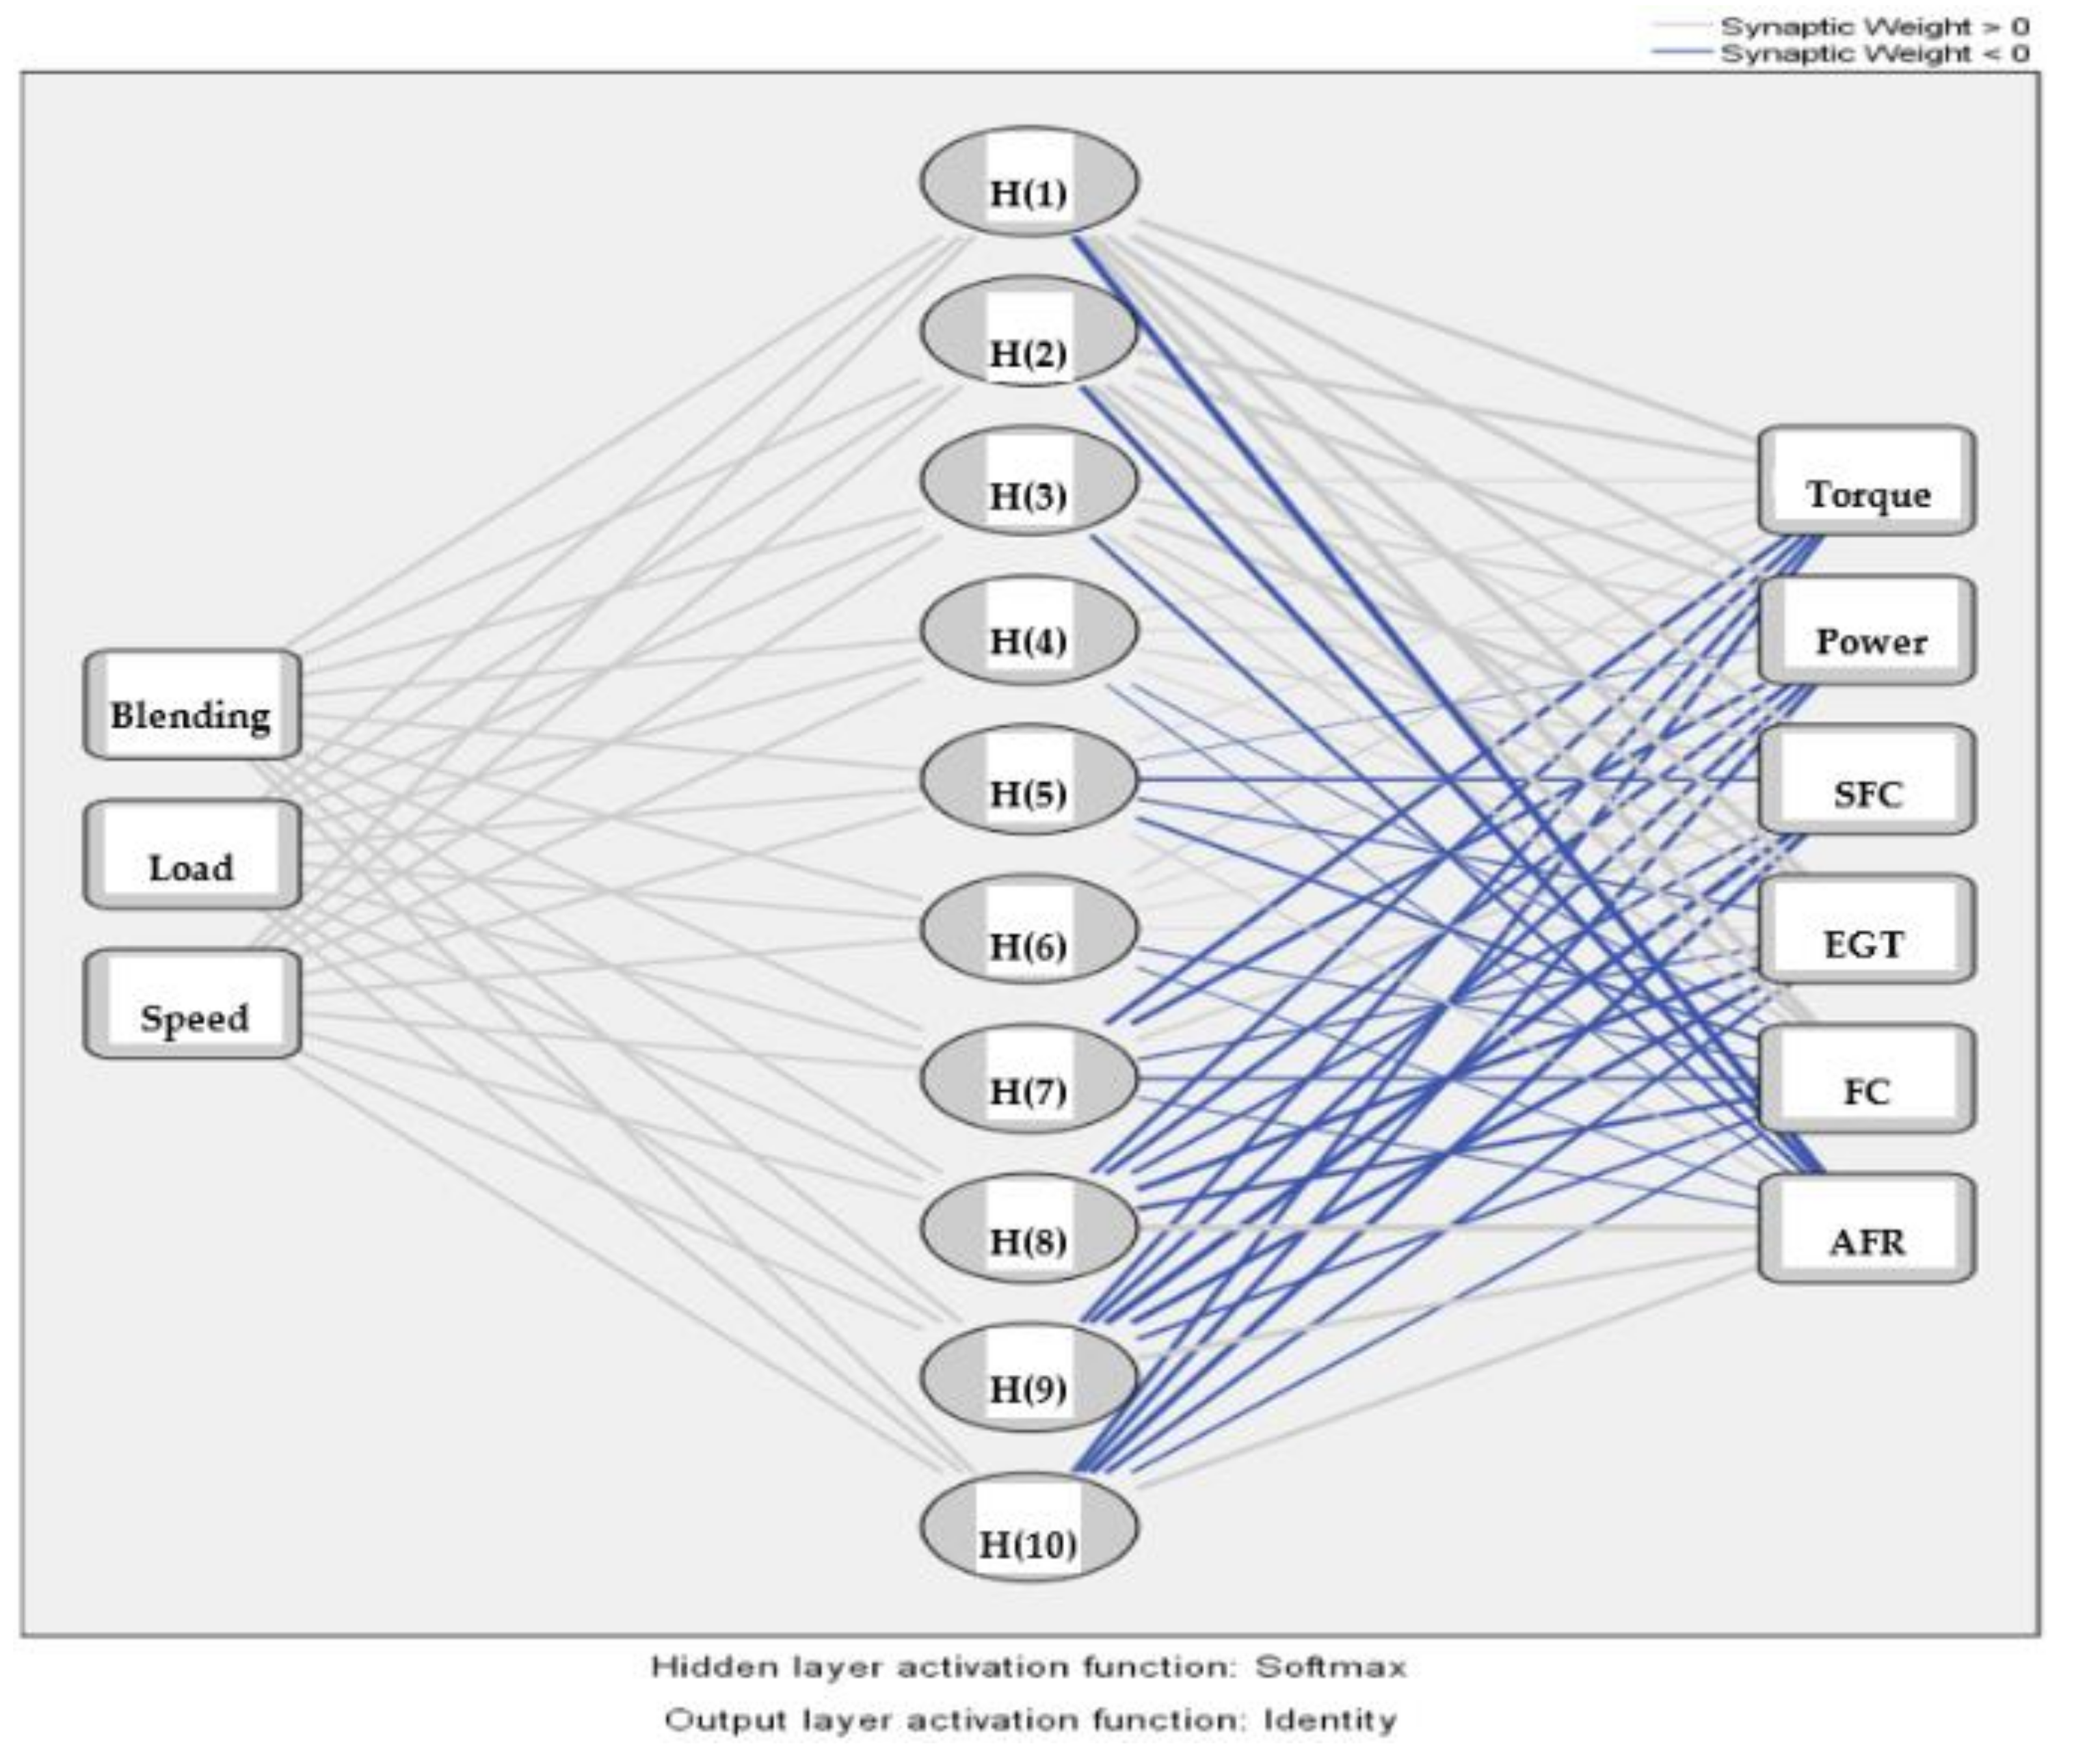
3.4. Neural Network Modeling

The generated network has three parameters as the network input and six parameters as the network output. The input variable parameters are the load applied to the engine, and the amount of biodiesel blended in the diesel fuel and engine speed and the output variable parameters include the torque and power production output, SFC, FC, EGT, and AFR. Therefore, the neural network was modeled and designed with three neurons in the input layer and six neurons in the output layer as depicted in Figure 7.
After these steps, training was then started using each of the algorithms with a hidden layer and five neurons in the hidden layer and was continued with increasing to 10 hidden layers and a maximum of 25 neurons. The sigmoid tangent transfer function was used in the hidden layer, and the linear actuator transfer function was used in the output layer. In this research, the value of the MSE function was efficiency. To find the best prediction, several neural networks were designed and trained with experimental data. In order to better evaluate the performance and select the optimal network, regression analysis was performed, and the correlation coefficient between the network and the desired outputs (experimental data) was determined, and the error was calculated at this stage. MATLAB R2018a was used to create a neural network model.

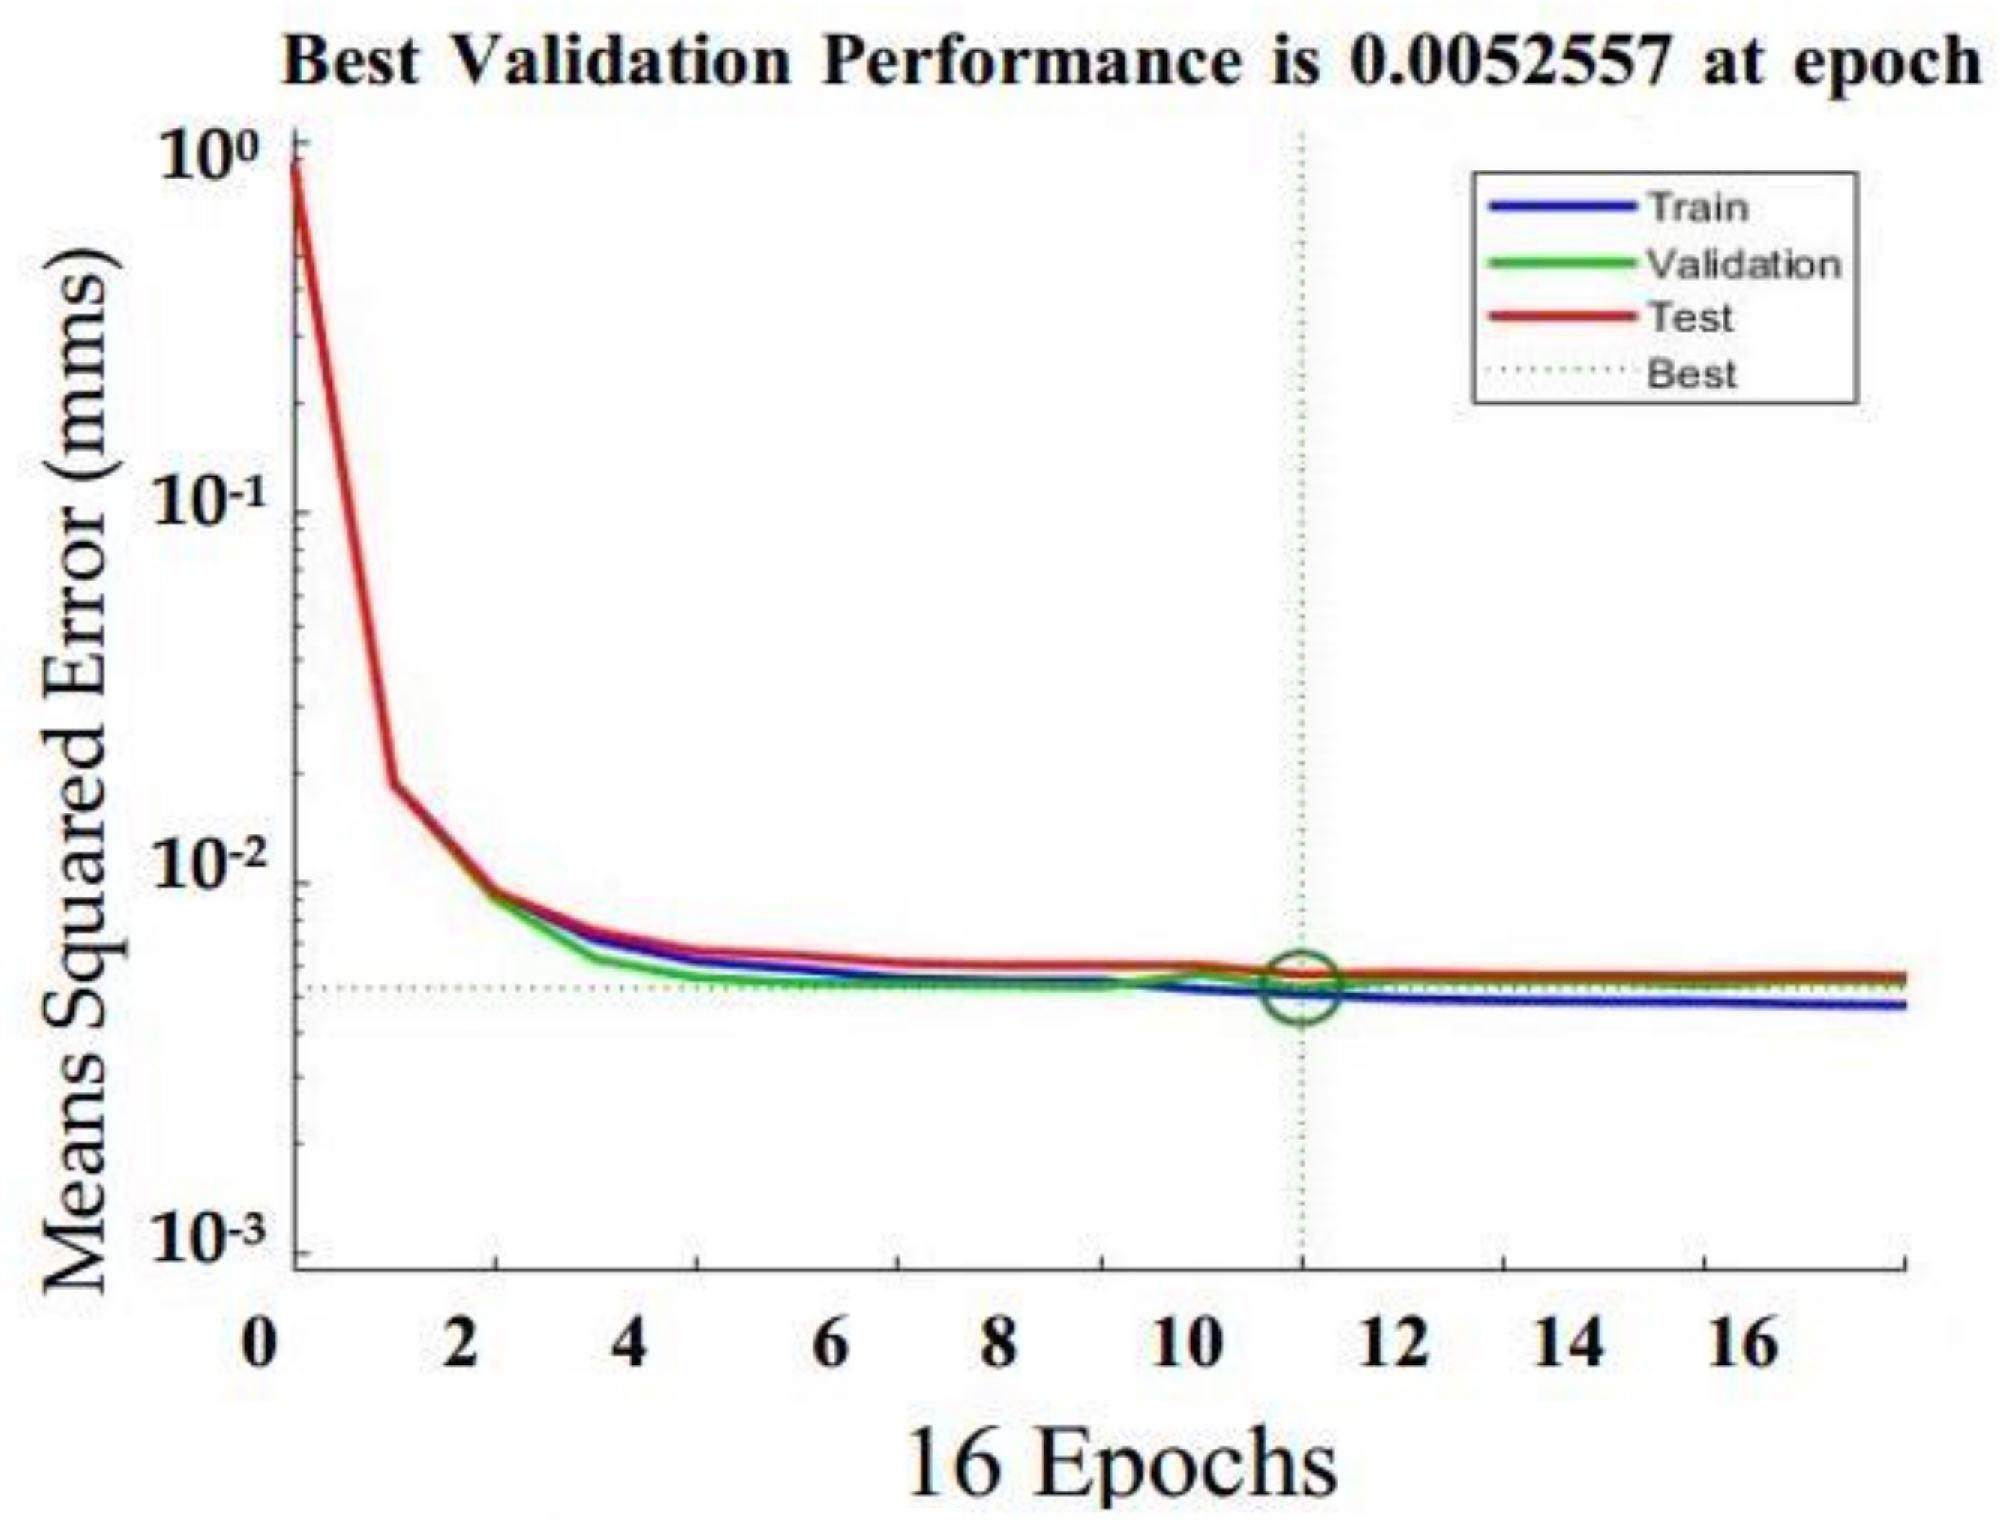
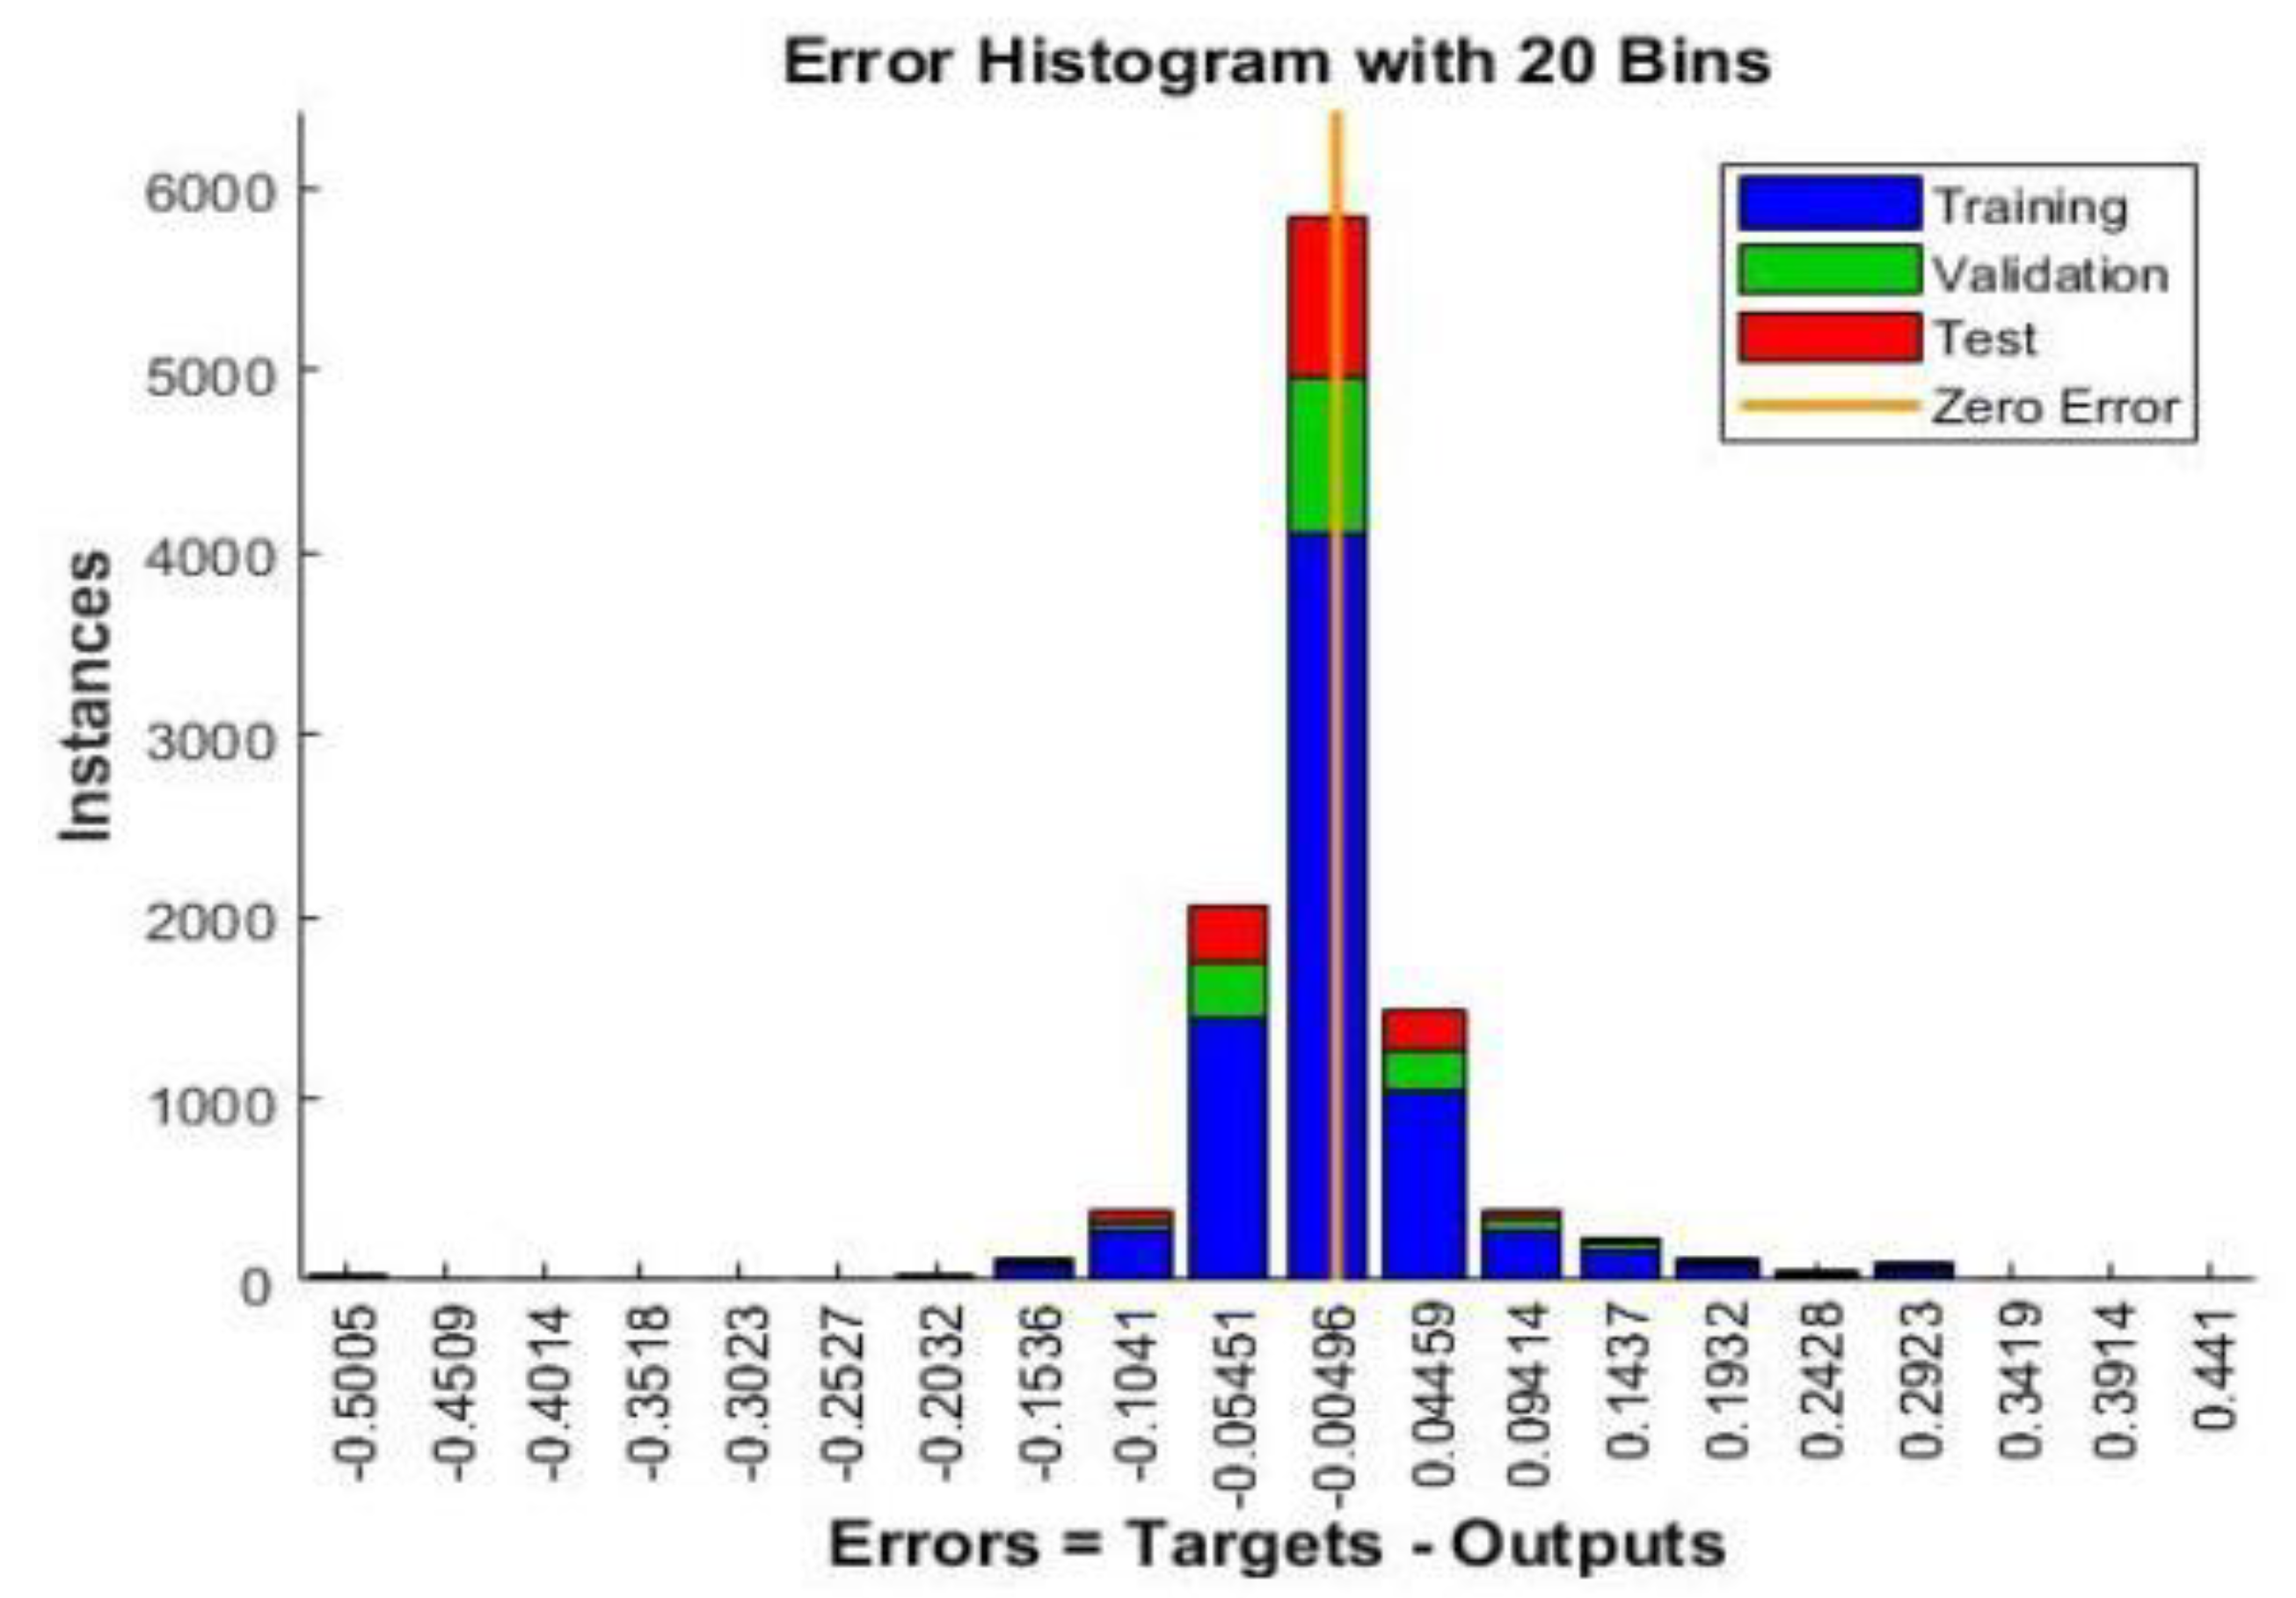
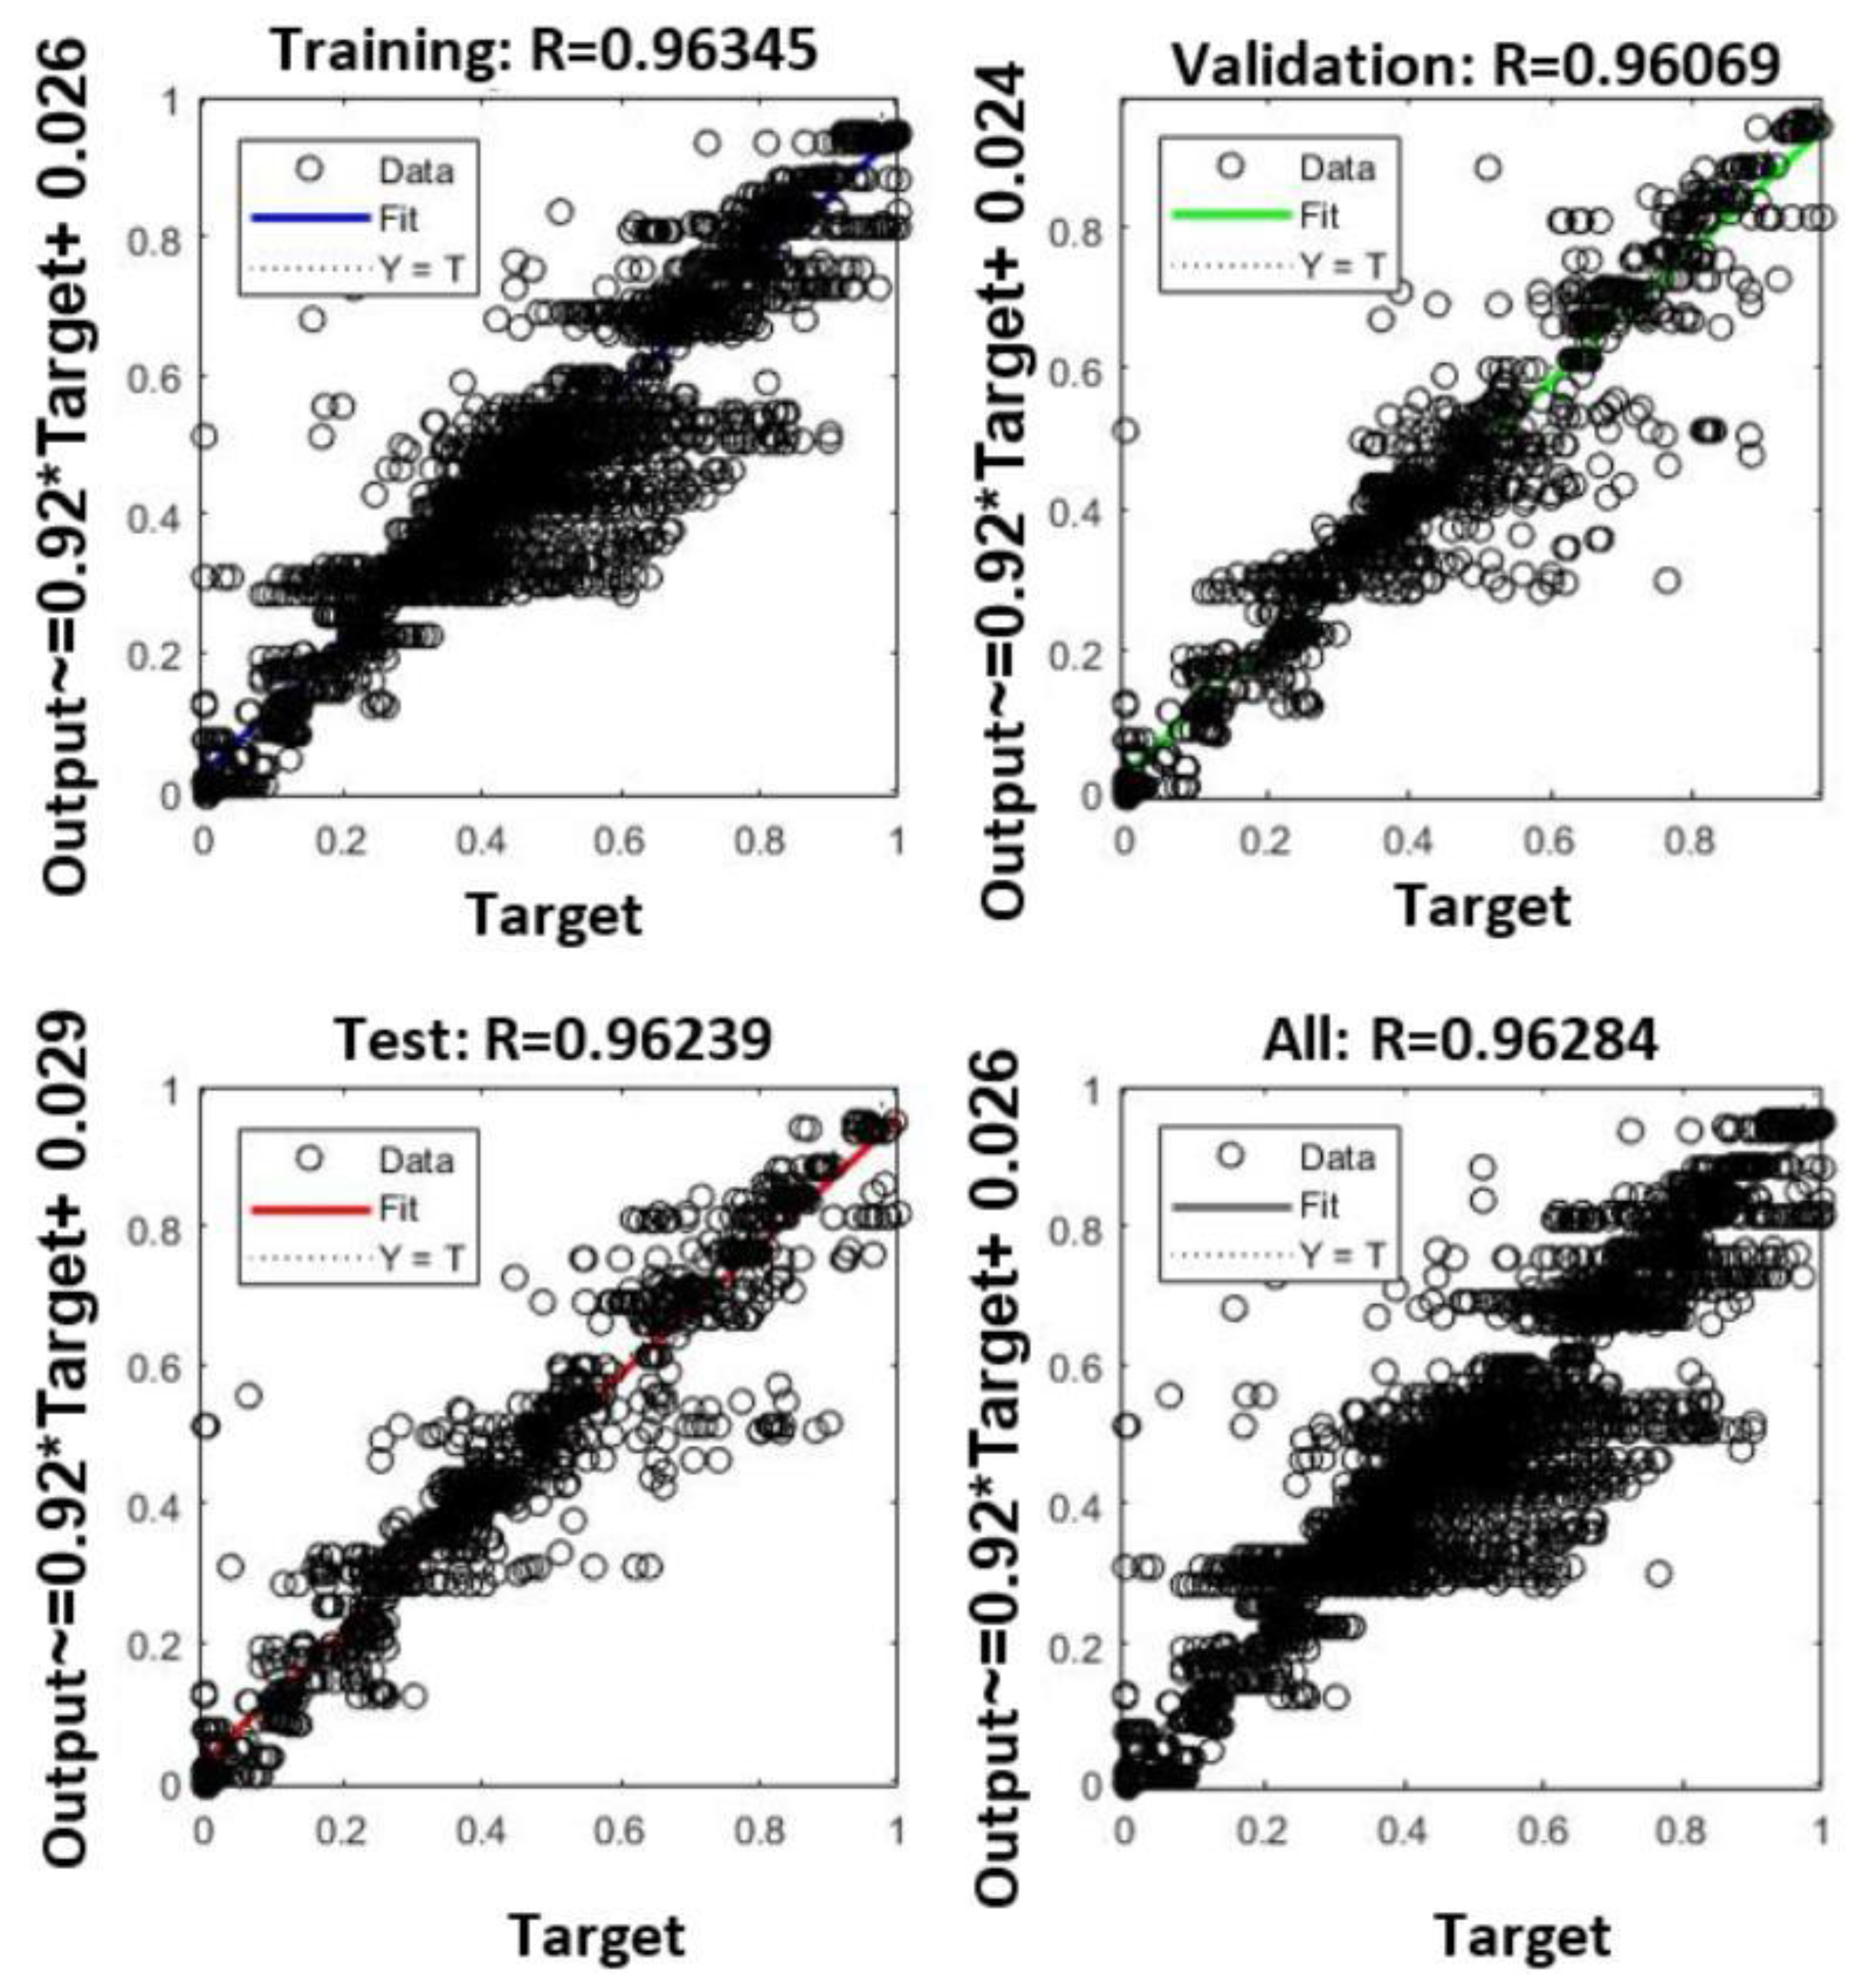
4. Results and Discussion of Neural Network Modeling

In this research, the batch training algorithms of slope reduction, batch training of slope reduction with momentum, and training with various learning speed, binary scaled slope and Lovengberg-Marquardt methods were used for network training the neural network model. The recall codes of these functions in MATLAB are traingdx, trainscg, traingda and trainlm, respectively. In order to prevent over-fitting due to the high error of the automatic adjustment method, the early stopping method was used which involved assigning 70% of the data as a training subset, 15% of the data as a validation subset and 15% as the test subset which showed better results in reducing the model error. The number of neurons in the hidden layer was changed from 5 to 10 neurons so that the optimal number was obtained for each learning algorithm and error of 10 layers.
Figure 8, shows the network MSE error gradually decreases and, after 16 iterations, the network training stops with a “Validation Stop” message which indicates the increase of error of the validation set. Weights and bias were adapted to the minimum error. Similar error changes of the test and validation sets indicate the optimal results of the model. Figure 9 presents the histogram error of 0.004. The correlation coefficients obtained from the general training, evaluation, and test diagrams are shown in Figure 10, which indicates the high accuracy of the ANN of backpropagation error, with three neurons in the input layer and six neurons in the output layer, in predicting the performance parameters of power, torque, SFC, FC, EGT, and air intake flow rate.

4.1. Neural Network Assessment

In order to assess the validity or accuracy of the neural network, 5% of the actual data was not included in any of the training, testing, and evaluation data processing of the neural network. In the end, this 5% of data was given to the network to calculate its prediction values. Then, with the adaptation of the graphs plotted from these data shown in Figure 11, their adaptation amount was examined. It can be seen that these diagrams have very good adaptation.

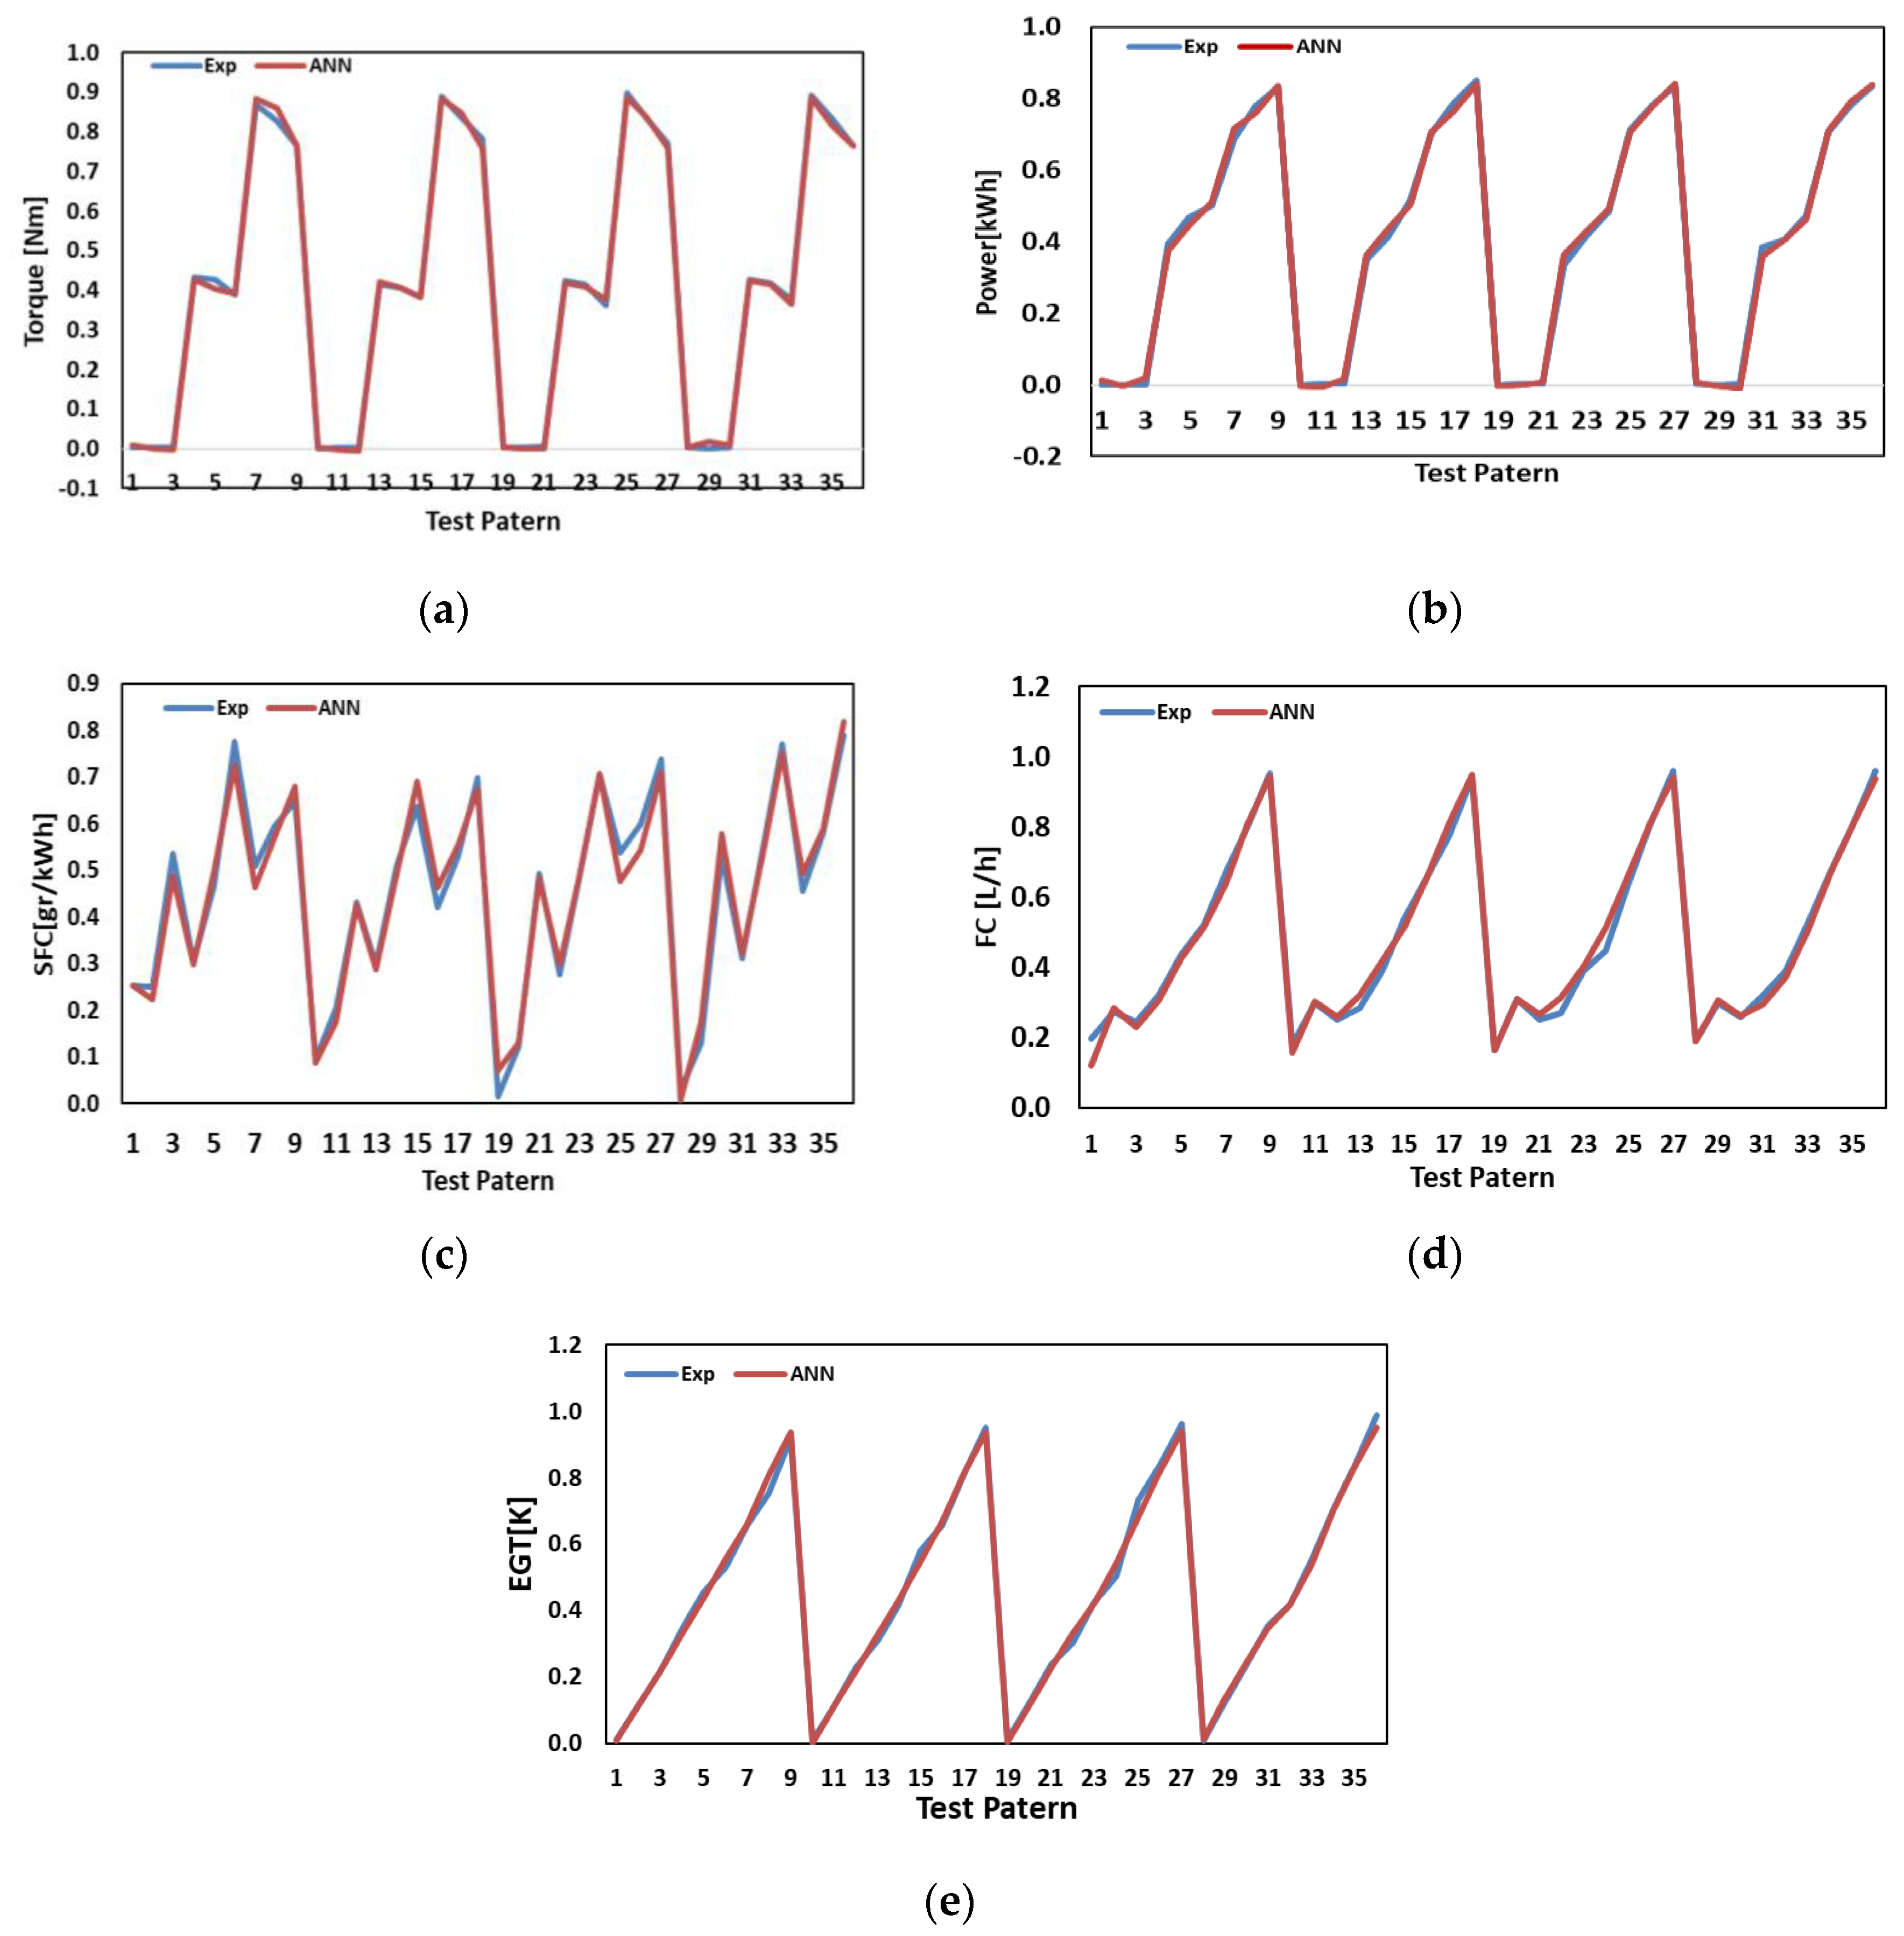
4.2. Use of Simulation with ANN

The main use of simulation with ANN in this research, is that predicting engine performance characteristics at any hypothetical conditions, without doing any real test. For example, in the actual test performed in this study, due to the lack of available biodiesel, as well as the cost and time spent on each test, B0, B5, B10, B20 fuels in three conditions of engine speed and load (1800, 2150, and 2500 rpm) and (0%, 50%, and 100% full load) were tested. However, all other conditions can be predicted by ANN. The engine performance characteristics for all fuels plus the B15 at 1200, 1400, 1600, 1800, 2000, 2200, 2400, 2600, and 2800 rpm at 100% load have been predicted without real testing. To evaluate the accuracy of the ANN predictions, the results were compared with the results of other articles. The prediction results are shown in Figure 12.
Figure 12a shows that, as previously mentioned, the maximum torque occurred at 1800 rpm. Which is consistent with the experimental data of other articles and engine technical characteristics [44]. Figure 12b shows that the lowest SFC occurs at around 1800 rpm. Since SFC is a measure of engine efficiency and this engine has maximum torque at 1800 rpm, then the lowest SFC occurred at 1800 rpm. The graph shows that with increasing and decreasing speed from 1800 rpm, SFC is rising because the length of each cycle is prolonged at a low speed, which causes more heat loss. Another reason is the higher frictional losses during the high speed. Both factors make the SFC rise [38]. Figure 12c,d show that as the speed increases, FC and EGT rise. By increasing the engine speed and spraying pressure, the EGT increases. Because the combustion improvement is due to increased fuel injection pressure. By increasing the spraying pressure, the fuel is thoroughly powdered and blended with air in the combustion chamber. As a result, complete combustion and more energy are released [41].

5. Conclusions

The results of analysis variance of engine performance characteristics showed that different load, speed, and various fuel ratios have significant effects on fuel and power consumption, but have no significant effect on other parameters such as torque, FC, EGT, and airflow ratio at the 0.01 significance level. The largest amount of torque comes from 5% biodiesel, and the lowest amount of torque comes from the B20 fuel blend. Fuel B5 produces 12% more torque than diesel. The B20 blend has a torque of 6% less than diesel. The results also showed that the highest FC is from the pure diesel fuel with no biodiesel blend, and the lowest FC is the B20, which is 6% less than pure diesel. The highest AFR occurs when fuel B5 is consumed and is 12% more than pure diesel. The lowest EGT of 613 K is related to B20, and the highest EGT is related to groups B5 and B10, which have a 10% higher EGT. ANNs are reasonable for the prediction of engine parameters due to their capability to learn and generalize a broad range of experimental conditions. This makes the ANN model a great instrument to solve complicated engineering problems, especially related to engine emissions.

Author Contributions

The contributions of each author are as follows: R.K. drafted the manuscript; M.G.R. contributed to the experimental design and thoroughly revised the paper; M.M.K.K. helped to revise and improve the paper; and M.A. checked and revised the manuscript.

Funding

This research received no external funding.

Conflicts of Interest

The authors declare no conflict of interest.

Nomenclature

TSOBTomato Seed Oil Biodiesel
B00% Biodiesel + 100% Diesel
B55% Biodiesel + 95% Diesel
B1010% Biodiesel + 90% Diesel
B2020% Biodiesel + 80% Diesel
DIDirect Injection
LLoad
TTorque
PPower
Sspeed
BDBiodiesel
DDiesel
ASTMAmerican Society for Testing and Materials
CRDCompletely Randomized Design
AFRAir–fuel ratio
SFCSpecific Fuel Consumption
BSFCBreak Specific Fuel Consumption
FCFuel Consumption
NmNewton meter
EGTExhaust Gas Temperature
RMSEroot-mean-square error
ANNArtificial Neural Networks
Expexperience
DFDegrees of Freedom
KKelvin
ANOVAAnalysis of Variance
SPSSStatistical Package for the Social Sciences
LHVLower Heating Value

References

  1. Knoblich, M.; Anderson, B.; Latshaw, D. Analyses of tomato peel and seed by products and their use as a source of carotenoids. J. Sci. Food Agric. 2005, 85, 1166–1170. [Google Scholar] [CrossRef]
  2. Sogi, D.S.; Sidhu, J.S.; Arora, M.S.; Garg, S.K.; Bawa, A.S. Effect of Tomato Seed Meal Supplementation On the Dough and Bread Characteristics of Wheat (Pbw 343) Flour. Int. J. Food Prop. 2007, 5, 563–571. [Google Scholar] [CrossRef]
  3. Persia, M.E.; Parsons, C.M.; Schang, M.; Azcona, J. Nutritional Evaluation of Dried Tomato Seeds. Poult. Sci. 2003, 82, 141–146. [Google Scholar] [CrossRef] [PubMed]
  4. Al-Betawi, N.A. Preliminary study on tomato pomace as unusual feedstuff in broiler diets. Pak. J. Nutr 2005, 1, 57–63. [Google Scholar]
  5. Karami, R.; Kamgar, S.; Karparvarfard, S.H.; Rasul, M.G.; Khan, M.M.K. Biodiesel production from tomato seed and its engine emission test and simulation using Artificial Neural Networ. J. Oil Gas Petrochem. Technol. 2019, 1, 41–62. [Google Scholar] [CrossRef]
  6. Giuffrè, A.M.; Sicari, V.; Capocasale, M.; Zappia, C.; Pellicanò, T.M.; Poiana, M. Physico-chemical properties of tomato seed oil (Solanum lycopersicum L) for biodiesel production. Acta Hortic. 2015, 1081, 237–244. [Google Scholar] [CrossRef]
  7. Giuffrè, A.M.; Capocasale, M.; Zappia, C.; Sicari, V.; Pellicanò, T.M.; Poiana, M.; Panzera, G. Tomato seed oil for biodiesel production. Eur. J. Lipid Sci. Technol. 2016, 118, 640–650. [Google Scholar] [CrossRef]
  8. Najafi, B. Experimental Investigation and Mathematical Modelling of Combustion Using Biodiesel from Restaurant Waste Cooking Oil. JER 2010, 17, 60–70. (In Persian) [Google Scholar]
  9. Anwar, M.; Rasul, M.G.; Ashwath, N.; Nabi, M.D.N. The potential of utilising papaya seed oil and stone fruit kernel oil as non-edible feedstock for biodiesel production in Australia—A review. Energy Rep. 2019, 5, 280–297. [Google Scholar] [CrossRef]
  10. McCormick, R.L.; Graboski, M.S.; Alleman, T.L.; Herring, A.M.; Tyson, K.S. Impact of Biodiesel Source Material and Chemical Structure on Emission of Criteria Pollutants from a Heavy-duty Engine. Environ. Sci. Technol. 2001, 35, 1742–1747. [Google Scholar] [CrossRef]
  11. Rosenberg, A.; Kaul, H.P.; Senn, T.; Aufhammer, W. Costs of Ethanol Production from Winter Cereals. The Effect of Growing Conditions and Crop Production Intensity Levels. Mech. Eng. 2002, 15, 91–102. [Google Scholar] [CrossRef]
  12. Anwar, M.; Rasul, M.G.; Ashwath, N. Production optimization and quality assessment of papaya (Carica papaya) biodiesel with response surface methodology. Energy Convers. Manag. 2018, 156, 103–112. [Google Scholar] [CrossRef]
  13. Najafi, B. The effect of ethyl esters of fatty acids in biodiesel fuel on diesel engine performance. Available online: https://www.civilica.com/Paper-CCI04-CCI04_064.html (accessed on 8 August 2019).
  14. Anwar, M.; Rasul, M.G.; Ashwath, N. The synergistic effects of oxygenated additives on papaya biodiesel binary and ternary blends. Fuel 2019, 256, 115980. [Google Scholar] [CrossRef]
  15. Harish, S.; Vivek, S.; Shri, K.R.; Sudharsan, R.S.; Saravana, K.N. Investigation of biodiesel obtained from tomato seed as a potential fuel alternative in a CI engine. Biofuels 2017, 10. [Google Scholar] [CrossRef]
  16. Lapuerta, M.; Armas, O.; Rodrı´guez-Fernandez, J. Effect of Biodiesel Fuels on Diesel Engine Emissions. Prog. Energy Combust. Sci. 2008, 3, 198–223. [Google Scholar] [CrossRef]
  17. Murillo, S.; Mıguez, J.L.; Porteiro, J.; Granada, E.; Moran, J.C. Performance and Exhaust Emissions in the use of Biodiesel in Outboard Diesel Engines. Fuel 2007, 86, 1765–1771. [Google Scholar] [CrossRef]
  18. Xue, J.; Grift, T.; Hansen, A. Effect of Biodiesel on Engine Performances and Emissions. Renew. Sustain. Energy Rev. 2011, 15, 1098–1116. [Google Scholar] [CrossRef]
  19. Saidi Neicharan, M.; Ghobadian, B.; Najafi, G. Experimental Investigation of a Diesel Engine Performance Parameters Using Biodiesel Fuel. J. Engine Res. 2009, 16, 29–35. (In Persian) [Google Scholar]
  20. Sundarapandian, S.; Devaradjane, G. Performance and Emission Analysis of Bio Diesel Operated CI Engine. J. Eng. Comput. Archit. 2007, 1, 1–22. [Google Scholar]
  21. Zhu, L.; Cheung, C.S.; Zhang, W.G.; Huang, Z. Combustion, performance and emission characteristics of a di diesel engine fueled with ethanol-biodiesel blends. Fuel 2011, 90, 1743–1750. [Google Scholar] [CrossRef]
  22. Nabi, M.N.; Rahman, M.M.; Akhter, M.S. Biodiesel from cotton seed oil and its effect on engine performance and exhaust emissions. Appl. Therm. Eng. 2009, 29, 2265–2270. [Google Scholar] [CrossRef]
  23. Gumus, M.; Atmaca, M. Use of Hazelunt Kernel Oil Methyl Ester and Its Blends as Alternative Fuels in Diesel Engines. Turk. J. Eng. Environ. Sci. 2008, 32, 133–141. [Google Scholar]
  24. Hosseini, S.H.; Taghizadeh-Alisaraei, A.; Ghobadian, B.; Abbaszadeh-Mayvan, A. Effect of added alumina as Nano-catalyst to diesel-biodiesel blends on performance and emission characteristics of CI engine. Energy 2017, 124, 543–552. [Google Scholar] [CrossRef]
  25. Shaafi, T.; Velraj, R. Influence of alumina nanoparticles, ethanol and isopropanol blend as additive with diesel soybean biodiesel blend fuel: Combustion, engine performance and emissions. Renew. Energy 2015, 80, 543–552. [Google Scholar] [CrossRef]
  26. Heydari-maleney, K.; Taghizadeh-alisaraei, A.; Ghobadian, B.; Abbaszadehmayvan, A. Analyzing and evaluation of carbon nanotubes additives to diesohol-B2 fuels on performance and emission of diesel engines. Fuel 2017, 196, 110–123. [Google Scholar] [CrossRef]
  27. Agarwal, A.K.; Das, L.M. Biodiesel development and characterization for use as a fuel in compression ignition engines. J. Eng. Gas Turbines Power 2001, 123, 440–447. [Google Scholar] [CrossRef]
  28. Labeckas, G.; Slavinskas, S. The Effect of Rapeseed Oil Methyl Ester on Direct Injection Diesel Engine Performance and Exhaust Emissions. Energy Convers. Manag. 2006, 47, 1954–1967. [Google Scholar] [CrossRef]
  29. Lujan, J.; Bermudez, V.; Tormos, B.; Pla, B. Comparative Analysis of a DI Diesel Engine Fuelled with biodiesel Blends during the European MVEG-A Cycle. Performance and Emissions. Biomass Bioenergy 2012, 33, 948–956. [Google Scholar] [CrossRef]
  30. Ma, F.; Hanna, M.A. Biodiesel production a review. Bioresour. Technol. 1999, 70, 1–5. [Google Scholar] [CrossRef]
  31. Nalgundwar, A.; Paul, B.; Sharma, S.K. Comparison of performance and emissions characteristics of DI CI engine fuelled with dual biodiesel blends of palm and jatropha. Fuel 2016, 173, 172–179. [Google Scholar] [CrossRef]
  32. Bavafa, M.; Eshghi, H.; Ghobadian, B.; Farzad, A.; Tabasizadeh, M. Biodiesel extraction from poultry fatty oil containing high free fatty acid. In Proceedings of the Fifth Iranian Fuel and Combustion Conference, Tehran University of Science and Technology, Tehran, Iran, 5–6 February 2014. (In Persian). [Google Scholar]
  33. Mbarawa, M.; Milton, B.E.; Casey, R.T.; Miao, H. Fuel injection characteristics of diesel stimulated natural gas combustion. Ind. Energy Res. 1999, 23, 1359–1371. [Google Scholar] [CrossRef]
  34. Najafi, B.; Torkian, M.; Hejazi, M.A.; Zamzamian, A.A. Effect of Microalgae Biodiesel on Performance Parameters and Exhaust Emissions from IDI Diesel Engine. Fuel Combust. 2012, 4, 29–42. [Google Scholar]
  35. Sabet Sarvestani, N.; Rohani, A.; Farzad, A.; Aghkhani, M.H. Modeling of specific fuel consumption and emission parameters of compression ignition engine using Nano fluid combustion experimental data. Fuel Process. Technol. 2016, 154, 37–43. [Google Scholar] [CrossRef]
  36. Najafi, B. Artificial neural networks used for the prediction of the diesel engine performance and pollution of waste cooking oil biodiesel. Modares Mech. Eng. 2011, 11, 11–20. (In Persian) [Google Scholar]
  37. Ebrahimi, R.; Savadkouhi, L.; Ghobadian, B.; Mirmohammadi, A.; Rostami, S. Numerical study of Injection Pressure and Timing Effects on a Diesel Engine Performance using Biodiesel Fuel. Biomed. Eng. J. 2013, 1, 1–18. [Google Scholar]
  38. Shojaeefard, M.H.; Tahani, M.; Etghani, M.M.; Akbari, M. Investigation of performance and exhaust emissions in direct injection engine using coconut oil biodiesel. J. Sel. Top. Energy 2014, 1, 1–7. (In Persian) [Google Scholar]
  39. Gumus, M.; Kasifoglu, S. Performance and emission evaluation of a compression ignition engine using a biodiesel (apricot seed kernel oil methyl ester) and its blends with diesel fuel. Biomass Bioenergy 2010, 34, 134–139. [Google Scholar] [CrossRef]
  40. Canakci, M.; Ozsezen, A.; Arcaklioglu, E.; Erdil, A. Prediction of performance and exhaust emissions of a diesel engine fuelled with biodiesel produced from waste frying palm oil. Expert Syst. Appl. 2009, 36, 9268–9280. [Google Scholar] [CrossRef]
  41. Rostami, S.; Ghobadian, B.; Savadkouhi, L.; Ebrahimi, R. Experimental Investigation of Effect of Injection Pressure on Performance of a Diesel Engine Using Blends of Biodiesel and Diesel. J. Engine Res. 2010, 21, 73–82. (In Persian) [Google Scholar]
  42. Adaileh, W.A.; AlQdah, K.S. Performance of Diesel Engine Fuelled by a Biodiesel Extracted from A Waste Cocking Oil. Energy Procedia 2012, 18, 1317–1334. [Google Scholar] [CrossRef]
  43. Lin, C.Y.; Lin, H.A. Diesel engine performance and emission characteristics of biodiesel produced by the peroxidation process. Fuel 2006, 85, 298–305. [Google Scholar] [CrossRef]
  44. Najafi, G.H.; Ghobadian, B. Investigation of diesel engine performance and emission variables using diesel fuel and biodiesel oil palm blending. In Proceedings of the First Iranian Thermal Science Conference, Mashhad, Iran, 8 February 2008. (In Persian). [Google Scholar]
Figure 1. The Control devices of the one-cylinder engine parameters and dynamometer.
Energies 12 04421 g001
Figure 2. Means Difference of (a) Torque; (b) Power; (c) Specific Fuel Consumption (SFC); (d) Fuel Consumption (FC); (e) Exhaust Gas Temperature (EGT) for groups in homogeneous subsets chart. Different letters (ad): Significant difference at the level of 0.01.
Energies 12 04421 g002
Figure 3. Torque (a,b) and power (c,d) changes at constant load and engine speed.
Energies 12 04421 g003
Figure 4. SFC (a,b) and FC (c,d) changes at constant load and engine speed.
Energies 12 04421 g004
Figure 5. EGT changes at constant load (a) and engine speed (b).
Energies 12 04421 g005
Figure 6. Normal P-Plot of Regression Standardized Residual Dependent Variables.
Energies 12 04421 g006
Figure 7. Neural Network Graph.
Energies 12 04421 g007
Figure 8. Mean square error plot.
Energies 12 04421 g008
Figure 9. Error Histogram.
Energies 12 04421 g009
Figure 10. R values of training, validation and test data.
Energies 12 04421 g010
Figure 11. Comparison of experimental and prediction torque (a), power (b), SFC (c), FC (d) and EGT (e) data by ANN.
Energies 12 04421 g011
Figure 12. Prediction of torque (a), EGT (b), FC (c) and SFC (d) by ANN at various engine speeds.
Energies 12 04421 g012
Table 1. TSOB specifications according to ASTM standard.
Test NameUnitTSOB ResultLimit RangeTest Method STM
Kin. Viscosity @40 °CcSt51.9–6D445
Density-@15 °Ckg/m3883max 900D4052
Cloud Point°C12min −7D2500
Flash Point (Closed Cup)°C190min 130D93
TANmg KOH/g0.74max 0.8D974
Water & Sedimentvol.%0.05max 0.05D96–D2273
Copper Corrosion @100 °C1a D130
Sulfated Ashwt%0.02max 0.02D874
Sulfurppm172 ppm D4294
Cetane Index047.7min 47D976
Rams bottom Carbon Residuewt%0.05 D524
Table 2. Specifications of the 3LD510LOMBARDINI engine.
PropertySpecifications, ModelPropertySpecifications, Model
ModelLD510Power (N DIN 70020)8.2 kW
Number of cylinders1Power (NB DIN 6270)7.46 kW
Number of valve2Power (NA DIN 6270)9
Max rpm3000Maximum torque@ rpm33 Nm
Cylinder stroke90 mmInjection pressure200 bar
Cylinder diameter85 mmOil consumption0.008 kg/h
Total cylinder volume510 ccCombustion air volume at 3000 rpm630 L/1
Compression ratio17.5:1Max. axial load permissible for250 kg
Type of combustion chamberB typedrive shaft in two directions

