Article

Numerical Investigation on the Influence of Mechanical Draft Wet-Cooling Towers on the Cooling Performance of Air-Cooled Condenser with Complex Building Environment

1
School of Energy and Power Engineering, Shandong University, Jinan 250061, China
2
School of Water Conservancy and Civil Engineering, Shandong Agricultural University, Taian 271000, China
3
Energy Engineering Excellence (ENEXIO) Energy Technology (Beijing) Co., Ltd, Beijing 100600, China
*
Author to whom correspondence should be addressed.
These authors contributed equally to this work and should be considered co-first authors.
Submission received: 17 September 2019 / Revised: 4 November 2019 / Accepted: 5 November 2019 / Published: 29 November 2019

Abstract

:
In air-cooled power units, an air-cooled condenser (ACC) is usually accompanied by mechanical draft wet-cooling towers (MCTs) so as to meet the severe cooling requirements of air-cooling auxiliary apparatuses, such as water ring vacuum pumps. When running, both the ACC and MCTs affected each other through their aerodynamic fields. To make the effect of MCTs on the cooling performance of the ACC more prominent, a three-dimensional (3D) numerical model was established for one 2 × 660 MW air-cooling power plant, with full consideration the ACC, MCTs and adjacent main workshops, which was validated by design data and published test results. By numerical simulation, we obtained the effect of hot air recirculation (HAR) on the cooling performance of the ACC under different working conditions and the effect of MCTs on the cooling performance of the ACC. The results showed that as the ambient wind speed increases, the hot recirculation rate (HRR) of the ACC increased and changed significantly with the change of wind directions. An increase in ambient temperature can cause a significant rise in back pressure of the ACC. The exhaust of the MCTs partially entered the ACC under the influence of ambient wind, and the HRR in the affected cooling units was higher than that of the nearby unaffected cooling units. When the MCTs were turned off, the overall HRR of the ACC decreased. The presence of MCTs had a local influence on the cooling performance of only two cooling units, and then slightly impacted the overall cooling performance of the ACC, which provides a good insight into the arrangement optimization of the ACC and the MCTs.

Graphical Abstract

1. Introduction

The air-cooled condenser (ACC) uses air as a cooling medium to exchange heat and has obvious water conservation benefits; therefore, in arid regions, the ACC has been widely used [1,2]. Apart from thermal power plants, the ACC is also diffusely used in the cold ends of the refrigeration and air conditioning industries [3,4]. Inevitably, ambient wind and surrounding structures can have unpredictable effects on the cooling performance of the ACC. Efficient and economical operation of the entire energy network is inseparable from the ACC’s adequate and predictable cooling performance [5]. In air-cooled power units, the exhausted steam is cooled in the ACC, but the auxiliary critical apparatus, such as the water ring vacuum pump, oil cooler, etc., should be cooled by mechanical draft wet-cooling towers (MCTs) due to their severe cooling requirements, so MCTs are usually built nearby ACCs.
Hot air recirculation (HAR) is an unavoidable phenomenon during the operation of ACCs. Ambient wind and adjacent structures play a leading role in the ACC performance reduction. Gu et al. [6] experimentally studied the influence of wind directions, wind speed and ACC platform height on the HAR of an air-cooling system. Liu [7] and Wang [8] simulated the phenomenon of hot air reflow and proposed valuable suggestions to reduce these adverse effects. Meyer and Kroger [9,10] studied the influence of the characteristics of fan and heat exchangers and the geometry of the static pressure chamber on the flow loss of ACCs by experimental measurements.
The cooling performance of ACCs is affected by many factors, and many measures and methods have been developed to enhance the cooling performance of ACCs. Owen et al. [11] numerically investigated the influencing factors of the performance of ACCs under windy conditions and compared the results of the numerical simulation with experimental data. It was found that they have good correlation. He also pointed out that the performance degradation of the fan due to the distortion of the airflow at the upstream fan inlet is the main reason for the decline in the ACC’s performance, and the accumulation of hot plume also led to a reduction in the ACC’s performance. Alan O’Donovan et al. [12] experimentally studied that the increase in fan speed causes the temperature and pressure of the ACC to decrease, and vice-versa. Wang et al. [8] proposed setting side panels below or above the platform to prevent plume recirculation because of the flow separation at the inlet of the fan. Zhang et al. [13] proposed to set up a windproof mesh outside the steel supporting structure and under the ACC platform in order to enhance the cooling performance of the ACC. Meyer [14] recommended setting an aisle outside the edge of the platform of the fan and removing the inlet portion of the peripheral fan to restore the ACC’s cooling performance under ambient wind. Gao et al. [15] recommended installing deflecting plates below the platform of the ACC to reduce the influence of strong wind on the ACC by introducing sufficient cold air into the windward area of the fan to achieve a uniform air mass flow rate, thereby improving ACCs cooling performance. Huang et al. [16] optimized the baffle geometry under the platform of the fan to make the ACC have better heat flow performance in a windy situation. Jin et al. [17] proposed to replace the traditional arrangement with a square array of ACC structures to improve the thermal performance of ACCs in a windy situation. Yang et al. [18] studied three different types of windproof wall and took into account the effects of the steam engine room, boiler room and chimney on the ACC. The results showed that increasing the width of the inner or outer channels can enhance the performance of the ACC.
MCTs are diffusely used for deep cooling of industrial water [19,20,21]. MCTs’ performance is constrained by many factors, but at the same time, the plume generated by the MCTs will have an adverse effect on the environment [22]. Many studies [23,24,25,26] have made detailed analyses of the environmental impact of plumes discharged from MCTs. Ambient air enters the MCTs through the air inlet. After a series of heat exchange with the high-temperature steam, it is discharged into the environment by the fan at the air outlet. The temperature of this part of the exhausted air is often higher than the ambient air, and the exhausted air always entrains high-temperature steam. Under the influence of ambient wind, this part of the exhausted air will pass through the air inlet of the ACC, causing the air temperature sucked by the ACC to increase. Similarly, the air discharged from the ACC will also influence the performance of the MCTs. In power plants, MCTs and ACCs are coexisting, and there is bound to be an interaction between them. Therefore, it is very necessary to research the influence of MCTs on the cooling performance of ACCs.
The aforementioned research all showed that wind speeds, wind directions and even the installation of various equipment around ACCs had some impacts on the cooling performance of the ACC. In a power plant, MCTs were usually built nearby the ACC, in this process, the MCTs were bound to have some impacts on the cooling performance of the ACC. However, the investigation on the effect of MCTs on the performance of the ACC with a complex building environment is less. Taking a representative 2 × 600 MW power plant as an example, and taking into account factors such as boiler rooms, steam engine rooms and chimneys, the specific effects of MCTs on the cooling performance of the ACC were mainly studied, which fills in the blanks of this aspect. The final results showed that the presence of MCTs had a local influence on the cooling performance of only two cooling units, and then slightly impacted the overall cooling performance of the ACC, which provides a good insight into the arrangement optimization of ACCs and MCTs. Meanwhile, it is beneficial to the optimal design and operation of the ACC of the power plant.

2. Numerical Simulation

2.1. Physical Model

Figure 1 shows a typical 2 × 660 MW air-cooled power plant, which is composed of a chimney, boiler room, turbine room, support structure, an ACC and MCTs. The size of this ACC system is 100 m at width and is about 184 m at length. The structure consists of 124 (16 × 8) fans with a diameter of 9.6 m. The MCTs of the auxiliary cooling water system of the project are a square, open-type exhaust, counter flow combined-type and have a water distribution system with tubular pressure distribution. There are three MCTs with the water-cooling area of a single cooling tower of 196 m2 and the height of 14 m arranged side by side. The cooling water volume is 3000 m3/h, and the fan diameter is 8.53 m with the fan shaft power of 132 KW. Generally speaking, these MCTs are conventional tower-types, which have typical representative meanings. This paper focuses on the analysis of mutual influences. The tower-type will be discussed in subsequent articles. The main dimensions of the studied MCTs with S-wave fill are shown in Table 1.
Based on the information provided, the main affected buildings were identified (the buildings and terrain were all taken into consideration). In order to determine the calculation area range, in the case of maximum wind speed and maximum temperature rise disturbance, when the surrounding environment space was large enough, a mathematical model with an enlarged area diameter of 2600 m and the height of 2000 m was used to predict the range of the wind field to reach a stable area. According to the design drawing, the mathematical model of the plant was generated for the main buildings of the power plant. Except for the ACC and the MCTs, other buildings in the model area were treated as obstacles in the flow, which only affected the flow, regardless of whether it was hot or endothermic. The ACC was divided into heat transfer units corresponding to the wind turbine, considering the structure of the ACC and the complexity of heat exchange, the model was simplified appropriately. The details of the air-cooled units were neglected. It was proposed to adopt the radiator model in Computational Fluid Dynamics (CFD) software under the premise of keeping the macroscopic resistance and heat transfer characteristics of the ACC unchanged.

2.2. Numerical Model

Under the given environmental meteorological conditions and operating conditions, the ACC and the MCTs can be considered to be in stable operation; therefore, the Reynolds-averaged Navier–Stokes conservation equations are adopted to describe the flow of air in the ACC and its building environment. The Reynolds stress average term is turbulently closed by adopting the RNG k-Ɛ turbulence model. The first-order upwind schemes are used for convection terms in discrete momentum, energy and turbulence equations, and the diffusion term adopts the central difference format. The ACC radiator is simulated by adopting the RADIATOR model in FLUENT software in which the thermal characteristics and resistance characteristics of the radiator are strictly on the basis of the data provided by the manufacturer. The flow field outside the ACC and the MCTs is considered to be incompressible, and the momentum equation and the continuous equation in the basic governing equation are solved by the SIMPLE algorithm for pressure-velocity coupling.
Grid modeling is performed strictly according to the actual model to ensure that the calculated flow field reflects the actual flow field. Important buildings in the factory area, such as boiler rooms, turbine rooms, chimneys, and surrounding mountains, have been reflected in the model. The partitioning of the solid mesh adopted the partitioned meshing technique, and different regions are divided by different mesh types and sizes. A structured grid with a small size was used near the finned tube heat sink, the grid near the air-cooled platform area also selected a smaller spacing, and the other areas used a larger spacing. There are three sets of grids of the numerical for grid independence testing. The resulting grid number is 3,379,659 for simulation modeling of the entire project.
In this study, a lumped radiator model was used to simplify the ribbed tube bundles of the ACC to a non-thickness surface. The radiator simulated in FLUENT is supposed to be infinitely thin and the pressure drop across it is also supposed to be in proportion to the dynamic head of the fluid, and has an empirical formula of the loss factor provided. That is, the pressure drop and the normal velocity component across the radiator can be written as:
Δ P = K L 1 2 ρ v 2
where, ρ and v represent the air density and the magnitude of the local fluid velocity perpendicular to the radiator, respectively. KL is the flow loss coefficient, which can be expressed as a polynomial function, a piecewise linear function or a piecewise polynomial function [27].
Polynomial functions are expressed as:
K L = n = 1 3 r n v n 1
where, rn are the polynomial coefficients with r1 = 70.665, r2 = −15.86 and r3 = 2, in the light of the calculation results of the pressure drop across finned tube bundles.
The heat flux from the radiator to the surrounding fluid can be written as:
q = h ( T H X T e x i t )
where, q, THX and Texit denote the heat flux, the radiator temperature and the temperature of the outlet fluid, respectively. The convection heat transfer coefficient h is a piecewise polynomial function, which are expressed as:
h = n = 0 N h n v n ; 0 N 7
where, hn and v represent the polynomial coefficient and the magnitude of the local fluid velocity perpendicular to the radiator, respectively. The heat transfer and resistance characteristics of the radiator in this study are provided by the manufacturer.
According to the size parameters of the radiator structure provided by the manufacturer, the length of the single tube bundle is 10 m, and the angle between the bundles is 60°, the width is 2.22 m, the thickness is 0.214 m, and the finned ratio is 122.69, as shown in Figure 2 below.

2.3. Boundary Conditions

2.3.1. Fan Boundary Conditions

Injecting the surrounding cooling air into the heat exchanger is an important function of the axial fan, so this study chose the fan model in the FLUENT software because it can achieve this purpose by increasing the fluid pressure flowing through the fan. The FAN model is a lumped model that can be adopted to predict the influence of a fan with known deterministic properties on the flow field in a large basin. The fan characteristic curve expresses the relationship between the pressure-flow of the fan at a given known rotational speed. Taking the FLUENT software as an example, in the FAN model of FLUENT, simplifying the fan into an infinitely thin layer causes the discontiguous pressure to rise to overcome the flow resistance, and the fan’s discontiguous pressure rise is designated as a function of fan speed. The axial flow fan is simplified to a pressure jump surface, and the pressure rise ∆P is calculated as a polynomial form of the axial velocity v. The relationship between them can be a piecewise polynomial function and is expressed as [27]:
Δ P = n = 1 6 f n v n 1
where, ∆P and v represent the pressure jump and the size of the local fluid velocity perpendicular to the fan, respectively. Both the MCTs and the ACC contain fans, and the coefficients are different. fn1 are the pressure-jump polynomial coefficients of MCTs, with f1 = 459.2698, f2 = −28.93151, f3 = 5.4779, f4 = −0.89391, f5 = 0.04158 and f6 = −0.000750621. fn2 are the pressure-jump polynomial coefficients of the ACC, with f1 = 34.07611, f2 = 178.7873, f3 = −61.21099, f4 = 9.15276, f5 = −0.66468 and f6 = 0.01831, which are obtained by fitting the change of the static pressure with the volume flow rate.

2.3.2. Inlet Boundary Conditions

The boundaries of the air-inlet surfaces are set as the velocity inlet and the calculation should use the atmospheric boundary function, which is expressed as:
U i U = ( Z i Z ) α
where, Z is the speed at which the airflow reaches a uniform, U and Ui represent the average speed at the Z and Zi, respectively, α is the wall roughness coefficient, the greater the roughness, the larger the value of α.

2.3.3. Outlet Boundary Conditions

The boundary of the outlet is set to a pressure outlet, and the static pressure at the flow outlet boundary is given according to the relationship between the barometric pressure and the elevation of the ocean level, as is the inlet pressure.
P = 760 e a 7926
where, a is the altitude and the unit is m, P is atmospheric pressure and the unit is mmHg.

2.3.4. Other Boundary Conditions

Using K-Ɛ to describe the turbulence model and ambient air turbulence is very weak, with a recommended turbulence intensity of 10% and a viscosity ratio of 5 [28]. Surfaces such as ground and buildings are set as wall boundary conditions, regardless of their heat dissipation or heat absorption, only considering the impact on the flow. In this paper, it is assumed that air is an ideal gas, and its density is also calculated as an ideal gas. All parameters such as specific heat, heat transfer coefficient, etc., are constant. Figure 3 shows the computation domain and its air flow boundaries for the ACC and MCTs.

3. Results and Discussion

3.1. Effect of Hot Air Recirculation (HAR) on Heat Transfer Performance of the Air-Cooled Condenser (ACC)

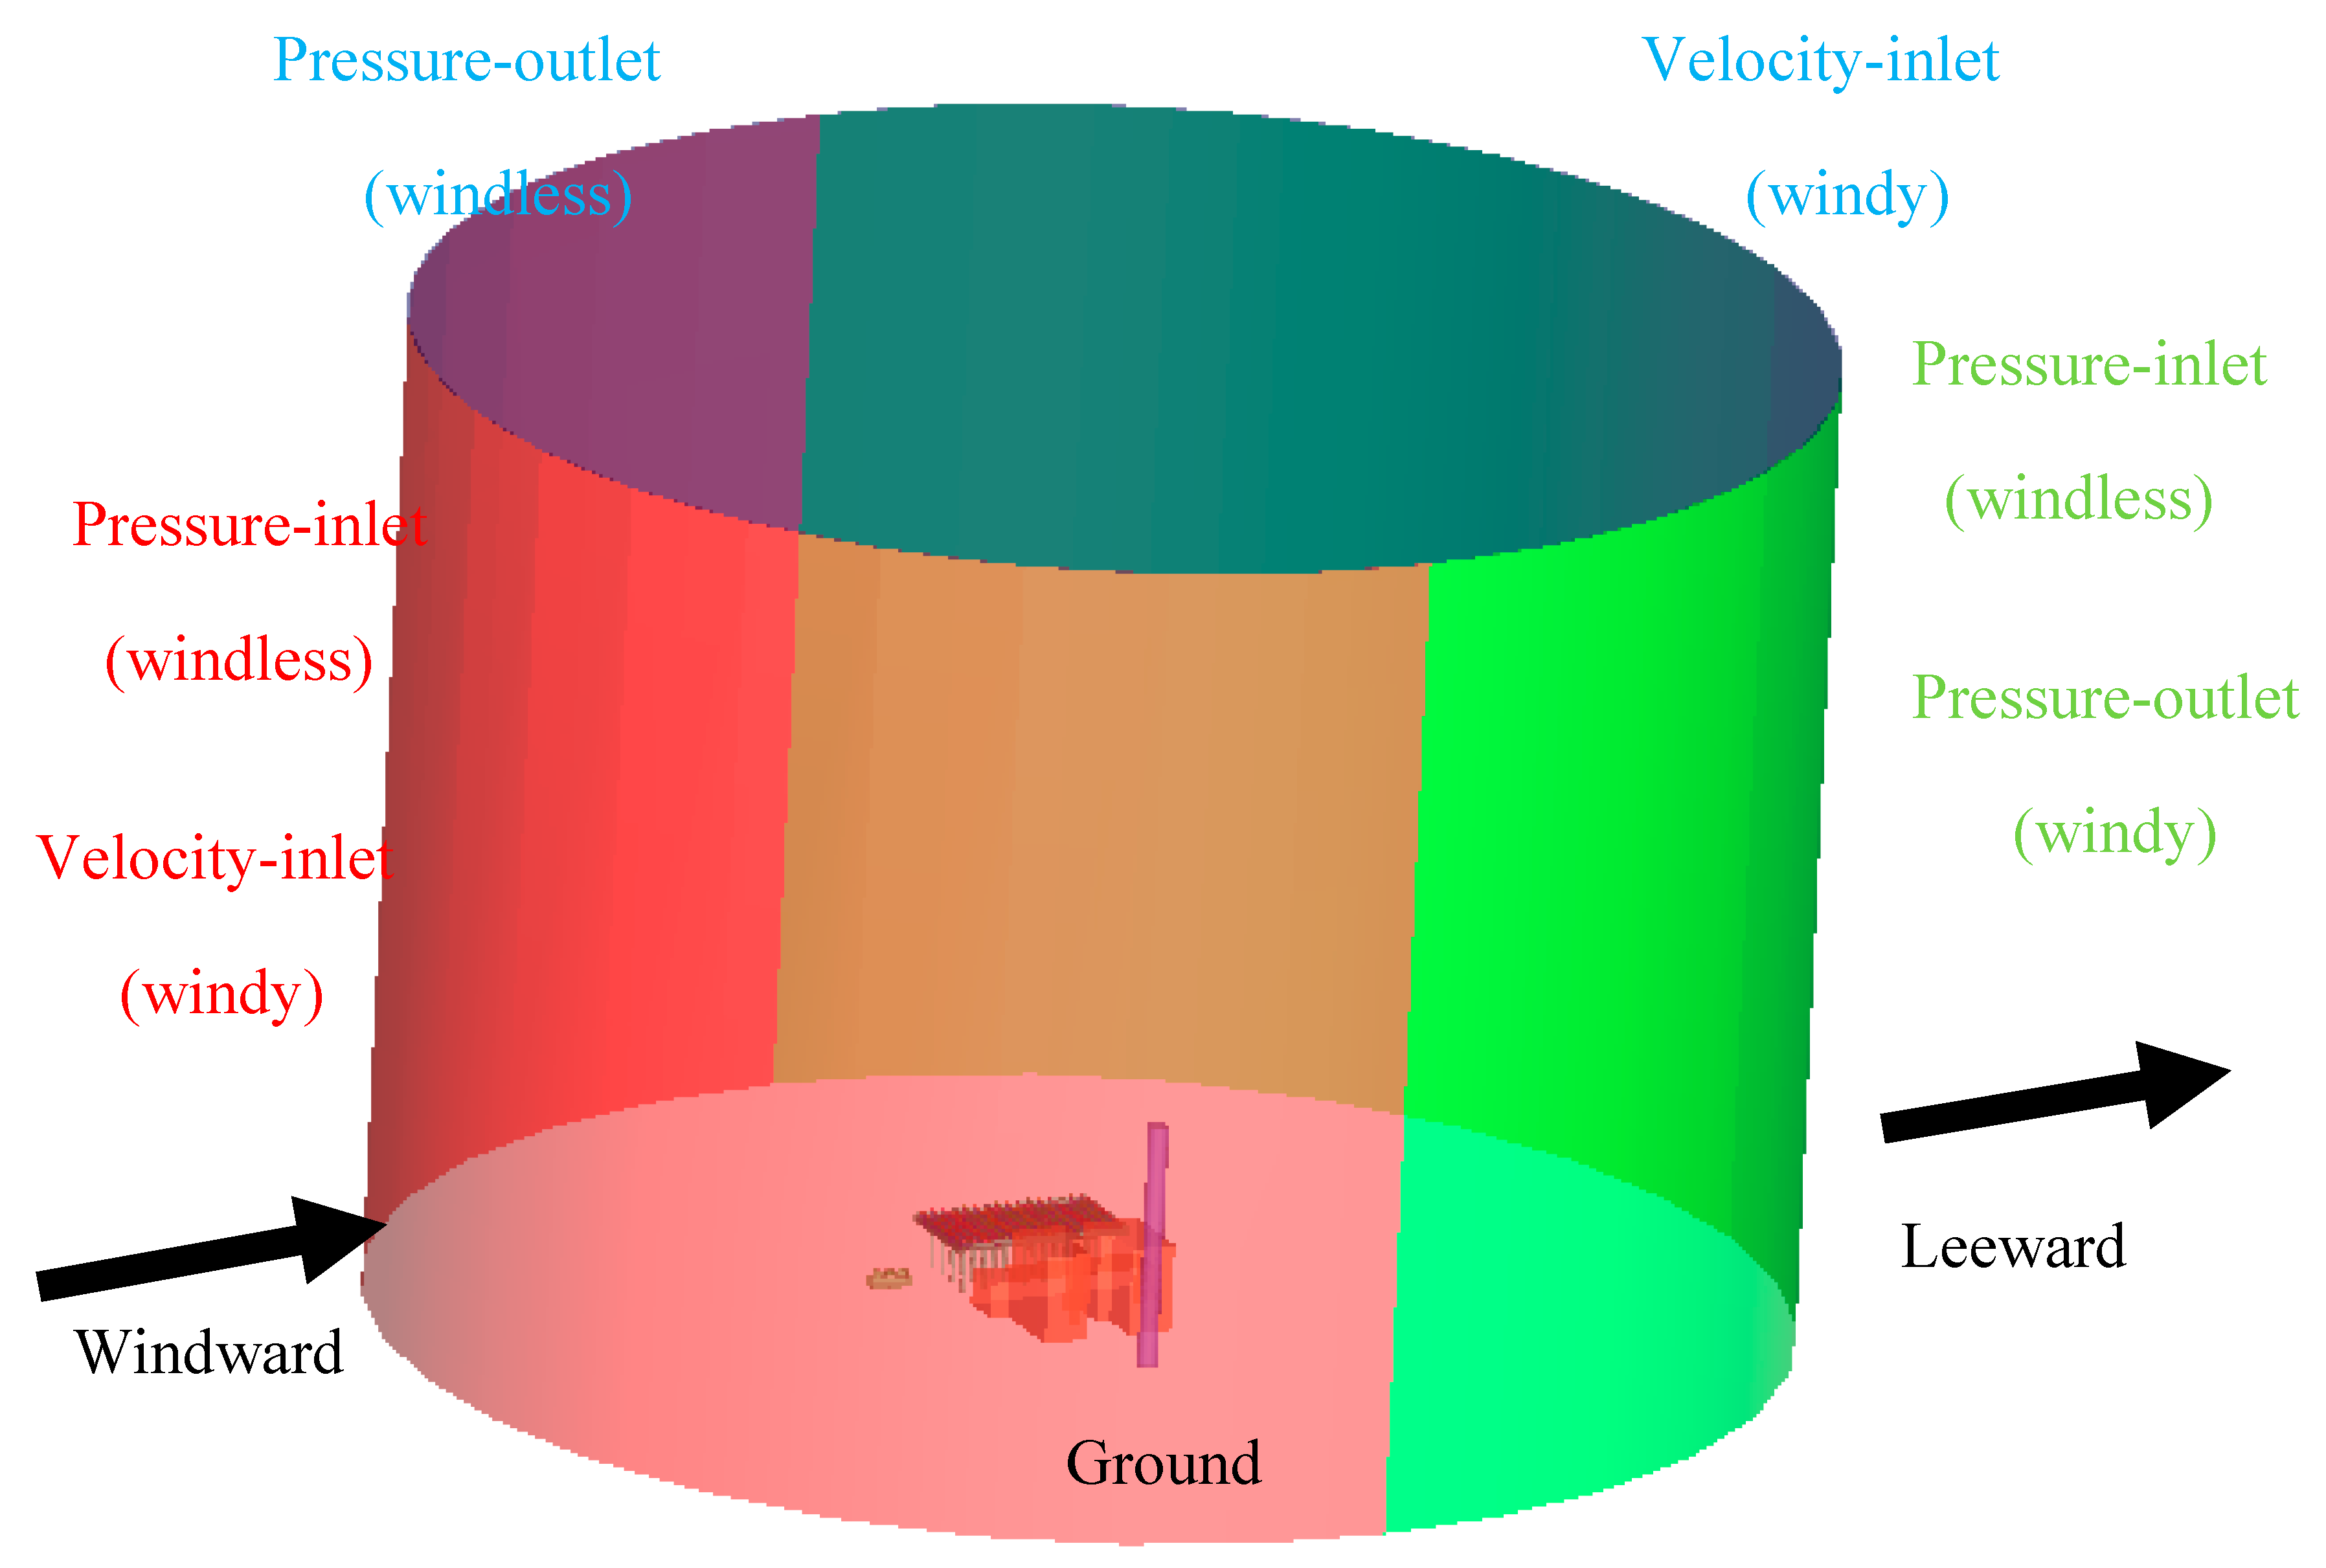
HAR means that the hot air discharged from the ACC is returned to the air-cooling fan suction port, which causes the air temperature of the inlet of the ACC to rise. The hot recirculation rate (HRR) represents the strength of the HAR, the greater the HRR, the stronger the HAR. On account of the complexity of the direct ACC itself and the overall arrangement of its surrounding buildings, the flow field embracing them is very complicated; therefore, it is very necessary to study the wind or confirm the influence law of different ambient winds on the HRR. We selected the ambient temperatures of 34 °C and 38 °C, different incident wind directions of west-north-west (WNW), south-south-east (SSE) and wind speeds of 5 m/s and 7 m/s to complete the numerical simulation of the impact of ambient wind on HRR.
For quantitative analysis of thermal reflow, the HRR is defined as follows:
R = T i T a T o T a × 100 %
where, Ti is the average temperature at the inlet of the fan and Ta and To represent the ambient temperature and the average temperature at the outlet of the ACC, respectively.
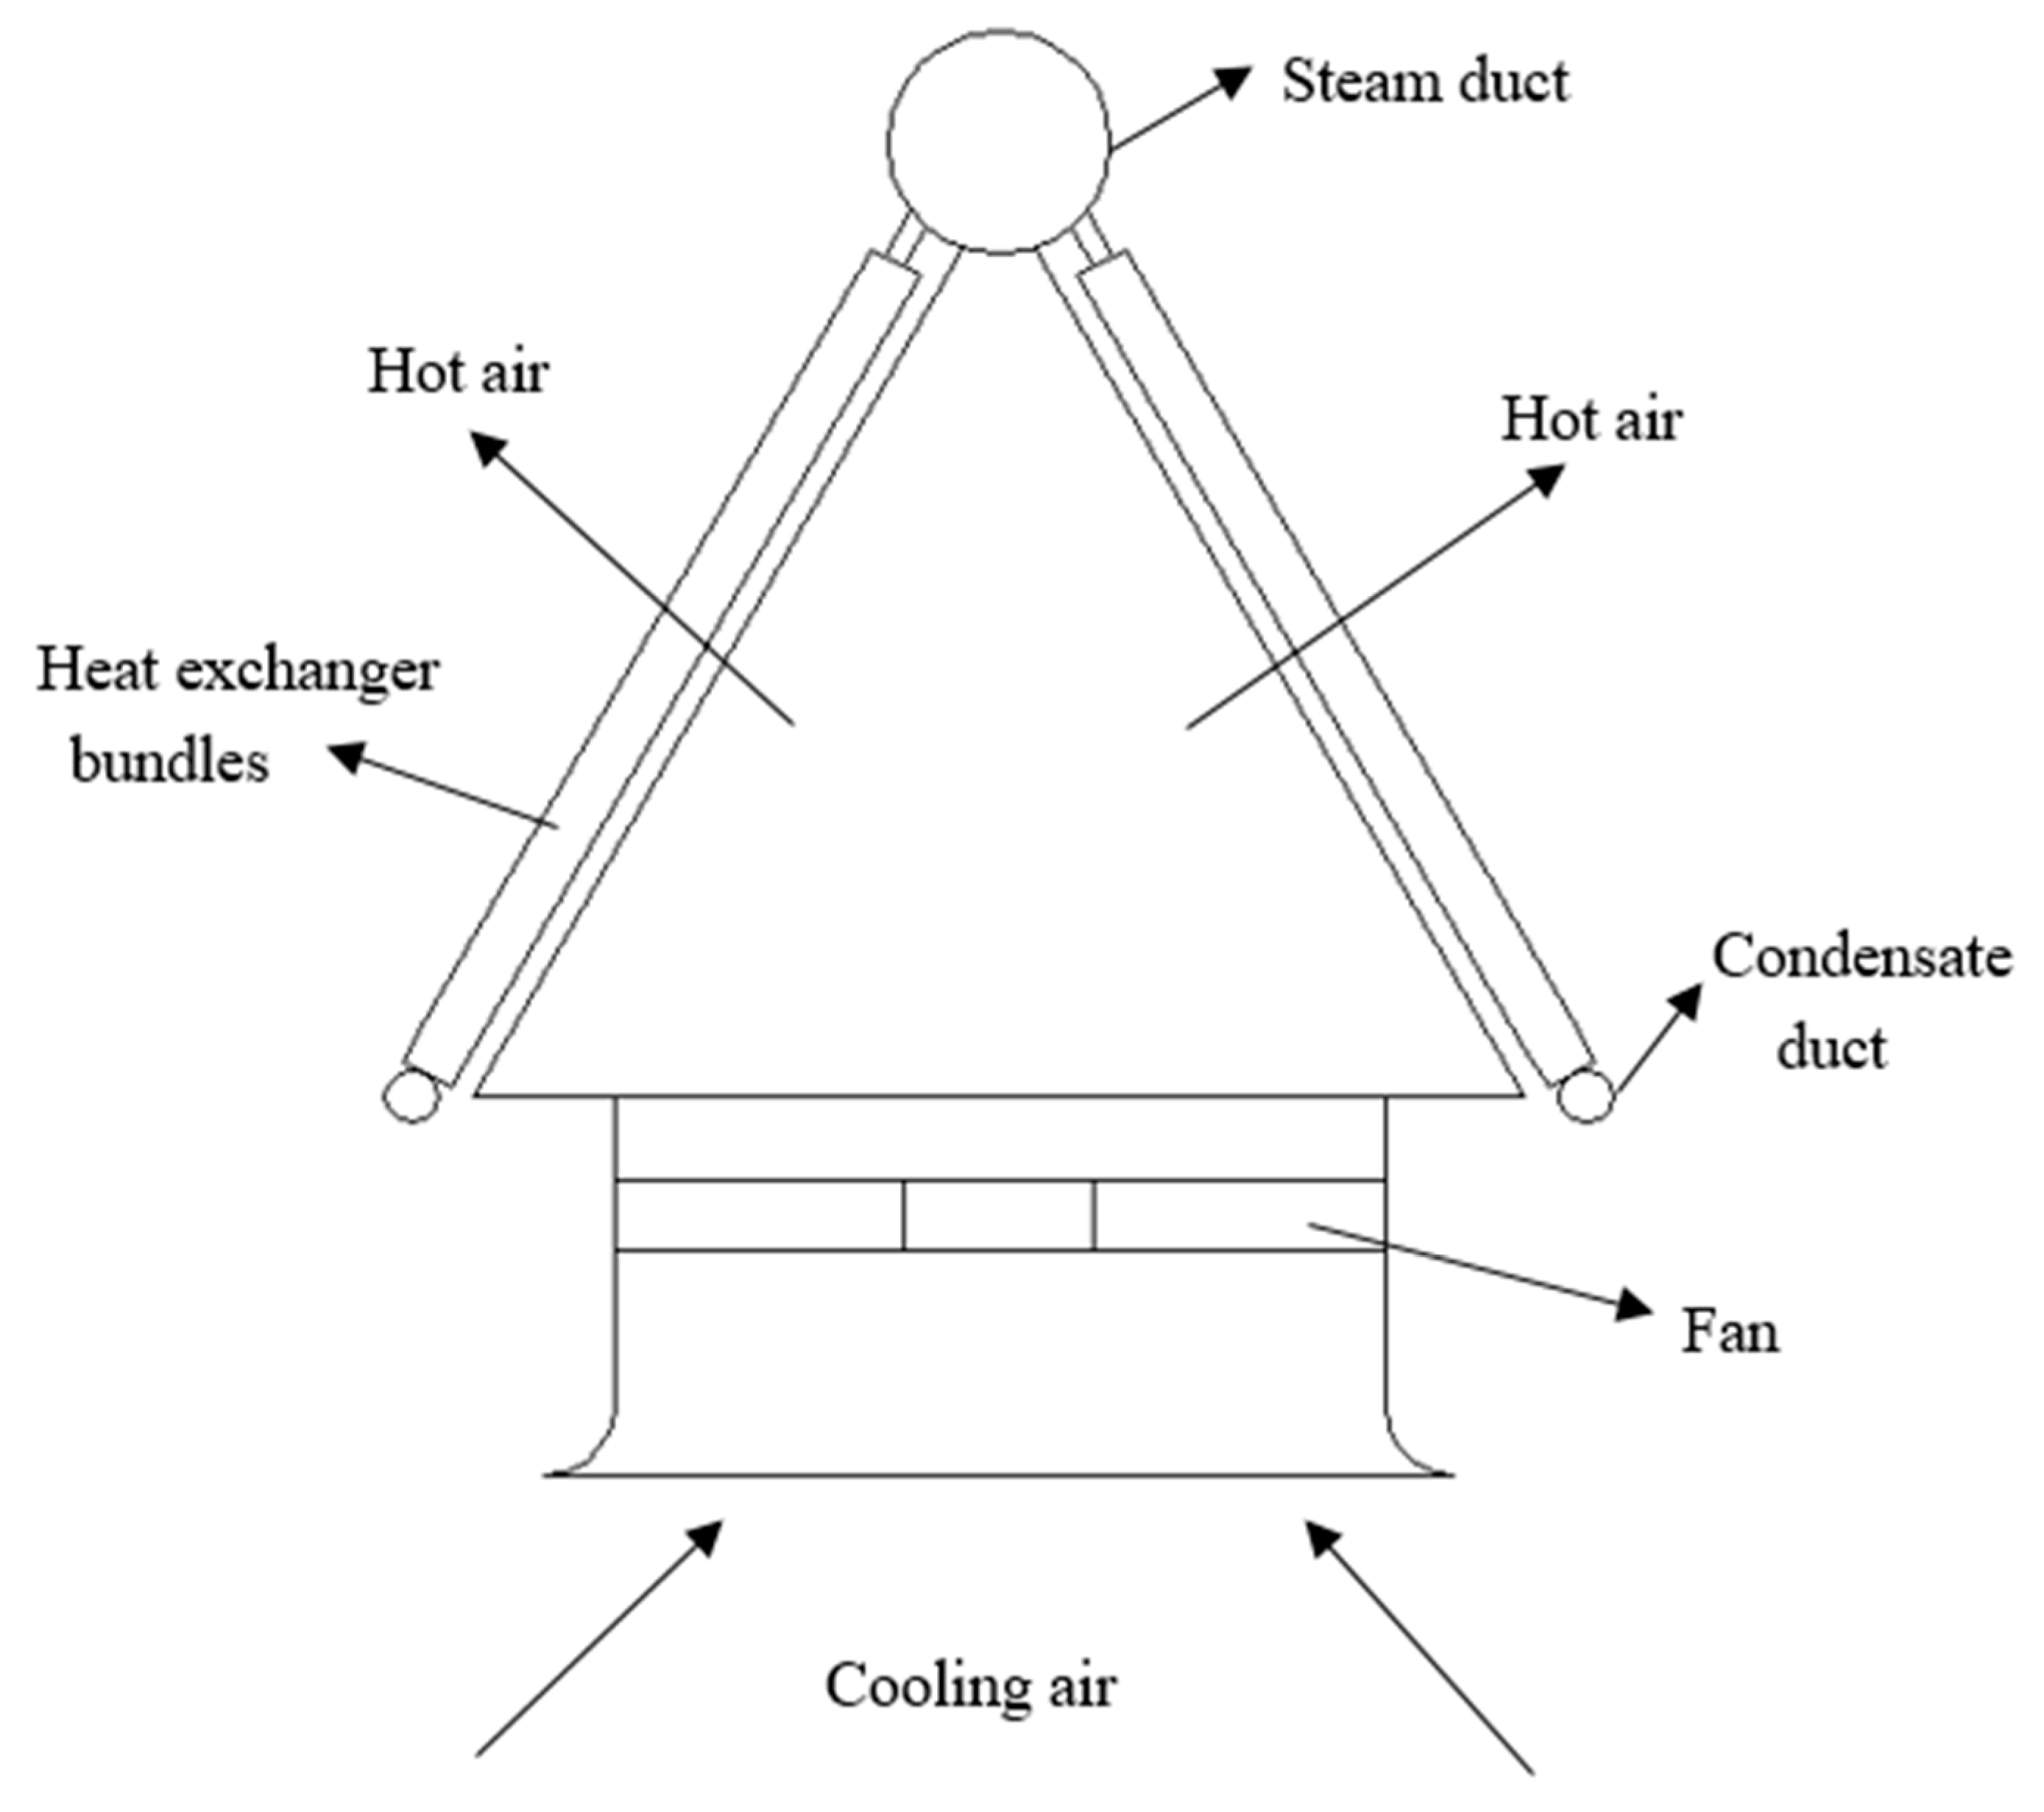
For the ACC, the wall heat conduction thermal resistance and the steam condensation heat resistance are neglected. It is considered that the exhaust steam temperature is equal to the tube bundle average wall temperature, that is, the temperature of the exhaust steam and the pressure of the exhaust steam are calculated according to the tube bundle average wall temperature.
T s = q h + T a 1 + T a 2 2
where, Ts is the exhaust steam temperature and q and h represent the heat flux per square meter and the heat transfer coefficient, respectively. Ta1 and Ta2 represent the average temperature of the inlet air and outlet air of the ACC, respectively.
The heat transfer capacity of a single unit under a design condition is about 820.86 MW, and the calculated heat flow per square meter is 47,400.47 W/m2. Ta1, Ta2 and 
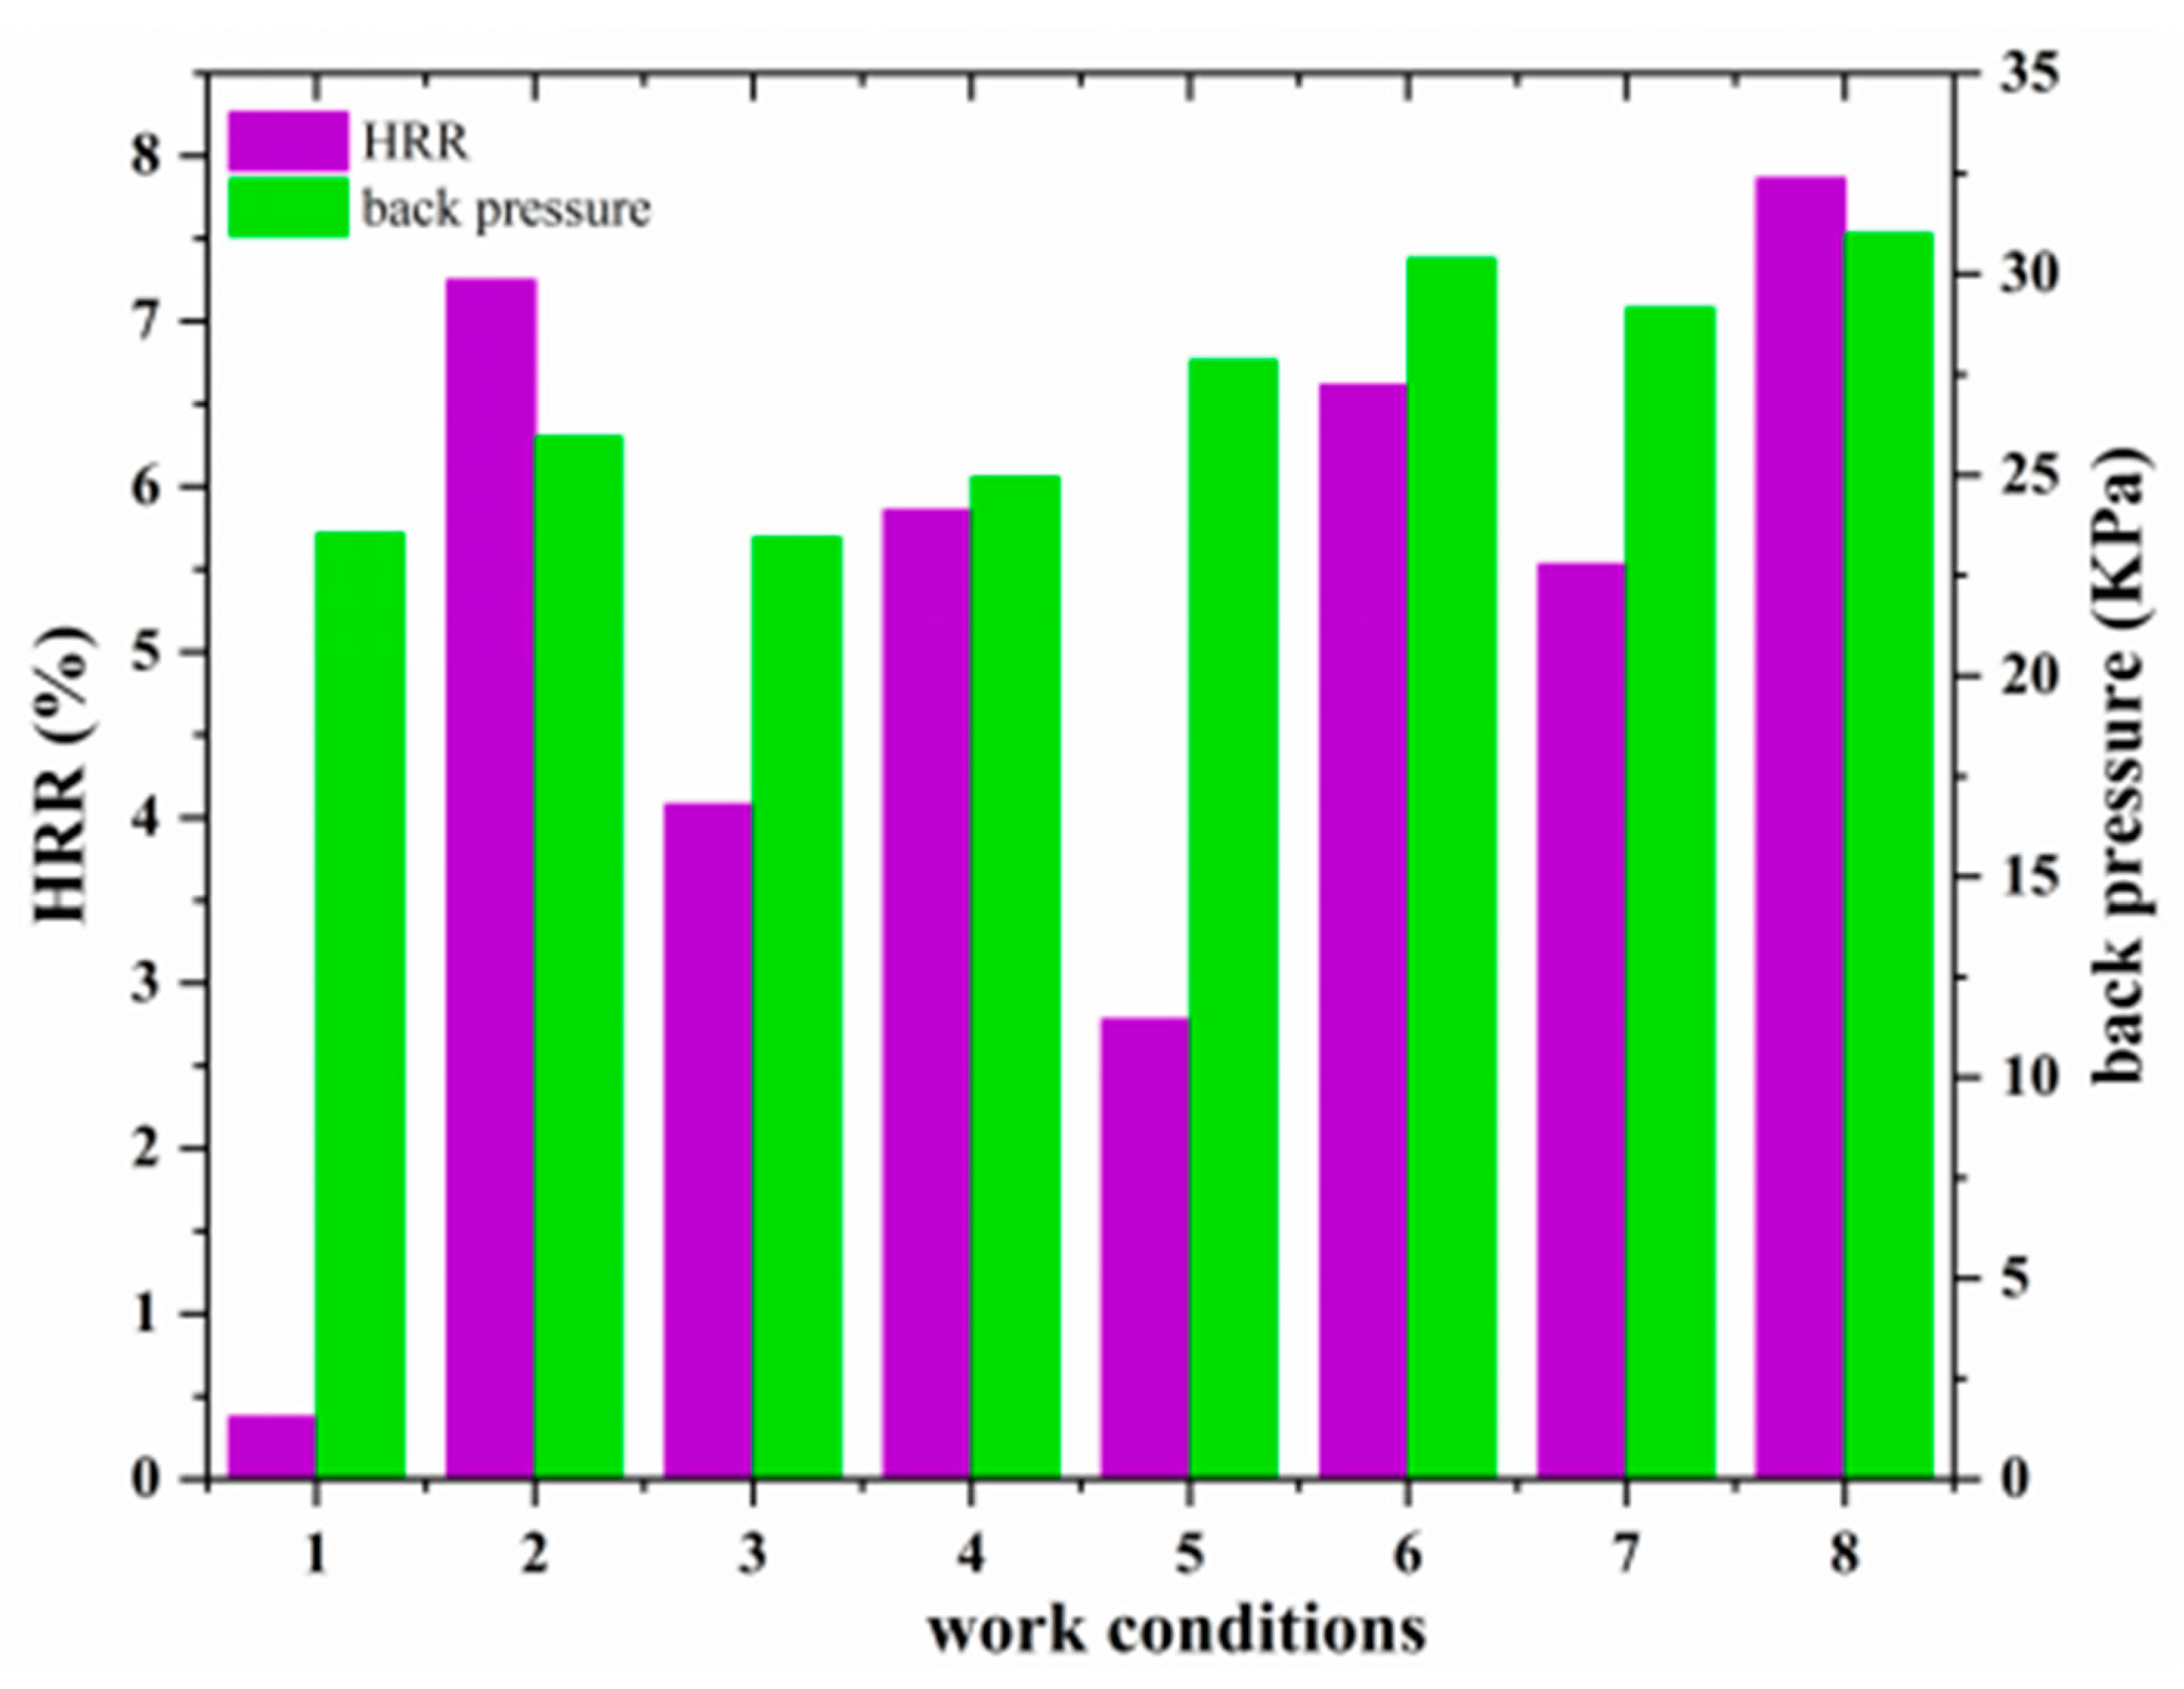
h were obtained by three-dimensional (3D) model calculation. The HRR and the back pressure of the ACC can represent the level of the cooling performance of the ACC, a higher HRR and back pressure will have a lower cooling performance of the ACC. Combining different wind speeds, ambient temperature and wind directions, a total of eight working conditions were obtained. The calculation and analysis of these working conditions were carried out, and the corresponding back pressure and HRR were obtained to further study the effect of different environmental conditions on the heat transfer performance of the ACC. The calculated data is shown in Table 2 below.
It can be seen from Table 2 that the change of wind direction affects the average temperature at the fan inlet and the exhaust temperature at the fan outlet. The wind direction of WNW increases the average temperature at the fan inlet. From Figure 4, we can see that under the effect of HAR, the back pressure of the unit was higher than 24 kPa under the ambient temperature of 38 °C. Under the conditions of the ambient temperature of 34 °C, wind speed of 7 m/s and wind direction of SSE and WNW, the back pressure of the unit was also higher than 24 kPa, which exceeded the safety back pressure (24 kPa) at the steam exhaust port of the turbine. At the same ambient temperature and the same wind direction, HRR and back pressure increased as the wind speed increased from 5 m/s to 7 m/s. Similarly, an increase in ambient temperature can cause a significant increase in back pressure. Among them, the increase of ambient temperature led to the performance degradation of the ACC, and the increase of wind speed also caused the same situation to occur, but the influence was less than the increase of ambient temperature and greater than the change of wind direction.

3.2. Influence of Summer Extreme Conditions on Heat Transfer Performance of the Direct ACC

As the ambient temperature rose, especially in the extreme high-temperature conditions in summer, the heat transfer performance of the direct ACC would be correspondingly reduced, resulting in an increase of turbine back pressure. The output of the units was not guaranteed, and even affected the safe operation of the units. Therefore, the heat transfer performance of the direct ACC under high temperature and unfavorable wind direction in summer was studied to understand the law of the influence of extreme meteorological conditions on the ACC’s cooling performance. Summer extreme conditions and unfavorable wind direction and wind speed were corresponding to the ambient temperature of 38 °C, the summer-dominant wind direction of SSE and the wind speed of 7 m/s. For the ACC, under the extreme summer conditions, the average temperature at the inlet of the fan was 39.82 °C, and the cooling triangle outlet average temperature was 65.534 °C. According to the formula, the back pressure of the ACC can be calculated to be 30.40 kPa, and the HRR of the ACC was 6.614%.
The ACC has a total of 128 cooling units with 16 columns and 8 rows. We represented X as a column and Y as a row, for example, X8Y2 represents the heat exchange unit in the eighth row and the second column, and so on. 
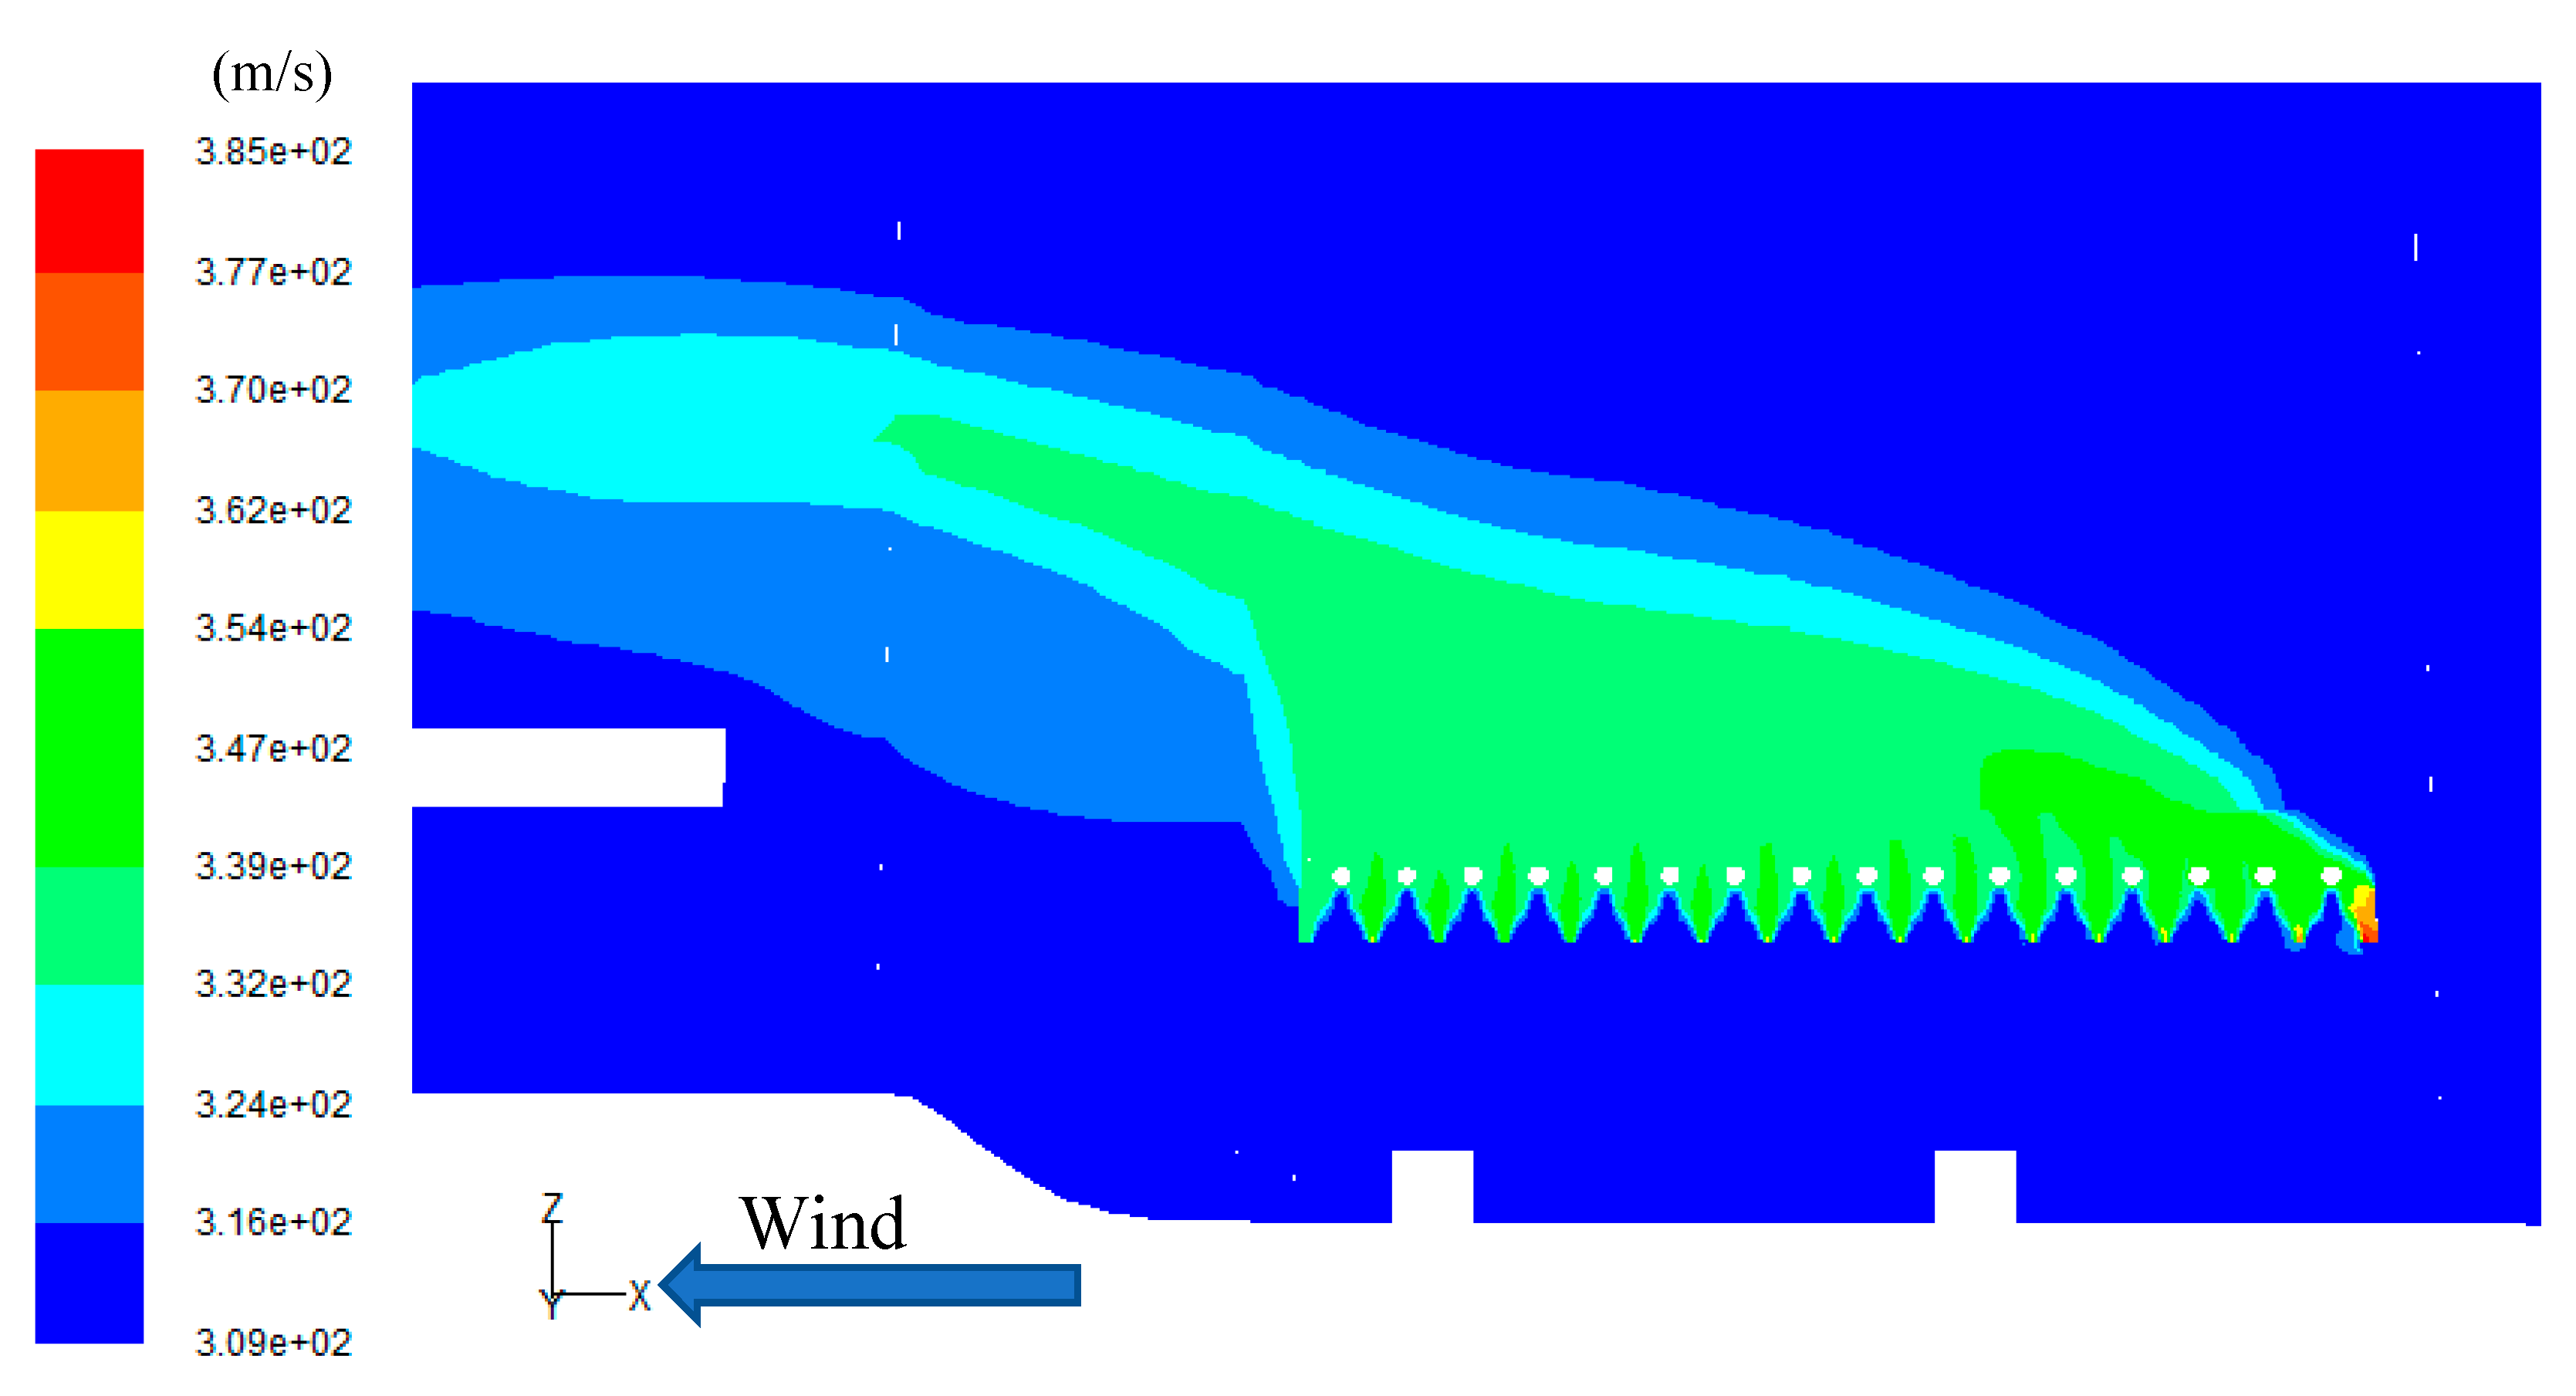
Figure 5 shows the transverse section temperature distribution of the ACC and it can be seen that the temperature gradient decreased from the windward side to the leeward side. The temperature on the windward side is significantly higher than the temperature on the leeward side. We can use Equation (8) to calculate the HAR of the ACC; therefore, the HAR in the upstream was significantly higher than the downstream of the wind field, so the heat transfer efficiency of the ACC heat exchange units on the windward side was reduced. 
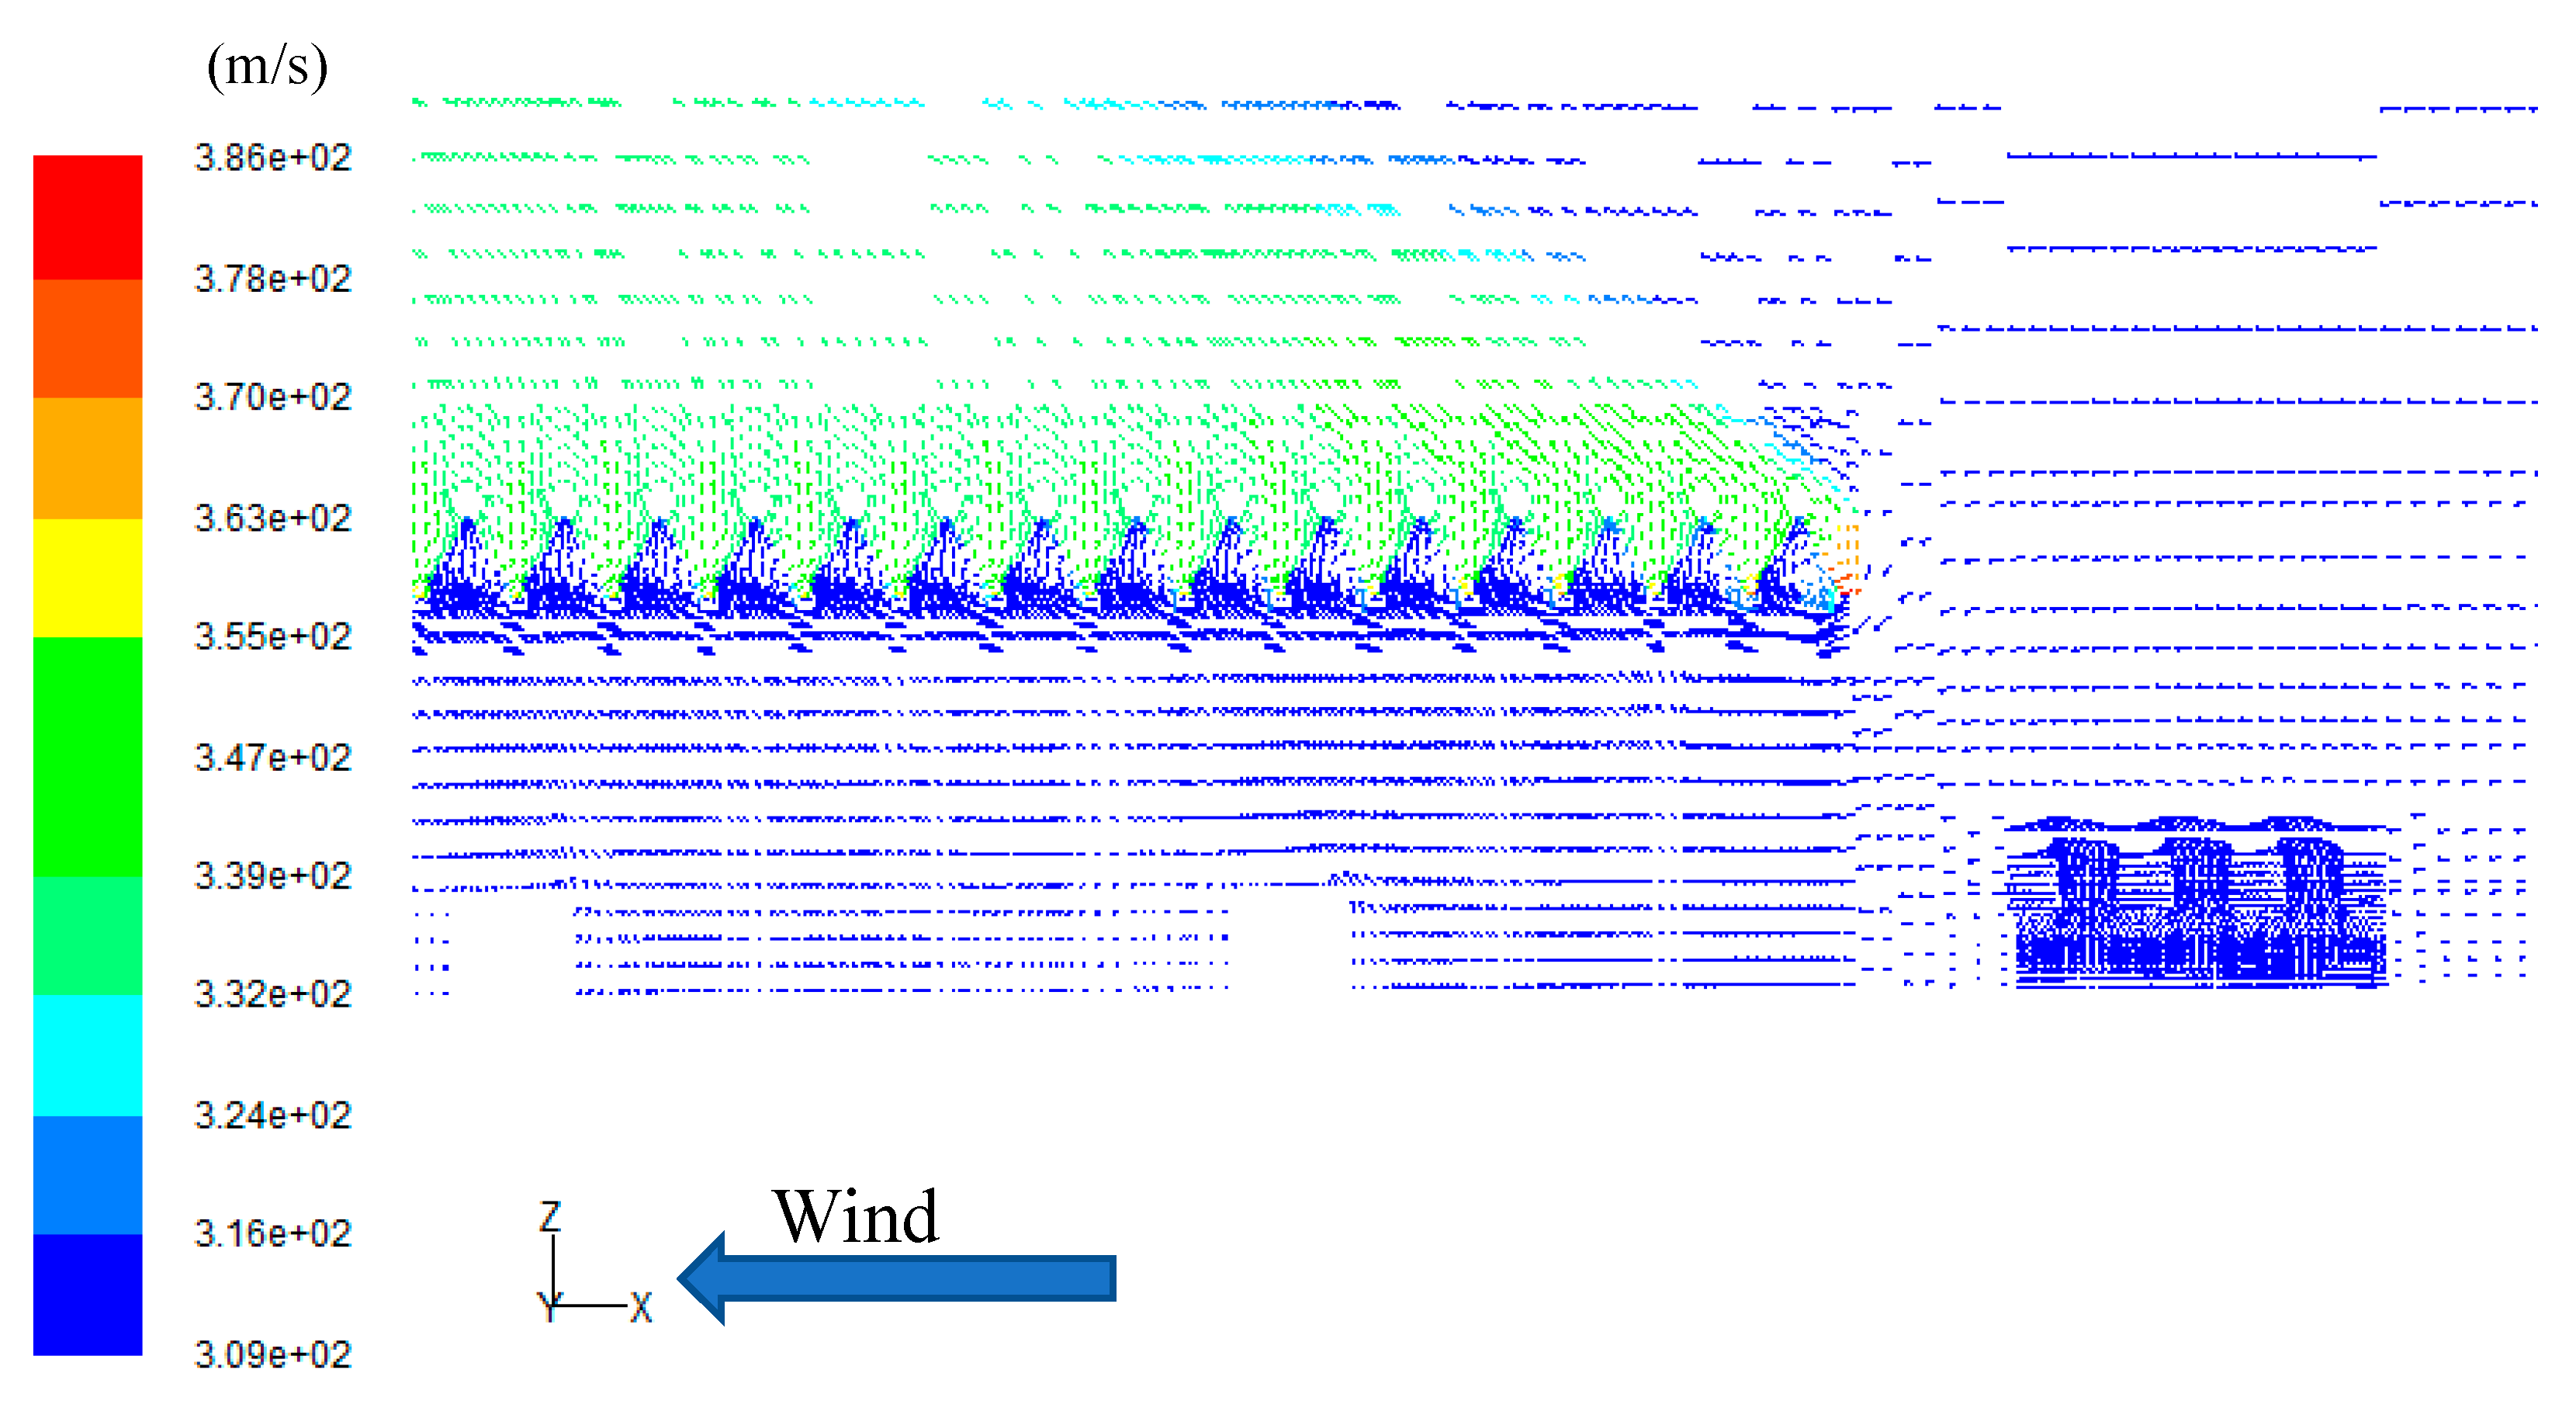
Figure 6 showed the ACC and MCTs transverse section velocity distribution. Because of the influence of HAR, the heat exchange units of the ACC on the windward side upstream of the wind field produced significant eddy currents. It can be seen in Figure 6 that there was no obvious eddy current around the wind field of the MCTs, so there was no mutation in the velocity at the outlet of the MCTs. Therefore, it can be concluded that the MCTs were not obviously affected by the ambient wind. Besides, it can be indicated from Figure 6 that the influence of ambient wind on the ACC was significantly greater than that of MCTs. 
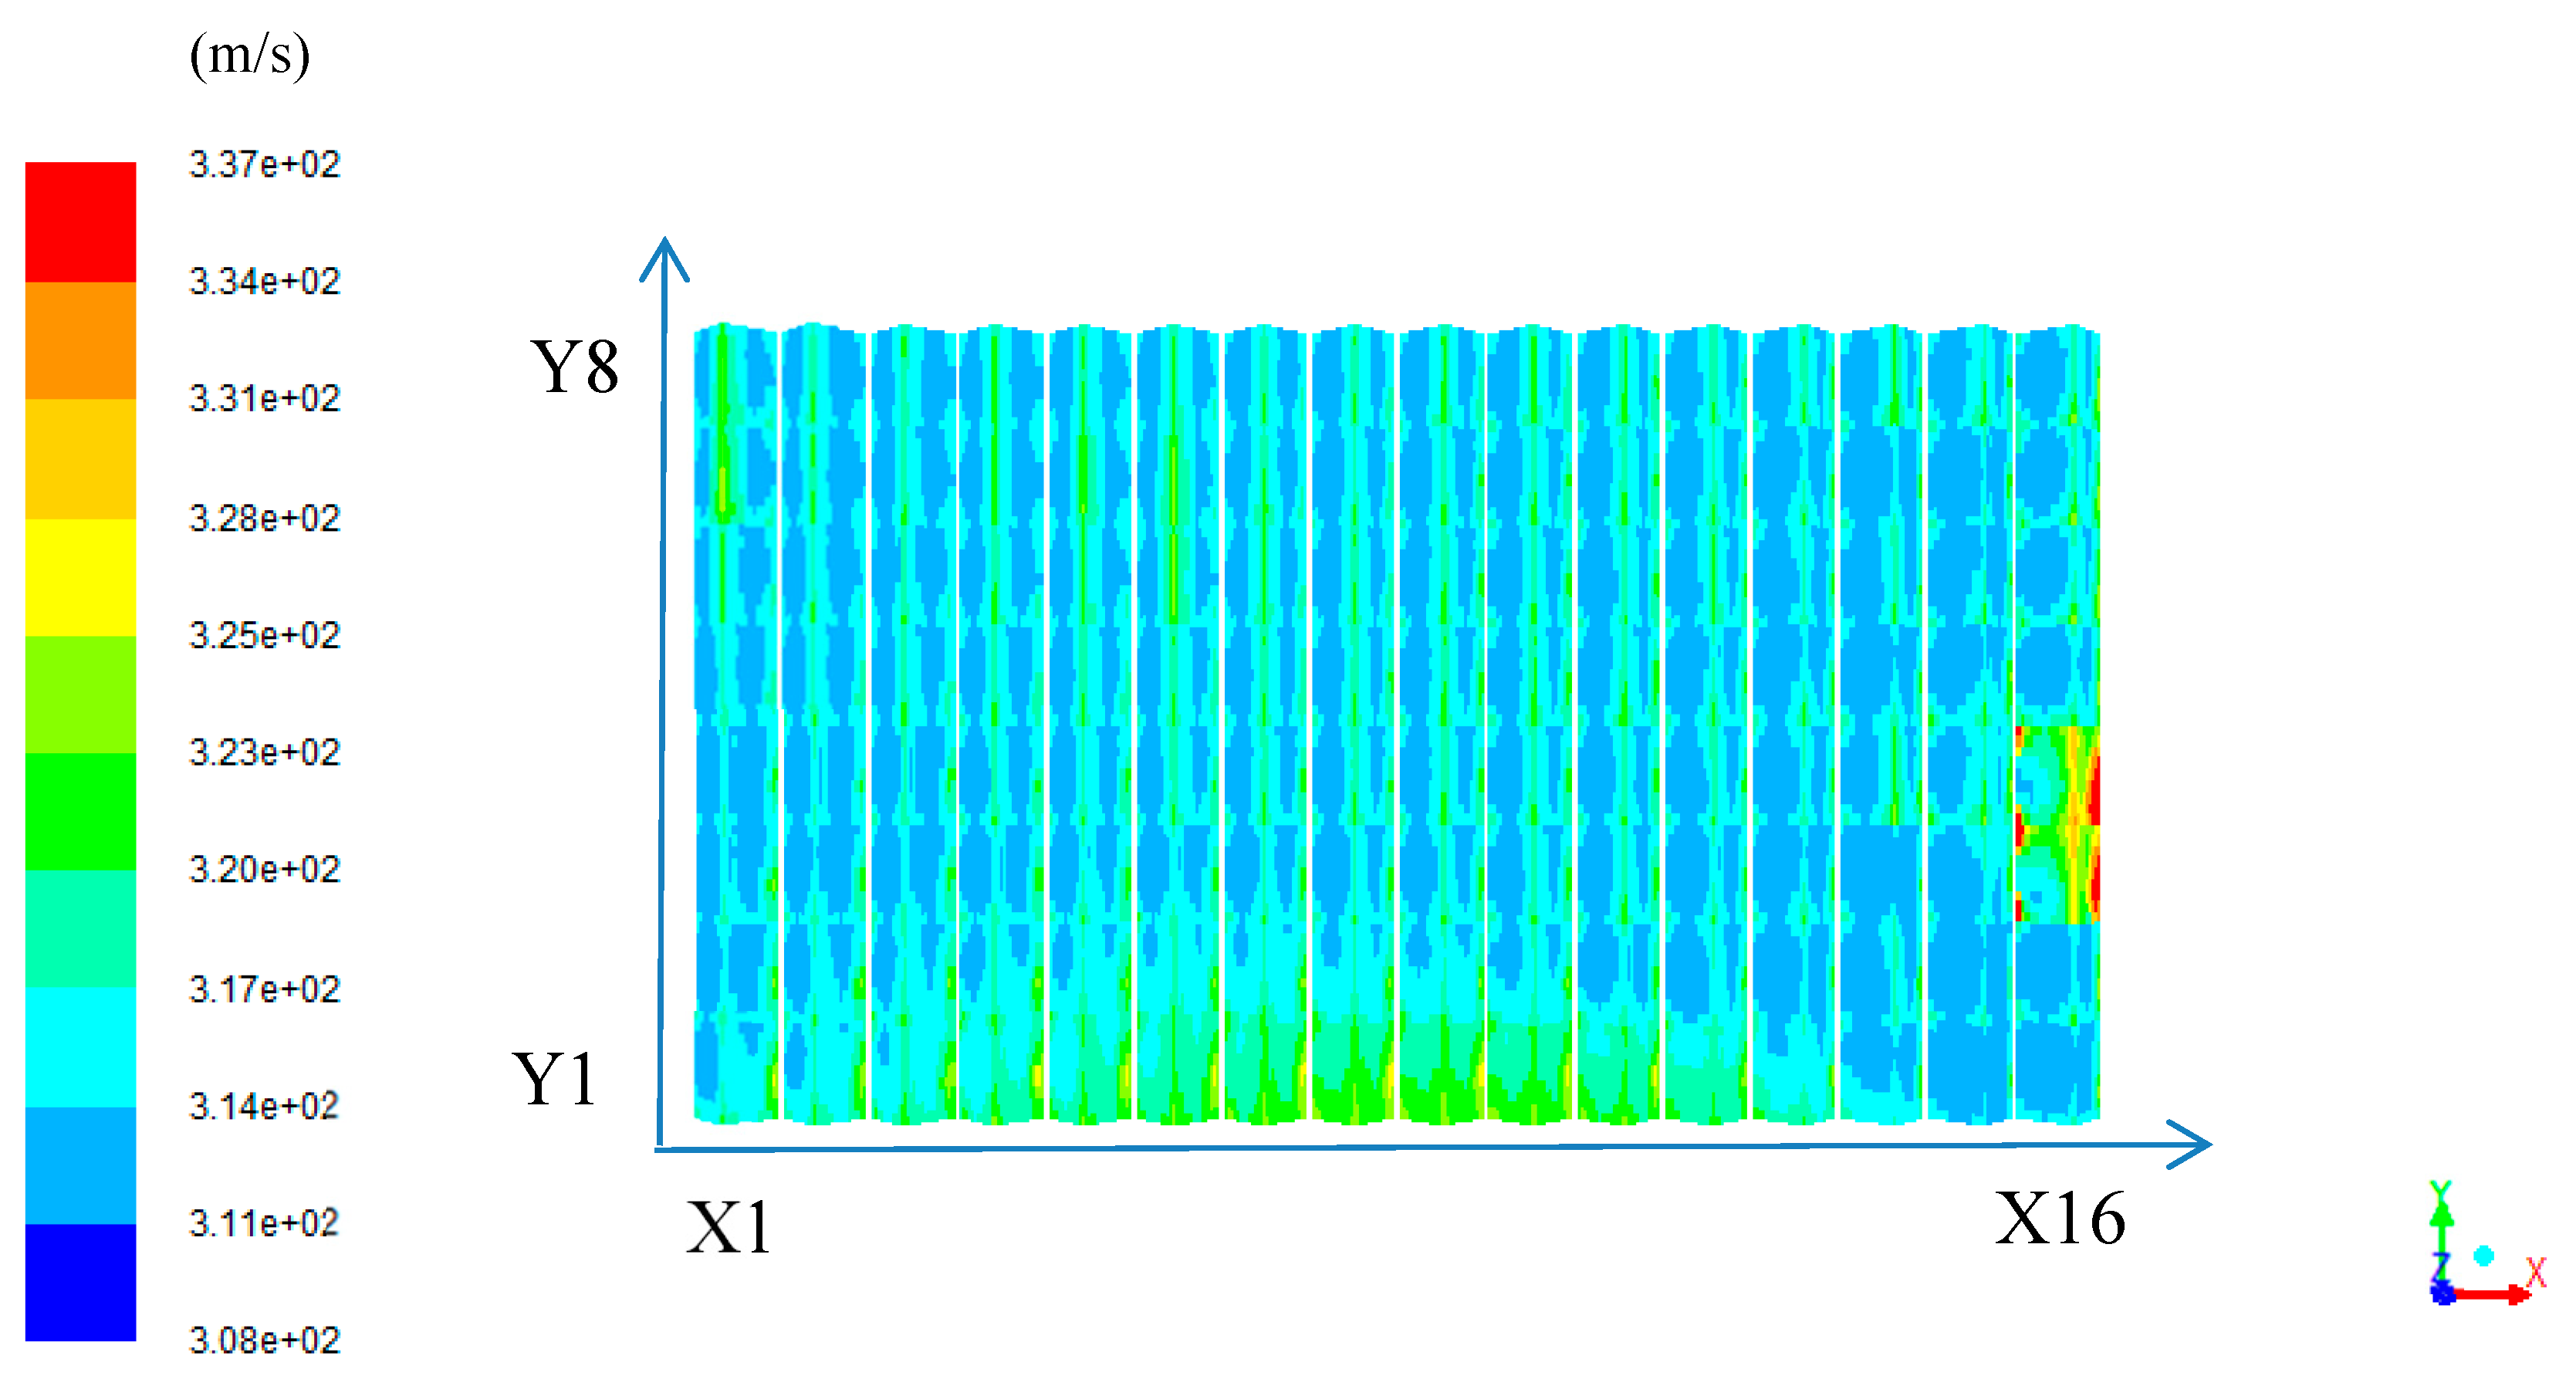
Figure 7 shows the cooling triangle temperature distribution of the ACC by comparing the X15Y4 and X16Y4 cooling units. Due to the influence of eddy currents, the volume flow of the units decreased from 327.622 m3/s to 242.931 m3/s and the fan power dropped from 76.95 KW to 49.12 KW. Therefore, under summer extreme conditions, due to the effect of HAR, hot air intrusion occurred at the edge of the ACC, resulting in the reduced cooling performance of the ACC.

3.3. Effect of MCTs on the Cooling Performance of the ACC

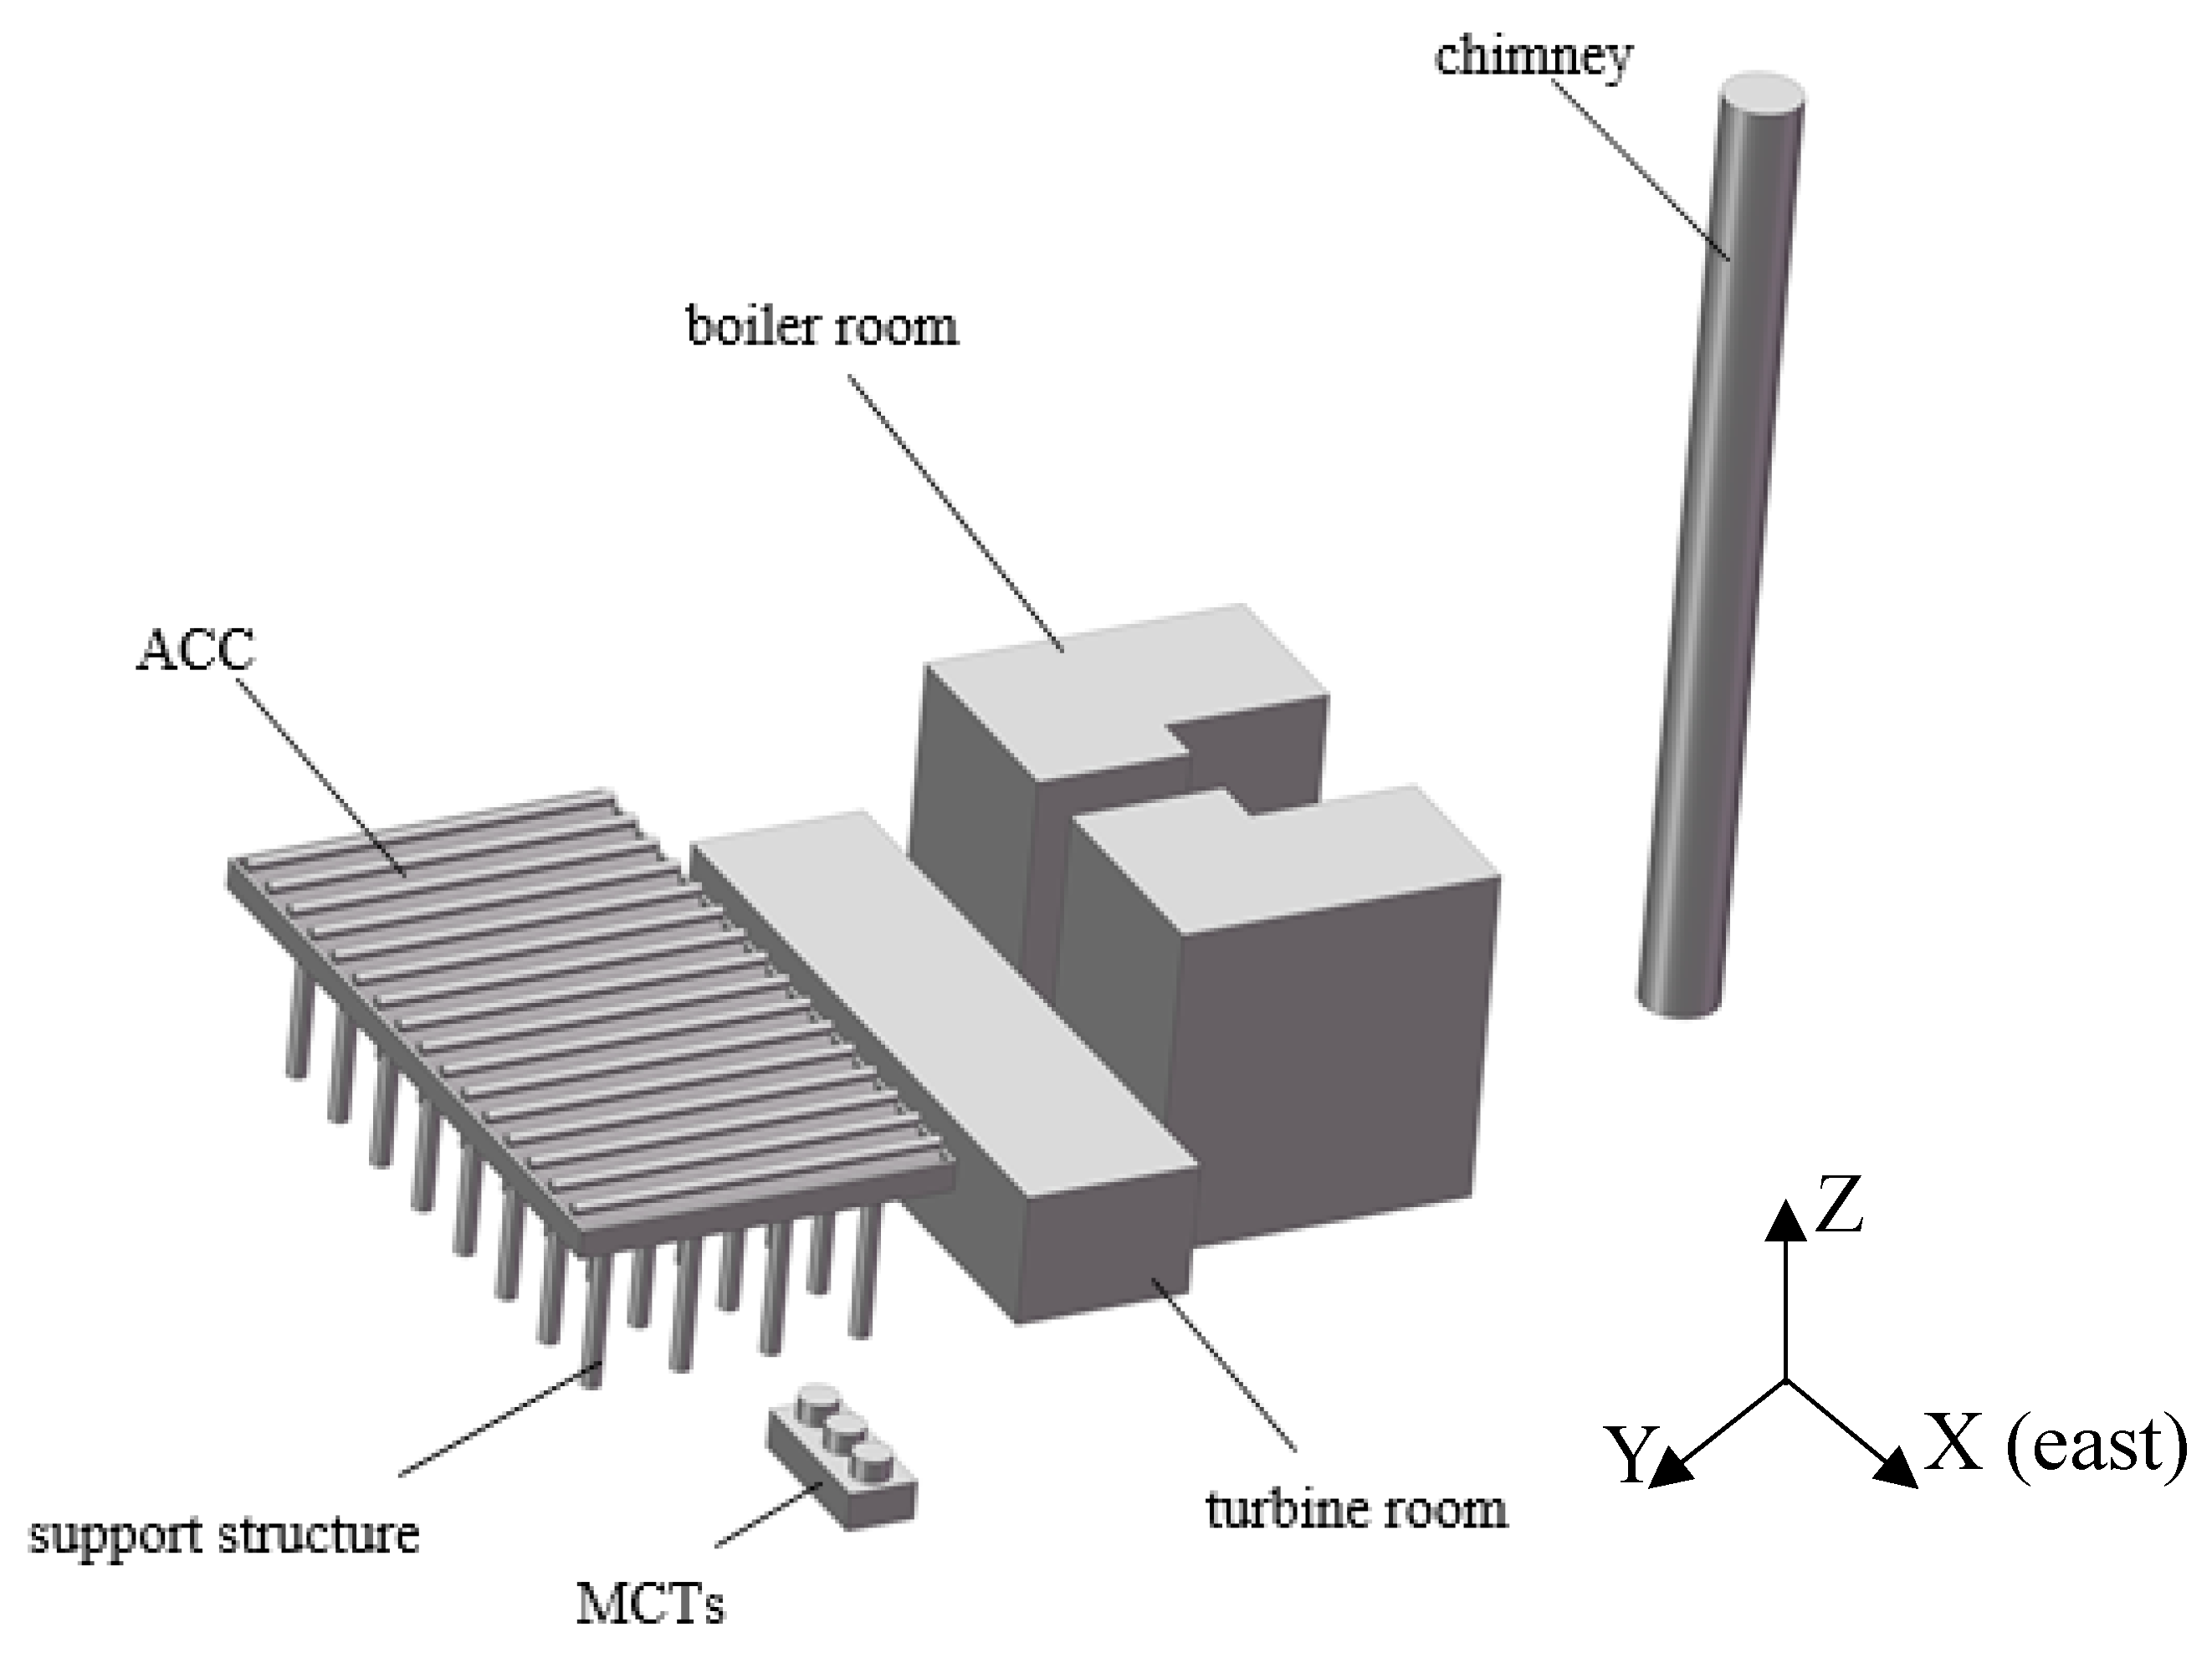
In power plants, MCTs and the ACC are coexisting, and there is bound to be an interaction between them. The exhaust of the MCTs will partially enter the ACC under the effect of the ambient wind, which will affect the cooling performance of the ACC. Under different environmental conditions, MCTs will have different effects on the cooling performance of the ACC. Ambient air enters the MCTs through the air inlet. After a series of heat exchange with the high-temperature steam, it is discharged into the environment by the fan at the air outlet. The temperature of this part of the exhausted air is often higher than the ambient air, and the exhausted air always entrains high-temperature steam. The increase in temperature causes the air density to become smaller, so the discharged air will rise. Under the influence of ambient wind, this part of the exhausted air will pass through the air inlet of the ACC, causing the temperature of the air sucked by the ACC to increase. According to the heat exchange formula, the heat exchange temperature difference is reduced, and the ACC needs to do more work to complete the same heat transfer quantity, which greatly affects the heat transfer performance of the ACC, especially the entrained water mist, which may have serious consequences for the ACC. Similarly, the air discharged from the ACC will also affect the heat transfer performance of the MCTs. Therefore, when MCTs and the ACC work together in the same power plant, it is very indispensable to study the interaction between them. According to the numerical simulation, the effect of the MCTs on the cooling performance of the ACC and the influence of the presence or absence of the MCTs on the cooling performance of the ACC were studied, which provides a feasible scheme for the research on the ACC. In order to better analyze the effect of MCTs on the cooling performance of the ACC, we chose to be in summer extreme conditions (ambient temperature of 38 ℃, wind speed of 7 m/s, wind direction of SSE), which can weaken other influencing factors, focusing on the impact of MCTs on the cooling performance of the ACC.
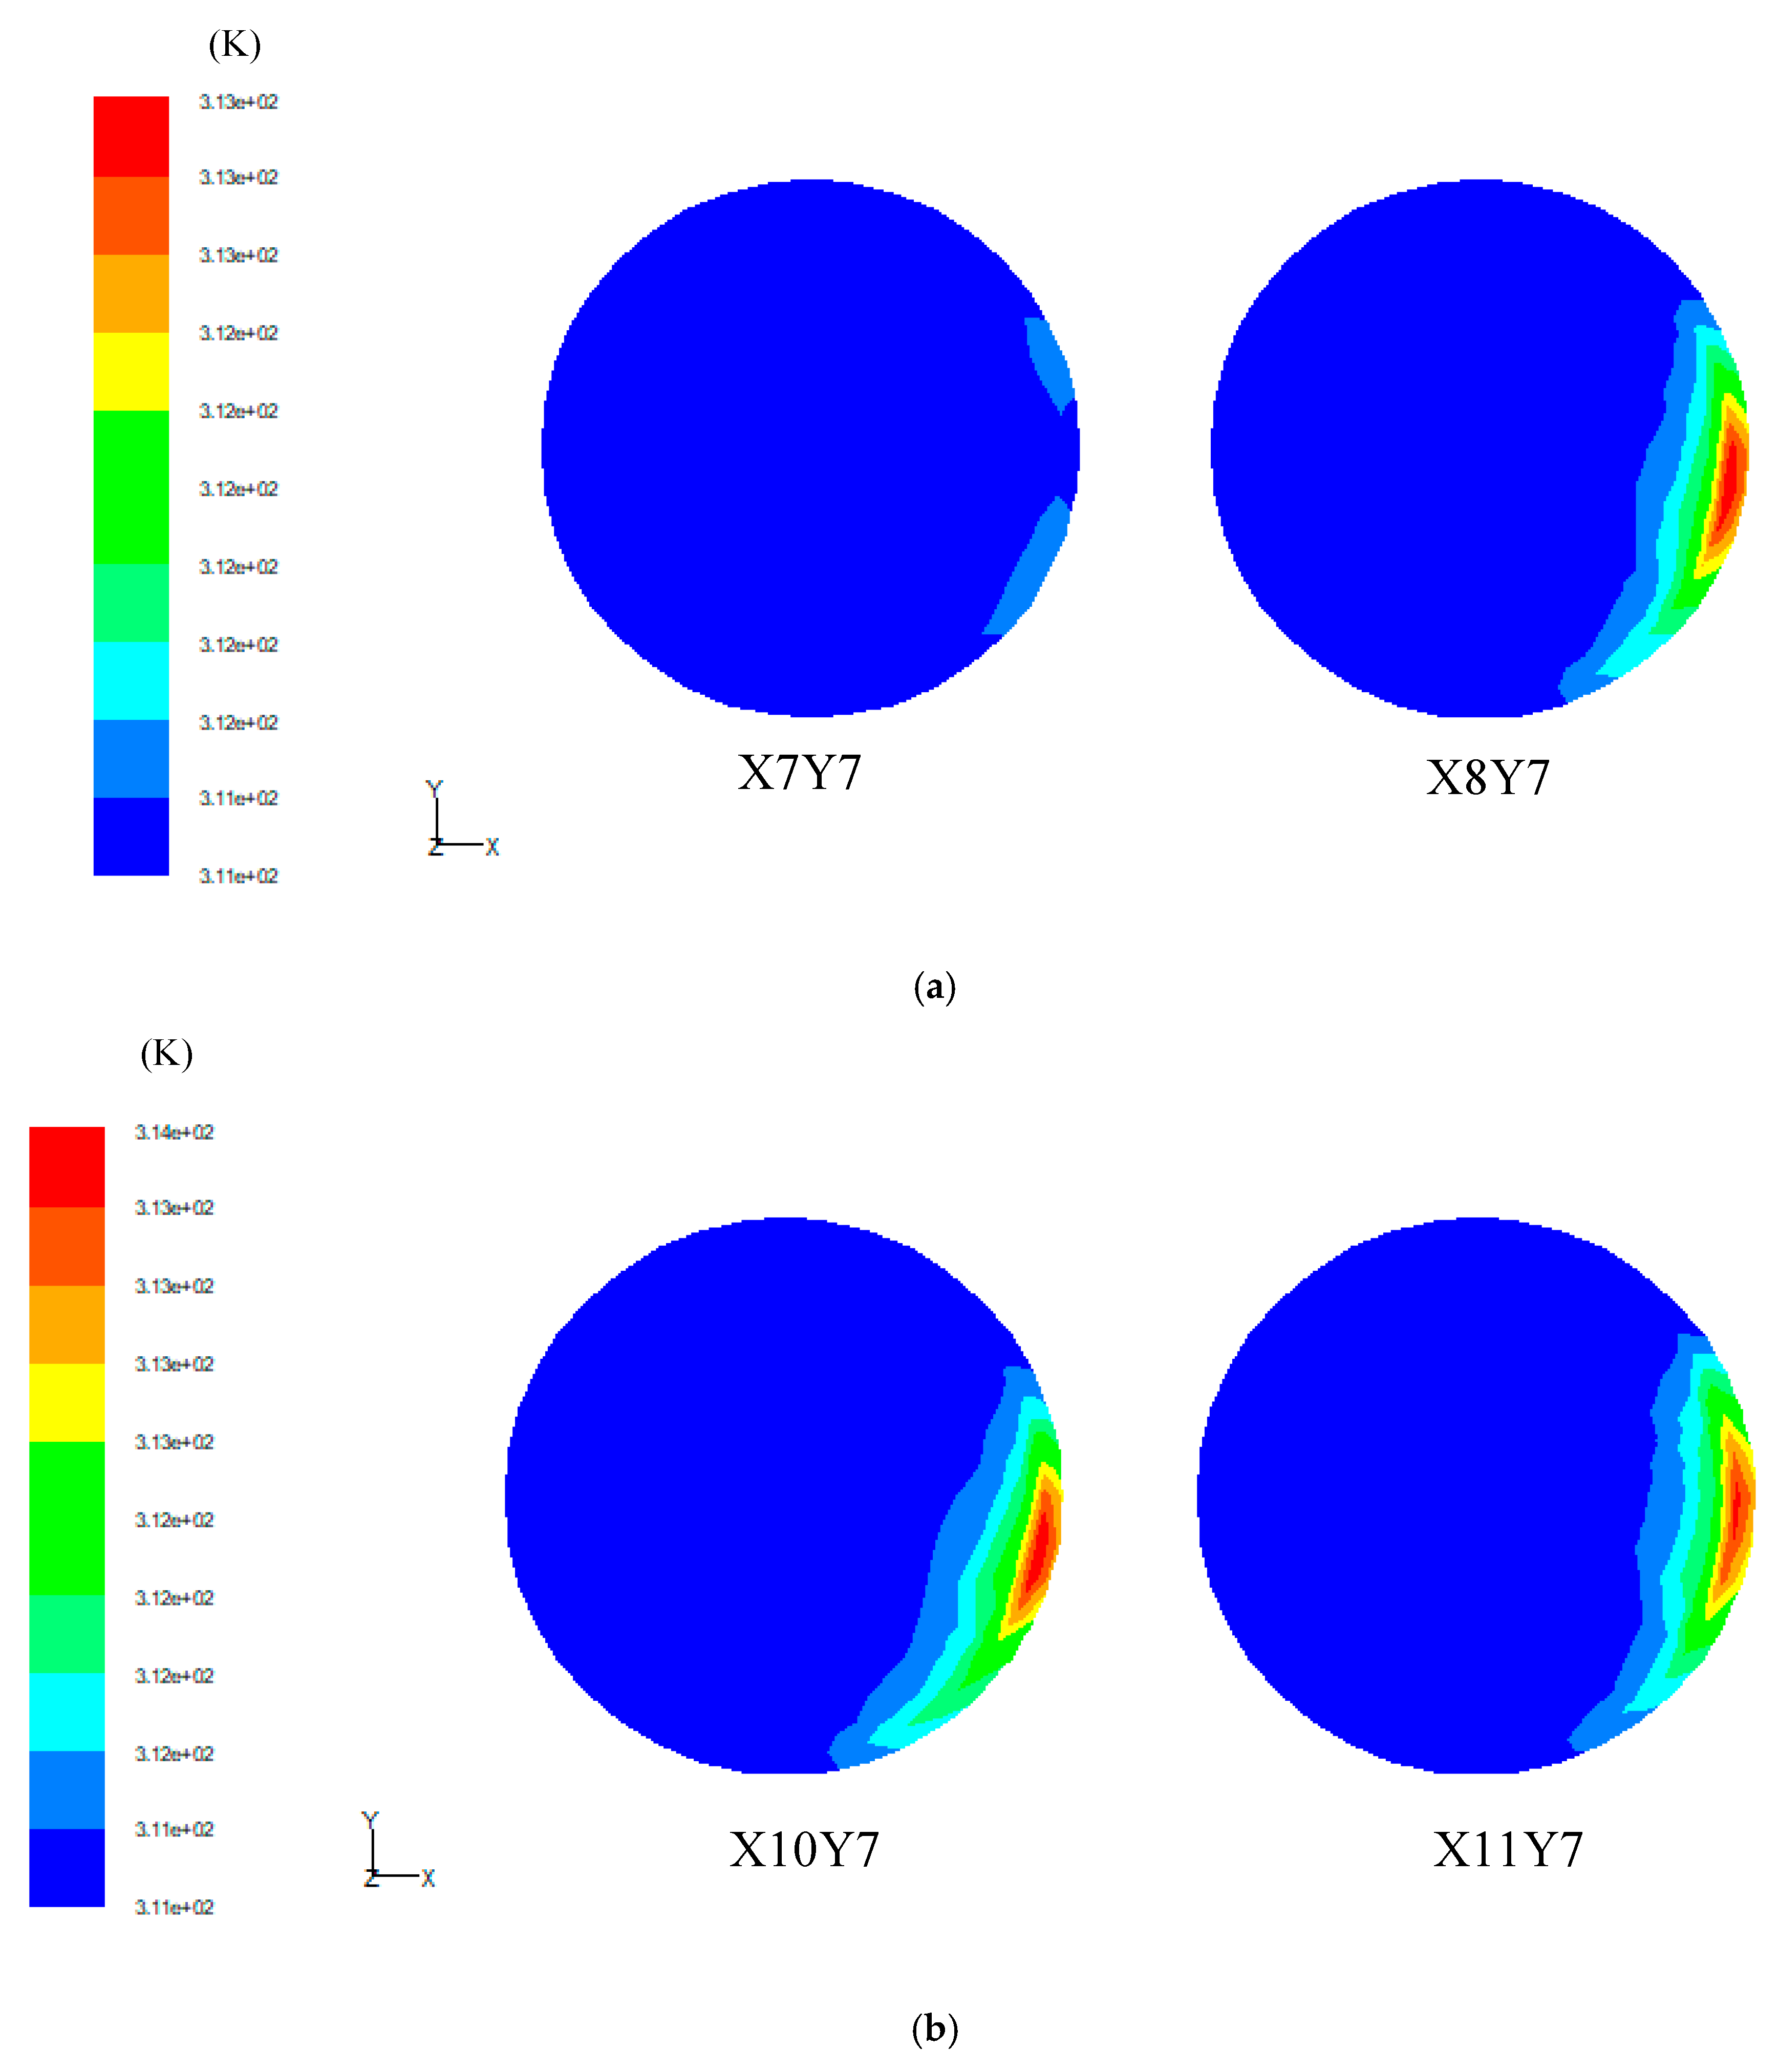
Two typical cooling units, X10Y7 and X11Y7, were selected to investigate the area where the ACC was affected by the MCTs. In the area where the ACC was not affected by the MCTs, we selected two typical cooling units, X7Y7 and X8Y7, for analysis. 
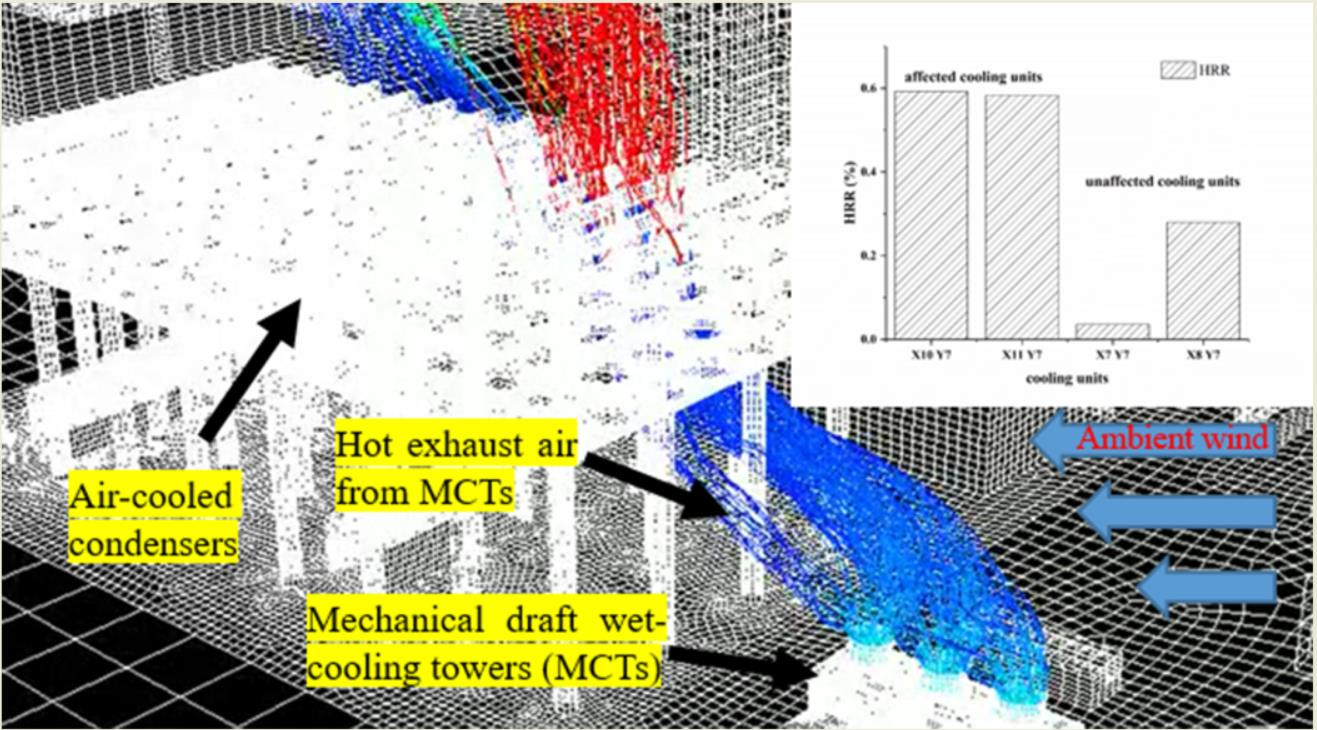
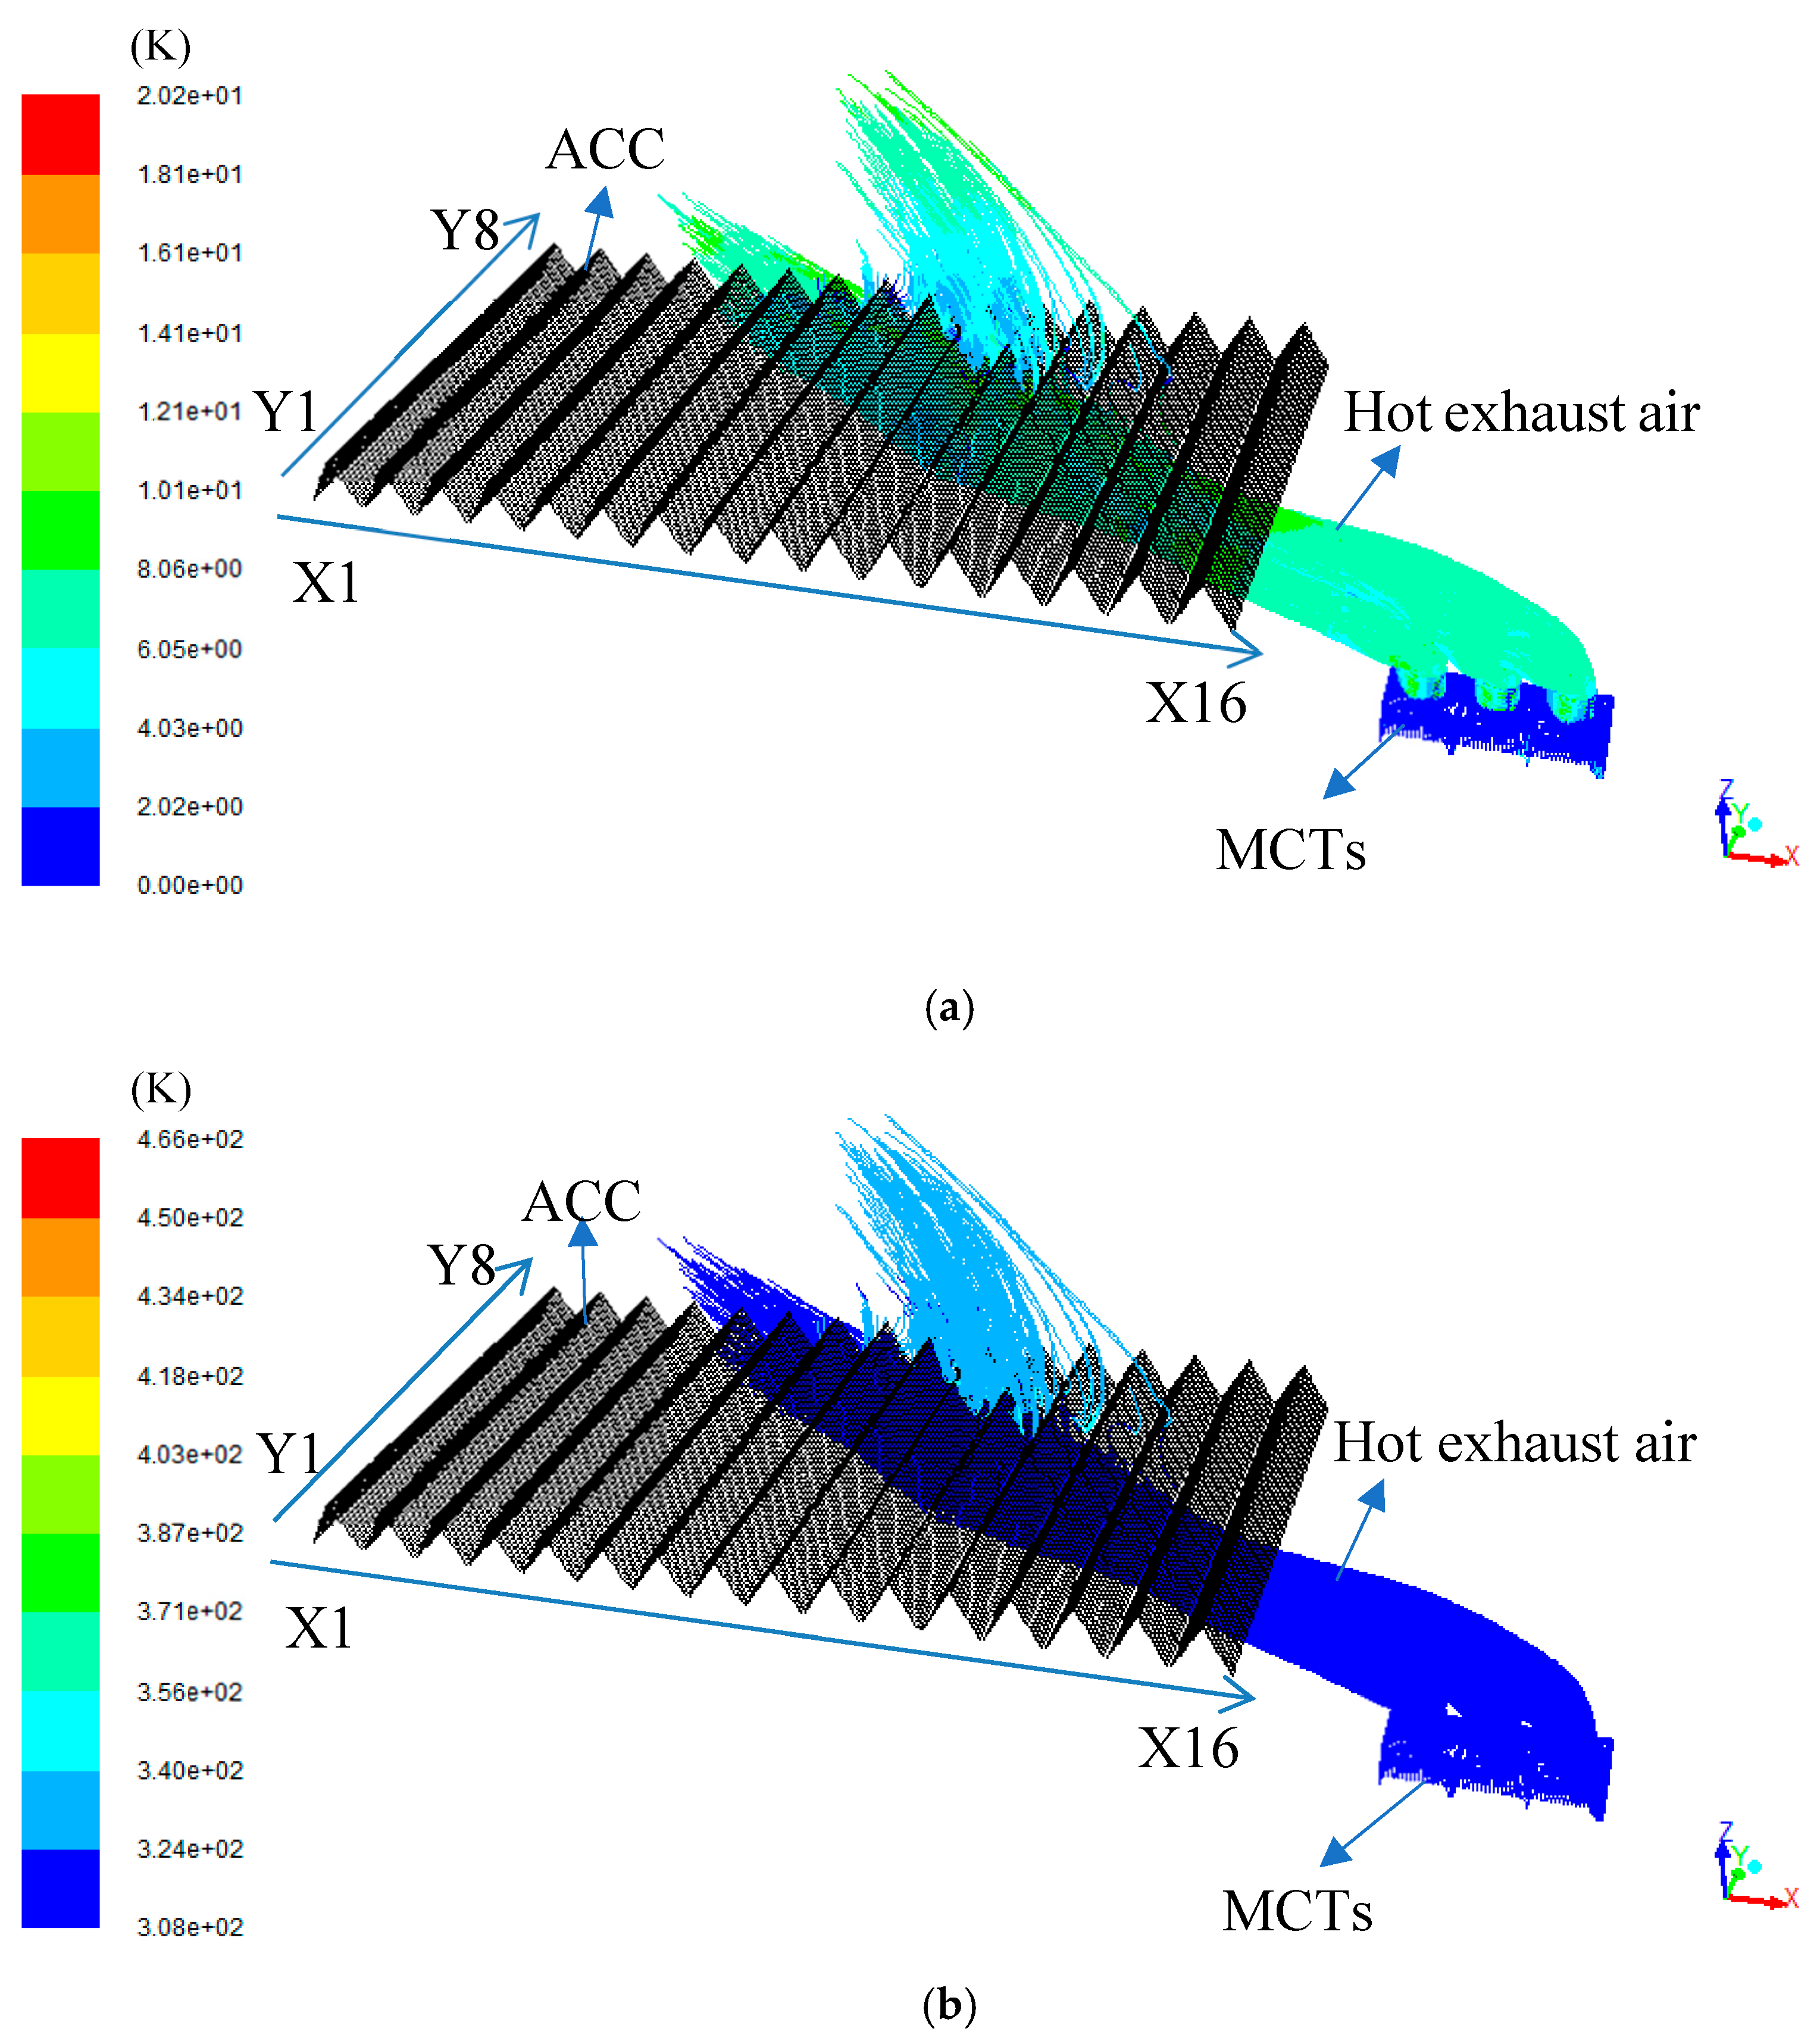
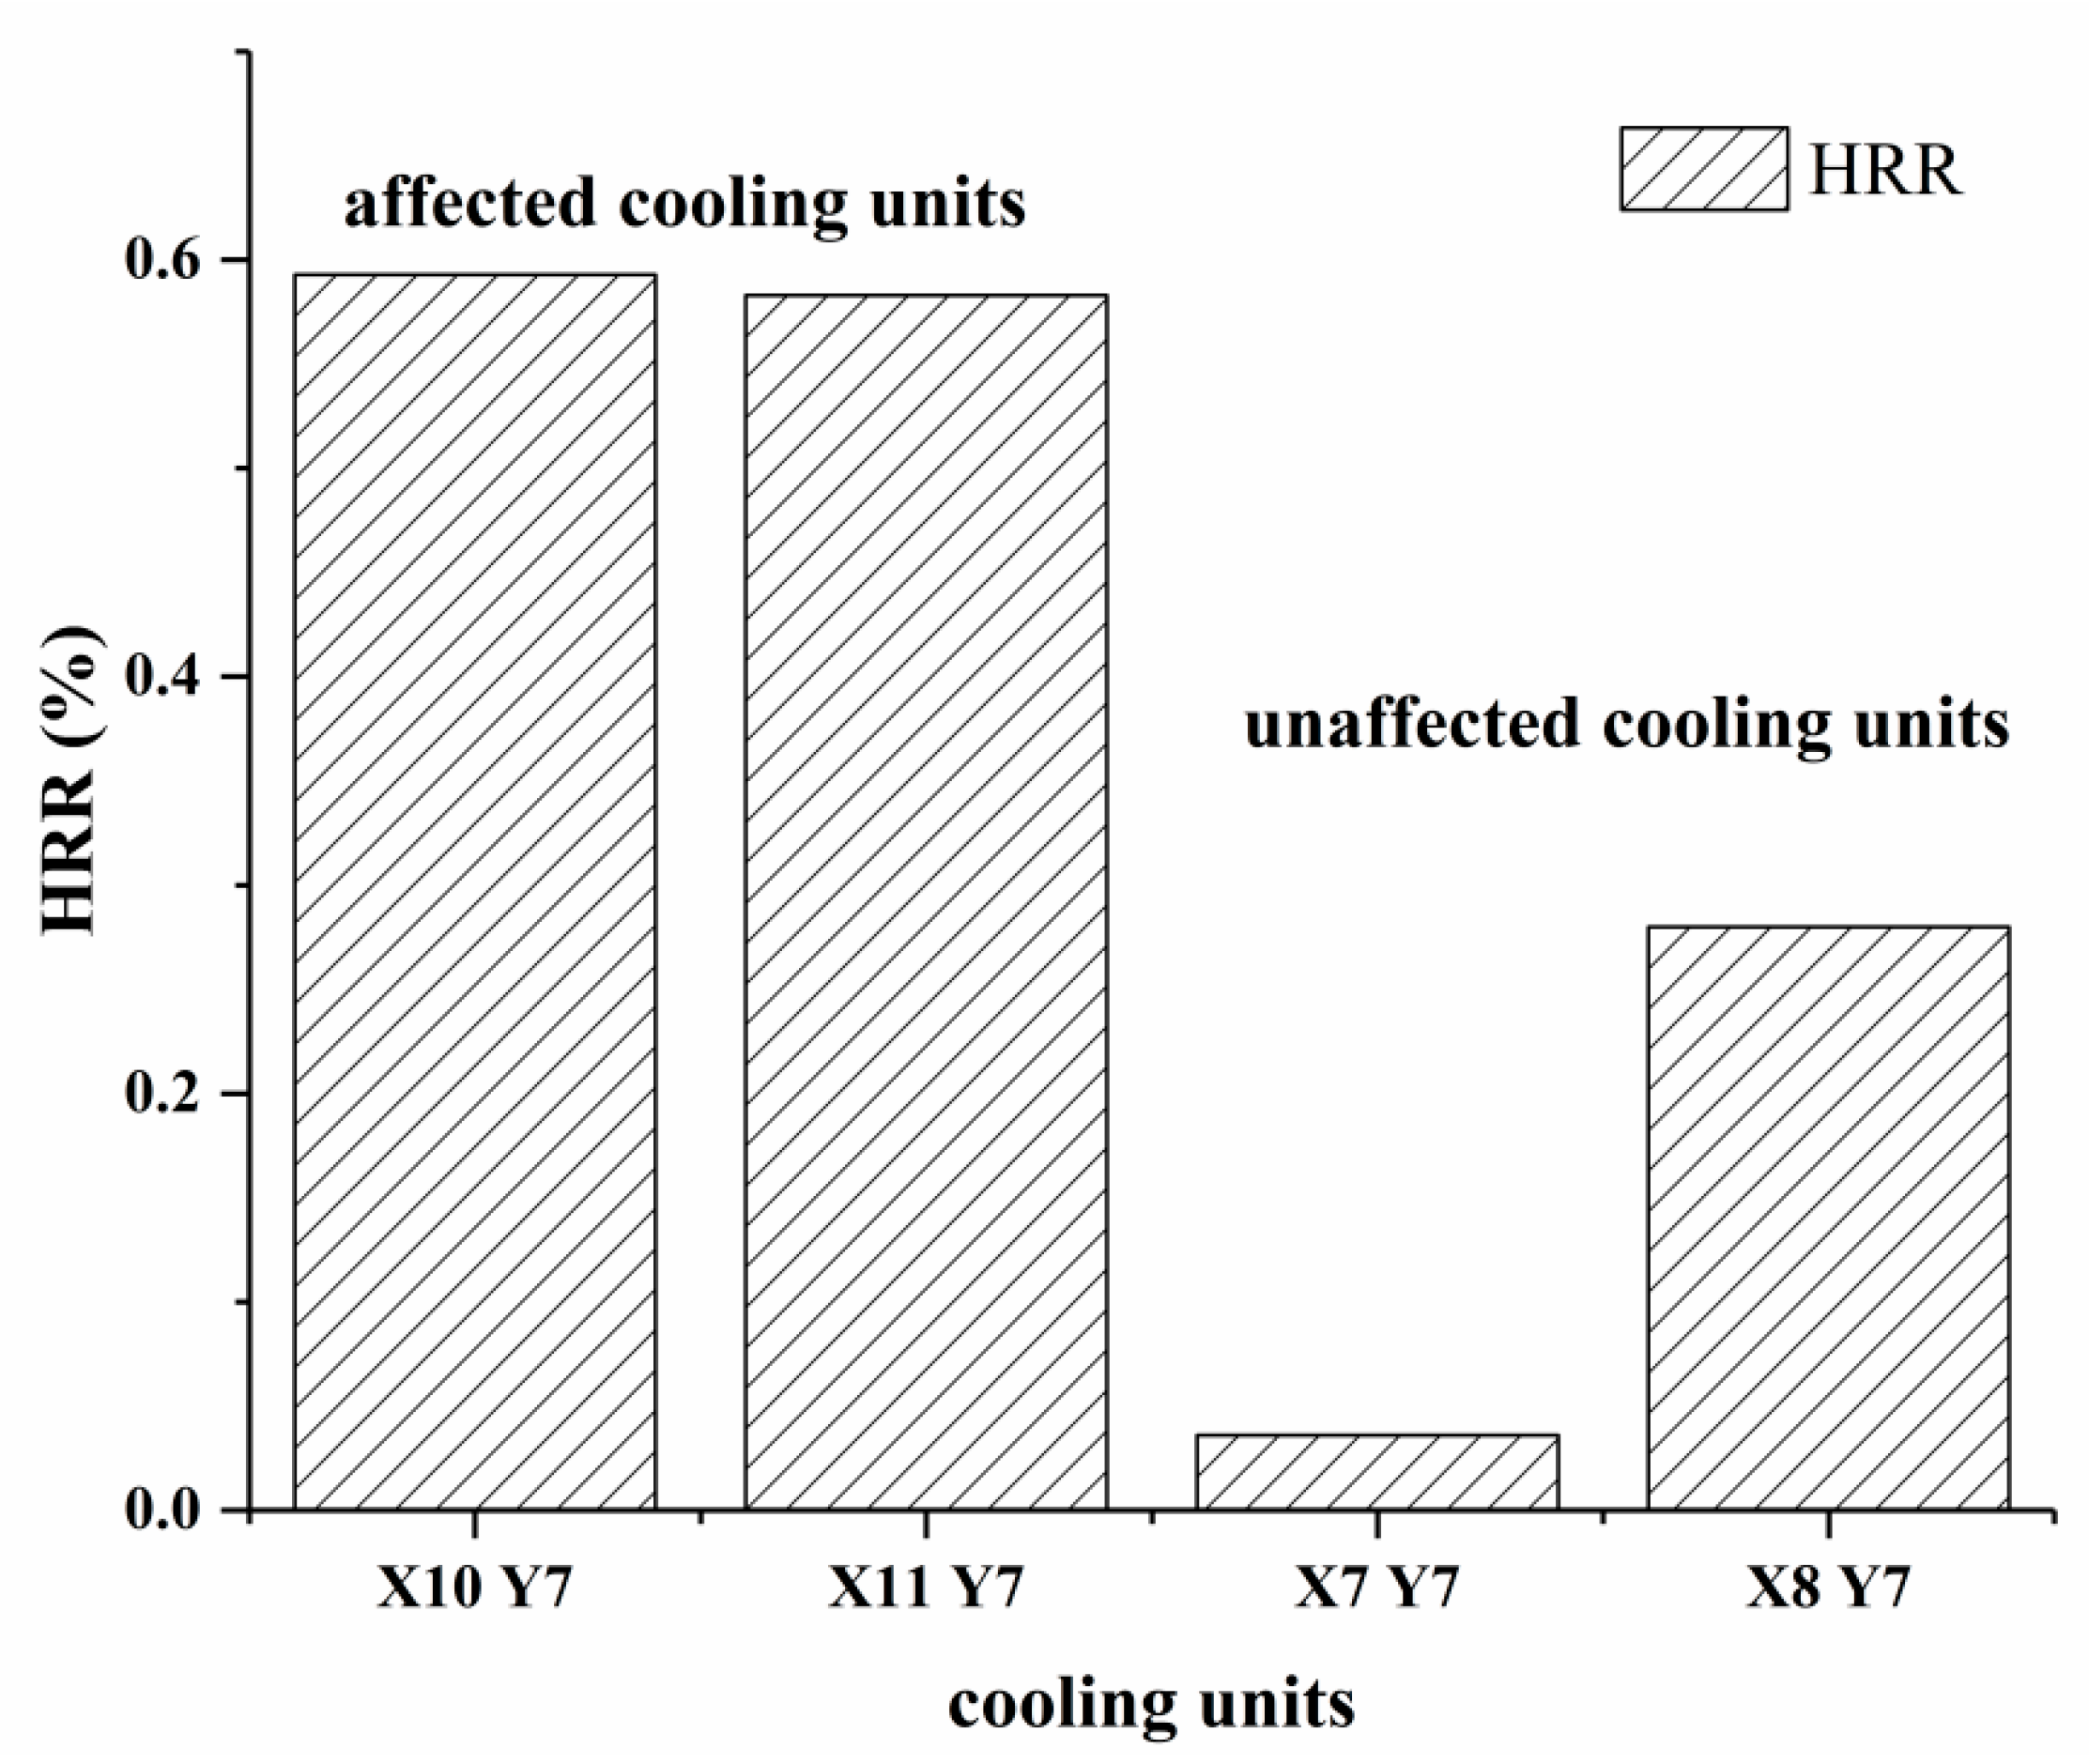
Figure 8a,b shows the velocity and temperature distribution of the influence of MCTs on the ACC, respectively. We can see that under the condition that the ambient temperature of 38 °C, the wind speed of 7 m/s and the wind direction of SSE, the exhaust of the MCTs partially entered the ACC under the effect of the ambient wind. In the affected cooling unit X10Y7, the HRR was calculated to be 0.593%, and in the cooling unit X11Y7, the HRR was 0.583%. In the nearby unaffected cooling unit X7Y7, the HRR was 0.036%, and the cooling unit X8Y7 had a HRR of 0.280%. Focusing on Figure 9, the HRR of the cooling units affected by MCTs increased, which meant that MCTs had a great effect on the cooling performance of the ACC. However, in the cooling units not affected by MCTs, the increase of HRR was not large, which indicated that the presence of MCTs had a local influence on the cooling performance of only two cooling units, and then slightly impacted the overall cooling performance of the ACC, which provides a good insight into the arrangement optimization of the ACC and MCTs.
In the above discussion, we separately discussed the effects of MCTs on the affected and non-affected areas of the ACC. For a better study, the influence of the overall cooling performance of the ACC, under the same environmental conditions, the HRR of the ACC both in the absence and presence of MCTs were calculated separately. Through such a comparative study, theoretical support was provided for the study of the effect of the MCTs on the cooling performance of the ACC.
Figure 10a,b shows the cooling triangle temperature distribution of the ACC in the presence and absence of MCTs respectively, under the condition that the ambient temperature is 38 °C, the wind speed is 7 m/s and the wind direction is SSE, the exhaust of the MCTs partially entered the ACC under the effect of ambient wind. The temperature at the outlet of the ACC was 65.534 °C, the back pressure of the ACC was 30.396 kPa and the HRR was 6.614%. If the MCTs were turned off at this time, the temperature at the outlet of the ACC would change to 65.488 °C, the back pressure would be 30.335 kPa and the HRR would drop to 6.477%. In order to analyze the influence of the presence and absence of MCTs on the heat transfer performance of the ACC, we obtained the total average heat transfer coefficient and the average heat transfer coefficient of each column in the presence and absence of MCTs. From Table 3, we can see the comparison of the heat transfer performance of the ACC in the absence and presence of MCTs. It was very clear to see that in the absence of MCTs, the total average heat transfer coefficient of the ACC and most of the average heat transfer coefficient per column are slightly higher, while the back pressure and the HRR of the ACC were lower than in the presence of MCTs; however, the magnitude of the reduction was relatively small, so the presence of MCTs had a minor impact on the overall cooling performance of the ACC. The main reason was that after the ambient air entered the MCTs, the two phases of gas and water were directly contacted, which was mainly based on latent heat transfer, and the dry bulb temperature was not greatly increased, while the ACC was dominated by sensible heat transfer, and the oncoming flow air dry bulb temperature played a leading role in its thermal performance. Secondly, the cooling air volume (1089.55 kg/s) of the MCTs was significantly smaller than that (59,017.36 kg/s) of the ACC; therefore, the presence of MCTs had a relatively small effect on the overall thermal characteristics of the ACC.

4. Conclusions

Using the mature and reliable CFD software FLUENT, the air-cooling system and surrounding buildings are accurately modeled, which can accurately calculate the air flow field around the ACC and MCTs, and the effect of the MCTs on the cooling performance of the ACC. Based on the above research, the conclusions are summarized as follows:
(1) By calculating the HRR and back pressure of the ACC under eight working conditions, the influence of HAR, ambient temperature, wind direction and wind speed on the cooling performance of the ACC was obtained. An increase of ambient temperature led to the performance degradation of the ACC, and the increase of wind speed also caused the same situation to occur, but the influence was less than the increase of ambient temperature and greater than the change of wind direction.
(2) Under the summer extreme conditions, the HRR of the ACC was 6.614%, and the back pressure of the ACC was 30.40 kPa. The influence of ambient wind on the ACC was significantly greater than that of MCTs.
(3) The influence of MCTs on the cooling performance of the ACC was analyzed emphatically. According to the results, the exhaust of MCTs partially entered the ACC under the effect of ambient wind, and the HRR of the affected cooling units was higher than that of the nearby unaffected cooling units. When the MCTs were turned off, the overall HRR of the ACC decreased. The presence of MCTs had a local influence on the cooling performance of only two cooling units, and then slightly impacted the overall cooling performance of the ACC, which provides a good insight into the arrangement optimization of the ACC and MCTs.

Author Contributions

Conceptualization, J.F.; Formal analysis, J.F.; Investigation, H.D.; Project administration, Y.Z.; Resources, X.X., D.T. and B.Y.

Funding

The financial supports for this research, from the National Natural Science Foundation of China (Grant No. 51606112) and the Key Technology Research and Development Program of Shandong Province (Grant No. 2017GGX40122), are both gratefully acknowledged.

Acknowledgments

I wish to thank Yajin Liu for advice on my English writing.

Conflicts of Interest

In my opinion, there is no conflict of interest in the submission of this manuscript, and all authors agree to publish the manuscript.

Nomenclature

aAltitude (m)
fnPressure-jump polynomial coefficients
hHeat transfer coefficient (W∙m−2∙K−1)
kTurbulent kinetic energy per unit mass (m2∙s−2)
KLFlow loss coefficient
ΔPPressure jump (pa)
PAtmospheric pressure (mmHg)
qHeat flux (W/m2)
rnPolynomial coefficients
TiAverage temperature at the inlet of the fan (K)
TaAmbient temperature (K)
Ta1Average temperature of the inlet air of the ACC (K)
Ta2Average temperature of the outlet air of the ACC (K)
ToOutlet temperature of the ACC (K)
TsExhaust steam temperature (K)
THXRadiator temperature (K)
TexitTemperature of the outlet fluid (K)
vVelocity (m/s)
XColumn
YRow

Greek Letters

ρAir density (kg/m3)
ƐTurbulence dissipation rate (m2∙s−3)
αWall roughness coefficient

Subscripts

iInlet
aAmbient
oOutlet
NNumber
sSteam
LLoss

References

  1. Duvenhage, K.; Kröger, D.G. The influence of wind on the performance of forced draught air-cooled heat exchangers. J. Wind Eng. Ind. Aerod. 1996, 62, 259–277. [Google Scholar] [CrossRef]
  2. Wilber, K.R.; Zammit, K. Development of Procurement Guidelines for Air-Cooled Condensers. In Proceedings of the Advanced Cooling Strategies/Technologies Conference, Sacramento, CA, USA, 1–2 June 2005; pp. 1–24. [Google Scholar]
  3. Ge, Y.; Cropper, R. Air-cooled condensers in retail systems using R22 and R404A refrigerants. Appl. Energy 2004, 78, 95–110. [Google Scholar] [CrossRef]
  4. Yu, F.W.; Chan, K.T. Modeling of a condenser-fan control for an air-cooled centrifugal chiller. Appl. Energy 2007, 84, 1117–1135. [Google Scholar] [CrossRef]
  5. Maulbetsch, J.S.; DiFilippo, M.N. Effects of Wind on Air-cooled Condenser Performance; Paper No. TP07-04; Cooling Technology Institute: Houston, TX, USA, 2007. [Google Scholar]
  6. Gu, Z.; Chen, X.; Lubitz, W.; Li, Y.; Luo, W. Wind tunnel simulation of exhaust recirculation in an air-cooling system at a large power plant. Int. J. Therm. Sci. 2007, 46, 308–317. [Google Scholar] [CrossRef]
  7. Liu, P.; Duan, H.; Zhao, W. Numerical investigation of hot air recirculation of air-cooled condensers at a large power plant. Appl. Therm. Eng. 2009, 29, 1927–1934. [Google Scholar] [CrossRef]
  8. Wang, Q.W.; Zhang, D.J.; Zeng, M.; Lin, M.; Tang, L.H. CFD simulation on a thermal power plant with air-cooled heat exchanger system in north China. Eng. Comput. 2008, 25, 342–365. [Google Scholar] [CrossRef]
  9. Meyer, C.; Kröger, D. Plenum chamber flow losses in forced draught air-cooled heat exchangers. Appl. Therm. Eng. 1998, 18, 875–893. [Google Scholar] [CrossRef]
  10. Meyer, C.J.; Kroger, D.G. Numerical investigation of the effect of fan performance on forced draught air-cooled heat exchanger plenum chamber aerodynamic behavior. Appl. Therm. Eng. 2004, 24, 359–371. [Google Scholar] [CrossRef]
  11. Owen, M.T.F.; Kröger, D.G. An Investigation of Air-Cooled Steam Condenser Performance Under Windy Conditions Using Computational Fluid Dynamics. J. Eng. Gas Turbines Power 2011, 133, 604502. [Google Scholar] [CrossRef]
  12. O’Donovan, A.; Grimes, R. A theoretical and experimental investigation into the thermodynamic performance of a 50 MW power plant with a novel modular air-cooled condenser. Appl. Therm. Eng. 2014, 71, 119–129. [Google Scholar] [CrossRef]
  13. Zhang, X.; Chen, H. Effects of windbreak mesh on thermo-flow characteristics of air-cooled steam condenser under windy conditions. Appl. Therm. Eng. 2015, 85, 21–32. [Google Scholar] [CrossRef]
  14. Meyer, C. Numerical investigation of the effect of inlet flow distortions on forced draught air-cooled heat exchanger performance. Appl. Therm. Eng. 2005, 25, 1634–1649. [Google Scholar] [CrossRef]
  15. Gao, X.; Zhang, C.; Wei, J.; Yu, B. Performance prediction of an improved air-cooled steam condenser with deflector under strong wind. Appl. Therm. Eng. 2010, 30, 2663–2669. [Google Scholar] [CrossRef]
  16. Huang, X.; Chen, L.; Kong, Y.; Yang, L.; Du, X. Effects of geometric structures of air deflectors on thermo-flow performances of air-cooled condenser. Int. J. Heat Mass Transf. 2018, 118, 1022–1039. [Google Scholar] [CrossRef]
  17. Jin, R.; Yang, X.; Yang, L.; Du, X.; Yang, Y. Square array of air-cooled condensers to improve thermo-flow performances under windy conditions. Int. J. Heat Mass Transf. 2018, 127, 717–729. [Google Scholar] [CrossRef]
  18. Yang, L.J.; Du, X.Z.; Yang, Y.P. Influences of wind-break wall configurations upon flow and heat transfer characteristics of air-cooled condensers in a power plant. Int. J. Therm. Sci. 2011, 50, 2050–2061. [Google Scholar] [CrossRef]
  19. Berman, L.D. Evaporative Cooling of Circulating Water; Pergamon press: Oxford, UK, 1961; p. 710. [Google Scholar]
  20. Kroger, D.G. Air-Cooled Heat Exchangers and Cooling € Towers; Begell House: New York, NY, USA, 1998. [Google Scholar]
  21. Thulukkanam, K. Heat Exchanger Design Handbook; Hemisphere Publishing Corporation: New York, NY, USA, 1983. [Google Scholar]
  22. Davis, L.R. Fundamentals of Environmental Discharge Modeling; CRC Press: Boca Raton, FL, USA, 1998. [Google Scholar]
  23. Buss, J.R. Control of Fog from Cooling Towers; Cooling Tower Institute Annual Meeting: New York, NY, USA, 1967. [Google Scholar]
  24. Campbell, J.C. The Prevention of Fog from Cooling Towers; Annual Meeting of the Cooling Tower Institute: Houston, TX, USA, 1976. [Google Scholar]
  25. Michioka, T.; Sato, A.; Kanzaki, T.; Sada, K. Wind tunnel experiment for predicting a visible plume region from a wet cooling tower. J. Wind. Eng. Ind. Aerodyn. 2007, 95, 741–754. [Google Scholar] [CrossRef]
  26. Xu, X.; Wang, S.; Ma, Z. Evaluation of plume potential and plume abatement of evaporative cooling towers in a subtropical region. Appl. Therm. Eng. 2008, 28, 1471–1484. [Google Scholar] [CrossRef]
  27. ANSYS Inc. Fluent User’s Guide; ANSYS Inc.: Canonsburg, PA, USA, 2015. [Google Scholar]
  28. Architectural Institute of Japan (AIJ). AIJ Recommendations for Loads on Buildings; Architectural Institute of Japan: Tokyo, Japan, 1996. (In Japanese) [Google Scholar]
Figure 1. Physical model.
Energies 12 04560 g001
Figure 2. The structure of the air-cooled condenser (ACC).
Energies 12 04560 g002
Figure 3. Computation domain and its air flow boundaries for the ACC and MCTs.
Energies 12 04560 g003
Figure 4. Hot recirculation rate (HRR) and back pressure under various working conditions.
Energies 12 04560 g004
Figure 5. Transverse section temperature distribution of the ACC.
Energies 12 04560 g005
Figure 6. Transverse section velocity distribution of the ACC and MCTs.
Energies 12 04560 g006
Figure 7. Cooling triangle temperature distribution of the ACC.
Energies 12 04560 g007
Figure 8. The influence of MCTs on the ACC. (a) Velocity distribution of the influence of MCTs on the ACC and (b) Temperature distribution of the influence of MCTs on the ACC.
Energies 12 04560 g008
Figure 9. Relationship between the hot recirculation rate (HRR) and cooling units.
Energies 12 04560 g009
Figure 10. Fan temperature profile of the ACC in the presence and absence of MCTs. (a) Fan temperature profile of the ACC in the absence of MCTs. (b) Fan temperature profile of the ACC in the presence of MCTs.
Energies 12 04560 g010
Table 1. The main dimensions of the studied wet cooling towers (mechanical draft wet-cooling towers (MCTs)).
ItemsValueUnit
Water drenching area196m2
Cooling fill height1.5m
Tower height14m
Tower length and width14m
Air inlet height2.7m
Fan diameter8.53m
Fill bottom height2.7m
Tower throat inner diameter8.60m
Table 2. Combined working condition calculation data table.
Design Work Conditions12345678
Ambient temperature (°C)3434343438383838
Wind directionSSESSEWNWWNWSSESSEWNWWNW
Wind speed (m/s)57575757
Fan inlet average temperature (°C)34.10735.98335.09335.64238.73339.82139.51040.241
Exhaust steam temperature (°C)63.62965.80963.53864.92567.41369.39768.44269.855
Back pressure (kPa)23.5525.9623.4524.9627.8730.4029.1631.01
Hot recirculation rate (HRR) (%)0.3757.2484.0795.8562.7776.6145.5297.862
Table 3. Comparison of heat transfer performance of the ACC in the absence and presence of MCTs.
ParametersMCTs EffectNo MCTs Effect
HRR (%)6.6146.477
Back pressure (kPa)30.39630.335
h Total average heat transfer coefficient (W∙m−2∙K−1)3551.5453552.097
h1 Average heat transfer coefficient of X1 (W∙m−2∙K−1)3570.4993570.685
h2 Average heat transfer coefficient of X2 (W∙m−2∙K−1)3567.9843567.887
h3 Average heat transfer coefficient of X3 (W∙m−2∙K−1)3567.0403567.048
h4 Average heat transfer coefficient of X4 (W∙m−2∙K−1)3567.7903567.998
h5 Average heat transfer coefficient of X5 (W∙m−2∙K−1)3566.2223566.620
h6 Average heat transfer coefficient of X6 (W∙m−2∙K−1) 3565.5093565.957
h7 Average heat transfer coefficient of X7 (W∙m−2∙K−1)3562.8483563.341
h8 Average heat transfer coefficient of X8 (W∙m−2∙K−1)3562.6263563.008
h9 Average heat transfer coefficient of X9 (W∙m−2∙K−1)3558.1283558.397
h10 Average heat transfer coefficient of X10 (W∙m−2∙K−1)3558.4333558.926
h11 Average heat transfer coefficient of X11 (W∙m−2∙K−1)3554.8013555.224
h12 Average heat transfer coefficient of X12 (W∙m−2∙K−1)3554.4073554.876
h13 Average heat transfer coefficient of X13 (W∙m−2∙K−1)3546.9353547.624
h14 Average heat transfer coefficient of X14 (W∙m−2∙K−1)3542.0623542.211
h15 Average heat transfer coefficient of X15 (W∙m−2∙K−1)3529.5953529.525
h16 Average heat transfer coefficient of X16 (W∙m−2∙K−1)3345.0263344.195

