Performance Assessment of Four Different Photovoltaic Technologies in Poland


Department of Renewable Energy Engineering, Faculty of Environmental Engineering, Lublin University of Technology, Nadbystrzycka 40B, 20-618 Lublin, Poland
*
Author to whom correspondence should be addressed.
Energies 2020, 13(1), 196; https://0-doi-org.brum.beds.ac.uk/10.3390/en13010196
Submission received: 28 November 2019
/
Revised: 23 December 2019
/
Accepted: 25 December 2019
/
Published: 1 January 2020
(This article belongs to the Section A2: Solar Energy and Photovoltaic Systems)
Abstract
:Due to the observed increase of photovoltaic installations capacity in Poland, the research on the performance of different modules became an important issue from the practical and scientific point of view. This paper is intended to help system planners to choose photovoltaic modules and inverters taking into account the actual operating conditions. The study is devoted to the assessment of four different technologies of photovoltaic modules: polycrystalline silicon (pc-Si), amorphous silicon (a-Si), copper indium gallium selenide (CIGS), and cadmium telluride (CdTe). The data was collected at a solar plant located at high latitude location, in the eastern part of Poland, during the fourth year of the plant operation. The influence of irradiance on the temperature and efficiency of modules was studied. The results show that the efficiency of the pc-Si and CIGS modules decreases with rising temperature; however, the efficiency of the a-Si and CdTe modules is more stable. The impact of changing external conditions on the inverter efficiency as well as array and system losses during various seasons of the year was shown. The inverter efficiency reaches up to 98% in summer and drops as low as 30% in winter. Small average array capture losses of 7.41 (kWh/kWp)/month (0.25 h/day) are observed for the CIGS and 10.4 (kWh/kWp)/month (0.35 h/day) for pc-Si modules. The a-Si and CdTe array losses are higher, up to 2.83 h/day for CdTe in summer. The results indicate high annual energy yields of the pc-Si and CIGS modules, 1130 kWh/kWp and 1140 kWh/kWp, respectively. This research provided new data on pc-Si and especially the performance of the thin film modules and losses in a photovoltaic installation under temperate climate.
1. Introduction
The energy supply in Poland is based on fossil fuels, mainly coal. According to the current predictions, Poland will not manage to meet European Union requirement [1] to achieve 15% of RES (renewable energy sources) share in the gross final energy consumption and exceed 19% of electricity production from RES by 2020. However, nowadays the dynamic growth of photovoltaic market is observed. Global horizontal solar irradiation in Poland is in the range of 950–1250 (kWh/m2)/year, which is similar to that in Germany, the European leader in photovoltaics [2]. The development of photovoltaics is observed due to the decrease in the prices of PV modules and new legal regulations introduced in 2016 that offer two ways of supporting photovoltaics: net metering (for systems up to 40 kWp) and an auction mechanism for large-scale projects (over 40 kWp). In 2019, a substantial increment of new PV installations took place. The current reports estimate that as much as 1 GW of new installations is going to be installed in 2019, while at the end of 2018, the PV cumulative capacity was equal to 200 MW only. According to the current trends, Poland may be in the fourth place in EU in terms of establishing new PV systems annually [3].
Due to the increase in the PV capacity observed in many places around the world, the research on the performance of PV installations under the actual external conditions became an important issue. The studies of this kind help determine the annual yield and environmental or economic benefits of PV investments. Therefore, this topic is widely addressed in literature; however, mainly for the sites located at low latitude. Different kinds of PV technologies were evaluated in terms of spectral changes and effect of irradiance, represented by average photon energy (APE) and angle of incidence (AOI) e.g. in India [4,5]. Bora [4] reported the performance ratio of 96% for amorphous silicon (a-Si) and monocrystalline Si (c-Si) in a cold and sunny zone in India and lower values of 90%–91% in a hot and humid area. The results obtained by Magare [5] indicate that the a-Si modules are more sensitive to seasonal spectral variations than module temperature but the performance of the c-Si modules is influenced more by temperature than spectral changes.
The photovoltaic performance under real outdoor conditions was also assessed in Turkey, Greece, India, Italy, Spain, and Peru [6,7,8,9,10,11,12]; additionally, modeling work combined with experimental characterization was carried out [13]. Ozden estimated 44-month average efficiencies of systems consisting of the c-Si, a-Si, and CdTe (cadmium telluride) modules as 11.86%, 6.4%, and 5.3% respectively [6]. Performance ratio (PR) in the range of 70%–90% was found for c-Si, about 70% for a-Si and much lower 42%–72% for CdTe, contrary to the results obtained in another location in Turkey, where the performance of thin film technologies was close to that of c-Si [9]. In Greece [7], the differences between summer and winter periods were observed in the efficiency of multicrystalline modules that ranged from 6.2% to 10.4%, respectively, with a mean annual value of 8.7%. Sharma, in India [8] found the energy yields of the a-Si modules to be 14% higher in summer and 6% lower during winter, in comparison to the pc-Si modules. The performance ratio of the a-Si modules was 90% and 83% for pc-Si. In Italy [10], the PR value for the c-Si modules amounts to 93%. For a-Si, which is strongly affected by the seasonal solar spectrum, the performance ratio ranged from 80% in January to 97% in August. Belluardo [11] proposed a new calculation method to evaluate the performance loss rate. In Peru [12], the c-Si modules achieved 84% annual performance ratio and annual energy yield of 1770–1992 kWh/kWp under high irradiation as well as PR of 82% and annual yield of 1540 kWh/kWp at the similar irradiation combined with higher temperature. The modules of c-Si technology also exhibited seasonal variation, since PR was 20% higher in winter than in summer which showed the role of temperature. In the same study, a-Si under lower irradiation of 1700 kWh/m2 achieved the performance ratio of 97% and the annual yield of 1338 kWh/kWp.
At higher latitude, the assessment of different modules types indicates gains in winter for the copper indium gallium selenide (CIGS) and crystalline silicon modules [14,15]. In summer, the amorphous silicon (a-Si) and cadmium telluride (CdTe) modules exhibit an advantage attributed mainly to spectrum changes [14,15]. In UK, Gottchalg reported a significant influence of spectrum on a-Si modules. Relative changes in the generated short-circuit current were of −20% to 10% for the a-Si devices and only ±3% for CIGS and crystalline silicon modules [14]. It was also shown that environmental effects can cause up to 15% of losses to the annual PV yield.
In Germany [15], the research on the impact of varying spectral irradiance revealed the gains of 0.6% for CIGS, 2.4% for CdTe, 3.4% for a-Si, and 1.1% for c-Si during the entire year. In summer, spectral gains amounted to 3.4% for a-Si and 2.4% for CdTe.
The study carried in Neatherlands [16] showed that low irradiance caused a decrease in annual energy yield of 1.2% for the CIGS modules and 1% for CdTe. This experimental study also indicated a strong effect of spectral variation on the performance of the a-Si modules.
In Ireland, where monocrystalline modules were studied in rooftop installations, the following parameters were reported: The annual average module efficiency of 7.6% [17] and 14.9% [18]; system efficiency of 6.4% [17] and 12.6% [18] as well as performance ratio of 61% [17] and 81.5% [18]. The very good results obtained in one of the locations in Ireland [18] were connected to the beneficial external conditions: high wind speed and low ambient temperature at the analyzed location.
Unfortunately, the studies on the PV performance at high latitude are rare. Literature devoted to the studies in Poland is limited to a single report on a-Si rooftop installation [19] in which the annual energy yield of 830 kWh/kWp, a-Si modules efficiency of 5% and the performance ratio of 60–80% was reported.
Various kinds of solar modules mentioned above differ in structure, color, and appearance, but most importantly, they operate in different ways under solar illumination. The type of absorber material determines the main properties of the solar cell. The bandgap, absorption coefficient and in consequence the spectral response of the cells made with different semiconductors are not the same [15]. Wider band gap materials (1.7–1.9 eV for a-Si [20,21], 1.45–1.5 eV for CdTe [22], 1.04–1.68 for CIGS [23]) are more resistant to the temperature growth; thus, their temperature coefficient is lower than for narrow bandgap polycrystalline silicon (pc-Si) (1.1 eV). The influence of the temperature on the performance of PV modules is visible well in the investigations conducted before, under the temperate climate of Poland [24], where significant differences between summer and winter conditions are observed. The role of temperature and other climate elements is an important issue but the quality of devices comprising the whole PV system also significantly influence the final performance of the installation.
This work presents the energy rating of four different kinds of PV modules: pc-Si, CIGS, a-Si, and CdTe at high latitude, in Poland, in the fourth year of the system operation. The investigations address the performance of inverters, which is the main factor influencing the system losses on different types of PV arrays.
The analysis is carried out also in terms of the annual energy yield and performance ratio, another important property of PV installation, defined as the operating efficiency divided by the efficiency under Standard Test Conditions (irradiance of 1000 W/m2, cell temperature of 25 °C, air mass 1.5). This paper attempts to fill the gap in knowledge on the performance of various types of photovoltaic modules at high latitude.
2. Methods—Experimental Setup and Data Acquisition
The solar power plant on which the investigations were carried out is located in East Poland (latitude 51° 51′ N, longitude 23° 10′ E). Its total installed capacity equals 1.4 MWp; the installation is grid connected and covers an area of 3.5 ha. Because of the geographical location of the facility, the installed modules are inclined 34° from the horizontal plane facing south; the rows of panels are 6.3 m apart. All types modules are placed vertically (two rows in a set) except for the CdTe modules, which are mounted horizontally (four rows in a set). The modules are installed 0.5 m above the ground in order to ensure good heat dissipation. The pc-Si modules are installed in the main part of the photovoltaic plant. The smaller experimental part, which is separated, consists of four installations with three types of thin film modules (CIGS, CdTe, a-Si) and also traditional pc-Si modules. Within the area of the PV plant, the grass and weeds were mowed twice a year to avoid partial shadowing and lowering of the module output, but the modules were left uncleaned. All the installed modules were new and the whole plant started to operate at the end of 2014.
Solar irradiance was measured by using a monocrystalline silicon cell (5 × 3.3 cm), which was tilted at the same angle as the modules. The irradiance range of the sensor is 0–1400 W/m2, resolution 1 W/m2, temperature range from −20°C to 70 °C, accuracy ±5%. The temperature of the module was measured by Pt1000 resistance temperature detector. The range of the sensor is from −40 °C to 70 °C.
The specification of PV modules and the capacity of each installation are given in Table 1. The polycrystalline modules are connected to the grid using an inverter with nominal apparent AC power 20 kW, characterized by the maximum efficiency of 98%, Euroeta efficiency of 97.8%, operating temperature range −20° to 60°C and maximum input voltage of 1000 V. The inverter is equipped with two maximum power point trackers (MPPT), 51 modules are connected to the one tracker (3 strings) and 34 modules to the second tracker (2 strings). Each type of thin film modules installation is connected to inverter of AC power 3.3 kW with maximum efficiency of 96.2%, Euroeta efficiency of 94.8%, operating temperature range −25 °C to 70 °C, maximum input voltage of 600 V and one MPPT. The ratio of PV peak power to the inverter nominal power is as follows: 1.06 for pc-Si; 1.0 for a-Si; 1.04 for CIGS, and 1.13 for CdTe.
The DC and AC electric power registered by inverters as well as solar irradiance and module temperature measurements were recorded every 5 min. by the central data logging computer to achieve synchronous data collection.
3. Results
3.1. Solar Irradiation Data
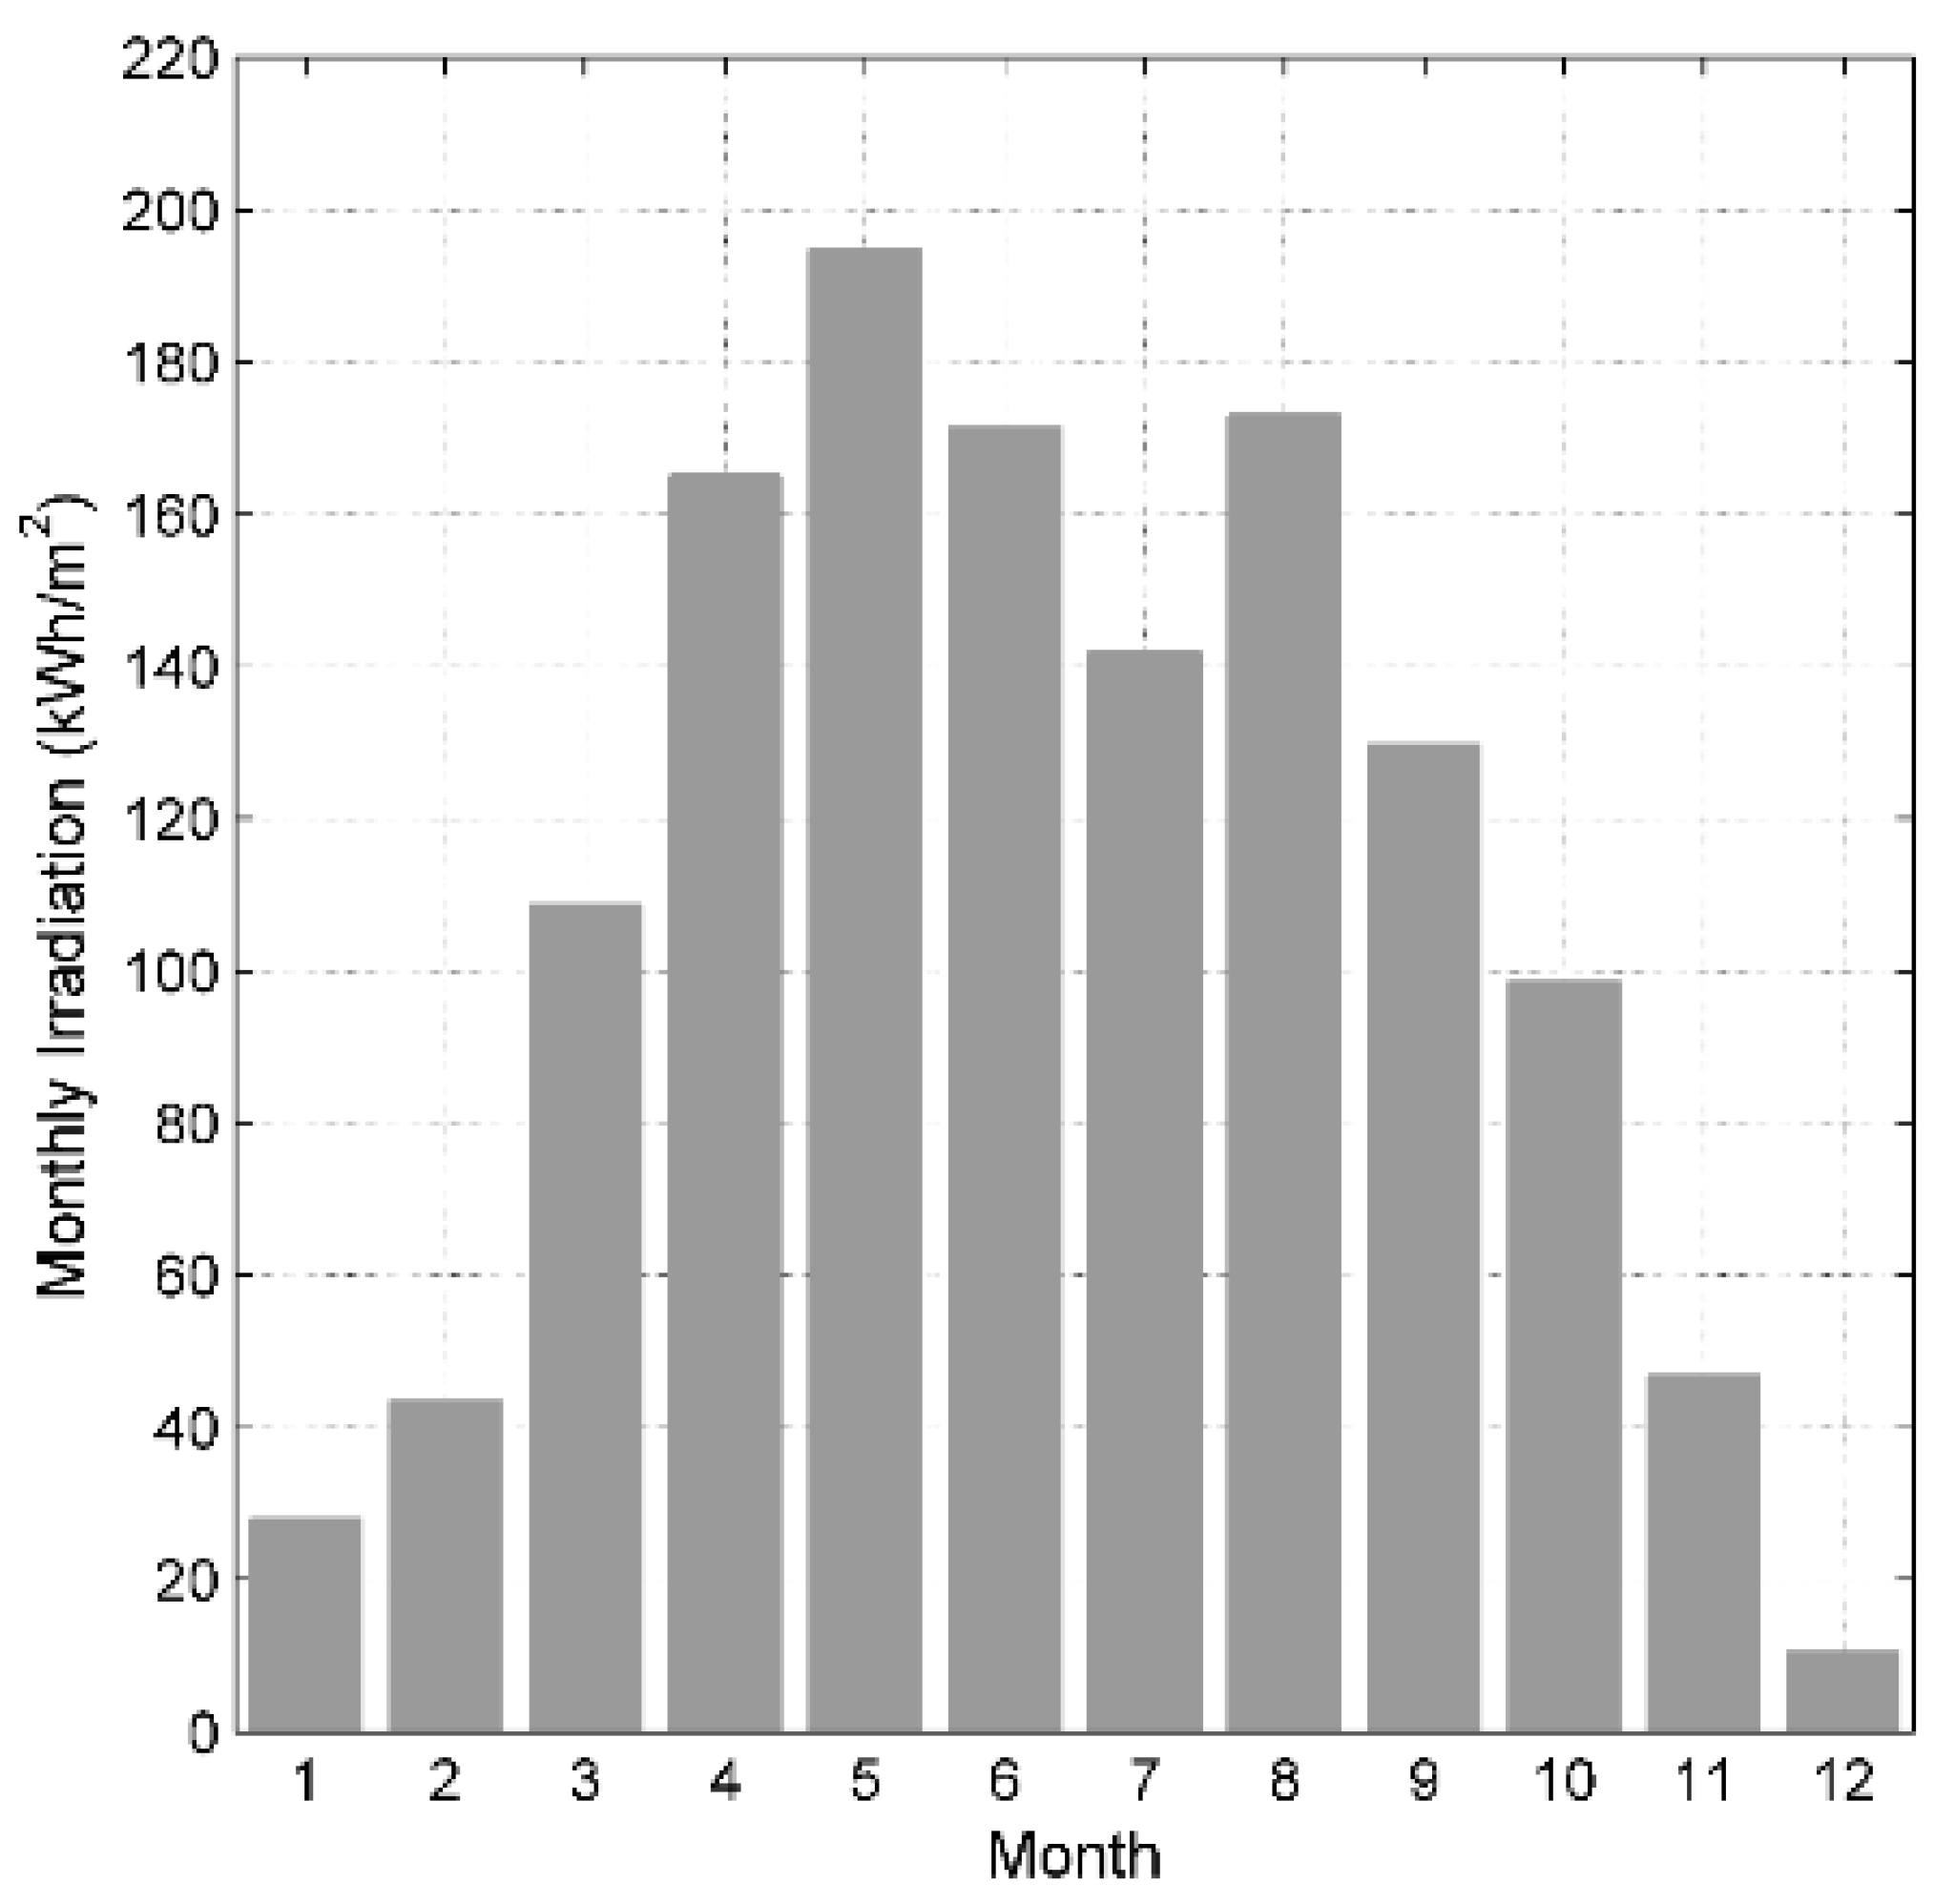
The solar plant under investigation is located in the warm summer continental climate (according to Köppen’s classification) which is characterized by significant differences between the warm and cold parts of the year. Among many climate elements, solar irradiation is the most important factor determining the performance of the plant. Figure 1 shows the distribution of monthly irradiation over the entire year 2018 at the location of the installation. During the warm half of the year, three times more solar energy is received than in the cold part of the year, which is directly reflected in the energy production yields (v.i.). According to the prior measurements at the studied location, the annual sum of solar irradiation varied by about 200 kWh/m2, depending on the weather conditions throughout the given year. The 2018 was a sunny year with a measured solar irradiation sum of 1313 (kWh/m2)/y, in comparison to 2017 when 1160 (kWh/m2)/y was registered in the module plane. At high latitude, which is the case of the studied plant, high irradiance values are rarely observed, only 7% of irradiance is in the range of 900–1200 W/m2 (Table 2). In turn, 88% of the irradiance is below 800 W/m2; therefore it is highly unlikely that the STC conditions will occur.
3.2. The Influence of Irradiation on PV Module Temperature
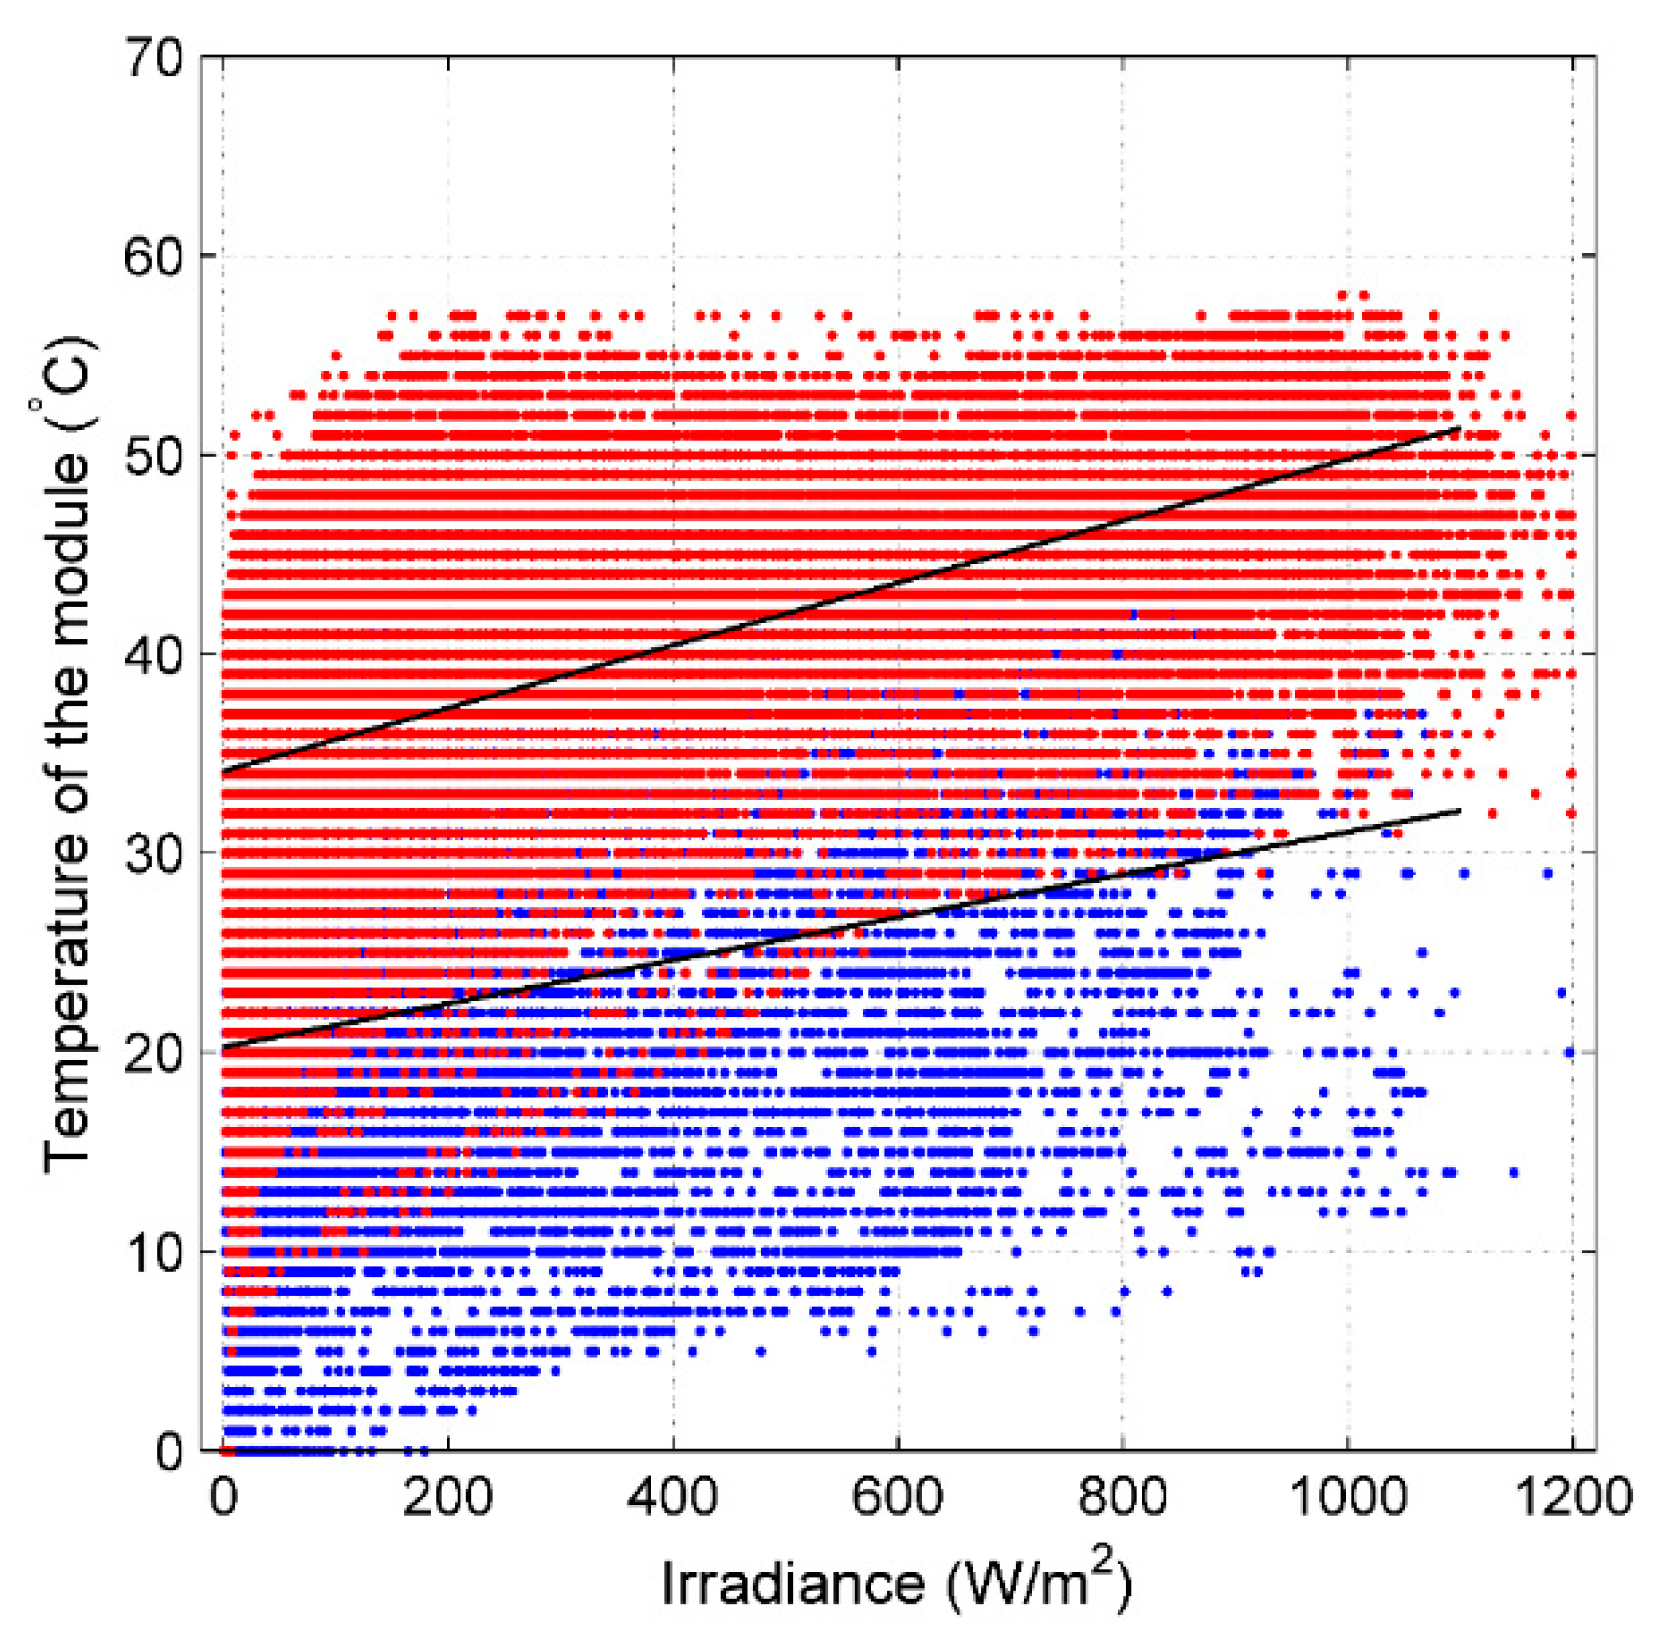
At the location of the studied solar power plant, where a clear difference between the warm and cold half of the year occurs, the back PV module surface temperature reaches maximum 40 °C in October and almost 60 °C in August. In both parts of the year, the temperature of the modules increases with irradiance. Starting from January, when the maximum irradiance is about 700 W/m2, the increase of irradiance and accompanying module temperature growth is observed. The temperature distribution of modules (Figure 2) exhibits significant fluctuations for the same irradiance level which can be evoked by ambient temperature changes during subsequent seasons of the year, as well as other numerous external factors such as wind speed and its direction or precipitation such as rain or snow. Occurrence of module temperature equal to 25 °C at 1000 W/m2 of irradiance determined for standard test conditions is rarely met in real outdoor environment at the considered latitude, which is indicated in Figure 2.
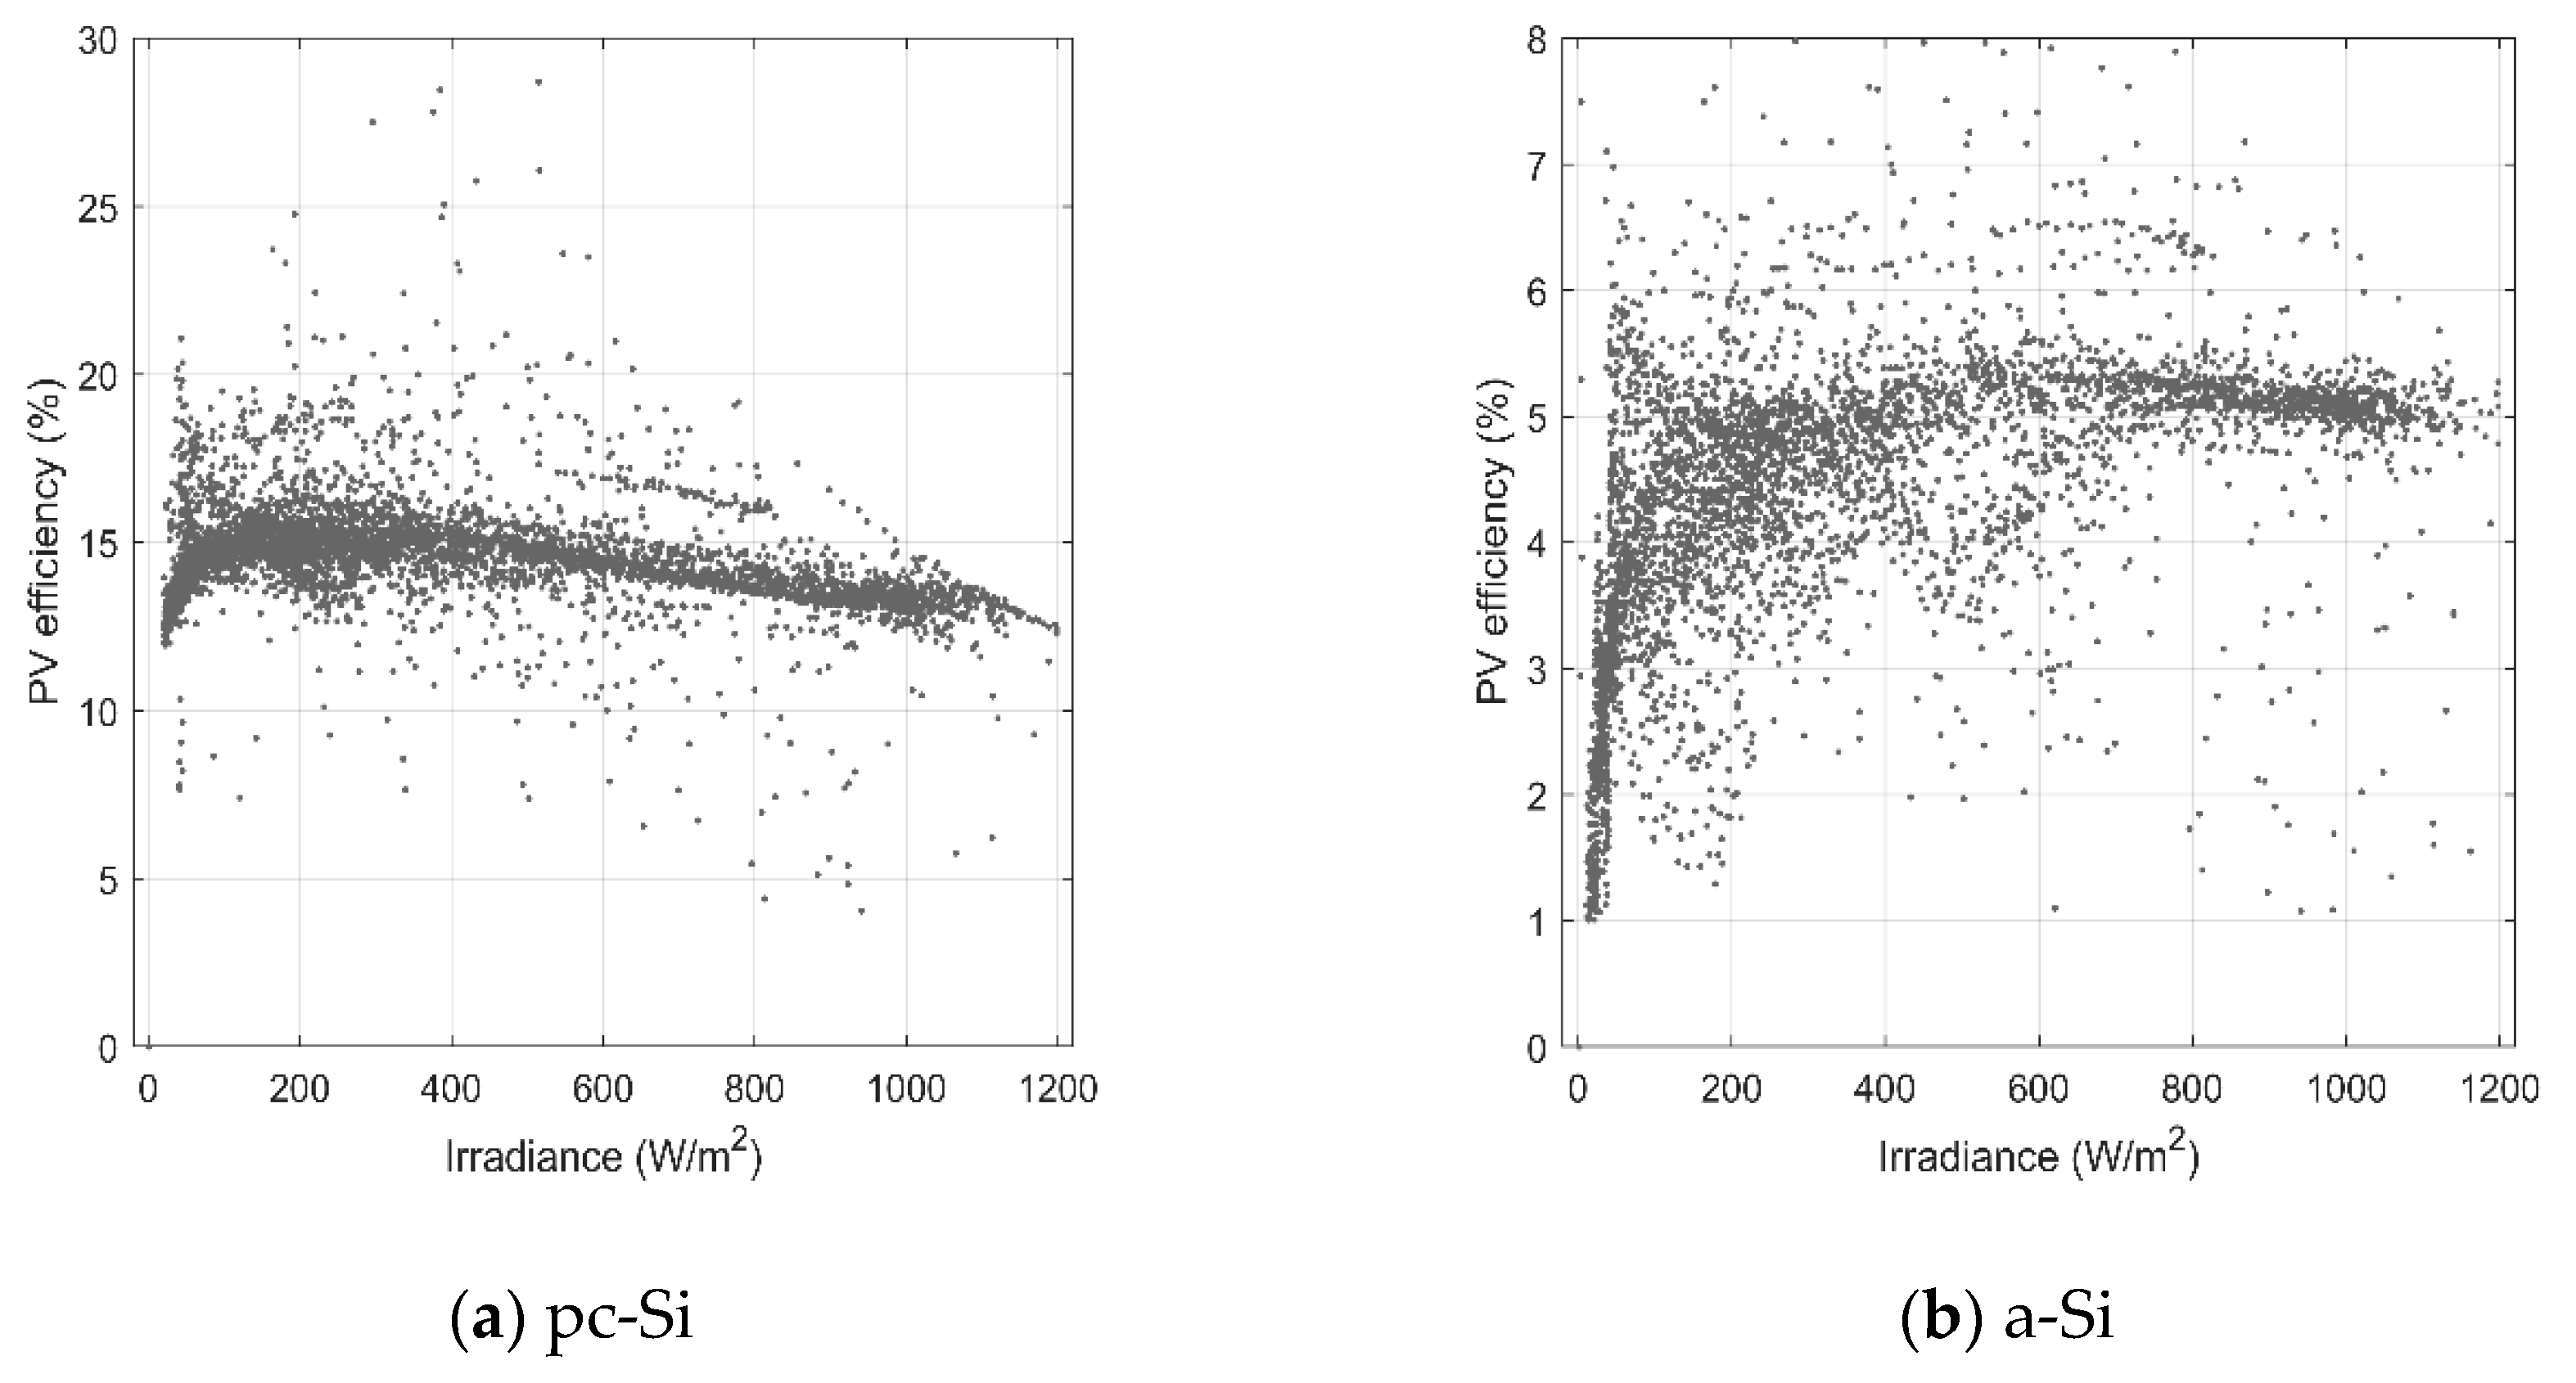
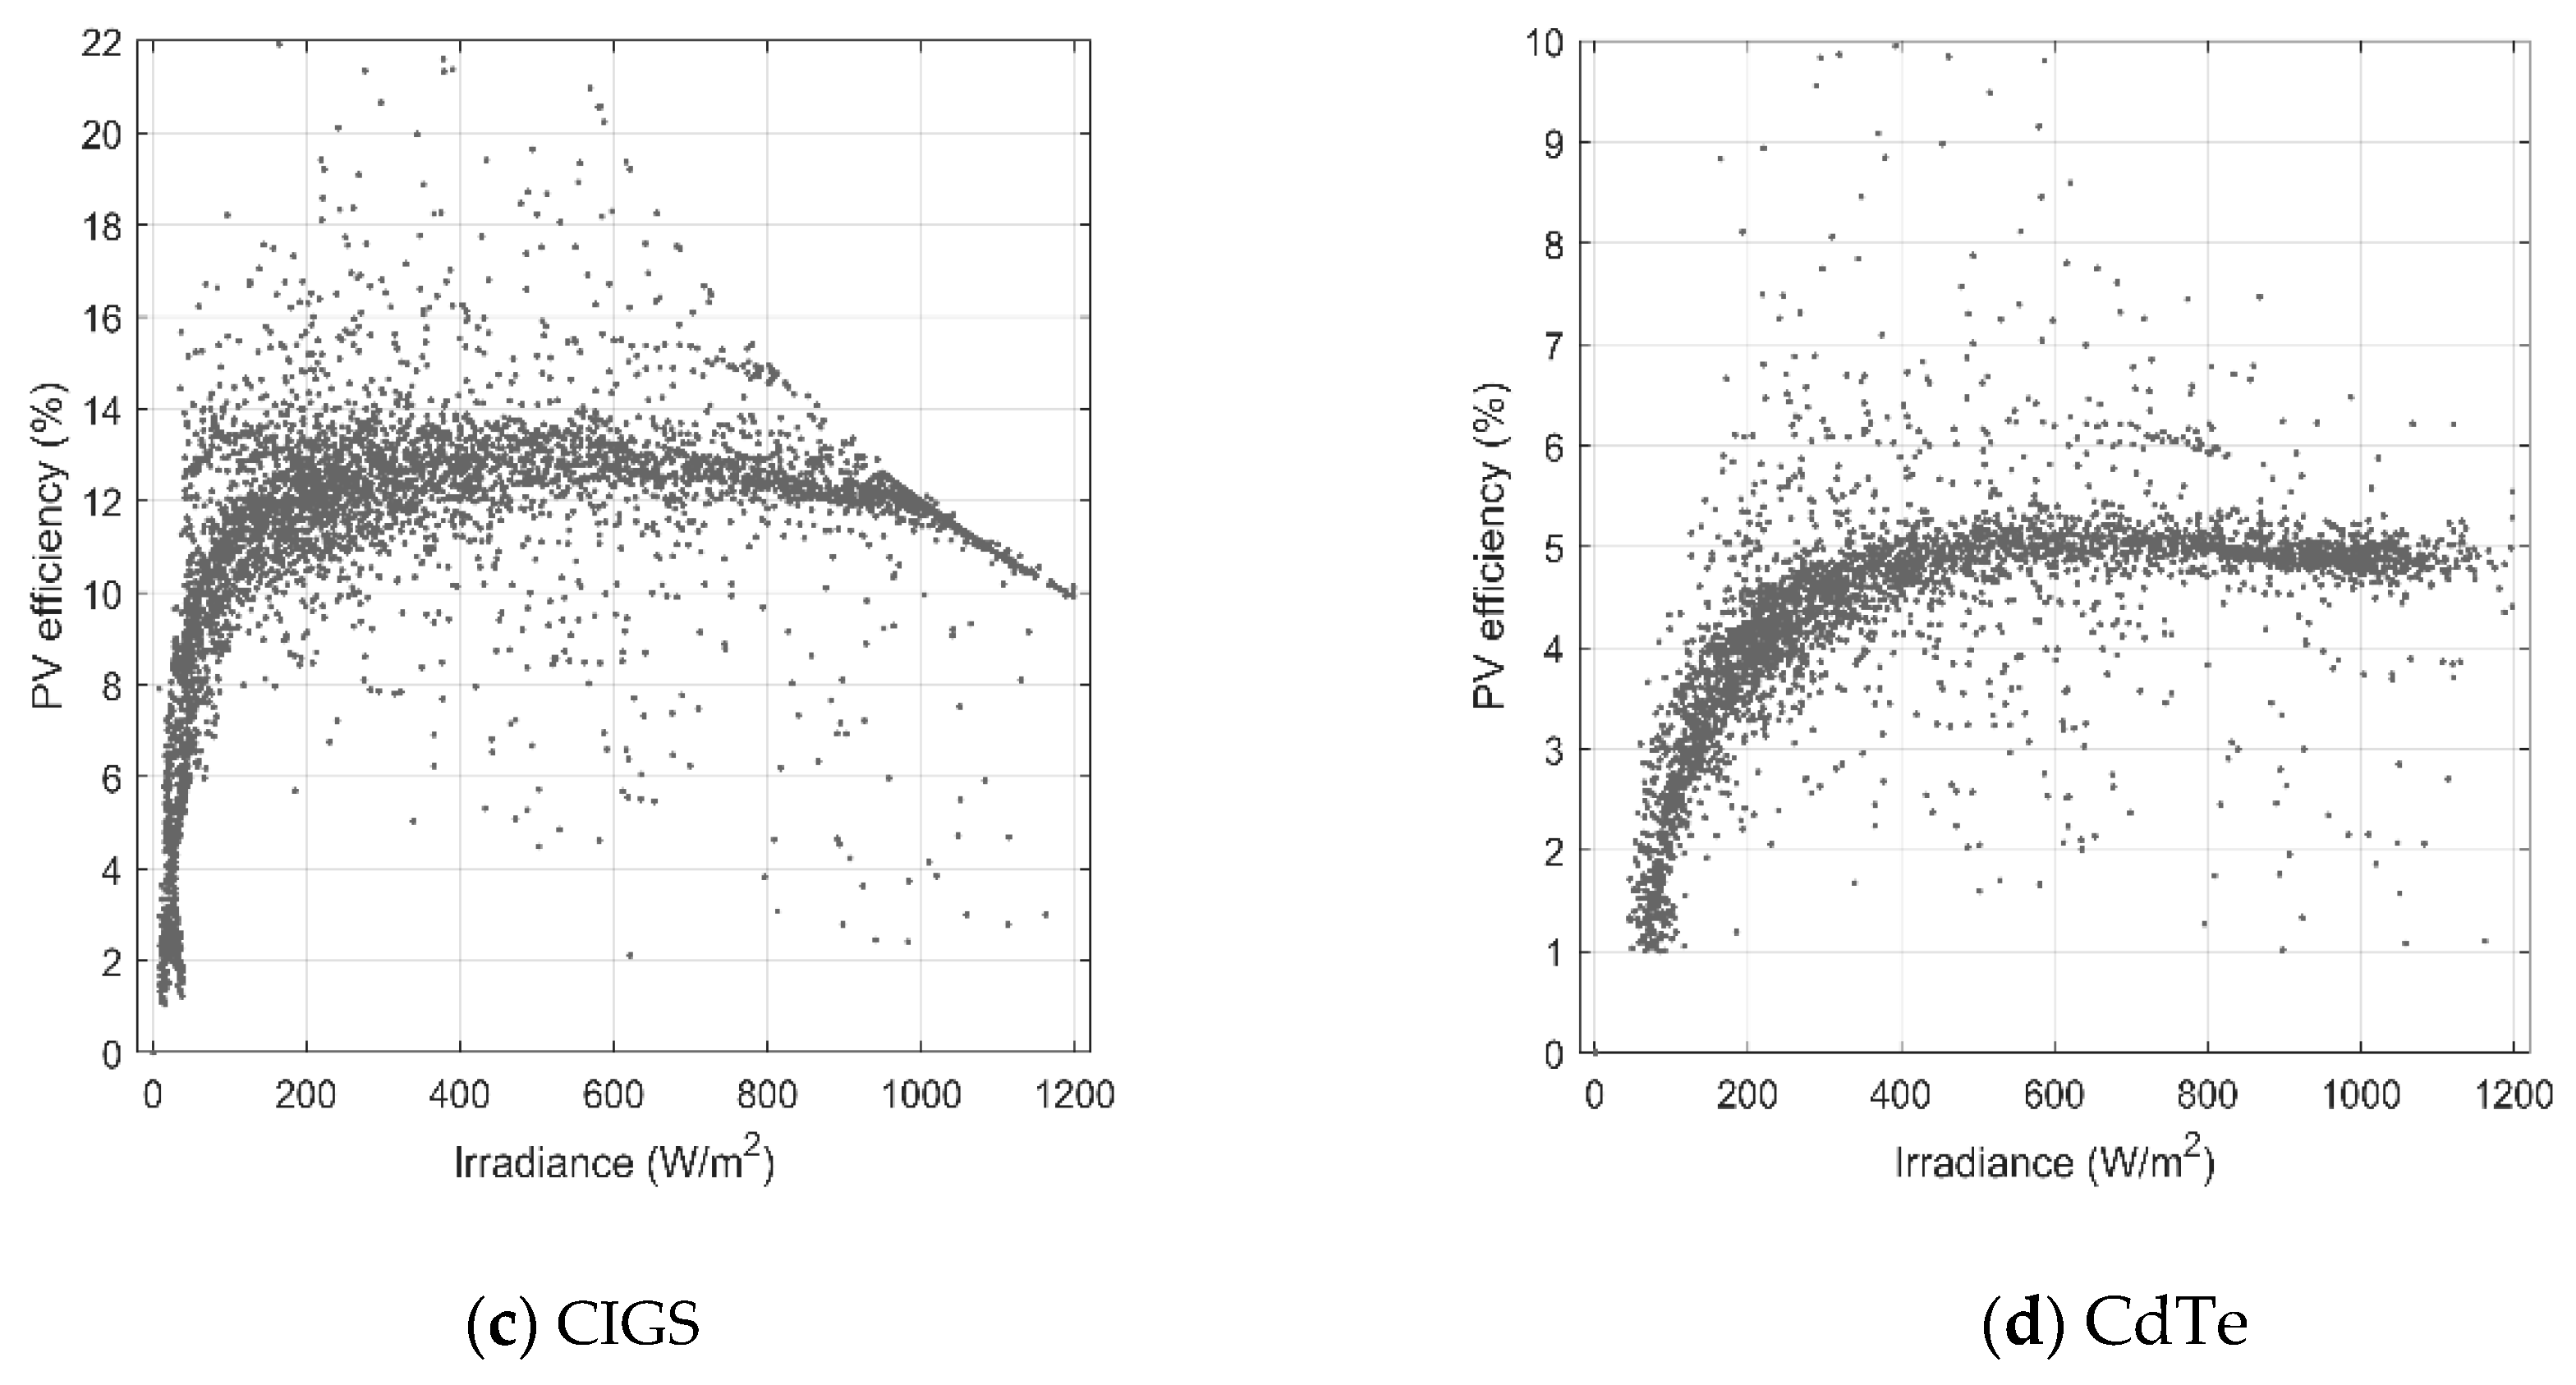
High irradiance conditions result in the increase of the module temperature because of air temperature growth and direct heating of the modules surface. The rise of module temperature is the reason for efficiency drop in the case of pc-Si and CIGS technologies (Figure 3). This kind of changes is not observed for the a-Si. The PV efficiency values were computed as the quotient between PV power output Pout and incident solar irradiance on the surface of PV modules [7] according to the following equation:
where G—solar irradiance [W/m2], A—area of PV module [m2].
During the days, when irradiance is below 600 W/m2, the efficiency reveals an increasing tendency due to the temperature decrease, which is visible again for pc-Si and CIGS. Below 200 W/m2, the efficiency of the PV modules is definitely reduced, which is also reported in literature [25]. Figure 3 presents real, unfiltered experimental data; thus, the points are spread due to the changing weather conditions and time of a day.
3.3. Inverter Efficiency
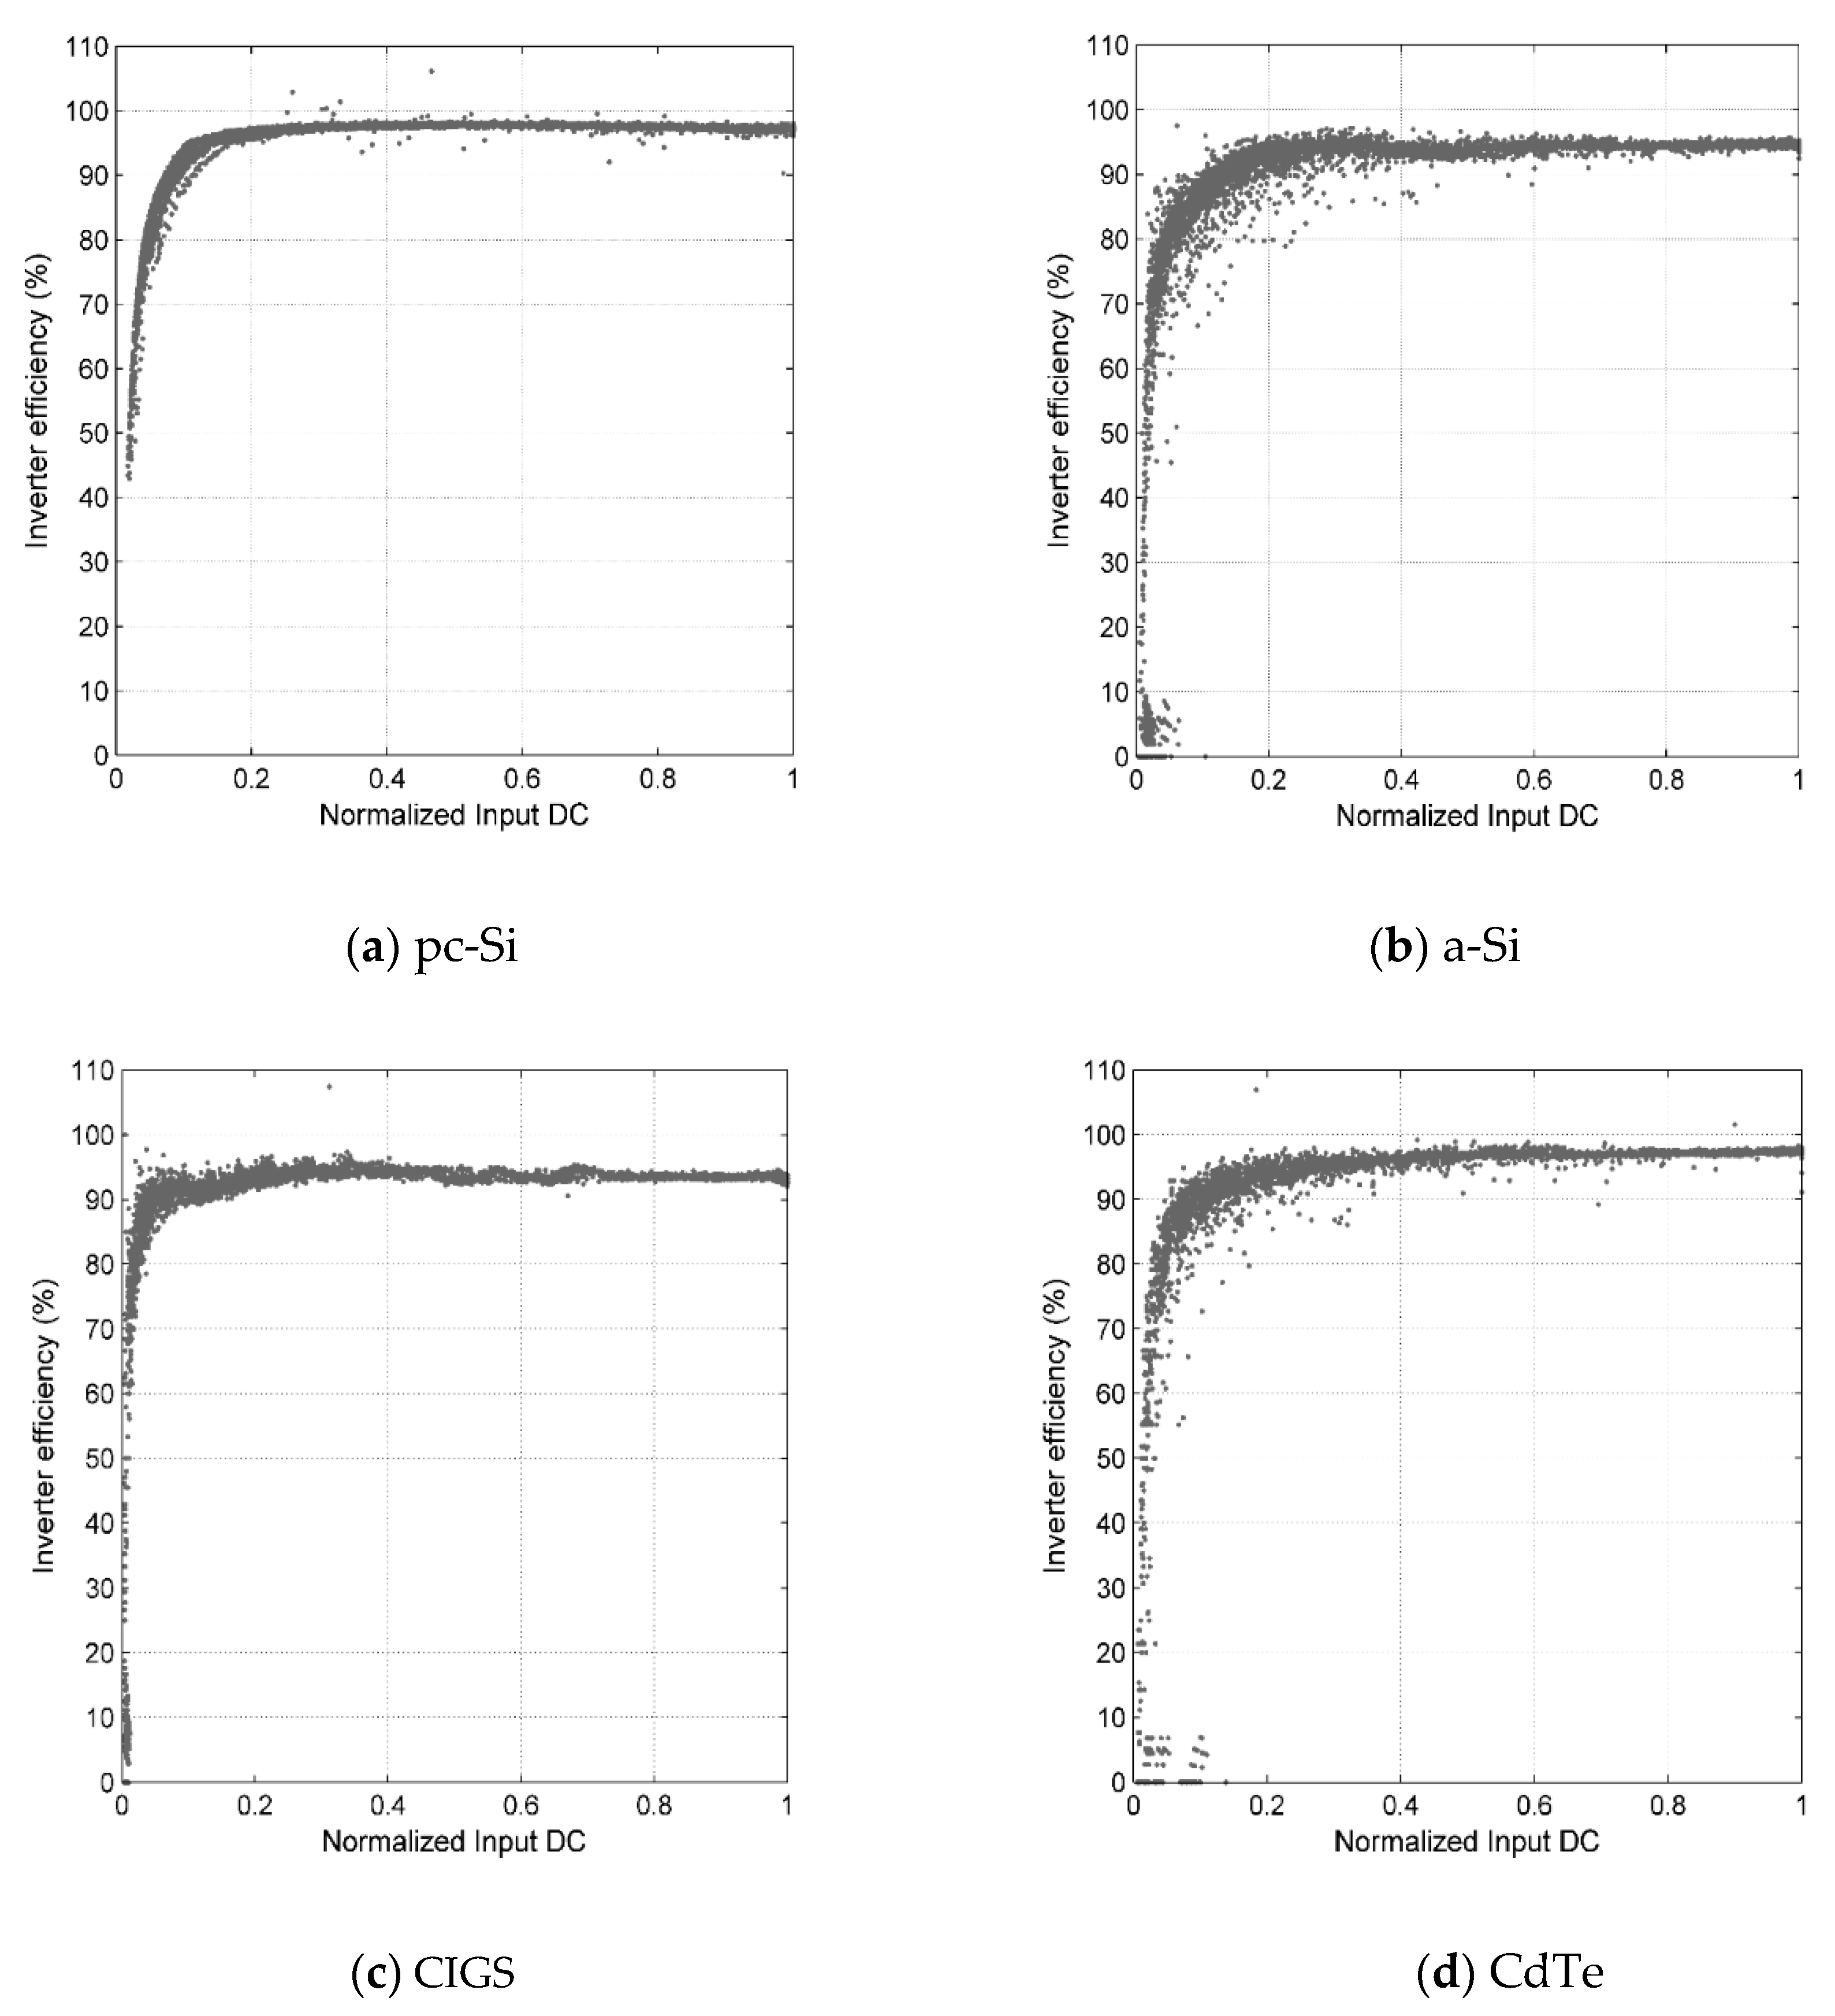
Figure 4 and 5 show the inverter efficiency as a function of normalized DC input, which is the ratio of daily AC energy output EAC to daily DC energy input EDC:
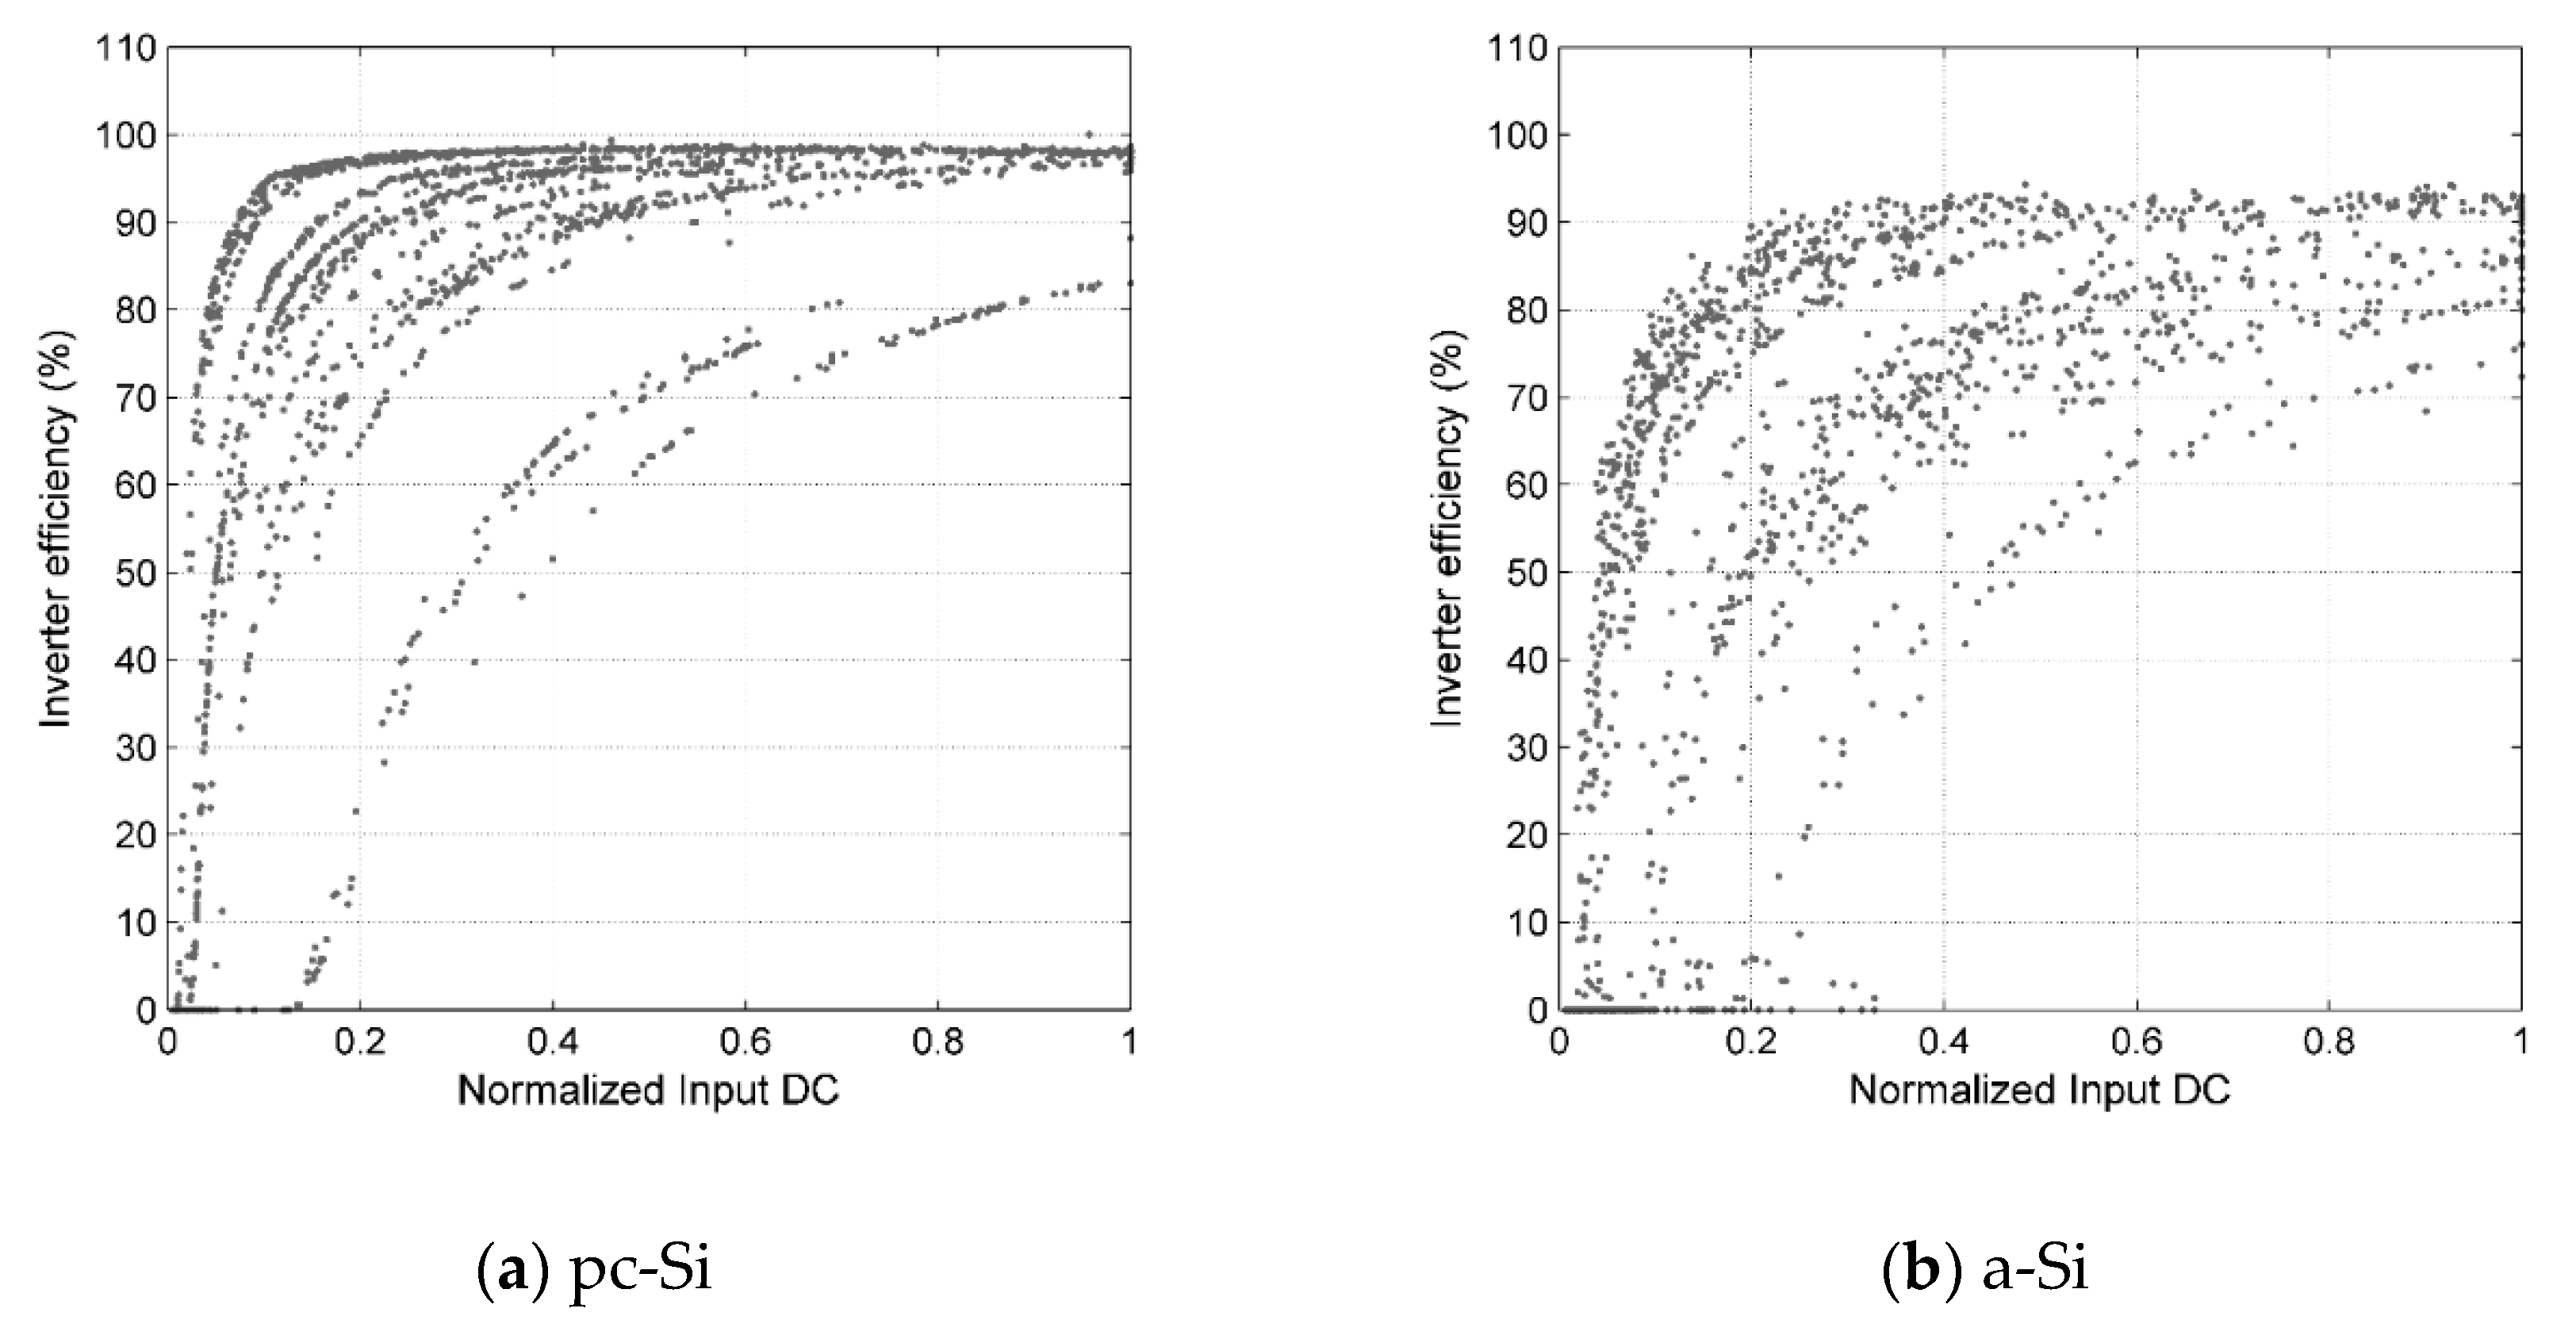
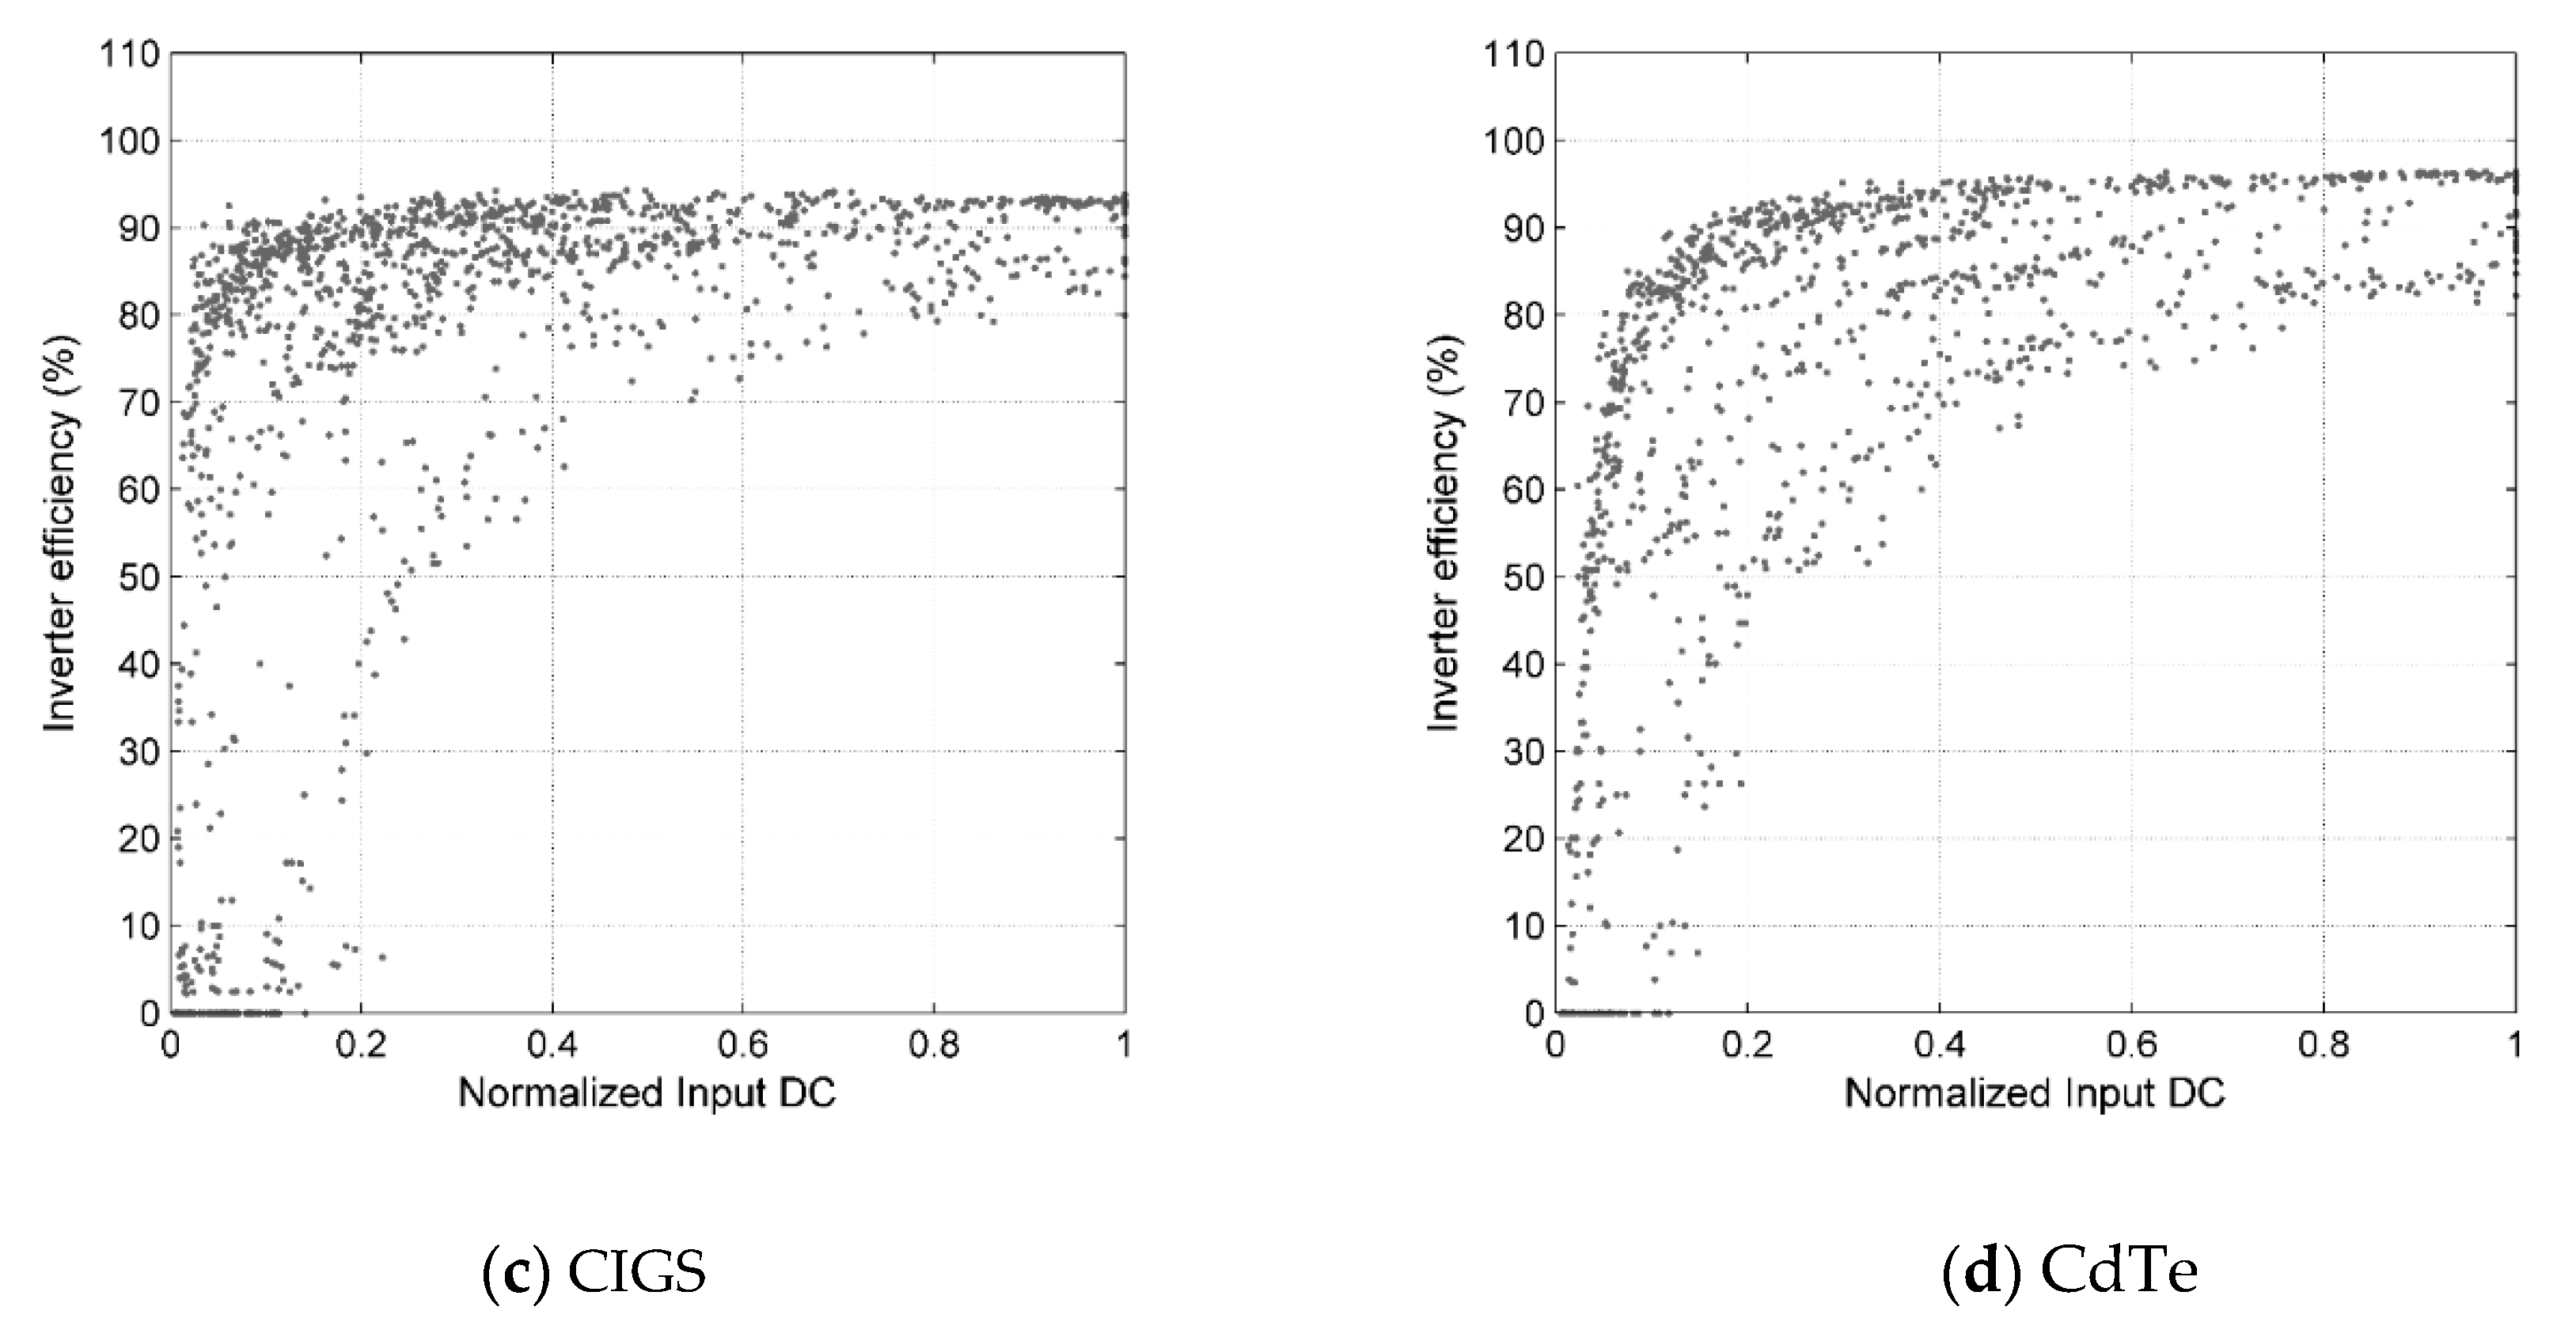
During the warm part of the year, the efficiency of the inverter increases with the DC input, reaching 95%–98% at high input conditions (for DC input above 20% of the inverter rated capacity). High values of the inverter efficiency (Figure 4) are observed from April to September for the inverters of each tested installation. Figure 4 also shows the difference between the quality of inverters used, since the nominal efficiency of the inverters equals 98% and 96.2% for the pc-Si and thin film installations, respectively. Under favorable conditions, the efficiency of inverters is close to its maximum value. In the cold part of the year (October to March), when the irradiance fluctuates or long low insolation periods occur, instantaneous input power to the inverter is very low or even zero and the inverter performance deteriorates (Figure 5). An inverter also requires some portion of the energy to power itself, so at low insolation when the input power is below the threshold level, an inverter is unable to even start its operation. Varying insolation results in discontinuous operation of the inverter and a decrease of its daily efficiency to 30%–80%.
3.4. Energy Production and Losses
The processes of solar radiation absorption and conversion are hindered by such factors as reflection of light, shadowing (soiling), degradation of modules, heating of modules that cause a decrease in voltage and, in consequence, their efficiency. The harmful role of factors of this kind are represented by the array capture losses LC that can be expressed as [18,26]:
YR—the reference yield which is the total in-plane solar insolation H (kWh/m2) divided by the array reference irradiance (1000 W/m2), YA—array yield is the monthly energy output of the PV array EA (kWh) divided by the peak power of the installation PR (kWp):
In addition to the losses connected with the absorption of the solar radiation, the amount of electric energy delivered to the grid is affected by system loses LS that are generated mainly by the inverter. The system losses can be expressed as:
YF—the final yield, which is the monthly AC energy production E (kWh) divided by the peak power PR (kWp) of the system at STC:
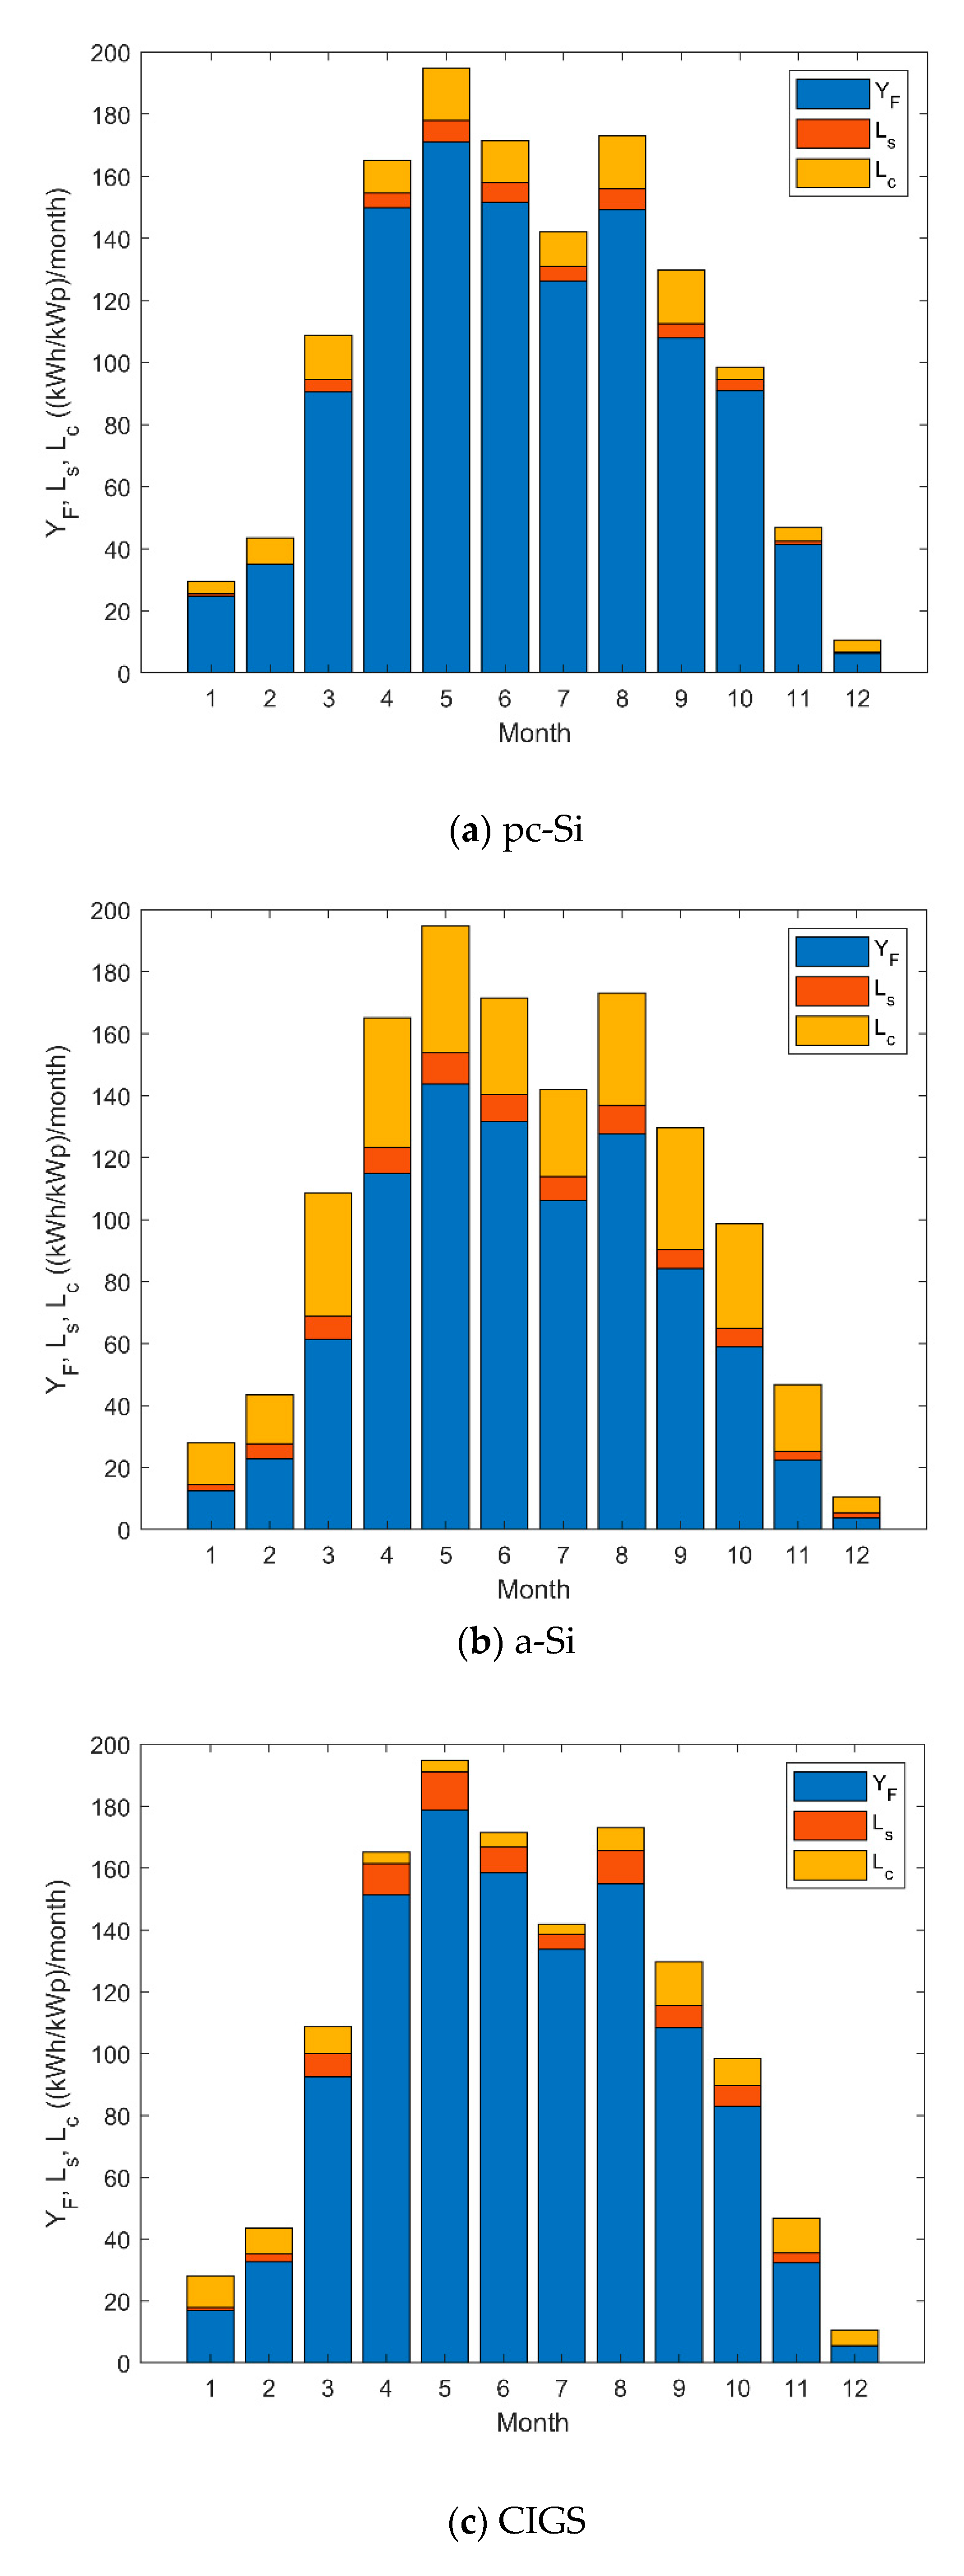
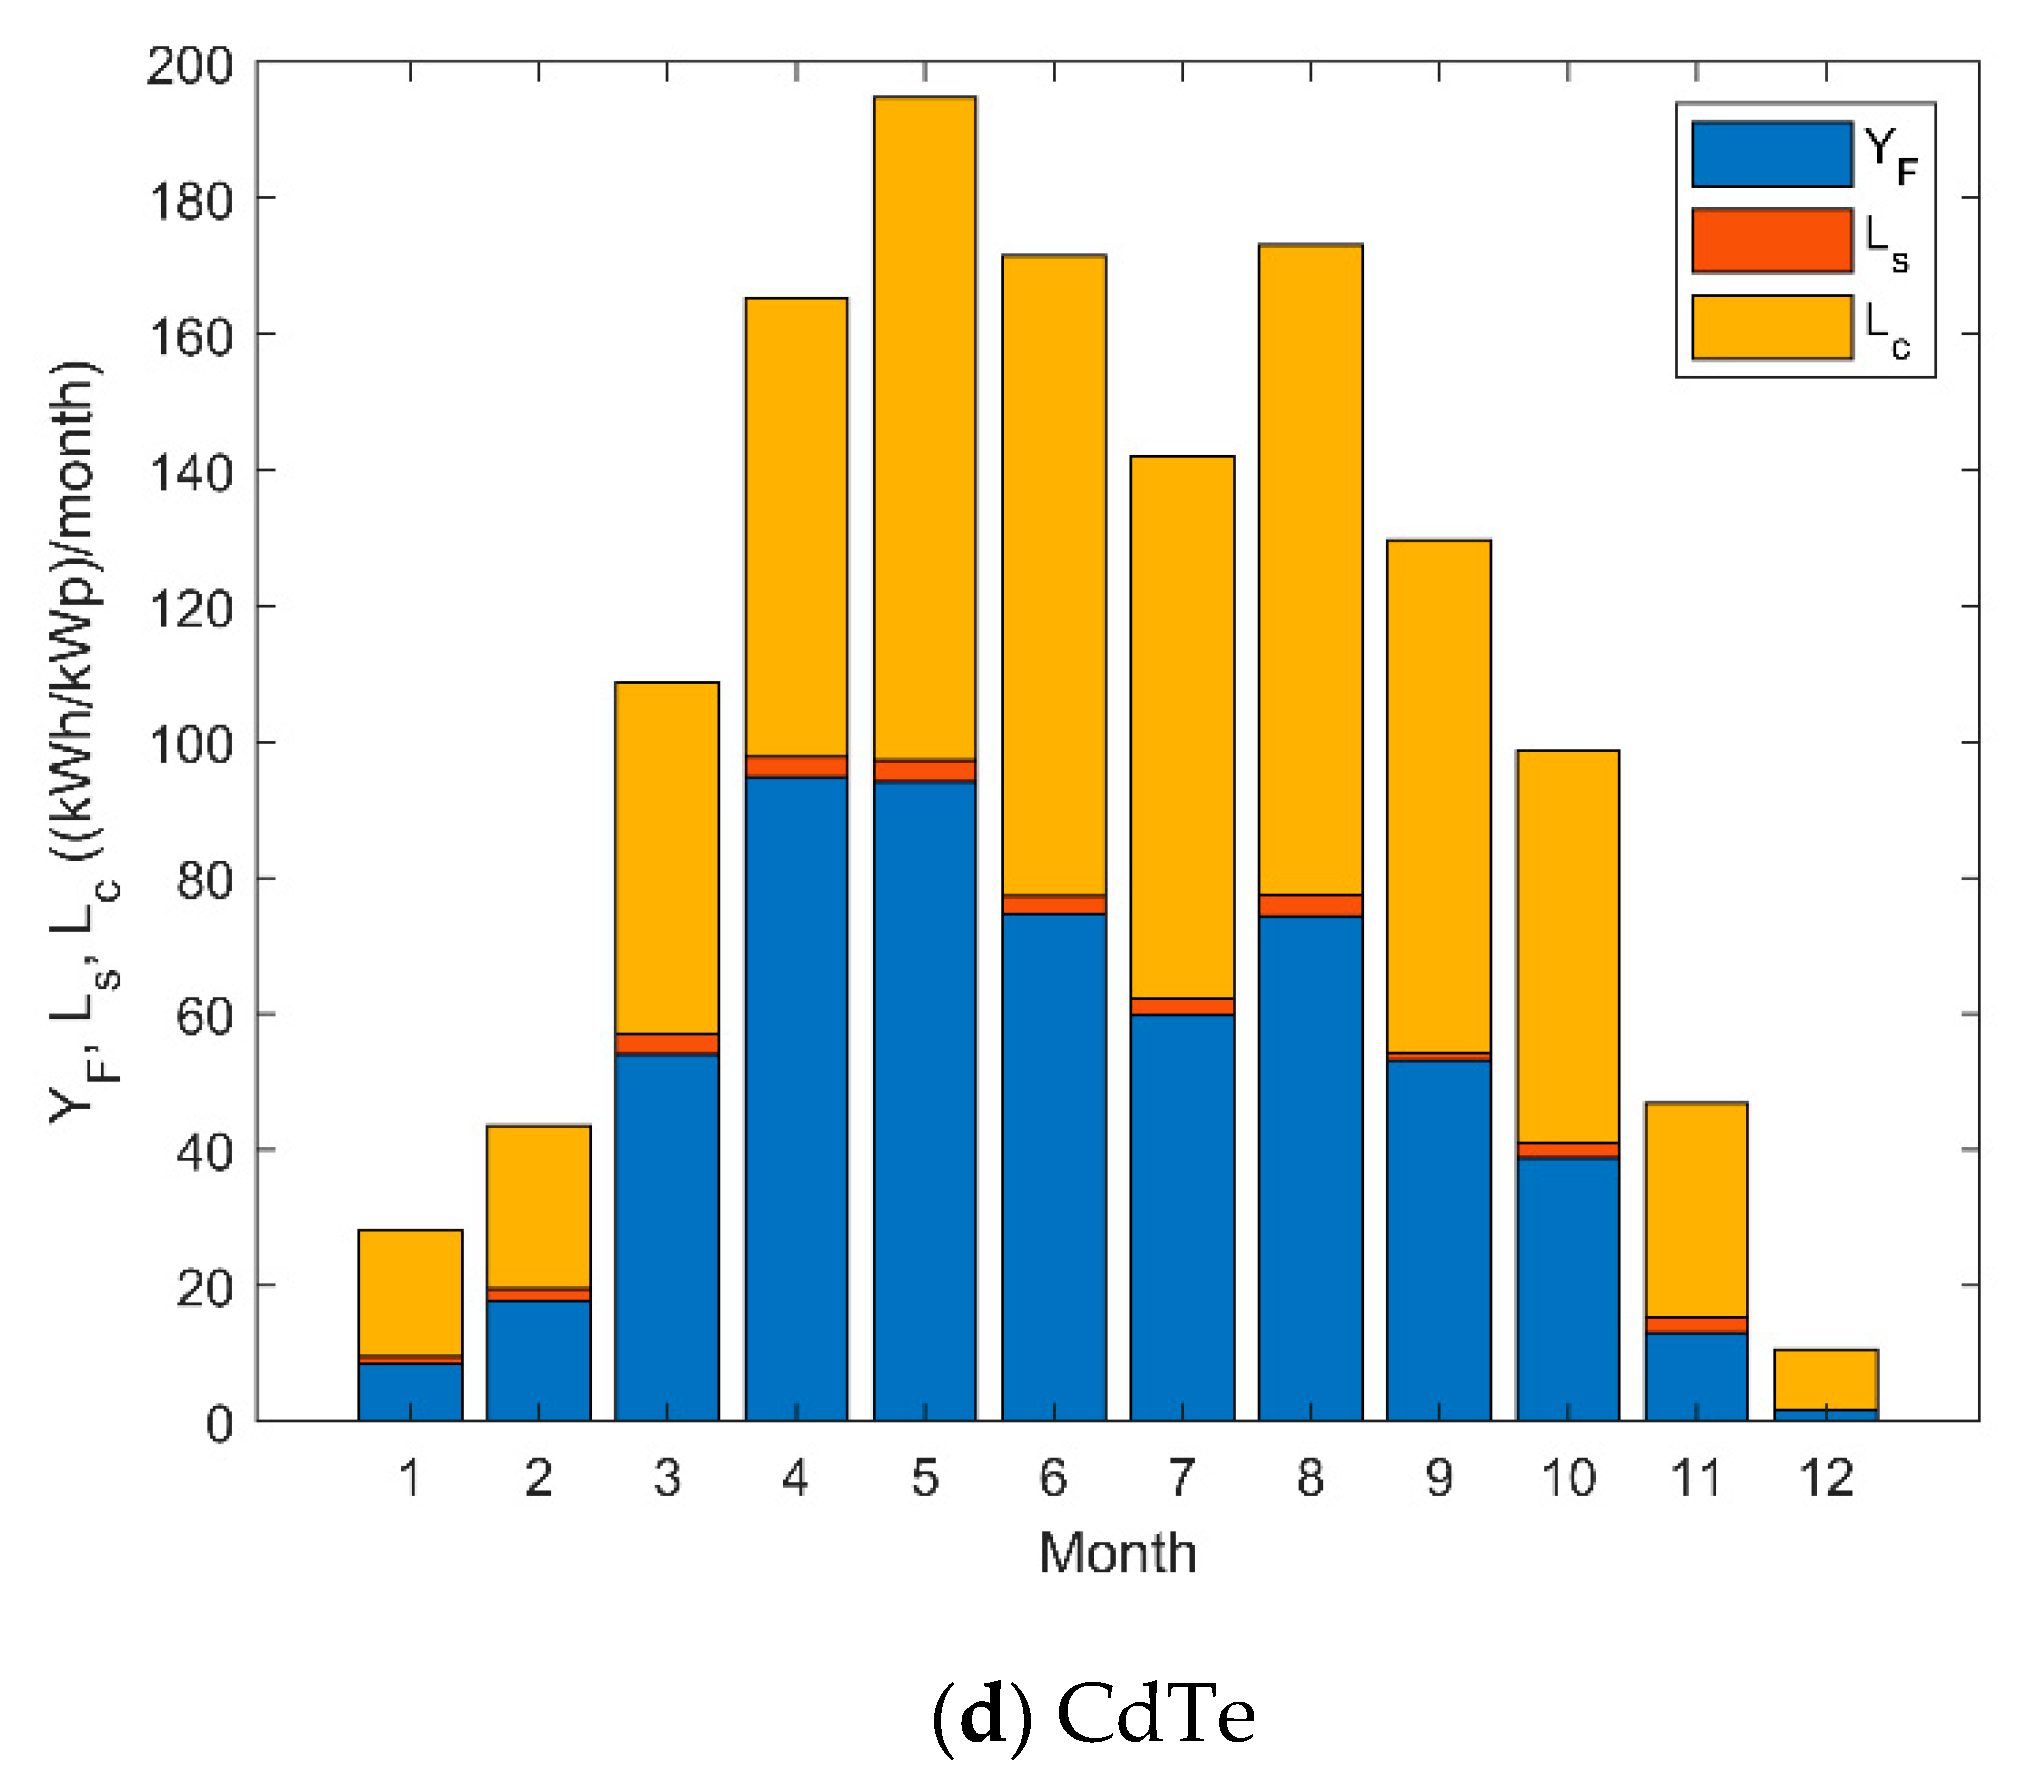
The final yield and losses for each type of studied modules are shown in Figure 6; their shape follows the distribution of solar irradiation in each type of technology.
The array losses for the pc-Si modules are higher than for CIGS in the warm part of the year. The highest difference (13.3 (kWh/kWp)/month) was noticed in May, the sunniest month in 2018 at the location of the PV system. The lowest value was equal to 3.1 (kWh/kWp)/month in September. The average array losses difference between the pc-Si and CIGS systems in the warm part of the year was estimated as 8.3 kWh/kWp. CIGS is the only technology that shows higher array losses in the cold part of the year than in the warm part. The highest values of differences, comparing to pc-Si, were noticed in November (6.9 (kWh/kWp)/month) and January (6.2 (kWh/kWp)/month). Simultaneously, the CIGS system losses are high in the summer months, even up to 12.3 (kWh/kWp)/month in May. A-Si exhibits significant array losses through the entire year that ranged from 5 (kWh/kWp)/month in December to 41 (kWh/kWp)/month in May. In general, the array losses are the highest for the CdTe modules, especially in summer (with maximum value in May equal to 97.5 (kWh/kWp)/month). Thus, the energy yield of the CdTe modules is the lowest in spite of the minimum system losses in this case.
The values of energy yield for each type of technology in 2018 is presented in Table 4. In the presented study, based on the data collected in 2018 it is worth to address the degradation processes that were supposed to occur during previous years of solar plant operation. Quantity estimation of modules degradation was made possible by linear regression of the energy yield decrease [5] presented in Table 5. Irradiation changes during each subsequent year were also taken into account: 1338 (kWh/m2)/y in 2015, 1249 (kWh/m2)/y in 2016 and 1160 (kWh/m2)/y in 2017. Average annual degradation rate determined for CIGS and pc-Si modules is below 0.5%. For a-Si this value is higher, 7.3% and for CdTe degradation rate exceeds 26% which is reflected by low energy yield.
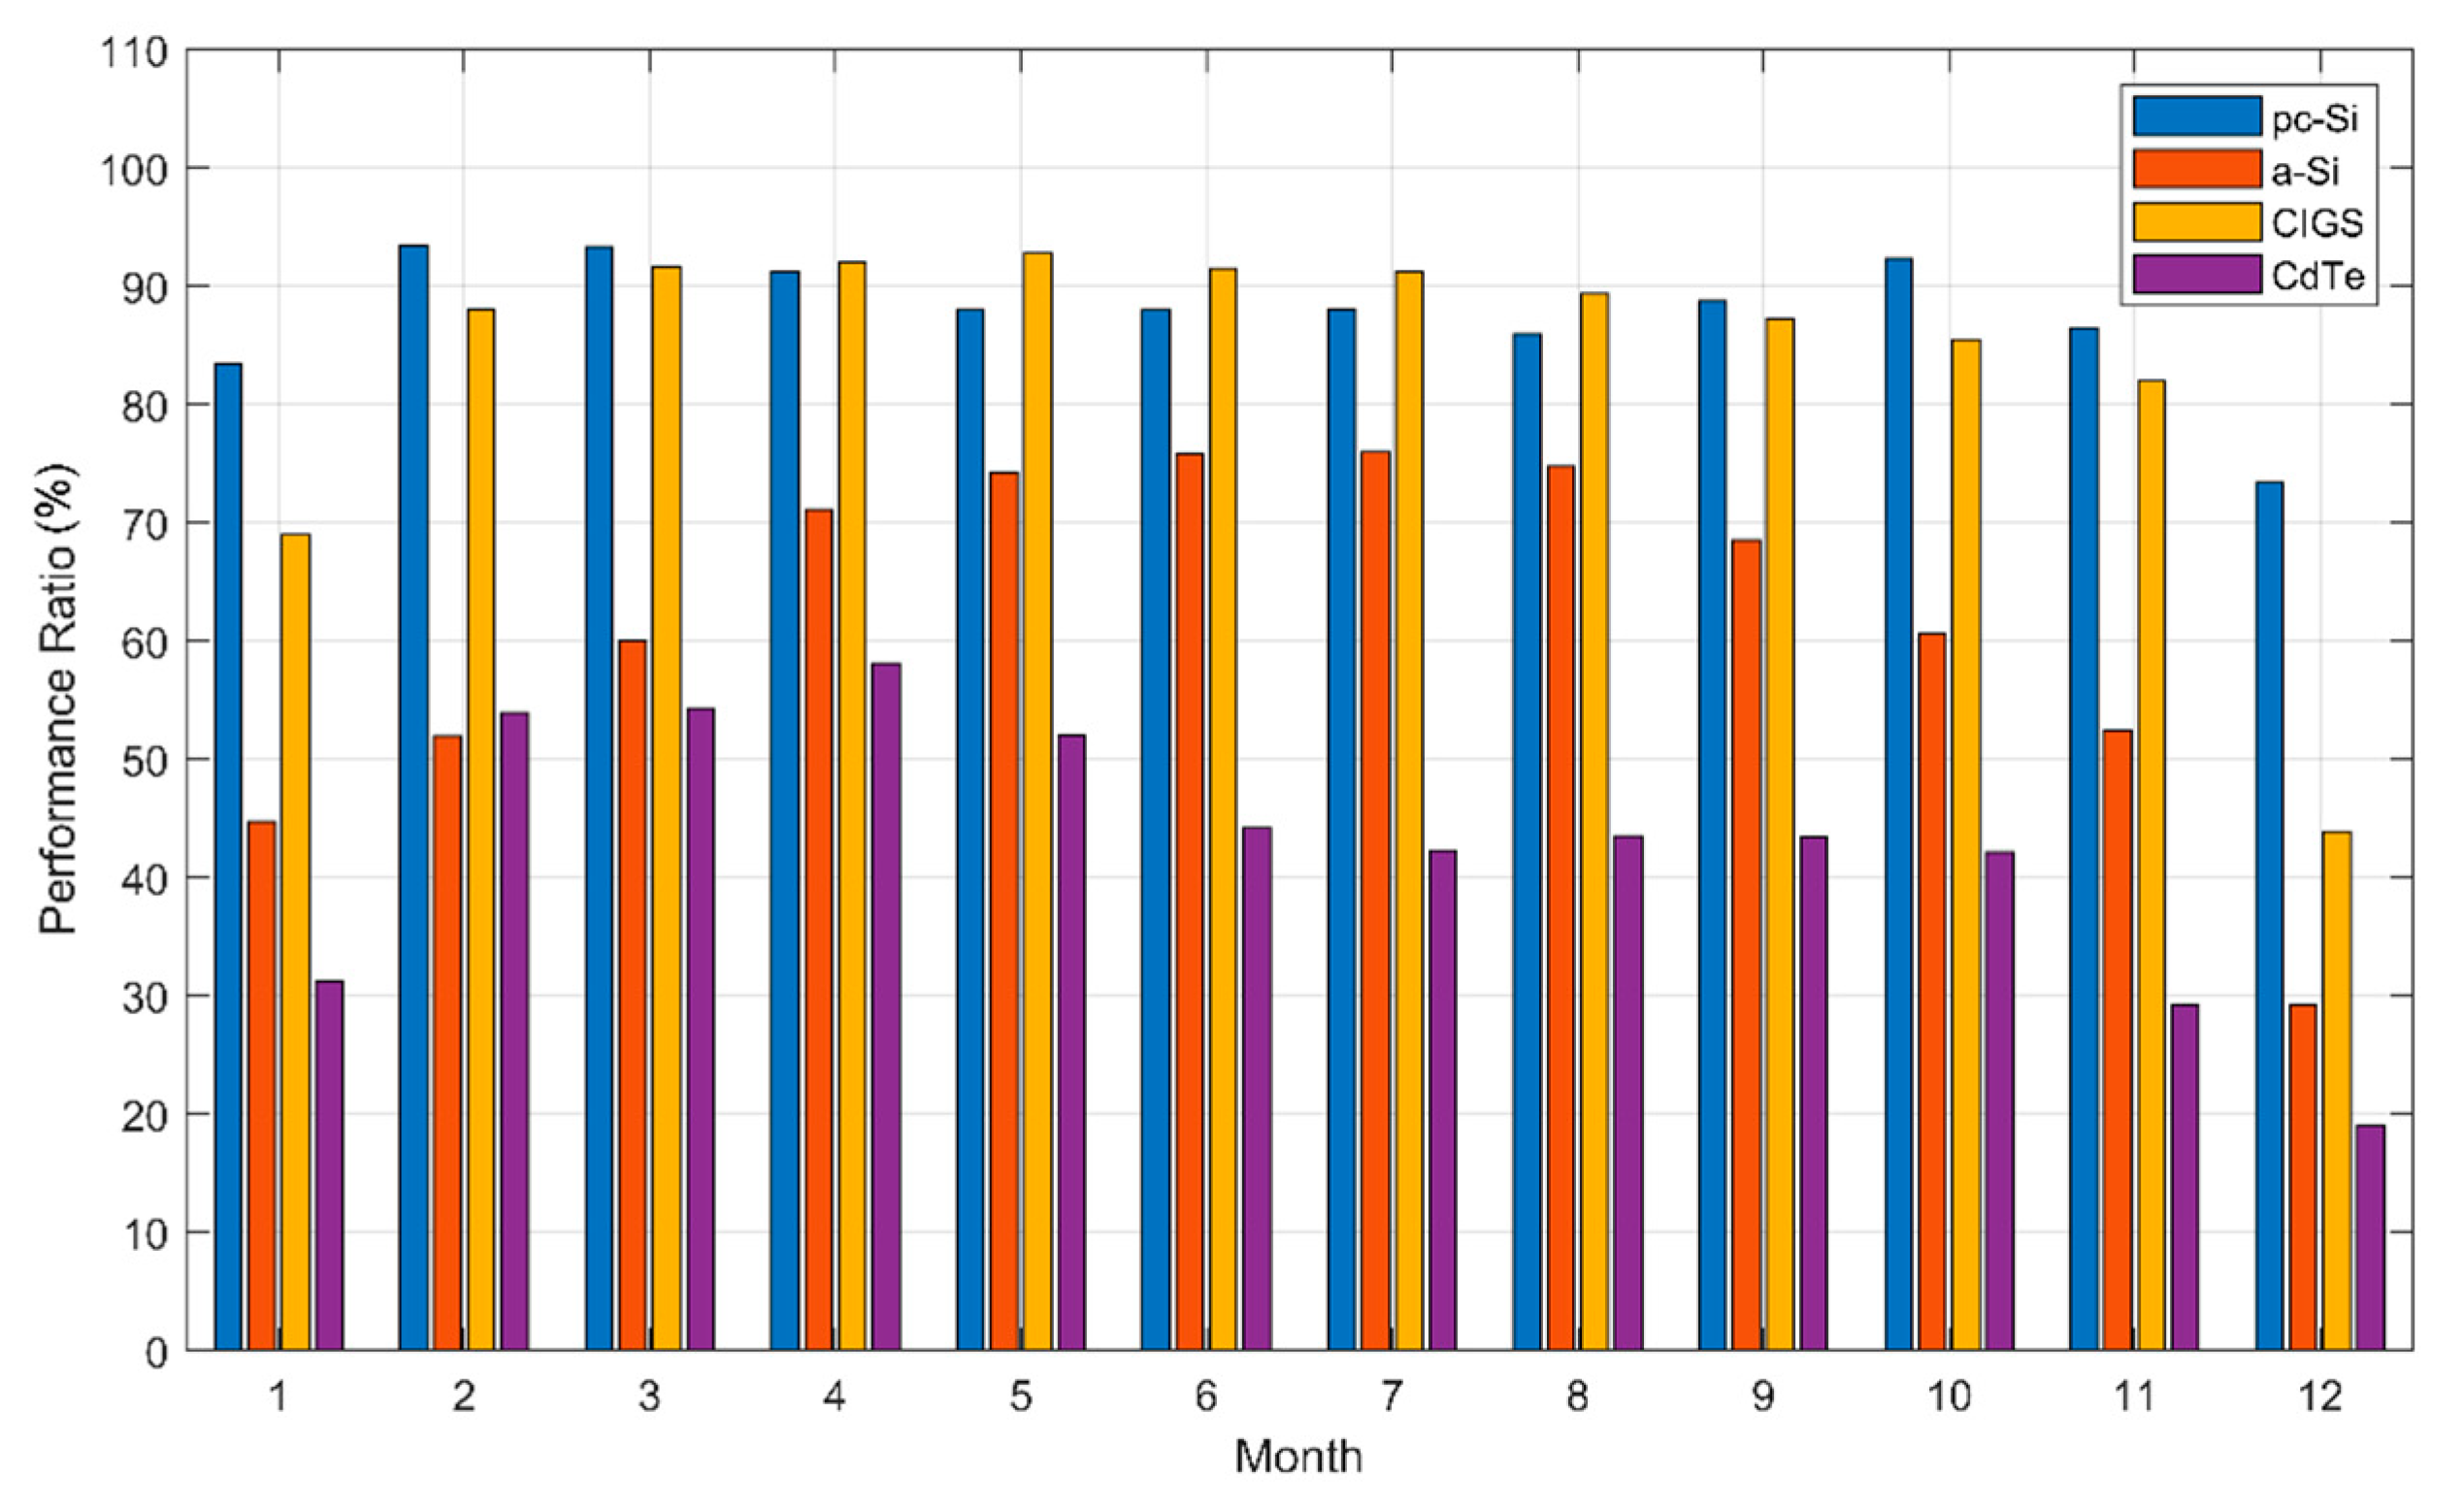
The performance ratio parameter PR (Figure 7) allows comparing the real system efficiency with the nominal efficiency at STC and reflects the overall losses occurring under the actual operating conditions due to the degradation, temperature influence, and soiling, of modules and inverter as well as performance of other electrical components. The performance ratio can be calculated as a ratio of the final yield YF and the reference yield YR according to the formula:
In order to avoid accidental errors, caused by e.g. inverter failure or local shading of some modules in the string, monthly performance ratio was computed as an average of daily PR values. The data was filtered to keep the standard deviation (SD) of average monthly PR below 3% in summer months and 5% in winter months for all technologies under study. The lowest value of SD was achieved for period between June and August (about 2%) which proves high precision of performance ratio estimation.
PR for the pc-Si installation is over 80% throughout the entire year, except for December, which is a good result. PR value in this case is changing from about 86% in August to 91% in April. This dependency is not observed for CIGS and a-Si technology. PR of CIGS is close to 90% for all summer months except September. The a-Si modules exhibit a performance improvement during the summer months. However, noticeable array losses for this technology result in a low overall PR value. The performance ratio of the CdTe installation does not yield the expected results, PR drops to 42%–45% in summer.
4. Discussion
The actual performance of the photovoltaic system depends on the quality of the components and connections between them as well as the external conditions. The overlapping of these factors makes juxtaposing the results from different locations in the world difficult; however, in some aspects the comparison is possible.
The performance of the silicon modules tested in this work is similar to that observed at the same latitude in UK [14] where the summer losses were observed in the case of crystalline Si and the summer gains for the a-Si technology. In this study, the a-Si PR value reaches 73.4% in the warm part of the year and 49.8% in the cold part of the year. In the case of pc-Si, the PR values drops from 93% in spring to about 87% during the hottest months (May to August). The same tendency was observed in India [8] where PR for pc-Si decreased even below 80% in summer. These dependencies, reflected also by modules efficiency changes, are directly affected by the temperature coefficient, which in the presented study is the highest for pc-Si and the lowest for a-Si. Narrow bandgap of pc-Si and generation of defects upon a temperature increase results in weakening of the photovoltaic conversion efficiency. The gains observed in the performance of the a-Si modules during the summer months, also observed in other studies [28], are attributed to the Stabler–Wronsky effect [29], in which the metastable defects in the material structure of amorphous silicon—which is hydrogenated—are reduced under the exposure to elevated temperature [30]. Spectral gains can also be observed since a high a-Si band gap value enables the conversion of blue light, which is beneficial in some locations [14]. The photovoltaic performance of the studied pc-Si modules is similar to c-Si studied in Dublin [18], where PR achieved 81.5%. The efficiency of c-Si modules reaching 14.9% was determined, also close to the result of the pc-Si efficiency obtained in in this research, equal to 14.5%. The value of 14.5% is only 0.5% lower than in STC, while at lower latitude, this difference amounted to 2% [7]. In the case of a-Si, the efficiency equals 4.9%, which is of the same level as the value determined in Poland in earlier studies [19]; however, the annual average PR of 61.6% remained lower.
CIGS, similarly to a-Si, exhibits better performance in the sunny and warm part of the year, which reflects the positive influence of the temperature growth on this PV technology. The bandgap value of CIGS (higher than for pc-Si) and temperature coefficient (lower than for pc-Si) foster summer gains. However, the summer system losses are largest in the case of the CIGS installation. This observation suggests the occurrence of occasional shutdowns in the inverter operation. Most of the time the system operates properly but sometimes, when the combination of very high irradiance and low temperature takes place, the saturation of the inverter can occur. PR for CIGS modules amounts to 90.7% in the summer months and 76.7% in the winter months. The annual average equals 83.7%. The CIGS modules, the mean efficiency of which is 12.5% and energy yield is similar to the value achieved by the pc-Si modules, definitely outperformed the thin film technologies in other studies.
In a PV installation, the system losses, which are mainly caused by the inverter, are influenced by high input current, power threshold, voltage threshold, excessive inverter power or voltage, inverter efficiency during operation, maximum power point tracking and also night consumption of energy. In this study, the efficiency of inverters exceeds 95% under high irradiation and drops significantly, even to 30% at low irradiation. All installations under study reveal a decrease of the performance ratio caused by an inverter that does not start convert the energy under the threshold energy level. This behavior reflects the strong differences between the warm and cold part of the year at the studied location. High inverter efficiency of 92%–93% in summer (August) was reported in Poland also by Pietruszko [19]. The estimated efficiency of inverters can be compared with the analysis performed in Ireland, a place at similar latitude, where the efficiency of 86% was reported in winter and 91% in summer [18] which is connected to the lack of significant seasonal weather differences. In other studies, also in Ireland, at similar latitude, the minimum inverter efficiency of 83% was observed in November and maximum of 89.7% in December, with the annual average of 87% [17]. High efficiencies of inverters were reported also at low latitude: 88.1% in Algieria [31] and 84.8% in Italy [32]. In the presented work, the determined system losses are in the range of 0.07 h/day in the CdTe installation to 0.21 h/day in the CIGS and a-Si systems.
Recently, the cloud edge effect was also indicated as one of the factors causing losses in the PV system. This kind of effect occurs on the days with blue skies when the cumulus clouds cover the Sun partially and sun shines strongly [33] The sunlight refraction results in an intensity increase and, in consequence, losses due to the inverter saturation. The array losses are connected with the irradiance level, temperature, module quality, soiling and shading and wiring of modules.
The array losses are the lowest for the CIGS technology modules in summer (0.2 h/day). In winter, they are slightly higher than for pc-Si (0.29 h/day for CIGS and 0.21 h/day for pc-Si). The array losses are the highest for the CdTe modules (2.83 h/day in summer and 1.07 h/day in winter) which certainly results in low performance of this technology; however, the system losses are very low (0.09 h/day in summer and 0.06 h/day in winter). In literature, the array losses for c-Si range from 0.22 h/day [18] to 0.81 h/day [17]; the value of 0.35 h/day for pc-Si obtained in this research is within this range. The determined system losses for the studied PV technologies that are in the range of 0.07–0.21 h/day are low when compared to the literature data of 0.23–0.27 h/day [17,18].
In the PV system under investigation, CdTe modules, in spite of a favorable temperature coefficient and small system losses, exhibit very low annual average performance ratio of 42.8%, which can be the effect of degradation. The reason for the degradation may be the residual snow occurring on this type of modules for extended periods of time. Infrared thermography inspection allowed observing that the CdTe modules used have a frame that dam up the snow. The residues such as snow may contribute to the degradation process as they shade the surface of the module and generate hot spots [34] in the places where microcracks occur. This kind of defects can appear during the manufacturing or can occur when the system operates. The performance ratio of the CdTe modules is 9% lower in the cold part of the year than in the warm part; however, a decrease of PR is observed under the highest irradiation and temperature (June to August). Overheating of CdTe modules was indicated as one of the degradation reasons in study performed in Turkey [6] where this type of modules exhibited also poor PR of 42% and efficiency of 4.2% in the fourth year of the operation, similarly to the results of analysis presented here. In literature, the effect of high temperature was a decrease of the yield of 1% for CdTe in the study performed in Netherlands [16], but summer gains were observed as well [15]. The efficiency of CdTe modules (4.8%) is over two times lower than the nominal value (10.6%) leading to the overall energy yield two times lower than achieved by pc-Si or CIGS in this study.
Degradation processes occur in all types of modules; however, they involve different mechanisms: chemical reactions, mechanical damage, corrosion of metallic parts, encapsulate discoloration or delamination and antireflection coating failure. In general, PV modules degrade faster in hot and dry climates [35,36,37,38] causing losses of even 50% due to the soiling effects [39,40,41]. Temperate climates are advantageous in this context, since precipitation helps to keep modules clean. Some investigations also indicate that the smaller capacity modules and the modules in large installations show lesser degradation [42]. Regarding the technology-dependent degradation, 1% degradation is reported for the crystalline silicon and a-Si modules, 0.6% for the CdTe and 0.5% for the CIGS modules [43]. On average, the degradation rate is in the range 4.5%–6% and even 10% in the case of CdTe [6,44,45,46].
In terms of the annual energy yield, the advantageous results are indicated by the comparison of the solar plant under study with other plants located in different places of the world. In this study, the annual energy yields were of 1031–1116 kWh/kWp for different PV technologies in 2015 and even 1130 kWh/kWp for the pc-Si and CIGS modules in 2018. In other countries, the following yields were achieved in the plants consisting of silicon modules (in order of increasing latitude): 990 kWh/kWp in Sweden, 1047 kWh/kWp in UK, 1030-1095 kWh/kWp in Poland, 1000 kWh/kWp in Germany, 1445 kWh/kWp in France and 1181 kWh/kWp in Italy [47].
According to the obtained results, not only the most popular pc-Si modules but also the thin film CIGS modules are suitable for use under the climatic conditions of Poland. This interesting observation encourages testing other types of solar modules e.g. HIT (Heterojunction with Intrinsic Thin Layer) technology, which was already examined at low latitude (in India [8] and Italy [10]) or new types of modules, recently introduced into market like the PERC (Passivated Emitter Rare Cell) silicon modules. Further efforts can also be aimed at collecting the experimental data of current-voltage characteristics of different technologies modules over all four seasons of the year in order to implement the computational model enabling to estimate the PV peak power in real external environment.
5. Conclusions
Due to significant differences of weather during the warm and cold part of the year observed at high latitude, photovoltaic modules as well as other parts of the installation are exposed to a broad range of irradiance and temperature changes. The rise of irradiation in the summer months is beneficial for the electric energy production but leads to the module temperature growth, which can decrease the efficiency of modules; however, it is beneficial for the a-Si modules. The performance of inverters is also influenced by the external conditions. During the warm part of the year, when high input occurs, the efficiency of inverters reaches the highest values.
The energy rating (in kWh/kWp) of different kinds of modules was analyzed to show the technology-specific differences. The CIGS modules exhibit specific yield comparable to the pc-Si technology. In 2018, which was a sunny year, the yield of the CIGS modules reached 1140 kWh/kWp, similarly to the pc-Si yield equal to 1130 kWh/kWp. Other studied technologies (a-Si and CdTe) performed much worse mainly due to significant array capture loses that are probably the consequence of degradation processes.
Nowadays, when the growing interest in photovoltaic applications is observed even in high latitude countries, the results of the presented experimental research are valuable at the planning stage of a system. The provided data can be useful in the prediction of realistic power generation pattern for four different types of PV modules under changing external conditions.
Author Contributions
Conceptualization, A.Z.; methodology, S.G., A.Z.; software and computing, S.G.; data curation, S.G.; formal analysis, A.Z., S.G.; investigation, S.G.; writing, A.Z.; supervision, A.Z. All authors have read and agreed to the published version of the manuscript.
Funding
This work was supported by Polish Ministry of Science and Higher Education. The solar plant was partially financed by EU project RPLU.06.02.00-06-086/12-00.
Acknowledgments
Authors would like to thank Piotr Dragan representing the government of partnership “Valley of Zielawa” for providing access to the solar plant.
Conflicts of Interest
The authors declare no conflict of interest.
References
- Directive (EU) 2015/1513 of the European Parliament and of the Council of 9 September 2015 Amending Directive 2009/28/EC on the Promotion of the Use of Energy from Renewable Sources. Available online: http://data.europa.eu/eli/dir/2015/1513/oj (accessed on 20 December 2018).
- PVGIS Data. Available online: https://ec.europa.eu/jrc.en.pvgis (accessed on 13 September 2019).
- IEO Report. Available online: https://ieo.pl/en/pv-report (accessed on 13 September 2019).
- Bora, B.; Kumar, R.; Sastry, O.S.; Prasad, B.; Mondal, S.; Tripathi, A.K. Energy rating estimation of PV module technologies for different climatic conditions. Sol. Energy 2018, 174, 901–911. [Google Scholar] [CrossRef]
- Magare, D.B.; Sastry, O.S.; Gupta, R.; Betts, T.R.; Gottchalg, R.; Kumar, A.; Bora, B.; Singh, Y.K. Effect of seasonal variations on performance of three different photovoltaic technologies in India. Int. J. Renew. Energy Environ. Eng. 2016, 7, 93–103. [Google Scholar] [CrossRef] [Green Version]
- Ozden, T.; Akinoglu, B.G.; Turan, R. Long term outdoor performances of three different on-grid PV arrays in central Anatolia—An extended analysis. Renew. Energy 2017, 101, 182–195. [Google Scholar] [CrossRef]
- Gaglia, A.G.; Lykoudis, S.; Argiriou, A.A.; Balaras, C.A.; Dialynas, E. Energy efficiency of PV panels under real outdoor conditions—An experimental assessment in Athens, Greece. Renew. Energy 2017, 101, 236–243. [Google Scholar] [CrossRef]
- Sharma, V.; Kumar, A.; Sastry, O.S.; Chandel, S.S. Performance assessment of different solar photovoltaic technologies under similar outdoor conditions. Energy 2013, 58, 511–518. [Google Scholar] [CrossRef]
- Kesler, S.; Kivrak, S.; Dincer, F.; Rustemli, S.; Karaaslan, M.; Unal, E.; Erdiven, U. The analysis of PV power potential and system installation in Manavgat, Turkey—A case study in winter season. Renew. Sustain. Energy Rev. 2014, 31, 671–680. [Google Scholar] [CrossRef]
- Aste, N.; Del Pero, C.; Leonforte, F. PV technologies performance comparison in temperate climates. Sol. Energy 2014, 109, 1–10. [Google Scholar] [CrossRef]
- Belluardo, G.; Ingenhoven, P.; Sparber, W.; Wagner, J.; Weihs, P.; Moser, D. Novel method for the improvement in the evaluation of outdoor performance loss rate in different PV technologies and comparison with two other methods. Sol. Energy 2015, 117, 139–152. [Google Scholar] [CrossRef]
- Romero-Fiances, I.; Muñoz-Cerón, E.; Espinoza-Paredes, R.; Nofuentes, G.; de la Casa, J. Analysis of the Performance of Various PV Module Technologies in Peru. Energies 2019, 12, 186. [Google Scholar] [CrossRef] [Green Version]
- Gulkowski, S.; Munoz Diez, J.V.; Tejero, J.A.; Nofuentes, G. Computational modeling and experimental analysis of heterojunction with intrinsic thin layer photovoltaic module under different environmental conditions. Energy 2019, 172, 380–390. [Google Scholar] [CrossRef]
- Gottschalg, R.; Betts, T.R.; Eeles, A.; Williams, A.R.; Zhu, J. Influences on the energy delivery of thin film photovoltaic modules. Sol. Energy Mater. Sol. Cells 2013, 119, 169–180. [Google Scholar] [CrossRef] [Green Version]
- Dirnberger, D.; Blackburn, G.; Müler, B.; Reise, C. On the impact of solar spectral irradiance on the yield of different PV technologies. Sol. Energy Mater. Sol. Cells 2015, 132, 431–442. [Google Scholar] [CrossRef]
- Louwen, A.; de Waal, A.C.; Schropp, R.E.I.; Faaij, A.P.C.; van Sark, W.G.J.H.M. Comprehensive characterization and analysis of PV module performance under real operating conditions. Prog. Photovolt. Res. Appl. 2017, 25, 218–232. [Google Scholar] [CrossRef]
- Mondol, J.D.; Yohanis, Y.; Smyth, M.; Norton, B. Long term performance analysis of a grid connected photovoltaic system in Northern Ireland. Energy Convers. Manag. 2006, 47, 2925–2947. [Google Scholar] [CrossRef]
- Ayompe, L.M.; Duffy, A.; McCormack, S.J.; Conlon, M. Measured performance of a 1.72 kW rooftop grid connected photovoltaic system in Ireland. Energy Convers. Manag. 2011, 52, 816–825. [Google Scholar] [CrossRef] [Green Version]
- Pietruszko, S.M.; Gradzki, M. Performance of a grid connected small PV system in Poland. Appl. Energy 2003, 74, 177–184. [Google Scholar] [CrossRef]
- Morigaki, K.; Ogihara, C. Amorphous Semiconductors: Structure, Optical and Electrical Properties. In Springer Handbook of Electronic and Photonic Materials; Kasap, S., Capper, P., Eds.; Springer: Cham, Germany, 2017. [Google Scholar] [CrossRef] [Green Version]
- Kalogirou, S.A. McEvoy’s Handbook of Photovoltaics: Fundamentals and Applications, 3rd ed.; Elsevier: London, UK, 2018. [Google Scholar]
- Khana, N.A.; Rahmanb, K.S.; Aris, K.A.; Ali, A.M.; Misran, H.; Akhtaruzzaman, M.; Tiong, S.K.; Amin, N. Effect of laser annealing on thermally evaporated CdTe thin films for photovoltaic absorber application. Sol. Energy 2018, 173, 1051–1057. [Google Scholar] [CrossRef]
- Shafarman, W.N.; Stolt, L. Cu(InGa)Se2 solar cells. In Handbook of Photovoltaic Science and Engineering; Luque, A., Hegedus, S., Eds.; Wiley: Hoboken, NJ, USA, 2003; pp. 567–616. [Google Scholar]
- Gułkowski, S.; Zdyb, A.; Dragan, P. Experimental Efficiency Analysis of a Photovoltaic System with Different Module Technologies under Temperate Climate Conditions. Appl. Sci. 2019, 9, 141. [Google Scholar] [CrossRef] [Green Version]
- Bücher, K. Site dependence of the energy collection of PV modules. Sol. Energy Mater. Sol. Cells 1997, 47, 85–94. [Google Scholar] [CrossRef]
- Kymakis, E.; Kalykakis, S.; Papazoglou, T.M. Performance analysis of a grid connected photovoltaic park on the island of Crete. Energy Convers. Manag. 2009, 50, 433–438. [Google Scholar] [CrossRef]
- Dragan, P.; Zdyb, A. Reduction of Pollution Emission by Using Solar Energy in Eastern Poland. J. Ecol. Eng. 2017, 18, 231–235. [Google Scholar] [CrossRef] [Green Version]
- Makrides, G.; Zinsser, B.; Phinikarides, A.; Schubert, M.; Georghiou, G.E. Temperature and thermal annealing effects on different photovoltaic technologies. Renew. Energy 2012, 43, 407–417. [Google Scholar] [CrossRef]
- Staebler, D.L.; Wronski, C.R. Reversible Conductivity Charges in Discharge Produced Amorphous Si. Appl. Phys. Lett. 1977, 31, 292–294. [Google Scholar] [CrossRef]
- McEvoy, A.; Markvart, T.; Castaner, L. Practical Handbook of Photovoltaics: Fundamentals and Applications, 2nd ed.; Academic Press: Waltham, MA, USA, 2012. [Google Scholar]
- Benatiallah, A.; Mostefaou, R.; Bradja, K. Performance of photovoltaic solar system in Algeria. Desalination 2007, 209, 39–42. [Google Scholar] [CrossRef]
- Cucumo, M.; DeRosa, A.; Ferraro, V.; Kaliakatsos, D.; Marinelli, V. Performance analysis of a 3kW grid connected photovoltaic plant. Renew. Energy 2006, 31, 1129–1138. [Google Scholar] [CrossRef]
- Do Nascimento, L.R.; Braga, M.; Campos, R.A.; Naspolini, H.F.; Rüther, R. Performance assessment of solar photovoltaic technologies under different climatic conditions in Brazil. Renew. Energy 2020, 146, 1070–1082. [Google Scholar] [CrossRef]
- Gulkowski, S.; Zytkowska, N.; Dragan, P. Temperature distribution analysis of different technologies of PV modules using infrared thermography. E3S Web Conf. 2018, 49, 00044. [Google Scholar] [CrossRef] [Green Version]
- Sastry, O.S.; Saurabh, S.; Shil, S.; Pant, P.; Kumar, R.A. Performance analysis of field exposed single crystalline silicon modules. Sol. Energy Mater. Sol. Cells 2010, 94, 1463–1468. [Google Scholar] [CrossRef]
- Sharma, V.; Sastry, O.S.; Kumar, A.; Bora, B.; Chandel, S. Degradation analysis of a-Si, HIT and mono c-Si solar photovoltaic technologies under outdoor conditions. Energy 2014, 72, 536–546. [Google Scholar] [CrossRef]
- Kuitche, J.; Pan, R.; Tamizhmani, G. Investigation of dominant failure modes for field-aged c-Si modules in desert climatic conditions. IEEE J. Photovolt. 2014, 4, 814–826. [Google Scholar] [CrossRef]
- Lorenzo, E.; Moretón, R.; Luque, I. Dust effects on PV array performance: In-field observations with non-uniform patterns. Prog. Photovolt. Res. Appl. 2014, 22, 666–670. [Google Scholar] [CrossRef] [Green Version]
- Ferrada, P.; Araya, F.; Marzo, A.; Fuentealba, E. Performance analysis of photovoltaic systems of two different technologies in a coastal desert climate zone of Chile. Sol. Energy 2015, 114, 356–363. [Google Scholar] [CrossRef]
- Al-Sabounchi, A.; Yalyali, S.; Al-Thani, H. Design and performance evaluation of a photovoltaic grid-connected system in hot weather conditions. Renew. Energy 2013, 53, 71–78. [Google Scholar] [CrossRef]
- Adinoyi, M.J.; Said, S.A.M. Effect of dust accumulation on the power outputs of solar photovoltaic modules. Renew. Energy 2013, 60, 633–636. [Google Scholar] [CrossRef]
- Dubey, R.; Chattopadhyay, S.; Kuthanazhi, V.; Kottantharayil, A.; Solanki, C.S.; Arora, B.M.; Narasimhan, K.L.; Vasi, J.; Bora, B.; Singh, Y.K.; et al. Comprehensive study of performance degradation of field-mounted photovoltaic modules in India. Energy Sci. Eng. 2017, 5, 51–64. [Google Scholar] [CrossRef]
- Jordan, D.C.; Kurtz, S.R.; Van Sant, K.; Newmiller, J. Compendium of photovoltaic degradation rates. Prog. Photovolt. Res. Appl. 2016, 24, 978–989. [Google Scholar] [CrossRef]
- Sanchez-Friera, P.; Piliougine, M.; Pelaez, J.; Carretero, J.; Sidrach, M. Analysis of dergadation mechanism of crystalline silicon PV modules after 12 years of operation in Southren Europe. Prog. Photovolt. Res. Appl. 2011, 19, 658–666. [Google Scholar] [CrossRef]
- Dunlop, E.D.; Halton, D. The performance of crystalline silicon photovoltaic solar modules after 22 years of continuous outdoor exposure. Prog. Photovolt. Res. Appl. 2005, 14, 53–64. [Google Scholar] [CrossRef]
- Phinikarides, A.; Makrides, G.; Zinsser, B.; Schubert, M.; Georghiou, G.E. Analysis of photovoltaic system performance time series: Seasonality and performance loss. Renew. Energy 2015, 77, 51–63. [Google Scholar] [CrossRef]
- Sunnyportal. Available online: https://sunnyportal.com/ (accessed on 13 September 2019).
Figure 1.
Distribution of irradiation on the modules plane in 2018.

Figure 2.
The dependence of the module temperature T on the solar irradiance G during the warm (red color) and cold (blue color) part of the year. Linear equations for the warm and cold half of the year, respectively, are as follows: T = 0.0159 × G + 34.112, T = 0.0110 × G + 20.26. The red and blue points overlap partially and not all of them are visible.

Figure 3.
PV efficiency for different kinds of the modules vs irradiance.


Figure 4.
Inverter conversion efficiency as a function of normalized DC power in each studied installation. The plots show exemplary efficiency in June.
Figure 4.
Inverter conversion efficiency as a function of normalized DC power in each studied installation. The plots show exemplary efficiency in June.

Figure 5.
Inverter conversion efficiency as a function of normalized DC power in each studied installation. The plots show exemplary efficiency in February.
Figure 5.
Inverter conversion efficiency as a function of normalized DC power in each studied installation. The plots show exemplary efficiency in February.


Figure 6.
Normalized yields and losses for the analyzed PV installation in 2018.


Figure 7.
Performance ratio for each studied PV technology, based on the data collected in 2018.


Table 1.
Technical data of the modules and installation.
| Parameter | PV Module Type | |||
|---|---|---|---|---|
| pc-Si | a-Si | CIGS | CdTe | |
| Efficiency (%) | 15.4 | 6.0 | 12.6 | 10.6 |
| Max. power (W) | 250 | 95 | 155 | 75 |
| Number of modules | 85 | 36 | 24 | 44 |
| Installed capacity (kWp) | 21.25 | 3.42 | 3.72 | 3.3 |
| Total area (m2) | 138.3 | 56.7 | 29.3 | 31.68 |
| IMPP (A) | 8.31 | 1.3 | 1.88 | 1.82 |
| VMPP (V) | 30.1 | 73 | 82.5 | 42 |
| ISC (A) | 8.83 | 1.62 | 2.2 | 2.15 |
| VOC (V) | 37.4 | 100 | 109 | 59.6 |
| Temperature coefficient of power (%/°C) | −0.40 | −0.2 | −0.31 | −0.25 |
| Temp. coefficient of ISC (%/°C) | 0.04 | 0.09 | 0.01 | 0.02 |
| Temp. coefficient of VOC (%/°C) | −0.112 | −0.34 | −0.3 | −0.24 |
Table 2.
Fraction of solar irradiance at different levels.
| In-Plane Solar Irradiance (W/m2) | Fraction of Solar Irradiance |
|---|---|
| 10–100 | 37.1% |
| 100–200 | 15.0% |
| 200–300 | 9.6% |
| 300–400 | 6.7% |
| 400–500 | 4.9% |
| 500–600 | 4.7% |
| 600–700 | 5.0% |
| 700–800 | 4.6% |
| 800–900 | 5.1% |
| 900–1000 | 5.0% |
| 1000–1100 | 1.9% |
| 1100–1200 | 0.4% |
Table 3.
Efficiency of the PV modules based on the experimental data presented in Figure 3. Pc-Si: polycrystalline silicon; a-Si: amorphous silicon; CIGS: copper indium gallium selenide; CdTe: cadmium telluride.
Table 3.
Efficiency of the PV modules based on the experimental data presented in Figure 3. Pc-Si: polycrystalline silicon; a-Si: amorphous silicon; CIGS: copper indium gallium selenide; CdTe: cadmium telluride.
| PV Technology | pc-Si | a-Si | CIGS | CdTe |
|---|---|---|---|---|
| All range of irradiance G | ||||
| Average efficiency value (%) | 14.6 | 4.4 | 11.0 | 4.4 |
| Median efficiency value (%) | 14.5 | 4.7 | 11.9 | 4.7 |
| Standard deviation (%) | 1.84 | 1.44 | 3.8 | 1.4 |
| Irradiance G > 200 W/m2 | ||||
| Average efficiency value (%) | 14.5 | 4.9 | 12.5 | 4.8 |
| Median efficiency value (%) | 14.4 | 5.0 | 12.4 | 4.8 |
| Standard deviation (%) | 1.98 | 1.18 | 2.6 | 1.1 |
Table 4.
Energy yield for each PV technology in 2018.
| Type of Modules | pc-Si | a-Si | CIGS | CdTe |
|---|---|---|---|---|
| Energy yield in 2018 (kWh/kWp) | 1130.54 | 855.98 | 1139.72 | 574.58 |
| Energy yield in the warm half of 2018 (kWh/kWp) | 855 | 679 | 885 | 448 |
| Energy yield in the cold half of 2018 (kWh/kWp) | 275 | 177 | 255 | 126 |
Table 5.
Energy yields in 2015 [27], 2016 and 2017.
Table 5.
Energy yields in 2015 [27], 2016 and 2017.
| pc-Si | a-Si | CIGS | CdTe | |
|---|---|---|---|---|
| Energy yield in 2015 (kWh/kWp) | 1080 | 1031 | 1116 | 1058 |
| Energy yield in 2016 (kWh/kWp) | 1009 | 858 | 1046 | 732 |
| Energy yield in 2017 (kWh/kWp) | 936 | 764 | 970 | 439 |
© 2020 by the authors. Licensee MDPI, Basel, Switzerland. This article is an open access article distributed under the terms and conditions of the Creative Commons Attribution (CC BY) license (http://creativecommons.org/licenses/by/4.0/).
Share and Cite
MDPI and ACS Style
Zdyb, A.; Gulkowski, S. Performance Assessment of Four Different Photovoltaic Technologies in Poland. Energies 2020, 13, 196. https://0-doi-org.brum.beds.ac.uk/10.3390/en13010196
AMA Style
Zdyb A, Gulkowski S. Performance Assessment of Four Different Photovoltaic Technologies in Poland. Energies. 2020; 13(1):196. https://0-doi-org.brum.beds.ac.uk/10.3390/en13010196
Chicago/Turabian StyleZdyb, Agata, and Slawomir Gulkowski. 2020. "Performance Assessment of Four Different Photovoltaic Technologies in Poland" Energies 13, no. 1: 196. https://0-doi-org.brum.beds.ac.uk/10.3390/en13010196
Note that from the first issue of 2016, this journal uses article numbers instead of page numbers. See further details here.